Atypical Antipsychotic Utilization: Emerging Trends in Indiana Medicaid Children and Teens Professor of Psychiatry Indiana University School of Medicine MMAC Consultant Andrew W. Goddard, M.D.
Transcript
Atypical Antipsychotic Utilization: Emerging Trends in Indiana
Medicaid Children and Teens
Professor of Psychiatry Indiana University School of Medicine
MMAC Consultant
Andrew W. Goddard, M.D.
Collaborators IU Medicaid Medical Advisory
Cabinet (MMAC) Steve Downs, MD Kristin Hendrix, PhD Katie Schwartz, JD Matt Aalsma, PhD Maria Finnell, MD Kathleen Unroe, MD Brownsyne Tucker Edmonds, MD Nancy Swigonski, MD Marc Rosenman, MD Wendy Morrison, PhD
Indiana OMPP
Emily Hancock, PharmD
Dave Lambert, JD
IU Regenstrief Institute
Bert Ambeuhl, MS
IU Biostatistics
James Slaven, MS
Presenter
Presentation Notes
For more information, please contact Emily Hancock, PharmD, at the Indiana Office of Medicaid Policy and Planning: [email protected].
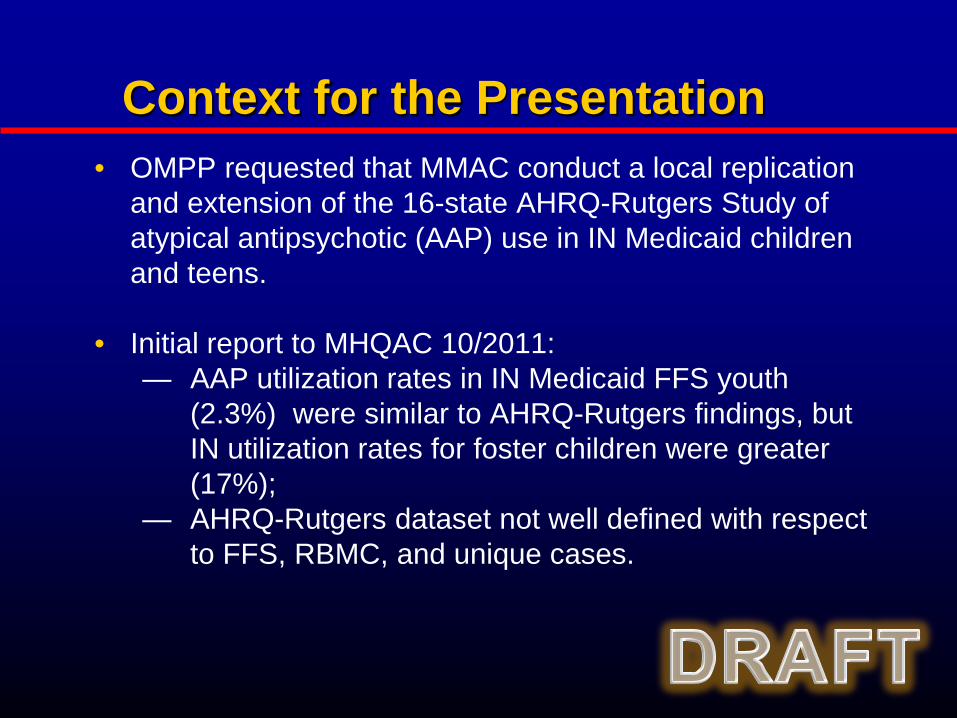
Context for the Presentation • OMPP requested that MMAC conduct a local replication
and extension of the 16-state AHRQ-Rutgers Study of atypical antipsychotic (AAP) use in IN Medicaid children and teens.
• Initial report to MHQAC 10/2011:
— AAP utilization rates in IN Medicaid FFS youth (2.3%) were similar to AHRQ-Rutgers findings, but IN utilization rates for foster children were greater (17%);
— AHRQ-Rutgers dataset not well defined with respect to FFS, RBMC, and unique cases.
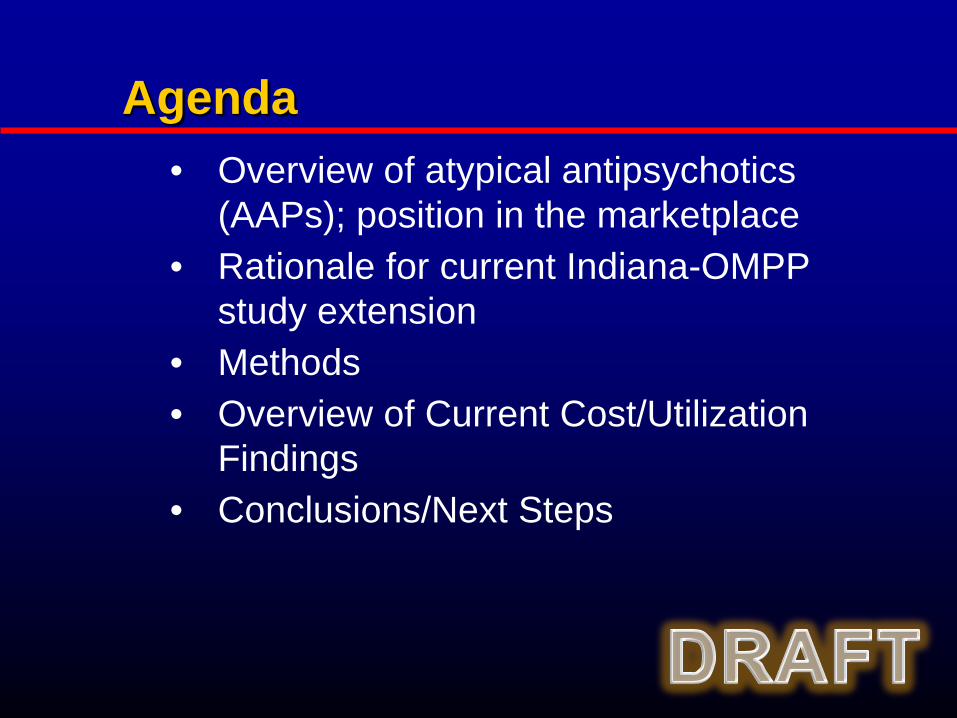
Agenda • Overview of atypical antipsychotics
(AAPs); position in the marketplace • Rationale for current Indiana-OMPP
study extension • Methods • Overview of Current Cost/Utilization
Paliperidone ++ +++ ++ ++ ++++ ++ - ++ +++ +++ Quetiapine + + - + + - ++ +++ ++ - Risperidone + +++ +++ + ++++ ++ - ++ +++ ++ Ziprasidone ++ +++ ++ ++ ++++ ++ - ++ ++ + Binding affinities expressed as plus (+) sign based on Ki (nM) from published sources. Very high (++++): Ki < 1, High (+++): Ki < 10, Moderate (++): Ki < 100, Low (+): Ki < 1000, Very low (-): Ki < 10,000
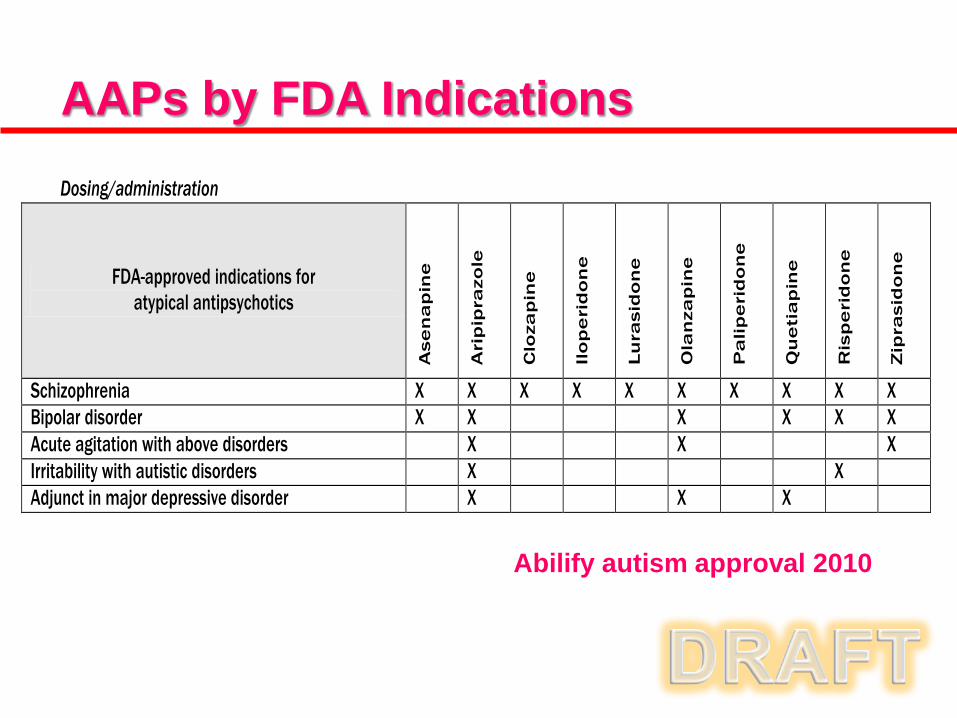
Dosing/administration
FDA-approved indications for atypical antipsychotics
Ase
na
pin
e
Ari
pip
razo
le
Clo
zap
ine
Ilo
pe
rid
on
e
Lu
rasi
do
ne
Ola
nza
pin
e
Pa
lip
eri
do
ne
Qu
eti
ap
ine
Ris
pe
rid
on
e
Zip
rasi
do
ne
Schizophrenia X X X X X X X X X X Bipolar disorder X X X X X X Acute agitation with above disorders X X X Irritability with autistic disorders X X Adjunct in major depressive disorder X X X
AAPs by FDA Indications
Abilify autism approval 2010
OMPP Study Rationale 1. Examine a time frame beyond the original
AHRQ-Rutgers study (i.e., 2004-2011) as new AAPs have come on the market since 2007.
2. Determine impact on AAP utilization and cost curves of OMPP program/policy changes (i.e., CareSelect-2007, SmartPA-2009/10, Pharmacy Benefits consolidation-2009).
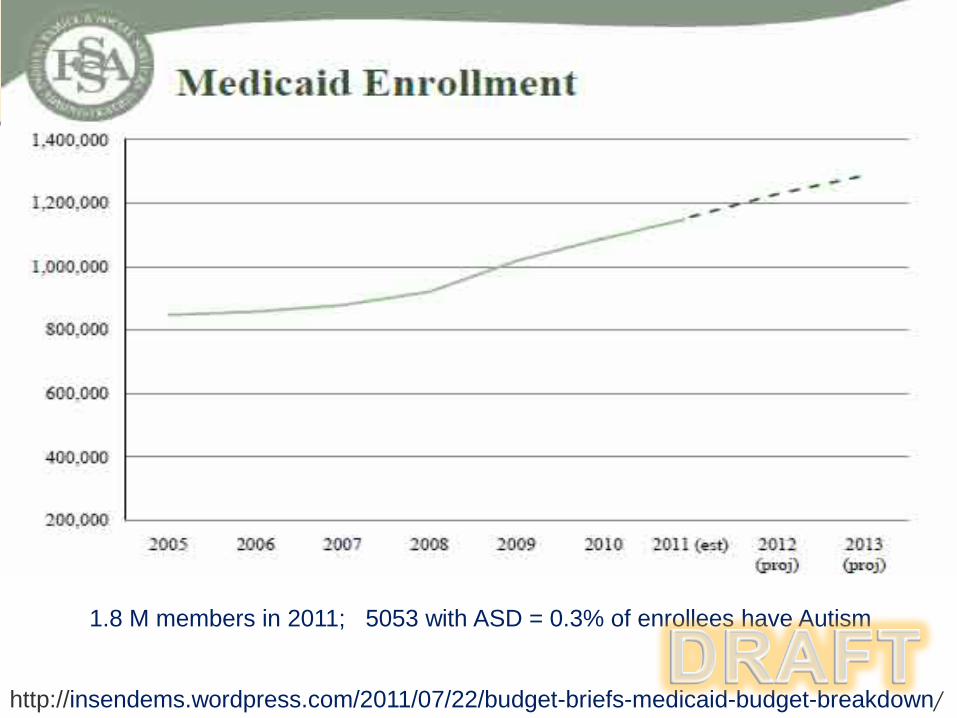
Autism Spectrum Disorder - Medicaid Expenditures by Year
Conclusions • Similarity to original AHRQ-Rutgers findings
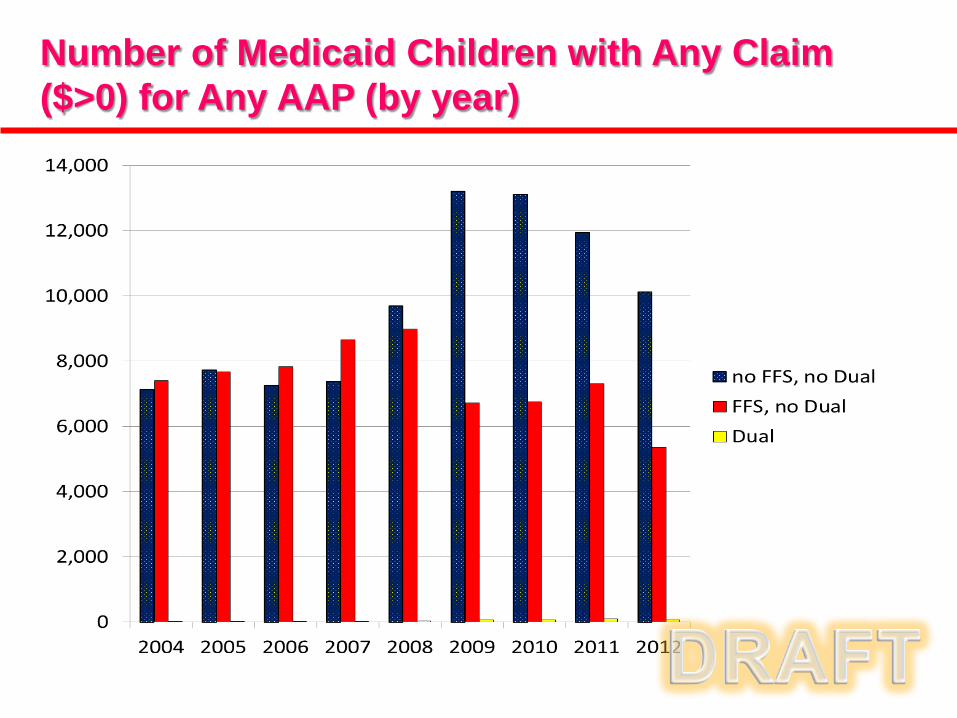
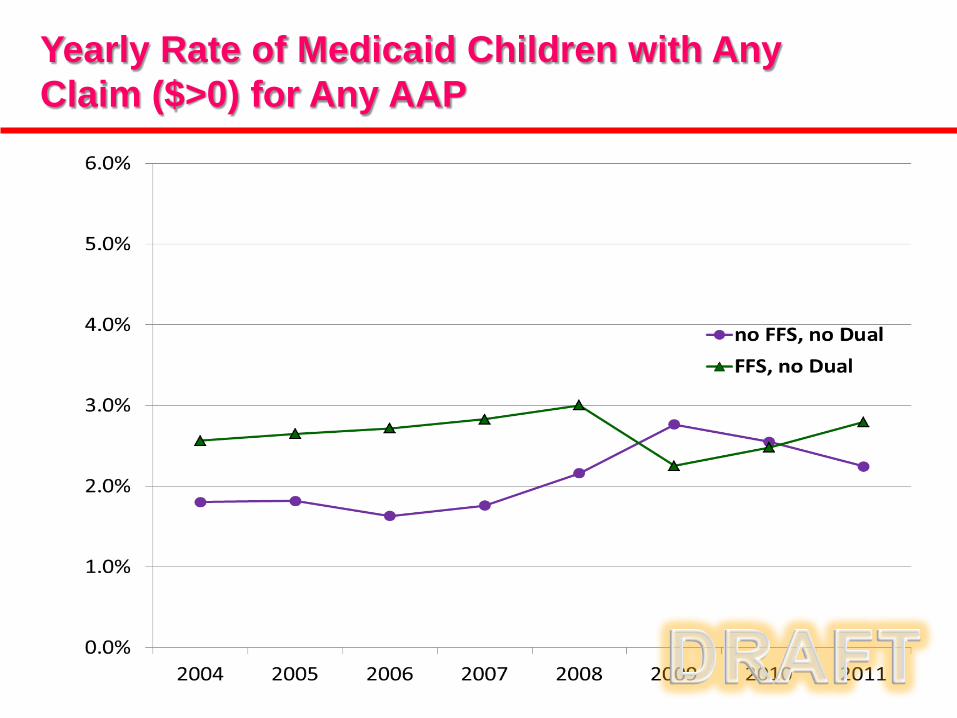
• Utilization patterns: FFS & non FFS AAP utilization is fairly flat (2-3%),
despite non-FFS population growth after 2007
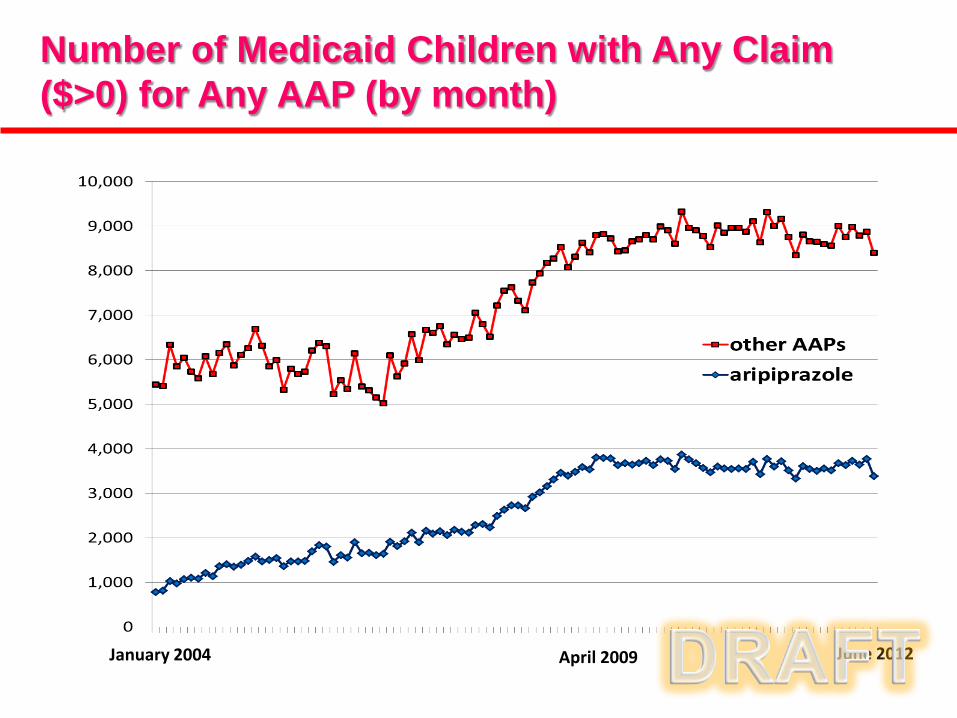
• Cost trends: Not adjusted. Average Abilify per member per month spending increases after 2007-8. Other AAP spending stabilizes by early 2009.
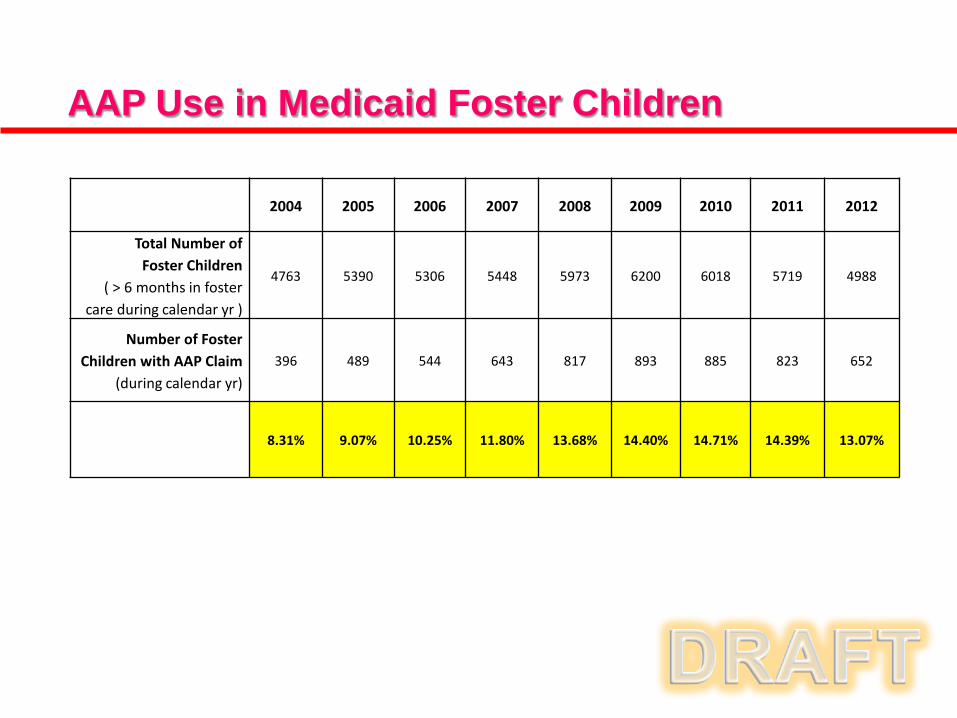
• Foster children demonstrate a higher AAP exposure rate, when compared to non-foster children, as expected. Their AAP utilization rates were fairly constant over the study period (~8-15%).
• FFS children under 5 years old experience some AAP exposure, though utilization rates did not appear to grow over time.
Presenter
Presentation Notes
Refer back to Dr. Culpepper and high rates of co-morbidity Given treatments currently available anti-depressants first-line – there may be some cases when anxiolytic will be necessary particularly early in the course. Anxiety symptoms can sometimes be exacerbated or caused by the antidepressant - management of this would be as prescribed.
Limitations • Claims data do not provide information
about individual patient status, patient needs, and individual provider decision processes.
• Minimal access to clinical safety data (e.g.,
basic info such as weight, vitals).
• Evaluation of “clinically appropriate” prescribing calls for either a chart-review study or, ideally, a prospective F/U study.
Next Steps: follow-up analyses • Analysis of AAP use by mental health diagnosis.
• Analysis of AAP use by other demographic
variables (e.g. race, Medicaid aid category, age range).
• Preliminary safety analyses (e.g. rates of diabetes in AAP utilizers versus non-utilizers).
• Regression analyses to more rigorously assess impact of OMPP program/policy updates on costs.
Presenter
Presentation Notes
Refer back to Dr. Culpepper and high rates of co-morbidity Given treatments currently available anti-depressants first-line – there may be some cases when anxiolytic will be necessary particularly early in the course. Anxiety symptoms can sometimes be exacerbated or caused by the antidepressant - management of this would be as prescribed.