211
JPMorgan Investment Funds Société d’Investissement à Capital Variable, Luxembourg Audited Annual Report (R.C.S. No B 49 663) 31 December 2011

JPMorgan Investment FundsSociété d’Investissement à Capital Variable, Luxembourg
Audited Annual Report
(R.C.S. No B 49 663)
31 December 2011
GB

JPMorgan Investment Funds
Audited Annual Report
As at 31 December 2011
Contents
Board of Directors 1Management and Administration 2Board of Directors’ Report 3Investment Managers’ Report 4Audit Report 5
Financial Statements and Statistical InformationCombined Statement of Net Assets 7-11Combined Statement of Operations and Changes in Net Assets 13-17Statement of Changes in the Number of Shares 18-22Statistical Information 23-27
Notes to the Financial Statements 28-35
Schedule of InvestmentsJPMorgan Investment Funds - Blue and Green Fund 36JPMorgan Investment Funds - Emerging Markets Corporate Bond Portfolio Fund I 40JPMorgan Investment Funds - Euro Liquid Market Fund 43JPMorgan Investment Funds - Europe Bond Fund 45JPMorgan Investment Funds - Europe Recovery Fund 48JPMorgan Investment Funds - Europe Select Equity Fund 50JPMorgan Investment Funds - Europe Strategic Dividend Fund 53JPMorgan Investment Funds - Global Balanced Fund (EUR) 58JPMorgan Investment Funds - Global Balanced Fund (USD) 62JPMorgan Investment Funds - Global Bond Fund (EUR) 69JPMorgan Investment Funds - Global Bond Fund (USD) 74JPMorgan Investment Funds - Global Capital Appreciation Fund 79JPMorgan Investment Funds - Global Capital Preservation Fund (EUR) 83JPMorgan Investment Funds - Global Capital Preservation Fund (USD) 87JPMorgan Investment Funds - Global Convertibles Fund (USD) 91JPMorgan Investment Funds - Global Dividend Fund 95JPMorgan Investment Funds - Global Enhanced Bond Fund 98JPMorgan Investment Funds - Global Financials Fund 103JPMorgan Investment Funds - Global High Yield Bond Fund 106JPMorgan Investment Funds - Global Income Fund 111JPMorgan Investment Funds - Global Select 130/30 Fund 122JPMorgan Investment Funds - Global Select Equity Fund 126JPMorgan Investment Funds - Global Total Return Fund 130JPMorgan Investment Funds - Highbridge Statistical Market Neutral Fund 133JPMorgan Investment Funds - Income Opportunity Fund 137JPMorgan Investment Funds - Japan 50 Equity Fund 154JPMorgan Investment Funds - Japan Behavioural Finance Equity Fund 156JPMorgan Investment Funds - Japan Focus Fund 158JPMorgan Investment Funds - Japan Select Equity Fund 160JPMorgan Investment Funds - Japan Strategic Value Fund 161JPMorgan Investment Funds - JF Asia ex-Japan Fund 163JPMorgan Investment Funds - US Bond Fund 164JPMorgan Investment Funds - US Equity Fund 168JPMorgan Investment Funds - US Select Equity Fund 171
Appendix: Unaudited Additional DisclosuresFund Total Expense Ratios 174Summary of Investment Objectives of the Sub-Funds 179Performance and Volatility 181Interest Rate Received/(Charged) on Bank Accounts 186Sub-Fund Share Classes Subject to Taxe d’Abonnement Rate of 0.01% 186Sub-Fund Share Classes Exempt from Taxe d’Abonnement 186Portfolio Turnover Ratio 187Calculation method of the risk exposure 188Historical Statements of Changes in the Number of Shares 189
For additional information please consult www.jpmorganassetmanagement.com
No subscriptions can be received solely on the basis of this report. Subscriptions are only valid if made on the basis of the current prospectus, the current simplified prospectus,supplemented by the latest audited annual report and, if published thereafter, the latest unaudited semi-annual report.
The current prospectus, the current simplified prospectus, the unaudited semi-annual reports, as well as the audited annual report can be obtained free of charge from theregistered office of the SICAV and from local paying agent.
Following a review of the disclosure of Investment Manager(s) within the Prospectus and Simplified Prospectus, the details of the Investment Manager(s) for the individualSub-Funds will now be available from the Management Company at its registered office, or from www.jpmorganassetmanagement.com.

JPMorgan Investment Funds
Board of Directors
As at 31 December 2011
Chairman
Iain O.S. SaundersBankerDuine, ArdfernArgyll PA31 8QNUnited Kingdom
Directors
Jacques ElvingerPartnerElvinger, Hoss & Prussen2, place Winston ChurchillL-2014 LuxembourgBP 425Grand Duchy of Luxembourg
Jean FrijnsProfessor, Finance and InvestmentsAntigonelaan 2NL-5631 LR EindhovenThe Netherlands
Berndt MayManaging DirectorJPMorgan Asset Management (Europe) S.à r.l.Austrian BranchFührichgasse 8A-1010 ViennaAustria
Registered Office
European Bank & Business Centre6, route de TrèvesL-2633 SenningerbergGrand Duchy of Luxembourg
Deputy Chairman
Pierre JaansEconomist3, rue de KahlerL-8356 GarnichGrand Duchy of Luxembourg
James B. BroderickManaging DirectorJPMorgan Asset Management (UK) Limited20 Finsbury StreetLondon EC2Y 9AQUnited Kingdom
Robert Van der MeerProfessor of Finance12 Lange VijverbergNL-2513 AC The HagueThe Netherlands
1

JPMorgan Investment Funds
Management and Administration
As at 31 December 2011
Management Company, Registrar and Transfer Agent,Global Distributor and Domiciliary Agent
JPMorgan Asset Management (Europe) S.à r.l.European Bank & Business Centre6, route de TrèvesL-2633 SenningerbergGrand Duchy of Luxembourg
Investment Managers
J.P. Morgan Investment Management Inc.245 Park AvenueNew York, NY 10167United States of America
JPMorgan Asset Management (Japan) LimitedTokyo Building 7-3Marunouchi 2-ChomeChiyoda-KuTokyo 100-6432, Japan
JPMorgan Asset Management (UK) Limited20 Finsbury StreetLondon EC2Y 9AQUnited Kingdom
JF Asset Management Limited21st Floor, Chater House8 Connaught RoadCentral, Hong Kong
Highbridge Capital Management LLC9 West 57th StreetNew York, NY 10019United States of America
JPMorgan Asset Management (Singapore) Limited168 Robinson Road17th Floor, Capital TowerSingapore 068912
Custodian, Corporate and Administrative Agent
J.P. Morgan Bank Luxembourg S.A.European Bank & Business Centre6, route de TrèvesL-2633 SenningerbergGrand Duchy of Luxembourg
Auditor
PricewaterhouseCoopers S.à r.l.400, Route d’EschBP 1443L-1014 LuxembourgGrand Duchy of Luxembourg
Legal Adviser
Elvinger, Hoss & Prussen2, place Winston ChurchillBP 425L-2014 LuxembourgGrand Duchy of Luxembourg
22

JPMorgan Investment Funds
Board of Directors’ Report
As at 31 December 2011
The Board of Directors is pleased to present the Audited Annual Report for the year ended 31 December 2011.
Structure and Size of the FundThe Fund is a variable capital investment company with multiple Sub-Funds, organised as a “société anonyme”, under the laws of the Grand Duchy ofLuxembourg, organised as an “umbrella” with a number of Sub-Funds, each of which has its own investment policy and restrictions.
At the year end the Fund had issued shares in 34 Sub-Funds.
During the year, the total net assets of the Fund decreased from USD 18.3 billion to USD 16.1 billion at year end.
The Fund qualifies as an Undertaking for Collective Investments in Transferable Securities under the amended EC Directive 85/611 of 20 December 1985 andmay therefore be offered for sale in European Union Member States, subject to registration in countries other than the Grand Duchy of Luxembourg. Inaddition, applications to register the Fund and its Sub-Funds may be made in other countries.
The Fund and the Sub-Funds are currently registered for offer and distribution in the Grand Duchy of Luxembourg and in the following jurisdictions:
Austria, Bahrain, Belgium, Chile, Cyprus, Denmark, Finland, France, Germany, Greece, Hong Kong, Hungary, Ireland, Italy, Jersey, Macau, The Netherlands,Norway, Portugal, Singapore, Spain, Sweden, Switzerland, Taiwan and United Kingdom.
Responsibility of the DirectorsThe responsibility of the Directors of the Fund is governed by Luxembourg law. With respect to the annual accounts of the Fund, the duties of the Directorsare governed by general corporate law and the law of 19 December 2002 on, inter alia, the accounting and annual accounts of undertakings and by the law of17 December 2010 relating to undertakings for collective investments.
Change in the Board of DirectorsIn early 2011 Ms Andrea L. Hazen informed the Board of her intention to retire from the Board of Directors and it was agreed that this would be effective from31 March 2011. Ms Hazen had been a Director of the Company since September 2005 and the Board would like to take this opportunity to record their thanksfor her services.
In addition, the Board would like to advise that with effect from 31 March 2011 Mr James B. Broderick was co-opted as a Director and his appointment wasapproved by Shareholders during the last Annual General Meeting dated 29 April 2011.
ALFI Code of ConductFollowing its introduction the Board of Directors has adopted the ALFI Code of Conduct (the “Code”) which sets out principles of good governance. The Boardof Directors considers that the Fund has been in compliance with the Code in all material aspects throughout the financial year ended 31 December 2011.
Annual General MeetingThe next Annual General Meeting of the Company will be held on 27 April 2012.
The Board of Directors
Luxembourg, 21 March 2012
33

JPMorgan Investment Funds
Investment Managers’ Report
For the year ended 31 December 2011
Market review of 2011Investors have had a challenging year. With stubbornly high inflation to contend with in the eurozone, the UK and US, weak macroeconomic data and a rise inmarket volatility, achieving a real return on capital has been difficult. Many stock markets have suffered falls, particularly in the eurozone and emergingmarkets. However, in aggregate global equities held up fairly well, mainly thanks to solid returns from the US and flat performance in the UK. The MSCI WorldIndex was down 1.8% in euro terms.
Bonds had a much better year in general, with the JPMorgan Global Bond Index returning 10.8% in euro terms over the period (Source: J.P. Morgan). Inparticular, UK and US government bonds were the surprise winners of 2011, having benefitted from an increasingly narrow definition of what constitutes asafe haven in the investment world. Far from falling in value due to worries that quantitative easing would result in runaway inflation, as some feared inJanuary, many investors have favoured them because the UK and the US can print the money needed to repay debt, unlike the eurozone countries.
Disappointing economic data and a slow policy response to events in the eurozone were responsible for most of the volatility on stock markets in 2011. Globalgrowth has been steadily revised down, from what were in any case modest initial projections, while the eurozone debt crisis has got to such a level as tothreaten the sustainability of the single currency itself. Across the Atlantic in the US, still the world's largest economy and with one of the world's mostflexible labour forces, we appear to have a serious structural - not a cyclical - unemployment problem.
Furthermore, in March a tsunami and a subsequent nuclear power plant explosion severely disrupted output in Japan, the world's third largest economy.There were knock-on effects on supply chains around the world, particularly for the auto and technology sectors.
These themes were the driving forces behind the fall in growth expectations seen in 2011, particularly in the second half of the year, which in turn led to alowering of corporate earnings growth forecasts.
Behind many of the macroeconomic problems lies a weak banking sector in Europe and the US, which is still suffering from the after-effects of the collapse ofLehman Brothers in 2008, and is still struggling to rebuild balance sheets full of property-related and/or eurozone sovereign debt. The reluctance ofEuropean and US banks to lend into the 'real' economy has been a significant contributor to the disappointing growth following the initial recovery of2009/10, with lending to small and medium sized companies (which provide the bulk of employment growth within the Organisation for EconomicCo-operation and Development) severely restricted.
Emerging market equities underperformed developed markets, despite much more robust economic growth. The reasons were twofold: first, tightermonetary policy in the emerging markets as central banks sought to bring down inflation; and second, downgrades to Gross Domestic Product (GDP) growthforecasts on the back of weaker growth in developed economies. Since the autumn there has also been an increasing problem in obtaining trade financefrom European and US banks, as they seek to selloff assets in emerging economies in order to help rebuild their balance sheets.
Outlook for 2012At least one key event that troubled markets in 2011 will almost certainly continue to reverberate in 2012: the eurozone debt crisis. Even if a definitivesolution is soon found, the economic damage has been done and all the countries in Europe will suffer lower growth because of it. After years of lax fiscalpolicies, the planned cuts in debt-to-GDP ratios means a fiscal contraction of EUR 150 billion in 2012, with potentially more to follow in subsequent years.Growth will be fortunate to reach 0.5% and the reforms required to boost economic competitiveness may take years to bear fruit.
Outside of Europe the outlook is a bit brighter. In the run-up to the US election, both fiscal and monetary policy is likely to stay expansionary. Investorsremain indulgent about the country's level of indebtedness as the Treasury market is still unrivalled in its size and liquidity. In Asia, growth will inevitablyslow as trade with Europe falls, but GDP expansion is still likely outstrip any other region, and Japan will continue its recovery from the earthquake. LatinAmerica's commodity exports to China are likely to continue and rising internal demand should benefit Brazil and Mexico.
High levels of risk aversion thanks to the eurozone crisis mean that traditional safe haven assets offer little potential return. Core sovereign debt yields arewell below what expected nominal GDP growth rates suggest is reasonable. With the US economy forecasted to expand by at least 4% in the next fivequarters (in nominal terms), ten-year yields should be much higher than their current levels. Gold - traditionally seen as a hedge against inflation - is at riskbecause an escalation of the crisis would likely be deflationary, and a rising dollar due to a flight to quality would also hurt gold prices.
The asset classes that we believe offer the best potential returns in the next year include higher yielding fixed income, such as emerging market debt (bothUS dollar and local currency), as generous coupons, falling risk aversion and appreciating currencies all argue for positive total returns. Corporate high yielddebt also looks attractive as companies generally have sufficient cash to make interest payments and current spreads suggest a much higher default ratethan we think is likely. Equities should recover some of their losses from 2011 as the outlook in Europe improves and valuations are attractive, but earningsgrowth will be hard to come by, moderating gains. Stocks with better dividend yields should provide some additional cushion.
The Investment Managers
21 March 2012
The information stated in this report is historical and not necessarily indicative of future performance.
4

We have audited the accompanying financial statements of JPMorgan Investment Funds and of each of its Sub-Funds, which comprise the CombinedStatement of Net Assets and the Schedule of Investments as at 31 December 2011 and the Combined Statement of Operations and Changes in Net Assets forthe year then ended, and a summary of significant accounting policies and other explanatory notes to the financial statements.
Responsibility of the Board of Directors of the SICAV for the financial statementsThe Board of Directors of the SICAV is responsible for the preparation and fair presentation of these financial statements in accordance with Luxembourglegal and regulatory requirements relating to the preparation of the financial statements and for such internal control as the Board of Directors of the SICAVdetermines is necessary to enable the preparation of financial statements that are free from material misstatement, whether due to fraud or error.
Responsibility of the “Réviseur d’entreprises agréé”Our responsibility is to express an opinion on these financial statements based on our audit. We conducted our audit in accordance with InternationalStandards on Auditing as adopted for Luxembourg by the “Commission de Surveillance du Secteur Financier”. Those standards require that we comply withethical requirements and plan and perform the audit to obtain reasonable assurance about whether the financial statements are free from materialmisstatement.
An audit involves performing procedures to obtain audit evidence about the amounts and disclosures in the financial statements. The procedures selecteddepend on the judgment of the “Réviseur d’entreprises agréé”, including the assessment of the risks of material misstatement of the financial statements,whether due to fraud or error. In making those risk assessments, the “Réviseur d’entreprises agréé” considers internal control relevant to the entity’spreparation and fair presentation of the financial statements in order to design audit procedures that are appropriate in the circumstances, but not for thepurpose of expressing an opinion on the effectiveness of the entity’s internal control. An audit also includes evaluating the appropriateness of accountingpolicies used and the reasonableness of accounting estimates made by the Board of Directors of the SICAV, as well as evaluating the overall presentation ofthe financial statements.
We believe that the audit evidence we have obtained is sufficient and appropriate to provide a basis for our audit opinion.
OpinionIn our opinion, the financial statements give a true and fair view of the financial position of JPMorgan Investment Funds and of each of its Sub-Funds as of 31December 2011, and of the results of their operations and changes in their net assets for the year then ended in accordance with Luxembourg legal andregulatory requirements relating to the preparation of the financial statements.
Other mattersSupplementary information included in the annual report has been reviewed in the context of our mandate but has not been subject to specific auditprocedures carried out in accordance with the standards described above. Consequently, we express no opinion on such information. However, we have noobservation to make concerning such information in the context of the financial statements taken as a whole.
PricewaterhouseCoopers S.à r.l. Luxembourg, 21 March 2012
Represented by
John Parkhouse
PricewaterhouseCoopers S.à r.l., 400 Route d’Esch, B.P. 1443, L-1014 LuxembourgT: +352 494848 1, F:+352 494848 2900, www.pwc.lu
Cabinet de révision agréé. Expert-comptable (autorisation gouvernementale n° 00123693)R.C.S. Luxembourg B 65 477 - Capital social EUR 516 950 - TVA LU17564447
5
Audit Report
To the Shareholders ofJPMorgan Investment Funds

This page has been left blank intentionally
6

JPMorgan Investment Funds
Combined Statement of Net Assets
As at 31 December 2011
JPMorganInvestment Funds
CombinedUSD
Blue andGreen Fund
EUR
Emerging MarketsCorporate BondPortfolio Fund I
USD
EuroLiquid Market
FundEUR
Assets
Investments in Securities at Market Value 15,372,180,053 61,477,367 103,951,621 138,690,456Acquisition Cost: 15,586,794,212 57,622,971 105,982,021 138,690,456Investment in TBAs at Market Value (1) 241,640,413 - - -Cash at Bank and at Brokers 799,233,053 7,226,987 169,391 1,608,132Time Deposits and Cash Equivalents 412,909,892 - - 136,000,000Amounts Receivable on Sale of Investments 86,298,196 12,290,586 - -Amounts Receivable on Sale of TBAs (1) 389,259,683 - - -Amounts Receivable on Subscriptions 23,238,686 - - 183,290Interest and Dividends Receivable, Net 100,369,312 361,594 1,992,190 24,572Tax Reclaims Receivable 1,272,855 - - -Fee Waiver (2) 60,921 - - -Other Receivables 18,172 - - -Unrealised Net Gain on Forward Foreign Exchange Contracts 2,853,577 - - -Unrealised Net Gain on Financial Futures Contracts 6,232,051 224,726 - -Derivatives Instruments at Market Value 20,551,155 1,160,603 - -Total Assets 17,456,118,019 82,741,863 106,113,202 276,506,450
LiabilitiesOpen Short Positions on TBAs (1) 391,010,836 - - -Amounts Payable on Purchase of Investments 253,020,636 880,537 - 91,995,972Amounts Payable on Purchase of TBAs (1) 240,317,484 - - -Amounts Payable on Redemptions 44,527,735 - - 594,540Management and Advisory Fees Payable 15,653,728 51,790 122,373 86,394Performance Fees 99,963 - - -Other Payables 4,702,036 34,225 9,366 21,038Unrealised Net Loss on Forward Foreign Exchange Contracts 147,996,106 221,920 2,106,129 -Unrealised Net Loss on Financial Futures Contracts 551,063 - - -Derivatives Instruments at Market Value 231,748,458 - - -
Total Liabilities 1,329,628,045 1,188,472 2,237,868 92,697,944
Total Net Assets 16,126,489,974 81,553,391 103,875,334 183,808,506
Historical Total Net Assets31 December 2010 18,277,112,582 84,218,665 113,202,329 81,069,82431 December 2009 17,111,214,731 83,253,730 - 199,851,28431 December 2008 12,451,274,404 75,942,811 - 440,144,81431 December 2007 21,371,859,183 81,191,009 - 322,262,690
(1) Please refer to Note 2 i).(2) Please refer to Note 3 a).
The accompanying notes form an integral part of these Financial Statements.
7

JPMorgan Investment Funds
Combined Statement of Net Assets (continued)
As at 31 December 2011
EuropeBond Fund
EUR
EuropeRecovery
FundEUR
EuropeSelect
Equity FundEUR
Europe StrategicDividend
FundEUR
Global BalancedFund (EUR)
EUR
Global BalancedFund (USD)
USD
Global BondFund (EUR)
EUR
Global BondFund (USD)
USD
25,693,458 133,098,395 231,415,936 519,054,207 145,866,523 223,379,348 70,931,926 57,231,90826,296,661 126,274,248 243,196,809 529,343,695 138,117,527 211,385,049 65,763,596 57,132,728
808,545 - - - - - 2,263,925 1,899,652177,276 246,799 188,663 1,514,174 2,627,535 18,315,944 2,615,441 1,915,421
- - - - - - - -- 11,044,620 347,645 170,997 - 3,287 100,000 -- - - - - - - -
88 1,299 53,939 2,331,574 34,977 135,091 292,725 12,755376,431 135,568 384,276 1,423,049 1,275,909 1,443,225 1,286,955 404,843
- 221,901 119,872 435,315 6,113 7,848 - -3,218 - - - - - 3,940 6,775
- - - - - - - -- - - - - 900,955 - 46,849- - 5,330 75,850 57,454 339,167 25,579 15,434- - - - - - - -
27,059,016 144,748,582 232,515,661 525,005,166 149,868,511 244,524,865 77,520,491 61,533,637
- - - - - - - -- 2,177,988 - - - 63,374 - 744,899
806,137 - - - - - 2,256,257 1,893,21829,119 68,381 90,427 1,360,217 101,105 149,204 234,314 11,22416,379 174,900 181,487 633,917 199,179 299,010 39,561 18,141
- - - - - - - -6,942 17,979 22,196 42,322 13,191 23,012 1,563,489 463,228
61,209 - 481,975 205,564 1,892,385 - 1,824,074 -618 - - - - - - -
- - - - - - - -
920,404 2,439,248 776,085 2,242,020 2,205,860 534,600 5,917,695 3,130,710
26,138,612 142,309,334 231,739,576 522,763,146 147,662,651 243,990,265 71,602,796 58,402,927
36,739,031 262,251,751 229,438,958 381,961,567 152,909,305 303,452,081 69,109,803 59,153,87967,991,833 221,102,757 235,863,162 240,930,029 151,154,147 501,258,891 73,496,303 60,110,60972,856,344 162,279,387 87,650,033 73,662,946 131,322,731 437,621,915 110,901,698 71,738,748
482,277,975 561,915,412 329,258,620 151,500,345 222,514,608 599,095,598 867,821,768 398,540,721
8

JPMorgan Investment Funds
Combined Statement of Net Assets (continued)
As at 31 December 2011
Global CapitalAppreciation
FundEUR
Global CapitalPreservation
Fund (EUR)EUR
Global CapitalPreservation
Fund (USD)USD
GlobalConvertibles
Fund (USD)USD
GlobalDividend
FundUSD
GlobalEnhanced Bond
FundEUR
GlobalFinancials Fund
USD
GlobalHigh Yield Bond
FundUSD
81,909,770 851,400,779 52,019,302 390,840,629 103,954,243 20,571,095 121,726,082 1,371,253,99872,123,067 801,482,242 52,153,085 424,263,779 106,582,765 20,541,757 153,478,712 1,389,583,088
- - - - - 4,679,060 - -8,501,968 120,899,043 10,062,356 375,671 213,876 951,209 617,458 32,636,922
- 97,600,000 - - - - - -80,438 6,402,275 476,679 551,698 - - - -
- - - - - - - -- 472,438 48,266 89,682 211,124 42,151 216,363 9,339,366
205,530 4,460,317 271,399 1,650,370 205,410 245,022 82,565 27,194,6437,849 - 909 - 17,505 - 19,393 -4,853 - 2,415 - - 6,513 - -
- - - - - - - -- - - - - - 81,285 -
241,561 3,510,647 327,230 - - 2,867 - -- 13,854,087 794,358 - - - - -
90,951,969 1,098,599,586 64,002,914 393,508,050 104,602,158 26,497,917 122,743,146 1,440,424,929
- - - - - - - -- 16,414,852 807,998 849,578 - 51,310 - -- - - - - 4,652,113 - -
65,434 1,274,338 158 326,736 23,821 13,281 58,192 4,816,52478,549 1,238,415 79,205 495,965 114,770 15,391 183,871 1,049,595
- - - - - - - -14,330 76,033 11,471 36,720 19,224 185,062 15,961 111,661
3,733,472 6,890,370 344,301 351,830 318,566 417,859 - 1,910,068- - - - - - - -
116,402 - - - - - - 3,816,873
4,008,187 25,894,008 1,243,133 2,060,829 476,381 5,335,016 258,024 11,704,721
86,943,782 1,072,705,578 62,759,781 391,447,221 104,125,777 21,162,901 122,485,122 1,428,720,208
112,495,066 1,660,249,536 73,808,677 511,603,002 52,512,474 24,060,097 185,870,709 1,227,898,130113,079,859 1,957,647,449 74,449,543 533,842,291 37,054,753 20,893,798 127,331,667 450,507,539141,277,213 1,861,444,396 67,565,801 150,459,822 2,053,246 31,694,955 115,313,948 145,157,681233,001,215 2,659,485,093 56,022,839 204,045,393 2,994,964 172,270,768 173,591,902 226,958,050
9

JPMorgan Investment Funds
Combined Statement of Net Assets (continued)
As at 31 December 2011
GlobalIncome
FundEUR
Global Select130/30
FundUSD
Global SelectEquity Fund
USD
GlobalTotal Return
FundEUR
Highbridge StatisticalMarket Neutral
FundEUR
IncomeOpportunity
FundUSD
Japan50 Equity Fund
JPY
Japan BehaviouralFinance Equity
FundUSD
371,209,565 15,741,795 247,945,910 16,050,157 447,851,423 5,224,155,747 20,092,170,700 4,292,155356,063,747 16,008,324 260,896,357 16,906,278 451,497,898 5,308,016,856 23,666,888,923 4,209,147
- - - - - 221,514,655 - -2,569,041 85,495 13,489 19,437,807 203,941 481,590,141 210,334,750 99,914
- - - 16,000,000 57,000,000 - - -13,452,481 1,065 - 33,584 - 1,106,260 79,825,596 -
- - - - - 389,259,683 - -757,556 943 65,090 22,112 10,561 4,991,555 15,271,137 3,631
4,524,520 25,415 302,771 45,010 131,853 44,359,429 13,813,892 4,31120,978 2,143 17,064 28,024 - - - -
- 9,893 - - - - - 7,728- 1,300 - - 100 16,512 - -- 70,561 357,646 - 1,070,241 - - -- - - - - - 1,096,141 -- 60,668 - 3,201 155,738 - - -
392,534,141 15,999,278 248,701,970 51,619,895 506,423,857 6,366,993,982 20,412,512,216 4,407,739
- - - - - 391,010,836 - -9,552,791 - - - 153 90,146,128 81,058,950 -
- - - - - 220,290,378 - -388,347 27,869 166,728 18,887 612,429 13,477,379 1,419,957 -485,633 22,752 101,971 84,711 724,762 4,255,427 14,445,399 5,481
- - - - - 99,963 - -35,581 14,381 24,534 4,404 71,067 536,457 2,761,123 8,854
8,090,771 - - 343,939 - 106,143,551 4,560,066 -64,159 - - - - 466,979 - -
- - - - - 227,780,489 - -
18,617,282 65,002 293,233 451,941 1,408,411 1,054,207,587 104,245,495 14,335
373,916,859 15,934,276 248,408,737 51,167,954 505,015,446 5,312,786,395 20,308,266,721 4,393,404
154,763,536 23,983,169 243,047,770 75,080,068 930,858,882 4,713,873,852 25,533,477,954 5,133,97041,364,167 26,303,236 251,774,985 115,823,178 2,437,426,403 1,680,639,104 13,989,659,304 5,261,17111,800,343 22,697,497 115,122,494 98,861,072 2,842,761,494 120,730,895 31,690,006,989 43,080,245
- 84,167,009 190,919,912 259,445,423 2,536,907,979 16,807,790 61,783,248,670 100,132,088
10

JPMorgan Investment Funds
Combined Statement of Net Assets (continued)
As at 31 December 2011
JapanFocus Fund
JPY
JapanSelect Equity
FundJPY
JapanStrategic Value
FundJPY
JF Asiaex-Japan
FundUSD
US BondFundUSD
USEquity Fund
USD
US SelectEquity
FundUSD
6,955,299,350 26,010,452,000 10,047,766,875 689,421,195 30,040,276 248,093,122 1,626,724,1398,475,291,398 33,196,913,599 10,653,558,793 748,342,648 41,400,331 240,025,946 1,531,492,234
- - - - 8,164,233 - -83,362,148 194,441,675 120,468,751 3,970,925 3,528,192 5,826,979 12,855,494
- - - 14,927,773 - - -23,081,919 - - 8,286,570 45,297 - 17,480,146
- - - - - - -- 25,080,433 86,088 109,344 68,507 83,570 1,884,098
1,889,295 25,045,159 4,761,684 140,246 225,935 157,325 2,003,766- - - - - - 117,564
174,940 - - - 7,798 - -- - - - - 230 -- - - - 7,055 - -
325,000 - - - 11,317 44,363 96,988- - - - - - -
7,064,132,652 26,255,019,267 10,173,083,398 716,856,053 42,098,610 254,205,589 1,661,162,195
- - - - - - -23,394,697 - - - 262,829 - 1,632,779
- - - - 8,120,072 - -- 17,919,883 944,661 2,831,546 40,141 480,557 15,558,213
3,641,534 20,179,413 8,170,653 708,146 24,039 273,102 2,091,603- - - - - - -
1,204,315 2,404,018 623,803 73,720 375,038 23,305 128,384- - - - - 1,172,223 4,224,871- - - - - - -- - - - - - -
28,240,546 40,503,314 9,739,117 3,613,412 8,822,119 1,949,187 23,635,850
7,035,892,106 26,214,515,953 10,163,344,281 713,242,641 33,276,491 252,256,402 1,637,526,345
9,947,587,849 44,260,575,560 9,796,103,920 1,604,183,115 40,785,397 144,239,604 2,172,590,1397,855,615,201 50,076,159,171 6,255,065,891 1,595,870,962 45,776,146 94,195,327 1,475,480,9776,075,321,703 68,599,425,040 1,205,579,034 548,315,938 65,585,585 21,975,125 548,195,408
- 150,431,662,753 1,040,793,061 1,570,642,348 921,294,102 36,931,277 475,836,471
11

This page has been left blank intentionally
12

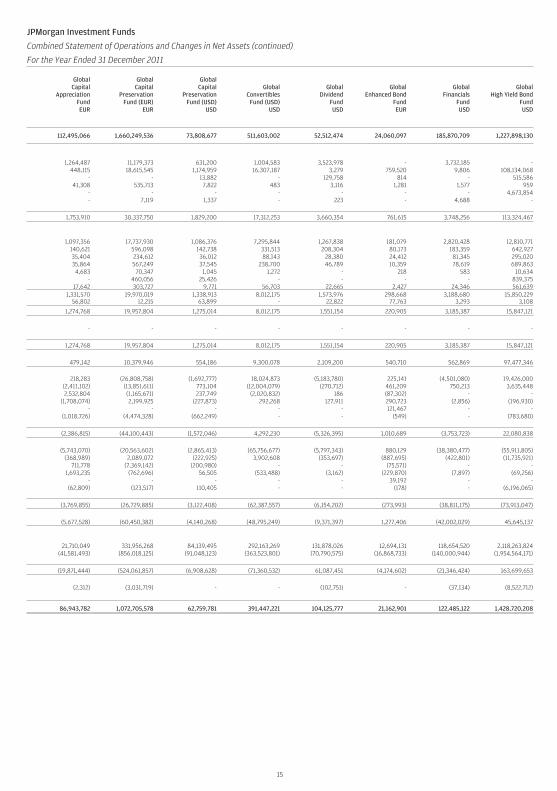
JPMorgan Investment Funds
Combined Statement of Operations and Changes in Net Assets
For the Year Ended 31 December 2011
JPMorganInvestment
FundsCombined
USD
Blue andGreen Fund
EUR
Emerging MarketsCorporate BondPortfolio Fund I
USD
EuroLiquid Market
FundEUR
Net Assets at the Beginning of the Year * 18,158,999,471 84,218,665 113,202,329 81,069,824
IncomeDividend Income, Net 167,321,315 691,349 - -Interest Income, Net 420,455,194 821,296 8,293,705 1,142,787Securities Lending Income 4,251,015 14,463 34,428 2,959Bank Interest 913,217 8,898 444 -Net Interest on Swap Transactions 70,985,539 - - -Other Income (1) 291,804 - - -
Total Income 664,218,084 1,536,006 8,328,577 1,145,746
ExpensesManagement and Advisory Fees 217,005,127 604,918 1,584,377 595,145Custodian, Corporate, Administrative and Domiciliary Agency Fees 11,891,465 90,812 88,366 81,809Registrar and Transfer Agency Fees 3,614,582 25 2,972 57,080Taxe d’Abonnement 8,562,498 8,314 55,395 13,637Overdraft Interest 221,418 59,779 - 710Net Interest on Swap Transactions 27,008,059 27,806 - -Sundry Fees** 6,167,673 9,198 25,112 11,618
274,470,822 800,852 1,756,222 759,999Less: Fee Waiver (2) 896,596 - - 1,083Total Expenses before Performance Fees 273,574,226 800,852 1,756,222 758,916
Performance Fees 99,963 - - -
Total Expenses 273,674,189 800,852 1,756,222 758,916
Net Investment Income/(Loss) 390,543,895 735,154 6,572,355 386,830
Net Realised Gain/(Loss) on Sale of Investments 26,140,082 (2,363,894) (585,878) -Net Realised Gain/(Loss) on Forward Foreign Exchange Contracts (38,507,612) (1,930,061) 1,349,416 -Net Realised Gain/(Loss) on Financial Futures Contracts (27,130,958) 513,805 - -Net Realised Gain/(Loss) on Foreign Exchange (46,857,035) 336,982 2,461 -Net Realised Gain/(Loss) on TBAs 2,469,047 - - -Net Realised Gain/(Loss) on Derivatives Instruments 4,001,286 (353,963) - -
Net Realised Gain/(Loss) for the Year (79,885,190) (3,797,131) 765,999 -
Net Change in Unrealised Gain/(Loss) on Investments (1,242,872,994) (118,657) (6,245,381) -Net Change in Unrealised Gain/(Loss) on Forward Foreign Exchange Contracts (165,788,422) 668,293 (3,198,799) -Net Change in Unrealised Gain/(Loss) on Financial Futures Contracts (9,383,757) (100,409) - -Net Change in Unrealised Gain/(Loss) on Foreign Exchange 45,360,271 (71,471) - -Net Change in Unrealised Gain/(Loss) on TBAs (532,246) - - -Net Change in Unrealised Gain/(Loss) on Derivatives Instruments (157,008,187) 18,947 - -
Net Change in Unrealised Gain/(Loss) for the Year (1,530,225,335) 396,703 (9,444,180) -
Increase/(Decrease) in Net Assets as a Result of Operations (1,219,566,630) (2,665,274) (2,105,826) 386,830
Movements in Share CapitalSubscriptions 13,831,533,288 - 755,683 304,036,841Redemptions (14,595,070,041) - (5,099,426) (201,684,989)
Increase/(Decrease) in Net Assets as a Result of Movements in Share Capital (763,536,753) - (4,343,743) 102,351,852
Dividend Distribution (49,406,114) - (2,877,426) -
Total Net Assets at the End of the Year 16,126,489,974 81,553,391 103,875,334 183,808,506
* The opening balance was combined using the foreign exchange rate as at 31 December 2011. The same net assets when combined using the foreign exchange ruling as at 31 December 2010 reflected afigure of USD 18,277,112,582
**Sundry Fees are principally comprised of Directors’ fees, audit and tax related fees, registration, publication, mailing and printing fees, as well as legal and marketing expenses.
(1) Please refer to Note 5.(2) Please refer to Note 3a).
The accompanying notes form an integral part of these Financial Statements.
13

JPMorgan Investment Funds
Combined Statement of Operations and Changes in Net Assets (continued)
For the Year Ended 31 December 2011
EuropeBond Fund
EUR
EuropeRecovery
FundEUR
EuropeSelect
Equity FundEUR
Europe StrategicDividend
FundEUR
Global BalancedFund (EUR)
EUR
Global BalancedFund (USD)
USD
Global BondFund (EUR)
EUR
Global BondFund (USD)
USD
36,739,031 262,251,751 229,438,958 381,961,567 152,909,305 303,452,081 69,109,803 59,153,879
- 6,624,555 8,494,747 22,402,380 1,790,833 2,600,095 - -1,260,052 86,190 55,071 82,949 1,677,366 3,402,652 1,953,053 1,740,829
1,208 443,824 604,832 1,028,494 - - 852 520329 2,808 1,371 7,853 589 1,894 9,140 6,031
- - - - - - - -- 11,670 6,163 82,406 8,096 6,795 - -
1,261,589 7,169,047 9,162,184 23,604,082 3,476,884 6,011,436 1,963,045 1,747,380
235,770 3,091,097 2,185,121 7,920,911 2,465,214 3,590,283 450,803 222,07663,671 195,861 229,176 384,536 133,878 241,985 89,672 114,85025,556 36,305 81,302 140,822 46,127 55,244 30,390 10,15016,558 89,579 97,128 259,648 77,086 126,104 34,696 16,172
- 5,021 255 11,803 915 444 113 178- - - - - - - -
3,699 25,202 61,538 54,493 17,273 42,078 7,513 7,157345,254 3,443,065 2,654,520 8,772,213 2,740,493 4,056,138 613,187 370,58344,610 704 9,303 136 2,114 4,482 38,576 64,713
300,644 3,442,361 2,645,217 8,772,077 2,738,379 4,051,656 574,611 305,870
- - - - - - - -
300,644 3,442,361 2,645,217 8,772,077 2,738,379 4,051,656 574,611 305,870
960,945 3,726,686 6,516,967 14,832,005 738,505 1,959,780 1,388,434 1,441,510
(1,407,405) (26,293,486) (8,158,940) (10,461,700) 112,566 12,066,563 166,573 761,236143,269 (310,946) 375,974 1,408,252 353,764 1,157,474 (196,459) (1,287,313)318,449 1,521,783 (1,216,830) 1,065,133 29,662 163,674 502,498 222,071(34,535) 54,585 (185,559) 14,238 79,768 26,950 384,301 41,332
- - - - - - (157,470) 54,892(382) - - - - - (749) (400)
(980,604) (25,028,064) (9,185,355) (7,974,077) 575,760 13,414,661 698,694 (208,182)
640,743 (33,562,939) (34,332,278) (52,784,764) (3,895,638) (19,178,552) 4,402,366 753,273(56,137) - (974,771) (1,801,430) (1,215,190) (141,399) (2,307,370) 978,059(3,224) - 24,141 95,108 (271,039) 333,894 99,337 23,240
4,342 7,485 12,402 41,380 (3,176) (55,556) 4,148 (32,537)2,407 - - - - - 29,115 20,483(181) - - - - - (428) (225)
587,950 (33,555,454) (35,270,506) (54,449,706) (5,385,043) (19,041,613) 2,227,168 1,742,293
568,291 (54,856,832) (37,938,894) (47,591,778) (4,070,778) (3,667,172) 4,314,296 2,975,621
17,616,008 58,292,959 214,322,954 495,560,823 50,462,975 111,370,099 23,598,197 3,059,519(28,784,718) (123,209,298) (174,062,007) (306,899,454) (51,623,946) (167,158,261) (25,419,500) (6,786,092)
(11,168,710) (64,916,339) 40,260,947 188,661,369 (1,160,971) (55,788,162) (1,821,303) (3,726,573)
- (169,246) (21,435) (268,012) (14,905) (6,482) - -
26,138,612 142,309,334 231,739,576 522,763,146 147,662,651 243,990,265 71,602,796 58,402,927
14
JPMorgan Investment Funds
Combined Statement of Operations and Changes in Net Assets (continued)
For the Year Ended 31 December 2011
GlobalCapital
AppreciationFundEUR
GlobalCapital
PreservationFund (EUR)
EUR
GlobalCapital
PreservationFund (USD)
USD
GlobalConvertibles
Fund (USD)USD
GlobalDividend
FundUSD
GlobalEnhanced Bond
FundEUR
GlobalFinancials
FundUSD
GlobalHigh Yield Bond
FundUSD
112,495,066 1,660,249,536 73,808,677 511,603,002 52,512,474 24,060,097 185,870,709 1,227,898,130
1,264,487 11,179,373 631,200 1,004,583 3,523,978 - 3,732,185 -448,115 18,615,545 1,174,959 16,307,187 3,279 759,520 9,806 108,134,068
- - 13,882 - 129,758 814 - 515,58641,308 535,713 7,822 483 3,116 1,281 1,577 959
- - - - - - - 4,673,854- 7,119 1,337 - 223 - 4,688 -
1,753,910 30,337,750 1,829,200 17,312,253 3,660,354 761,615 3,748,256 113,324,467
1,097,356 17,737,930 1,086,376 7,295,844 1,267,838 181,079 2,820,428 12,810,771140,621 596,098 142,738 331,513 208,304 80,173 183,359 642,92735,404 234,612 36,012 88,143 28,380 24,412 81,345 295,02035,864 567,249 37,545 238,700 46,789 10,359 78,619 689,8634,683 70,347 1,045 1,272 - 218 583 10,634
- 460,056 25,426 - - - - 839,37517,642 303,727 9,771 56,703 22,665 2,427 24,346 561,639
1,331,570 19,970,019 1,338,913 8,012,175 1,573,976 298,668 3,188,680 15,850,22956,802 12,215 63,899 - 22,822 77,763 3,293 3,108
1,274,768 19,957,804 1,275,014 8,012,175 1,551,154 220,905 3,185,387 15,847,121
- - - - - - - -
1,274,768 19,957,804 1,275,014 8,012,175 1,551,154 220,905 3,185,387 15,847,121
479,142 10,379,946 554,186 9,300,078 2,109,200 540,710 562,869 97,477,346
218,283 (26,808,758) (1,692,777) 18,024,873 (5,183,780) 225,141 (4,501,080) 19,426,000(2,411,102) (13,851,611) 773,104 (12,004,079) (270,712) 461,209 750,213 3,635,4482,532,804 (1,165,671) 237,749 (2,020,832) 186 (87,302) - -
(1,708,074) 2,199,925 (227,873) 292,268 127,911 290,723 (2,856) (196,930)- - - - - 121,467 - -
(1,018,726) (4,474,328) (662,249) - - (549) - (783,680)
(2,386,815) (44,100,443) (1,572,046) 4,292,230 (5,326,395) 1,010,689 (3,753,723) 22,080,838
(5,743,070) (20,563,602) (2,865,413) (65,756,677) (5,797,343) 880,129 (38,380,477) (55,911,805)(368,989) 2,089,072 (222,925) 3,902,608 (353,697) (887,695) (422,801) (11,735,921)
711,778 (7,369,142) (200,980) - - (75,571) - -1,693,235 (762,696) 56,505 (533,488) (3,162) (229,870) (7,897) (69,256)
- - - - - 39,192 - -(62,809) (123,517) 110,405 - - (178) - (6,196,065)
(3,769,855) (26,729,885) (3,122,408) (62,387,557) (6,154,202) (273,993) (38,811,175) (73,913,047)
(5,677,528) (60,450,382) (4,140,268) (48,795,249) (9,371,397) 1,277,406 (42,002,029) 45,645,137
21,710,049 331,956,268 84,139,495 292,163,269 131,878,026 12,694,131 118,654,520 2,118,263,824(41,581,493) (856,018,125) (91,048,123) (363,523,801) (70,790,575) (16,868,733) (140,000,944) (1,954,564,171)
(19,871,444) (524,061,857) (6,908,628) (71,360,532) 61,087,451 (4,174,602) (21,346,424) 163,699,653
(2,312) (3,031,719) - - (102,751) - (37,134) (8,522,712)
86,943,782 1,072,705,578 62,759,781 391,447,221 104,125,777 21,162,901 122,485,122 1,428,720,208
15

JPMorgan Investment Funds
Combined Statement of Operations and Changes in Net Assets (continued)
For the Year Ended 31 December 2011
GlobalIncome
FundEUR
Global Select130/30
FundUSD
Global SelectEquity Fund
USD
GlobalTotal Return
FundEUR
HighbridgeStatistical
Market NeutralFundEUR
IncomeOpportunity
FundUSD
Japan50 Equity Fund
JPY
Japan BehaviouralFinance Equity
FundUSD
154,763,536 23,983,169 243,047,770 75,080,068 930,858,882 4,713,873,852 25,533,477,954 5,133,970
5,218,564 423,366 4,242,761 869,667 - 1,997,326 441,495,670 100,46113,059,992 237 10,640 148,262 7,646,929 217,989,698 - 803
- 10,119 146,315 - - 652,356 - -2,352 263 1,339 14,828 15,220 31,658 - 168
- - - - 574,236 65,565,471 - -- 211 6,188 93,612 - - - -
18,280,908 434,196 4,407,243 1,126,369 8,236,385 286,236,509 441,495,670 101,432
4,859,619 330,447 1,844,882 1,188,664 12,111,106 58,371,120 135,688,151 67,354286,539 204,891 217,770 48,955 893,730 2,383,850 15,979,715 77,084
65,017 19,896 51,480 17,790 179,837 938,374 1,858,496 1,887171,142 9,686 82,346 28,854 355,896 3,169,781 6,013,709 2,273
783 368 - 1,317 499 2,920 11,433 -- - - - 2,892,635 21,726,779 - -
74,560 2,362 25,908 7,072 363,251 3,346,535 5,968,097 5395,457,660 567,650 2,222,386 1,292,652 16,796,954 89,939,359 165,519,601 149,137
10,175 158,509 9,945 197 41,548 31,794 21,426 63,759
5,447,485 409,141 2,212,441 1,292,455 16,755,406 89,907,565 165,498,175 85,378
- - - - - 99,963 - -
5,447,485 409,141 2,212,441 1,292,455 16,755,406 90,007,528 165,498,175 85,378
12,833,423 25,055 2,194,802 (166,086) (8,519,021) 196,228,981 275,997,495 16,054
(12,172,200) 1,482,852 3,669,814 2,892,972 183,267 97,346,895 (3,334,558,146) 213,508(10,748,691) 227,427 (973,290) 97,391 (5,752,787) 6,841,937 (46,333,229) (302)
(40,580) 19,208 49,862 (2,032,344) - (26,173,125) (21,844,086) -(3,587,427) (8,847) 404,954 (30,850,329) (713,495) (2,966,410) 16,205,803 11,414
- - - - - 1,836,870 - -- - - - (7,636,628) 23,162,535 - -
(26,548,898) 1,720,640 3,151,340 (29,892,310) (13,919,643) 100,048,702 (3,386,529,658) 224,620
6,029,506 (3,372,917) (32,108,263) (5,603,335) 211,480 (221,108,947) (2,219,315,739) (692,597)(9,417,492) (123,623) (144,119) 1,717,207 4,519,864 (136,477,544) (4,560,066) -
(64,159) - (19,453) 341,633 - (958,390) 2,537,141 -4,019,277 (1,390) (2,911) 30,898,119 9,385 78,736 14,910 (1,222)
- - - - - (727,408) - -- (9,566) - 3,201 4,595,597 (156,844,377) - -
567,132 (3,507,496) (32,274,746) 27,356,825 9,336,326 (516,037,930) (2,221,323,754) (693,819)
(13,148,343) (1,761,801) (26,928,604) (2,701,571) (13,102,338) (219,760,247) (5,331,855,917) (453,145)
342,519,991 3,565,247 170,650,253 11,957,557 458,196,055 5,288,272,338 17,067,845,042 1,622,559(97,657,730) (9,852,179) (138,356,787) (33,167,470) (870,937,153) (4,452,635,542) (16,960,432,033) (1,909,622)
244,862,261 (6,286,932) 32,293,466 (21,209,913) (412,741,098) 835,636,796 107,413,009 (287,063)
(12,560,596) (160) (3,895) (630) - (16,964,006) (768,325) (358)
373,916,859 15,934,276 248,408,737 51,167,954 505,015,446 5,312,786,395 20,308,266,721 4,393,404
16

JPMorgan Investment Funds
Combined Statement of Operations and Changes in Net Assets (continued)
For the Year Ended 31 December 2011
JapanFocus Fund
JPY
JapanSelect Equity Fund
JPY
JapanStrategic Value
FundJPY
JF Asiaex-Japan
FundUSD
US BondFundUSD
USEquity Fund
USD
US SelectEquity
FundUSD
9,947,587,849 44,260,575,560 9,796,103,920 1,604,183,115 40,785,397 144,239,604 2,172,590,139
267,228,337 733,985,005 179,762,970 21,561,477 - 2,695,395 27,802,609- - 208,490 77,424 1,316,068 - -- - 1,167,066 - 1,683 2,075 6,581
549 - 72,675 8,793 2,637 249 11,890- - - - 827 - -- - - - - - 984
267,228,886 733,985,005 181,211,201 21,647,694 1,321,215 2,697,719 27,822,064
101,893,330 307,973,211 73,961,691 12,477,448 312,845 3,090,392 30,769,78511,790,670 23,505,071 9,979,925 1,057,297 87,616 161,020 650,450
1,315,232 9,342,102 954,944 143,601 20,733 65,725 335,8903,440,277 11,920,042 2,842,348 347,611 17,634 103,491 934,335
58,243 - - - - - -- - - - 28,425 - -
1,266,745 4,148,848 976,170 138,360 4,389 42,521 452,330119,764,497 356,889,274 88,715,078 14,164,317 471,642 3,463,149 33,142,790
302,004 38,654 1,374,156 141 63,034 1,381 -
119,462,493 356,850,620 87,340,922 14,164,176 408,608 3,461,768 33,142,790
- - - - - - -
119,462,493 356,850,620 87,340,922 14,164,176 408,608 3,461,768 33,142,790
147,766,393 377,134,385 93,870,279 7,483,518 912,607 (764,049) (5,320,726)
(1,913,911,853) (10,513,553,388) (377,118,512) 62,712,137 (179,291) 6,996,649 133,570,635- - 1,753,126 (15,117) (23,823) (746,677) 4,663,562
(112,324,150) (46,439,435) - - 349,468 444,380 (603,406)(549) (21,353) (3,360,622) (710,686) (3,411) 1,656 (46,313)
- - - - 624,019 - -- - - - (210,294) - -
(2,026,236,552) (10,560,014,176) (378,726,008) 61,986,334 556,668 6,696,008 137,584,478
(1,087,183,734) 945,792,086 (912,180,193) (375,465,290) 854,338 (9,031,584) (178,666,295)- - - - 7,055 (1,310,350) (6,056,517)
675,000 597,000 - - 21,067 17,703 (68,077)- 12,395 (1,950,061) (296,257) (1,687) - 15,445- - - - 82,889 - -- - - - 180,459 - -
(1,086,508,734) 946,401,481 (914,130,254) (375,761,547) 1,144,121 (10,324,231) (184,775,444)
(2,964,978,893) (9,236,478,310) (1,198,985,983) (306,291,695) 2,613,396 (4,392,272) (52,511,692)
14,803,330,548 17,645,029,654 6,585,155,182 283,502,967 37,806,583 321,653,553 1,096,004,923(14,750,046,509) (26,453,780,739) (5,018,063,786) (868,151,746) (47,928,885) (209,243,403) (1,578,557,025)
53,284,039 (8,808,751,085) 1,567,091,396 (584,648,779) (10,122,302) 112,410,150 (482,552,102)
(889) (830,212) (865,052) - - (1,080) -
7,035,892,106 26,214,515,953 10,163,344,281 713,242,641 33,276,491 252,256,402 1,637,526,345
17

JPMorgan Investment Funds
Statement of Changes in the Number of Shares (continued)
For the Year Ended 31 December 2011
Shares Outstandingat the Beginning
of the Year
Shares Subscribed Shares Redeemed Shares Outstandingat the End
of the Year
JPMorgan Investment Funds - Blue and Green FundJPM Blue and Green 3,449.615 - - 3,449.615
JPMorgan Investment Funds - Emerging Markets Corporate Bond Portfolio Fund IJPM Emerging Markets Corporate Bond Portfolio I - A (div) - USD 96,796.841 - 10,768.234 86,028.607JPM Emerging Markets Corporate Bond Portfolio I - A (div) - EUR (hedged) 204,329.666 - 3,833.923 200,495.743JPM Emerging Markets Corporate Bond Portfolio I - B (div) - USD 25,003.001 - - 25,003.001JPM Emerging Markets Corporate Bond Portfolio I - B (div) - EUR (hedged) 24,518.818 - - 24,518.818JPM Emerging Markets Corporate Bond Portfolio I - C (div) - USD 136,700.000 - - 136,700.000JPM Emerging Markets Corporate Bond Portfolio I - D (div) - USD 53,615.965 4,417.398 4,779.898 53,253.465JPM Emerging Markets Corporate Bond Portfolio I - D (div) - EUR (hedged) 450,440.865 2,319.752 24,566.434 428,194.183
JPMorgan Investment Funds - Euro Liquid Market FundJPM Euro Liquid Market A (acc) - EUR 66,774.235 257,370.215 169,375.175 154,769.275JPM Euro Liquid Market C (acc) - EUR 55,578.530 85,204.819 102,359.266 38,424.083JPM Euro Liquid Market D (acc) - EUR 78,644.546 348,901.736 196,999.861 230,546.421
JPMorgan Investment Funds - Europe Bond FundJPM Europe Bond A (acc) - EUR 181,780.281 68,548.084 122,100.263 128,228.102JPM Europe Bond A (inc) - EUR 62,030.283 188.000 17,884.000 44,334.283JPM Europe Bond B (acc) - EUR 1,234.074 2.216 1,206.489 29.801JPM Europe Bond C (acc) - EUR 3,027.326 47,081.150 47,881.848 2,226.628JPM Europe Bond D (acc) - EUR 46,904.229 11,530.427 28,043.165 30,391.491JPM Europe Bond X (acc) - EUR 140.718 - 55.129 85.589
JPMorgan Investment Funds - Europe Recovery FundJPM Europe Recovery A (acc) - EUR 832,704.390 52,560.729 275,703.724 609,561.395JPM Europe Recovery A (dist) - EUR 258,215.705 13,309.964 88,706.608 182,819.061JPM Europe Recovery B (acc) - EUR 984.410 11,290.495 11,274.906 999.999JPM Europe Recovery C (acc) - EUR 87,411.189 242,327.025 329,637.714 100.500JPM Europe Recovery D (acc) - EUR 17,118.867 12,881.020 12,288.259 17,711.628JPM Europe Recovery X (acc) - EUR 216,084.264 - 40,420.000 175,664.264
JPMorgan Investment Funds - Europe Select Equity FundJPM Europe Select Equity A (acc) - EUR 35,837.563 122,268.447 49,748.624 108,357.386JPM Europe Select Equity A (acc) - USD 2,946.509 5,847.604 49.510 8,744.603JPM Europe Select Equity A (dist) - EUR 1,854.279 74,554.438 18,560.375 57,848.342JPM Europe Select Equity B (acc) - EUR 48,588.236 101,834.497 64,452.707 85,970.026JPM Europe Select Equity C (acc) - EUR 733,990.819 1,418,766.336 1,355,293.357 797,463.798JPM Europe Select Equity D (acc) - EUR 68,608.549 19,833.909 28,163.926 60,278.532JPM Europe Select Equity D (acc) - USD 34.860 - - 34.860JPM Europe Select Equity I (acc) - EUR 330,128.348 - - 330,128.348JPM Europe Select Equity X (acc) - EUR 386,200.280 9,347.981 55,992.725 339,555.536JPM Europe Select Equity X (acc) - EUR (hedged) 659,537.598 - 329,768.799 329,768.799
JPMorgan Investment Funds - Europe Strategic Dividend FundJPM Europe Strategic Dividend A (acc) - EUR 2,235,828.927 1,500,380.924 1,624,802.107 2,111,407.744JPM Europe Strategic Dividend A (dist) - EUR 49,413.783 78,469.663 28,643.583 99,239.863JPM Europe Strategic Dividend A (div) - EUR - 310.000 - 310.000JPM Europe Strategic Dividend A (inc) - EUR 75,849.265 1,372,206.068 257,014.124 1,191,041.209JPM Europe Strategic Dividend B (acc) - EUR 52,700.000 84,165.313 31,762.708 105,102.605JPM Europe Strategic Dividend C (acc) - EUR 821,064.393 1,656,840.400 962,759.011 1,515,145.782JPM Europe Strategic Dividend D (acc) - EUR 151,795.079 141,771.426 69,464.766 224,101.739JPM Europe Strategic Dividend D (div) - EUR - 10.000 - 10.000JPM Europe Strategic Dividend I (acc) - EUR - 356,757.983 7,782.060 348,975.923JPM Europe Strategic Dividend X (acc) - EUR 2,080.137 57,362.936 709.784 58,733.289
JPMorgan Investment Funds - Global Balanced Fund (EUR)JPM Global Balanced (EUR) A (acc) - EUR 78,526.170 20,084.215 27,121.755 71,488.630JPM Global Balanced (EUR) A (dist) - EUR 182.187 12,670.852 1,890.819 10,962.220JPM Global Balanced (EUR) B (acc) - EUR 4,565.819 1,936.377 613.295 5,888.901JPM Global Balanced (EUR) C (acc) - EUR 3,324.426 2,699.869 2,435.817 3,588.478JPM Global Balanced (EUR) D (acc) - EUR 318,065.313 138,234.931 110,010.475 346,289.769JPM Global Balanced (EUR) T (acc) - EUR - 1,290.315 24.690 1,265.625
JPMorgan Investment Funds - Global Balanced Fund (USD)JF Global Balanced (USD) A (acc) - USD 52,414.454 8,172.338 2,980.329 57,606.463JPM Global Balanced (USD) A (acc) - USD 831,734.550 440,989.474 321,531.665 951,192.359JPM Global Balanced (USD) A (dist) - USD 374.027 10,487.555 917.415 9,944.167JPM Global Balanced (USD) B (acc) - USD 72,992.370 23,717.197 16,640.041 80,069.526JPM Global Balanced (USD) C (acc) - USD 154,934.306 65,461.230 174,610.506 45,785.030JPM Global Balanced (USD) D (acc) - USD 203,401.764 90,736.961 53,711.627 240,427.098JPM Global Balanced (USD) X (acc) - USD 346,595.312 46.000 313,512.460 33,128.852
JPMorgan Investment Funds - Global Bond Fund (EUR)JPM Global Bond (EUR) A (acc) - EUR 310,327.336 83,784.795 109,321.052 284,791.079JPM Global Bond (EUR) A (inc) - EUR 25,284.913 1,418.000 7,938.000 18,764.913JPM Global Bond (EUR) B (acc) - EUR 12,426.620 16,718.042 20,159.437 8,985.225JPM Global Bond (EUR) C (acc) - EUR 117,322.416 33,958.623 16,749.883 134,531.156JPM Global Bond (EUR) D (acc) - EUR 54,125.247 30,018.621 43,201.712 40,942.156JPM Global Bond (EUR) X (acc) - EUR 1,100.308 - 458.663 641.645
18

JPMorgan Investment Funds
Statement of Changes in the Number of Shares (continued)
For the Year Ended 31 December 2011
Shares Outstandingat the Beginning
of the Year
Shares Subscribed Shares Redeemed Shares Outstandingat the End
of the Year
JPMorgan Investment Funds - Global Bond Fund (USD)JF Global Bond (USD) A (acc) - USD 3,220.648 8,670.489 9,706.572 2,184.565JPM Global Bond (USD) A (acc) - USD 173,207.336 8,826.127 24,718.519 157,314.944JPM Global Bond (USD) B (acc) - USD - 999.999 - 999.999JPM Global Bond (USD) C (acc) - USD 3,530.261 705.978 799.507 3,436.732JPM Global Bond (USD) D (acc) - USD 49,929.330 8,767.115 25,290.143 33,406.302JPM Global Bond (USD) X (acc) - USD 236,378.854 - - 236,378.854
JPMorgan Investment Funds - Global Capital Appreciation FundJPM Global Capital Appreciation A (acc) - EUR 205,544.804 79,224.094 88,842.291 195,926.607JPM Global Capital Appreciation A (dist) - EUR 1,416.175 31.339 742.694 704.820JPM Global Capital Appreciation A (inc) - EUR 6,623.775 126.315 481.321 6,268.769JPM Global Capital Appreciation B (acc) - EUR 1,317.348 1,856.151 427.085 2,746.414JPM Global Capital Appreciation C (acc) - EUR 137,914.946 6,489.488 119,547.418 24,857.016JPM Global Capital Appreciation D (acc) - EUR 372,180.844 98,858.491 165,190.712 305,848.623JPM Global Capital Appreciation T (acc) - EUR - 368.805 - 368.805JPM Global Capital Appreciation X (acc) - EUR 261,184.709 - - 261,184.709
JPMorgan Investment Funds - Global Capital Preservation Fund (EUR)JPM Global Capital Preservation (EUR) A (acc) - EUR 667,800.124 143,432.472 382,418.340 428,814.256JPM Global Capital Preservation (EUR) A (acc) - USD 39,764.589 11,985.531 27,789.748 23,960.372JPM Global Capital Preservation (EUR) A (dist) - EUR 469,968.298 23,335.175 195,727.256 297,576.217JPM Global Capital Preservation (EUR) A (inc) - EUR 73,944.026 1,909.561 25,058.362 50,795.225JPM Global Capital Preservation (EUR) B (acc) - EUR 23,815.758 2,349.916 19,570.406 6,595.268JPM Global Capital Preservation (EUR) C (acc) - EUR 101,802.373 88,017.972 119,298.115 70,522.230JPM Global Capital Preservation (EUR) D (acc) - EUR 4,539,135.288 203,546.597 1,971,385.277 2,771,296.608JPM Global Capital Preservation (EUR) D (acc) - SEK (hedged) 563,397.007 208,280.473 93,851.752 677,825.728JPM Global Capital Preservation (EUR) I (acc) - EUR 192,215.692 24,167.000 61,069.000 155,313.692JPM Global Capital Preservation (EUR) I (inc) - EUR 220,889.066 177,696.828 39,188.642 359,397.252JPM Global Capital Preservation (EUR) T (acc) - EUR - 1,215.101 - 1,215.101JPM Global Capital Preservation (EUR) X (acc) - EUR 401,458.322 68,092.635 40,279.320 429,271.637
JPMorgan Investment Funds - Global Capital Preservation Fund (USD)JPM Global Capital Preservation (USD) A (acc) - USD 460,185.662 624,059.454 674,563.328 409,681.788JPM Global Capital Preservation (USD) B (acc) - USD - 50.000 - 50.000JPM Global Capital Preservation (USD) D (acc) - USD 161,996.959 84,594.071 102,129.751 144,461.279
JPMorgan Investment Funds - Global Convertibles Fund (USD)JF Global Convertibles (USD) A (acc) - USD 543.955 2,507.829 1,061.312 1,990.472JPM Global Convertibles (USD) A (acc) - USD 2,734,398.377 1,659,361.553 1,808,659.259 2,585,100.671JPM Global Convertibles (USD) B (acc) - USD 417,042.589 220,739.803 304,788.871 332,993.521JPM Global Convertibles (USD) C (acc) - USD 262,936.356 180,689.965 387,708.905 55,917.416JPM Global Convertibles (USD) D (acc) - USD 315,931.991 74,941.446 196,331.820 194,541.617JPM Global Convertibles (USD) I (acc) - USD 67,007.000 - 64,607.000 2,400.000
JPMorgan Investment Funds - Global Dividend FundJPM Global Dividend A (acc) - USD 384,991.008 801,665.875 462,664.191 723,992.692JPM Global Dividend A (acc) - EUR 9,272.787 21,943.635 7,714.906 23,501.516JPM Global Dividend A (acc) - EUR (hedged) 109,129.512 74,672.908 62,729.501 121,072.919JPM Global Dividend A (div) - EUR - 13.484 - 13.484JPM Global Dividend A (inc) - USD 12,787.585 46,312.839 20,859.263 38,241.161JPM Global Dividend A (inc) - EUR (hedged) 7,957.487 5,252.591 2,401.677 10,808.401JPM Global Dividend B (dist) - EUR - 19,792.665 - 19,792.665JPM Global Dividend C (acc) - EUR 35,320.180 212,375.451 85,764.132 161,931.499JPM Global Dividend C (div) - EUR - 13.484 - 13.484JPM Global Dividend D (acc) - USD 16,511.678 14,223.019 14,240.330 16,494.367JPM Global Dividend D (acc) - EUR (hedged) 27,360.705 57,930.681 27,059.650 58,231.736JPM Global Dividend X (acc) - USD - 111,346.477 86,974.547 24,371.930
JPMorgan Investment Funds - Global Enhanced Bond FundJPM Global Enhanced Bond A (acc) - EUR 130,026.136 52,936.117 68,956.347 114,005.906JPM Global Enhanced Bond A (inc) - EUR 49.539 7.518 7.518 49.539JPM Global Enhanced Bond B (acc) - EUR* 8,331.434 212.714 8,544.148 -JPM Global Enhanced Bond C (acc) - EUR 22,201.738 - 185.574 22,016.164JPM Global Enhanced Bond D (acc) - EUR 45,234.574 53,442.428 66,759.293 31,917.709JPM Global Enhanced Bond X (acc) - EUR 197.750 1,023.000 16.591 1,204.159
JPMorgan Investment Funds - Global Financials FundJPM Global Financials A (acc) - USD 739,375.036 726,753.394 777,780.747 688,347.683JPM Global Financials A (acc) - EUR 595,497.628 127,531.243 247,109.076 475,919.795JPM Global Financials A (acc) - SGD - 533.284 - 533.284JPM Global Financials A (dist) - USD 702,599.309 235,950.787 73,667.792 864,882.304JPM Global Financials B (acc) - USD 338,420.592 1,197,220.604 689,184.237 846,456.959JPM Global Financials C (acc) - USD 233,331.952 149,763.956 382,560.311 535.597JPM Global Financials D (acc) - USD 66,587.334 16,766.848 29,008.258 54,345.924JPM Global Financials X (acc) - USD 10,185.237 113.915 1,210.000 9,089.152
19

JPMorgan Investment Funds
Statement of Changes in the Number of Shares (continued)
For the Year Ended 31 December 2011
Shares Outstandingat the Beginning
of the Year
Shares Subscribed Shares Redeemed Shares Outstandingat the End
of the Year
JPMorgan Investment Funds - Global High Yield Bond FundJPM Global High Yield Bond A (acc) - USD 3,282,610.566 6,555,023.242 5,646,468.445 4,191,165.363JPM Global High Yield Bond A (acc) - EUR (hedged) 963,313.231 920,689.804 1,090,837.217 793,165.818JPM Global High Yield Bond A (inc) - EUR (hedged) 59,764.926 458,535.909 347,225.464 171,075.371JPM Global High Yield Bond A (mth) - USD 567,386.801 2,133,222.221 1,409,807.998 1,290,801.024JPM Global High Yield Bond B (acc) - USD - 58,962.171 - 58,962.171JPM Global High Yield Bond B (acc) - EUR (hedged) 154,700.504 195,855.466 278,126.747 72,429.223JPM Global High Yield Bond C (acc) - USD 768,659.698 2,527,499.258 1,727,533.302 1,568,625.654JPM Global High Yield Bond C (acc) - EUR (hedged) 967,852.030 977,971.727 868,722.886 1,077,100.871JPM Global High Yield Bond D (acc) - USD 823.395 2,625.589 279.486 3,169.498JPM Global High Yield Bond D (acc) - EUR (hedged) 282,313.565 270,539.950 219,602.242 333,251.273JPM Global High Yield Bond I (acc) - USD 1,436,986.484 340,378.927 1,772,501.412 4,863.999JPM Global High Yield Bond I (inc) - EUR (hedged) 95,393.467 136,700.000 152,419.000 79,674.467JPM Global High Yield Bond X (acc) - USD - 1,186,328.989 504,994.634 681,334.355JPM Global High Yield Bond X (acc) - EUR (hedged) 54,365.617 344,063.519 340,846.991 57,582.145
JPMorgan Investment Funds - Global Income FundJPM Global Income A (div) - EUR 135,535.656 531,404.345 191,052.023 475,887.978JPM Global Income B (div) - EUR - 1,778.561 1,641.149 137.412JPM Global Income C (div) - EUR 100,891.807 172,637.204 144,650.625 128,878.386JPM Global Income D (div) - EUR 1,021,365.031 1,956,968.730 476,962.409 2,501,371.352JPM Global Income T (div) - EUR - 98,332.613 142.460 98,190.153JPM Global Income X (div) - EUR - 9,500.000 - 9,500.000
JPMorgan Investment Funds - Global Select 130/30 FundJPM Global Select 130/30 A (acc) - USD 109,857.521 12,828.069 24,074.172 98,611.418JPM Global Select 130/30 A (acc) - EUR* - 1,359.796 1,359.796 -JPM Global Select 130/30 A (dist) - USD 531.926 61.527 481.926 111.527JPM Global Select 130/30 C (acc) - USD 29,207.540 3,143.358 30,962.879 1,388.019JPM Global Select 130/30 D (acc) - USD 33,382.882 9,423.727 12,415.407 30,391.202
JPMorgan Investment Funds - Global Select Equity FundJPM Global Select Equity A (acc) - USD 447,871.635 112,490.270 306,934.522 253,427.383JPM Global Select Equity A (dist) - USD 9,272.695 18,761.805 19,469.803 8,564.697JPM Global Select Equity B (acc) - USD 360.000 410.999 565.999 205.000JPM Global Select Equity C (acc) - USD 704,757.544 110,511.743 468,000.535 347,268.752JPM Global Select Equity C (acc) - EUR - 329,972.669 95,424.050 234,548.619JPM Global Select Equity D (acc) - USD 64,828.157 10,943.294 43,664.466 32,106.985JPM Global Select Equity X (acc) - USD 342,841.521 708,516.367 - 1,051,357.888
JPMorgan Investment Funds - Global Total Return FundJPM Global Total Return A (acc) - EUR 317,262.260 86,828.867 161,572.758 242,518.369JPM Global Total Return A (dist) - EUR 718.952 5.992 633.147 91.797JPM Global Total Return A (inc) - EUR 97.972 - - 97.972JPM Global Total Return C (acc) - EUR 27,580.324 6,603.950 29,229.869 4,954.405JPM Global Total Return D (acc) - EUR 341,265.123 14,803.835 113,198.366 242,870.592
JPMorgan Investment Funds - Highbridge Statistical Market Neutral FundJPM Highbridge Statistical Market Neutral A (acc) - EUR 2,251,943.725 303,611.879 1,086,505.942 1,469,049.662JPM Highbridge Statistical Market Neutral A (acc) - SEK (hedged) 231,393.599 1,638,619.567 1,655,733.517 214,279.649JPM Highbridge Statistical Market Neutral A (acc) - USD 113,803.078 12,210.950 103,008.717 23,005.311JPM Highbridge Statistical Market Neutral A (acc) - USD (hedged) 144,380.393 115,178.917 163,146.088 96,413.222JPM Highbridge Statistical Market Neutral A (dist) - GBP 11,120.387 1,438.223 7,444.721 5,113.889JPM Highbridge Statistical Market Neutral A (dist) - GBP (hedged) 77,892.690 3,471.758 58,004.760 23,359.688JPM Highbridge Statistical Market Neutral A (inc) - EUR 56,653.230 620.390 8,184.377 49,089.243JPM Highbridge Statistical Market Neutral B (acc) - EUR 294,331.723 140,719.397 305,159.054 129,892.066JPM Highbridge Statistical Market Neutral B (dist) - GBP (hedged) - 206,216.565 44,256.613 161,959.952JPM Highbridge Statistical Market Neutral C (acc) - EUR 1,291,469.436 1,372,947.743 1,799,210.129 865,207.050JPM Highbridge Statistical Market Neutral C (dist) - GBP (hedged) 1,459,959.716 128,508.584 1,458,572.046 129,896.254JPM Highbridge Statistical Market Neutral C (dist) - USD (hedged) 40,841.658 50,155.000 26,955.212 64,041.446JPM Highbridge Statistical Market Neutral D (acc) - EUR 2,518,568.924 66,922.727 1,178,917.699 1,406,573.952JPM Highbridge Statistical Market Neutral D (acc) - USD 20,391.513 550.437 14,633.325 6,308.625JPM Highbridge Statistical Market Neutral D (acc) - USD (hedged) 8,699.862 3,251.951 5,697.792 6,254.021JPM Highbridge Statistical Market Neutral I (acc) - EUR* 197,067.662 - 197,067.662 -JPM Highbridge Statistical Market Neutral I (dist) - EUR 146,170.498 290,185.890 332,507.726 103,848.662JPM Highbridge Statistical Market Neutral T (acc) - EUR - 579.650 - 579.650JPM Highbridge Statistical Market Neutral X (acc) - EUR 103,965.721 20,537.001 21,810.720 102,692.002
20

JPMorgan Investment Funds
Statement of Changes in the Number of Shares (continued)
For the Year Ended 31 December 2011
Shares Outstandingat the Beginning
of the Year
Shares Subscribed Shares Redeemed Shares Outstandingat the End
of the Year
JPMorgan Investment Funds - Income Opportunity FundJPM Income Opportunity A (acc) - USD 5,725,462.100 3,491,098.050 3,733,203.843 5,483,356.307JPM Income Opportunity A (acc) - CHF (hedged) - 3,225.950 - 3,225.950JPM Income Opportunity A (acc) - EUR (hedged) 5,052,883.048 7,051,372.432 5,385,068.943 6,719,186.537JPM Income Opportunity A (acc) - SEK (hedged) 505,188.266 642,113.472 369,408.400 777,893.338JPM Income Opportunity A (inc) - EUR (hedged) 649,623.998 1,760,612.991 293,661.662 2,116,575.327JPM Income Opportunity A (dist) - GBP (hedged) 2,526,973.278 896,522.779 1,021,911.318 2,401,584.739JPM Income Opportunity B (acc) - USD 997,322.415 473,996.436 704,232.762 767,086.089JPM Income Opportunity B (acc) - EUR (hedged) 991,358.716 1,315,443.706 1,574,857.904 731,944.518JPM Income Opportunity B (dist) - GBP (hedged) - 588,092.169 18,208.481 569,883.688JPM Income Opportunity C (acc) - USD 1,568,131.304 2,812,994.917 2,396,335.236 1,984,790.985JPM Income Opportunity C (acc) - USD (hedged to BRL)* 67,681.326 105,071.610 172,752.936 -JPM Income Opportunity C (acc) - EUR (hedged) 6,384,470.579 4,526,526.316 5,203,977.095 5,707,019.800JPM Income Opportunity C (acc) - SEK (hedged) 95,026.376 9,483.538 92,127.612 12,382.302JPM Income Opportunity C (dist) - GBP (hedged) 871,191.550 733,430.829 966,718.606 637,903.773JPM Income Opportunity D (acc) - EUR (hedged) 3,018,253.205 5,822,715.613 3,806,264.195 5,034,704.623JPM Income Opportunity D (inc) - EUR (hedged) 68.985 133,221.000 4,807.000 128,482.985JPM Income Opportunity X (acc) - USD 285,514.772 357,859.946 327,873.856 315,500.862JPM Income Opportunity X (acc) - EUR (hedged) 200,355.894 316,388.012 348,304.653 168,439.253JPM Income Opportunity X (acc) - GBP (hedged) 28,865.000 - 8,050.000 20,815.000JPM Income Opportunity X (dist) - GBP (hedged) - 16,388.980 16,378.868 10.112
JPMorgan Investment Funds - Japan 50 Equity FundJPM Japan 50 Equity A (acc) - JPY 744,772.621 1,046,142.906 1,458,580.948 332,334.579JPM Japan 50 Equity A (dist) - JPY 5,019.607 167.418 4,033.000 1,154.025JPM Japan 50 Equity A (acc) - EUR 233,995.803 1,300,054.677 242,524.067 1,291,526.413JPM Japan 50 Equity A (acc) - EUR (hedged) - 40.778 - 40.778JPM Japan 50 Equity C (acc) - JPY 540,633.027 120,603.469 261,457.132 399,779.364JPM Japan 50 Equity C (acc) - EUR (hedged) - 17,973.789 1,582.700 16,391.089JPM Japan 50 Equity D (acc) - JPY 9,351.429 146,115.414 144,935.539 10,531.304JPM Japan 50 Equity D (acc) - EUR (hedged) - 38.974 - 38.974JPM Japan 50 Equity X (acc) - JPY 1,146,984.151 1,584.392 58,245.985 1,090,322.558
JPMorgan Investment Funds - Japan Behavioural Finance Equity FundJPM Japan Behavioural Finance Equity A (acc) - USD 20,484.803 8,697.230 1,151.047 28,030.986JPM Japan Behavioural Finance Equity A (acc) - EUR 16,454.848 4,455.177 4,419.669 16,490.356JPM Japan Behavioural Finance Equity A (dist) - USD 17,905.103 402.000 402.000 17,905.103JPM Japan Behavioural Finance Equity D (acc) - EUR 3,658.540 9,595.404 7,818.835 5,435.109JPM Japan Behavioural Finance Equity X (acc) - USD* 11,535.181 - 11,535.181 -
JPMorgan Investment Funds - Japan Focus FundJPM Japan Focus A (acc) - JPY 639,395.718 1,232,096.657 1,581,107.110 290,385.265JPM Japan Focus A (dist) - JPY 8.888 - - 8.888JPM Japan Focus B (acc) - JPY - 4,053.537 1,296.487 2,757.050JPM Japan Focus C (acc) - JPY - 573,667.576 421,187.011 152,480.565JPM Japan Focus D (acc) - JPY 6,120.946 7,080.652 2,047.356 11,154.242JPM Japan Focus I (acc) - JPY 351,343.699 25,128.516 85,000.000 291,472.215JPM Japan Focus X (acc) - JPY 260,808.757 4,000.635 - 264,809.392
JPMorgan Investment Funds - Japan Select Equity FundJPM Japan Select Equity A (acc) - JPY 1,902,055.417 927,012.002 1,584,557.460 1,244,509.959JPM Japan Select Equity A (dist) - JPY 7,377.991 367.482 3,700.780 4,044.693JPM Japan Select Equity B (acc) - JPY 157,495.057 117,801.620 215,090.462 60,206.215JPM Japan Select Equity C (acc) - JPY 2,086,455.427 1,236,811.711 1,688,226.804 1,635,040.334JPM Japan Select Equity D (acc) - JPY 121,128.943 144,091.537 162,204.621 103,015.859JPM Japan Select Equity I (acc) - JPY 302,140.000 - - 302,140.000JPM Japan Select Equity X (acc) - JPY 1,142,794.711 76,621.948 326,889.996 892,526.663
JPMorgan Investment Funds - Japan Strategic Value FundJPM Japan Strategic Value A (acc) - JPY 605,574.909 479,793.444 423,553.618 661,814.735JPM Japan Strategic Value A (acc) - EUR 23,493.607 16,039.123 26,185.560 13,347.170JPM Japan Strategic Value A (dist) - GBP 55,467.574 33,165.830 24,619.574 64,013.830JPM Japan Strategic Value C (acc) - JPY 112,993.908 252,302.553 115,774.430 249,522.031JPM Japan Strategic Value D (acc) - JPY 25,621.808 14,373.120 24,057.874 15,937.054JPM Japan Strategic Value D (acc) - EUR 23,560.314 3,077.827 24,518.604 2,119.537JPM Japan Strategic Value X (acc) - JPY 314,559.421 53,034.000 39,817.000 327,776.421
JPMorgan Investment Funds - JF Asia ex-Japan FundJF Asia ex-Japan A (acc) - USD 1,182,163.024 216,446.051 602,430.171 796,178.904JF Asia ex-Japan A (dist) - USD 164,052.942 128,028.775 162,558.096 129,523.621JF Asia ex-Japan B (acc) - USD 163,113.028 83,691.762 129,164.216 117,640.574JF Asia ex-Japan C (acc) - USD 791,161.316 302,583.508 458,084.668 635,660.156JF Asia ex-Japan C (dist) - USD - 165,580.560 5,463.111 160,117.449JF Asia ex-Japan D (acc) - USD 216,871.567 88,225.757 121,757.395 183,339.929JF Asia ex-Japan I (acc) - USD 3,883,035.608 89,753.349 2,540,139.988 1,432,648.969JF Asia ex-Japan X (acc) - USD 185,961.905 40,928.829 94,020.518 132,870.216JF Asia ex-Japan X (dist) - USD - 19,232.703 13,637.680 5,595.023
JPMorgan Investment Funds - US Bond FundJPM US Bond A (acc) - USD 162,017.368 101,980.945 156,178.441 107,819.872JPM US Bond A (inc) - USD 1,082.226 - 235.000 847.226JPM US Bond B (acc) - USD 4,639.043 189.593 3,262.883 1,565.753JPM US Bond C (acc) - USD 11,014.254 82,596.109 59,938.383 33,671.980JPM US Bond D (acc) - USD 85,139.661 39,108.446 72,109.103 52,139.004
21

JPMorgan Investment Funds
Statement of Changes in the Number of Shares (continued)
For the Year Ended 31 December 2011
Shares Outstandingat the Beginning
of the Year
Shares Subscribed Shares Redeemed Shares Outstandingat the End
of the Year
JPMorgan Investment Funds - US Equity FundJPM US Equity A (acc) - USD 1,031,179.167 1,841,645.912 1,441,773.041 1,431,052.038JPM US Equity A (acc) - EUR (hedged) 91,748.328 393,541.343 110,119.232 375,170.439JPM US Equity A (dist) - GBP 23,665.174 16,245.982 13,218.980 26,692.176JPM US Equity C (acc) - USD 281,261.930 562,718.882 450,464.597 393,516.215JPM US Equity D (acc) - USD 26,683.183 37,027.759 14,756.117 48,954.825JPM US Equity D (acc) - EUR (hedged) 35,382.806 92,172.132 59,697.912 67,857.026JPM US Equity X (acc) - USD 121,743.181 516,577.725 156,643.610 481,677.296
JPMorgan Investment Funds - US Select Equity FundJPM US Select Equity A (acc) - USD 7,612,406.656 2,235,926.304 4,524,797.954 5,323,535.006JPM US Select Equity A (acc) - EUR 1,323,779.488 498,748.865 1,513,211.455 309,316.898JPM US Select Equity A (acc) - EUR (hedged) 490,816.117 1,481,517.449 1,400,371.177 571,962.389JPM US Select Equity A (dist) - USD 621,917.103 126,696.643 366,600.660 382,013.086JPM US Select Equity B (acc) - USD 734,542.787 215,646.684 548,062.756 402,126.715JPM US Select Equity C (acc) - USD 2,443,763.511 835,773.734 1,640,717.048 1,638,820.197JPM US Select Equity C (acc) - EUR - 533,270.993 199,477.568 333,793.425JPM US Select Equity C (acc) - EUR (hedged) 363,398.065 140,611.856 360,360.771 143,649.150JPM US Select Equity C (dist) - GBP - 1,600,232.590 - 1,600,232.590JPM US Select Equity D (acc) - USD 586,674.937 509,955.900 264,375.885 832,254.952JPM US Select Equity D (acc) - EUR (hedged) 512,808.333 529,270.265 467,764.087 574,314.511JPM US Select Equity I (acc) - USD 500,444.560 70,365.917 480,000.000 90,810.477JPM US Select Equity X (acc) - USD 113,159.525 9,593.789 56,258.188 66,495.126
* Share Class inactive as at end of the year.
The accompanying notes form an integral part of these Financial Statements.
22

JPMorgan Investment Funds
Statistical Information (continued)
Net Asset Value per Share in Share Class Currency
31 December 2011 31 December 2010 31 December 2009 31 December 2008 31 December 2007
JPMorgan Investment Funds - Blue and Green FundJPM Blue and Green 23,641.30 24,413.93 24,134.21 22,014.87 23,536.25
JPMorgan Investment Funds - Emerging Markets Corporate Bond Portfolio Fund IJPM Emerging Markets Corporate Bond Portfolio I - A (div) - USD 103.72 105.47 - - -JPM Emerging Markets Corporate Bond Portfolio I - A (div) - EUR (hedged) 84.52 85.83 - - -JPM Emerging Markets Corporate Bond Portfolio I - B (div) - USD 104.43 105.82 - - -JPM Emerging Markets Corporate Bond Portfolio I - B (div) - EUR (hedged) 85.49 86.50 - - -JPM Emerging Markets Corporate Bond Portfolio I - C (div) - USD 104.63 105.92 - - -JPM Emerging Markets Corporate Bond Portfolio I - D (div) - USD 103.08 105.16 - - -JPM Emerging Markets Corporate Bond Portfolio I - D (div) - EUR (hedged) 84.00 85.58 - - -
JPMorgan Investment Funds - Euro Liquid Market FundJPM Euro Liquid Market A (acc) - EUR 1,009.95 1,006.48 1,006.28 1,000.71 963.63JPM Euro Liquid Market C (acc) - EUR 107.05 106.24 105.87 104.87 100.58JPM Euro Liquid Market D (acc) - EUR 101.44 101.19 101.18 100.71 -JPM Euro Liquid Market X (acc) - EUR* - - - - 116.92
JPMorgan Investment Funds - Europe Bond FundJPM Europe Bond A (acc) - EUR 143.77 140.49 134.82 123.94 148.36JPM Europe Bond A (inc) - EUR 87.83 85.83 82.36 75.72 94.15JPM Europe Bond B (acc) - EUR 147.00 143.28 137.10 125.66 149.95JPM Europe Bond C (acc) - EUR 141.88 138.09 131.98 120.85 144.07JPM Europe Bond D (acc) - EUR 114.35 112.14 107.99 99.62 119.69JPM Europe Bond X (acc) - EUR 153.09 148.40 141.27 128.85 152.97
JPMorgan Investment Funds - Europe Recovery FundJPM Europe Recovery A (acc) - EUR 171.20 221.91 179.27 142.33 245.28JPM Europe Recovery A (dist) - EUR 70.58 92.19 75.01 61.09 111.16JPM Europe Recovery B (acc) - EUR 78.98 98.97 111.71 87.99 150.51JPM Europe Recovery C (acc) - EUR 136.38 175.27 140.32 110.38 188.50JPM Europe Recovery D (acc) - EUR 157.65 206.40 168.41 135.06 235.10JPM Europe Recovery X (acc) - EUR 126.16 160.63 127.51 - 264.29
JPMorgan Investment Funds - Europe Select Equity FundJPM Europe Select Equity A (acc) - EUR 701.65 808.95 730.52 521.40 976.84JPM Europe Select Equity A (acc) - USD 94.40 112.31 108.78 76.43 148.73JPM Europe Select Equity A (dist) - EUR 48.31 56.27 51.29 58.41 110.63JPM Europe Select Equity B (acc) - EUR 65.79 75.28 67.47 47.79 88.87JPM Europe Select Equity C (acc) - EUR 69.65 79.47 71.01 50.15 92.97JPM Europe Select Equity D (acc) - EUR 64.39 74.80 68.05 48.94 92.38JPM Europe Select Equity D (acc) - USD 91.59 109.79 107.15 75.85 148.71JPM Europe Select Equity I (acc) - EUR 91.17 103.93 - - -JPM Europe Select Equity X (acc) - EUR 95.79 108.49 96.27 67.52 124.30JPM Europe Select Equity X (acc) - EUR (hedged) 74.51 86.08 79.52 57.97 98.70
JPMorgan Investment Funds - Europe Strategic Dividend FundJPM Europe Strategic Dividend A (acc) - EUR 116.44 125.68 112.89 80.41 140.42JPM Europe Strategic Dividend A (dist) - EUR 77.71 85.93 79.08 59.70 106.43JPM Europe Strategic Dividend A (inc) - EUR 67.77 74.85 68.88 51.99 92.42JPM Europe Strategic Dividend A (div) - EUR 101.57 - - - -JPM Europe Strategic Dividend B (acc) - EUR 100.96 108.16 - - -JPM Europe Strategic Dividend C (acc) - EUR 79.29 84.69 75.28 53.06 91.69JPM Europe Strategic Dividend D (acc) - EUR 94.72 103.00 93.21 66.90 117.71JPM Europe Strategic Dividend D (div) - EUR 101.52 - - - -JPM Europe Strategic Dividend I (acc) - EUR 90.97 - - - -JPM Europe Strategic Dividend X (acc) - EUR 80.55 85.42 74.61 52.21 89.59
JPMorgan Investment Funds - Global Balanced Fund (EUR)JPM Global Balanced (EUR) A (acc) - EUR 1,257.42 1,284.41 1,157.38 1,005.92 1,232.33JPM Global Balanced (EUR) A (dist) - EUR 93.48 96.78 88.60 84.79 108.43JPM Global Balanced (EUR) B (acc) - EUR 1,464.27 1,486.77 1,331.71 1,150.52 1,400.98JPM Global Balanced (EUR) C (acc) - EUR 979.79 993.36 888.43 766.40 931.83JPM Global Balanced (EUR) D (acc) - EUR 128.45 131.86 119.42 104.31 128.44JPM Global Balanced (EUR) T (acc) - EUR 99.53 - - - -
JPMorgan Investment Funds - Global Balanced Fund (USD)JF Global Balanced (USD) A (acc) - USD 168.47 170.85 157.48 134.47 165.13JPM Global Balanced (USD) A (acc) - USD 176.53 178.95 164.86 140.70 172.70JPM Global Balanced (USD) A (dist) - USD 109.74 112.52 104.55 91.32 116.85JPM Global Balanced (USD) B (acc) - USD 188.58 190.01 174.00 147.61 180.08JPM Global Balanced (USD) C (acc) - USD 167.11 168.12 153.72 130.21 158.62JPM Global Balanced (USD) D (acc) - USD 148.53 151.32 140.10 120.17 148.24JPM Global Balanced (USD) X (acc) - USD 216.83 216.42 196.31 165.00 199.38
JPMorgan Investment Funds - Global Bond Fund (EUR)JPM Global Bond (EUR) A (acc) - EUR 118.03 110.96 104.34 104.79 131.08JPM Global Bond (EUR) A (inc) - EUR 88.46 83.16 78.19 78.53 102.20JPM Global Bond (EUR) B (acc) - EUR 215.35 201.84 189.23 189.48 236.29JPM Global Bond (EUR) C (acc) - EUR 222.14 207.90 194.61 194.58 242.25JPM Global Bond (EUR) D (acc) - EUR 106.76 100.77 95.13 95.93 120.47JPM Global Bond (EUR) X (acc) - EUR 214.69 200.02 186.40 185.53 229.97
23

JPMorgan Investment Funds
Statistical Information (continued)
Net Asset Value per Share in Share Class Currency
31 December 2011 31 December 2010 31 December 2009 31 December 2008 31 December 2007
JPMorgan Investment Funds - Global Bond Fund (USD)JF Global Bond (USD) A (acc) - USD 97.64 93.36 88.26 87.87 113.11JPM Global Bond (USD) A (acc) - USD 135.01 128.83 121.55 120.78 155.15JPM Global Bond (USD) B (acc) - USD** 101.94 - - 124.84 159.89JPM Global Bond (USD) C (acc) - USD 136.56 129.73 121.85 120.53 154.16JPM Global Bond (USD) D (acc) - USD 103.22 98.89 93.68 93.45 120.54JPM Global Bond (USD) X (acc) - USD 139.31 131.75 123.19 121.31 154.43
JPMorgan Investment Funds - Global Capital Appreciation FundJPM Global Capital Appreciation A (acc) - EUR 120.97 128.69 118.00 104.02 124.65JPM Global Capital Appreciation A (dist) - EUR 98.59 105.16 97.19 90.15 109.83JPM Global Capital Appreciation A (inc) - EUR 101.28 108.05 99.84 89.92 109.54JPM Global Capital Appreciation B (acc) - EUR 119.82 126.83 115.71 101.50 121.02JPM Global Capital Appreciation C (acc) - EUR 101.47 106.91 97.35 85.23 101.42JPM Global Capital Appreciation D (acc) - EUR 98.55 105.58 97.49 86.54 104.44JPM Global Capital Appreciation T (acc) - EUR 94.35 - - - -JPM Global Capital Appreciation X (acc) - EUR 112.98 118.58 107.27 93.30 110.29
JPMorgan Investment Funds - Global Capital Preservation Fund (EUR)JPM Global Capital Preservation (EUR) A (acc) - EUR 1,060.00 1,108.03 1,084.13 982.37 1,078.28JPM Global Capital Preservation (EUR) A (acc) - USD 138.54 149.45 156.84 138.23 159.51JPM Global Capital Preservation (EUR) A (dist) - EUR 97.70 105.87 105.29 97.02 108.91JPM Global Capital Preservation (EUR) A (inc) - EUR 98.02 106.23 105.52 96.08 107.88JPM Global Capital Preservation (EUR) B (acc) - EUR 1,190.35 1,238.08 1,205.33 1,086.75 1,186.95JPM Global Capital Preservation (EUR) C (acc) - EUR 969.45 1,006.28 977.66 879.72 958.82JPM Global Capital Preservation (EUR) D (acc) - EUR 119.35 125.32 123.17 112.11 123.61JPM Global Capital Preservation (EUR) D (acc) - SEK (hedged) 945.03 981.15 963.33 881.29 -JPM Global Capital Preservation (EUR) I (acc) - EUR 101.27 105.04 102.10 91.83 -JPM Global Capital Preservation (EUR) I (inc) - EUR 98.87 107.15 106.38 96.84 108.54JPM Global Capital Preservation (EUR) T (acc) - EUR 98.13 - - - -JPM Global Capital Preservation (EUR) X (acc) - EUR 125.79 129.70 125.19 111.92 121.18
JPMorgan Investment Funds - Global Capital Preservation Fund (USD)JPM Global Capital Preservation (USD) A (acc) - USD 114.02 119.31 115.79 106.87 115.19JPM Global Capital Preservation (USD) B (acc) - USD 96.19 - - - -JPM Global Capital Preservation (USD) D (acc) - USD 111.04 116.70 113.74 105.45 114.18JPM Global Capital Preservation (USD) X (acc) - USD* - - - 108.97 115.87
JPMorgan Investment Funds - Global Convertibles Fund (USD)JF Global Convertibles (USD) A (acc) - USD 103.78 114.25 108.14 - -JPM Global Convertibles (USD) A (acc) - USD 126.66 139.07 131.30 101.71 137.72JPM Global Convertibles (USD) B (acc) - USD 98.60 107.56 100.89 77.64 -JPM Global Convertibles (USD) C (acc) - USD 127.71 139.25 130.55 - -JPM Global Convertibles (USD) D (acc) - USD 121.32 133.88 127.03 98.89 134.58JPM Global Convertibles (USD) I (acc) - USD 102.58 111.72 104.65 80.45 108.12JPM Global Convertibles (USD) X (acc) - USD* - - 114.46 - 119.47
JPMorgan Investment Funds - Global Dividend FundJPM Global Dividend A (acc) - USD 77.53 82.98 76.82 62.53 100.09JPM Global Dividend A (acc) - EUR 75.74 78.56 - - -JPM Global Dividend A (acc) - EUR (hedged) 53.42 57.24 52.66 45.03 68.35JPM Global Dividend A (div) - EUR 76.67 - - - -JPM Global Dividend A (inc) - USD 102.12 111.09 103.11 - -JPM Global Dividend A (inc) - EUR (hedged) 98.24 107.03 100.88 - -JPM Global Dividend B (dist) - EUR 70.02 - - - -JPM Global Dividend C (acc) - EUR 108.66 111.48 95.18 - -JPM Global Dividend C (div) - EUR 76.74 - - - -JPM Global Dividend D (acc) - USD 75.18 81.08 75.63 62.02 100.03JPM Global Dividend D (acc) - EUR (hedged) 51.81 55.93 51.84 44.66 68.30JPM Global Dividend X (acc) - USD 90.63 - - - -
JPMorgan Investment Funds - Global Enhanced Bond FundJPM Global Enhanced Bond A (acc) - EUR 123.91 116.24 104.30 95.22 125.09JPM Global Enhanced Bond A (inc) - EUR 90.97 85.35 77.05 71.38 97.83JPM Global Enhanced Bond B (acc) - EUR* - 117.61 105.16 95.68 125.25JPM Global Enhanced Bond C (acc) - EUR 139.52 130.23 116.27 105.63 138.06JPM Global Enhanced Bond D (acc) - EUR 118.51 111.50 100.35 91.90 121.09JPM Global Enhanced Bond X (acc) - EUR 147.80 137.27 121.89 110.18 143.35
JPMorgan Investment Funds - Global Financials FundJPM Global Financials A (acc) - USD 76.06 99.05 96.33 69.22 157.72JPM Global Financials A (acc) - EUR 37.80 47.71 43.26 31.96 69.27JPM Global Financials A (acc) - SGD 13.21 - - - -JPM Global Financials A (dist) - USD 43.24 56.36 55.21 44.45 102.89JPM Global Financials B (acc) - USD 4.76 6.15 5.93 4.23 9.55JPM Global Financials C (acc) - USD 81.54 105.31 101.56 72.36 163.47JPM Global Financials D (acc) - USD 76.24 100.28 98.51 71.50 164.58JPM Global Financials X (acc) - USD 126.86 162.32 155.15 109.61 245.50
24

JPMorgan Investment Funds
Statistical Information (continued)
Net Asset Value per Share in Share Class Currency
31 December 2011 31 December 2010 31 December 2009 31 December 2008 31 December 2007
JPMorgan Investment Funds - Global High Yield Bond FundJPM Global High Yield Bond A (acc) - USD 119.17 114.52 100.43 66.67 -JPM Global High Yield Bond A (acc) - EUR (hedged) 163.10 156.44 137.96 91.70 145.19JPM Global High Yield Bond A (inc) - EUR (hedged) 82.05 83.00 78.42 59.60 101.43JPM Global High Yield Bond A (mth) - USD 98.89 101.97 95.01 67.12 -JPM Global High Yield Bond B (acc) - USD 105.26 - - - -JPM Global High Yield Bond B (acc) - EUR (hedged) 170.18 162.67 142.94 94.68 149.39JPM Global High Yield Bond C (acc) - USD 121.73 116.22 101.26 66.79 -JPM Global High Yield Bond C (acc) - EUR (hedged) 176.99 168.67 147.78 97.59 153.51JPM Global High Yield Bond D (acc) - USD 108.14 104.33 - - -JPM Global High Yield Bond D (acc) - EUR (hedged) 155.36 149.62 132.47 88.40 140.54JPM Global High Yield Bond I (acc) - USD 124.50 118.62 103.29 - -JPM Global High Yield Bond I (inc) - EUR (hedged) 66.87 67.56 63.63 43.72 -JPM Global High Yield Bond X (acc) - USD 104.14 - - - -JPM Global High Yield Bond X (acc) - EUR (hedged) 118.28 112.14 97.76 64.24 100.53
JPMorgan Investment Funds - Global Income FundJPM Global Income A (div) - EUR 129.12 136.55 127.67 101.68 -JPM Global Income B (div) - EUR 93.73 - - - -JPM Global Income C (div) - EUR 104.26 110.59 - - -JPM Global Income D (div) - EUR 115.41 122.48 114.92 - -JPM Global Income T (div) - EUR 95.49 - - - -JPM Global Income X (div) - EUR 102.17 - - - -
JPMorgan Investment Funds - Global Select 130/30 FundJPM Global Select 130/30 A (acc) - USD 129.23 143.47 131.20 97.03 166.53JPM Global Select 130/30 A (acc) - EUR* - - 96.81 73.53 -JPM Global Select 130/30 A (dist) - USD 91.02 101.34 92.99 70.92 122.68JPM Global Select 130/30 C (acc) - USD 139.77 153.74 139.34 102.25 173.74JPM Global Select 130/30 D (acc) - USD 98.26 110.18 101.77 75.93 131.73
JPMorgan Investment Funds - Global Select Equity FundJPM Global Select Equity A (acc) - USD 136.77 156.60 142.40 101.20 182.13JPM Global Select Equity A (dist) - USD 93.05 106.98 97.51 70.45 127.44JPM Global Select Equity B (acc) - USD 147.26 167.35 151.08 106.57 190.34JPM Global Select Equity C (acc) - USD 138.38 156.72 140.95 99.05 176.31JPM Global Select Equity C (acc) - EUR 64.18 - - - -JPM Global Select Equity D (acc) - USD 128.72 148.49 136.04 97.41 176.63JPM Global Select Equity X (acc) - USD 134.30 151.05 134.94 94.24 166.62
JPMorgan Investment Funds - Global Total Return FundJPM Global Total Return A (acc) - EUR 108.11 112.68 105.88 90.33 109.75JPM Global Total Return A (dist) - EUR 87.47 91.92 87.12 77.29 93.90JPM Global Total Return A (inc) - EUR 88.55 93.09 88.23 76.51 93.92JPM Global Total Return B (acc) - EUR* - - - 88.19 106.45JPM Global Total Return C (acc) - EUR 112.40 116.16 108.29 91.61 110.37JPM Global Total Return D (acc) - EUR 100.35 105.64 100.27 86.40 106.04JPM Global Total Return I (acc) - EUR* - - - - -
JPMorgan Investment Funds - Highbridge Statistical Market Neutral FundJPM Highbridge Statistical Market Neutral A (acc) - EUR 105.12 107.21 110.40 113.66 100.82JPM Highbridge Statistical Market Neutral A (acc) - SEK (hedged) 914.38 920.48 946.19 980.43 -JPM Highbridge Statistical Market Neutral A (acc) - USD 136.37 143.53 158.52 158.71 148.02JPM Highbridge Statistical Market Neutral A (acc) - USD (hedged) 149.57 153.05 157.32 162.87 -JPM Highbridge Statistical Market Neutral A (dist) - GBP 81.98 86.07 91.52 104.61 72.56JPM Highbridge Statistical Market Neutral A (dist) - GBP (hedged) 76.12 77.65 79.83 83.10 -JPM Highbridge Statistical Market Neutral A (inc) - EUR 97.41 99.34 102.29 107.62 96.63JPM Highbridge Statistical Market Neutral B (acc) - EUR 106.16 107.46 109.83 112.24 98.91JPM Highbridge Statistical Market Neutral B (acc) - USD* - - 146.80 145.87 -JPM Highbridge Statistical Market Neutral B (dist) - GBP (hedged) 85.25 - - - -JPM Highbridge Statistical Market Neutral C (acc) - EUR 107.70 108.85 111.08 113.35 100.00JPM Highbridge Statistical Market Neutral C (dist) - GBP (hedged) 77.83 78.69 80.38 83.21 -JPM Highbridge Statistical Market Neutral C (dist) - USD (hedged) 127.11 128.90 131.76 - -JPM Highbridge Statistical Market Neutral D (acc) - EUR 101.44 104.24 108.15 112.18 99.90JPM Highbridge Statistical Market Neutral D (acc) - USD 131.64 139.57 155.32 156.68 146.73JPM Highbridge Statistical Market Neutral D (acc) - USD (hedged) 136.04 140.25 145.25 151.48 -JPM Highbridge Statistical Market Neutral I (acc) - EUR* - 110.63 112.81 114.98 101.41JPM Highbridge Statistical Market Neutral I (dist) - EUR 96.20 97.19 - - -JPM Highbridge Statistical Market Neutral T (acc) - EUR 96.79 - - - -JPM Highbridge Statistical Market Neutral X (acc) - EUR 114.40 114.64 115.98 117.30 102.52JPM Highbridge Statistical Market Neutral X (acc) - USD (hedged)* - - 139.42 - -
25

JPMorgan Investment Funds
Statistical Information (continued)
Net Asset Value per Share in Share Class Currency
31 December 2011 31 December 2010 31 December 2009 31 December 2008 31 December 2007
JPMorgan Investment Funds - Income Opportunity FundJPM Income Opportunity A (acc) - USD 165.58 166.12 158.85 136.98 -JPM Income Opportunity A (acc) - CHF (hedged) 90.71 - - - -JPM Income Opportunity A (acc) - EUR (hedged) 124.74 125.11 119.80 102.86 101.77JPM Income Opportunity A (acc) - SEK (hedged) 1,229.13 1,220.31 1,168.16 - -JPM Income Opportunity A (inc) - EUR (hedged) 117.69 120.51 - - -JPM Income Opportunity A (dist) - GBP (hedged) 88.28 90.40 86.94 76.02 -JPM Income Opportunity B (acc) - USD 158.82 158.65 151.24 - -JPM Income Opportunity B (acc) - EUR (hedged) 113.99 113.80 108.61 - -JPM Income Opportunity B (dist) - GBP (hedged) 61.18 - - - -JPM Income Opportunity C (acc) - USD 160.03 159.71 152.10 - -JPM Income Opportunity C (acc) - USD (hedged to BRL)* - 113.01 - - -JPM Income Opportunity C (acc) - EUR (hedged) 124.21 123.90 118.22 101.08 -JPM Income Opportunity C (acc) - SEK (hedged) 759.52 747.97 - - -JPM Income Opportunity C (dist) - GBP (hedged) 103.76 106.17 101.84 - -JPM Income Opportunity D (acc) - EUR (hedged) 123.71 124.42 119.44 102.60 101.66JPM Income Opportunity D (inc) - EUR (hedged) 72.64 73.44 - - -JPM Income Opportunity X (acc) - USD 161.02 160.05 151.70 - -JPM Income Opportunity X (acc) - EUR (hedged) 107.61 106.81 101.28 - -JPM Income Opportunity X (acc) - GBP (hedged) 97.57 96.50 91.34 - -JPM Income Opportunity X (dist) - GBP (hedged) 60.62 - - - -
JPMorgan Investment Funds - Japan 50 Equity FundJPM Japan 50 Equity A (acc) - JPY 6,805 8,714 8,405 7,366 13,055JPM Japan 50 Equity A (acc) - EUR 43.61 51.41 40.79 37.06 50.38JPM Japan 50 Equity A (acc) - EUR (hedged) 72.34 - - - -JPM Japan 50 Equity A (dist) - JPY 3,892 5,797 5,739 5,030 8,914JPM Japan 50 Equity C (acc) - JPY 9,346 11,856 11,327 - -JPM Japan 50 Equity C (acc) - EUR (hedged) 72.82 - - - -JPM Japan 50 Equity D (acc) - EUR (hedged) 97.06 - - - -JPM Japan 50 Equity D (acc) - JPY 4,819 6,234 6,074 5,377 9,625JPM Japan 50 Equity I (acc) - JPY* - - - 5,302 9,300JPM Japan 50 Equity X (acc) - JPY 7,791 9,799 9,284 7,992 13,914
JPMorgan Investment Funds - Japan Behavioural Finance Equity FundJPM Japan Behavioural Finance Equity A (acc) - USD 66.05 74.07 62.77 61.76 91.05JPM Japan Behavioural Finance Equity A (acc) - EUR 50.90 55.32 43.91 43.67 61.97JPM Japan Behavioural Finance Equity A (dist) - USD 61.69 69.21 58.68 58.30 85.99JPM Japan Behavioural Finance Equity C (acc) - USD* - - - 60.46 88.27JPM Japan Behavioural Finance Equity D (acc) - USD* - - - - 90.54JPM Japan Behavioural Finance Equity D (acc) - EUR 49.31 53.99 43.19 43.28 61.63JPM Japan Behavioural Finance Equity I (inc) - EUR* - - - - 61.21JPM Japan Behavioural Finance Equity X (acc) - USD* - 77.46 64.49 62.35 90.31
JPMorgan Investment Funds - Japan Focus FundJPM Japan Focus A (acc) - JPY 5,988 7,344 6,752 5,995 -JPM Japan Focus A (dist) - JPY 9,385 11,633 10,838 - -JPM Japan Focus B (acc) - JPY 8,625 - - - -JPM Japan Focus C (acc) - JPY 7,873 - - - -JPM Japan Focus D (acc) - JPY 5,777 7,166 6,646 5,959 -JPM Japan Focus I (acc) - JPY 5,562 6,753 6,136 5,394 -JPM Japan Focus X (acc) - JPY 9,015 10,871 9,871 6,031 -
JPMorgan Investment Funds - Japan Select Equity FundJPM Japan Select Equity A (acc) - JPY 5,364 6,814 6,795 6,155 11,006JPM Japan Select Equity A (dist) - JPY 4,090 5,427 5,462 4,948 8,847JPM Japan Select Equity B (acc) - JPY 5,401 6,818 6,748 6,068 10,767JPM Japan Select Equity C (acc) - JPY 6,233 7,844 7,748 6,952 12,311JPM Japan Select Equity D (acc) - JPY 6,515 8,339 8,379 7,648 13,778JPM Japan Select Equity I (acc) - JPY 4,875 6,127 6,046 5,421 9,592JPM Japan Select Equity X (acc) - JPY 7,688 9,590 9,392 8,357 14,678
JPMorgan Investment Funds - Japan Strategic Value FundJPM Japan Strategic Value A (acc) - JPY 5,721 6,635 6,329 5,791 9,533JPM Japan Strategic Value A (acc) - EUR 57.10 60.97 47.84 45.38 57.30JPM Japan Strategic Value A (dist) - GBP 46.94 51.84 42.56 44.28 42.26JPM Japan Strategic Value C (acc) - JPY 10,122 11,628 10,988 - -JPM Japan Strategic Value D (acc) - JPY 5,548 6,483 6,231 5,745 9,527JPM Japan Strategic Value D (acc) - EUR 55.38 59.58 47.10 45.01 57.26JPM Japan Strategic Value X (acc) - JPY 10,113 11,526 10,804 - -
JPMorgan Investment Funds - JF Asia ex-Japan FundJF Asia ex-Japan A (acc) - USD 247.77 328.49 273.18 161.69 367.34JF Asia ex-Japan A (dist) - USD 102.34 135.69 112.84 71.49 164.02JF Asia ex-Japan B (acc) - USD 276.36 363.66 300.18 176.36 397.64JF Asia ex-Japan C (acc) - USD 261.58 343.70 283.28 166.17 374.09JF Asia ex-Japan C (dist) - USD 75.67 - - - -JF Asia ex-Japan D (acc) - USD 207.48 277.14 232.21 138.48 316.97JF Asia ex-Japan I (acc) - USD 137.14 179.92 148.10 86.80 195.26JF Asia ex-Japan X (acc) - USD 427.94 557.31 455.34 264.94 591.60JF Asia ex-Japan X (dist) - USD 79.03 - - - -
26

JPMorgan Investment Funds
Statistical Information (continued)
Net Asset Value per Share in Share Class Currency
31 December 2011 31 December 2010 31 December 2009 31 December 2008 31 December 2007
JPMorgan Investment Funds - US Bond FundJPM US Bond A (acc) - USD 183.04 169.49 153.60 126.67 157.91JPM US Bond A (inc) - USD 110.23 102.07 92.51 76.29 97.87JPM US Bond B (acc) - USD 190.72 175.99 158.95 130.63 162.26JPM US Bond C (acc) - USD 184.24 169.76 153.07 125.62 155.78JPM US Bond D (acc) - USD 133.21 123.66 112.35 92.89 116.08JPM US Bond X (acc) - USD* - - - - 159.82
JPMorgan Investment Funds - US Equity FundJPM US Equity A (acc) - USD 89.31 88.95 80.70 63.00 102.55JPM US Equity A (acc) - EUR (hedged) 65.04 64.81 59.39 46.99 77.04JPM US Equity A (dist) - GBP 78.35 77.89 68.14 - -JPM US Equity C (acc) - USD 92.49 91.15 81.85 63.22 101.82JPM US Equity D (acc) - USD 87.11 87.19 79.50 62.37 102.03JPM US Equity D (acc) - EUR (hedged) 63.42 63.51 58.49 46.51 76.66JPM US Equity X (acc) - USD 89.85 87.94 78.41 60.14 96.18
JPMorgan Investment Funds - US Select Equity FundJPM US Select Equity A (acc) - USD 156.46 161.31 145.55 109.20 174.40JPM US Select Equity A (acc) - EUR 75.21 75.15 63.21 48.76 -JPM US Select Equity A (acc) - EUR (hedged) 72.40 74.48 67.83 51.70 83.17JPM US Select Equity A (dist) - USD 109.73 113.13 102.07 76.59 122.31JPM US Select Equity B (acc) - USD 147.14 150.57 134.84 100.42 159.16JPM US Select Equity C (acc) - USD 145.48 148.43 132.53 98.40 155.50JPM US Select Equity C (acc) - EUR 83.76 - - - -JPM US Select Equity C (acc) - EUR (hedged) 72.27 73.56 66.29 50.00 -JPM US Select Equity C (dist) - GBP 67.73 - - - -JPM US Select Equity D (acc) - USD 110.47 114.46 103.79 78.27 125.63JPM US Select Equity D (acc) - EUR (hedged) 70.69 73.07 66.88 51.24 82.84JPM US Select Equity I (acc) - USD 96.38 98.17 87.54 64.95 102.57JPM US Select Equity X (acc) - USD 143.67 145.43 128.85 94.98 149.05
* Share Class inactive as at end of the year.** Share Class reactivated during the year.
The accompanying notes form an integral part of these Financial Statements.
27

JPMorgan Investment Funds
Notes to the Financial Statements
As at 31 December 2011
1. Organisation
JPMorgan Investment Funds (the “SICAV”) is a variable capital investment company with multiple Sub-Funds organised as a société anonyme under the lawsof the Grand Duchy of Luxembourg. The SICAV was incorporated in Luxembourg on 22 December 1994 for an unlimited period as J.P. Morgan InvestmentFunds. Its name was changed into JPMorgan Fleming Investment Funds on 19 November 2001 and into JPMorgan Investment Funds on 12 September 2005.
The SICAV has been authorised under Part I of the law of 20 December 2002 concerning Undertakings for Collective Investment in transferable securitiesuntil 30 June 2011 and under Part I of the law of 17 December 2010 concerning Undertakings for Collective Investment since 1 July 2011. The SICAV isregistered with the Registre de Commerce et des Sociétés of Luxembourg under number B 49 663.
The SICAV is designed as an Equity, Total Return, Balanced, Convertibles, Bond and Money Market Funds and has issued shares in 34 Sub-Funds, details ofwhich are shown in the Appendix.
2. Significant Accounting Policies
The Financial Statements are prepared in accordance with Luxembourg regulations relating to Undertakings for Collective Investment.
a) Investment Valuation
Transferable securities which are admitted to an official exchange listing or dealt in on another regulated market are valued on the basis of the latestavailable price prevailing at the time of calculating the net asset value.
If securities are listed or dealt in on several exchanges or markets, the latest available price, or if appropriate, the average price on the principal exchange ormarket will be applied.
Transferable securities not admitted to an official exchange listing nor dealt in on another regulated market are valued at the latest available price. Thosesecurities for which no price is available or for which the latest available price is not representative are valued on the basis of their reasonably foreseeablesales price determined with prudence and in good faith by the Board of Directors.
Shares or Units in UCITS or other UCIS are valued at the latest available price or net asset value, as reported or provided by such undertakings or their agents.
Liquid assets and money market instruments may be valued at nominal values plus any accrued interest or on an amortised cost basis.
For the JPMorgan Investment Funds - Euro Liquid Market Fund:
• Except as noted below, all investments are valued at amortised cost, which approximates market value. Under this method, the cost of investments isadjusted to income for the amortisation of premiums and discounts over the life of the investments.
• Where the amortised cost basis does not reflect a prudent approach to the valuation of the security, the latest available price prevailing on the valuationday is used.
The financial statements are presented on the basis of the net asset values of the Sub-Funds calculated on 31 December 2011, except for JPMorganInvestment Funds – Blue and Green Fund calculated on 27 December 2011 (due to a weekly Net Asset Value calculation frequency). In accordance with theprospectus, the net asset values were calculated using the latest exchange rates known at the time of calculation.
b) Swing Pricing
A Sub-Fund may suffer dilution of the Net Asset Value per Share due to investors buying or selling Shares in a Sub-Fund at a price that does not reflect thedealing and other costs that arise when security trades are undertaken by the Investment Manager to accommodate cash inflows or outflows.
In order to counter this impact, a Swing Pricing mechanism may be adopted to protect the interests of Shareholders of the Fund. If on any Valuation Day, theaggregate net transactions in Shares of a Sub-Fund exceed a pre-determined threshold, as determined and reviewed for each Sub-Fund on a periodic basisby the Management Company, the Net Asset Value per Share may be adjusted upwards or downwards to reflect net inflows and net outflows respectively.The net inflows and net outflows will be determined by the Management Company based on the latest available information at the time of calculation of theNet Asset Value per Share. The Swing Pricing mechanism may be applied across all Sub-Funds with the exception of JPMorgan Investment Funds – Blue andGreen Fund, JPMorgan Investment Funds – Highbridge Statistical Market Neutral Fund and the money market Sub-Funds, as defined by the Prospectus. Theextent of the price adjustment will be set by the Management Company to reflect dealing and other costs. Such adjustment may vary from Sub-Fund toSub-Fund and will not exceed 2% of the original Net Asset Value per Share. The official Net Asset Value per Share as at year-end, disclosed in the StatisticalInformation section of this report may therefore include a Swing Pricing adjustment, which would not be recognised in the Combined Statement of NetAssets and in the Combined Statement of Operations and Changes in Net Assets.
As at year-end, a Swing Pricing adjustment had been applied to JPMorgan Investment Funds - Emerging Markets Corporate Bond Portfolio Fund I, toJPMorgan Investment Funds - Global Capital Preservation Fund (EUR) and to JPMorgan Investment Funds - Global Balanced Fund (USD).
From 30 July 2010 onwards, the net asset values of JPMorgan Investment Funds - Emerging Markets Corporate Bond Portfolio Fund I had been adjusteddownwards by a swing factor determined by the Management Company under its established procedures, irrespective of redemption flows. The decision toswing downwards is due to the specific nature of the product and the fact that after the initial subscription phase, no further subscriptions will be acceptedinto the Fund.
No other Sub-Funds were swung as at 31 December 2011.
c) Realised and Unrealised Gains and Losses on Investments
Investment transactions are accounted for on the trade date (the date the order to buy or sell is executed). For trades into other collective investmentschemes, transactions are accounted for on receipt of the trade confirmation from the underlying transfer agents.
Realised gains and losses on sales of investments are calculated on the average book cost. The associated foreign exchange movement between the date ofpurchase and date of sale of investments is included in realised gains and losses on investments. Unrealised gains and losses on holdings of investments arecalculated on the total book cost and include the associated unrealised gains and losses on foreign exchange.
d) Income Recognition
Interest income is accrued daily and includes the amortisation of premiums and accretion of discounts, where applicable. Bank interest income is recognisedon an accrual basis. Dividend income is accrued on the ex-dividend date. This income is shown net of any withholding taxes and adjusted accordingly whentax reclaims apply.
28

JPMorgan Investment Funds
Notes to the Financial Statements (continued)
As at 31 December 2011
e) Conversion of Foreign Currencies
The books and records of each Sub-Fund are denominated in the base currency of the corresponding Sub-Fund. Amounts denominated in other currenciesare translated into the base currency on the following basis: (i) investment valuations and other assets and liabilities initially expressed in other currenciesare converted each business day into the base currency using currency exchange rates prevailing on each such business day; (ii) purchases and sales offoreign investments, income and expenses are converted into the base currency using currency exchange rates prevailing on the respective dates of suchtransactions.
Net realised and unrealised gains or losses on foreign exchange represent: (i) foreign exchange gains and losses from the sale and holding of foreigncurrencies and foreign cash equivalents; (ii) gains and losses between trade date and settlement date on securities transactions; and (iii) gains and lossesarising from the difference between amounts of dividends and interest recorded and the amounts actually received.
The resulting gains and losses on translation are included in “Net Realised Gain/Loss on Foreign Exchange” in the Combined Statement of Operations andChanges in Net Assets.
The reference currency of the SICAV as reflected in the combined statements is USD.
The principal exchange rates applied as at 31 December 2011 are as follows:
1 USD = 0.77038637 EUR1 USD = 77.17500000 JPY1 USD = 0.64341783 GBP
f) Forward Foreign Exchange Contracts
Unrealised gains or losses on outstanding forward foreign exchange contracts are valued on the basis of currency exchange rates prevailing at the relevantvaluation date. The changes in such amounts are included in the Combined Statement of Operations and Changes in Net Assets under “Net Change inUnrealised Gain/(Loss) on Forward Foreign Exchange Contracts”. When a contract is closed, the Realised Gain/(Loss) is recorded under “Net RealisedGain/(Loss) on Forward Foreign Exchange Contracts” in the Combined Statement of Operations and Changes in Net Assets. Unrealised Gains or Losses arerecorded under “Unrealised Gain/(Loss) on Forward Foreign Exchanges Contracts” in the Combined Statement of Net Assets.
g) Financial Futures Contracts on Securities and Indices
Regulated financial futures contracts are valued at the exchange quoted settlement price. Initial margin deposits are made upon entering into the contractsand can be either in cash or securities. During the period the contracts are open, changes in the value of the contracts are recognised as unrealised gains andlosses by “marking-to-market” on a daily basis to reflect the market value of the contracts at the end of each business day’s trading. Variation marginpayments are made or received on a daily basis, depending upon whether losses or gains are incurred. When a contract is closed, the SICAV records arealised gain or loss equal to the difference between the proceeds from, or cost of, the closing transaction and the initial cost of the contract in “Net RealisedGain/(Loss) on Financial Futures Contracts” in the Combined Statement of Operations and Changes in Net Assets.
Unrealised gains or losses are recorded under “Unrealised Net Gain/(Loss) on Financial Futures Contracts” in the Combined Statement of Net Assets.
Daily margin calls are recorded under “Net Realised Gain/(Loss) on Financial Futures Contracts” in the Combined Statement of Operations and Changes inNet Assets.
h) Option Contracts
Options purchased are recorded as investments; options written or sold are recorded as liabilities. When the exercise of an option results in a cashsettlement, the difference between the premium and the settlement proceeds is accounted for as a realised gain or loss. When securities are acquired ordelivered upon exercise of an option, the acquisition cost or sale proceeds are adjusted by the amount of the premium. When an option is closed, thedifference between the premium and the cost to close the position is accounted for as a realised gain or loss. When an option expires, the premium isaccounted for as a realised gain for options written or as a realised loss for options purchased.
The SICAV writes options on securities and futures. These options are settled in cash and subject the SICAV to unlimited risk of loss. The SICAV, however, isnot subject to credit risk on written options as the counterparty has already performed its obligation by paying the premium at the inception of the contract.As of 31 December 2011, the SICAV had written options contracts outstanding as listed on its Schedule of Investments.
For options on futures, where the investment manager is based in the United Kingdom, variation margin payments are made or received daily, dependingupon whether losses or gains are incurred on the underlying futures contract.
The market values are recorded under “Derivatives Instruments at Market Value” in the Combined Statement of Net Assets.
i) To Be Announced Securities (“TBAs”)
TBAs are related to mortgage backed securities issued by government sponsored agencies. These agencies usually pool mortgage loans and sell interests inthe pools created. TBAs relate to future pools of these agencies that are bought and sold for future settlement for which either the interest rate or thematurity date is not yet fixed. TBAs are separately disclosed in the Schedule of Investments.
Certain Sub-Funds may enter into Dollar Rolls, principally using To Be Announced (“TBA”) Securities, in which the Sub-Funds sell mortgage-backed securitiesfor delivery in the current month and simultaneously contract to repurchase similar, but not identical, securities at an agreed-upon price on a fixed date. TheSub-Funds account for such Dollar Rolls as purchases and sales and receive compensation as consideration for entering into the commitment to repurchase.The Sub-Funds must maintain liquid securities having a value not less than the repurchase price (including accrued interest) for such Dollar Rolls. The marketvalue of the securities that the Sub-Funds are required to purchase may decline below the agreed upon repurchase price of those securities.
Certain Sub-Funds had TBAs outstanding as of 31 December 2011, which are included in Amounts Receivable on Sale of TBAs and Amounts Payable onPurchase of TBAs in the Combined Statement of Net Assets.
j) Interest Rate Swaps
An interest rate swap is a bilateral agreement in which each of the parties agree to exchange a series of interest payments for another series of interestpayments (usually fixed/floating) based on a notional amount that serves as a computation basis and that is usually not exchanged.
The market values are recorded under “Derivatives Instruments at Market Value” in the Combined Statement of Net Assets. The changes in such amounts arerecorded under “Net Change in Unrealised Gain/(Loss) on Derivatives Instruments” and the Realised under “Net Realised Gain/(Loss) on DerivativesInstruments” in the Combined Statement of Operations and Changes in Net Assets.
29
JPMorgan Investment Funds
Notes to the Financial Statements (continued)
As at 31 December 2011
k) Inflation Rate Swaps
An inflation rate swap is a bilateral agreement in which each of the parties agree to exchange a series of interest payments for another series of interestpayments (usually fixed/floating on inflation indexes) based on a notional amount that serves as a computation basis and that is usually not exchanged.
The market values are recorded under “Derivatives Instruments at Market Value” in the Combined Statement of Net Assets. The changes in such amounts arerecorded under “Net Change in Unrealised Gain/(Loss) on Derivatives Instruments” and the Realised under “Net Realised Gain/(Loss) on DerivativesInstruments” in the Combined Statement of Operations and Changes in Net Assets.
l) Total Return Swaps
The SICAV may enter into swap contracts in which the SICAV and the counterparty agree to exchange payments where one or both parties pay the returnsgenerated by a security, instrument, basket or index thereof. The payments made by the SICAV to the counterparty and vice versa are calculated byreference to a specific security, index, or instruments and an agreed upon notional amount. Any such underlying security or instrument must be atransferable security and any such index must be an index of a regulated market.
A Total Return Swap on a basket of equities will exchange the total performance on the specific basket of equities, selected by the Investment Manageragainst a reference rate plus a spread. The total performance includes interest, dividends, gains and losses on the underlying securities during the contractperiod according to the type of underlying. The risk of this type of instrument will depend on the uncertain evolution, at the time of the contract conclusion, ofthe performance of the underlying. These underlying securities are listed on a primary exchange.
The value of the underlying securities shall be taken into account for the calculation of the investment restrictions applicable to individual issuers. Therelevant indices include, but are not limited to, currencies, interest rates, prices and total return on interest rates indices, fixed income indices and stockindices.
The market values are recorded under “Derivatives Instruments at Market Value” in the Combined Statement of Net Assets. The changes in such amounts areincluded in the Combined Statement of Operations and Changes in Net Assets under “Net Change in Unrealised Gain/(Loss) on Derivatives Instruments”.When a contract is closed, the Realised Gain/(Loss) is recorded under “Net Realised Gain/(Loss) on Derivatives Instruments” in the Combined Statement ofOperations and Changes in Net Assets.
m) Credit Default Swaps
A Credit Default Swap is a credit derivative transaction in which two parties enter into an agreement, whereby one party pays the other a periodic paymentfor the specified life of the agreement. The other party makes no payments unless a credit event, relating to a predetermined reference asset, occurs. If suchan event occurs, the party will then make a payment to the first party, and the swap will terminate. The value of the underlying securities shall be taken intoaccount for the calculation of the investment restrictions applicable to individual issuers.
The market values are recorded under “Derivatives Instruments at Market Value” in the Combined Statement of Net Assets. The changes in such amounts arerecorded under “Net Change in Unrealised Gain/(Loss) on Derivatives Instruments” and the Realised under “Net Realised Gain/(Loss) on DerivativesInstruments” in the Combined Statement of Operations and Changes in Net Assets.
n) Variance Swap
A variance swap is a financial derivative instrument in which two parties exchange their cash flows based on the measured variance of particular underlyingasset during a specified time period. Variance swaps are mostly used to hedge volatility exposure of other positions, to speculate on future volatility or totrade the spread between implied and realised volatility. Terms of the contract (e.g. strike price, number of units in the transaction) are agreed between bothparties on trade date.
The market values are recorded under “Derivatives Instruments at Market Value” in the Combined Statement of Net Assets. The changes in such amounts arerecorded under “Net Change in Unrealised Gain/(Loss) on Derivatives Instruments” and the Realised under “Net Realised Gain/(Loss) on DerivativesInstruments” in the Combined Statement of Operations and Changes in Net Assets.
3. Fees and Expenses
a) All Sub-Funds - Share Classes A, B, C, D and T
The fees and expenses charged to these Classes of shares are set at a fixed percentage of the total net assets of each Class of shares. This fixed percentagecovers all fees and expenses connected with the management of these Classes of shares, including Investment Management Fees, shareholder servicingfees and Other Operating and Administrative Expenses, which include but are not limited to Custody, Registrar and Transfer Agent Fees; it does not covertaxes paid on investment, brokerage expenses, extraordinary costs or performance fees, if any. No other costs are charged to these Classes of shares, andthe Management Company absorbs any difference that may arise between the actual costs of the operations of these Classes of shares and the fixedpercentage. To the extent that the actual operating costs are less than the fixed percentage, the excess is paid to the Management Company and includedwithin “Investment Management Fees”. To the extent that actual operating costs exceed the fixed percentage, the amount borne by the ManagementCompany will be separately disclosed as a “Fee Waiver’’ in the Combined Statement of Net Assets and the Combined Statement of Operations and Changes inNet Assets.
This fixedannual rateof feesandexpenses iscategorisedasaTotalExpenseRatio.The fixedannual ratesof fees foreachClassofsharesareshownin theAppendix.
b) All Sub-Funds - Share Class I
The maximum total fees and expenses to be borne by Class I shareholders of any Sub-Fund will not exceed a capped percentage of the total net assetsattributable to that Class. These capped fees and expenses comprise Investment Management Fees plus other Operating and Administrative Expenses,limited to Custody, Fiduciary, Accounting, Transfer Agency Fees, Taxes and Sundry Expenses; it does not cover performance fees, if any.
This capped annual rate of fees and expenses is categorised as a Capped Expense Ratio. The capped annual rates of fees for each Class of shares are shown inthe Appendix.
c) All Sub-Funds - Share Class X
The Class X shares of each Sub-Fund are charged a pro-rata share of the Custody and Accounting Fees allocable to that Sub-Fund.
The Management Company pays all other Operating and Administrative Expenses allocable to such Class to the exclusion of performance fees, if any. Themaximum Operating and Administrative Expenses to be borne by the Class X shareholders of any Sub-Fund will not exceed a capped percentage of the totalnet assets attributable to that Class, as set out in the Appendix.
The Annual Management Fee that would normally be payable in respect of the X Share Class are administratively levied and collected by the GlobalDistributor directly from the shareholder or through the relevant J.P.Morgan Chase & Co entity.
30

JPMorgan Investment Funds
Notes to the Financial Statements (continued)
As at 31 December 2011
Sub-Funds may invest in UCITS and other UCIs managed by the Management Company, the Investment Manager or any other member of JPMorgan Chase &Co. The avoidance of a double-charge of the Annual Management and Advisory Fee on such assets is achieved by either a) excluding the assets from the netassets on which the Annual Management and Advisory Fee is calculated; or b) investing in UCITS or UCIs via classes that do not accrue an AnnualManagement and Advisory Fee or other equivalent fees payable to the relevant Investment Manager’s group; or c) the Annual Management and AdvisoryFee being netted off by a rebate to the SICAV or Sub-Fund of the Annual Management and Advisory Fee (or equivalent) charged to the underlying UCITS orUCIs; or d) charging only the difference between the Annual Management and Advisory Fee of the SICAV or Sub-Fund and the Annual Management andAdvisory Fee (or equivalent) charged to the underlying UCITS or UCIs.
The Management Company may decide from time to time, in order to protect the interests of the SICAV’s shareholders, to reduce the fees payable to theManagement Company.
d) Performance Fees
Pursuant to the Investment Management Agreement, as set out in the Appendix to the Prospectus, the Investment Manager is entitled to receive from thenet assets of certain Sub-Funds or Classes, an annual performance-based incentive fee (the “Performance Fee”) if the performance of the Sub-Fund exceedsthe return from the benchmark, subject to the operation of a Claw-Back Mechanism or of a High Water Mark as defined in Appendix V and as specified inAppendix III for each Sub-Fund. On each Valuation Day, an accrual for the previous Valuation Day’s Performance Fee is made, when appropriate, and thefinal Performance Fee is payable annually. Pursuant to the provisions of the relevant Investment Management Agreement, the Investment Manager may beentitled to receive the performance Fee from the Management Company.
On each Valuation Day, the net asset value of each Class of each Sub-Fund for which a Performance Fee applies, which includes an accrual for all fees andexpenses (including the Annual Management and Advisory Fee, and the Operating and Administrative Expenses to be borne by the relevant Class at the rateset out in the Appendix to the Prospectus), is adjusted for any dividend distributions and for subscriptions and redemptions dealt with on that Valuation Day,if any, and any Performance Fee accrued through that day in respect of such Class is added back (the “Adjusted net asset value”). For purposes of calculatingthe Performance Fee, the “Share Class Return” is computed on each Valuation Day, as the difference between the net asset value (adjusted by adding backany accrued Performance Fee) on such day and the Adjusted net asset value on the previous Valuation Day, expressed as a return based on the previousValuation Day’s Adjusted net asset value for that Class.
High Water Mark Method
If the Share Class Return exceeds the Benchmark Return and the cumulative Share Class Return exceeds the High Water Mark Return (as set out in theAppendix to the Prospectus), the Performance Fee accrual is increased by the Performance Fee Rate multiplied by the Excess Return multiplied by theprevious Valuation Day’s Adjusted net asset value for that Class. If the Share Class Return does not exceed the Benchmark Return, the Performance Feeaccrual is reduced (but not below zero) by the Performance Fee Rate multiplied by the negative Excess Return multiplied by the previous Valuation Day’sAdjusted net asset value for that Class. Following a period of negative Excess Return whereby the Performance Fee accrual has been reduced to zero, no newPerformance Fee is accrued until such time as the cumulative Share Class Return exceeds the greater of the High Water Mark Return and the cumulativeBenchmark Return since the beginning of the SICAV accounting year. The Performance Fee accrued on any Valuation Day is reflected in the Net Asset Valueper Share on the basis of which subscriptions and redemptions may be accepted.
Claw-Back mechanism
The purpose of the Claw-Back Mechanism is to ensure that the Management Company will only become entitled to a Performance Fee when it outperformsthe cumulative Benchmark Return (as defined in Appendix V of the prospectus) accrued since the last Valuation Day of the last year in which a PerformanceFee was paid.
As at 31 December 2011, the Performance Fee rate and the benchmarks are as follows:
Sub-Fund or Share Class PerformanceFee Rate
Benchmark
Claw-Back Mechanism method
JPMorgan Investment Funds - Global Select 130/30 Fund 10% Morgan Stanley Capital International (MSCI) World Index (Total Return Net)
JPMorgan Investment Funds – Japan Focus Fund 10% Tokyo Stock Price Index (TOPIX) (Total Return Net)
High Water Mark Return methodJPMorgan Investment Funds - Global Total Return Fund 10% LIBOR one-month Euro deposits (Total Return Gross)
JPMorgan Investment Funds - Global Capital Appreciation Fund 10% British Bankers’ Association (BBA) LIBOR one-month Euro deposits
JPMorgan Investment Funds - Global Capital Preservation Fund (EUR) 10% British Bankers’ Association (BBA) LIBOR one-month Euro deposits
JPMorgan Investment Funds - Global Capital Preservation Fund (EUR) (SEK hedged) 10% British Bankers’ Association (BBA) LIBOR one-month Euro deposits hedged into SEK
JPMorgan Investment Funds - Global Capital Preservation Fund (USD) 10% British Bankers’ Association (BBA) LIBOR one-month US Dollar deposits
JPMorgan Investment Funds - Highbridge Statistical Market Neutral Fund 20% European Overnight Index Average (EONIA) (Total Return Gross)
JPMorgan Investment Funds - Highbridge Statistical Market Neutral Fund (GBP hedged) 20% British Bankers’ Association (BBA) LIBOR GBP Overnight Index (Total Return Gross)
JPMorgan Investment Funds - Highbridge Statistical Market Neutral Fund (SEK hedged) 20% British Bankers’ Association (BBA) LIBOR SEK Spot Next Index (Total Return Gross)
JPMorgan Investment Funds - Highbridge Statistical Market Neutral Fund (USD hedged) 20% British Bankers’ Association (BBA) LIBOR USD Overnight Index (Total Return Gross)
JPMorgan Investment Funds - Income Opportunity Fund 20% British Bankers’ Association (BBA) LIBOR USD Overnight Index
JPMorgan Investment Funds - Income Opportunity Fund (SEK hedged) 20% British Bankers’ Association (BBA) LIBOR SEK Spot Next Index
JPMorgan Investment Funds - Income Opportunity Fund (GBP hedged) 20% British Bankers’ Association (BBA) LIBOR GBP Overnight Index
JPMorgan Investment Funds - Income Opportunity Fund (EUR hedged) 20% European Overnight Index Average (EONIA)
JPMorgan Investment Funds - Income Opportunity Fund (USD hedged to BRL) 20% British Bankers’ Association (BBA) LIBOR USD Overnight Index hedged to BRL
31

JPMorgan Investment Funds
Notes to the Financial Statements (continued)
As at 31 December 2011
4. Dividend Policy
Share Classes with the suffix “(acc)” are accumulation Share Classes and will not normally pay dividends.
Distribution Share Classes will normally pay dividends as described below.
Share Classes suffixed “(dist)” and suffixed “(inc)”
It is intended that all those Share Classes with the suffix “(dist)” will meet the conditions to qualify as “reporting Fund” for the purposes of the UnitedKingdom tax legislation relating to offshore funds and will, if appropriate, pay dividends which at least meet the greater of the reportable income under thatlegislation or the taxable earnings from investments in accordance with the German Investment Tax Act. It is intended that those Share Classes with the suffix“(inc)” will, if appropriate, pay dividends equal to or in excess of the taxable earnings from investments in accordance with the German Investment Tax Act.Payment of dividends on these Share Classes will normally be made in March of each year.
Share Classes suffixed “(div)”
Share Classes with the suffix “(div)” will normally pay quarterly dividends which are calculated by the Management Company based on the estimated annualyield of the relevant Sub-Fund’s portfolio which is attributable to that Share Class. The Management Company will review the dividend rate for each ShareClass at least semi-annually, but may adjust the dividend rate more frequently to reflect changes in the portfolio’s expected yield.
Investors should be aware that “(div)” Share Classes give priority to dividends, rather than to capital growth. The expected yield for each Share Class will becalculated gross of both the Annual Management and Advisory Fee and the Operating and Administrative Expenses, and such Share Classes will typicallydistribute more than the income received. Share Classes with the suffix “(div)” in issue at the dividend record date will be eligible for any dividends which willnormally be paid in the currency of the relevant Share Class.
Share Classes suffixed “(mth)”
Share Classes with the suffix “(mth)” will be available to Shareholders subscribing, and remaining subscribed, through specific Asian distribution networksand to other distributors at the sole discretion of the Management Company. Share Classes with the suffix “(mth)” will normally pay dividends on a monthlybasis. The monthly dividend rate per Share will be calculated by the Management Company based on the estimated annual yield of the relevant Sub-Fund’sportfolio which is attributable to that Share Class. The Management Company will review the dividend rate for each Share Class at least semi-annually, butmay adjust the dividend rate more frequently to reflect changes in the portfolio’s expected yield. Investors should be aware that “(mth)” share classes givepriority to dividends, rather than to capital growth. The expected yield for each Share Class will be calculated gross of both the Annual Management andAdvisory Fee and the Operating and Administrative Expenses, and such Share Classes will typically distribute more than the income received. Dividendpayments for these Share Classes will normally be made to Shareholders each month in the currency of the relevant Share Class. The Management Companyreserves the right to fix a minimum amount per Share Class, below which the actual payment of the dividend would not be economically efficient for theFund. These payments will be deferred to the following month or reinvested in further Shares of the same Share Class and not paid directly to theShareholders. The Net Asset Value of “(mth)” Share Classes may fluctuate more than other Share Classes due to more frequent distribution of income.
Other Information
Shareholders should note that, where the dividend rate is in excess of the investment income of the Share Class, dividends will be paid out of the capitalattributed to the Share Class, as well as from realised and unrealised capital gains. This may be tax inefficient for investors in certain countries. Investorsshould consult their local tax adviser about their own position. Share Classes with the suffix “(inc)”, “(div)” and ”(mth)” do not distribute the reportableincome in accordance with the United Kingdom tax legislation relating to offshore funds.
During the year ended 31 December 2011, the SICAV paid dividends as follows:
Class name CurrencyDividend Amount
per Share Payment Date
JPM Global High Yield Bond A (mth) - USD USD 0.60 25 January 2011JPM Global High Yield Bond A (mth) - USD USD 0.41 22 February 2011JPM Global Income A (div) - EUR EUR 1.40 22 February 2011JPM Global Income C (div) - EUR EUR 1.13 22 February 2011JPM Global Income D (div) - EUR EUR 1.25 22 February 2011JPM Emerging Markets Corporate Bond Portfolio I - A (div) - EUR (hedged) EUR 2.22 22 March 2011JPM Emerging Markets Corporate Bond Portfolio I - A (div) - USD USD 2.74 22 March 2011JPM Emerging Markets Corporate Bond Portfolio I - B (div) - EUR (hedged) EUR 2.41 22 March 2011JPM Emerging Markets Corporate Bond Portfolio I - B (div) - USD USD 2.96 22 March 2011JPM Emerging Markets Corporate Bond Portfolio I - C (div) - USD USD 3.02 22 March 2011JPM Emerging Markets Corporate Bond Portfolio I - D (div) - EUR (hedged) EUR 2.07 22 March 2011JPM Emerging Markets Corporate Bond Portfolio I - D (div) - USD USD 2.55 22 March 2011JPM Global High Yield Bond A (mth) - USD USD 0.42 22 March 2011JPM Europe Recovery A (dist) - EUR EUR 0.65 31 March 2011JPM Europe Select Equity A (dist) - EUR EUR 0.55 31 March 2011JPM Europe Strategic Dividend A (dist) - EUR EUR 2.00 31 March 2011JPM Europe Strategic Dividend A (inc) - EUR EUR 1.66 31 March 2011JPM Global Balanced (EUR) A (dist) - EUR EUR 1.26 31 March 2011JPM Global Balanced (USD) A (dist) - USD USD 1.27 31 March 2011JPM Global Capital Appreciation A (dist) - EUR EUR 0.28 31 March 2011JPM Global Capital Appreciation A (inc) - EUR EUR 0.29 31 March 2011JPM Global Capital Preservation (EUR) A (dist) - EUR EUR 3.68 31 March 2011JPM Global Capital Preservation (EUR) A (inc) - EUR EUR 3.70 31 March 2011JPM Global Capital Preservation (EUR) I (inc) - EUR EUR 4.52 31 March 2011JPM Global Dividend A (inc) - EUR (hedged) EUR 1.71 31 March 2011JPM Global Dividend A (inc) - USD USD 1.77 31 March 2011JPM Global Enhanced Bond A (inc) - EUR EUR 0.02 31 March 2011JPM Global Financials A (dist) - USD USD 0.05 31 March 2011JPM Global High Yield Bond A (inc) - EUR (hedged) EUR 4.40 31 March 2011JPM Global High Yield Bond I (inc) - EUR (hedged) EUR 3.99 31 March 2011JPM Global Select 130/30 A (dist) - USD USD 0.30 31 March 2011JPM Global Select Equity A (dist) - USD USD 0.42 31 March 2011JPM Global Total Return A (dist) - EUR EUR 0.77 31 March 2011JPM Global Total Return A (inc) - EUR EUR 0.78 31 March 2011JPM Income Opportunity A (dist) - GBP (hedged) GBP 1.98 31 March 2011
32

Class name CurrencyDividend Amount
per Share Payment Date
JPM Income Opportunity A (inc) - EUR (hedged) EUR 2.46 31 March 2011JPM Income Opportunity C (dist) - GBP (hedged) GBP 2.76 31 March 2011JPM Income Opportunity D (inc) - EUR (hedged) EUR 0.29 31 March 2011JPM Japan 50 Equity A (dist) - JPY JPY 700.00 31 March 2011JPM Japan Behavioural Finance Equity A (dist) - USD USD 0.02 31 March 2011JPM Japan Focus A (dist) - JPY JPY 100.00 31 March 2011JPM Japan Select Equity A (dist) - JPY JPY 200.00 31 March 2011JPM Japan Strategic Value A (dist) - GBP GBP 0.20 31 March 2011JPM US Equity A (dist) - GBP GBP 0.03 31 March 2011JPM Global High Yield Bond A (mth) - USD USD 0.62 26 April 2011JPM Global High Yield Bond A (mth) - USD USD 0.58 25 May 2011JPM Global Income A (div) - EUR EUR 1.41 25 May 2011JPM Global Income C (div) - EUR EUR 1.14 25 May 2011JPM Global Income D (div) - EUR EUR 1.27 25 May 2011JPM Global High Yield Bond A (mth) - USD USD 0.58 22 June 2011JPM Global High Yield Bond A (mth) - USD USD 0.58 15 July 2011JPM Global High Yield Bond A (mth) - USD USD 0.59 19 August 2011JPM Global Income A (div) - EUR EUR 1.27 19 August 2011JPM Global Income B (div) - EUR EUR 0.92 19 August 2011JPM Global Income C (div) - EUR EUR 1.02 19 August 2011JPM Global Income D (div) - EUR EUR 1.14 19 August 2011JPM Global Income T (div) - EUR EUR 0.33 19 August 2011JPM Global High Yield Bond A (mth) - USD USD 0.59 15 September 2011JPM Global High Yield Bond A (mth) - USD USD 0.70 17 October 2011JPM Global High Yield Bond A (mth) - USD USD 0.70 16 November 2011JPM Global Income A (div) - EUR EUR 1.30 16 November 2011JPM Global Income B (div) - EUR EUR 0.94 16 November 2011JPM Global Income C (div) - EUR EUR 1.05 16 November 2011JPM Global Income D (div) - EUR EUR 1.16 16 November 2011JPM Global Income T (div) - EUR EUR 0.96 16 November 2011JPM Global High Yield Bond A (mth) - USD USD 0.70 15 December 2011
5. Taxation
Under current law and practice in the Grand Duchy of Luxembourg, the SICAV is not liable to any income tax, nor are dividends distributed by the SICAV liable to anywithholding tax. However, the SICAV, with the exception of those share Classes identified in the Appendix, is liable to an asset based tax of 0.05% per annum, suchtax being payable quarterly and calculated on the total net assets of each Sub-Fund at the end of the relevant quarter. For those Sub-Funds’ share Classes identifiedin the Appendix, the rate is 0.01% per annum. No tax is payable on the portion of assets invested in other undertakings for collective investment already subject tothe Taxe d’abonnement.
All share Classes (except share Class A (acc)) of JPMorgan Investment Funds - Euro Liquid Market Fund are exempted from the Taxe d’abonnement.
No stamp duty or other tax is payable on the issue of shares in the SICAV in the Grand Duchy of Luxembourg. No tax is payable on realised or unrealisedcapital appreciation of the assets of the SICAV in the Grand Duchy of Luxembourg. Although the SICAV’s realised capital gains, whether short or long-term,are not expected to become taxable in another country, the shareholders must be aware and recognise that such a possibility is not totally excluded. Theregular income of the SICAV from some of its securities, as well as interest earned on cash deposits in certain countries, may be subject to withholding taxesat varying rates, which normally cannot be recovered.
Following case law precedent within Europe, the SICAV has instigated proceedings to reclaim tax witheld by certain Member States of the European Union ondividend payments it has received. The decision to initiate proceedings against any particular Member State is the result of an analysis of the likely costs andpotential benefits of doing so. The likelihood of successfully reclaiming such amounts together with the estimated time to complete proceedings varies acrossMember States. Any costs associated with this decision have been charged to the relevant Sub-Funds and have been included within total costs for the purposes ofdetermining the relevant expense cap or TER and no amount has been recorded in the SICAV for any possible amounts to be received under this action.
Certain Sub-Funds of the SICAV may have invested into Norwegian, Finnish and Polish stocks for which tax reclaim has been successful. As such, amountshave been recorded, where applicable, on a cash basis under Other Income.
During the financial year, the South Korean tax authorities issued a ruling advising that the reduced South Korea/Luxembourg double tax treaty withholdingrates would not apply to SICAVs, and the Seoul Regional Tax Office has claimed withholding taxes on dividend and income from July 2006 from the followingSub-Funds: JPMorgan Investment Funds - Global Balanced Fund (EUR), JPMorgan Investment Funds - Global Capital Preservation Fund (EUR), JPMorganInvestment Funds - Global Capital Preservation Fund (USD), JPMorgan Investment Funds - Global Convertibles Fund (USD), JPMorgan Investment Funds -Global Financials Fund, JPMorgan Investment Funds - Global Select 130/30 Fund, JPMorgan Investment Funds - Global Select Equity Fund and JPMorganInvestment Funds - JF Asia ex-Japan Fund.
Those amounts have been accrued in the Net Asset Value of each Share Class, upon instruction from the Management Company, on 3rd August 2011, andhave been recorded as a reduction of “Dividend Income, Net”.
6. Statement of Changes in Investments
A list, specifying for each investment within each Sub-Fund the total purchases and sales which occurred during the year under review, may be obtained freeof charge upon request at the registered office of the SICAV. Additional information on investments within each Sub-Fund’s portfolio is available toshareholders at the registered office of the SICAV.
7. Value of Financial Instruments and Associated Risks
The SICAV entered into forward foreign exchange, financial futures contracts, options and swaps which, to varying degrees, represent a market risk in excessof the amount reflected on the Combined Statement of Net Assets. The amount of the contracts represents the extent of the SICAV’s participation in thesefinancial instruments. Market risks associated with such contracts arise due to the possible movements in foreign exchange rates, indices, and securityvalues underlying these instruments. Other market and credit risks include the possibility that there may be an illiquid market for the contracts, that achange in the value of the contracts may not directly correlate with changes in the value of the underlying currencies, indices, or securities, or that thecounterparty to a contract defaults on its obligation to perform under the terms of the contract.
33
JPMorgan Investment Funds
Notes to the Financial Statements (continued)
As at 31 December 2011

JPMorgan Investment Funds
Notes to the Financial Statements (continued)
As at 31 December 2011
8. Securities Lending
The SICAV may lend portions of its securities portfolio to third parties for the purpose of generating additional capital or income or for reducing costs or risk,to the maximum extent allowed by and within the limits set forth in (i) article 11 of the Grand Ducal regulation of 8 February 2008 relating to certaindefinitions of the Luxembourg Law, (ii) CSSF Circular 08/356 relating to the rules applicable to undertakings for collective investments when they use certaintechniques and instruments relating to transferable securities and money market instruments (“CSSF Circular 08/356”) and (iii) any other applicable laws,regulations, circulars or CSSF positions. A significant proportion of the income generated from the securities lending program is credited to participatingSub-Funds, with a portion of the income shared between the Management Company for oversight of the program and JPMorgan Chase Bank, N.A. for its roleas securities lending agent for the Fund. Borrowers of securities lent by participating Sub-Funds are approved by the Management Company afterappropriate assessment of such borrowers’ status and financial standing. The income earned from the securities lending program is detailed in theCombined Statement of Operations and Changes in Net Assets. As at 31 December 2011, the SICAV valuation of securities on loan is USD 77,481,330 asdetailed below and received collateral as security with a market value of USD 80,482,271.
The table below provides the USD valuation of securities on loan at a Sub-Fund level as at 31 December 2011:
USDJPMorgan Investment Funds - Emerging Markets Corporate Bond Portfolio Fund I 5,470,652
JPMorgan Investment Funds - Europe Strategic Dividend Fund 1,228,980
JPMorgan Investment Funds - Global High Yield Bond Fund 39,266,743
JPMorgan Investment Funds - Global Select Equity Fund 346,936
JPMorgan Investment Funds - Income Opportunity Fund 30,632,375
JPMorgan Investment Funds - Japan Behavioural Finance Equity Fund 11,797
JPMorgan Investment Funds - Japan Strategic Value Fund 523,847
9. Transactions with Connected Parties
All transactions with connected parties were carried out on an arm’s length basis.
JPMorgan Chase & Co. and its affiliates are counterparties for all securities lending activity and for certain forward foreign exchange contracts, financialfutures contracts and swaps contracts. The Investment Managers, Custodian, Corporate, Administrative and Domiciliary Agent, Management Company andGlobal Distributor and other related Agents of the SICAV are considered as connected parties.
10. Soft Commission Arrangements
The Investment Managers of the SICAV may enter into soft commission arrangements with brokers in respect of services used to support investmentdecision-making for the benefit of the SICAV.
The investment related services received under soft commission arrangements comprise:
- research and advisory services;- economic and political analysis;- portfolio analysis, including valuation and performance measurement;- market analysis;- data and quotation services;- computer hardware and software incidental to the above goods and services; and- investment-related publications.
The Investment Managers do not make direct payments for these services, but transact an agreed amount of business with the brokers on behalf of theSICAV and commission is paid on these transactions.
11. Information for German Registered Shareholders
A list, specifying for each investment within each Sub-Fund the total purchases and sales which occurred during the year under review, may be obtained freeof charge upon request at the registered office of the SICAV and at the office of the German paying and information agent, J.P. Morgan Bank AG,Junghofstraße 14, D-60311 Frankfurt am Main. Additional information on investments within each Sub-Fund’s portfolio is available to shareholders at theregistered office of the SICAV and at the office of the German paying and information agent.
12. Information for Swiss Registered Shareholders
J.P. Morgan (Suisse) S.A. was authorised by the Swiss Financial Market Supervisory Authority (FINMA) as Swiss representative of the SICAV and acts also aspaying agent. The prospectus, the simplified prospectus, the articles, the annual and semi-annual reports of the SICAV, as well as the list of the purchasesand sales which the SICAV has undertaken during the financial year and all information according to the SFA Directive in relation to the transparency ofmanagement fees, may be obtained, on simple request and free of charge, at the head office of the Swiss Representative, J.P. Morgan (Suisse) S.A., 8 rue dela Confédération, CH-1204 Geneva, Switzerland.
Payments/compensations (trailer fees) can be paid out from the management fee for the distribution/marketing of the investment fund to distributors.Reimbursements/rebatescanbegrantedoutof themanagement fee to institutional investorswhohold theSub-Fundshares for theeconomicbenefitof thirdparties.
34

JPMorgan Investment Funds
Notes to the Financial Statements (continued)
As at 31 December 2011
13. Authorisation of Sub-Funds in Hong Kong
Certain share classes of the following Sub-Funds are authorised in Hong Kong and are available to Hong Kong residents:• JPMorgan Investment Funds - Europe Select Equity Fund• JPMorgan Investment Funds - Global Balanced Fund (USD)• JPMorgan Investment Funds - Global Bond Fund (USD)• JPMorgan Investment Funds - Global Capital Preservation Fund (USD)• JPMorgan Investment Funds - Global Convertibles Fund (USD)• JPMorgan Investment Funds - Global Dividend Fund• JPMorgan Investment Funds - Global Enhanced Bond Fund• JPMorgan Investment Funds - Global Financials Fund• JPMorgan Investment Funds - Global High Yield Bond Fund• JPMorgan Investment Funds - Highbridge Statistical Market Neutral Fund• JPMorgan Investment Funds - Japan 50 Equity Fund• JPMorgan Investment Funds - Japan Behavioural Finance Equity Fund• JPMorgan Investment Funds - JF Asia ex-Japan Fund• JPMorgan Investment Funds - US Bond Fund• JPMorgan Investment Funds - US Equity Fund
14. Directors Fees
The only remuneration paid to Directors is an annual fee. This is waived by Mr Berndt May, Mr James B. Broderick and Ms Andrea L. Hazen.
The total Directors’ fees for the year amount to EUR 174,250, of which the Chairman is due EUR 37,250.
15. Transaction Costs
For the year ended 31 December 2011, the SICAV incurred transaction costs which have been defined as brokerage fees relating to purchase or sale oftransferable securities, money market instruments, derivatives or other eligible assets as follows:Sub-Fund Total (Base Currency) CurrencyJPMorgan Investment Funds - Blue and Green Fund 404,298 EURJPMorgan Investment Funds - Emerging Markets Corporate Bond Portfolio Fund I - * USDJPMorgan Investment Funds - Euro Liquid Market Fund - * EURJPMorgan Investment Funds - Europe Bond Fund 1,758 EURJPMorgan Investment Funds - Europe Recovery Fund 3,800,708 EURJPMorgan Investment Funds - Europe Select Equity Fund 984,431 EURJPMorgan Investment Funds - Europe Strategic Dividend Fund 1,591,538 EURJPMorgan Investment Funds - Global Balanced Fund (EUR) 144,272 EURJPMorgan Investment Funds - Global Balanced Fund (USD) 303,688 USDJPMorgan Investment Funds - Global Bond Fund (EUR) 2,967 EURJPMorgan Investment Funds - Global Bond Fund (USD) 2,210 USDJPMorgan Investment Funds - Global Capital Appreciation Fund 352,441 EURJPMorgan Investment Funds - Global Capital Preservation Fund (EUR) 6,328,690 EURJPMorgan Investment Funds - Global Capital Preservation Fund (USD) 403,764 USDJPMorgan Investment Funds - Global Convertibles Fund (USD) 24,691 USDJPMorgan Investment Funds - Global Dividend Fund 251,729 USDJPMorgan Investment Funds - Global Enhanced Bond Fund 969 EURJPMorgan Investment Funds - Global Financials Fund 302,915 USDJPMorgan Investment Funds - Global High Yield Bond Fund 720 USDJPMorgan Investment Funds - Global Income Fund 369,117 EURJPMorgan Investment Funds - Global Select 130/30 Fund 48,600 USDJPMorgan Investment Funds - Global Select Equity Fund 449,610 USDJPMorgan Investment Funds - Global Total Return Fund 89,447 EURJPMorgan Investment Funds - Highbridge Statistical Market Neutral Fund - * EURJPMorgan Investment Funds - Income Opportunity Fund 105,414 USDJPMorgan Investment Funds - Japan 50 Equity Fund 34,649,875 JPYJPMorgan Investment Funds - Japan Behavioural Finance Equity Fund 4,424 USDJPMorgan Investment Funds - Japan Focus Fund 21,720,839 JPYJPMorgan Investment Funds - Japan Select Equity Fund 25,234,374 JPYJPMorgan Investment Funds - Japan Strategic Value Fund 11,630,411 JPYJPMorgan Investment Funds - JF Asia ex-Japan Fund 7,174,959 USDJPMorgan Investment Funds - US Bond Fund - * USDJPMorgan Investment Funds - US Equity Fund 384,293 USDJPMorgan Investment Funds - US Select Equity Fund 2,706,829 USD
* For fixed income securities, transaction cost are not separately identifiable from the purchase price of the security and therefore cannot be disclosed separately.
16. Significant Events
With effect from 3 January 2011, all share classes of the Sub-Funds were de-listed from the official list of the Luxembourg Stock Exchange.
Effective 1 March 2011, the JPMorgan Investment Funds - Global Income Fund changed its benchmarks as follows:
- 10% Emerging Markets Global hedged to Euro, 45% Merrill Lynch High Yield BB-B constrained hedged Euro, 10% FTSE EPRA/NAREIT Developed Indexhedged Euro, 25% MSCI World hedged Euro and 10% Citigroup Euro Broad Investment Grade was replaced by 35% MSCI World Index - Total Return Net -Hedged to EUR 40% Barclays Capital U.S. High Yield 2% Issuer Cap Index - Total Return Gross - Hedged to EUR 25% Barclays Capital Global Credit Index - TotalReturn Gross - Hedged to EUR.
Effective 1 July 2011, the JPMorgan Investment Funds - Europe Bond Fund changed its benchmark from J.P. Morgan EMU Index in EUR (Total Return Gross) toJ.P. Morgan EMU Government Bond Investment Grade Index, in EUR (Total Return Gross).
35

Transferable Securities Admitted to an Official Exchange Listing
Shares
UNITED STATES OF AMERICA27,266 99 Cents Only Stores 457,546 0.5619,001 AGCO 620,181 0.76
5,516 Chevron 457,749 0.5617,284 Coca-Cola 928,194 1.1424,701 EI du Pont de Nemours & Co. 873,435 1.0748,618 EMC/Massachusetts 812,130 1.0024,367 General Motors Preference Shares 641,649 0.794,869 Goodrich 460,218 0.568,823 Harleysville Group 398,117 0.499,697 Healthspring 405,863 0.50
21,749 Microsoft 434,714 0.5314,184 Motorola Mobility Holdings 421,107 0.5211,282 Netlogic Microsystems 427,430 0.52
16,564 Newmont Mining 786,395 0.9610,238 Norfolk Southern 573,000 0.705,630 Occidental Petroleum 412,334 0.5112,143 RightNow Technologies 396,898 0.4913,553 Temple-Inland 328,517 0.407,415 Union Pacific 602,627 0.74
695 Wells Fargo & Co Preference Shares 560,535 0.69
10,998,639 13.49
UNITED KINGDOM52,935 BG Group 855,737 1.05
161,341 BP 888,917 1.0928,449 British American Tobacco 1,022,693 1.2552,229 British Sky Broadcasting Group 450,254 0.55
119,687 Centrica 415,730 0.5131,978 Imperial Tobacco Group 917,957 1.1393,227 National Grid 689,993 0.8556,126 Prudential 419,605 0.51
583,133 Vodafone Group 1,232,387 1.51
6,893,273 8.45
JAPAN292 Japan Tobacco 1,059,314 1.30
194,500 Mitsubishi UFJ Financial Group 624,336 0.77579,900 Mizuho Financial Group 590,077 0.72
600 NTT DoCoMo 819,939 1.0030,400 Sumitomo Mitsui Financial Group 644,822 0.79
3,738,488 4.58
CANADA18,900 Anvil Mining 104,297 0.1317,621 Barrick Gold 618,364 0.7660,531 Daylight Energy 457,253 0.5661,355 Grande Cache Coal 454,507 0.55
1,634,421 2.00
NETHERLANDS14,515 CNH Global 414,325 0.5133,757 Royal Dutch Shell - A Shares 947,221 1.16
1,361,546 1.67
SWITZERLAND7,000 Compagnie Financiere Richemont - Bearer A Shares 272,152 0.331,906 Syngenta Registered Shares 423,436 0.52
695,588 0.85
BERMUDA106,000 Cheung Kong Infrastructure Holdings 466,910 0.57
466,910 0.57
JERSEY40,100 Charter International 454,074 0.56
454,074 0.56
FRANCE12,273 Vivendi 204,560 0.25
204,560 0.25
TAIWAN259 Taiwan Semiconductor Manufacturing 493 0.00124 MediaTek 873 0.00
1,366 0.00
Total Shares 26,448,865 32.42
Bonds
UNITED KINGDOM3,300,000 UK Treasury 16.08.13/2.500% 11,213,677 13.75
11,213,677 13.75
AUSTRALIA2,200,000 Australia (Commonwealth of) 20.08.20/4.000% 3,171,565 3.89
3,171,565 3.89
NETHERLANDS1,500,000 Netherlands (Kingdom of) 15.07.15/3.250% 1,618,750 1.981,000,000 SNS Bank 10.03.14/3.500% 1,049,188 1.29
2,667,938 3.27
INTERNATIONAL AGENCIES1,386,000 European Investment Bank 14.08.13/6.000% 1,091,838 1.34
900,000 European Investment Bank 20.05.14/5.375% 699,738 0.86
1,791,576 2.20
UNITED STATES OF AMERICA1,000,000 Verizon Wireless Capital 01.02.14/5.550% 833,470 1.02
833,470 1.02
CAYMAN ISLANDS700,000 Hutchison Whampoa
International 10 31.12.49/6.000%* 535,958 0.66
535,958 0.66
FRANCE76,000 Sanofi 17.05.13/3.500% 78,378 0.10
78,378 0.10
Total Bonds 20,292,562 24.89
Convertible Bonds
BRITISH VIRGIN ISLANDS700,000 Newford Capital 12.05.16/0.000% 456,134 0.56
8,000,000 Wharf Finance 2014 07.06.14/2.300% 740,654 0.91
1,196,788 1.47
CHANNEL ISLANDS1,000,000 QBE Funding Trust 12.05.30/0.000% 466,878 0.57
466,878 0.57
TAIWAN600,000 Hon Hai Precision Industry 12.10.13/0.000% 440,484 0.54
440,484 0.54
SINGAPORE750,000 CapitaLand 03.09.16/2.875% 409,516 0.50
409,516 0.50
SWITZERLAND225,000 Swiss Prime Site 20.01.15/1.875% 187,967 0.23
187,967 0.23
Total Convertible Bonds 2,701,633 3.31
Total Transferable Securities Admitted to an OfficialExchange Listing
49,443,060 60.62
Transferable Securities Dealt in on Another Regulated Market
Bonds
UNITED STATES OF AMERICA12,000,000 US Treasury 28.02.17/3.000% 10,107,966 12.39
10,107,966 12.39
36
JPMorgan Investment Funds - Blue and Green Fund
Schedule of Investments (Market Value Expressed in EUR)
As at 31 December 2011
Quantity/Nominal
Value
Name of Securities Maturity/Coupon
MarketValue
%of
NetAssets
Quantity/Nominal
Value
Name of Securities Maturity/Coupon
MarketValue
%of
NetAssets

UNITED KINGDOM415,737 Granite Master Issuer
2006-1X A6 20.12.54/1.337%* 397,444 0.499,339 Prominent CMBS Funding 1 A1 20.12.32/1.647%* 9,105 0.01
406,549 0.50
NETHERLANDS507,762 Holland Euro-Denominated
Mortgage Backed Series 11 A 18.09.40/1.539%* 485,715 0.60
485,715 0.60
Total Bonds 11,000,230 13.49
Convertible Bonds
UNITED STATES OF AMERICA1,049,000 Liberty Media 30.03.23/3.125% 902,234 1.11
902,234 1.11
CAYMAN ISLANDS176,000 Transocean 15.12.37/1.500% 131,843 0.16
131,843 0.16
Total Convertible Bonds 1,034,077 1.27
Total Transferable Securities Dealt in on AnotherRegulated Market
12,034,307 14.76
Total Investments 61,477,367 75.38
Cash 7,226,987 8.86
Other Assets/(Liabilities) 12,849,037 15.76
Total Net Assets 81,553,391 100.00
* Variable coupon rates are those quoted as at 31 December 2011.
Allocation of Portfolio as at 31 December 2011 % ofNet Assets
Fixed Income SecuritiesUnited States of America 14.52United Kingdom 14.25Australia 3.89Netherlands 3.87International Agencies 2.20British Virgin Islands 1.47Cayman Islands 0.82Channel Islands 0.57Taiwan 0.54Singapore 0.50Switzerland 0.23France 0.10Total Fixed Income Securities 42.96SharesEnergy 4.93Consumer Staples 4.82Financials 4.54Materials 4.39Industrials 3.83Information Technology 3.06Telecommunication Services 2.76Consumer Discretionary 2.23Utilities 1.36Health Care 0.50Total Shares 32.42Cash and Other Assets/(Liabilities) 24.62
Total 100.00
Allocation of Portfolio as at 30 June 2011 (Unaudited) % ofNet Assets
Fixed Income SecuritiesInternational Agencies 12.62United Kingdom 8.40United States of America 7.74Italy 7.31Netherlands 6.99Australia 3.32Luxembourg 3.01Cayman Islands 0.61Singapore 0.51Switzerland 0.45Channel Islands 0.27France 0.09Total Fixed Income Securities 51.32SharesMaterials 4.32Energy 4.27Financials 4.23Telecommunication Services 3.86Consumer Discretionary 2.66Industrials 2.17Utilities 1.59Consumer Staples 1.49Information Technology 0.51Health Care 0.50Total Shares 25.60Cash and Other Assets/(Liabilities) 23.08
Total 100.00
37
JPMorgan Investment Funds - Blue and Green Fund
Schedule of Investments (Market Value Expressed in EUR) (continued)
As at 31 December 2011
Quantity/Nominal
Value
Name of Securities Maturity/Coupon
MarketValue
%of
NetAssets
Quantity/Nominal
Value
Name of Securities Maturity/Coupon
MarketValue
%of
NetAssets

JPMorgan Investment Funds - Blue and Green Fund
Schedule of Investments - Outstanding Financial Futures Contracts (Expressed in EUR)
As at 31 December 2011
ExpirationDate
Number ofContracts Security Description Currency
NotionalValue
UnrealisedGain/(Loss)
Bond Futures
Mar-12 490 Euro-Bobl Future EUR 61,076,050 173,950Mar-12 (274) Euro-Bund Future EUR (37,840,770) (152,070)Mar-12 (430) Euro-Schatz Future EUR (47,440,825) (54,825)Mar-12 312 US 5 Year Note Future USD 29,292,723 23,321
Total Bond Futures (9,624)
Equity Futures
Mar-12 (128) FTSE 100 Index Future GBP (8,400,391) -Mar-12 (224) Russell 2000 Mini Future USD (12,739,138) 230,902Mar-12 53 SP 500 Emini Future USD 2,559,642 3,448
Total Equity Futures 234,350
Total 224,726
Schedule of Investments - Outstanding Forward Foreign Exchange Contracts (Expressed in EUR)
SettlementDate Currency
AmountPurchased Currency
AmountSold
UnrealisedGain/(Loss)
20-Jan-12 CHF 248,624 NOK 1,581,477 1,04220-Jan-12 EUR 9,228,747 AUD 12,111,965 (150,861)20-Jan-12 EUR 1,644,738 CAD 2,218,817 (17,309)20-Jan-12 EUR 1,086,226 CHF 1,322,404 2,85620-Jan-12 EUR 19,132,501 GBP 16,074,744 (122,312)20-Jan-12 EUR 1,198,123 HKD 12,146,570 2,95320-Jan-12 EUR 3,890,958 JPY 394,379,780 12,90220-Jan-12 EUR 523,134 SGD 888,195 (916)20-Jan-12 EUR 24,621,808 USD 32,106,815 58,32920-Jan-12 GBP 630,720 EUR 749,753 5,74220-Jan-12 NOK 1,515,209 EUR 195,129 (979)20-Jan-12 USD 3,200,000 EUR 2,461,543 (13,367)
Total (221,920)
Schedule of Investments - Outstanding Future Option Contracts (Expressed in EUR)
ExpirationDate
Number ofContracts Security Description Currency
MarketValue
UnrealisedGain/(Loss)
27-Jan-12 280 US 10 Year Note Future, Put Option, Strike Price 127.5 USD 48,553 (39,381)27-Jan-12 270 US 10 Year Note Future, Put Option, Strike Price 128 USD 64,578 5,261
Total 113,131 (34,120)
38

JPMorgan Investment Funds - Blue and Green Fund
Schedule of Investments - Outstanding Financial Option Contracts (Expressed in EUR)
As at 31 December 2011
ExpirationDate
Number ofContracts Security Description Currency
MarketValue
UnrealisedGain/(Loss)
18-Jan-12 2,400 VIX Index, Put Option, Strike Price 24 USD 257,166 124,42818-Jan-12 3,764 VIX Index, Put Option, Strike Price 25 USD 554,568 278,63020-Jan-12 376 DJ Euro Stoxx 50, Call Option, Strike Price 2,350 EUR 135,172 (16,770)20-Jan-12 (752) DJ Euro Stoxx 50, Call Option, Strike Price 2,450 EUR (81,216) 17,07010-Feb-12 193 Nikkei 225 Index, Call Option, Strike Price 8,750 JPY 180,259 (44,707)17-Mar-12 199 S&P 500 Index, Put Option, Strike Price 500 USD 1,523 (44,470)
Total 1,047,472 314,181
39

Transferable Securities Admitted to an Official Exchange Listing
Bonds
LUXEMBOURG2,600,000 Evraz Group 10.11.15/8.250% 2,625,805 2.533,200,000 MHP 29.04.15/10.250% 2,884,000 2.783,000,000 SB Capital for Sberbank 07.07.15/5.499% 3,056,340 2.942,400,000 UBS Luxembourg for Vimpel
Communications 23.05.16/8.250% 2,392,752 2.30900,000 VTB Capital for VTB Bank 04.03.15/6.465% 910,021 0.88
3,000,000 Willow No 2 for Yasar Holdings 07.10.15/9.625% 2,991,735 2.88
14,860,653 14.31
CAYMAN ISLANDS1,300,000 Central China Real Estate 20.10.15/12.250% 1,130,350 1.092,000,000 China Shanshui Cement Group 25.05.16/8.500% 1,893,560 1.821,950,000 Kaisa Group Holdings 28.04.15/13.500% 1,641,656 1.582,900,000 Kuwait Projects 17.10.16/8.875% 3,124,025 3.01
900,000 Vale Overseas 11.01.16/6.250% 1,008,040 0.97
8,797,631 8.47
BRAZIL1,800,000 Banco do Nordeste do Brasil 09.11.15/3.625% 1,794,699 1.732,000,000 BES Investimento do Brasil 25.03.15/5.625% 1,844,200 1.772,700,000 JBS 04.08.16/10.500% 2,744,104 2.64
6,383,003 6.14
NETHERLANDS1,000,000 DTEK Finance 28.04.15/9.500% 920,760 0.891,500,000 Indo Integrated Energy II 05.11.16/9.750% 1,621,448 1.561,000,000 Listrindo Capital 29.01.15/9.250% 1,081,790 1.042,900,000 Metinvest 20.05.15/10.250% 2,747,895 2.64
6,371,893 6.13
MEXICO3,000,000 Desarrolladora Homex 28.09.15/7.500% 2,945,760 2.842,800,000 Urbi Desarrollos Urbanos 19.04.16/8.500% 2,786,182 2.68
5,731,942 5.52
UNITED ARAB EMIRATES2,000,000 Abu Dhabi National Energy 27.10.16/5.875% 2,212,820 2.132,950,000 Dubai Electricity & Water
Authority 22.04.15/8.500% 3,203,803 3.08
5,416,623 5.21
BRITISH VIRGIN ISLANDS2,000,000 Citic Resources Finance 2007 15.05.14/6.750% 2,053,460 1.982,900,000 Star Energy Geothermal Wayang
Windu 12.02.15/11.500% 3,151,213 3.03
5,204,673 5.01
IRELAND3,280,000 Koks Finance 23.06.16/7.750% 2,912,099 2.802,050,000 Novatek Finance 03.02.16/5.326% 2,062,536 1.99
4,974,635 4.79
ARGENTINA3,000,000 City of Buenos Aires Argentina 06.04.15/12.500% 3,150,000 3.03
3,150,000 3.03
KAZAKHSTAN3,000,000 Kazatomprom 20.05.15/6.250% 3,132,255 3.02
3,132,255 3.02
CYPRUS3,000,000 Alfa MTN Issuance 18.03.15/8.000% 3,028,080 2.92
3,028,080 2.92
TURKEY3,000,000 Akbank 22.07.15/5.125% 2,904,390 2.80
2,904,390 2.80
UNITED KINGDOM3,100,000 Biz Finance for Ukreximbank 27.04.15/8.375% 2,708,300 2.61
2,708,300 2.61
SOUTH AFRICA2,400,000 African Bank 15.06.16/6.000% 2,283,751 2.20
2,283,751 2.20
SINGAPORE2,000,000 Sigma Capital 30.04.15/9.000% 2,005,620 1.93
2,005,620 1.93
HONG KONG2,000,000 Bangkok Bank Hongkong 18.10.15/3.250% 1,978,052 1.90
1,978,052 1.90
SOUTH KOREA900,000 Hyundai Motor Manufacturing 15.04.15/4.500% 923,562 0.89900,000 Woori Bank 14.04.15/7.630% 972,509 0.94
1,896,071 1.83
CHILE1,800,000 Telefonica Moviles Chile 09.11.15/2.875% 1,780,425 1.71
1,780,425 1.71
GEORGIA (REPUBLIC OF)1,500,000 Georgian Railway 22.07.15/9.875% 1,532,153 1.47
1,532,153 1.47
BERMUDA1,500,000 China Oriental Group 18.08.15/8.000% 1,295,625 1.25
1,295,625 1.25
AUSTRALIA1,000,000 PTTEP Australia International
Finance Proprietary 19.07.15/4.152% 1,017,468 0.98
1,017,468 0.98
Total Bonds 86,453,243 83.23
Total Transferable Securities Admitted to anOfficial Exchange Listing
86,453,243 83.23
Transferable Securities Dealt in on Another Regulated Market
Bonds
MEXICO2,650,000 Corporacion GEO 25.09.14/8.875% 2,621,128 2.523,000,000 Financiera Independencia 30.03.15/10.000% 2,974,560 2.87
5,595,688 5.39
CAYMAN ISLANDS3,000,000 Country Garden Holdings 22.04.17/11.250% 2,640,000 2.541,700,000 TGI International 03.10.17/9.500% 1,829,880 1.76
4,469,880 4.30
BERMUDA3,060,000 Digicel Group 15.01.15/8.875% 3,020,817 2.91
3,020,817 2.91
BARBADOS2,800,000 Columbus International 20.11.14/11.500% 2,972,900 2.86
2,972,900 2.86
RUSSIA1,000,000 Severstal via Steel Capital 26.07.16/6.250% 937,575 0.90
937,575 0.90
Total Bonds 16,996,860 16.36
Investment Funds
LUXEMBOURG36 JPMorgan Liquidity Funds - US Dollar Liquidity Fund
(JPM US Dollar Liquidity X (acc)) 501,518 0.48
501,518 0.48
Total Investment Funds 501,518 0.48
Total Transferable Securities Dealt in on AnotherRegulated Market
17,498,378 16.84
Total Investments 103,951,621 100.07
Cash 169,391 0.16
Other Assets/(Liabilities) (245,678) (0.23)
Total Net Assets 103,875,334 100.0040
JPMorgan Investment Funds - Emerging Markets Corporate Bond Portfolio Fund I
Schedule of Investments (Market Value Expressed in USD)
As at 31 December 2011
Quantity/Nominal
Value
Name of Securities Maturity/Coupon
MarketValue
%of
NetAssets
Quantity/Nominal
Value
Name of Securities Maturity/Coupon
MarketValue
%of
NetAssets

Allocation of Portfolio as at 31 December 2011 % ofNet Assets
Fixed Income SecuritiesLuxembourg 14.31Cayman Islands 12.77Mexico 10.91Brazil 6.14Netherlands 6.13United Arab Emirates 5.21British Virgin Islands 5.01Ireland 4.79Bermuda 4.16Argentina 3.03Kazakhstan 3.02Cyprus 2.92Barbados 2.86Turkey 2.80United Kingdom 2.61South Africa 2.20Singapore 1.93Hong Kong 1.90South Korea 1.83Chile 1.71Georgia (Republic Of) 1.47Australia 0.98Russia 0.90Total Fixed Income Securities 99.59Investment FundsLuxembourg 0.48Total Investment Funds 0.48Cash and Other Assets/(Liabilities) (0.07)
Total 100.00
Allocation of Portfolio as at 30 June 2011 (Unaudited) % ofNet Assets
Fixed Income SecuritiesLuxembourg 13.13Cayman Islands 10.54Mexico 10.00Brazil 5.55Bermuda 5.36United Kingdom 4.57United Arab Emirates 4.54Ireland 4.53Netherlands 4.44Argentina 2.83British Virgin Islands 2.75Thailand 2.71Cyprus 2.67Kazakhstan 2.66Barbados 2.64Turkey 2.48Ukraine 2.38South Africa 1.98Singapore 1.79Hong Kong 1.65South Korea 1.63Chile 1.48Australia 0.85Total Fixed Income Securities 93.16Investment FundsLuxembourg 7.27Total Investment Funds 7.27Cash and Other Assets/(Liabilities) (0.43)
Total 100.00
41
JPMorgan Investment Funds - Emerging Markets Corporate Bond Portfolio Fund I
Schedule of Investments (Market Value Expressed in USD) (continued)
As at 31 December 2011
Quantity/Nominal
Value
Name of Securities Maturity/Coupon
MarketValue
%of
NetAssets
Quantity/Nominal
Value
Name of Securities Maturity/Coupon
MarketValue
%of
NetAssets

JPMorgan Investment Funds - Emerging Markets Corporate Bond Portfolio Fund I
Schedule of Investments - Outstanding Forward Foreign Exchange Contracts (Expressed in USD)
As at 31 December 2011
SettlementDate Currency
AmountPurchased Currency
AmountSold
UnrealisedGain/(Loss)
13-Jan-12 EUR 55,559,379 USD 74,234,084 (2,110,041)13-Jan-12 USD 312,259 EUR 237,529 3,912
Total (2,106,129)
42

Transferable Securities Admitted to an Official Exchange Listing
Bonds
FRANCE2,000,000 Caisse d’Amortissement de la
Dette Sociale 28.11.12/1.274%* 2,000,000 1.09
2,000,000 1.09
GERMANY1,000,000 German Treasury Bill 11.01.12/0.000% 999,703 0.54
999,703 0.54
Total Bonds 2,999,703 1.63
Total Transferable Securities Admitted to anOfficial Exchange Listing
2,999,703 1.63
Transferable Securities Dealt in on Another Regulated Market
Bonds
NETHERLANDS1,500,000 Rabobank Nederland 18.01.12/1.674%* 1,500,000 0.81
1,500,000 0.81
Total Bonds 1,500,000 0.81
Commercial Paper
UNITED KINGDOM2,000,000 Cancara Asset Securitisation 09.01.12/0.000% 1,999,538 1.092,000,000 Cancara Asset Securitisation 23.01.12/0.000% 1,998,730 1.093,500,000 Lloyds Banking Group 12.01.12/0.000% 3,498,854 1.902,000,000 Lloyds Banking Group 16.01.12/0.000% 1,999,378 1.095,000,000 Royal Bank of Scotland 16.01.12/0.000% 4,998,213 2.72
500,000 Thames Asset GlobalSecuritization 18.01.12/0.000% 499,754 0.27
2,000,000 Thames Asset GlobalSecuritization 20.01.12/0.000% 1,998,891 1.09
2,813,000 Thames Asset GlobalSecuritization 11.01.12/0.000% 2,812,171 1.53
19,805,529 10.78
GERMANY3,000,000 Deutsche Bank 19.01.12/0.000% 2,998,697 1.631,000,000 Deutsche Bank 15.02.12/0.000% 998,174 0.541,000,000 Erste Abwicklungsanstalt 08.03.12/0.000% 998,176 0.551,000,000 Erste Abwicklungsanstalt 22.03.12/0.000% 997,833 0.545,000,000 Federal State Of North Rhine 23.01.12/0.000% 4,998,456 2.721,000,000 Germany (Federal Republic of) 08.03.12/0.000% 998,555 0.543,000,000 Germany (Federal Republic of) 23.04.12/0.000% 2,990,714 1.63
14,980,605 8.15
NETHERLANDS2,000,000 ING Groep 05.01.12/0.000% 1,999,805 1.093,000,000 ING Groep 09.01.12/0.000% 2,999,324 1.632,000,000 Paccar 05.01.12/0.000% 1,999,830 1.091,000,000 Paccar 27.01.12/0.000% 999,238 0.542,500,000 Paccar 16.02.12/0.000% 2,496,137 1.36
10,494,334 5.71
SWEDEN2,500,000 Nordea Bank 16.01.12/0.000% 2,498,692 1.361,000,000 Nordea Bank 13.02.12/0.000% 998,604 0.541,000,000 Nordea Bank 15.02.12/0.000% 998,514 0.542,000,000 Nordea Bank 17.02.12/0.000% 1,996,867 1.091,500,000 Svenska Handelsbanken 18.01.12/0.000% 1,499,169 0.821,000,000 Svenska Handelsbanken 27.01.12/0.000% 999,098 0.54
8,990,944 4.89
IRELAND1,000,000 General Electric Capital 05.03.12/0.000% 997,671 0.542,000,000 General Electric Capital 18.04.12/0.000% 1,991,326 1.081,000,000 Regency Assets 19.01.12/0.000% 999,533 0.552,000,000 Regency Assets 19.01.12/0.000% 1,999,066 1.092,000,000 Regency Assets 17.01.12/0.000% 1,999,176 1.09
7,986,772 4.35
FRANCE1,000,000 Cades 02.02.12/0.000% 999,128 0.543,000,000 France (Government of) 30.03.12/0.000% 2,995,972 1.632,000,000 France (Government of) 10.01.12/0.000% 1,999,627 1.091,000,000 GE Capital European Funding 02.03.12/0.000% 998,454 0.54
6,993,181 3.80
SWITZERLAND1,000,000 Mont Blanc Capital 09.01.12/0.000% 999,757 0.552,000,000 Mont Blanc Capital 09.01.12/0.000% 1,999,557 1.091,500,000 UBS 13.02.12/0.000% 1,497,976 0.811,000,000 UBS 14.02.12/0.000% 998,619 0.54
5,495,909 2.99
FINLAND5,000,000 Pohjola Bank 19.01.12/0.000% 4,998,466 2.72
4,998,466 2.72
NORWAY2,000,000 DnB Bank 23.01.12/0.000% 1,999,685 1.092,000,000 DnB Bank 23.03.12/0.000% 1,996,990 1.091,000,000 DnB Bank 09.02.12/0.000% 999,136 0.54
4,995,811 2.72
AUSTRALIA1,000,000 Commonwealth Bank of
Australia 27.02.12/0.000% 998,422 0.542,000,000 Commonwealth Bank of
Australia 09.05.12/0.000% 1,994,334 1.091,000,000 Macquarie Group 21.02.12/0.000% 998,891 0.54
3,991,647 2.17
AUSTRIA2,000,000 Austria (Republic of) 29.02.12/0.000% 1,998,165 1.091,000,000 Austria (Republic of) 26.03.12/0.000% 997,725 0.54
2,995,890 1.63
JAPAN1,500,000 Mizuho Financial Group 15.02.12/0.000% 1,497,898 0.81
1,497,898 0.81
Total Commercial Paper 93,226,986 50.72
Certificates of Deposit
JAPAN2,000,000 Mitsubishi UFJ Financial Group 25.01.12/0.000% 1,998,738 1.091,000,000 Mitsubishi UFJ Financial Group 30.01.12/0.000% 999,479 0.551,000,000 Mitsubishi UFJ Financial Group 08.03.12/0.000% 998,049 0.541,000,000 Mitsubishi UFJ Financial Group 21.03.12/0.000% 996,690 0.542,000,000 Mizuho Financial Group 08.02.12/0.000% 1,997,541 1.082,000,000 Mizuho Financial Group 15.02.12/0.000% 1,997,560 1.094,000,000 Sumitomo Mitsui Financial Group 16.01.12/0.000% 4,000,000 2.182,000,000 Sumitomo Mitsui Financial Group 27.02.12/0.000% 1,997,238 1.081,000,000 Sumitomo Trust & Banking 10.02.12/0.000% 998,973 0.542,000,000 Sumitomo Trust & Banking 14.02.12/0.000% 1,997,902 1.09
17,982,170 9.78
UNITED KINGDOM2,000,000 Barclays 16.01.12/0.000% 1,998,900 1.092,000,000 Barclays 16.01.12/0.500% 2,000,000 1.095,000,000 HSBC Holdings/London 08.05.12/0.900% 5,000,000 2.72
8,998,900 4.90
NETHERLANDS1,000,000 Rabobank Nederland 22.02.12/0.000% 998,310 0.544,000,000 Rabobank Nederland 17.05.12/1.049% 4,000,000 2.18
4,998,310 2.72
CANADA2,000,000 Bank of Nova Scotia 13.02.12/0.000% 1,998,137 1.092,000,000 Bank of Nova Scotia 11.05.12/0.000% 1,992,671 1.08
3,990,808 2.17
SWEDEN3,000,000 Svenska Handelsbanken 20.02.12/0.000% 2,994,324 1.63
2,994,324 1.63
43
JPMorgan Investment Funds - Euro Liquid Market Fund
Schedule of Investments (Market Value Expressed in EUR)
As at 31 December 2011
Quantity/Nominal
Value
Name of Securities Maturity/Coupon
MarketValue
%of
NetAssets
Quantity/Nominal
Value
Name of Securities Maturity/Coupon
MarketValue
%of
NetAssets

AUSTRIA2,000,000 Oesterreichische Kontrollbank 16.01.12/0.000% 1,999,255 1.09
1,999,255 1.09
Total Certificates of Deposit 40,963,767 22.29
Total Transferable Securities Dealt in on AnotherRegulated Market
135,690,753 73.82
Total Investments 138,690,456 75.45
Cash Equivalents
Time Deposits
UNITED KINGDOM3,500,000 Bank of Scotland 30.12.11/0.100% 3,500,000 1.903,500,000 Bank of Scotland 02.01.12/0.150% 3,500,000 1.903,500,000 Bank of Scotland 03.01.12/0.150% 3,500,000 1.905,000,000 Barclays Bank 02.01.12/0.050% 5,000,000 2.725,000,000 Barclays Bank 03.01.12/0.050% 5,000,000 2.725,000,000 Barclays Bank 04.01.12/0.050% 5,000,000 2.729,000,000 Citibank/London 03.01.12/0.150% 9,000,000 4.909,000,000 Citibank/London 04.01.12/0.150% 9,000,000 4.909,000,000 Citibank/London 02.01.12/0.170% 9,000,000 4.905,000,000 Deutsche Bank/London 30.12.11/0.150% 5,000,000 2.725,000,000 Deutsche Bank/London 02.01.12/0.150% 5,000,000 2.725,000,000 Deutsche Bank/London 03.01.12/0.150% 5,000,000 2.724,000,000 RBS 30.12.11/0.150% 4,000,000 2.176,500,000 UBS/London 03.01.12/0.100% 6,500,000 3.546,500,000 UBS/London 04.01.12/0.100% 6,500,000 3.54
84,500,000 45.97
FRANCE9,000,000 BNP Paribas 03.01.12/0.250% 9,000,000 4.909,000,000 BNP Paribas 04.01.12/0.250% 9,000,000 4.899,000,000 BNP Paribas 02.01.12/0.650% 9,000,000 4.909,000,000 BRED Banque Populaire 02.01.12/0.350% 9,000,000 4.90
36,000,000 19.59
NETHERLANDS4,000,000 ING Bank 02.01.12/0.200% 4,000,000 2.184,000,000 ING Bank 03.01.12/0.200% 4,000,000 2.172,500,000 Rabobank Nederland 30.12.11/0.050% 2,500,000 1.362,500,000 Rabobank Nederland 02.01.12/0.100% 2,500,000 1.362,500,000 Rabobank Nederland 03.01.12/0.100% 2,500,000 1.36
15,500,000 8.43
Total Time Deposits 136,000,000 73.99
Total Cash Equivalents 136,000,000 73.99
Total Investments plus Total Cash Equivalents 274,690,456 149.44
Cash 1,608,132 0.88
Other Assets/(Liabilities) (92,490,082) (50.32)
Total Net Assets 183,808,506 100.00
* Variable coupon rates are those quoted as at 31 December 2011.
Allocation of Portfolio as at 31 December 2011 % ofNet Assets
Fixed Income SecuritiesUnited Kingdom 15.68Japan 10.59Netherlands 9.24Germany 8.69Sweden 6.52France 4.89Ireland 4.35Switzerland 2.99Finland 2.72Norway 2.72Austria 2.72Australia 2.17Canada 2.17Total Fixed Income Securities 75.45Cash Equivalents, Cash and Other Assets/(Liabilities) 24.55
Total 100.00
Allocation of Portfolio as at 30 June 2011 (Unaudited) % ofNet Assets
Fixed Income SecuritiesFrance 14.51Netherlands 7.04Germany 5.99United Kingdom 5.27Sweden 5.27Ireland 3.52United States of America 3.52Italy 2.64Japan 2.20Finland 1.76Australia 1.32Austria 0.88Switzerland 0.88Netherlands Antilles 0.88Hong Kong 0.44Total Fixed Income Securities 56.12Cash Equivalents, Cash and Other Assets/(Liabilities) 43.88
Total 100.00
44
JPMorgan Investment Funds - Euro Liquid Market Fund
Schedule of Investments (Market Value Expressed in EUR) (continued)
As at 31 December 2011
Quantity/Nominal
Value
Name of Securities Maturity/Coupon
MarketValue
%of
NetAssets
Quantity/Nominal
Value
Name of Securities Maturity/Coupon
MarketValue
%of
NetAssets

Transferable Securities Admitted to an Official Exchange Listing
Bonds
FRANCE150,000 Arkema 25.10.17/4.000% 147,324 0.57
1,971,000 France (Government of) 25.10.20/2.500% 1,892,138 7.24289,000 France (Government of) 25.10.32/5.750% 376,220 1.44446,000 France (Government of) 25.04.35/4.750% 523,355 2.00645,000 France (Government of) 25.04.60/4.000% 686,129 2.62400,000 GCE Covered Bonds 14.01.15/2.750% 402,183 1.54588,000 Ixis Corporate & Investment Bank 24.07.18/4.375%* 509,907 1.95200,000 Société des Autoroutes
Paris-Rhin-Rhone 12.01.17/5.000% 203,592 0.78
4,740,848 18.14
ITALY590,000 Italy (Republic of) 15.12.13/3.750% 578,997 2.22656,000 Italy (Republic of) 01.08.17/5.250% 630,508 2.41
1,881,000 Italy (Republic of) 01.09.20/4.000% 1,578,775 6.041,837,000 Italy (Republic of) 01.02.37/4.000% 1,289,321 4.93
4,077,601 15.60
GERMANY1,738,000 Germany (Federal Republic of) 08.04.16/2.750% 1,892,589 7.24
147,000 Germany (Federal Republic of) 04.07.21/3.250% 166,137 0.64300,000 Germany (Federal Republic of) 04.07.42/3.250% 356,876 1.36
2,415,602 9.24
NETHERLANDS300,000 LeasePlan 22.05.14/3.250% 314,017 1.20
85,000 Linde Finance 01.06.21/3.875% 90,552 0.351,312,000 Netherlands (Kingdom of) 15.07.18/4.000% 1,490,678 5.70
117,000 Netherlands (Kingdom of) 15.01.42/3.750% 148,572 0.57
2,043,819 7.82
SPAIN370,000 Spain (Kingdom of) 30.04.16/3.250% 359,865 1.38
7,000 Spain (Kingdom of) 30.07.18/4.100% 6,877 0.03687,000 Spain (Kingdom of) 30.04.20/4.000% 654,072 2.50414,000 Spain (Kingdom of) 31.10.20/4.850% 413,494 1.58593,000 Spain (Kingdom of) 30.07.41/4.700% 498,926 1.91125,000 Telefonica Emisiones 16.02.21/5.462% 92,790 0.35
2,026,024 7.75
BELGIUM191,000 Belgium (Kingdom of) 28.03.14/4.000% 197,293 0.76
945,000 Belgium (Kingdom of) 28.03.18/4.000% 970,615 3.71546,000 Belgium (Kingdom of) 28.09.21/4.250% 554,841 2.12
1,722,749 6.59
AUSTRIA660,000 Austria (Republic of) 15.03.19/4.350% 728,867 2.79232,000 Austria (Republic of) 15.03.26/4.850% 272,530 1.04
1,001,397 3.83
SOUTH KOREA915,000,000 Korea (Republic of) 10.06.12/4.000% 611,652 2.34
611,652 2.34
FINLAND390,000 Finland (Government of) 15.09.14/3.125% 416,063 1.59150,000 Finland (Government of) 15.04.20/3.375% 163,103 0.63
579,166 2.22
SWEDEN150,000 Skandinaviska Enskilda Banken 19.05.16/3.750% 151,146 0.57100,000 Svenska Handelsbanken 20.10.21/4.375% 103,777 0.40310,000 Swedbank Hypotek 07.09.15/2.250% 313,339 1.20
568,262 2.17
NORWAY324,000 DNB Boligkreditt 18.10.16/2.500% 327,714 1.25173,000 Sparebank 1 Boligkreditt 22.11.16/2.375% 173,762 0.67
501,476 1.92
MEXICO55,000 Mexico (United Mexican States) 05.12.24/10.000% 392,522 1.50
392,522 1.50
BRAZIL830 Brazil (Republic of) 01.01.13/10.000% 359,623 1.38
359,623 1.38
IRELAND210,000 GE Capital European Funding 04.04.16/3.750% 215,396 0.82
215,396 0.82
UNITED KINGDOM200,000 Barclays Bank 08.09.14/2.125% 198,968 0.76
198,968 0.76
RUSSIA200,400 Russian (Republic of) 31.03.30/7.500%* 179,616 0.69
179,616 0.69
CANADA105,000 Xstrata Finance Canada 13.06.17/5.250% 112,571 0.43
112,571 0.43
UNITED STATES OF AMERICA100,000 HSBC Finance 30.05.17/4.875% 103,804 0.40
103,804 0.40
Total Bonds 21,851,096 83.60
Total Transferable Securities Admitted to an OfficialExchange Listing
21,851,096 83.60
Transferable Securities Dealt in on Another Regulated Market
Bonds
UNITED STATES OF AMERICA57,799 Asset Backed Funding
Certificates 2005-HE2 M1 25.06.35/0.774%* 43,702 0.17165,123 Credit Suisse First Boston
Mortgage Securities 2004-3 2A1 25.04.19/5.000% 131,405 0.5090,711 Equity One ABS 2004-3 AF4 25.07.34/5.100%* 66,838 0.25
118,155 Morgan Stanley ABS Capital I2004-SD2 A 25.04.34/0.744%* 79,062 0.30
285,000 Morgan Stanley Capital I2005-HQ7 A4 14.11.42/5.202%* 242,009 0.93
130,000 Park Place Securities 2005-WHQ3M1 25.06.35/0.714%* 88,141 0.34
340,002 Residential Asset MortgageProducts 2004-RS11 M1 25.11.34/0.914%* 239,853 0.92
225,000 Wachovia Bank CommercialMortgage Trust 2005-C21 A4 15.10.44/5.204%* 190,284 0.73
130,816 Wells Fargo Mortgage BackedSecurities Trust 2005-2 2A1 25.04.20/4.750% 103,986 0.40
1,185,280 4.54
UNITED KINGDOM1,100,000 Aire Valley Mortgages 2006-1X
2B2 20.09.66/1.647%* 667,150 2.55858,912 Granite Master Issuer 2006-2 A5 20.12.54/1.337%* 821,120 3.14
1,488,270 5.69
FRANCE72,000 French Treasury Bill (i) 16.05.12/0.000% 71,801 0.27
71,801 0.27
Total Bonds 2,745,351 10.50
45
JPMorgan Investment Funds - Europe Bond Fund
Schedule of Investments (Market Value Expressed in EUR)
As at 31 December 2011
Quantity/Nominal
Value
Name of Securities Maturity/Coupon
MarketValue
%of
NetAssets
Quantity/Nominal
Value
Name of Securities Maturity/Coupon
MarketValue
%of
NetAssets

Investment Funds
LUXEMBOURG79 JPMorgan Liquidity Funds - Euro Liquidity Fund (JPM
Euro Liquidity X (acc)) 1,097,011 4.20
1,097,011 4.20
Total Investment Funds 1,097,011 4.20
Total Transferable Securities Dealt in on AnotherRegulated Market
3,842,362 14.70
Total Investments 25,693,458 98.30
Cash 177,276 0.68
Other Assets/(Liabilities) 267,878 1.02
Total Net Assets 26,138,612 100.00
* Variable coupon rates are those quoted as at 31 December 2011.(i) Security partially or totally held as collateral against financial futures contracts by the broker.
Allocation of Portfolio as at 31 December 2011 % ofNet Assets
Fixed Income SecuritiesFrance 18.41Italy 15.60Germany 9.24Netherlands 7.82Spain 7.75Belgium 6.59United Kingdom 6.45United States of America 4.94Austria 3.83South Korea 2.34Finland 2.22Sweden 2.17Norway 1.92Mexico 1.50Brazil 1.38Ireland 0.82Russia 0.69Canada 0.43Total Fixed Income Securities 94.10Investment FundsLuxembourg 4.20Total Investment Funds 4.20Cash and Other Assets/(Liabilities) 1.70
Total 100.00
Allocation of Portfolio as at 30 June 2011 (Unaudited) % ofNet Assets
Fixed Income SecuritiesItaly 23.16France 14.68Spain 9.61Netherlands 7.63Belgium 6.37United Kingdom 5.73United States of America 3.92Austria 3.63South Africa 2.92Ireland 1.90South Korea 1.76Finland 1.64Mexico 1.51Brazil 1.05Russia 0.90Portugal 0.84Canada 0.52Sweden 0.44Norway 0.29Total Fixed Income Securities 88.50Investment FundsLuxembourg 5.82Total Investment Funds 94.32Cash and Other Assets/(Liabilities) 5.68
Total 100.00
46
JPMorgan Investment Funds - Europe Bond Fund
Schedule of Investments (Market Value Expressed in EUR) (continued)
As at 31 December 2011
Quantity/Nominal
Value
Name of Securities Maturity/Coupon
MarketValue
%of
NetAssets
Quantity/Nominal
Value
Name of Securities Maturity/Coupon
MarketValue
%of
NetAssets

JPMorgan Investment Funds - Europe Bond Fund
Schedule of Investments - Outstanding To be Announced Securities (Expressed in EUR)
As at 31 December 2011
MaturityDate Name of Securities Coupon
NominalValue
MarketValue
UnrealisedGain/(Loss)
To be Announced Securities - Long Positions
UNITED STATES OF AMERICA
25-Jan-42 Fannie Mae 4.000% 1,000,000 808,545 2,407
Total 808,545 2,407
Schedule of Investments - Outstanding Financial Futures Contracts (Expressed in EUR)
ExpirationDate
Number ofContracts Security Description Currency
NotionalValue
UnrealisedGain/(Loss)
Bond Futures
Mar-12 2 Euro-Bobl Future EUR 250,140 240Mar-12 6 Euro-Bund Future EUR 833,640 110Mar-12 11 Euro-Schatz Future EUR 1,213,850 (220)Mar-12 6 Long Gilt Future GBP 840,170 (790)Mar-12 (15) US 2 Year Note Future USD (2,548,053) (361)Mar-12 (5) US 5 Year Note Future USD (474,389) (271)Mar-12 7 US 10 Year Note Future USD 706,276 674
Total (618)
Schedule of Investments - Outstanding Forward Foreign Exchange Contracts (Expressed in EUR)
SettlementDate Currency
AmountPurchased Currency
AmountSold
UnrealisedGain/(Loss)
10-Feb-12 AUD 716,829 EUR 543,295 16,73010-Feb-12 CAD 119,187 EUR 86,508 3,45210-Feb-12 CAD 249,792 NOK 1,426,222 5,16410-Feb-12 CAD 127,097 USD 124,766 (159)10-Feb-12 CHF 352,658 EUR 285,716 4,15010-Feb-12 CHF 105,209 USD 111,734 42410-Feb-12 CNY 2,200,000 USD 345,695 1,15710-Feb-12 EUR 908,171 AUD 1,206,778 (34,627)10-Feb-12 EUR 373,870 CHF 458,047 (2,619)10-Feb-12 EUR 18,478 GBP 15,867 (508)10-Feb-12 EUR 83,428 JPY 8,502,757 (1,478)10-Feb-12 EUR 251,772 MXN 4,629,453 (3,022)10-Feb-12 EUR 270,768 SEK 2,494,165 (8,479)10-Feb-12 EUR 2,218,735 USD 2,994,308 (87,330)10-Feb-12 MXN 2,150,996 EUR 117,809 57710-Feb-12 NOK 741,995 CAD 126,057 25610-Feb-12 NOK 2,128,922 EUR 272,376 1,34710-Feb-12 NZD 469,120 EUR 269,386 9,97110-Feb-12 SGD 450,000 USD 349,060 (1,567)10-Feb-12 USD 451,952 BRL 812,158 16,04210-Feb-12 USD 119,221 EUR 91,143 67510-Feb-12 USD 813,964 KRW 919,840,000 17,42510-Feb-12 ZAR 301,218 EUR 27,318 1,210
Total (61,209)
47

Transferable Securities Admitted to an Official Exchange Listing
Shares
UNITED KINGDOM375,000 Barclays 790,241 0.5562,000 Berkeley Group Holdings 944,637 0.67
1,412,973 BP 7,784,824 5.47528,699 Capital & Counties Properties 1,170,155 0.82
49,661 Croda International 1,075,052 0.75150,000 Diageo 2,526,526 1.78130,000 Filtrona 593,040 0.42337,310 GlaxoSmithKline 5,941,980 4.17
245,000 Great Portland Estates 948,537 0.6788,000 Hunting 791,294 0.56
560,000 International Power 2,264,639 1.59145,000 Kingfisher 435,162 0.31155,000 Persimmon 871,423 0.61580,000 Reed Elsevier 3,599,008 2.53
56,000 Rio Tinto 2,095,838 1.47130,000 SABMiller 3,529,832 2.48255,000 Sage Group 895,962 0.63430,000 Senior 881,687 0.62240,000 Stagecoach Group 780,040 0.55569,552 Standard Life 1,404,123 0.99395,000 Tate & Lyle 3,333,095 2.3430,000 United Utilities Group 217,586 0.1570,000 WH Smith 444,211 0.31
43,318,892 30.44
FRANCE162,430 Cie Générale de Géophysique-Veritas 2,937,140 2.06
31,847 Pernod-Ricard 2,269,258 1.6078,799 Sanofi 4,439,930 3.1243,636 Technip 3,167,755 2.23
157,409 Total 6,191,683 4.35
19,005,766 13.36
SWITZERLAND37,455 Roche Holding - Genussschein 4,891,195 3.4433,401 Schindler Holding 3,006,191 2.11
107,402 Swiss Re 4,201,025 2.9525,519 Zurich Financial Services 4,451,007 3.13
16,549,418 11.63
GERMANY41,988 Beiersdorf 1,838,235 1.2927,944 Bilfinger Berger 1,827,957 1.28130,141 Celesio 1,593,902 1.12156,161 Deutsche Post Registered Shares 1,861,439 1.3184,744 GEA Group 1,846,995 1.3046,612 Merck KGaA 3,581,899 2.52121,138 Suedzucker 2,993,926 2.10
15,544,353 10.92
SWEDEN129,648 Alfa Laval 1,890,783 1.33116,017 Hennes & Mauritz - B Shares 2,861,213 2.01
336,536 Securitas - B Shares 2,246,289 1.58183,191 Skanska - B Shares 2,320,093 1.63
247,343 Svenska Cellulosa - B Shares 2,810,570 1.97
12,128,948 8.52
JERSEY620,000 Cape 2,427,476 1.70175,000 Wolseley 4,465,160 3.14
6,892,636 4.84
NETHERLANDS267,684 Delta Lloyd 3,464,500 2.44251,992 Reed Elsevier 2,255,202 1.58
5,719,702 4.02
SPAIN109,496 Ebro Foods 1,565,245 1.10297,479 Ferrovial 2,769,678 1.95
4,334,923 3.05
ITALY1,072,305 Mediolanum 3,222,277 2.26
3,222,277 2.26
IRELAND144,196 CRH 2,202,233 1.55
2,202,233 1.55
AUSTRIA228,549 Telekom Austria 2,105,051 1.48
2,105,051 1.48
ISLE OF MAN347,000 Lamprell 1,122,614 0.79
1,122,614 0.79
BERMUDA110,000 Lancashire Holdings 951,582 0.67
951,582 0.67
Total Shares 133,098,395 93.53
Total Transferable Securities Admitted to anOfficial Exchange Listing
133,098,395 93.53
Other Transferable Securities
Shares
AUSTRIA951,684 Immofinanz* 0 0.00
0 0.00
Total Shares 0 0.00
Total Other Transferable Securities 0 0.00
Total Investments 133,098,395 93.53
Cash 246,799 0.17
Other Assets/(Liabilities) 8,964,140 6.30
Total Net Assets 142,309,334 100.00
* This Security is fair valued.
48
JPMorgan Investment Funds - Europe Recovery Fund
Schedule of Investments (Market Value Expressed in EUR)
As at 31 December 2011
Quantity/Nominal
Value
Name of Securities MarketValue
%of
NetAssets
Quantity/Nominal
Value
Name of Securities MarketValue
%of
NetAssets

Allocation of Portfolio as at 31 December 2011 % ofNet Assets
SharesFinancials 15.78Energy 15.46Health Care 14.37Consumer Discretionary 13.27Consumer Staples 12.69Industrials 11.95Materials 6.16Utilities 1.74Telecommunication Services 1.48Information Technology 0.63Total Shares 93.53Cash and Other Assets/(Liabilities) 6.47
Total 100.00
Allocation of Portfolio as at 30 June 2011 (Unaudited) % ofNet Assets
SharesIndustrials 24.56Consumer Discretionary 16.71Materials 15.00Financials 12.75Information Technology 7.36Consumer Staples 5.80Energy 5.70Telecommunication Services 4.91Investment Companies 2.93Utilities 2.87Health Care 2.66Total Shares 101.25Cash and Other Assets/(Liabilities) (1.25)
Total 100.00
49
JPMorgan Investment Funds - Europe Recovery Fund
Schedule of Investments (Market Value Expressed in EUR) (continued)
As at 31 December 2011
Quantity/Nominal
Value
Name of Securities MarketValue
%of
NetAssets
Quantity/Nominal
Value
Name of Securities MarketValue
%of
NetAssets

Transferable Securities Admitted to an Official Exchange Listing
Shares
UNITED KINGDOM428,393 Aegis Group 739,901 0.3280,958 Anglo American 2,305,813 1.0060,428 ASOS 896,086 0.39113,395 Associated British Foods 1,503,672 0.65116,412 AstraZeneca 4,142,147 1.78
621,930 Barclays 1,310,599 0.57947,552 Barratt Developments 1,052,850 0.45137,115 BG Group 2,260,245 0.98
825,920 BP 4,550,435 1.96443,522 Brammer 1,277,161 0.55122,443 British American Tobacco 4,483,921 1.93
1,774,330 BT Group 4,056,669 1.75147,156 Burberry Group 2,088,791 0.90586,971 Cairn Energy 1,870,153 0.81
41,131 Croda International 890,396 0.38231,221 Domino’s Pizza UK & IRL 1,116,393 0.48
440,715 HSBC Holdings 2,591,453 1.12407,565 Inchcape 1,427,864 0.62138,788 Intercontinental Hotels Group 1,925,976 0.83401,838 International Power 1,625,032 0.70
2,620,109 ITV 2,136,397 0.929,588,204 Lloyds Banking Group 2,969,950 1.28
157,161 Petropavlovsk 1,159,624 0.50681,104 Premier Farnell 1,465,063 0.63604,733 Prudential 4,619,552 1.99
81,678 Rio Tinto 3,056,855 1.32355,172 Rolls-Royce Holdings 3,173,501 1.37175,296 SABMiller 4,759,734 2.05495,165 Salamander Energy 1,192,278 0.52
1,809,794 SIG 1,818,053 0.79209,678 Smith & Nephew 1,569,720 0.68121,613 Soco International 424,894 0.18
81,211 Standard Chartered 1,370,309 0.59170,274 Tate & Lyle 1,436,809 0.62
1,783,496 Vodafone Group 3,821,372 1.6561,464 Weir Group 1,498,353 0.65
120,655 Xstrata 1,411,417 0.61
79,999,438 34.52
SWITZERLAND214,574 ABB Registered Shares 3,115,002 1.3496,687 Compagnie Financiere Richemont - Bearer A Shares 3,783,099 1.63
156,939 Nestlé Registered Shares 6,959,342 3.0187,781 Novartis Registered Shares 3,865,538 1.67
50,450 Roche Holding - Genussschein 6,588,194 2.8466,163 Swiss Re 2,587,963 1.12
294,750 UBS Registered Shares 2,691,584 1.1616,936 Zurich Financial Services 2,953,966 1.27
32,544,688 14.04
FRANCE80,044 Atos 2,707,488 1.17119,851 AXA 1,195,214 0.5273,912 BNP Paribas 2,233,251 0.96
147,630 GDF Suez 3,067,013 1.3236,265 L’Oréal 2,912,442 1.2632,908 PPR 3,645,384 1.5779,119 Schneider Electric 3,176,035 1.37
111,316 Société Générale 1,865,378 0.80219,177 Suez Environnement 1,940,593 0.84
167,830 Total 6,601,593 2.85
29,344,391 12.66
GERMANY29,110 Allianz Registered Shares 2,146,135 0.9288,431 Bayer Registered Shares 4,349,700 1.8836,136 Bayerische Motoren Werke 1,864,437 0.8020,529 Brenntag 1,473,058 0.6330,380 Continental 1,457,405 0.63
130,801 Deutsche Telekom Registered Shares 1,156,869 0.5033,653 Duerr 1,146,894 0.49
189,698 E.ON 3,145,667 1.36101,494 Henkel & Co. KGaA Non Voting Preference Shares 4,538,304 1.96295,894 Infineon Technologies 1,726,837 0.75
57,638 Kabel Deutschland Holding 2,262,580 0.98
25,267,886 10.90
NETHERLANDS179,241 EADS 4,302,680 1.86
433,560 ING Groep - CVA 2,403,657 1.04268,520 Koninklijke KPN 2,482,199 1.07167,682 Royal Dutch Shell - A Shares 4,754,268 2.05
13,942,804 6.02
SWEDEN26,111 Modern Times Group - B Shares 954,716 0.42
450,845 Nordea Bank 2,682,919 1.16214,735 Swedbank - A Shares 2,133,381 0.92132,563 Tele2 - B Shares 1,976,440 0.85
288,636 Telefonaktiebolaget LM Ericsson - B Shares 2,258,597 0.97
10,006,053 4.32
SPAIN454,542 Banco Santander 2,641,798 1.14446,185 BBVA 2,921,396 1.26
39,910 Inditex 2,519,319 1.0948,872 Red Eléctrica 1,603,979 0.69
9,686,492 4.18
DENMARK34,174 Carlsberg - B Shares 1,857,310 0.8049,367 Novo Nordisk - B Shares 4,388,690 1.89
6,246,000 2.69
JERSEY624,819 Highland Gold Mining 1,396,211 0.60
95,138 Petrofac 1,640,333 0.7193,658 Shire 2,514,178 1.09
5,550,722 2.40
FINLAND499,839 Nokia 1,861,900 0.80
68,924 Nokian Renkaat 1,697,598 0.73147,022 Outokumpu 731,287 0.32156,002 Stora Enso - R Shares 712,617 0.31
5,003,402 2.16
ITALY1,042,411 Snam Rete Gas 3,516,052 1.521,761,728 Telecom Italia 1,459,592 0.63
4,975,644 2.15
BELGIUM47,505 KBC Groep 450,086 0.2034,826 Solvay 2,205,357 0.95
2,655,443 1.15
PORTUGAL197,282 Jeronimo Martins SGPS 2,521,757 1.09
2,521,757 1.09
IRELAND32,528 Paddy Power 1,462,947 0.63
1,462,947 0.63
AUSTRIA17,438 Andritz 1,114,201 0.48
1,114,201 0.48
NORWAY116,686 Petroleum Geo-Services 980,646 0.42
980,646 0.42
Total Shares 231,302,514 99.81
Total Transferable Securities Admitted to anOfficial Exchange Listing
231,302,514 99.81
50
JPMorgan Investment Funds - Europe Select Equity Fund
Schedule of Investments (Market Value Expressed in EUR)
As at 31 December 2011
Quantity/Nominal
Value
Name of Securities MarketValue
%of
NetAssets
Quantity/Nominal
Value
Name of Securities MarketValue
%of
NetAssets

Other Transferable Securities
Shares
UNITED STATES OF AMERICA267,686 Vimetco Registered Shares GDR* 113,422 0.05
113,422 0.05
Total Shares 113,422 0.05
Total Other Transferable Securities 113,422 0.05
Total Investments 231,415,936 99.86
Cash 188,663 0.08
Other Assets/(Liabilities) 134,977 0.06
Total Net Assets 231,739,576 100.00* This security is fair valued.
Allocation of Portfolio as at 31 December 2011 % ofNet Assets
SharesFinancials 18.02Consumer Discretionary 14.73Consumer Staples 13.37Energy 10.48Health Care 9.95Materials 8.50Industrials 7.61Telecommunication Services 6.45Utilities 6.43Information Technology 4.32Total Shares 99.86Cash and Other Assets/(Liabilities) 0.14
Total 100.00
Allocation of Portfolio as at 30 June 2011 (Unaudited) % ofNet Assets
SharesFinancials 21.26Consumer Discretionary 13.15Consumer Staples 10.38Health Care 10.19Energy 9.93Materials 9.69Industrials 7.94Telecommunication Services 6.61Utilities 5.73Information Technology 4.81Total Shares 99.69Bank Overdraft and Other Assets/(Liabilities) 0.31
Total 100.00
51
JPMorgan Investment Funds - Europe Select Equity Fund
Schedule of Investments (Market Value Expressed in EUR) (continued)
As at 31 December 2011
Quantity/Nominal
Value
Name of Securities MarketValue
%of
NetAssets
Quantity/Nominal
Value
Name of Securities MarketValue
%of
NetAssets

JPMorgan Investment Funds - Europe Select Equity Fund
Schedule of Investments - Outstanding Financial Futures Contracts (Expressed in EUR)
As at 31 December 2011
ExpirationDate
Number ofContracts Security Description Currency
NotionalValue
UnrealisedGain/(Loss)
Equity Futures
Mar-12 26 DJ Euro Stoxx 50 Index Future EUR 597,610 5,330
Total 5,330
Schedule of Investments - Outstanding Forward Foreign Exchange Contracts (Expressed in EUR)
SettlementDate Currency
AmountPurchased Currency
AmountSold
UnrealisedGain/(Loss)
10-Jan-12 EUR 3,281,312 CHF 4,057,476 (52,334)10-Jan-12 EUR 343,390 DKK 2,553,212 (128)10-Jan-12 EUR 9,104,988 GBP 7,807,901 (242,435)10-Jan-12 EUR 288,694 NOK 2,233,783 1,07210-Jan-12 EUR 1,136,740 SEK 10,328,503 (21,754)10-Jan-12 GBP 331,452 EUR 394,178 2,62920-Jan-12 CHF 4,828,370 EUR 3,935,852 31,72620-Jan-12 EUR 5,504,408 CHF 6,817,154 (97,399)20-Jan-12 EUR 2,923,515 DKK 21,752,191 (3,126)20-Jan-12 EUR 7,839,881 GBP 6,695,425 (174,391)20-Jan-12 EUR 1,631,267 SEK 14,984,580 (48,459)20-Jan-12 GBP 1,612,556 EUR 1,902,904 27,28920-Jan-12 NOK 16,538,392 EUR 2,108,682 19,84820-Jan-12 SEK 4,168,984 CHF 562,653 4,98620-Jan-12 SEK 21,031,363 EUR 2,287,079 70,47310-Feb-12 CHF 128,178 EUR 105,328 28
Total (481,975)
52

Transferable Securities Admitted to an Official Exchange Listing
Shares and Warrants
UNITED KINGDOM456,289 Aberdeen Asset Management 1,153,850 0.22
82,304 Anglo Pacific Group 272,035 0.05101,234 Antofagasta 1,475,743 0.28
200,000 Ashmore Group 799,700 0.15172,250 AstraZeneca 6,128,963 1.17119,843 Atkins (WS) 889,293 0.17524,987 Aviva 1,888,898 0.36
1,827,649 Barclays 3,851,421 0.74437,900 BBA Aviation 936,160 0.18164,006 Berendsen 853,522 0.16281,200 BHP Billiton 6,311,263 1.21278,593 Bodycote 879,621 0.17
2,224,044 BP 12,253,448 2.34239,500 British American Tobacco 8,770,604 1.68237,163 British Land 1,311,911 0.25135,677 British Sky Broadcasting Group 1,190,764 0.23
1,330,134 BT Group 3,041,099 0.581,551,158 Cable & Wireless Communications 707,428 0.14288,458 Capital Shopping Centres Group 1,079,315 0.21235,682 Carillion 851,227 0.16855,053 Centrica 2,961,296 0.57
82,183 Chesnara 172,083 0.03354,000 Cineworld Group 867,337 0.17
34,564 Clarkson 475,096 0.09611,401 Communisis 196,775 0.04
363,442 Compass Group 2,653,398 0.51196,893 Computacenter 789,516 0.1584,333 Costain Group 186,682 0.04
241,533 Dairy Crest Group 969,818 0.1966,121 De La Rue 704,208 0.14
947,930 Debenhams 663,969 0.13200,000 Diploma 816,822 0.16
151,867 Drax Group 990,095 0.19471,013 DS Smith 1,118,897 0.21262,105 F&C Asset Management 204,866 0.04197,732 Firstgroup 798,799 0.15
100,000 Galliford Try 569,692 0.11376,918 GKN 827,002 0.16
605,000 GlaxoSmithKline 10,657,549 2.0457,265 Go-Ahead Group 948,602 0.18178,811 Greene King 1,041,045 0.20171,899 Greggs 1,042,481 0.20263,721 Hammerson 1,136,428 0.22
829,740 Hansteen Holdings 758,817 0.15144,686 Hill & Smith Holdings 435,467 0.08
2,000,000 HSBC Holdings 11,760,219 2.25140,774 IG Group Holdings 810,068 0.1575,000 IMI 680,685 0.13
149,200 Imperial Tobacco Group 4,353,513 0.83187,154 Inmarsat 906,876 0.17288,651 Intermediate Capital Group 789,896 0.15275,321 International Personal Finance 562,880 0.11
407,750 International Power 1,648,940 0.32278,370 Interserve 1,065,900 0.20218,825 Investec 886,893 0.17391,755 ITE Group 962,749 0.18411,209 J Sainsbury 1,489,127 0.29104,097 Jardine Lloyd Thompson Group 860,009 0.16174,657 John Menzies 1,105,214 0.21
1,182,724 Kcom Group 992,697 0.1957,131 Kier Group 925,518 0.18
536,020 Kingfisher 1,608,660 0.31586,760 Ladbrokes 914,366 0.17125,868 Laird 231,485 0.05188,803 Land Securities Group 1,437,179 0.27
1,421,400 Legal & General Group 1,751,246 0.33675,212 London & Stamford Property 874,344 0.1774,500 London Stock Exchange Group 707,813 0.14
1,166,043 Lookers 710,358 0.1491,231 Majestic Wine 356,507 0.07
427,027 Marks & Spencer Group 1,587,313 0.30854,376 Marston’s 940,420 0.18205,092 Melrose 834,794 0.16203,750 Micro Focus International 941,918 0.18341,107 Mitie Group 995,522 0.19
145,000 Mondi 792,372 0.15842,537 Moneysupermarket.com Group 1,057,725 0.20305,874 Morgan Crucible 963,560 0.19271,478 N Brown Group 758,829 0.15
298,097 National Express Group 796,293 0.15528,560 National Grid 3,952,230 0.7698,400 New World Resources - A Shares 521,874 0.10
1,291,081 Old Mutual 2,097,726 0.40165,690 Pearson 2,399,483 0.46118,110 Pennon Group 1,008,658 0.19
222,347 Primary Health Properties 846,938 0.1674,014 Provident Financial 833,466 0.16
410,744 Prudential 3,137,671 0.6060,557 Rathbone Brothers 766,761 0.1595,325 Reckitt Benckiser Group 3,631,805 0.6934,593 Renishaw 414,401 0.08
300,693 Restaurant Group 1,069,109 0.20331,318 Rexam 1,397,172 0.27
259,074 RPC Group 1,110,820 0.211,054,916 RSA Insurance Group 1,330,031 0.25
192,068 Savills 749,701 0.14170,030 Scottish & Southern Energy 2,627,236 0.50
82,112 Severn Trent 1,468,834 0.28960,351 Sportingbet 365,081 0.07201,320 Standard Chartered 3,396,960 0.65572,485 Standard Life 1,411,354 0.27628,322 TalkTalk Telecom Group 1,016,749 0.20140,711 Tate & Lyle 1,187,350 0.2364,000 Telecom Plus 590,238 0.11
1,112,527 Tesco 5,375,290 1.03238,666 Tullett Prebon 771,132 0.15355,270 Unilever 9,198,778 1.76225,421 United Utilities Group 1,634,945 0.3134,168 Vitec Group 227,360 0.04
5,940,000 Vodafone Group 12,727,223 2.43168,423 WH Smith 1,068,791 0.20403,140 William Hill 978,178 0.19514,077 WM Morrison Supermarkets 2,007,525 0.3873,536 Workspace Group 199,532 0.04
206,215,295 39.45
FRANCE11,678 Affine 145,566 0.03
261,881 AXA 2,611,608 0.50136,928 BNP Paribas 4,137,279 0.79
44,141 Bouygues 1,073,840 0.2116,707 Euler Hermès 762,591 0.1516,718 Foncière Des Régions 831,762 0.1612,827 Gecina 827,277 0.16
29,839 GL Events 401,782 0.0812,088 ICADE 706,664 0.1319,200 Mercialys 475,392 0.0919,345 Neopost 1,014,645 0.1934,586 Rallye 741,783 0.14
143,023 Sanofi 8,058,631 1.5469,997 SCOR 1,256,271 0.2415,614 Société de la Tour Eiffel 563,587 0.119,657 Société Internationale de Plantations d’Heveas 532,970 0.10
257,268 Total 10,119,637 1.9415,749 Unibail-Rodamco 2,169,818 0.4163,172 Vinci 2,112,314 0.40
193,320 Vivendi 3,248,259 0.62
41,791,676 7.99
GERMANY61,830 Allianz Registered Shares 4,558,417 0.8795,391 Alstria Office REIT 873,877 0.1720,200 Amadeus Fire 539,340 0.10114,395 BASF 6,145,871 1.18
13,831 Bilfinger Berger 904,755 0.1725,107 Cewe Color Holding 782,397 0.15
96,969 Comdirect Bank 724,358 0.14121,706 Daimler Registered Shares 4,126,746 0.79
13,136 Delticom 874,595 0.1740,414 Deutsche Boerse 1,633,029 0.3130,331 Deutsche Euroshop 756,152 0.14
101,800 Deutsche Lufthansa Registered Shares 931,979 0.18171,206 Deutsche Post Registered Shares 2,040,776 0.39392,416 Deutsche Telekom Registered Shares 3,470,723 0.66134,227 Drillisch 949,790 0.18238,939 E.ON 3,962,206 0.76108,197 Freenet 1,083,052 0.21
3,834 Generali Deutschland Holding 209,950 0.0434,107 Hannover Rueckversicherung Registered Shares 1,309,368 0.25
8,522 Hochtief 377,418 0.0715,390 Hugo Boss Preference Shares 877,846 0.17
53
JPMorgan Investment Funds - Europe Strategic Dividend Fund
Schedule of Investments (Market Value Expressed in EUR)
As at 31 December 2011
Quantity/Nominal
Value
Name of Securities Maturity/Coupon
MarketValue
%of
NetAssets
Quantity/Nominal
Value
Name of Securities Maturity/Coupon
MarketValue
%of
NetAssets

38,313 Indus Holding 726,989 0.1457,296 ProSiebenSat.1 Media Preference Shares 803,433 0.1549,893 RWE 1,346,737 0.26
40,009,804 7.65
SWITZERLAND19,296 Baloise Holding Registered Shares 1,021,331 0.20
2,736 Banque Cantonale Vaudoise Registered Shares 1,032,871 0.205,345 Bossard Holding - Bearer Shares 447,034 0.085,382 Inficon Holding Registered Shares 672,539 0.13
377,400 Nestlé Registered Shares 16,735,520 3.20114,200 Novartis Registered Shares 5,028,930 0.9616,664 Orior 666,050 0.1322,130 Roche Holding - Genussschein 2,889,925 0.5561,437 Swiss Re 2,403,106 0.464,568 Swisscom Registered Shares 1,326,286 0.253,115 Valora Holding Registered Shares 500,962 0.09
11,033 Vontobel Holding Registered Shares 190,579 0.04953 Walter Meier Registered Shares 162,972 0.03
21,490 Zurich Financial Services 3,748,272 0.72
36,826,377 7.04
NETHERLANDS50,920 Accell Group 717,208 0.1468,533 Delta Lloyd 886,988 0.1725,716 Eurocommercial Properties - CVA 627,149 0.12
28,488 Exact Holding 480,308 0.0935,120 Koninklijke Boskalis Westminster 996,267 0.1932,323 Koninklijke DSM 1,161,365 0.22
257,611 Koninklijke KPN 2,381,356 0.46162,114 Koninklijke Philips Electronics 2,630,300 0.5024,412 Macintosh Retail Group 253,580 0.0558,962 Mediq 691,477 0.1314,293 Nieuwe Steen Investment Funds
- Warrants 01.04.13 1 0.0041,236 Nieuwe Steen Investment Funds 384,093 0.0839,078 Randstad Holding 897,329 0.17
701,700 Royal Dutch Shell - B Shares 20,615,662 3.9471,416 SBM Offshore 1,137,478 0.2210,016 TKH Group - Dutch Certificates 162,835 0.0319,674 Vastned Retail 679,442 0.1376,360 Wolters Kluwer 1,015,588 0.19
35,718,426 6.83
SPAIN113,703 Abertis Infraestructuras 1,395,989 0.2716,544 Acciona 1,106,380 0.2146,700 ACS Actividades de Construccion y Servicios 1,066,861 0.2097,507 Almirall 522,638 0.10
609,312 BBVA 3,989,470 0.7648,433 Bolsas y Mercados Españoles 1,005,106 0.19
174,190 Duro Felguera 878,789 0.1759,041 Ebro Foods 843,991 0.1680,273 Enagas 1,140,679 0.2248,452 Endesa 766,632 0.15
155,366 Ferrovial 1,446,535 0.2853,295 Fomento de Construcciones y Contratas 1,065,367 0.20
101,815 Gas Natural SDG 1,362,539 0.2654,892 Grupo Catalana Occidente 664,742 0.13
360,286 Grupo Empresarial Ence 621,493 0.12607,818 Iberdrola 2,919,350 0.56
85,705 Indra Sistemas 842,137 0.16465,390 Mapfre 1,142,998 0.22
37,071 Red Eléctrica 1,216,670 0.23131,839 Repsol YPF 3,117,992 0.6091,390 Zardoya Otis 963,708 0.18
28,080,066 5.37
FINLAND36,404 Ahlstrom 453,958 0.0992,649 Amer Sports - A Shares 838,010 0.1683,396 Elisa 1,330,583 0.2540,639 Fiskars 562,647 0.11
100,427 Fortum 1,638,467 0.31287,268 F-Secure 573,100 0.11109,944 Huhtamaki 1,004,888 0.19
81,897 Kemira 748,375 0.1439,048 Kesko - B Shares 995,138 0.1945,296 Metso 1,275,988 0.25
121,640 Neste Oil 938,453 0.18625,213 Nokia 2,328,918 0.4566,656 Orion - B Shares 997,507 0.1964,141 PKC Group 735,377 0.14
127,384 Pohjola Bank - A Shares 946,208 0.18
90,785 Ramirent 490,693 0.1092,323 Sampo - A Shares 1,736,134 0.3384,218 Sanoma 737,960 0.14
292,407 Sponda 905,000 0.17219,402 Stora Enso - R Shares 1,002,228 0.19148,346 Technopolis 482,124 0.09
74,733 Tieto 825,426 0.1652,617 Tikkurila 668,236 0.13
137,032 UPM-Kymmene 1,156,208 0.2261,227 Wartsila 1,366,893 0.2657,365 YIT 705,303 0.14
25,443,822 4.87
ITALY1,053,996 A2A 774,424 0.15
51,850 ACEA 249,658 0.05111,652 Atlantia 1,372,203 0.2678,394 Autostrada Torino-Milano 590,111 0.11
104,824 Banca Generali 751,850 0.14192,257 Benetton Group 575,810 0.11100,578 Cairo Communication 283,429 0.05979,859 Enel 3,043,442 0.58332,198 ENI 5,283,609 1.01679,970 Hera 743,547 0.14530,874 Immobiliare Grande Distribuzione 386,344 0.07177,573 Indesit 664,833 0.1353,829 Industria Macchine Automatiche 710,812 0.1463,887 Lottomatica 740,450 0.14112,287 MARR 728,743 0.14
312,999 Mediolanum 940,562 0.18138,529 Recordati 775,070 0.1526,884 SAVE 164,328 0.03
426,335 Snam Rete Gas 1,438,028 0.2758,894 Societa Iniziative Autostradali e Servizi 342,027 0.07350,161 Sogefi 654,626 0.13
2,704,292 Telecom Italia 2,240,506 0.4339,500 Vittoria Assicurazioni 118,421 0.0295,167 Zignago Vetro 427,871 0.08
24,000,704 4.58
SWEDEN30,051 Axfood 857,134 0.1663,787 Betsson 1,086,327 0.21
64,444 Bilia - A Shares 687,078 0.13124,351 Billerud 812,915 0.16135,155 Boliden 1,525,155 0.29
103,300 Duni 624,579 0.12111,007 Haldex 313,320 0.06161,653 HIQ International 522,488 0.1063,125 NCC - B Shares 855,792 0.16
442,448 Nordea Bank 2,632,950 0.50113,280 Svenska Cellulosa - B Shares 1,287,206 0.2573,837 Svenska Handelsbanken - A Shares 1,508,566 0.29
170,220 Swedbank - A Shares 1,691,127 0.3299,717 Tele2 - B Shares 1,486,724 0.29
15,891,361 3.04
NORWAY53,472 Aker - A Shares 1,058,899 0.20
114,727 Atea 881,063 0.176,675 Bonheur 97,795 0.02
86,447 Cermaq 774,391 0.15205,113 DnB NOR 1,546,136 0.3031,678 Fred Olsen Energy 814,592 0.16
139,727 Gjensidige Forsikring 1,238,174 0.24255,506 Orkla 1,460,335 0.2864,914 Sparebank 1 Nord-Norge 268,384 0.05
101,288 SpareBank 1 SMN 508,787 0.1061,359 SpareBank 1 SR Bank 322,047 0.06
170,644 Statoil 3,361,658 0.64164,359 Statoil Fuel & Retail 939,282 0.17163,768 Telenor 2,055,003 0.39
15,326,546 2.93
BELGIUM783,518 Ageas 938,655 0.1844,059 Arseus 485,090 0.1051,678 Belgacom 1,243,631 0.2422,757 Compagnie Maritime Belge 385,617 0.07
34,360 Elia System Operator 1,025,818 0.2018,732 EVS Broadcast Equipement 736,823 0.1422,669 Gimv 832,632 0.1621,296 Mobistar 856,365 0.1619,658 Recticel 90,623 0.02
54
JPMorgan Investment Funds - Europe Strategic Dividend Fund
Schedule of Investments (Market Value Expressed in EUR) (continued)
As at 31 December 2011
Quantity/Nominal
Value
Name of Securities Maturity/Coupon
MarketValue
%of
NetAssets
Quantity/Nominal
Value
Name of Securities Maturity/Coupon
MarketValue
%of
NetAssets

30,814 Telenet Group Holding 898,613 0.1730,113 Tessenderlo Chemie 624,092 0.12
1,145 Tessenderlo Chemie 92 0.0020,855 Warehouses De Pauw 788,319 0.15
8,906,370 1.71
BERMUDA219,501 Catlin Group 1,048,636 0.20
1,057,911 Golden Ocean Group 518,462 0.1010,770 HAL Trust 913,404 0.18
217,758 Hiscox 974,475 0.19122,171 Lancashire Holdings 1,056,870 0.2075,604 Seadrill 1,943,651 0.3727,413 Stolt-Nielsen 419,279 0.08
6,874,777 1.32
PORTUGAL285,206 Brisa-Auto Estradas de Portugal 731,126 0.14188,653 Cimpor Cimentos de Portugal SGPS Registered
Shares 982,033 0.19608,558 EDP - Energias de Portugal 1,439,240 0.27346,743 Mota-Engil SGPS 359,052 0.07431,722 Portucel Empresa Produtora de Pasta e Papel 788,972 0.15238,102 REN - Redes Energeticas Nacionais 498,467 0.10
1,359,019 Sonae 621,072 0.12302,871 Zon Multimedia Servicos de Telecomunicacoes e
Multimedia SGPS 701,146 0.13
6,121,108 1.17
DENMARK90,387 Pandora 655,170 0.1226,074 Royal UNIBREW 1,132,231 0.22
3,061 SimCorp 363,445 0.07199,987 TDC 1,241,347 0.24
3,392,193 0.65
AUSTRIA54,615 EVN 585,746 0.1137,447 Oesterreichische Post 871,298 0.1747,380 OMV 1,101,822 0.2125,744 Semperit Holding 763,824 0.15
3,322,690 0.64
JERSEY668,699 Beazley 1,079,685 0.21181,226 Cape 709,551 0.13206,101 Informa 890,353 0.17
2,679,589 0.51
GREECE117,419 Hellenic Exchanges Holding Clearing Settlement and
Registry 336,993 0.06140,753 Hellenic Petroleum 890,263 0.1748,076 Metka 283,168 0.06116,465 Motor Oil Hellas Corinth Refineries 691,802 0.13108,351 Public Power 406,316 0.08
2,608,542 0.50
LUXEMBOURG12,525 RTL Group 934,991 0.18
80,694 SES 1,487,392 0.29
2,422,383 0.47
GUERNSEY496,307 Resolution 1,497,202 0.29
1,497,202 0.29
IRELAND45,544 FBD Holdings 292,734 0.06716,756 Total Produce 268,784 0.05414,405 United Drug 832,954 0.16
1,394,472 0.27
CYPRUS162,091 ProSafe 855,651 0.16
855,651 0.16
GABONESE REPUBLIC1,915 Total Gabon 566,160 0.11
566,160 0.11
FAROE ISLANDS113,134 Bakkafrost 535,505 0.10
535,505 0.10
ISLE OF MAN623,672 Shaft Sinkers Holdings 399,508 0.08
399,508 0.08
CAYMAN ISLANDS59,636 Phoenix Group Holdings 373,980 0.07
373,980 0.07
Total Shares and Warrants 511,254,207 97.80
Total Transferable Securities Admitted to anOfficial Exchange Listing
511,254,207 97.80
Transferable Securities Dealt in on Another Regulated Market
Investment Funds
LUXEMBOURG7,800,000 JPMorgan Liquidity Funds - Euro Liquidity Fund (JPM
Euro Liquidity X (dist)) 7,800,000 1.49
7,800,000 1.49
Total Investment Funds 7,800,000 1.49
Total Transferable Securities Dealt in on AnotherRegulated Market
7,800,000 1.49
Total Investments 519,054,207 99.29
Cash 1,514,174 0.29
Other Assets/(Liabilities) 2,194,765 0.42
Total Net Assets 522,763,146 100.00
55
JPMorgan Investment Funds - Europe Strategic Dividend Fund
Schedule of Investments (Market Value Expressed in EUR) (continued)
As at 31 December 2011
Quantity/Nominal
Value
Name of Securities Maturity/Coupon
MarketValue
%of
NetAssets
Quantity/Nominal
Value
Name of Securities Maturity/Coupon
MarketValue
%of
NetAssets

Allocation of Portfolio as at 31 December 2011 % ofNet Assets
Shares and WarrantsFinancials 22.78Energy 12.30Consumer Staples 11.92Industrials 9.50Consumer Discretionary 8.66Telecommunication Services 8.20Utilities 7.63Health Care 7.09Materials 6.32Information Technology 3.40Investment Companies 1.49Total Shares and Warrants 99.29Cash and Other Assets/(Liabilities) 0.71
Total 100.00
Allocation of Portfolio as at 30 June 2011 (Unaudited) % ofNet Assets
Shares and RightsFinancials 25.89Industrials 11.07Energy 9.84Consumer Discretionary 9.52Consumer Staples 9.25Utilities 6.83Materials 6.72Health Care 6.32Telecommunication Services 5.94Information Technology 2.63Total Shares and Rights 94.01Cash and Other Assets/(Liabilities) 5.99
Total 100.00
56
JPMorgan Investment Funds - Europe Strategic Dividend Fund
Schedule of Investments (Market Value Expressed in EUR) (continued)
As at 31 December 2011
Quantity/Nominal
Value
Name of Securities Maturity/Coupon
MarketValue
%of
NetAssets
Quantity/Nominal
Value
Name of Securities Maturity/Coupon
MarketValue
%of
NetAssets

JPMorgan Investment Funds - Europe Strategic Dividend Fund
Schedule of Investments - Outstanding Financial Futures Contracts (Expressed in EUR)
As at 31 December 2011
ExpirationDate
Number ofContracts Security Description Currency
NotionalValue
UnrealisedGain/(Loss)
Equity Futures
Mar-12 370 DJ Euro Stoxx 50 Index Future EUR 8,504,450 75,850
Total 75,850
Schedule of Investments - Outstanding Forward Foreign Exchange Contracts (Expressed in EUR)
SettlementDate Currency
AmountPurchased Currency
AmountSold
UnrealisedGain/(Loss)
23-Feb-12 CHF 38,373,180 EUR 31,541,069 4,33723-Feb-12 DKK 57,922,654 EUR 7,802,376 (8,852)23-Feb-12 EUR 54,778,230 GBP 46,053,347 (310,077)23-Feb-12 EUR 10,031,207 NOK 78,010,302 7,82723-Feb-12 GBP 8,336,183 EUR 9,947,143 24,47123-Feb-12 SEK 75,690,086 EUR 8,391,412 76,730
Total (205,564)
57
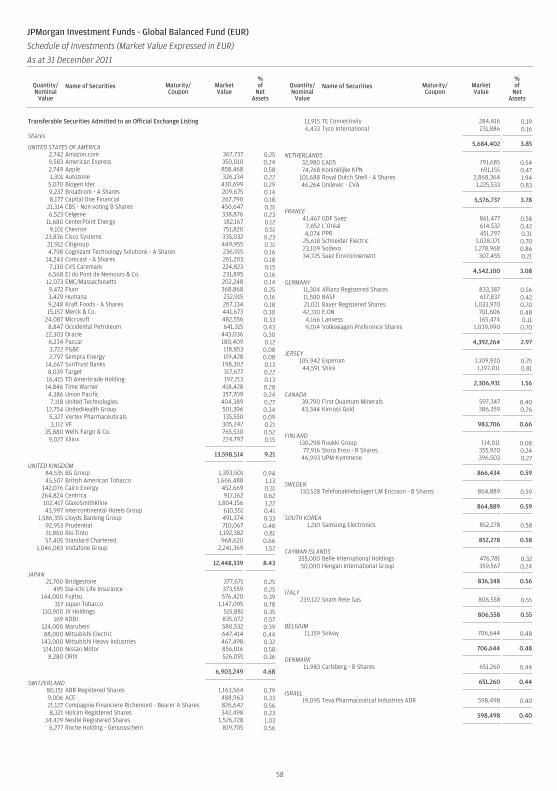
Transferable Securities Admitted to an Official Exchange Listing
Shares
UNITED STATES OF AMERICA2,742 Amazon.com 367,737 0.259,583 American Express 350,010 0.242,749 Apple 858,468 0.581,301 Autozone 326,134 0.22
5,070 Biogen Idec 430,699 0.299,237 Broadcom - A Shares 209,675 0.148,177 Capital One Financial 267,790 0.18
21,314 CBS - Non voting B Shares 450,647 0.316,523 Celgene 338,876 0.23
11,680 CenterPoint Energy 182,167 0.129,101 Chevron 751,820 0.51
23,836 Cisco Systems 335,032 0.2321,912 Citigroup 449,955 0.314,798 Cognizant Technology Solutions - A Shares 236,915 0.16
14,243 Comcast - A Shares 261,203 0.187,130 CVS Caremark 224,823 0.156,568 EI du Pont de Nemours & Co. 231,895 0.16
12,073 EMC/Massachusetts 202,248 0.149,472 Fluor 368,868 0.253,429 Humana 232,915 0.169,248 Kraft Foods - A Shares 267,134 0.1815,157 Merck & Co. 441,673 0.30
24,087 Microsoft 482,556 0.338,847 Occidental Petroleum 641,315 0.43
22,303 Oracle 443,036 0.306,234 Paccar 180,409 0.123,722 PG&E 118,853 0.082,797 Sempra Energy 119,428 0.08
14,667 SunTrust Banks 198,302 0.138,039 Target 317,677 0.2216,415 TD Ameritrade Holding 197,213 0.1314,846 Time Warner 418,428 0.284,386 Union Pacific 357,709 0.247,118 United Technologies 404,389 0.27
12,754 UnitedHealth Group 501,396 0.345,327 Vertex Pharmaceuticals 135,550 0.093,112 VF 305,242 0.21
35,880 Wells Fargo & Co. 765,530 0.529,027 Xilinx 224,797 0.15
13,598,514 9.21
UNITED KINGDOM84,535 BG Group 1,393,501 0.9445,507 British American Tobacco 1,666,488 1.13
142,076 Cairn Energy 452,669 0.31264,824 Centrica 917,162 0.62102,417 GlaxoSmithKline 1,804,156 1.2243,997 Intercontinental Hotels Group 610,551 0.41
1,586,355 Lloyds Banking Group 491,374 0.3392,953 Prudential 710,067 0.4831,860 Rio Tinto 1,192,382 0.8157,405 Standard Chartered 968,620 0.66
1,046,083 Vodafone Group 2,241,369 1.52
12,448,339 8.43
JAPAN21,700 Bridgestone 377,671 0.25
495 Dai-ichi Life Insurance 373,559 0.25144,000 Fujitsu 576,420 0.39
317 Japan Tobacco 1,147,095 0.78110,900 JX Holdings 515,881 0.35
169 KDDI 835,072 0.57124,000 Marubeni 580,532 0.3988,000 Mitsubishi Electric 647,414 0.44
143,000 Mitsubishi Heavy Industries 467,498 0.32124,100 Nissan Motor 856,016 0.58
8,280 ORIX 526,091 0.36
6,903,249 4.68
SWITZERLAND80,151 ABB Registered Shares 1,163,564 0.799,006 ACE 488,963 0.3321,127 Compagnie Financiere Richemont - Bearer A Shares 826,642 0.568,321 Holcim Registered Shares 342,498 0.23
34,429 Nestlé Registered Shares 1,526,728 1.036,277 Roche Holding - Genussschein 819,705 0.56
11,915 TE Connectivity 284,416 0.196,433 Tyco International 231,886 0.16
5,684,402 3.85
NETHERLANDS32,980 EADS 791,685 0.5474,768 Koninklijke KPN 691,155 0.47
101,688 Royal Dutch Shell - A Shares 2,868,364 1.9446,264 Unilever - CVA 1,225,533 0.83
5,576,737 3.78
FRANCE41,467 GDF Suez 861,477 0.58
7,652 L’Oréal 614,532 0.424,074 PPR 451,297 0.31
25,618 Schneider Electric 1,028,371 0.7023,109 Sodexo 1,278,968 0.8634,725 Suez Environnement 307,455 0.21
4,542,100 3.08
GERMANY11,304 Allianz Registered Shares 833,387 0.5611,500 BASF 617,837 0.4221,021 Bayer Registered Shares 1,033,970 0.7042,310 E.ON 701,606 0.484,166 Lanxess 165,474 0.119,014 Volkswagen Preference Shares 1,039,990 0.70
4,392,264 2.97
JERSEY105,942 Experian 1,109,920 0.7544,591 Shire 1,197,011 0.81
2,306,931 1.56
CANADA39,790 First Quantum Minerals 597,347 0.4043,344 Kinross Gold 386,359 0.26
983,706 0.66
FINLAND130,298 Ruukki Group 114,011 0.08
77,916 Stora Enso - R Shares 355,920 0.2446,993 UPM-Kymmene 396,503 0.27
866,434 0.59
SWEDEN110,528 Telefonaktiebolaget LM Ericsson - B Shares 864,889 0.59
864,889 0.59
SOUTH KOREA1,210 Samsung Electronics 852,278 0.58
852,278 0.58
CAYMAN ISLANDS355,000 Belle International Holdings 476,781 0.3250,000 Hengan International Group 359,567 0.24
836,348 0.56
ITALY239,122 Snam Rete Gas 806,558 0.55
806,558 0.55
BELGIUM11,159 Solvay 706,644 0.48
706,644 0.48
DENMARK11,983 Carlsberg - B Shares 651,260 0.44
651,260 0.44
ISRAEL19,095 Teva Pharmaceutical Industries ADR 598,498 0.40
598,498 0.40
58
JPMorgan Investment Funds - Global Balanced Fund (EUR)
Schedule of Investments (Market Value Expressed in EUR)
As at 31 December 2011
Quantity/Nominal
Value
Name of Securities Maturity/Coupon
MarketValue
%of
NetAssets
Quantity/Nominal
Value
Name of Securities Maturity/Coupon
MarketValue
%of
NetAssets

CURACAO10,635 Schlumberger 554,875 0.38
554,875 0.38
TAIWAN120,741 Hon Hai Precision Industry Registered Shares GDR 513,688 0.34
513,688 0.34
IRELAND9,619 Covidien 334,799 0.23
334,799 0.23
HONG KONG250,000 China Overseas Land & Investment 321,379 0.22
321,379 0.22
CHINA193,000 China Merchants Bank - H Shares * 300,367 0.20
300,367 0.20
PANAMA8,485 Carnival 214,928 0.15
214,928 0.15
BERMUDA1,879 Everest Re Group 122,963 0.08
122,963 0.08
Total Shares 64,982,150 44.01
Bonds
GERMANY5,500,000 Germany (Federal Republic of) 04.01.12/5.000% 5,500,825 3.735,000,000 Germany (Federal Republic of) 11.10.13/4.000% 5,342,425 3.621,000,000 Germany (Federal Republic of) 04.01.24/6.250% 1,441,936 0.971,000,000 Germany (Federal Republic of) 04.01.28/5.625% 1,429,012 0.97
660,000 Germany (Federal Republic of) 04.07.34/4.750% 918,229 0.62
14,632,427 9.91
ITALY6,000,000 Italy Buoni Poliennali Del Tesoro 01.11.15/3.000% 5,456,160 3.702,500,000 Italy Buoni Poliennali Del Tesoro 01.09.21/4.750% 2,173,522 1.47
7,629,682 5.17
UNITED KINGDOM1,540,000 UK Treasury 07.12.15/8.000% 2,369,765 1.611,000,000 UK Treasury 25.08.17/8.750% 1,698,609 1.151,430,000 UK Treasury 07.06.32/4.250% 2,088,341 1.41
6,156,715 4.17
FRANCE332,000 France (Government of) 25.07.32/3.150% 496,472 0.33700,000 France (Government of) 25.04.35/4.750% 821,410 0.56
1,317,882 0.89
JAPAN35,000,000 Development Bank of Japan 20.09.22/1.700% 367,741 0.24
367,741 0.24
Total Bonds 30,104,447 20.38
Total Transferable Securities Admitted to anOfficial Exchange Listing
95,086,597 64.39
Transferable Securities Dealt in on Another Regulated Market
Bonds
UNITED STATES OF AMERICA7,000,000 US Treasury 15.02.12/4.875% 5,423,460 3.677,400,000 US Treasury 15.02.15/4.000% 6,328,844 4.292,000,000 US Treasury 15.11.18/9.000% 2,328,493 1.582,300,000 US Treasury 15.08.29/6.125% 2,683,027 1.816,000,000 US Treasury 31.10.14/2.375% 4,880,699 3.311,700,000 US Treasury 15.08.41/3.750% 1,537,005 1.047,000,000 US Treasury 15.08.13/4.250% 5,741,019 3.894,500,000 US Treasury 15.11.16/7.500% 4,568,241 3.09
5,800,000 US Treasury 15.02.19/8.875% 6,771,480 4.59
40,262,268 27.27
Total Bonds 40,262,268 27.27
Investment Funds
LUXEMBOURG437,913 JPMorgan Funds - Emerging Markets Equity Fund
(JPM Emerging Markets Equity X (dist) - USD) 5,593,460 3.794,924,198 JPMorgan Liquidity Funds - Euro Liquidity Fund (JPM
Euro Liquidity X (dist)) 4,924,198 3.33
10,517,658 7.12
Total Investment Funds 10,517,658 7.12
Total Transferable Securities Dealt in on AnotherRegulated Market
50,779,926 34.39
Total Investments 145,866,523 98.78
Cash 2,627,535 1.78
Other Assets/(Liabilities) (831,407) (0.56)
Total Net Assets 147,662,651 100.00
* Hong Kong Registered Shares.
59
JPMorgan Investment Funds - Global Balanced Fund (EUR)
Schedule of Investments (Market Value Expressed in EUR) (continued)
As at 31 December 2011
Quantity/Nominal
Value
Name of Securities Maturity/Coupon
MarketValue
%of
NetAssets
Quantity/Nominal
Value
Name of Securities Maturity/Coupon
MarketValue
%of
NetAssets

Allocation of Portfolio as at 31 December 2011 % ofNet Assets
Fixed Income SecuritiesUnited States of America 27.27Germany 9.91Italy 5.17United Kingdom 4.17France 0.89Japan 0.24Total Fixed Income Securities 47.65SharesIndustrials 5.55Consumer Discretionary 5.07Financials 4.98Consumer Staples 4.96Health Care 4.87Energy 4.86Information Technology 4.28Materials 4.16Utilities 2.72Telecommunication Services 2.56Total Shares 44.01Investment FundsLuxembourg 7.12Total Investment Funds 7.12Cash and Other Assets/(Liabilities) 1.22
Total 100.00
Allocation of Portfolio as at 30 June 2011 (Unaudited) % ofNet Assets
Fixed Income SecuritiesUnited States of America 22.16Germany 10.17United Kingdom 5.51France 2.09Netherlands 1.16Japan 0.20Total Fixed Income Securities 41.29SharesFinancials 6.59Materials 5.80Consumer Discretionary 5.50Health Care 5.30Industrials 5.18Investment Companies 4.74Energy 4.36Consumer Staples 3.82Information Technology 3.63Utilities 2.54Telecommunication Services 2.11Total Shares 49.57Cash Equivalents, Cash and Other Assets/(Liabilities) 9.14
Total 100.00
60
JPMorgan Investment Funds - Global Balanced Fund (EUR)
Schedule of Investments (Market Value Expressed in EUR) (continued)
As at 31 December 2011
Quantity/Nominal
Value
Name of Securities Maturity/Coupon
MarketValue
%of
NetAssets
Quantity/Nominal
Value
Name of Securities Maturity/Coupon
MarketValue
%of
NetAssets

JPMorgan Investment Funds - Global Balanced Fund (EUR)
Schedule of Investments - Outstanding Financial Futures Contracts (Expressed in EUR)
As at 31 December 2011
ExpirationDate
Number ofContracts Security Description Currency
NotionalValue
UnrealisedGain/(Loss)
Bond Futures
Mar-12 8 Canada 10 Year Bond Future CAD 809,200 514Mar-12 (3) Euro-Bund Future EUR (416,835) (75)Mar-12 (55) Euro-Schatz Future EUR (6,069,113) 1,238Mar-12 16 Japan 10 Year Bond Future JPY 22,745,340 22,359Mar-12 (7) Long Gilt Future GBP (980,198) 922Mar-12 (37) US 2 Year Note Future USD (6,284,975) (668)Mar-12 (54) US 5 Year Note Future USD (5,123,569) (3,087)Mar-12 (32) US 10 Year Note Future USD (3,228,882) (3,274)
Total Bond Futures 17,929
Equity Futures
Mar-12 9 Dax Index Future EUR 1,327,500 (1,688)Mar-12 (97) DJ Euro Stoxx 50 Index Future EUR (2,229,545) (19,885)Mar-12 (43) FTSE 100 Index Future GBP (2,850,231) (14,158)Mar-12 (27) Russell 2000 Mini Future USD (1,542,976) 31,097Mar-12 166 SP 500 Emini Future USD 8,037,518 (2,558)Mar-12 72 Topix Index Future JPY 5,232,339 46,717
Total Equity Futures 39,525
Total 57,454
Schedule of Investments - Outstanding Forward Foreign Exchange Contracts (Expressed in EUR)
SettlementDate Currency
AmountPurchased Currency
AmountSold
UnrealisedGain/(Loss)
11-Jan-12 CHF 3,684,305 EUR 2,995,821 31,26811-Jan-12 CHF 715,355 NOK 4,541,997 2,94711-Jan-12 CHF 722,609 USD 766,857 2,96711-Jan-12 EUR 794,562 CAD 1,106,901 (41,714)11-Jan-12 EUR 4,174,062 CHF 5,128,873 (39,909)11-Jan-12 EUR 8,585,769 GBP 7,342,374 (204,192)11-Jan-12 EUR 1,280,870 HKD 13,540,933 (62,210)11-Jan-12 EUR 803,397 JPY 83,665,063 (31,816)11-Jan-12 EUR 1,844,780 SEK 16,819,308 (41,640)11-Jan-12 EUR 35,875,180 USD 48,865,643 (1,768,040)11-Jan-12 GBP 1,654,840 EUR 1,929,789 51,31211-Jan-12 HKD 1,946,451 USD 249,906 54911-Jan-12 JPY 150,248,112 EUR 1,432,433 67,46611-Jan-12 JPY 48,178,925 GBP 402,094 (408)11-Jan-12 JPY 130,607,676 USD 1,683,332 7,09211-Jan-12 NOK 14,670,484 EUR 1,886,981 1,90711-Jan-12 SEK 9,264,365 EUR 1,025,759 13,31411-Jan-12 SEK 4,039,759 JPY 47,597,768 (22,068)11-Jan-12 USD 630,509 CHF 577,792 10,98311-Jan-12 USD 4,663,582 EUR 3,446,599 145,95111-Jan-12 USD 2,017,255 JPY 157,282,193 (16,144)
Total (1,892,385)
61

Transferable Securities Admitted to an Official Exchange Listing
Shares
UNITED STATES OF AMERICA725 1st Source 18,411 0.01
5,175 ACCO Brands 50,197 0.022,875 Achillion Pharmaceuticals 22,382 0.011,650 Acorda Therapeutics 39,212 0.021,025 Acuity Brands 54,176 0.021,725 Advance America Cash Advance Centers 15,352 0.012,293 Aegerion Pharmaceuticals 37,296 0.022,850 Affiliated Managers Group 274,911 0.116,475 Affymetrix 27,033 0.011,025 AGCO 44,090 0.02900 Agilysys 7,159 0.00984 AGL Resources 42,061 0.02950 AGL Resources 40,608 0.02625 Agree Realty 15,341 0.01
1,675 Albemarle 86,757 0.042,425 Alere 56,624 0.02
450 Alexander & Baldwin 18,652 0.011,725 Alliance Data Systems 179,555 0.07
6,450 Alliance HealthCare Services 6,901 0.001,500 Alliant Energy 66,622 0.03
700 Allied Nevada Gold 21,651 0.01500 Alon USA Energy 4,397 0.00800 Alpha Natural Resources 16,156 0.01
6,235 Amazon.com 1,085,420 0.445,450 American Capital 37,251 0.023,400 American Capital Agency 96,169 0.042,075 American Dental Partners 39,114 0.025,625 American Eagle Outfitters 86,203 0.044,700 American Equity Investment Life Holding 48,997 0.0219,501 American Express 924,542 0.384,925 American Financial Group 183,284 0.084,225 American Greetings - A Shares 53,784 0.025,675 American Reprographics 26,360 0.01
925 American Water Works 29,827 0.011,700 AMERIGROUP 102,875 0.043,575 Ameristar Casinos 61,973 0.03
675 Ametek 28,286 0.01200 Ampco-Pittsburgh 3,869 0.00
6,425 Amylin Pharmaceuticals 74,883 0.03250 Ancestry.com 5,736 0.00600 AngioDynamics 8,901 0.00
3,625 Anthera Pharmaceuticals 21,170 0.016,350 Anworth Mortgage Asset 40,100 0.024,292 Apartment Investment & Management - A Shares 98,630 0.045,497 Apple 2,228,264 0.911,200 Applied Industrial Technologies 42,960 0.02
825 Aqua America 18,426 0.012,700 Arctic Cat 61,668 0.03
275 Arden Group 25,303 0.011,075 Argan 16,383 0.01
4,600 Ariad Pharmaceuticals 55,959 0.021,100 Arkansas Best 21,208 0.014,525 Arqule 25,589 0.011,274 Arris Group 13,855 0.011,325 Arrow Electronics 49,297 0.02
275 Arthur J Gallagher & Co. 9,251 0.001,500 Ashford Hospitality Trust 12,150 0.002,050 Ashland 117,947 0.055,050 Aspen Technology 86,658 0.042,325 Associated Banc-Corp 26,052 0.01
250 Associated Estates Realty 4,009 0.001,075 Astoria Financial 9,175 0.00
650 ATMI 13,201 0.011,300 Atmos Energy 44,011 0.02
225 Atwood Oceanics 9,045 0.001,750 Autoliv 94,824 0.042,925 Autozone 951,780 0.391,000 AVEO Pharmaceuticals 17,225 0.011,075 Avnet 33,578 0.01
450 AVX 5,740 0.001,400 B&G Foods - A Shares 33,936 0.012,925 Ball 104,788 0.041,650 Bancfirst 61,636 0.033,525 Bancorpsouth 39,022 0.02
900 Bank of Hawaii 40,270 0.02250 BankFinancial 1,369 0.00725 Banner 12,528 0.01
1,700 Barnes & Noble 24,225 0.011,466 Barrett Business Services 29,085 0.011,282 BBCN Bancorp 12,128 0.00
625 BE Aerospace 24,237 0.01
800 Big Lots 30,472 0.01350 Biglari Holdings 130,552 0.05
6,125 BioCryst Pharmaceuticals 14,363 0.0111,703 Biogen Idec 1,290,490 0.533,625 BioMarin Pharmaceuticals 124,102 0.05
725 BioMed Realty Trust 13,351 0.011,575 Black Box 45,462 0.021,275 Blyth 74,250 0.03
975 Boingo Wireless 8,356 0.00275 BOK Financial 15,172 0.01975 Booz Allen Hamilton Holding 16,804 0.01
6,725 Brandywine Realty Trust 64,863 0.036,625 Brightpoint 71,517 0.033,600 Brinker International 96,732 0.0423,110 Broadcom - A Shares 680,936 0.281,925 Broadridge Financial Solutions 43,293 0.02
12,350 Brocade Communications Systems 64,529 0.031,125 Brooks Automation 11,790 0.01
2,025 Brunswick 36,814 0.021,050 Buckeye Technologies 35,768 0.011,450 Build-A-Bear Workshop 12,245 0.01
425 CACI International - A Shares 23,704 0.019,875 Cadence Design Systems 103,046 0.04
16,750 Cal Dive International 37,520 0.021,150 Camden Property Trust 71,990 0.03
21,101 Capital One Financial 897,004 0.371,975 CapitalSource 13,539 0.01
225 Capitol Federal Financial 2,595 0.006,075 Capstead Mortgage 76,120 0.035,900 CardioNet 13,865 0.013,875 Career Education 31,019 0.011,825 Carlisle 81,276 0.03
225 Carpenter Technology 11,667 0.00225 Cascade 10,928 0.00
1,450 Cathay General Bancorp 21,801 0.011,700 CBL & Associates Properties 27,089 0.01
51,206 CBS - Non voting B Shares 1,405,349 0.58475 Celadon Group 5,624 0.00
13,895 Celgene 937,009 0.3828,483 CenterPoint Energy 576,638 0.24
1,425 Charles River Laboratories International 38,803 0.022,875 Checkpoint Systems 31,582 0.01
475 Cheesecake Factory 13,970 0.013,375 Chelsea Therapeutics International 17,331 0.01
19,439 Chevron 2,084,444 0.858,125 Chimera Investment 20,434 0.01
825 Church & Dwight 38,177 0.021,625 Cincinnati Bell 4,981 0.001,250 Cirrus Logic 20,144 0.01
52,995 Cisco Systems 966,894 0.4049,592 Citigroup 1,321,875 0.54
200 Citizens & Northern 3,743 0.001,650 City Holding 56,801 0.02
325 City National 14,362 0.01175 Clayton Williams Energy 13,545 0.01
2,950 Cloud Peak Energy 56,669 0.028,425 CMS Energy 188,004 0.086,400 CNO Financial Group 40,960 0.021,075 CoBiz Financial 6,084 0.001,225 Coeur d’Alene Mines 30,061 0.01
11,842 Cognizant Technology Solutions - A Shares 759,013 0.311,575 Coherent 84,184 0.04850 Coinstar 39,032 0.02
66,300 Coldwater Creek 75,913 0.03362 Colonial Properties Trust 7,553 0.00
33,344 Comcast - A Shares 793,754 0.33840 Commerce Bancshares 32,088 0.01
3,018 CommonWealth REIT 50,838 0.021,025 Complete Production Services 34,609 0.01
5,900 Compuware 49,117 0.021,200 Comtech Telecommunications 34,794 0.012,875 Conmed 74,520 0.036,682 Conn’s 74,939 0.032,950 Consolidated Communications Holdings 56,743 0.025,475 Constellation Brands - A Shares 113,634 0.05
225 Contango Oil & Gas 13,348 0.011,300 Con-way 38,142 0.021,925 Cooper 137,310 0.06
175 CoreLogic 2,261 0.004,112 Coresite Realty 73,831 0.032,425 Corn Products International 126,912 0.05
650 Covanta Holding 8,651 0.00150 Coventry Health Care 4,595 0.00
1,675 Crane 78,557 0.03675 Credit Acceptance 55,596 0.02
9,300 Cross Country Healthcare 51,708 0.02
62
JPMorgan Investment Funds - Global Balanced Fund (USD)
Schedule of Investments (Market Value Expressed in USD)
As at 31 December 2011
Quantity/Nominal
Value
Name of Securities Maturity/Coupon
MarketValue
%of
NetAssets
Quantity/Nominal
Value
Name of Securities Maturity/Coupon
MarketValue
%of
NetAssets

1,675 Crown Holdings 56,615 0.02900 CSG Systems International 13,306 0.01
1,095 CSS Industries 21,982 0.012,700 Cubic 118,773 0.051,050 Cullen/Frost Bankers 55,876 0.021,100 CVR Energy 20,597 0.01
16,775 CVS Caremark 686,601 0.28800 Cymer 40,328 0.02
3,475 Cypress Semiconductor 59,197 0.021,075 Dana 13,013 0.013,700 DCT Industrial Trust 18,925 0.013,000 DDR 36,915 0.023,525 Delek US Holdings 40,026 0.02
150 Delphi Financial Group - A Shares 6,655 0.001,750 Deluxe 40,022 0.02
325 Demand Media 2,231 0.00725 DeVry 27,778 0.01
4,541 DFC Global 82,714 0.031,275 Diamond Foods 42,387 0.021,975 DiamondRock Hospitality 19,335 0.013,375 Digital Realty Trust 227,087 0.094,075 Dillard’s - A Shares 184,496 0.08
100 DineEquity 4,237 0.001,750 Domtar 141,934 0.06600 Dot Hill Systems 789 0.00
3,025 Douglas Dynamics 44,044 0.025,400 Douglas Emmett 99,657 0.04
800 DreamWorks Animation - A Shares 13,236 0.012,300 Dresser-Rand Group 115,897 0.05
631 DSP Group 3,297 0.00950 DST Systems 43,586 0.02
3,250 Duke Realty 39,764 0.0210,475 Dynavax Technologies 34,829 0.01
3,775 East West Bancorp 75,273 0.03750 EastGroup Properties 32,880 0.01300 EchoStar - A Shares 6,315 0.00
1,700 Education Realty Trust 17,425 0.0114,560 EI du Pont de Nemours & Co. 667,285 0.27
1,650 El Paso Electric 58,187 0.021,000 Electronics for Imaging 14,280 0.01
27,263 EMC/Massachusetts 592,834 0.243,575 EMCOR Group 96,167 0.042,150 Endo Pharmaceuticals Holdings 74,368 0.03
3,400 Energen 171,258 0.071,350 Energizer Holdings 105,010 0.045,075 Energy Partners 73,055 0.033,400 EnergySolutions 10,353 0.003,225 Entercom Communications - A Shares 19,850 0.01
925 EPIQ Systems 11,114 0.001,022 Equifax 39,705 0.02
250 Equity Lifestyle Properties 16,649 0.01275 Erie Indemnity - A Shares 21,560 0.01
6,025 EXCO Resources 62,238 0.03325 Factset Research Systems 28,546 0.01725 Fair Isaac 26,332 0.01
2,325 Fairchild Semiconductor International 28,295 0.013,050 Federated Investors - B Shares 46,253 0.021,425 Fidelity National Financial - A Shares 22,971 0.011,450 Financial Institutions 24,048 0.015,125 Finish Line - A Shares 99,502 0.049,975 First Commonwealth Financial 53,316 0.023,825 First Financial Bancorp 64,337 0.031,866 First Horizon National 14,825 0.01
550 First Industrial Realty Trust 5,632 0.00675 First Interstate Bancsystem 8,789 0.00475 First Merchants 4,085 0.00300 Fisher Communications 8,643 0.00375 FleetCor Technologies 11,166 0.00
23,094 Fluor 1,167,402 0.482,400 FNB 27,120 0.012,150 Foot Locker 51,643 0.022,775 Forest City Enterprises - A Shares 32,648 0.011,325 Forest Oil 17,715 0.011,625 Fortinet 35,319 0.01
375 Fossil 30,504 0.011,050 Fresh Market 41,942 0.022,400 Fulton Financial 23,580 0.01
750 Fusion-io 18,067 0.01725 G&K Services - A Shares 21,449 0.01
3,600 GameStop - A Shares 87,570 0.041,550 Gardner Denver 118,854 0.05
700 Gartner 24,402 0.011,050 GATX 46,846 0.021,832 Geokinetics 3,866 0.001,875 Georgia Gulf 35,934 0.01
4,950 Gibraltar Industries 70,538 0.03
1,275 Global Cash Access Holdings 5,680 0.001,675 Global Payments 79,320 0.032,625 Goodyear Tire & Rubber 37,341 0.022,875 Graphic Packaging Holding 12,118 0.005,075 Greatbatch 112,919 0.054,550 GT Advanced Technologies 32,965 0.01
350 Gulf Island Fabrication 10,642 0.00900 Hanover Insurance Group 31,414 0.01
1,975 Harsco 40,557 0.025,875 Hawaiian Holdings 33,693 0.011,700 HCC Insurance Holdings 46,878 0.023,000 Health Net 92,610 0.041,700 Heartland Express 24,693 0.01
725 Heartland Financial USA 11,325 0.00675 Heartland Payment Systems 16,558 0.01
2,950 Hecla Mining 15,738 0.011,250 Helmerich & Payne 73,369 0.03
2,400 Hercules Offshore 10,716 0.002,525 HollyFrontier 59,161 0.028,981 Hologic 158,919 0.06
925 Home Properties 53,854 0.028,100 Hospitality Properties Trust 188,973 0.082,175 Hubbell - B Shares 145,910 0.06
8,734 Humana 770,077 0.329,025 Huntington Bancshares 50,224 0.021,500 Huntsman 14,857 0.011,975 Hurco 42,028 0.024,175 IAC/InterActive 177,730 0.072,500 Imation 14,250 0.013,275 Imperial Sugar 12,052 0.01
150 Imperva 5,125 0.00550 InfoSpace 6,377 0.00
1,900 Ingram Micro - A Shares 34,628 0.012,850 Inhibitex 30,367 0.01
625 Innophos Holdings 30,650 0.011,275 Integrated Device Technology 6,879 0.001,175 Integrys Energy Group 64,026 0.03
2,050 InterDigital 90,180 0.041,950 Intermolecular 16,721 0.011,725 InterMune 21,174 0.01
4,350 Interpublic Group of Companies 41,999 0.022,425 Intersections 26,675 0.011,125 Intersil - A Shares 11,919 0.00
3,500 Invacare 53,900 0.026,175 Investment Technology Group 66,813 0.031,225 ION Geophysical 7,607 0.00
38 Isramco 3,493 0.00825 Itron 30,141 0.01
1,600 ITT Educational Services 92,344 0.043,850 Jabil Circuit 76,865 0.036,950 Jakks Pacific 100,011 0.041,550 Janus Capital Group 9,664 0.003,475 Jarden 103,833 0.04
200 JB Hunt Transport Services 9,085 0.00683 JDA Software Group 22,372 0.01
1,400 JDS Uniphase 14,763 0.01200 Jive Software 3,197 0.00800 John Wiley & Sons - A Shares 35,588 0.01475 Jones Lang LaSalle 29,182 0.01
2,225 Journal Communications - A Shares 9,857 0.00250 Kadant 5,627 0.00
6,450 KAR Auction Services 87,462 0.046,075 KBR 169,766 0.07
700 Kemper 20,730 0.01157 KiOR - A Shares 1,441 0.00
1,450 Kirby 95,751 0.046,100 Knoll 91,317 0.04
20,507 Kraft Foods - A Shares 768,910 0.324,025 Kronos Worldwide 72,893 0.031,325 Kulicke & Soffa Industries 12,382 0.01
475 Laclede Group 19,530 0.01675 Lamar Advertising - A Shares 18,505 0.01
2,325 Lattice Semiconductor 13,822 0.01350 Lear 13,863 0.01
5,950 Leggett & Platt 140,480 0.061,450 Lender Processing Services 21,605 0.01
925 Level 3 Communications 15,637 0.016,069 Lexington Realty Trust 46,033 0.022,475 Lexmark International - A Shares 82,442 0.031,525 Liberty Property Trust 47,298 0.02
550 LifePoint Hospitals 20,556 0.012,900 Lifetime Brands 34,525 0.011,400 Lincare Holdings 36,190 0.01
700 Lincoln Electric Holdings 27,489 0.01875 LinkedIn 55,129 0.02
7,175 Liz Claiborne 60,521 0.02
63
JPMorgan Investment Funds - Global Balanced Fund (USD)
Schedule of Investments (Market Value Expressed in USD) (continued)
As at 31 December 2011
Quantity/Nominal
Value
Name of Securities Maturity/Coupon
MarketValue
%of
NetAssets
Quantity/Nominal
Value
Name of Securities Maturity/Coupon
MarketValue
%of
NetAssets

1,075 LKQ 32,524 0.01821 Lone Pine Resources 5,603 0.00
25,225 LSI 150,972 0.062,775 LTC Properties 86,316 0.04
10,975 LTX-Credence 58,661 0.02525 Mack-Cali Realty 14,073 0.01
1,025 Magellan Health Services 50,989 0.02950 MainSource Financial Group 8,479 0.00
3,200 Manhattan Associates 130,800 0.05650 Manning & Napier 8,369 0.00
1,425 Marlin Business Services 18,212 0.01825 MBIA 9,525 0.00
6,975 McClatchy - A Shares 16,112 0.011,200 McMoRan Exploration 17,610 0.012,400 MDU Resources Group 51,972 0.021,275 Meadowbrook Insurance Group 13,687 0.012,350 MedAssets 21,667 0.012,050 Medicis Pharmaceutical - A Shares 68,296 0.031,575 Mednax 113,534 0.05
34,645 Merck & Co. 1,310,447 0.546,700 MetroPCS Communications 55,711 0.02
450 Mettler Toledo International 66,085 0.036,750 MFA Financial 45,664 0.025,450 Micrel 55,590 0.02
50,610 Microsoft 1,316,113 0.54475 MicroStrategy - A Shares 52,606 0.02175 Mid-America Apartment Communities 11,056 0.00
2,225 Minerals Technologies 127,726 0.052,525 Mission West Properties 22,738 0.01
700 Molina Healthcare 15,764 0.01750 Molycorp 18,266 0.01
6,950 Monotype Imaging Holdings 111,061 0.053,525 MPG Office Trust 7,138 0.001,650 Mueller Industries 64,490 0.031,891 Multimedia Games 14,929 0.014,150 Myers Industries 53,245 0.02
175 NACCO Industries - A Shares 15,831 0.014,200 Nasdaq OMX Group 103,299 0.04
731 Nature’s Sunshine Products 11,638 0.00650 Navigators Group 31,129 0.01
2,525 Navistar International 94,284 0.046,250 NCR 103,469 0.041,325 Neenah Paper 29,779 0.015,425 Nektar Therapeutics 29,973 0.01
110 NeuStar - A Shares 3,773 0.00475 New Jersey Resources 23,805 0.01750 Newport 10,373 0.00
3,550 Nexstar Broadcasting Group 27,424 0.015,100 Nordson 210,911 0.091,900 Northeast Utilities 68,818 0.033,500 NorthWestern 127,120 0.051,325 Novellus Systems 55,133 0.022,775 Nuance Communications 70,055 0.03
200 NVR 136,800 0.0618,630 Occidental Petroleum 1,752,990 0.72
1,100 Oceaneering International 51,321 0.021,200 OceanFirst Financial 15,960 0.013,375 O’Charleys 18,816 0.015,700 Ocwen Financial 83,192 0.03
800 OGE Energy 45,552 0.022,550 Oil States International 195,190 0.084,600 Omnicare 161,253 0.074,800 ON Semiconductor 36,984 0.02
900 Onyx Pharmaceuticals 39,568 0.02825 OpenTable 32,208 0.01
2,100 Oplink Communications 34,272 0.0149,077 Oracle 1,265,450 0.5217,900 Orexigen Therapeutics 29,088 0.01
2,150 Outdoor Channel Holdings 15,974 0.011,275 Oxford Industries 57,700 0.02
15,082 Paccar 566,555 0.235,475 Pacer International 29,045 0.017,177 Pacific Biosciences of Californiaa 19,593 0.01
1,000 PacWest Bancorp 18,955 0.01325 Pall 18,704 0.01450 Pandora Media 4,484 0.00175 Panhandle Oil and Gas - A Shares 5,803 0.00
200 Parker Drilling 1,461 0.00350 Park-Ohio Holdings 6,384 0.00
1,600 Patterson-UTI Energy 31,976 0.012,200 Pennsylvania Real Estate Investment Trust 23,397 0.01
875 Pentair 29,247 0.013,200 PerkinElmer 63,600 0.03
400 PetMed Express 4,094 0.004,525 Petroquest Energy 30,046 0.011,200 PetSmart 62,076 0.02
1,125 PF Chang’s China Bistro 34,959 0.018,490 PG&E 351,910 0.14
900 PH Glatfelter 12,766 0.01675 Pharmasset 83,714 0.03
2,275 PHH 23,353 0.011,025 Piedmont Natural Gas 35,547 0.011,475 Pinnacle West Capital 71,744 0.031,625 Pioneer Drilling 15,754 0.01
650 Plantronics 23,377 0.011,625 PMC - Sierra 9,011 0.002,100 Polycom 34,198 0.01
375 Portfolio Recovery Associates 26,267 0.012,325 Portland General Electric 59,102 0.022,575 Potlatch 80,559 0.032,375 Prestige Brands Holdings 27,372 0.01
650 ProAssurance 52,286 0.023,350 Protective Life 75,626 0.031,700 PS Business Parks 95,744 0.043,850 Pulse Electronics 10,934 0.001,125 PVH 79,774 0.03
2,925 QLogic 44,270 0.02425 Quest Software 7,969 0.00
2,300 Questar 46,103 0.02575 Radisys 3,065 0.00
2,800 RailAmerica 40,768 0.023,175 Ramco-Gershenson Properties Trust 30,940 0.011,125 Raymond James Financial 35,021 0.011,275 Red Robin Gourmet Burgers 36,306 0.01300 Regal Entertainment Group - A Shares 3,606 0.00900 Regal-Beloit 46,364 0.02
1,175 Regency Centers 44,756 0.021,300 Regis 21,586 0.011,550 Reinsurance Group of America 81,003 0.031,500 Reliance Steel & Aluminum 73,163 0.03
250 Rent-A-Center 9,373 0.003,875 RF Micro Devices 21,254 0.01
425 Richardson Electronics 5,234 0.0062,900 Rite Aid 77,681 0.03
875 Riverbed Technology 20,939 0.011,775 Rock-Tenn - A Shares 102,080 0.041,675 Rockwood Holdings 65,032 0.032,075 Rovi 51,014 0.02
500 Rowan Companies 15,455 0.01350 Royal Gold 23,956 0.01800 RPC 14,892 0.01450 RPM International 11,135 0.01
25,824 RTI Biologics 115,433 0.051,475 Rudolph Technologies 13,762 0.011,500 Ryder System 79,740 0.033,825 Saia 48,444 0.022,975 Sauer-Danfoss 108,097 0.041,100 Saul Centers 39,221 0.027,800 Savient Pharmaceuticals 17,199 0.011,600 SCANA 72,632 0.03
300 Schnitzer Steel Industries - A Shares 12,768 0.012,800 Scholastic 84,672 0.03
575 School Specialty 1,440 0.00300 SEACOR Holdings 27,065 0.01
1,975 Sealed Air 33,773 0.017,194 Sempra Energy 398,727 0.16
800 Semtech 20,048 0.017,575 Service Corp. International 81,053 0.03800 Sierra Bancorp 7,200 0.00500 Silgan Holdings 19,330 0.01
50 Silicon Laboratories 2,194 0.00975 Simmons First National - A Shares 27,168 0.01
7,650 Sinclair Broadcast Group - A Shares 87,248 0.034,000 Skilled Healthcare Group 21,740 0.01
325 Skullcandy 3,931 0.00525 SM Energy 38,837 0.02
8,125 Smart Balance 44,484 0.024,425 Smithfield Foods 108,479 0.051,350 Snap-On 68,776 0.03400 Solazyme 4,664 0.00875 Solera Holdings 39,314 0.02
1,275 Sonoco Products 42,349 0.022,225 Southern Union 93,851 0.04
1 Southside Bancshares 22 0.003,975 Southwest Bancorp 24,228 0.01
750 Southwest Gas 32,231 0.014,425 Spartan Motors 21,550 0.011,375 Stancorp Financial Group 50,222 0.02
475 Standard Parking 8,529 0.001,200 Standex International 42,096 0.022,300 Steel Dynamics 30,533 0.01
600 Steelcase - A Shares 4,470 0.00
64
JPMorgan Investment Funds - Global Balanced Fund (USD)
Schedule of Investments (Market Value Expressed in USD) (continued)
As at 31 December 2011
Quantity/Nominal
Value
Name of Securities Maturity/Coupon
MarketValue
%of
NetAssets
Quantity/Nominal
Value
Name of Securities Maturity/Coupon
MarketValue
%of
NetAssets

375 StellarOne 4,258 0.001,650 Stone Energy 43,989 0.022,225 Suffolk Bancorp 24,308 0.01
34,291 SunTrust Banks 601,807 0.251,775 Superior Industries International 29,580 0.017,125 Supervalu 57,321 0.02
2,400 Susquehanna Bancshares 20,196 0.01375 SVB Financial Group 18,000 0.01925 Swift Energy 27,963 0.01
2,475 Symetra Financial 22,423 0.013,350 Synopsys 91,003 0.041,125 TAL International Group 32,934 0.01
150 Tangoe 2,226 0.0018,942 Target 971,630 0.402,200 Taubman Centers 137,841 0.067,200 TCF Financial 74,952 0.03
44,815 TD Ameritrade Holding 698,890 0.291,975 Team Health Holdings 43,628 0.02
350 Teavana Holdings 6,408 0.001,425 Tech Data 71,385 0.033,100 TECO Energy 59,722 0.027,575 TeleNav 57,911 0.021,850 Tellabs 7,428 0.00
400 Tempur-Pedic International 21,398 0.017,275 Teradyne 99,195 0.042,325 Tesoro 54,440 0.021,950 Thomas & Betts 106,938 0.041,650 Thoratec 55,440 0.022,025 TIBCO Software 48,701 0.02
34,986 Time Warner 1,279,963 0.522,300 Timken 88,803 0.04
150 TNS 2,650 0.001,575 Toro 96,729 0.042,850 Towers Watson & Co. - A Shares 171,085 0.075,075 Town Sports International Holdings 37,453 0.01
500 TransDigm Group 48,183 0.021,675 Tredegar 37,922 0.021,575 Trimas 27,602 0.013,575 TRW Automotive Holdings 115,419 0.051,375 tw telecom 26,847 0.014,100 UGI 121,873 0.05
475 UMB Financial 17,798 0.0110,402 Union Pacific 1,101,208 0.45
725 Unisource Energy 26,963 0.01755 Unisys 14,870 0.01475 Unit 22,095 0.01
17,021 United Technologies 1,255,214 0.52950 United Therapeutics 44,930 0.02
29,600 UnitedHealth Group 1,510,488 0.623,025 Universal 140,148 0.06
400 Universal Health Services - B Shares 15,396 0.01175 USA Mobility 2,457 0.00
5,775 Vaalco Energy 35,025 0.011,485 Valley National Bancorp 18,243 0.01
275 Valmont Industries 25,193 0.015,025 Valspar 196,226 0.08
500 Vectren 15,290 0.01974 VeriFone Systems 34,699 0.02
13,040 Vertex Pharmaceuticals 430,711 0.188,035 VF 1,023,016 0.4212,232 Vishay Intertechnology 110,638 0.052,825 Vivus 27,304 0.01
19,600 Vonage Holdings 48,314 0.025,475 W&T Offshore 117,028 0.05
525 Wabtec 36,637 0.02350 Waddell & Reed Financial - A Shares 8,720 0.00
3,175 Washington Federal 44,466 0.022,675 Websense 50,344 0.021,650 WellCare Health Plans 87,087 0.03
79,746 Wells Fargo & Co. 2,208,565 0.912,300 Wesco Aircraft Holdings 30,992 0.011,050 West Bancorporation 10,122 0.001,150 Westar Energy 33,316 0.01
350 Western Refining 4,629 0.001,675 Westlake Chemical 68,214 0.03
100 Westmoreland Coal 1,273 0.00775 Williams-Sonoma 29,962 0.01
2,875 Wilshire Bancorp 10,163 0.001,475 World Acceptance 109,150 0.054,350 Worthington Industries 71,906 0.031,050 WR Berkley 36,188 0.022,900 Wyndham Worldwide 110,838 0.04
29,249 Xilinx 945,474 0.39
775 Zebra Technologies - A Shares 27,974 0.01250 Zillow 5,681 0.00
5,100 Zions Bancorporation 83,309 0.03
65,925,606 27.03
UNITED KINGDOM47,649 BG Group 1,019,567 0.4225,350 British American Tobacco 1,205,018 0.4981,445 Cairn Energy 336,834 0.14
140,594 Centrica 632,044 0.2651,069 GlaxoSmithKline 1,167,752 0.4826,787 Intercontinental Hotels Group 482,519 0.20
936,214 Lloyds Banking Group 376,425 0.1547,063 Prudential 466,667 0.1916,551 Rio Tinto 804,054 0.33
39,492 Standard Chartered 864,976 0.35579,275 Vodafone Group 1,611,103 0.66
8,966,959 3.67
JAPAN15,100 Bridgestone 341,132 0.14
368 Dai-ichi Life Insurance 360,490 0.15112,000 Fujitsu 581,950 0.24
228 Japan Tobacco 1,070,943 0.4483,700 JX Holdings 505,399 0.21
121 KDDI 776,093 0.3284,000 Marubeni 510,476 0.2172,000 Mitsubishi Electric 687,580 0.28111,000 Mitsubishi Heavy Industries 471,040 0.1988,800 Nissan Motor 795,086 0.33
6,170 ORIX 508,870 0.21
6,609,059 2.72
SWITZERLAND45,357 ABB Registered Shares 854,706 0.3519,484 ACE 1,373,135 0.56
1,175 Allied World Assurance Co Holdings 74,002 0.0312,226 Compagnie Financiere Richemont - Bearer A Shares 620,948 0.264,741 Holcim Registered Shares 253,305 0.10
16,581 Nestlé Registered Shares 954,420 0.393,072 Roche Holding - Genussschein 520,736 0.21
28,244 TE Connectivity 875,140 0.3615,177 Tyco International 710,132 0.29
6,236,524 2.55
NETHERLANDS2,475 Chicago Bridge & Iron 93,914 0.04
450 Core Laboratories 51,824 0.0223,399 EADS 729,106 0.3043,882 Koninklijke KPN 526,548 0.2273,713 Royal Dutch Shell - A Shares 2,698,983 1.11
26,398 Unilever - CVA 907,704 0.37300 VistaPrint 9,195 0.00
5,017,274 2.06
FRANCE23,066 GDF Suez 622,021 0.254,309 L’Oréal 449,198 0.182,264 PPR 325,544 0.1315,116 Schneider Electric 787,649 0.3212,539 Sodexo 900,809 0.37
20,930 Suez Environnement 240,547 0.11
3,325,768 1.36
GERMANY6,338 Allianz Registered Shares 606,539 0.255,900 BASF 411,453 0.1711,657 Bayer Registered Shares 744,274 0.3123,632 E.ON 508,677 0.202,468 Lanxess 127,246 0.055,462 Volkswagen Preference Shares 818,003 0.34
3,216,192 1.32
JERSEY60,386 Experian 821,204 0.3423,418 Shire 816,004 0.33
1,637,208 0.67
65
JPMorgan Investment Funds - Global Balanced Fund (USD)
Schedule of Investments (Market Value Expressed in USD) (continued)
As at 31 December 2011
Quantity/Nominal
Value
Name of Securities Maturity/Coupon
MarketValue
%of
NetAssets
Quantity/Nominal
Value
Name of Securities Maturity/Coupon
MarketValue
%of
NetAssets

CURACAO22,721 Schlumberger 1,538,780 0.63
1,538,780 0.63
CANADA40,210 First Quantum Minerals 783,570 0.3239,436 Kinross Gold 456,295 0.19
1,239,865 0.51
SOUTH KOREA1,345 Samsung Electronics 1,229,730 0.50
1,229,730 0.50
CAYMAN ISLANDS363,000 Belle International Holdings 632,832 0.26
49,500 Hengan International Group 462,069 0.192,025 Herbalife 106,161 0.04
1,201,062 0.49
IRELAND21,844 Covidien 986,912 0.40
986,912 0.40
BERMUDA1,750 Aircastle 22,173 0.011,900 Arch Capital Group 70,747 0.03
350 Aspen Insurance Holdings 9,361 0.004,150 Assured Guaranty 55,091 0.021,525 Axis Capital Holdings 48,869 0.021,350 Endurance Specialty Holdings 51,773 0.024,958 Everest Re Group 421,157 0.171,750 Genpact 25,786 0.013,775 Global Sources 18,743 0.01900 Lazard - A Shares 23,166 0.01
1,475 Platinum Underwriters Holdings 50,430 0.02875 RenaissanceRe Holdings 65,030 0.03
862,326 0.35
FINLAND196,329 Ruukki Group 222,989 0.0946,433 Stora Enso - R Shares 275,324 0.1127,669 UPM-Kymmene 303,039 0.13
801,352 0.33
PANAMA19,116 Carnival 628,534 0.261,375 Copa Holdings - A Shares 82,445 0.03
710,979 0.29
ISRAEL17,441 Teva Pharmaceutical Industries ADR 709,587 0.29
709,587 0.29
SWEDEN63,126 Telefonaktiebolaget LM Ericsson - B Shares 641,192 0.26
641,192 0.26
TAIWAN113,659 Hon Hai Precision Industry Registered Shares GDR 627,682 0.26
627,682 0.26
BELGIUM6,834 Solvay 561,748 0.23
561,748 0.23
ITALY123,596 Snam Rete Gas 541,143 0.22
541,143 0.22
DENMARK7,066 Carlsberg - B Shares 498,487 0.20
498,487 0.20
HONG KONG258,000 China Overseas Land & Investment 430,515 0.18
430,515 0.18
CHINA184,000 China Merchants Bank - H Shares * 371,710 0.15
371,710 0.15
PUERTO RICO2,800 Oriental Financial Group 34,118 0.01
34,118 0.01
Total Shares 113,921,778 46.68
Bonds
UNITED STATES OF AMERICA15,000,000 Goldman Sachs Group 15.06.12/3.250% 15,215,475 6.24
15,215,475 6.24
GERMANY4,000,000 Germany (Federal Republic of) 04.07.16/4.000% 5,955,100 2.441,500,000 Germany (Federal Republic of) 04.01.28/5.625% 2,782,394 1.141,865,000 Germany (Federal Republic of) 04.07.34/4.750% 3,368,042 1.38
12,105,536 4.96
NETHERLANDS6,550,000 Netherlands (Kingdom of) 15.07.17/4.500% 9,820,761 4.03
9,820,761 4.03
ITALY2,500,000 Italy Buoni Poliennali Del Tesoro 01.11.15/3.000% 2,950,987 1.211,000,000 Italy Buoni Poliennali Del Tesoro 01.09.21/4.750% 1,128,536 0.46
4,079,523 1.67
Total Bonds 41,221,295 16.90
Total Transferable Securities Admitted to anOfficial Exchange Listing
155,143,073 63.58
Transferable Securities Dealt in on Another Regulated Market
Bonds
UNITED STATES OF AMERICA9,500,000 US Treasury 15.05.17/8.750% 13,382,383 5.489,400,000 US Treasury 15.02.31/5.375% 13,386,188 5.499,000,000 US Treasury 15.08.14/4.250% 9,913,008 4.061,750,000 US Treasury 15.08.41/3.750% 2,053,789 0.84
80,000 US Treasury 30.11.12/0.500% 80,259 0.038,850,000 US Treasury 15.02.19/8.875% 13,411,898 5.503,000,000 US Treasury 15.05.30/6.250% 4,635,938 1.90
56,863,463 23.30
Total Bonds 56,863,463 23.30
Investment Funds
LUXEMBOURG685,929 JPMorgan Funds - Emerging Markets Equity Fund
(JPM Emerging Markets Equity X (dist) - USD) 11,372,702 4.660** JPMorgan Funds - Emerging Markets Opportunities
Fund (JPM Emerging Markets Opportunities X (acc) -USD) 110 0.01
11,372,812 4.67
Total Investment Funds 11,372,812 4.67
Total Transferable Securities Dealt in on AnotherRegulated Market
68,236,275 27.97
66
JPMorgan Investment Funds - Global Balanced Fund (USD)
Schedule of Investments (Market Value Expressed in USD) (continued)
As at 31 December 2011
Quantity/Nominal
Value
Name of Securities Maturity/Coupon
MarketValue
%of
NetAssets
Quantity/Nominal
Value
Name of Securities Maturity/Coupon
MarketValue
%of
NetAssets

Other Transferable Securities
Shares
UNITED STATES OF AMERICA300 J Crew Group 0 0.00
0 0.00
Total Shares 0 0.00
Total Other Transferable Securities 0 0.00
Total Investments 223,379,348 91.55
Cash 18,315,944 7.51
Other Assets/(Liabilities) 2,294,973 0.94
Total Net Assets 243,990,265 100.00
* Hong Kong Registered Shares.** Fractional shares rounded to zero.
Allocation of Portfolio as at 31 December 2011 % ofNet Assets
Fixed Income SecuritiesUnited States of America 29.54Germany 4.96Netherlands 4.03Italy 1.67Total Fixed Income Securities 40.20SharesFinancials 7.41Information Technology 6.94Consumer Discretionary 6.71Industrials 5.58Health Care 5.58Energy 4.73Investment Companies 4.67Consumer Staples 3.17Materials 3.06Utilities 2.22Telecommunication Services 1.28Total Shares 51.35Cash and Other Assets/(Liabilities) 8.45
Total 100.00
Allocation of Portfolio as at 30 June 2011 (Unaudited) % ofNet Assets
Fixed Income SecuritiesUnited States of America 29.80Germany 4.39Netherlands 3.77France 1.64Total Fixed Income Securities 39.60SharesFinancials 8.77Information Technology 6.46Investment Companies 6.05Consumer Discretionary 6.02Industrials 5.61Health Care 5.58Energy 4.74Materials 4.14Consumer Staples 2.44Utilities 2.21Telecommunication Services 1.39Total Shares 53.41Cash and Other Assets/(Liabilities) 6.99
Total 100.00
67
JPMorgan Investment Funds - Global Balanced Fund (USD)
Schedule of Investments (Market Value Expressed in USD) (continued)
As at 31 December 2011
Quantity/Nominal
Value
Name of Securities Maturity/Coupon
MarketValue
%of
NetAssets
Quantity/Nominal
Value
Name of Securities Maturity/Coupon
MarketValue
%of
NetAssets

JPMorgan Investment Funds - Global Balanced Fund (USD)
Schedule of Investments - Outstanding Financial Futures Contracts (Expressed in USD)
As at 31 December 2011
ExpirationDate
Number ofContracts Security Description Currency
NotionalValue
UnrealisedGain/(Loss)
Bond Futures
Mar-12 (22) Euro-Bobl Future EUR (3,571,779) (3,570)Mar-12 (71) Euro-Bund Future EUR (12,805,386) (2,304)Mar-12 (36) Euro-Schatz Future EUR (5,156,516) 1,051Mar-12 7 Japan 10 Year Bond Future JPY 12,917,007 12,699Mar-12 18 Long Gilt Future GBP 3,271,746 (3,077)Mar-12 (53) US 2 Year Note Future USD (11,686,086) (1,242)Mar-12 (27) US 5 Year Note Future USD (3,325,324) (2,004)Mar-12 101 US 10 Year Note Future USD 13,228,633 13,414
Total Bond Futures 14,967
Equity Futures
Mar-12 17 Dax Index Future EUR 3,254,860 (4,138)Mar-12 (206) DJ Euro Stoxx 50 Index Future EUR (6,146,150) (54,817)Mar-12 (49) FTSE 100 Index Future GBP (4,215,985) (20,943)Mar-12 (242) Russell 2000 Mini Future USD (17,951,560) 364,165Mar-12 11 S&P 60 Index Future CAD 1,460,084 (1,597)Mar-12 4 S&P Midcap 400 Emini Future USD 352,620 (2,105)Mar-12 345 SP 500 Emini Future USD 21,683,250 (6,900)Mar-12 60 Topix Index Future JPY 5,659,864 50,535
Total Equity Futures 324,200
Total 339,167
Schedule of Investments - Outstanding Forward Foreign Exchange Contracts (Expressed in USD)
SettlementDate Currency
AmountPurchased Currency
AmountSold
UnrealisedGain/(Loss)
28-Feb-12 CAD 650,000 JPY 49,256,090 (2,075)28-Feb-12 CAD 175,149 USD 169,134 2,45428-Feb-12 CHF 2,000,867 EUR 1,630,389 18,90528-Feb-12 EUR 1,343,502 NOK 10,530,917 (12,011)28-Feb-12 EUR 2,449,507 USD 3,256,308 (75,084)28-Feb-12 GBP 1,414,729 USD 2,213,258 (15,694)28-Feb-12 HKD 911,938 USD 117,051 38528-Feb-12 JPY 226,794,636 USD 2,940,063 1,49028-Feb-12 NOK 4,954,387 CAD 859,618 (15,612)28-Feb-12 NOK 5,543,147 EUR 711,888 20428-Feb-12 NOK 38,276,016 USD 6,535,486 (150,005)28-Feb-12 SGD 893,439 USD 683,331 5,67728-Feb-12 USD 871,621 CAD 911,749 (21,589)28-Feb-12 USD 3,237,730 CHF 2,975,397 60,90128-Feb-12 USD 34,781,625 EUR 25,947,731 1,082,79128-Feb-12 USD 2,610,022 GBP 1,673,891 9,89028-Feb-12 USD 1,933,227 HKD 15,058,699 (5,988)28-Feb-12 USD 3,232,759 JPY 249,656,340 (5,313)28-Feb-12 USD 3,062,446 NOK 18,216,354 23,46228-Feb-12 USD 503,271 SEK 3,477,261 (1,833)
Total 900,955
68

Transferable Securities Admitted to an Official Exchange Listing
Bonds
JAPAN250,000,000 Japan (Government of) 20.03.13/0.600% 2,510,042 3.51905,000,000 Japan (Government of) 20.09.14/1.500% 9,355,413 13.07616,700,000 Japan (Government of) 20.03.20/1.300% 6,423,925 8.97270,000,000 Japan (Government of) 20.06.25/1.900% 2,879,157 4.02164,500,000 Japan (Government of) 20.12.28/1.900% 1,712,700 2.39124,000,000 Japan (Government of) 20.09.35/2.500% 1,401,909 1.9667,000,000 Japan (Government of) 20.09.39/2.200% 717,457 1.00
25,000,603 34.92
UNITED KINGDOM400,000 Barclays Bank 08.09.14/2.125% 397,935 0.56300,000 Legal & General Group 08.06.25/4.000%* 248,378 0.34275,000 UK Treasury 07.09.15/4.750% 379,135 0.53
404,000 UK Treasury 07.09.34/4.500% 610,863 0.85730,000 UK Treasury 07.12.42/4.500% 1,127,043 1.57336,000 UK Treasury 07.06.32/4.250% 490,687 0.69
55,000 WPP Finance 2010 144A 21.11.21/4.750% 42,066 0.06
3,296,107 4.60
FRANCE405,000 France (Government of) 25.04.35/4.750% 475,244 0.66173,000 France (Government of) 25.04.60/4.000% 184,032 0.26
1,399,000 France (Government of) 25.04.21/3.750% 1,468,852 2.05240,000 France (Government of) 25.10.21/3.250% 242,679 0.34345,000 France (Government of) 25.10.32/5.750% 449,121 0.63200,000 Société des Autoroutes
Paris-Rhin-Rhone 12.01.17/5.000% 203,592 0.28
3,023,520 4.22
ITALY820,000 Italy (Republic of) 01.02.17/4.000% 750,282 1.05760,000 Italy (Republic of) 01.03.20/4.250% 658,464 0.92675,000 Italy (Republic of) 01.09.20/4.000% 566,546 0.79
1,020,000 Italy (Republic of) 01.02.37/4.000% 715,900 1.00
2,691,192 3.76
UNITED STATES OF AMERICA240,000 Aristotle Holding 15.11.21/4.750% 191,338 0.27245,000 AT&T 15.05.21/4.450% 209,461 0.29125,000 Bank of America 13.05.21/5.000% 87,767 0.12745,000 Bank of America 15.06.12/3.125% 581,734 0.81100,000 Citigroup 09.08.20/5.375% 79,552 0.1160,000 Citigroup 29.05.37/5.875% 46,620 0.07
350,000 Citigroup Funding 10.12.12/2.250% 274,655 0.38125,000 Duke Energy Carolinas 15.12.16/1.750% 96,983 0.14130,000 Enterprise Products Operating 15.02.42/5.700% 108,928 0.1550,000 ERP Operating 15.12.21/4.625% 39,283 0.06
350,000 General Electric Capital 28.09.12/2.000% 273,309 0.38270,000 NBCUniversal Media 01.04.21/4.375% 221,358 0.31240,000 Tennessee Valley Authority 15.09.39/5.250% 236,812 0.33
2,447,800 3.42
NETHERLANDS800,000 LeasePlan 22.05.14/3.250% 837,378 1.17150,000 Linde Finance 01.06.21/3.875% 159,798 0.22
1,120,000 Netherlands (Kingdom of) 15.07.18/4.000% 1,272,530 1.78
2,269,706 3.17
SPAIN115,000 Spain (Kingdom of) 31.01.14/4.250% 117,165 0.16431,000 Spain (Kingdom of) 31.10.19/4.300% 421,808 0.59670,000 Spain (Kingdom of) 30.04.20/4.000% 637,887 0.89402,000 Spain (Kingdom of) 31.10.20/4.850% 401,509 0.56300,000 Spain (Kingdom of) 31.10.16/4.250% 301,394 0.42120,000 Telefonica Emisiones 16.02.21/5.462% 89,078 0.13
1,968,841 2.75
MEXICO435,000 America Movil 08.09.16/2.375% 334,367 0.47140,000 Mexico (United Mexican States) 05.12.24/10.000% 999,148 1.39
1,333,515 1.86
NORWAY648,000 DNB Boligkreditt 18.10.16/2.500% 655,429 0.92
60,000 Sparebank 1 Boligkreditt 15.11.16/6.000% 50,202 0.07
481,000 Sparebank 1 Boligkreditt GMTN 22.11.16/2.375% 483,119 0.67
1,188,750 1.66
GERMANY50,000 Germany (Federal Republic of) 04.07.21/3.250% 56,509 0.08
140,000 Germany (Federal Republic of) 04.07.28/4.750% 184,017 0.25673,245 Germany (Federal Republic of) 04.07.34/4.750% 936,656 1.31
1,177,182 1.64
BELGIUM1,140,000 Belgium (Kingdom of) 28.03.18/4.000% 1,170,901 1.64
1,170,901 1.64
SOUTH KOREA1,706,000,000 Korea (Republic of) 10.06.12/4.000% 1,140,413 1.59
1,140,413 1.59
SWEDEN670,000 Swedbank Hypotek 07.09.15/2.250% 677,217 0.95
3,525,000 Sweden (Kingdom of) 12.08.17/3.750% 449,620 0.62
1,126,837 1.57
DENMARK3,900,000 Denmark (Kingdom of) 15.11.17/4.000% 618,695 0.86
618,695 0.86
CANADA300,000 Suncor Energy 01.06.18/6.100% 273,891 0.38150,000 Xstrata Canada Financial 27.05.20/7.375% 208,070 0.29
481,961 0.67
BRAZIL935 Brazil (Republic of) 01.01.13/10.000% 405,118 0.57
405,118 0.57
RUSSIA417,500 Russian (Republic of) 31.03.30/7.500%* 374,200 0.52
374,200 0.52
INTERNATIONAL AGENCIES165,000 Eurasian Development
Bank 144A 29.09.14/7.375% 134,122 0.19250,000 European Investment Bank 15.05.14/1.500% 193,340 0.27
327,462 0.46
SOUTH AFRICA135,000 South Africa (Republic of) 09.03.20/5.500% 116,581 0.16
116,581 0.16
CAYMAN ISLANDS110,000 Transocean 15.12.21/6.375% 89,371 0.12
89,371 0.12
PERU70,000 Peru (Republic of) 21.11.33/8.750% 82,182 0.12
82,182 0.12
Total Bonds 50,330,937 70.28
Total Transferable Securities Admitted to anOfficial Exchange Listing
50,330,937 70.28
Transferable Securities Dealt in on Another Regulated Market
Bonds
UNITED STATES OF AMERICA143,012 ACE Securities 2005-HE4 M1 25.07.35/0.794%* 107,154 0.15
424,066 Aegis Asset Backed SecuritiesTrust 2004-3 A1 25.09.34/0.654%* 295,933 0.41
66,056 Asset Backed FundingCertificates 2005-HE2 M1 25.06.35/0.774%* 49,945 0.07
705,000 Bear Stearns CommercialMortgage Securities2005-PWR9 A4A 11.09.42/4.871% 590,528 0.82
400,000 Bear Stearns CommercialMortgage Securities2005-T18 A4 13.02.42/4.933%* 334,877 0.47
95,000 Bear Stearns CommercialMortgage Securities2006-PW14 AM 11.12.38/5.243% 72,154 0.10
69
JPMorgan Investment Funds - Global Bond Fund (EUR)
Schedule of Investments (Market Value Expressed in EUR)
As at 31 December 2011
Quantity/Nominal
Value
Name of Securities Maturity/Coupon
MarketValue
%of
NetAssets
Quantity/Nominal
Value
Name of Securities Maturity/Coupon
MarketValue
%of
NetAssets

1,100,000 Citibank Omni Master Trust2009-A8 A8 16.05.16/2.378%* 852,749 1.19
1,638,829 Countrywide Alternative LoanTrust 2005-J14 A3 25.12.35/5.500% 920,327 1.29
184,323 Credit Suisse First BostonMortgage Securities 2004-3 2A1 25.04.19/5.000% 146,684 0.20
85,665 Credit Suisse First BostonMortgage Securities2005-C2 AAB 15.04.37/4.681% 67,639 0.10
72,521 Daimler Chrysler Auto Trust2007-A A4 08.03.13/5.280% 55,931 0.08
113,844 Fannie Mae REMICS 2006-78 BC 25.01.34/6.500% 87,918 0.121,036,177 Fannie Mae REMICS 2010-116 BI 25.08.20/5.000% 81,439 0.11925,000 First National Master Note Trust
2009-3 A 15.07.15/1.628%* 715,624 1.00430,000 Freddie Mac 30.07.14/1.000% 334,937 0.47524,923 Harborview Mortgage Loan
Trust 2005-9 2A1A 20.06.35/0.625%* 302,488 0.42250,200 Indymac Index Mortgage Loan
Trust 2005-16IP A1 25.07.45/0.614%* 118,207 0.171,548,039 Indymac Index Mortgage Loan
Trust 2005-AR8 2A1A 25.04.35/0.524%* 673,836 0.94130,000 JP Morgan Chase Commercial
Mortgage Securities2004-CBX A6 12.01.37/4.899% 106,302 0.15
155,037 JP Morgan Mortgage Trust2005-S2 1A1 25.08.20/4.500% 120,091 0.17
80,000 LB-UBS Commercial MortgageTrust 2005-C2 A5 15.04.30/5.150%* 66,260 0.09
790,000 LB-UBS Commercial MortgageTrust 2006-C6 A4 15.09.39/5.372% 676,726 0.95
140,165 Morgan Stanley ABS Capital I2004-SD2 A 25.04.34/0.744%* 93,790 0.13
340,000 Morgan Stanley Capital I2005-HQ7 A4 14.11.42/5.202%* 288,712 0.40
255,000 Morgan Stanley Capital I2006-IQ12 A4 15.12.43/5.332% 220,458 0.31
140,000 Nisource Finance 01.02.42/5.800% 113,834 0.16145,000 Park Place Securities
2005-WHQ3 M1 25.06.35/0.714%* 98,311 0.14403,095 Residential Asset Mortgage
Products 2004-RS11 M1 25.11.34/0.914%* 284,362 0.40101,707 Residential Funding Mortgage
Securities I 2006-S12 2A2 25.12.36/6.000% 71,962 0.10192,849 Structured Asset Securities
2005-WF4 A4 25.11.35/0.654%* 140,726 0.20430,000 US Treasury 31.12.14/2.625% 353,122 0.49300,000 US Treasury 15.08.19/3.625% 267,408 0.37720,000 US Treasury 15.05.20/3.500% 637,490 0.89268,000 US Treasury 17.05.12/0.000% 206,430 0.29350,000 US Treasury 31.01.15/2.250% 284,665 0.40300,000 US Treasury 31.05.16/1.750% 241,498 0.34335,000 US Treasury 31.10.16/1.000% 260,368 0.36565,000 US Treasury 30.11.17/2.250% 463,969 0.65660,000 US Treasury 15.02.21/3.625% 589,609 0.82
1,418,000 US Treasury 15.11.21/2.000% 1,103,417 1.54455,000 US Treasury 15.11.40/4.250% 446,208 0.62495,000 US Treasury 15.02.41/4.750% 524,374 0.73
15,000 US Treasury 15.05.41/4.375% 15,024 0.02573,000 US Treasury 15.08.41/3.750% 518,061 0.7240,000 US Treasury 15.08.39/4.500% 40,686 0.06
530,000 US Treasury 15.08.40/3.875% 488,275 0.681,075,000 US Treasury (i) 15.02.19/8.875% 1,255,059 1.75
537,000 US Treasury (i) 15.02.36/4.500% 540,554 0.76165,000 Wachovia Bank Commercial
Mortgage Trust 2005-C20 A7 15.07.42/5.118%* 139,710 0.20400,000 Wachovia Bank Commercial
Mortgage Trust 2005-C21 A4 15.10.44/5.204%* 338,283 0.4765,000 Wachovia Bank Commercial
Mortgage Trust 2006-C25 A5 15.05.43/5.737%* 55,669 0.08265,000 Wells Fargo Home Equity Trust
2004-2 AI6 25.05.34/5.000%* 203,752 0.28149,504 Wells Fargo Mortgage Backed
Securities Trust 2005-2 2A1 25.04.20/4.750% 118,842 0.17
17,182,377 24.00
CANADA187,000 Canada (Government of) 01.06.33/5.750% 217,244 0.30140,000 Canada (Government of) 01.06.37/5.000% 154,570 0.22
371,814 0.52
CURACAO220,000 Teva Pharmaceutical Finance 10.11.16/2.400% 172,202 0.24
172,202 0.24
Total Bonds 17,726,393 24.76
Investment Funds
LUXEMBOURG172 JPMorgan Liquidity Funds - Euro Liquidity Fund (JPM
Euro Liquidity X (acc)) 2,403,890 3.36
2,403,890 3.36
Total Investment Funds 2,403,890 3.36
Total Transferable Securities Dealt in on AnotherRegulated Market
20,130,283 28.12
Other Transferable Securities
Bonds
UNITED STATES OF AMERICA2,350,000 Lehman Brothers Holdings
(Defaulted) 03.04.09/0.000% 470,706 0.66
470,706 0.66
Total Bonds 470,706 0.66
Total Other Transferable Securities 470,706 0.66
Total Investments 70,931,926 99.06
Cash 2,615,441 3.66
Other Assets/(Liabilities) (1,944,571) (2.72)
Total Net Assets 71,602,796 100.00
* Variable coupon rates are those quoted as at 31 December 2011.(i) Security partially or totally held as collateral against financial futures contracts by the broker.
70
JPMorgan Investment Funds - Global Bond Fund (EUR)
Schedule of Investments (Market Value Expressed in EUR) (continued)
As at 31 December 2011
Quantity/Nominal
Value
Name of Securities Maturity/Coupon
MarketValue
%of
NetAssets
Quantity/Nominal
Value
Name of Securities Maturity/Coupon
MarketValue
%of
NetAssets

Allocation of Portfolio as at 31 December 2011 % ofNet Assets
Fixed Income SecuritiesJapan 34.92United States of America 28.08United Kingdom 4.60France 4.22Italy 3.76Netherlands 3.17Spain 2.75Mexico 1.86Norway 1.66Germany 1.64Belgium 1.64South Korea 1.59Sweden 1.57Canada 1.19Denmark 0.86Brazil 0.57Russia 0.52International Agencies 0.46Curacao 0.24South Africa 0.16Cayman Islands 0.12Peru 0.12Total Fixed Income Securities 95.70Investment FundsLuxembourg 3.36Total Investment Funds 3.36Cash and Other Assets/(Liabilities) 0.94
Total 100.00
Allocation of Portfolio as at 30 June 2011 (Unaudited) % ofNet Assets
Fixed Income SecuritiesJapan 32.68United States of America 28.92Italy 5.65United Kingdom 3.98Netherlands 3.28South Africa 2.97France 2.54Germany 2.09Spain 2.01Belgium 1.76South Korea 1.68Mexico 1.55Canada 1.30Denmark 0.85Sweden 0.62Brazil 0.61Russia 0.53International Agencies 0.19Peru 0.10Luxembourg 0.08Total Fixed Income Securities 93.39Investment FundsLuxembourg 2.27Total Investment Funds 2.27Cash and Other Assets/(Liabilities) 4.34
Total 100.00
71
JPMorgan Investment Funds - Global Bond Fund (EUR)
Schedule of Investments (Market Value Expressed in EUR) (continued)
As at 31 December 2011
Quantity/Nominal
Value
Name of Securities Maturity/Coupon
MarketValue
%of
NetAssets
Quantity/Nominal
Value
Name of Securities Maturity/Coupon
MarketValue
%of
NetAssets

JPMorgan Investment Funds - Global Bond Fund (EUR)
Schedule of Investments - Outstanding To be Announced Securities (Expressed in EUR)
As at 31 December 2011
MaturityDate Name of Securities Coupon
NominalValue
MarketValue
UnrealisedGain/(Loss)
To be Announced Securities - Long Positions
UNITED STATES OF AMERICA
25-Jan-42 Fannie Mae 4.000% 2,800,000 2,263,925 7,668
Total 2,263,925 7,668
Schedule of Investments - Outstanding Financial Futures Contracts (Expressed in EUR)
ExpirationDate
Number ofContracts Security Description Currency
NotionalValue
UnrealisedGain/(Loss)
Bond Futures
Mar-12 1 Australia 3 Year Bond Future AUD 85,068 106Mar-12 3 Australia 10 Year Bond Future AUD 280,075 1,293Mar-12 7 Canada 10 Year Bond Future CAD 708,024 423Mar-12 (16) Euro-Bobl Future EUR (2,001,120) (1,920)Mar-12 (6) Euro-Bund Future EUR (833,640) (120)Mar-12 28 Euro-Schatz Future EUR 3,089,800 (560)Mar-12 22 Long Gilt Future GBP 3,080,622 (2,899)Mar-12 (31) US 2 Year Note Future USD (5,265,976) (746)Mar-12 37 US 5 Year Note Future USD 3,510,482 2,112Mar-12 42 US 10 Year Note Future USD 4,237,655 21,991Mar-12 8 US Long Bond Future USD 891,530 4,093Mar-12 (5) US Ultra Bond Future USD (616,189) 1,806
Total 25,579
JPMorgan Investment Funds - Global Bond Fund (EUR)
Schedule of Investments - Outstanding Forward Foreign Exchange Contracts (Expressed in EUR) (continued)
As at 31 December 2011
SettlementDate Currency
AmountPurchased Currency
AmountSold
UnrealisedGain/(Loss)
06-Jan-12 AUD 2,890,045 EUR 2,213,108 54,86706-Jan-12 BRL 910,000 USD 488,984 (916)06-Jan-12 CAD 662,941 NOK 3,783,080 13,75206-Jan-12 CAD 352,354 USD 346,171 (431)06-Jan-12 CHF 966,734 EUR 782,834 11,41406-Jan-12 CHF 304,199 USD 322,786 1,26006-Jan-12 CNY 6,190,000 USD 974,650 4,14306-Jan-12 DKK 4,377,765 EUR 588,880 11906-Jan-12 EUR 2,134,997 AUD 2,890,045 (132,979)06-Jan-12 EUR 759,274 CAD 1,015,295 (7,908)06-Jan-12 EUR 1,034,072 CHF 1,271,359 (10,450)06-Jan-12 EUR 588,640 DKK 4,377,765 (359)06-Jan-12 EUR 2,897,670 GBP 2,487,204 (80,131)06-Jan-12 EUR 25,125,661 JPY 2,610,882,807 (937,305)06-Jan-12 EUR 620,995 MXN 11,667,741 (23,238)06-Jan-12 EUR 256,745 NOK 2,005,393 (1,509)06-Jan-12 EUR 817,277 NZD 1,382,489 (8,275)06-Jan-12 EUR 738,543 SGD 1,250,000 (4,135)06-Jan-12 EUR 24,130,006 USD 32,296,873 (750,381)06-Jan-12 GBP 2,487,204 EUR 2,977,759 4306-Jan-12 JPY 2,610,882,807 EUR 25,592,978 469,98806-Jan-12 KRW 1,712,800,000 USD 1,488,455 (8,509)06-Jan-12 MXN 11,667,741 EUR 640,120 4,11206-Jan-12 NOK 5,788,474 EUR 737,352 8,08506-Jan-12 NZD 1,382,489 EUR 778,854 46,69806-Jan-12 SGD 1,250,000 USD 969,588 (4,258)06-Jan-12 USD 484,043 BRL 910,000 (2,891)06-Jan-12 USD 979,430 CNY 6,190,000 (460)06-Jan-12 USD 33,936,842 EUR 25,959,289 184,47206-Jan-12 USD 1,487,193 KRW 1,712,800,000 7,53609-Jan-12 EUR 1,206,684 SEK 11,182,351 (47,658)09-Jan-12 SEK 11,182,351 EUR 1,246,493 7,84907-Feb-12 CAD 880,051 EUR 661,021 3,28607-Feb-12 CNY 6,190,000 USD 977,266 (90)07-Feb-12 EUR 1,073,318 AUD 1,385,796 (9,722)
72

JPMorgan Investment Funds - Global Bond Fund (EUR)
Schedule of Investments - Outstanding Forward Foreign Exchange Contracts (Expressed in EUR) (continued)
As at 31 December 2011
SettlementDate Currency
AmountPurchased Currency
AmountSold
UnrealisedGain/(Loss)
07-Feb-12 EUR 588,827 DKK 4,377,765 (190)07-Feb-12 EUR 2,817,295 GBP 2,352,083 2,82807-Feb-12 EUR 24,586,904 JPY 2,506,639,812 (443,139)07-Feb-12 EUR 269,842 MXN 4,943,634 (2,316)07-Feb-12 EUR 1,244,322 SEK 11,182,351 (7,864)07-Feb-12 EUR 26,197,918 USD 34,251,238 (181,555)07-Feb-12 JPY 11,434,682 EUR 113,815 36607-Feb-12 NOK 2,132,969 CAD 362,380 74207-Feb-12 NOK 2,005,393 EUR 256,418 1,46107-Feb-12 NZD 1,382,489 EUR 815,453 7,99007-Feb-12 SGD 1,250,000 EUR 738,263 4,15407-Feb-12 USD 485,592 BRL 910,000 1,75507-Feb-12 USD 353,673 EUR 270,387 2,00307-Feb-12 USD 504,923 JPY 39,449,158 (5,040)07-Feb-12 USD 1,485,086 KRW 1,712,800,000 8,712
Total (1,824,074)
73

Transferable Securities Admitted to an Official Exchange Listing
Bonds
JAPAN496,000,000 Japan (Government of) 20.09.14/1.500% 6,655,603 11.40386,000,000 Japan (Government of) 20.03.20/1.300% 5,219,215 8.94167,000,000 Japan (Government of) 20.06.25/1.900% 2,311,583 3.96133,700,000 Japan (Government of) 20.12.28/1.900% 1,806,917 3.0992,000,000 Japan (Government of) 20.09.35/2.500% 1,350,136 2.31
17,343,454 29.70
UNITED KINGDOM300,000 Barclays Bank 08.09.14/2.125% 387,405 0.66150,000 Legal & General Group 08.06.25/4.000%* 161,204 0.28330,000 UK Treasury 07.09.15/4.750% 590,563 1.01155,000 UK Treasury 07.09.34/4.500% 304,219 0.52510,000 UK Treasury 07.12.42/4.500% 1,022,067 1.75145,000 UK Treasury 07.06.32/4.250% 274,868 0.4730,000 WPP Finance 2010 144A 21.11.21/4.750% 29,784 0.05
2,770,110 4.74
ITALY495,000 Italy (Republic of) 15.12.13/3.750% 630,552 1.08482,000 Italy (Republic of) 01.03.20/4.250% 542,072 0.93690,000 Italy (Republic of) 01.09.20/4.000% 751,747 1.28710,000 Italy (Republic of) 01.02.37/4.000% 646,847 1.11
2,571,218 4.40
UNITED STATES OF AMERICA145,000 AT&T 15.05.21/4.450% 160,915 0.27365,000 Bank of America 15.06.12/3.125% 369,958 0.6370,000 Bank of America 13.05.21/5.000% 63,799 0.1160,000 Citigroup 09.08.20/5.375% 61,958 0.1135,000 Citigroup 29.05.37/5.575% 35,301 0.06
350,000 Citigroup Funding 10.12.12/2.250% 356,516 0.6175,000 Duke Energy Carolinas 15.12.16/1.750% 75,533 0.1380,000 Enterprise Products Operating 15.02.42/5.700% 87,012 0.1530,000 ERP Operating 15.12.21/4.625% 30,595 0.05
350,000 General Electric Capital 28.09.12/2.000% 354,769 0.6180,000 Morgan Stanley 26.01.20/5.500% 73,947 0.13
170,000 NBC Universal Media 01.04.21/4.375% 180,914 0.31135,000 Tennessee Valley Authority 15.09.39/5.250% 172,909 0.30
2,024,126 3.47
SPAIN395,000 Spain (Kingdom of) 31.01.14/4.250% 522,383 0.8950,000 Spain (Kingdom of) 30.07.19/4.600% 64,957 0.11
393,000 Spain (Kingdom of) 30.04.20/4.000% 485,683 0.83435,000 Spain (Kingdom of) 31.10.20/4.850% 563,962 0.97
70,000 Telefonica Emisiones 16.02.21/5.462% 67,450 0.12
1,704,435 2.92
NETHERLANDS350,000 LeasePlan 22.05.14/3.250% 475,545 0.81100,000 Linde Finance 01.06.21/3.875% 138,284 0.24735,000 Netherlands (Kingdom of) 15.07.18/4.000% 1,083,999 1.86
1,697,828 2.91
MEXICO245,000 America Movil 08.09.16/2.375% 244,451 0.42125,000 Mexico (United Mexican States) 05.12.24/10.000% 1,157,985 1.98
1,402,436 2.40
FRANCE249,000 France (Government of) 25.04.35/4.750% 379,274 0.65625,000 France (Government of) 25.04.60/4.000% 863,014 1.48100,000 Société des Autoroutes
Paris-Rhin-Rhone 12.01.17/5.000% 132,136 0.22
1,374,424 2.35
BELGIUM710,000 Belgium (Kingdom of) 28.03.18/4.000% 946,597 1.62
946,597 1.62
SWEDEN370,000 Swedbank Hypotek 07.09.15/2.250% 485,452 0.83
2,530,000 Sweden (Kingdom of) 12.08.17/3.750% 418,888 0.72
904,340 1.55
NORWAY370,000 DNB Boligkreditt 18.10.16/2.500% 485,784 0.83
35,000 International Paper 15.11.41/6.000% 38,013 0.06281,000 Sparebank 1 Boligkreditt GMTN 22.11.16/2.375% 366,359 0.63
890,156 1.52
SOUTH KOREA1,023,000,000 Korea (Republic of) 10.06.12/4.000% 887,667 1.52
887,667 1.52
DENMARK2,600,000 Denmark (Kingdom of) 15.11.17/4.000% 535,398 0.92
535,398 0.92
AUSTRIA255,000 Austria (Republic of) 15.03.19/4.350% 365,541 0.63108,000 Austria (Republic of) 15.03.26/4.850% 164,680 0.28
530,221 0.91
POLAND1,200,000 Poland (Government of) 25.04.14/5.750% 356,290 0.61
356,290 0.61
BRAZIL555 Brazil (Republic of) 01.01.13/10.000% 312,143 0.53
312,143 0.53
CANADA180,000 Suncor Energy 01.06.18/6.100% 213,314 0.3750,000 Xstrata Canada Financial 27.05.20/7.375% 90,028 0.15
303,342 0.52
GERMANY90,000 Germany (Federal Republic of) 04.01.31/5.500% 169,741 0.2990,000 Germany (Federal Republic of) 04.07.21/3.250% 132,033 0.23
301,774 0.52
INTERNATIONAL AGENCIES100,000 Eurasian Development Bank
144A 29.09.14/7.375% 105,514 0.18195,000 European Investment Bank 15.05.14/1.500% 195,753 0.34
301,267 0.52
RUSSIAN FEDERATION225,450 Russian (Republic of) 31.03.30/7.500%* 262,294 0.45
262,294 0.45
FINLAND160,000 Finland (Government of) 15.09.14/3.125% 221,568 0.38
221,568 0.38
SOUTH AFRICA100,000 South Africa (Republic of) 09.03.20/5.500% 112,095 0.19
112,095 0.19
CAYMAN ISLANDS65,000 Transocean 15.12.21/6.375% 68,550 0.12
68,550 0.12
PERU45,000 Peru (Republic of) 21.11.33/8.750% 68,578 0.12
68,578 0.12
Total Bonds 37,890,311 64.89
Total Transferable Securities Admitted to anOfficial Exchange Listing
37,890,311 64.89
Transferable Securities Dealt in on Another Regulated Market
Bonds
UNITED STATES OF AMERICA90,324 ACE Securities 2005-HE4 M1 25.07.35/0.794%* 87,847 0.15282,711 Aegis Asset Backed Securities
Trust 2004-3 A1 25.09.34/0.654% 256,091 0.44135,000 Alberto-Culver 144A 15.11.21/4.750% 139,706 0.24
74
JPMorgan Investment Funds - Global Bond Fund (USD)
Schedule of Investments (Market Value Expressed in USD)
As at 31 December 2011
Quantity/Nominal
Value
Name of Securities Maturity/Coupon
MarketValue
%of
NetAssets
Quantity/Nominal
Value
Name of Securities Maturity/Coupon
MarketValue
%of
NetAssets

36,331 Asset Backed FundingCertificates 2005-HE2 M1 25.06.35/0.774%* 35,657 0.06
570,000 Bear Stearns CommercialMortgage Securities2005-PWR9 A4A 11.09.42/4.871% 619,752 1.06
55,000 Bear Stearns CommercialMortgage Securities2006-PW14 AM 11.12.38/5.243% 54,224 0.09
675,000 Citibank Omni Master Trust2009-A8 A8 16.05.16/2.378%* 679,241 1.16
819,414 Countrywide Alternative LoanTrust 2005-J14 A3 25.12.35/5.500% 597,315 1.02
103,682 Credit Suisse First BostonMortgage Securities 2004-3 2A1 25.04.19/5.000% 107,102 0.18
131,353 Credit Suisse First BostonMortgage Securities2005-C2 AAB 15.04.37/4.681% 134,625 0.23
47,484 Daimler Chrysler Auto Trust2007-A A4 08.03.13/5.280% 47,536 0.08
637,647 Fannie Mae REMICS 2010-116 BI 25.08.20/5.000% 65,054 0.11320,000 Greenwich Capital Commercial
Funding 2005-GG3 A4 10.08.42/4.799%* 344,273 0.591,116,143 Harborview Mortgage Loan
Trust 2005-11 2A1A 19.08.45/0.595% 735,854 1.26707,553 Indymac Index Mortgage Loan
Trust 2004-AR14 2A1A 25.01.35/0.654% 358,863 0.62110,000 JP Morgan Chase Commercial
Mortgage Securities2004-CBX A6 12.01.37/4.899% 116,757 0.20
96,047 JP Morgan Mortgage Trust2005-S2 1A1 25.08.20/4.500% 96,572 0.17
65,000 LB-UBS Commercial MortgageTrust 2005-C2 A5 15.04.30/5.150% 69,882 0.12
475,000 LB-UBS Commercial MortgageTrust 2006-C6 A4 15.09.39/5.372% 528,167 0.90
89,775 Morgan Stanley ABS Capital I2004-SD2 A 25.04.34/0.744%* 77,976 0.13
220,000 Morgan Stanley Capital I2005-HQ7 A4 14.11.42/5.202%* 242,494 0.42
160,000 Morgan Stanley Capital I2006-IQ12 A4 15.12.43/5.332% 179,554 0.31
85,000 Nisource Finance 01.02.42/5.800% 89,712 0.1580,000 Park Place Securities
2005-WHQ3 M1 25.06.35/0.714%* 70,407 0.12259,383 Residential Asset Mortgage
Products 2004-RS11 M1 25.11.34/0.914%* 237,518 0.4160,334 Residential Funding Mortgage
Securities I 2006-S12 2A2 25.12.36/6.000% 55,413 0.09119,700 Structured Asset Securities
2005-WF4 A4 25.11.35/0.654%* 113,381 0.19515,000 US Treasury 15.08.19/3.625% 595,871 1.02160,000 US Treasury 17.05.12/0.000% 159,970 0.27250,000 US Treasury 15.11.14/0.375% 250,039 0.43190,000 US Treasury 31.05.16/1.750% 198,535 0.34
5,000 US Treasury 31.07.16/1.500% 5,164 0.01160,000 US Treasury 30.09.16/1.000% 161,513 0.28255,000 US Treasury 31.12.17/2.750% 279,275 0.48685,000 US Treasury 15.05.21/3.125% 764,043 1.31195,000 US Treasury 15.11.21/2.000% 196,965 0.34275,000 US Treasury 15.11.40/4.250% 350,066 0.6085,000 US Treasury 15.02.41/4.750% 116,882 0.20
155,000 US Treasury 15.08.41/3.750% 181,907 0.31440,000 US Treasury 31.10.15/1.250% 450,931 0.77423,000 US Treasury 15.02.31/5.375% 602,378 1.03139,000 US Treasury 15.08.39/4.500% 183,523 0.32185,000 US Treasury (i) 15.02.14/4.000% 199,504 0.34775,000 US Treasury (i) 15.02.36/4.500% 1,012,647 1.73135,000 Wachovia Bank Commercial
Mortgage Trust 2005-C20 A7 15.07.42/5.118% 148,377 0.26255,000 Wachovia Bank Commercial
Mortgage Trust 2005-C21 A4 15.10.44/5.204%* 279,931 0.4855,000 Wachovia Bank Commercial
Mortgage Trust 2006-C25 A5 15.05.43/5.737% 61,144 0.10969,113 WaMu Mortgage Pass Through
Certificates 2005-AR9 A1A 25.07.45/0.614% 698,210 1.20145,000 Wells Fargo Home Equity Trust
2004-2 AI6 25.05.34/5.000% 144,716 0.2580,358 Wells Fargo Mortgage Backed
Securities Trust 2005-2 2A1 25.04.20/4.750% 82,916 0.14
13,265,480 22.71
CANADA900,000 Canada (Government of) 01.06.12/3.750% 893,087 1.53144,000 Canada (Government of) 01.06.33/5.750% 217,150 0.3790,000 Canada (Government of) 01.06.37/5.000% 128,982 0.2240,000 Xstrata Canada Financial 144A 15.11.41/6.000% 41,197 0.07
1,280,416 2.19
UNITED KINGDOM168,950 Themeleion Mortgage Finance 2 A 12.01.40/1.727% 147,717 0.25
147,717 0.25
NETHERLANDS ANTILLES125,000 Teva Pharmaceutical Finance 10.11.16/2.400% 127,004 0.23
127,004 0.23
Total Bonds 14,820,617 25.38
Investment Funds
LUXEMBOURG284 JPMorgan Liquidity Funds - US Dollar Liquidity Fund
(JPM US Dollar Liquidity X (acc)) 4,000,980 6.84
4,000,980 6.84
Total Investment Funds 4,000,980 6.84
Total Transferable Securities Dealt in on AnotherRegulated Market
18,821,597 32.22
Other Transferable Securities
Bonds
UNITED STATES OF AMERICA2,000,000 Lehman Brothers Holdings
(Defaulted) 03.04.09/0.000% 520,000 0.88
520,000 0.88
Total Bonds 520,000 0.88
Total Other Transferable Securities 520,000 0.88
Total Investments 57,231,908 97.99
Cash 1,915,421 3.28
Other Assets/(Liabilities) (744,402) (1.27)
Total Net Assets 58,402,927 100.00
* Variable coupon rates are those quoted as at 31 December 2011.(i) Security partially or totally held as collateral against financial futures contracts by the broker.
75
JPMorgan Investment Funds - Global Bond Fund (USD)
Schedule of Investments (Market Value Expressed in USD) (continued)
As at 31 December 2011
Quantity/Nominal
Value
Name of Securities Maturity/Coupon
MarketValue
%of
NetAssets
Quantity/Nominal
Value
Name of Securities Maturity/Coupon
MarketValue
%of
NetAssets

Allocation of Portfolio as at 31 December 2011 % ofNet Assets
Fixed Income SecuritiesJapan 29.70United States of America 27.06United Kingdom 4.99Italy 4.40Spain 2.92Netherlands 2.91Canada 2.71Mexico 2.40France 2.35Belgium 1.62Sweden 1.55Norway 1.52South Korea 1.52Denmark 0.92Austria 0.91Poland 0.61Brazil 0.53Germany 0.52International Agencies 0.52Russian Federation 0.45Finland 0.38Netherlands Antilles 0.23South Africa 0.19Peru 0.12Cayman Islands 0.12Total Fixed Income Securities 91.15Investment FundsLuxembourg 6.84Total Investment Funds 6.84Cash and Other Assets/(Liabilities) 2.01
Total 100.00
Allocation of Portfolio as at 30 June 2011 % ofNet Assets
Fixed Income SecuritiesUnited States of America 29.77Japan 27.77Italy 5.83United Kingdom 4.85South Africa 3.20Netherlands 3.17France 2.90Canada 2.87Spain 2.76Mexico 2.29Belgium 1.81South Korea 1.67Austria 0.99Denmark 0.94Poland 0.77Sweden 0.73Brazil 0.60Russia 0.48Finland 0.41Germany 0.28International Agencies 0.19Peru 0.11Luxembourg 0.09Total Fixed Income Securities 94.48Investment FundsLuxembourg 1.56Total Investment Funds 1.56Cash and Other Assets/(Liabilities) 3.96
Total 100.00
76
JPMorgan Investment Funds - Global Bond Fund (USD)
Schedule of Investments (Market Value Expressed in USD) (continued)
As at 31 December 2011
Quantity/Nominal
Value
Name of Securities Maturity/Coupon
MarketValue
%of
NetAssets
Quantity/Nominal
Value
Name of Securities Maturity/Coupon
MarketValue
%of
NetAssets

JPMorgan Investment Funds - Global Bond Fund (USD)
Schedule of Investments - Outstanding To be Announced Securities (Expressed in USD)
As at 31 December 2011
MaturityDate Name of Securities Coupon
NominalValue
MarketValue
UnrealisedGain/(Loss)
To be Announced Securities - Long Positions
UNITED STATES OF AMERICA
25-Jan-42 Fannie Mae 4.000% 1,810,000 1,899,652 6,434
Total 1,899,652 6,434
Schedule of Investments - Outstanding Financial Futures Contracts (Expressed in USD)
ExpirationDate
Number ofContracts Security Description Currency
NotionalValue
UnrealisedGain/(Loss)
Bond Futures
Mar-12 1 Australia 10 Year Bond Future AUD 121,184 559Mar-12 4 Canada 10 Year Bond Future CAD 525,172 314Mar-12 6 Euro-Bobl Future EUR 974,083 896Mar-12 2 Euro-Bund Future EUR 360,702 52Mar-12 13 Euro-Schatz Future EUR 1,862,118 (337)Mar-12 1 Japan 10 Year Bond Future JPY 1,845,287 1,814Mar-12 13 Long Gilt Future GBP 2,362,928 (2,223)Mar-12 (18) US 2 Year Note Future USD (3,969,000) (640)Mar-12 5 US 5 Year Note Future USD 615,781 281Mar-12 29 US 10 Year Note Future USD 3,798,094 16,905Mar-12 (4) US Long Bond Future USD (578,625) (2,656)Mar-12 (1) US Ultra Bond Future USD (159,969) 469
Total 15,434
JPMorgan Investment Funds - Global Bond Fund (USD)
Schedule of Investments - Outstanding Forward Foreign Exchange Contracts (Expressed in USD) (continued)
As at 31 December 2011
SettlementDate Currency
AmountPurchased Currency
AmountSold
UnrealisedGain/(Loss)
04-Jan-12 AUD 1,801,550 USD 1,818,911 16,70104-Jan-12 BRL 550,000 USD 295,858 (882)04-Jan-12 CAD 404,989 NOK 2,311,138 10,89204-Jan-12 CAD 692,442 USD 677,448 1,77404-Jan-12 CHF 534,615 EUR 432,895 8,21904-Jan-12 CHF 206,483 USD 219,089 1,11704-Jan-12 CNY 3,670,000 USD 577,953 3,47904-Jan-12 DKK 2,898,361 USD 509,672 (3,483)04-Jan-12 EUR 203,638 SEK 1,881,363 (9,688)04-Jan-12 EUR 9,486,333 USD 12,406,261 (92,323)04-Jan-12 GBP 1,555,917 USD 2,441,597 (23,456)04-Jan-12 JPY 1,296,868,648 USD 16,643,379 161,26204-Jan-12 KRW 1,027,640,000 USD 892,049 (5,145)04-Jan-12 MXN 12,446,044 USD 907,281 (15,110)04-Jan-12 NOK 3,439,735 USD 580,310 (5,272)04-Jan-12 NZD 760,534 USD 560,536 29,06904-Jan-12 PLN 1,189,180 USD 350,599 (4,009)04-Jan-12 SEK 6,822,818 USD 988,083 5,67404-Jan-12 SGD 740,000 USD 573,995 (3,272)04-Jan-12 USD 1,737,649 AUD 1,801,550 (97,963)04-Jan-12 USD 287,507 BRL 550,000 (7,469)04-Jan-12 USD 1,042,645 CAD 1,097,431 (33,833)04-Jan-12 USD 800,859 CHF 740,290 11,36704-Jan-12 USD 579,962 CNY 3,670,000 (1,470)04-Jan-12 USD 516,852 DKK 2,898,361 10,66304-Jan-12 USD 12,271,078 EUR 9,257,076 254,73204-Jan-12 USD 2,406,993 GBP 1,555,917 (11,149)04-Jan-12 USD 16,755,472 JPY 1,296,868,648 (49,169)04-Jan-12 USD 878,700 KRW 1,027,640,000 (8,203)04-Jan-12 USD 868,403 MXN 12,446,044 (23,768)04-Jan-12 USD 189,702 NOK 1,128,597 1,02904-Jan-12 USD 586,869 NZD 760,534 (2,737)04-Jan-12 USD 346,764 PLN 1,189,180 17404-Jan-12 USD 706,274 SEK 4,941,455 (13,459)04-Jan-12 USD 572,143 SGD 740,000 1,419
77

JPMorgan Investment Funds - Global Bond Fund (USD)
Schedule of Investments - Outstanding Forward Foreign Exchange Contracts (Expressed in USD) (continued)
As at 31 December 2011
SettlementDate Currency
AmountPurchased Currency
AmountSold
UnrealisedGain/(Loss)
03-Feb-12 CNY 3,670,000 USD 578,682 86903-Feb-12 NOK 1,277,185 CAD 216,998 58103-Feb-12 NOK 1,128,597 USD 189,533 (1,066)03-Feb-12 NZD 760,534 USD 585,683 2,63103-Feb-12 SGD 740,000 USD 572,143 (1,483)03-Feb-12 USD 803,034 AUD 795,599 (4,638)03-Feb-12 USD 293,772 BRL 550,000 1,45503-Feb-12 USD 454,339 CAD 465,702 (2,136)03-Feb-12 USD 509,908 DKK 2,898,361 3,60003-Feb-12 USD 11,989,421 EUR 9,178,736 72,25603-Feb-12 USD 2,425,085 GBP 1,546,480 22,30503-Feb-12 USD 16,762,263 JPY 1,305,586,524 (163,735)03-Feb-12 USD 890,040 KRW 1,027,640,000 5,60703-Feb-12 USD 614,158 MXN 8,502,366 6,22503-Feb-12 USD 349,589 PLN 1,189,180 4,05903-Feb-12 USD 986,778 SEK 6,822,818 (5,392)
Total 46,849
78

Transferable Securities Admitted to an Official Exchange Listing
Shares
UNITED STATES OF AMERICA5,280 Abbott Laboratories 229,273 0.2712,158 Adobe Systems 266,426 0.315,699 AGCO 188,854 0.224,871 Agilent Technologies 132,315 0.153,308 Alaska Air Group 193,108 0.223,862 Allergan 262,148 0.3013,173 Altria Group 301,100 0.351,280 Amazon.com 171,664 0.20
17,968 American Eagle Outfitters 212,133 0.245,177 American Express 189,085 0.227,224 American Financial Group 207,112 0.245,019 Ameriprise Financial 193,638 0.226,480 AmerisourceBergen 186,380 0.226,614 Amgen 330,458 0.384,747 Anadarko Petroleum 280,329 0.322,904 Apache 202,154 0.234,145 Apple 1,294,416 1.49
17,703 AT&T 412,350 0.475,026 Baker Hughes 187,790 0.228,898 BB&T 172,641 0.207,536 BE Aerospace 225,142 0.262,887 Biogen Idec 245,252 0.28
11,441 Brinker International 236,832 0.2712,835 Bristol-Myers Squibb 349,884 0.403,306 Cabot Oil & Gas 196,098 0.237,489 Capital One Financial 245,258 0.282,859 Caterpillar 200,849 0.23
11,395 CBS - Non voting B Shares 240,927 0.2811,646 Chevron 962,059 1.114,889 Cigna 158,868 0.18
40,425 Cisco Systems 568,202 0.6532,049 Citigroup 658,115 0.76
6,556 Coca-Cola 354,783 0.4112,350 Coca-Cola Enterprises 246,705 0.283,988 Cognizant Technology Solutions - A Shares 196,919 0.2313,219 Comcast - A Shares 242,424 0.2813,280 CSX 215,510 0.253,554 Cummins 243,199 0.285,442 Danaher 198,240 0.23
18,401 Dell 208,740 0.2410,394 Discover Financial Services 192,658 0.228,506 Dow Chemical 188,658 0.227,233 El Paso Electric 196,504 0.228,181 Eli Lilly & Co. 263,603 0.30
11,643 EMC/Massachusetts 195,044 0.226,067 Endo Pharmaceuticals Holdings 161,671 0.196,125 Exelon 206,369 0.249,835 Express 151,383 0.176,998 Exxon Mobil 459,192 0.53
22,180 Fifth Third Bancorp 218,459 0.259,865 Freeport-McMoRan Copper & Gold 282,107 0.333,378 Gardner Denver 199,549 0.23
37,119 General Electric 516,586 0.591,558 Google - A Shares 773,713 0.897,253 Hain Celestial Group 208,781 0.242,128 Hansen Natural 152,405 0.175,071 Helmerich & Payne 229,300 0.263,575 Humana 242,832 0.28
18,913 Intel 358,211 0.414,948 International Business Machines 709,542 0.82
32,450 Interpublic Group of Companies 241,366 0.283,281 JM Smucker 198,950 0.236,703 Johnson & Johnson 339,346 0.395,102 Kansas City Southern 267,511 0.314,280 Kirby 217,734 0.254,530 KLA-Tencor 170,933 0.208,296 Kraft Foods - A Shares 239,635 0.27
13,295 Kroger 249,041 0.294,804 Lam Research 138,156 0.16
13,946 Lowe’s 276,062 0.324,355 Ltd Brands 136,382 0.169,430 Macy’s 235,269 0.279,977 Marathon Oil 226,319 0.26
775 Mastercard - A Shares 224,577 0.2624,462 Merck & Co. 712,819 0.8232,000 Microsoft 641,085 0.74
7,680 Moody’s 200,572 0.236,151 Motorola Solutions 220,655 0.25
11,330 Nasdaq OMX Group 214,677 0.253,608 National Oilwell Varco 189,454 0.223,695 Newmont Mining 172,887 0.20
13,260 News - B Shares 186,276 0.212,867 Noble Energy 211,273 0.244,234 Norfolk Southern 238,374 0.274,082 Occidental Petroleum 295,902 0.343,877 Oil States International 228,624 0.267,220 Old Dominion Freight Line 228,411 0.269,827 Oracle 195,208 0.223,336 Parker Hannifin 196,156 0.23
55,564 Pfizer 931,667 1.079,390 Philip Morris International 570,323 0.66
20,138 Pier 1 Imports 217,197 0.253,548 Pioneer Natural Resources 244,811 0.286,096 Plains Exploration & Production 173,786 0.205,370 PNC Financial Services Group 239,076 0.271,880 Precision Castparts 240,053 0.28
549 Priceline.com 199,874 0.233,217 Pricesmart 172,752 0.20
12,529 Principal Financial Group 238,988 0.277,821 Prudential Financial 302,163 0.356,143 Qualcomm 259,553 0.306,090 Ross Stores 224,941 0.26
47 Rovi 890 0.005,281 Ryder System 216,277 0.256,952 SanDisk 266,314 0.318,002 Starwood Hotels & Resorts Worldwide 300,125 0.347,271 State Street 227,308 0.264,319 Tech Data 166,681 0.193,430 Towers Watson & Co. - A Shares 158,625 0.1812,210 Tyson Foods - A Shares 195,042 0.223,452 United Technologies 196,116 0.236,198 UnitedHealth Group 243,661 0.2813,171 US Bancorp 275,535 0.329,664 Valero Energy 153,702 0.181,968 VF 193,032 0.224,487 Viacom - B Shares 158,456 0.185,333 Wal-Mart Stores 245,954 0.283,321 Watson Pharmaceuticals 154,761 0.184,022 Weight Watchers International 172,261 0.20
36,477 Wells Fargo & Co. 778,268 0.89
33,125,793 38.10
UNITED KINGDOM30,851 ARM Holdings 218,309 0.2586,678 Aviva 311,867 0.36175,263 Barclays 369,333 0.4222,274 BG Group 367,171 0.4216,029 British American Tobacco 586,990 0.67
102,333 BT Group 233,965 0.2716,268 Burberry Group 230,915 0.2733,780 GlaxoSmithKline 595,061 0.6920,135 IMI 182,741 0.217,550 Imperial Tobacco Group 220,302 0.26
51,800 Inchcape 181,476 0.2116,463 Intercontinental Hotels Group 228,459 0.26
161,687 Legal & General Group 199,208 0.2336,350 Meggitt 153,354 0.1838,855 Prudential 296,813 0.3414,016 Rio Tinto 524,558 0.6010,535 Spectris 161,963 0.1926,309 Standard Chartered 443,923 0.51
405,577 Taylor Wimpey 181,861 0.2114,088 Tullow Oil 235,984 0.27
7,820 Unilever 202,478 0.23374,600 Vodafone Group 802,629 0.92
10,682 Weir Group 260,403 0.3053,760 WM Morrison Supermarkets 209,939 0.2421,369 Xstrata 249,974 0.29
7,649,676 8.80
JAPAN7,100 FamilyMart 220,597 0.25
50,000 Hitachi 201,643 0.2370,000 Isuzu Motors 248,410 0.2923,200 ITOCHU 181,219 0.21
64 Japan Tobacco 231,590 0.2756,200 JX Holdings 261,429 0.3011,700 Komatsu 209,994 0.24
43,000 Marubeni 201,314 0.2314,100 Mitsubishi 218,868 0.2520,300 Mitsui & Co. 242,562 0.28
5,600 Nippon Telegraph & Telephone 219,831 0.2535,500 Nissan Motor 244,872 0.28
3,560 ORIX 226,194 0.26262 Rakuten 216,160 0.25
4,100 Sanrio 161,766 0.19
79
JPMorgan Investment Funds - Global Capital Appreciation Fund
Schedule of Investments (Market Value Expressed in EUR)
As at 31 December 2011
Quantity/Nominal
Value
Name of Securities Maturity/Coupon
MarketValue
%of
NetAssets
Quantity/Nominal
Value
Name of Securities Maturity/Coupon
MarketValue
%of
NetAssets

2,000 SMC 247,462 0.2823,200 Sumitomo 240,970 0.28
3,774,881 4.34
GERMANY5,024 Allianz Registered Shares 370,394 0.437,491 BASF 402,454 0.468,508 Bayer Registered Shares 418,487 0.483,275 Bayerische Motoren Werke 168,974 0.194,055 Continental 194,529 0.22
15,556 E.ON 257,957 0.302,964 Fresenius & Co. KGaA 212,222 0.244,515 Henkel & Co. KGaA Non Voting Preference Shares 201,888 0.233,918 Lanxess 155,623 0.181,909 Linde 219,249 0.255,143 SAP 210,516 0.242,176 Siemens Registered Shares 160,621 0.199,291 Suedzucker 229,627 0.263,359 Volkswagen Preference Shares 387,545 0.45
3,590,086 4.12
FRANCE53,133 AXA 529,869 0.611,578 LVMH Moet Hennessy Louis Vuitton 170,897 0.20
2,660 Pernod-Ricard 189,538 0.222,361 PPR 261,540 0.308,781 Sanofi 494,765 0.573,331 Technip 241,814 0.28
16,473 Total 647,966 0.7417,679 Vivendi 297,051 0.34
2,833,440 3.26
SWITZERLAND5,016 ACE 272,334 0.317,727 Compagnie Financiere Richemont - Bearer A Shares 302,337 0.35
15,208 Nestlé Registered Shares 674,387 0.7714,445 Novartis Registered Shares 636,102 0.73
4,134 Roche Holding - Genussschein 539,853 0.627,292 TE Connectivity 174,063 0.201,044 Zurich Financial Services 182,094 0.21
2,781,170 3.19
NETHERLANDS7,942 Chicago Bridge & Iron - NY Shares 232,163 0.27
59,439 ING Groep - CVA 329,530 0.3817,909 Koninklijke KPN 165,551 0.1930,585 Royal Dutch Shell - A Shares 862,726 0.99
7,120 Unilever - CVA 188,609 0.22
1,778,579 2.05
CHINA81,500 Anhui Conch Cement - H Shares * 186,136 0.21
503,000 China Construction Bank - H Shares * 269,921 0.31134,559 China Merchants Bank - H Shares * 209,415 0.2449,000 China Shenhua Energy - H Shares * 163,673 0.19
280,000 China Southern Airlines - H Shares * 109,011 0.12504,000 Industrial & Commercial Bank of China - H Shares * 230,714 0.27
32,000 Ping An Insurance Group Co. of China - H Shares * 162,435 0.19
1,331,305 1.53
CANADA6,000 BCE 191,486 0.222,880 Canadian National Railway 172,694 0.2014,516 First Quantum Minerals 217,921 0.2510,519 Suncor Energy 233,436 0.274,553 TELUS Non Voting 187,765 0.223,217 Toronto-Dominion Bank 183,881 0.21
1,187,183 1.37
AUSTRALIA17,501 BHP Billiton 473,414 0.557,793 Flight Centre 100,600 0.12
10,299 Iluka Resources 125,226 0.1474,961 Regis Resources 200,420 0.2323,060 Resolute Mining 29,650 0.03
929,310 1.07
JERSEY11,887 Petrofac 204,951 0.246,216 Shire 166,864 0.19
29,930 WPP 242,163 0.28
613,978 0.71
BRAZIL7,449 Cia Hering 100,028 0.128,000 Cielo 159,329 0.186,107 Companhia de Bebidas das Americas Preference
Shares ADR 170,877 0.207,582 Tim Participacoes ADR 149,823 0.17
580,057 0.67
SOUTH KOREA1,036 Hyundai Motor 147,012 0.172,982 Kia Motors 132,454 0.15
373 Samsung Electronics 262,727 0.30
542,193 0.62
HONG KONG79,600 AIA Group 191,468 0.2295,000 Galaxy Entertainment Group 134,091 0.1549,100 Wharf Holdings 171,068 0.20
496,627 0.57
IRELAND3,821 Accenture - A Shares 157,971 0.188,781 Covidien 305,632 0.35
463,603 0.53
INDIA20,443 Federal Bank 100,537 0.12
9,461 HDFC Bank ADR 189,759 0.2245,690 Yes Bank 158,400 0.18
448,696 0.52
SWEDEN10,609 Lundin Petroleum 199,370 0.2310,099 Tele2 - B Shares 150,570 0.18
349,940 0.41
CAYMAN ISLANDS643 ENN Energy Holdings 1,583 0.00
3,734 Herbalife 150,807 0.1783,200 Sands China 180,115 0.21
332,505 0.38
ISRAEL9,149 Teva Pharmaceutical Industries ADR 286,759 0.33
286,759 0.33
FINLAND9,988 Nokian Renkaat 246,004 0.28
246,004 0.28
INDONESIA376,000 Bank Rakyat Indonesia Persero 216,419 0.25
216,419 0.25
ITALY61,200 Prada 213,226 0.25
213,226 0.25
BERMUDA5,600 Jardine Matheson Holdings 203,219 0.23
203,219 0.23
GUERNSEY60,983 Resolution 183,966 0.21
183,966 0.21
RUSSIAN FEDERATION22,041 Gazprom OAO ADR 181,178 0.21
181,178 0.21
80
JPMorgan Investment Funds - Global Capital Appreciation Fund
Schedule of Investments (Market Value Expressed in EUR) (continued)
As at 31 December 2011
Quantity/Nominal
Value
Name of Securities Maturity/Coupon
MarketValue
%of
NetAssets
Quantity/Nominal
Value
Name of Securities Maturity/Coupon
MarketValue
%of
NetAssets

MEXICO3,174 Fomento Economico Mexicano ADR 171,641 0.20
171,641 0.20
SINGAPORE7,308 Avago Technologies 162,200 0.19
162,200 0.19
Total Shares 64,673,634 74.39
Bonds
AUSTRALIA3,600,000 Australia (Commonwealth of) 20.08.20/4.000% 5,273,610 6.07
5,273,610 6.07
UNITED STATES OF AMERICA2,000,000 Cellco Partnership/Verizon
Wireless Capital 01.02.14/5.550% 1,680,852 1.93995,000 Roche Holdings 04.03.15/5.500% 1,341,713 1.55
3,022,565 3.48
FRANCE113,000 Sanofi 17.05.13/3.500% 116,520 0.12
116,520 0.12
Total Bonds 8,412,695 9.67
Convertible Bonds
GERMANY2,400,000 KfW - Kreditanstalt fuer
Wiederaufbau 27.06.13/3.250% 2,456,580 2.83
2,456,580 2.83
Total Convertible Bonds 2,456,580 2.83
Total Transferable Securities Admitted to an OfficialExchange Listing
75,542,909 86.89
Transferable Securities Dealt in on Another Regulated Market
Bonds
NETHERLANDS652,836 Holland Euro-Denominated
Mortgage Backed Series 11 A 18.09.40/1.539%** 624,605 0.72
624,605 0.72
UNITED KINGDOM394,202 Paragon Mortgages 9X AB 15.05.41/1.822%** 303,224 0.35
9,339 Prominent CMBS Funding 1 A1 20.12.32/1.647%** 9,105 0.01
312,329 0.36
Total Bonds 936,934 1.08
Investment Funds
UNITED STATES OF AMERICA144,358 iShares MSCI Emerging Markets Index Fund 4,229,927 4.87
4,229,927 4.87
LUXEMBOURG1,200,000 JPMorgan Liquidity Funds - Euro Liquidity Fund (JPM
Euro Liquidity X (dist)) 1,200,000 1.37
1,200,000 1.37
Total Investment Funds 5,429,927 6.24
Total Transferable Securities Dealt in on AnotherRegulated Market
6,366,861 7.32
Total Investments 81,909,770 94.21
Cash 8,501,968 9.78
Other Assets/(Liabilities) (3,467,956) (3.99)
Total Net Assets 86,943,782 100.00
* Hong Kong Registered Shares.** Variable coupon rates are those quoted as at 31 December 2011.
Allocation of Portfolio as at 31 December 2011 % ofNet Assets
Fixed Income SecuritiesAustralia 6.07United States of America 3.48Germany 2.83Netherlands 0.72United Kingdom 0.36France 0.12Total Fixed Income Securities 13.58SharesFinancials 12.11Consumer Discretionary 10.37Health Care 9.43Information Technology 9.33Energy 8.83Industrials 8.83Consumer Staples 6.89Investment Companies 6.24Materials 4.61Telecommunication Services 3.23Utilities 0.76Total Shares 80.63Cash and Other Assets/(Liabilities) 5.79
Total 100.00
Allocation of Portfolio as at 30 June 2011 (Unaudited) % ofNet Assets
Fixed Income SecuritiesAustralia 5.86France 4.64United States of America 2.68Germany 2.46Netherlands 0.65United Kingdom 0.35Total Fixed Income Securities 16.64SharesFinancials 13.04Consumer Discretionary 9.81Industrials 8.06Health Care 8.06Information Technology 7.68Energy 7.35Materials 5.77Investment Companies 4.62Consumer Staples 3.76Telecommunication Services 2.67Utilities 0.47Total Shares 71.29Cash Equivalents, Cash and Other Assets/(Liabilities) 12.07
Total 100.00
81
JPMorgan Investment Funds - Global Capital Appreciation Fund
Schedule of Investments (Market Value Expressed in EUR) (continued)
As at 31 December 2011
Quantity/Nominal
Value
Name of Securities Maturity/Coupon
MarketValue
%of
NetAssets
Quantity/Nominal
Value
Name of Securities Maturity/Coupon
MarketValue
%of
NetAssets

JPMorgan Investment Funds - Global Capital Appreciation Fund
Schedule of Investments - Outstanding Financial Futures Contracts (Expressed in EUR)
As at 31 December 2011
ExpirationDate
Number ofContracts Security Description Currency
NotionalValue
UnrealisedGain/(Loss)
Bond Futures
Mar-12 (223) US 2 Year Note Future USD (37,879,711) (4,027)Mar-12 439 US 5 Year Note Future USD 41,652,718 25,099Mar-12 (230) US 10 Year Note Future USD (23,207,589) (23,532)Mar-12 75 US Long Bond Future USD 8,357,187 8,125
Total Bond Futures 5,665
Equity Futures
Jan-12 (28) AMX Index Future EUR (1,749,020) (4,060)Jan-12 (174) OMX S30 Index Future SEK (1,920,296) 12,878Jan-12 21 Hang Seng Index Future HKD 1,922,202 15,102Jan-12 (50) MSCI Singapore Index Future SGD (1,784,259) 20,201Mar-12 83 Topix Index Future JPY 6,031,724 53,855Mar-12 16 S&P 60 Index Future CAD 1,636,115 (1,790)Mar-12 (496) DJ Euro Stoxx 50 Index Future EUR (11,400,560) (101,680)Mar-12 109 FTSE 100 Index Future GBP 7,225,004 35,890Mar-12 166 Nasdaq 100 E-Mini Future USD 5,836,952 (46,997)Mar-12 (215) Russell 2000 Mini Future USD (12,286,661) 247,621Mar-12 (199) SP 500 Emini Future USD (9,635,338) 3,066Mar-12 (37) Swiss Market Index Future CHF (1,779,961) (12,615)Dec-12 (424) DJ Euro Stoxx 50 Index Dividend Future EUR (4,555,880) (10,600)Dec-13 455 DJ Euro Stoxx 50 Index Dividend Future EUR 4,133,675 25,025
Total Equity Futures 235,896
Total 241,561
Schedule of Investments - Outstanding Forward Foreign Exchange Contracts (Expressed in EUR)
SettlementDate Currency
AmountPurchased Currency
AmountSold
UnrealisedGain/(Loss)
20-Jan-12 AUD 2,510,411 EUR 1,942,220 24,23720-Jan-12 EUR 7,520,967 AUD 10,193,287 (463,650)20-Jan-12 EUR 1,202,488 CAD 1,687,085 (71,754)20-Jan-12 EUR 2,195,211 CHF 2,686,488 (12,336)20-Jan-12 EUR 13,332,339 GBP 11,578,248 (526,559)20-Jan-12 EUR 971,164 HKD 10,472,309 (67,513)20-Jan-12 EUR 4,470,563 JPY 471,691,790 (238,722)20-Jan-12 EUR 611,399 SEK 5,591,793 (15,424)20-Jan-12 EUR 242,920 SGD 427,930 (11,293)20-Jan-12 EUR 49,022,178 USD 67,434,789 (2,922,489)20-Jan-12 GBP 3,171,102 EUR 3,689,669 106,06820-Jan-12 JPY 94,266,561 EUR 920,895 20,24520-Jan-12 NOK 70,945,992 EUR 9,172,087 (41,172)20-Jan-12 USD 5,942,446 AUD 5,834,622 7,05320-Jan-12 USD 2,883,283 EUR 2,169,349 51,62920-Jan-12 USD 12,304,987 NOK 70,319,309 428,208
Total (3,733,472)
Schedule of Investments - Outstanding Financial Option Contracts (Expressed in EUR)
ExpirationDate
Number ofContracts Security Description Currency
MarketValue
UnrealisedGain/(Loss)
21-Jan-12 (227) S&P 500 Index, Call Option, Strike Price 1,300 USD (118,043) 310,49417-Mar-12 213 S&P 500 Index, Put Option, Strike Price 500 USD 1,641 (47,910)
Total (116,402) 262,584
82

Transferable Securities Admitted to an Official Exchange Listing
Shares
UNITED STATES OF AMERICA377,864 99 Cents Only Stores 6,394,040 0.59273,769 AGCO 9,072,204 0.8580,594 Chevron 6,657,752 0.62
249,023 Coca-Cola 13,476,077 1.26326,492 EI du Pont de Nemours & Co. 11,527,390 1.07675,658 EMC/Massachusetts 11,318,658 1.06351,095 General Motors Preference Shares 9,247,670 0.8667,278 Goodrich 6,411,896 0.60
121,974 Harleysville Group 5,358,474 0.50135,214 Healthspring 5,677,624 0.53
308,238 Microsoft 6,175,209 0.57197,493 Motorola Mobility Holdings 5,896,415 0.55157,080 Netlogic Microsystems 5,996,764 0.56237,223 Newmont Mining 11,099,526 1.03136,615 Norfolk Southern 7,691,402 0.7282,252 Occidental Petroleum 5,962,407 0.56
169,311 RightNow Technologies 5,578,048 0.52188,698 Temple-Inland 4,611,875 0.4398,945 Union Pacific 8,069,653 0.7510,962 Wells Fargo & Co Preference Shares 8,906,916 0.83
155,130,000 14.46
UNITED KINGDOM735,642 BG Group 12,126,546 1.13
2,242,196 BP 12,353,457 1.15373,094 British American Tobacco 13,662,880 1.27727,631 British Sky Broadcasting Group 6,386,026 0.60
1,668,005 Centrica 5,776,785 0.54301,402 GlaxoSmithKline 5,309,433 0.49460,737 Imperial Tobacco Group 13,443,864 1.25
1,284,728 National Grid 9,606,366 0.90782,202 Prudential 5,975,237 0.56
7,635,091 Vodafone Group 16,359,176 1.53
100,999,770 9.42
JAPAN4,208 Japan Tobacco 15,227,048 1.42
2,680,100 Mitsubishi UFJ Financial Group 8,721,688 0.817,992,100 Mizuho Financial Group 8,257,208 0.77
8,266 NTT DoCoMo 11,671,598 1.09419,600 Sumitomo Mitsui Financial Group 8,978,234 0.84
52,855,776 4.93
NETHERLANDS205,990 CNH Global 5,726,397 0.53484,247 Royal Dutch Shell - A Shares 13,659,397 1.27
19,385,794 1.80
CANADA261,100 Anvil Mining 1,458,194 0.14
308,683 Barrick Gold 10,904,556 1.02855,595 Grande Cache Coal 6,410,987 0.60
18,773,737 1.76
FRANCE644,752 Vivendi 10,833,445 1.01
10,833,445 1.01
SWITZERLAND98,367 Compagnie Financiere Richemont - Bearer A Shares 3,848,833 0.3626,562 Syngenta Registered Shares 5,997,927 0.56
9,846,760 0.92
BERMUDA1,486,000 Cheung Kong Infrastructure Holdings 6,688,173 0.62
6,688,173 0.62
JERSEY557,500 Charter International 6,309,676 0.58
6,309,676 0.58
TAIWAN793 MediaTek 5,591 0.00924 Taiwan Semiconductor Manufacturing 1,779 0.00
7,370 0.00
Total Shares 380,830,501 35.50
Bonds
UNITED KINGDOM51,600,000 UK Treasury 16.08.13/2.500% 175,142,464 16.33
175,142,464 16.33
AUSTRALIA35,000,000 Australia (Commonwealth of) 20.08.20/4.000% 51,271,206 4.78
51,271,206 4.78
INTERNATIONAL AGENCIES27,027,000 European Investment Bank 14.08.13/6.000% 21,538,354 2.0115,225,000 European Investment Bank 20.05.14/5.375% 11,961,074 1.11
33,499,428 3.12
UNITED STATES OF AMERICA22,400,000 Cellco Partnership/Verizon
Wireless Capital 01.02.14/5.550% 18,825,543 1.75
18,825,543 1.75
CAYMAN ISLANDS15,000,000 Hutchison Whampoa
International 10 31.12.49/6.000%* 11,595,085 1.08
11,595,085 1.08
FRANCE1,603,000 Sanofi 17.05.13/3.500% 1,652,939 0.15
1,652,939 0.15
Total Bonds 291,986,665 27.21
Convertible Bonds
BRITISH VIRGIN ISLANDS9,400,000 Newford Capital 12.05.16/0.000% 6,192,500 0.58
100,000,000 Wharf Finance 2014 07.06.14/2.300% 9,339,572 0.87
15,532,072 1.45
SINGAPORE18,250,000 CapitaLand 03.09.16/2.875% 10,013,879 0.93
10,013,879 0.93
TAIWAN8,700,000 Hon Hai Precision Industry 12.10.13/0.000% 6,427,263 0.61
6,427,263 0.61
JERSEY13,500,000 QBE Funding Trust 12.05.30/0.000% 6,344,132 0.60
6,344,132 0.60
SWITZERLAND3,810,000 Swiss Prime Site 20.01.15/1.875% 3,208,093 0.29
3,208,093 0.29
Total Convertible Bonds 41,525,439 3.88
Total Transferable Securities Admitted to anOfficial Exchange Listing
714,342,605 66.59
Transferable Securities Dealt in on Another Regulated Market
Bonds
UNITED STATES OF AMERICA106,000,000 US Treasury 28.02.17/3.000% 90,244,925 8.41
90,244,925 8.41
83
JPMorgan Investment Funds - Global Capital Preservation Fund (EUR)
Schedule of Investments (Market Value Expressed in EUR)
As at 31 December 2011
Quantity/Nominal
Value
Name of Securities Maturity/Coupon
MarketValue
%of
NetAssets
Quantity/Nominal
Value
Name of Securities Maturity/Coupon
MarketValue
%of
NetAssets

UNITED KINGDOM1,765,330 Granite Master Issuer 2005-2 A5 20.12.54/1.417% 1,687,656 0.166,236,052 Granite Master Issuer
2006-1X A6 20.12.54/1.440% 5,961,666 0.568,079,475 Paragon Mortgages 11X A2B 15.10.41/1.812% 6,064,179 0.561,576,809 Paragon Mortgages 9X AB 15.05.41/1.822%* 1,212,897 0.11
359,539 Prominent CMBS Funding 1 A1 20.12.32/1.647%* 350,551 0.03
15,276,949 1.42
NETHERLANDS14,942,697 Holland Euro-Denominated
Mortgage Backed Series 11 A 18.09.40/1.539%* 14,296,515 1.33
14,296,515 1.33
Total Bonds 119,818,389 11.16
Convertible Bonds
UNITED STATES OF AMERICA14,584,000 Liberty Media 30.03.23/3.125% 12,555,464 1.18
12,555,464 1.18
CAYMAN ISLANDS5,273,000 Transocean 15.12.37/1.500% 3,994,123 0.37
3,994,123 0.37
Total Convertible Bonds 16,549,587 1.55
Total Transferable Securities Dealt in on AnotherRegulated Market
136,367,976 12.71
Other Transferable Securities
Shares
UNITED STATES OF AMERICA1,628,931 Vimetco Registered Shares GDR** 690,198 0.06
690,198 0.06
Total Shares 690,198 0.06
Total Other Transferable Securities 690,198 0.06
Total Investments 851,400,779 79.36
Cash Equivalents
Time Deposits
NETHERLANDS53,500,000 Rabobank Nederland 03.01.12/0.100% 53,500,000 5.00
53,500,000 5.00
UNITED KINGDOM44,100,000 Bank of Scotland 03.01.12/0.150% 44,100,000 4.11
44,100,000 4.11
Total Time Deposits 97,600,000 9.11
Total Cash Equivalents 97,600,000 9.11
Total Investments plus Total Cash Equivalents 949,000,779 88.47
Cash 120,899,043 11.27
Other Assets/(Liabilities) 2,805,756 0.26
Total Net Assets 1,072,705,578 100.00
* Variable coupon rates are those quoted as at 31 December 2011.** This Security is fair valued.
Allocation of Portfolio as at 31 December 2011 % ofNet Assets
Fixed Income SecuritiesUnited Kingdom 17.75United States of America 11.34Australia 4.78International Agencies 3.12Cayman Islands 1.45British Virgin Islands 1.45Netherlands 1.33Singapore 0.93Taiwan 0.60Jersey 0.59Switzerland 0.30France 0.15Total Fixed Income Securities 43.79SharesConsumer Staples 5.20Financials 4.93Materials 4.85Energy 4.73Industrials 4.10Telecommunication Services 3.63Information Technology 3.26Consumer Discretionary 2.41Utilities 1.44Health Care 1.02Total Shares 35.57Cash Equivalents, Cash and Other Assets/(Liabilities) 20.64
Total 100.00
Allocation of Portfolio as at 30 June 2011 (Unaudited) % ofNet Assets
Fixed Income SecuritiesInternational Agencies 13.87United States of America 9.98United Kingdom 9.69Italy 7.92Netherlands 4.58Australia 3.58Luxembourg 3.02Cayman Islands 0.87Singapore 0.83Switzerland 0.49Channel Islands 0.20France 0.13Total Fixed Income Securities 55.16SharesMaterials 5.10Financials 4.73Energy 4.54Telecommunication Services 4.06Consumer Discretionary 2.94Industrials 2.54Utilities 1.85Consumer Staples 1.56Health Care 0.51Information Technology 0.51Total Shares 28.34Cash Equivalents, Cash and Other Assets/(Liabilities) 16.50
Total 100.00
84
JPMorgan Investment Funds - Global Capital Preservation Fund (EUR)
Schedule of Investments (Market Value Expressed in EUR) (continued)
As at 31 December 2011
Quantity/Nominal
Value
Name of Securities Maturity/Coupon
MarketValue
%of
NetAssets
Quantity/Nominal
Value
Name of Securities Maturity/Coupon
MarketValue
%of
NetAssets

JPMorgan Investment Funds - Global Capital Preservation Fund (EUR)
Schedule of Investments - Outstanding Financial Futures Contracts (Expressed in EUR)
As at 31 December 2011
ExpirationDate
Number ofContracts Security Description Currency
NotionalValue
UnrealisedGain/(Loss)
Bond Futures
Mar-12 6,942 Euro-Bobl Future EUR 868,270,650 867,750Mar-12 (3,619) Euro-Bund Future EUR (502,841,955) (90,475)Mar-12 (5,826) Euro-Schatz Future EUR (642,884,535) 131,085Mar-12 4,265 US 5 Year Note Future USD 404,667,062 243,853
Total Bond Futures 1,152,213
Equity Futures
Mar-12 (1,680) FTSE 100 Index Future GBP (111,357,856) (553,168)Mar-12 (2,962) Russell 2000 Mini Future USD (169,270,187) 2,922,387Mar-12 700 SP 500 Emini Future USD 33,893,148 (10,785)
Total Equity Futures 2,358,434
Total 3,510,647
Schedule of Investments - Outstanding Forward Foreign Exchange Contracts (Expressed in EUR)
SettlementDate Currency
AmountPurchased Currency
AmountSold
UnrealisedGain/(Loss)
13-Jan-12 EUR 2,915,630 SEK 26,334,529 (37,641)13-Jan-12 SEK 665,442,604 EUR 73,575,159 1,050,52720-Jan-12 AUD 7,000,000 EUR 5,418,166 65,08120-Jan-12 CAD 4,571,630 USD 4,482,386 15920-Jan-12 CHF 3,802,793 NOK 24,189,264 11,62520-Jan-12 EUR 140,847,196 AUD 184,872,509 (3,967,338)20-Jan-12 EUR 25,459,401 CAD 34,332,135 (471,401)20-Jan-12 EUR 15,928,369 CHF 19,391,674 (6,199)20-Jan-12 EUR 300,463,263 GBP 252,268,355 (1,496,194)20-Jan-12 EUR 16,676,842 HKD 169,045,179 (89,588)20-Jan-12 EUR 48,169,555 JPY 4,878,130,798 (532,814)20-Jan-12 EUR 10,740,501 SGD 18,242,310 (96,387)20-Jan-12 EUR 304,733,745 USD 397,323,826 (1,322,730)20-Jan-12 NOK 24,756,790 EUR 3,188,200 (1,944)20-Jan-12 USD 9,221,805 EUR 7,054,721 48,78720-Jan-12 USD 7,248,036 JPY 563,655,879 (44,313)
Total (6,890,370)
Schedule of Investments - Outstanding Future Option Contracts (Expressed in EUR)
ExpirationDate
Number ofContracts Security Description Currency
MarketValue
UnrealisedGain/(Loss)
27-Jan-12 3,750 US 10 Year Note Future, Put Option, Strike Price 127.5 USD 203,129 (982,231)27-Jan-12 3,500 US 10 Year Note Future, Put Option, Strike Price 128 USD 252,783 (521,253)
Total 455,912 (1,503,484)
85

JPMorgan Investment Funds - Global Capital Preservation Fund (EUR)
Schedule of Investments - Outstanding Variance Swaps (Expressed in EUR)
As at 31 December 2011
TerminationDate Counterparty Referenced Obligation Currency
VarianceAmount Market Value
UnrealisedGain/(Loss)
16-Mar-12 Merrill Lynch DJ Euro Stoxx 50, Volatility Strike 25.15 EUR 3,808 2,137,487 2,137,48716-Mar-12 Merrill Lynch DJ Euro Stoxx 50, Volatility Strike 25.55 EUR 3,760 2,066,760 2,066,76016-Mar-12 Merrill Lynch S&P 500 Index,Volatility Strike 22.15 USD 6,754 (1,641,822) (1,641,822)16-Mar-12 Merrill Lynch S&P 500 Index,Volatility Strike 22.55 USD 6,575 (1,537,165) (1,537,165)
Total 1,025,260 1,025,260
Schedule of Investments - Outstanding Financial Option Contracts (Expressed in EUR)
ExpirationDate
Number ofContracts Security Description Currency
MarketValue
UnrealisedGain/(Loss)
18-Jan-12 31,900 VIX Index, Put Option, Strike Price 24 USD 2,826,163 1,035,07718-Jan-12 51,211 VIX Index, Put Option, Strike Price 25 USD 6,509,623 2,721,09420-Jan-12 4,983 DJ Euro Stoxx 50, Call Option, Strike Price 2,350 EUR 2,140,198 126,56920-Jan-12 (9,966) DJ Euro Stoxx 50, Call Option, Strike Price 2,450 EUR (1,370,325) (67,769)10-Feb-12 2,500 Nikkei 225 Index, Call Option, Strike Price 8,750 JPY 2,246,024 (705,122)17-Mar-12 2,756 S&P 500 Index, Put Option, Strike Price 500 USD 21,232 (619,906)
Total 12,372,915 2,489,943
86

Transferable Securities Admitted to an Official Exchange Listing
Shares
UNITED STATES OF AMERICA19,716 99 Cents Only Stores 433,062 0.6916,169 AGCO 695,510 1.114,777 Chevron 512,238 0.82
12,477 Coca-Cola 876,447 1.4016,994 EI du Pont de Nemours & Co. 778,835 1.2433,544 EMC/Massachusetts 729,414 1.1615,644 General Motors Preference Shares 534,868 0.853,488 Goodrich 431,500 0.696,610 Harleysville Group 376,935 0.608,125 Healthspring 442,853 0.71
18,229 Microsoft 474,045 0.7610,839 Motorola Mobility Holdings 420,065 0.67
8,621 Netlogic Microsystems 427,214 0.6811,174 Newmont Mining 678,653 1.087,082 Norfolk Southern 517,553 0.824,901 Occidental Petroleum 461,160 0.73
10,174 RightNow Technologies 435,091 0.6910,357 Temple-Inland 328,576 0.52
5,129 Union Pacific 542,982 0.8772 Wells Fargo & Co Preference Shares 75,938 0.12
10,172,939 16.21
UNITED KINGDOM34,942 BG Group 747,670 1.1999,719 BP 713,156 1.1416,977 British American Tobacco 807,005 1.2941,225 British Sky Broadcasting Group 469,647 0.75
100,465 Centrica 451,643 0.7213,748 GlaxoSmithKline 314,364 0.5023,169 Imperial Tobacco Group 877,546 1.4075,946 National Grid 737,130 1.1747,112 Prudential 467,153 0.74
344,423 Vodafone Group 957,923 1.53
6,543,237 10.43
JAPAN196 Japan Tobacco 920,635 1.46
119,900 Mitsubishi UFJ Financial Group 506,477 0.81375,300 Mizuho Financial Group 503,318 0.80
389 NTT DoCoMo 712,978 1.1419,000 Sumitomo Mitsui Financial Group 527,716 0.84
3,171,124 5.05
NETHERLANDS12,329 CNH Global 444,892 0.7128,692 Royal Dutch Shell - A Shares 1,050,550 1.67
1,495,442 2.38
CANADA15,100 Anvil Mining 109,465 0.1714,080 Barrick Gold 645,638 1.0343,098 Grande Cache Coal 419,184 0.67
1,174,287 1.87
SWITZERLAND4,537 Compagnie Financiere Richemont - Bearer A Shares 230,430 0.371,600 Syngenta Registered Shares 468,977 0.75
699,407 1.12
FRANCE29,409 Vivendi 641,425 1.02
641,425 1.02
BERMUDA90,000 Cheung Kong Infrastructure Holdings 525,802 0.84
525,802 0.84
JERSEY30,700 Charter International 451,016 0.72
451,016 0.72
TAIWAN70 MediaTek 641 0.00
641 0.00
Total Shares 24,875,320 39.64
Bonds
UNITED KINGDOM700,000 RBS 11.04.16/1.282%* 491,523 0.78
2,400,000 UK Treasury 16.08.13/2.500% 10,574,124 16.85
11,065,647 17.63
AUSTRALIA2,000,000 Australia (Commonwealth of) 20.08.20/4.000% 3,803,005 6.06
3,803,005 6.06
INTERNATIONAL AGENCIES1,040,000 European Investment Bank 14.08.13/6.000% 1,075,820 1.72
600,000 European Investment Bank 20.05.14/5.375% 611,865 0.98
1,687,685 2.70
UNITED STATES OF AMERICA600,000 Verizon Wireless Capital 01.02.14/5.550% 654,549 1.04
654,549 1.04
CAYMAN ISLANDS500,000 Hutchison Whampoa
International 10 31.12.49/6.000%* 501,700 0.80
501,700 0.80
FRANCE48,000 Sanofi 17.05.13/3.500% 64,247 0.10
64,247 0.10
Total Bonds 17,776,833 28.33
Convertible Bonds
BRITISH VIRGIN ISLANDS600,000 Newford Capital 12.05.16/0.000% 513,075 0.82
6,000,000 Wharf Finance 2014 07.06.14/2.300% 727,394 1.16
1,240,469 1.98
SINGAPORE500,000 CapitaLand 03.09.16/2.875% 356,124 0.57500,000 CapitaLand 05.03.18/3.125% 391,858 0.62
747,982 1.19
CHANNEL ISLANDS1,000,000 QBE Funding Trust 12.05.30/0.000% 610,000 0.97
610,000 0.97
TAIWAN500,000 Hon Hai Precision Industry 12.10.13/0.000% 479,478 0.76
479,478 0.76
SWITZERLAND150,000 Swiss Prime Site 20.01.15/1.875% 163,947 0.26
163,947 0.26
Total Convertible Bonds 3,241,876 5.16
Total Transferable Securities Admitted to an OfficialExchange Listing
45,894,029 73.13
Transferable Securities Dealt in on Another Regulated Market
Convertible Bonds
UNITED STATES OF AMERICA635,000 Liberty Media 30.03.23/3.125% 709,613 1.13
709,613 1.13
CAYMAN ISLANDS218,000 Transocean 15.12.37/1.500% 214,344 0.34
214,344 0.34
Total Convertible Bonds 923,957 1.47
87
JPMorgan Investment Funds - Global Capital Preservation Fund (USD)
Schedule of Investments (Market Value Expressed in USD)
As at 31 December 2011
Quantity/Nominal
Value
Name of Securities Maturity/Coupon
MarketValue
%of
NetAssets
Quantity/Nominal
Value
Name of Securities Maturity/Coupon
MarketValue
%of
NetAssets

Bonds
UNITED STATES OF AMERICA1,200,000 US Treasury 31.07.16/3.250% 1,333,406 2.133,500,000 US Treasury 28.02.17/3.000% 3,867,910 6.16
5,201,316 8.29
Total Bonds 5,201,316 8.29
Total Transferable Securities Dealt in on AnotherRegulated Market
6,125,273 9.76
Total Investments 52,019,302 82.89
Cash 10,062,356 16.03
Other Assets/(Liabilities) 678,123 1.08
Total Net Assets 62,759,781 100.00
* Variable coupon rates are those quoted as at 31 December 2011.
Allocation of Portfolio as at 31 December 2011 % ofNet Assets
Fixed Income SecuritiesUnited Kingdom 17.63United States of America 10.46Australia 6.06International Agencies 2.70British Virgin Islands 1.98Singapore 1.19Cayman Islands 1.14Channel Islands 0.97Taiwan 0.76Switzerland 0.26France 0.10Total Fixed Income Securities 43.25SharesConsumer Staples 5.55Energy 5.55Materials 5.46Industrials 4.92Financials 4.75Information Technology 3.96Telecommunication Services 3.69Consumer Discretionary 2.66Utilities 1.89Health Care 1.21Total Shares 39.64Cash and Other Assets/(Liabilities) 17.11
Total 100.00
Allocation of Portfolio as at 30 June 2011 (Unaudited) % ofNet Assets
Fixed Income SecuritiesUnited States of America 11.77International Agencies 9.78United Kingdom 8.33Italy 7.65Netherlands 3.14Luxembourg 2.79Australia 2.37France 1.47Singapore 1.09Cayman Islands 0.67Switzerland 0.45Total Fixed Income Securities 49.51SharesMaterials 4.61Energy 4.49Telecommunication Services 3.93Financials 3.88Consumer Discretionary 2.77Industrials 2.25Utilities 1.63Consumer Staples 1.53Information Technology 0.51Health Care 0.50Total Shares 26.10Cash and Other Assets/(Liabilities) 24.39
Total 100.00
88
JPMorgan Investment Funds - Global Capital Preservation Fund (USD)
Schedule of Investments (Market Value Expressed in USD) (continued)
As at 31 December 2011
Quantity/Nominal
Value
Name of Securities Maturity/Coupon
MarketValue
%of
NetAssets
Quantity/Nominal
Value
Name of Securities Maturity/Coupon
MarketValue
%of
NetAssets

JPMorgan Investment Funds - Global Capital Preservation Fund (USD)
Schedule of Investments - Outstanding Financial Futures Contracts (Expressed in USD)
As at 31 December 2011
ExpirationDate
Number ofContracts Security Description Currency
NotionalValue
UnrealisedGain/(Loss)
Bond Futures
Mar-12 317 Euro-Bobl Future EUR 51,466,091 75,430Mar-12 (162) Euro-Bund Future EUR (29,217,923) 20,039Mar-12 (316) Euro-Schatz Future EUR (45,262,756) 9,229Mar-12 203 US 5 Year Note Future USD 25,001,512 44,104
Total Bond Futures 148,802
Equity Futures
Mar-12 (76) FTSE 100 Index Future GBP (6,539,079) (32,483)Mar-12 (132) Russell 2000 Mini Future USD (9,791,760) 197,340Mar-12 16 SP 500 Emini Future USD 1,005,600 13,571
Total Equity Futures 178,428
Total 327,230
Schedule of Investments - Outstanding Forward Foreign Exchange Contracts (Expressed in USD)
SettlementDate Currency
AmountPurchased Currency
AmountSold
UnrealisedGain/(Loss)
20-Jan-12 AUD 927,175 USD 933,915 8,93920-Jan-12 EUR 862,714 USD 1,123,081 (3,102)20-Jan-12 GBP 2,952,321 USD 4,564,076 23,59720-Jan-12 JPY 50,436,848 USD 647,689 6,02520-Jan-12 USD 9,377,824 AUD 9,461,568 (243,748)20-Jan-12 USD 1,695,181 CAD 1,756,925 (27,526)20-Jan-12 USD 855,080 CHF 799,902 1,77420-Jan-12 USD 4,414,545 EUR 3,399,984 67120-Jan-12 USD 22,005,428 GBP 14,207,270 (71,547)20-Jan-12 USD 1,071,499 HKD 8,340,392 (2,409)20-Jan-12 USD 3,759,906 JPY 292,623,705 (32,800)20-Jan-12 USD 122,329 NOK 729,259 48320-Jan-12 USD 790,257 SGD 1,030,749 (4,658)
Total (344,301)
Schedule of Investments - Outstanding Future Option Contracts (Expressed in USD)
ExpirationDate
Number ofContracts Security Description Currency
MarketValue
UnrealisedGain/(Loss)
27-Jan-12 195 US 10 Year Note Future, Put Option, Strike Price 127.5 USD 13,711 (66,289)27-Jan-12 150 US 10 Year Note Future, Put Option, Strike Price 128 USD 14,062 (28,992)
Total 27,773 (95,281)
89

JPMorgan Investment Funds - Global Capital Preservation Fund (USD)
Schedule of Investments - Outstanding Variance Swaps (Expressed in USD)
As at 31 December 2011
TerminationDate Counterparty Description Currency
VarianceAmount
MarketValue
UnrealisedGain/(Loss)
16-Mar-12 Merrill Lynch DJ Euro Stoxx 50, Volatility Strike 25.15 EUR 163 118,764 118,76416-Mar-12 Merrill Lynch DJ Euro Stoxx 50, Volatility Strike 25.55 EUR 161 114,873 114,87416-Mar-12 Merrill Lynch S&P 500 Index,Volatility Strike 22.15 USD 290 (91,507) (91,507)16-Mar-12 Merrill Lynch S&P 500 Index,Volatility Strike 22.55 USD 281 (85,275) (85,275)
Total 56,855 56,855
Schedule of Investments - Outstanding Financial Option Contracts (Expressed in USD)
ExpirationDate
Number ofContracts Security Description Currency
MarketValue
UnrealisedGain/(Loss)
18-Jan-12 1,450 VIX Index, Put Option, Strike Price 24 USD 166,750 66,33118-Jan-12 2,185 VIX Index, Put Option, Strike Price 25 USD 360,525 153,54220-Jan-12 222 DJ Euro Stoxx 50, Call Option, Strike Price 2,350 EUR 123,768 7,31920-Jan-12 (444) DJ Euro Stoxx 50, Call Option, Strike Price 2,450 EUR (79,246) (3,919)10-Feb-12 117 Nikkei 225 Index, Call Option, Strike Price 8,750 JPY 136,443 (43,325)17-Mar-12 149 S&P 500 Index, Put Option, Strike Price 500 USD 1,490 (43,504)
Total 709,730 136,444
90

Transferable Securities Admitted to an Official Exchange Listing
Shares
UNITED STATES OF AMERICA25,100 Apache Preference Shares 1,359,290 0.352,660 Bank of America Preference Shares 2,044,210 0.52
60,047 General Motors Preference Shares 2,053,007 0.5243,150 Health Care REIT Preference Shares 2,214,674 0.5718,225 MetLife 1,123,845 0.29
45,700 NextEra Energy 2,465,515 0.6336,200 PPL 2,005,842 0.51
13,266,383 3.39
NETHERLANDS12,450 Nielsen Holdings Preference Shares 722,878 0.19
722,878 0.19
BERMUDA4,700 Bunge Preference Shares 441,800 0.11
441,800 0.11
Total Shares 14,431,061 3.69
Convertible Bonds
JAPAN214,000,000 Aeon 22.11.12/0.000% 3,274,487 0.84157,000,000 Aeon 22.11.13/0.300% 2,403,535 0.61
495,000,000 Asahi Group Holdings 26.05.28/0.000% 6,565,749 1.6882,000,000 Hitachi 12.12.14/0.100% 1,394,027 0.35
900,000,000 KDDI 14.12.15/0.000% 12,042,880 3.07212,000,000 Nippon Meat Packers 03.03.14/0.000% 2,765,779 0.71499,000,000 ORIX 31.03.14/1.000% 7,071,672 1.81390,000,000 Sekisui House 05.07.16/0.000% 5,157,602 1.32222,000,000 Softbank 31.03.13/1.500% 3,324,299 0.85101,000,000 Takashimaya 14.11.14/0.000% 1,334,363 0.34
450,000,000 Unicharm 24.09.13/0.000% 6,275,714 1.60
51,610,107 13.18
FRANCE31,415,300 Air France-KLM 01.04.15/4.970% 4,305,775 1.10
142,236,800 Alcatel-Lucent 01.01.15/5.000% 4,395,128 1.128,633,700 Club Mediterranee 01.11.15/6.110% 1,977,571 0.512,703,400 Eurazeo 10.06.14/6.250% 1,957,684 0.503,492,600 Fonciere Des Regions 01.01.17/3.340% 3,231,238 0.831,893,900 Misarte 01.01.16/3.250% 3,527,328 0.902,123,800 Nexans 01.01.16/4.000% 1,580,001 0.40
10,985,200 Peugeot 01.01.16/4.450% 3,310,676 0.851,383,500 Pierre & Vacances 01.10.15/4.000% 1,274,516 0.331,641,500 Publicis Groupe 30.07.14/3.125% 784,923 0.202,218,200 Publicis Groupe 18.01.18/1.000% 1,418,662 0.36968,400 Technip 01.01.16/0.500% 1,150,196 0.29
3,783,700 Technip 01.01.17/0.250% 4,794,785 1.22
33,708,483 8.61
CAYMAN ISLANDS2,200,000 Agile Property Holdings 28.04.16/4.000% 1,734,700 0.444,100,000 China Overseas Finance
Investment Cayman 14.05.14/0.000% 4,995,542 1.2815,000,000 Hengdeli Holdings 20.10.15/2.500% 1,898,992 0.4815,000,000 Intime Department Store Group 27.10.13/1.750% 1,945,904 0.5024,000,000 Soho China 02.07.14/3.750% 3,387,338 0.87
2,000,000 Subsea 7 11.10.13/2.250% 2,155,730 0.553,400,000 TPK Holding 20.04.14/0.000% 2,862,681 0.73
18,980,887 4.85
BRITISH VIRGIN ISLANDS6,400,000 Billion Express Investments 18.10.15/0.750% 7,425,120 1.906,300,000 Newford Capital 12.05.16/0.000% 5,387,287 1.3811,700,000 Power Regal Group 02.06.14/2.250% 1,806,302 0.467,300,000 Sherson 04.06.14/0.000% 1,028,262 0.26
10,000,000 Wharf Finance 2014 07.06.14/2.300% 1,212,323 0.31
16,859,294 4.31
UNITED KINGDOM1,500,000 British Airways 13.08.14/5.800% 2,458,251 0.631,000,000 Misys 22.11.15/2.500% 1,534,773 0.392,900,000 TUI Travel 05.10.14/6.000% 3,948,245 1.015,600,000 Vedanta Resources Jersey 13.07.16/5.500% 4,604,264 1.183,800,000 Vedanta Resources Jersey II 30.03.17/4.000% 3,250,672 0.83
15,796,205 4.04
SINGAPORE2,500,000 CapitaLand 03.09.16/2.875% 1,780,619 0.454,400,000 Olam International 15.10.16/6.000% 4,645,168 1.19
800,000 OSIM International 05.07.16/2.750% 567,638 0.15900,000 Wilmar International 18.12.12/0.000% 1,074,532 0.27
2,250,000 Yanlord Land Group 13.07.14/5.850% 1,723,161 0.44
9,791,118 2.50
JERSEY2,550,000 International Power Finance
Jersey III 05.06.15/4.750% 3,475,943 0.89600,000 London Mining Jersey 15.02.16/8.000% 571,125 0.15800,000 Premier Oil Finance 27.06.14/2.875% 855,556 0.22
2,000,000 Shire 09.05.14/2.750% 2,379,850 0.61800,000 WPP 19.05.14/5.750% 1,585,893 0.40
8,868,367 2.27
NETHERLANDS6,300,000 Lukoil International Finance 16.06.15/2.625% 6,398,154 1.632,700,000 Q-Cells International Finance 26.05.14/5.750% 767,116 0.20
400,000 Salzgitter Finance 08.11.17/2.000% 543,852 0.14
7,709,122 1.97
INDIA1,200,000 JSW Steel 28.06.12/0.000% 1,595,280 0.411,400,000 Larsen & Toubro 22.10.14/3.500% 1,368,983 0.35
560,000 Suzlon Energy 11.10.12/7.500% 702,338 0.184,366,000 Tata Steel 21.11.14/4.500% 3,877,728 0.99
7,544,329 1.93
UNITED STATES OF AMERICA1,822,000 Chesapeake Energy 15.11.35/2.750% 1,799,225 0.463,872,000 Chesapeake Energy 15.05.37/2.500% 3,478,392 0.89
672,000 DR Horton 15.05.14/2.000% 796,320 0.20
6,073,937 1.55
GERMANY2,900,000 KfW - Kreditanstalt fuer
Wiederaufbau 30.07.14/1.500% 4,141,306 1.06
4,141,306 1.06
SOUTH KOREA2,300,000 Hynix Semiconductor 14.05.15/2.650% 2,248,779 0.573,000,000 SK Telecom 07.04.14/1.750% 3,121,590 0.80
5,370,369 1.37
AUSTRIA1,100,000 Immofinanz 19.11.17/1.250% 1,529,361 0.391,000,000 Steinhoff Finance Holding 22.05.16/5.000% 1,234,770 0.322,450,000 Steinhoff Finance Holding 31.03.18/4.500% 2,586,316 0.66
5,350,447 1.37
TAIWAN4,200,000 Hon Hai Precision Industry 12.10.13/0.000% 4,027,611 1.03
4,027,611 1.03
ISLE OF MAN3,600,000 AngloGold Ashanti Holdings
Finance 22.05.14/3.500% 4,012,056 1.02
4,012,056 1.02
CHINA24,120,000 China Petroleum & Chemical 24.04.14/0.000% 3,561,106 0.91
3,561,106 0.91
SWEDEN2,350,000 Industrivarden 27.02.15/2.500% 3,231,780 0.83
3,231,780 0.83
MALAYSIA3,000,000 YTL Finance Labuan 18.03.15/1.875% 2,985,870 0.76
2,985,870 0.76
UNITED ARAB EMIRATES2,600,000 Aabar Investments 27.05.16/4.000% 2,957,265 0.76
2,957,265 0.76
91
JPMorgan Investment Funds - Global Convertibles Fund (USD)
Schedule of Investments (Market Value Expressed in USD)
As at 31 December 2011
Quantity/Nominal
Value
Name of Securities Maturity/Coupon
MarketValue
%of
NetAssets
Quantity/Nominal
Value
Name of Securities Maturity/Coupon
MarketValue
%of
NetAssets

PORTUGAL3,150,000 Parpublica - Participaçes
Publicas 28.09.17/5.250% 2,866,371 0.73
2,866,371 0.73
LUXEMBOURG700,000 Intralot Luxembourg 20.12.13/2.250% 679,205 0.17750,000 Kloeckner & Co. Financial
Services 09.06.14/6.000% 984,889 0.251,100,000 Kloeckner & Co. Financial
Services 22.12.17/2.500% 1,196,128 0.31
2,860,222 0.73
SPAIN1,150,000 Abengoa 03.02.17/4.500% 1,287,526 0.33
1,287,526 0.33
PHILIPPINES1,200,000 San Miguel 05.05.14/2.000% 1,270,680 0.32
1,270,680 0.32
BERMUDA1,200,000 Aquarius Platinum 18.12.15/4.000% 1,022,790 0.26
1,022,790 0.26
SWITZERLAND590,000 Clariant 07.07.14/3.000% 789,330 0.20
789,330 0.20
Total Convertible Bonds 222,676,578 56.89
Total Transferable Securities Admitted to anOfficial Exchange Listing
237,107,639 60.58
Transferable Securities Dealt in on Another Regulated Market
Convertible Bonds
UNITED STATES OF AMERICA2,763,000 Boston Properties 15.05.36/3.750% 3,146,988 0.80
547,000 Ciena 15.06.17/0.875% 415,381 0.111,212,000 Ciena 144A 15.03.15/4.000% 1,201,395 0.31
2,768,000 Dendreon 15.01.16/2.875% 1,951,440 0.50834,000 Electronic Arts 144A 15.07.16/0.750% 817,320 0.21542,000 EMC/Massachusetts 01.12.13/1.750% 782,512 0.20
1,745,000 Equinix 15.10.14/3.000% 1,959,059 0.50894,000 General Cable 15.11.13/0.875% 827,942 0.21
5,227,000 Gilead Sciences 01.05.13/0.625% 6,050,252 1.556,438,000 Gilead Sciences 01.05.14/1.000% 7,010,757 1.794,588,000 Health Care REIT 01.12.29/3.000% 5,284,160 1.35
1,000 Hologic 15.12.37/2.000%* 1,099 0.00889,000 Iconix Brand Group 144A 01.06.16/2.500% 847,884 0.22
5,487,000 Illumina 144A 15.03.16/0.250% 4,265,045 1.093,001,000 Intel 15.12.35/2.950% 3,147,629 0.804,099,000 Intel 01.08.39/3.250% 5,192,716 1.331,100,000 James River Coal 144A 15.03.18/3.125% 643,500 0.162,807,000 Lam Research 144A 15.05.16/0.500% 2,645,598 0.681,869,000 Lam Research 144A 15.05.18/1.250% 1,761,533 0.451,038,000 Lennar 144A 15.12.20/2.750% 1,163,858 0.303,532,000 Liberty Media 30.03.23/3.125% 3,947,010 1.012,585,000 MGM Resorts International 15.04.15/4.250% 2,453,113 0.63
967,000 Microchip Technology 15.12.37/2.125% 1,311,905 0.331,292,000 Micron Technology 01.06.27/1.875% 1,111,120 0.281,809,000 Micron Technology 01.08.31/1.500% 1,630,361 0.423,058,000 Microsoft 144A 15.06.13/0.000% 3,105,644 0.791,175,000 Molson Coors Brewing 30.07.13/2.500% 1,248,326 0.32
1,000 Mylan 15.03.12/1.250% 1,015 0.00949,000 National Retail Properties 15.06.28/5.125% 1,090,240 0.28769,000 Navistar International 15.10.14/3.000% 824,218 0.21
2,716,000 NetApp 01.06.13/1.750% 3,446,903 0.882,712,000 Newmont Mining 15.07.14/1.250% 3,793,410 0.971,139,000 Novellus Systems 144A 15.05.41/2.625% 1,373,520 0.351,135,000 NuVasive 01.07.17/2.750% 810,106 0.21980,000 ON Semiconductor 15.12.26/2.625% 1,078,701 0.27
2,886,000 Peabody Energy 15.12.41/4.750% 2,937,241 0.751,153,000 ProLogis 15.03.15/3.250% 1,193,470 0.30
223,334 Salix Pharmaceuticals 15.05.15/2.750% 288,938 0.071,265,000 SanDisk 15.05.13/1.000% 1,247,227 0.324,174,000 SanDisk 15.08.17/1.500% 4,943,540 1.261,202,000 SBA Communications 01.05.13/1.875% 1,355,724 0.35
916,000 Stanley Black & Decker 17.05.12/0.000%* 1,024,203 0.261,765,000 Symantec 15.06.13/1.000% 1,981,213 0.513,288,000 Teva Pharmaceutical Finance 01.02.26/0.250% 3,410,938 0.873,012,000 United States Steel 15.05.14/4.000% 3,294,706 0.84
2,856,000 VeriSign 15.08.37/3.250% 3,423,630 0.872,983,000 Vornado Realty 15.04.25/3.875% 3,047,463 0.783,860,000 Xilinx 15.03.37/3.125% 4,415,087 1.13
108,905,040 27.82
LUXEMBOURG4,552,000 ArcelorMittal 15.05.14/5.000% 4,808,050 1.23
4,808,050 1.23
SINGAPORE5,000,000 Temasek Financial III Pte 24.10.14/0.000% 3,959,240 1.01
3,959,240 1.01
CANADA2,385,000 Goldcorp 01.08.14/2.000% 2,906,719 0.741,500,000 Petrominerales 25.08.16/2.625% 1,357,605 0.35
4,264,324 1.09
BERMUDA2,400,000 Seadrill 27.10.17/3.375% 2,714,028 0.69
2,714,028 0.69
MEXICO1,700,000 Cemex 15.03.15/4.875% 1,113,764 0.282,000,000 Cemex 144A 15.03.16/3.250% 1,312,500 0.34
2,426,264 0.62
CAYMAN ISLANDS1,200,000 Polarcus 27.04.16/2.875% 904,608 0.23
904,608 0.23
FINLAND300,000 Talvivaara Mining 16.12.15/4.000% 267,121 0.07
267,121 0.07
Total Convertible Bonds 128,248,675 32.76
Investment Funds
LUXEMBOURG25,484,315 JPMorgan Liquidity Funds - US Dollar Liquidity Fund
(JPM US Dollar Liquidity X (dist)) 25,484,315 6.51
25,484,315 6.51
Total Investment Funds 25,484,315 6.51
Total Transferable Securities Dealt in on AnotherRegulated Market
153,732,990 39.27
Total Investments 390,840,629 99.85
Cash 375,671 0.10
Other Assets/(Liabilities) 230,921 0.05
Total Net Assets 391,447,221 100.00
* Variable coupon rates are those quoted as at 31 December 2011.
92
JPMorgan Investment Funds - Global Convertibles Fund (USD)
Schedule of Investments (Market Value Expressed in USD) (continued)
As at 31 December 2011
Quantity/Nominal
Value
Name of Securities Maturity/Coupon
MarketValue
%of
NetAssets
Quantity/Nominal
Value
Name of Securities Maturity/Coupon
MarketValue
%of
NetAssets

Allocation of Portfolio as at 31 December 2011 % ofNet Assets
Fixed Income SecuritiesUnited States of America 29.37Japan 13.18France 8.61Cayman Islands 5.08British Virgin Islands 4.31United Kingdom 4.04Singapore 3.51Jersey 2.27Netherlands 1.97Luxembourg 1.96India 1.93South Korea 1.37Austria 1.37Canada 1.09Germany 1.06Taiwan 1.03Isle Of Man 1.02Bermuda 0.95China 0.91Sweden 0.83Malaysia 0.76United Arab Emirates 0.76Portugal 0.73Mexico 0.62Spain 0.33Philippines 0.32Switzerland 0.20Finland 0.07Total Fixed Income Securities 89.65SharesInvestment Companies 6.51Financials 1.38Utilities 1.14Consumer Discretionary 0.71Energy 0.35Consumer Staples 0.11Total Shares 10.20Cash and Other Assets/(Liabilities) 0.15
Total 100.00
Allocation of Portfolio as at 30 June 2011 (Unaudited) % ofNet Assets
Fixed Income SecuritiesUnited States of America 27.24France 12.07Japan 11.39Netherlands 4.38Cayman Islands 4.30United Kingdom 3.91Luxembourg 3.86Singapore 3.54British Virgin Islands 3.40India 2.30Taiwan 1.77South Korea 1.61Bermuda 1.52Jersey 1.30Sweden 1.29Germany 1.26Austria 1.24Portugal 1.10Isle of Man 1.02Canada 0.84Switzerland 0.74United Arab Emirates 0.71Mexico 0.68Malaysia 0.60Spain 0.45Belgium 0.35Finland 0.14Norway 0.12Total Fixed Income Securities 93.13SharesFinancials 2.26Investment Companies 1.99Consumer Discretionary 1.73Utilities 1.39Energy 0.31Materials 0.25Consumer Staples 0.21Total Shares 8.14Cash and Other Assets/(Liabilities) (1.27)
Total 100.00
93
JPMorgan Investment Funds - Global Convertibles Fund (USD)
Schedule of Investments (Market Value Expressed in USD) (continued)
As at 31 December 2011
Quantity/Nominal
Value
Name of Securities Maturity/Coupon
MarketValue
%of
NetAssets
Quantity/Nominal
Value
Name of Securities Maturity/Coupon
MarketValue
%of
NetAssets

JPMorgan Investment Funds - Global Convertibles Fund (USD)
Schedule of Investments - Outstanding Forward Foreign Exchange Contracts (Expressed in USD)
As at 31 December 2011
SettlementDate Currency
AmountPurchased Currency
AmountSold
UnrealisedGain/(Loss)
20-Jan-12 EUR 4,939,574 USD 6,464,467 (51,890)20-Jan-12 USD 66,812,050 EUR 51,372,018 120,67620-Jan-12 USD 8,897,435 GBP 5,738,171 (19,228)20-Jan-12 USD 13,612,232 HKD 105,941,414 (28,781)20-Jan-12 USD 50,398,556 JPY 3,915,013,514 (344,071)20-Jan-12 USD 7,430,416 SGD 9,671,861 (28,536)
Total (351,830)
94

Transferable Securities Admitted to an Official Exchange Listing
Shares
UNITED STATES OF AMERICA18,691 Abbott Laboratories 1,053,518 1.0138,919 Bristol-Myers Squibb 1,377,149 1.3253,716 CenterPoint Energy 1,087,480 1.0416,470 Chevron 1,766,078 1.7039,879 Coca-Cola 2,801,300 2.6921,033 ConocoPhillips 1,534,147 1.4751,651 EI du Pont de Nemours & Co. 2,367,165 2.27
10,945 International Business Machines 2,037,302 1.9655,279 Mattel 1,544,219 1.4917,772 McDonald’s 1,781,998 1.71
62,078 Merck & Co. 2,348,100 2.2656,196 Microsoft 1,461,377 1.4031,048 Paychex 931,906 0.8997,065 Pfizer 2,112,620 2.0325,935 PG&E 1,075,006 1.0334,934 Sysco 1,023,042 0.9881,763 Time Warner 2,991,299 2.87
48,068 Verizon Communications 1,917,673 1.8572,111 Wells Fargo & Co. 1,997,114 1.92
69,900 Xcel Energy 1,937,279 1.86
35,145,772 33.75
FRANCE33,994 Compagnie de Saint-Gobain 1,297,081 1.2539,380 GDF Suez 1,061,960 1.0210,314 PPR 1,483,065 1.4214,838 Sanofi 1,085,231 1.0446,003 Schneider Electric 2,397,077 2.3124,186 Sodexo 1,737,536 1.6762,919 Suez Environnement 723,124 0.6931,503 Total 1,608,505 1.547,949 Unibail-Rodamco 1,421,590 1.37
12,815,169 12.31
UNITED KINGDOM52,979 British American Tobacco 2,518,368 2.42175,371 Cairn Energy 725,286 0.70
346,465 Centrica 1,557,542 1.5081,840 GlaxoSmithKline 1,871,367 1.80
192,385 HSBC Holdings 1,468,412 1.4153,168 Standard Chartered 1,164,516 1.11
757,821 Vodafone Group 2,107,683 2.02
11,413,174 10.96
JAPAN47,100 Canon 2,078,076 2.0019,600 Daito Trust Construction 1,676,191 1.61
380 Japan Tobacco 1,784,904 1.7134,600 Nippon Telegraph & Telephone 1,763,065 1.69155,200 Sumitomo 2,092,460 2.01
9,394,696 9.02
GERMANY12,893 Allianz Registered Shares 1,233,844 1.1824,701 BASF 1,722,592 1.6626,281 Deutsche Boerse 1,378,464 1.3271,371 E.ON 1,536,255 1.48
5,871,155 5.64
NETHERLANDS55,676 Koninklijke KPN 668,066 0.6473,201 Royal Dutch Shell - A Shares 2,694,050 2.5946,819 Unilever - CVA 1,609,887 1.54
4,972,003 4.77
SWITZERLAND28,059 Nestlé Registered Shares 1,615,106 1.55
9,075 Roche Holding - Genussschein 1,538,308 1.4820,062 Swiss Re 1,018,611 0.98
4,172,025 4.01
AUSTRALIA59,699 ANZ Banking Group 1,250,126 1.20114,188 QBE Insurance Group 1,510,692 1.45301,520 Tatts Group 749,871 0.72
3,510,689 3.37
HONG KONG250,000 Hutchison Whampoa 2,099,508 2.02
2,099,508 2.02
SOUTH AFRICA207,839 African Bank Investments 880,578 0.85
62,164 MTN Group 1,105,349 1.06
1,985,927 1.91
ITALY91,668 ENI 1,892,530 1.82
1,892,530 1.82
NEW ZEALAND1,121,760 Telecom Corp of New Zealand 1,783,126 1.71
1,783,126 1.71
PANAMA46,537 Carnival 1,530,137 1.47
1,530,137 1.47
SWEDEN147,784 Telefonaktiebolaget LM Ericsson - B Shares 1,501,091 1.44
1,501,091 1.44
SOUTH KOREA96,125 KT ADR 1,500,992 1.44
1,500,992 1.44
CHINA1,775,000 China Construction Bank - H Shares * 1,236,400 1.19
1,236,400 1.19
FINLAND110,612 UPM-Kymmene 1,211,455 1.16
1,211,455 1.16
SINGAPORE390,000 Singapore Telecommunications 930,935 0.90
930,935 0.90
NORWAY90,699 DnB Bank 887,459 0.85
887,459 0.85
Total Shares 103,854,243 99.74
Total Transferable Securities Admitted to anOfficial Exchange Listing
103,854,243 99.74
Transferable Securities Dealt in on Another Regulated Market
Investment Funds
LUXEMBOURG100,000 JPMorgan Liquidity Funds - US Dollar Liquidity Fund
(JPM US Dollar Liquidity X (dist)) 100,000 0.10
100,000 0.10
Total Investment Funds 100,000 0.10
Total Transferable Securities Dealt in on AnotherRegulated Market
100,000 0.10
Total Investments 103,954,243 99.84
Cash 213,876 0.20
Other Assets/(Liabilities) (42,342) (0.04)
Total Net Assets 104,125,777 100.00
* Hong Kong Registered Shares.
95
JPMorgan Investment Funds - Global Dividend Fund
Schedule of Investments (Market Value Expressed in USD)
As at 31 December 2011
Quantity/Nominal
Value
Name of Securities MarketValue
%of
NetAssets
Quantity/Nominal
Value
Name of Securities MarketValue
%of
NetAssets

Allocation of Portfolio as at 31 December 2011 % ofNet Assets
SharesFinancials 18.46Telecommunication Services 11.31Health Care 10.94Consumer Staples 10.89Energy 9.82Consumer Discretionary 9.68Utilities 8.62Industrials 6.88Information Technology 6.80Materials 6.34Investment Companies 0.10Total Shares 99.84Cash and Other Assets/(Liabilities) 0.16
Total 100.00
Allocation of Portfolio as at 30 June 2011 (Unaudited) % ofNet Assets
SharesFinancials 20.76Industrials 10.28Telecommunication Services 10.16Health Care 10.09Consumer Discretionary 9.93Utilities 8.76Materials 8.76Energy 8.42Consumer Staples 6.25Information Technology 3.02Investment Companies 1.98Total Shares 98.41Bank Overdraft and Other Assets/(Liabilities) 1.59
Total 100.00
96
JPMorgan Investment Funds - Global Dividend Fund
Schedule of Investments (Market Value Expressed in USD) (continued)
As at 31 December 2011
Quantity/Nominal
Value
Name of Securities MarketValue
%of
NetAssets
Quantity/Nominal
Value
Name of Securities MarketValue
%of
NetAssets

JPMorgan Investment Funds - Global Dividend Fund
Schedule of Investments - Outstanding Forward Foreign Exchange Contracts (Expressed in USD)
As at 31 December 2011
SettlementDate Currency
AmountPurchased Currency
AmountSold
UnrealisedGain/(Loss)
10-Jan-12 AUD 75,914 EUR 57,900 2,13510-Jan-12 EUR 99,286 CHF 121,050 (221)10-Jan-12 EUR 124,034 GBP 106,208 (4,046)10-Jan-12 EUR 49,614 HKD 521,421 (2,732)10-Jan-12 EUR 88,566 JPY 9,001,148 (1,674)10-Jan-12 EUR 46,958 NZD 81,120 (1,906)10-Jan-12 EUR 8,313,102 USD 11,141,619 (350,238)10-Jan-12 GBP 154,172 EUR 182,290 2,96110-Jan-12 JPY 17,317,671 EUR 170,650 2,89110-Jan-12 NOK 353,268 EUR 45,319 21810-Jan-12 NZD 114,422 EUR 66,775 1,98810-Jan-12 USD 499,944 AUD 489,663 1,37310-Jan-12 USD 418,371 CHF 385,531 7,18710-Jan-12 USD 1,034,426 EUR 790,081 8,80810-Jan-12 USD 1,919,207 GBP 1,227,586 11,44810-Jan-12 USD 219,507 HKD 1,706,049 (158)10-Jan-12 USD 1,333,472 JPY 103,480,640 (7,505)10-Jan-12 USD 185,148 NOK 1,068,046 6,62810-Jan-12 USD 235,933 NZD 303,705 58210-Jan-12 USD 177,125 SEK 1,199,085 2,53510-Jan-12 USD 162,126 SGD 208,451 1,36110-Feb-12 EUR 54,551 GBP 45,721 (201)
Total (318,566)
97

Transferable Securities Admitted to an Official Exchange Listing
Bonds
UNITED KINGDOM100,000 Abbey National Treasury
Services/London 18.03.13/2.500% 100,127 0.47199,000 Abbey National Treasury
Services/London 30.06.14/3.125% 199,371 0.94100,000 Abbey National Treasury
Services/London 08.06.15/3.375% 100,403 0.47100,000 Bank of Scotland 15.01.14/3.875% 102,422 0.48200,000 Barclays Bank 08.09.14/2.125% 198,968 0.94175,000 Barclays Bank 20.01.17/4.000% 173,844 0.82100,000 BAT International Finance 12.12.19/6.375% 145,051 0.69
75,000 British Telecommunications 07.12.16/8.500% 109,972 0.52110,000 HSBC Holdings 10.06.19/6.000% 111,580 0.5335,000 HSBC Holdings 14.01.42/6.100% 31,080 0.15
180,000 Imperial Tobacco Finance 15.09.14/7.250% 201,064 0.9550,000 Legal & General Group 08.06.25/4.000%* 41,396 0.20
200,000 Lloyds TSB Bank 17.03.15/3.375% 202,863 0.9675,000 Lloyds TSB Bank 21.01.21/6.375% 57,622 0.27
350,000 Network Rail InfrastructureFinance 17.06.13/3.500% 280,453 1.33
250,000 Royal Bank of ScotlandRegistered Shares 15.03.16/4.000% 258,560 1.22
100,000 Standard Chartered Bank 28.03.18/1.704%* 89,570 0.42100,000 UBS/London 06.10.14/3.000% 103,434 0.49
97,000 UK Treasury 07.09.39/4.250% 142,616 0.67283,000 UK Treasury 07.09.21/3.750% 391,612 1.85100,000 Vodafone Group 15.01.16/6.250% 116,031 0.5520,000 WPP Finance 2010 144A 21.11.21/4.750% 15,297 0.07
3,173,336 14.99
UNITED STATES OF AMERICA100,000 Altria Group 05.05.21/4.750% 84,918 0.4050,000 American Express Credit 25.08.14/5.125% 41,460 0.2090,000 American International Group 15.12.20/6.400% 70,208 0.3365,000 AT&T 15.05.21/4.450% 55,571 0.2660,000 AT&T 15.05.36/6.800% 59,099 0.28
320,000 BA Credit Card Trust 18.09.13/5.450%* 384,086 1.81100,000 Bank of America 04.12.19/5.500% 109,556 0.52125,000 Citigroup 04.09.19/7.375% 141,126 0.6715,000 Citigroup 09.08.20/5.375% 11,933 0.0630,000 ConocoPhillips 01.02.39/6.500% 31,834 0.1580,000 Coventry Health Care 15.06.21/5.450% 68,361 0.32
100,000 Crédit Suisse/New York 15.05.13/5.000% 79,312 0.38140,000 Crédit Suisse/New York 15.02.18/6.000% 106,971 0.51
55,000 Duke Energy Carolinas 15.12.16/1.750% 42,672 0.2025,000 Energy Transfer Partners 01.06.41/6.050% 19,053 0.0990,000 Entergy Arkansas 15.02.21/3.750% 72,205 0.3440,000 Enterprise Products Operating 01.09.20/5.200% 34,215 0.16
5,000 Enterprise Products Operating 15.04.38/7.550% 4,948 0.02165,000 General Electric Capital 14.01.38/5.875% 134,497 0.6460,000 Goldman Sachs Group 18.01.18/5.950% 47,490 0.2255,000 Goldman Sachs Group 01.02.41/6.250% 41,938 0.2040,000 HCP 01.02.21/5.375% 32,293 0.1540,000 Home Depot 01.04.41/5.950% 40,118 0.1915,000 Kinder Morgan Energy Partners 15.01.38/6.950% 13,156 0.0610,000 Kinder Morgan Energy Partners 01.03.41/6.375% 8,674 0.04
155,000 Kraft Foods 10.02.20/5.375% 137,843 0.6550,000 MetLife 15.02.19/7.717% 48,333 0.23
100,000 Morgan Stanley 26.01.20/5.500% 71,210 0.3455,000 Nevada Power 15.03.19/7.125% 52,933 0.2530,000 Nisource Finance 01.02.42/5.800% 24,393 0.1210,000 Nisource Finance 15.06.41/5.950% 8,272 0.0445,000 Pfizer 15.03.39/7.200% 50,816 0.24
145,000 Philip Morris International 17.03.14/6.875% 126,243 0.6095,000 Plains All American Pipeline 01.05.18/6.500% 85,078 0.4020,000 Richardson Electronics 15,824 0.08
150,000 SES Global Americas Holdings 09.07.14/4.875% 159,929 0.7670,000 Skilled Healthcare Group - A Shares 55,807 0.2610,000 Skullcandy 9,064 0.0440,000 Southern Power 15.09.41/5.150% 32,617 0.1545,000 StellarOne 41,705 0.2090,000 Tangoe 72,131 0.3470,000 Tennessee Valley Authority 15.09.39/5.250% 69,070 0.3355,000 Time Warner 29.03.41/6.250% 51,759 0.2420,000 Time Warner Entertainment 15.07.33/8.375% 20,252 0.1025,000 TNS 19,207 0.0910,000 Town Sports International Holdings 7,770 0.0465,000 UnitedHealth Group 15.10.40/5.700% 59,981 0.2830,000 Verizon Communications 01.11.18/8.750% 31,437 0.1565,000 Verizon Communications 01.04.21/4.600% 56,764 0.2760,000 Wal-Mart Stores 15.04.41/5.625% 59,513 0.2845,000 Watson Pharmaceuticals 15.08.19/6.125% 40,775 0.19
15,000 Westmoreland Coal 11,785 0.0550,000 Xcel Energy 15.05.20/4.700% 43,160 0.20
3,199,365 15.12
GERMANY100,000 Allianz Finance II 08.07.41/5.750% 85,746 0.4046,000 Deutsche Pfandbriefbank 15.09.14/3.125% 47,595 0.2340,000 Deutsche Telekom International
Finance 31.05.16/4.750% 43,953 0.21191,000 Eurohypo 26.05.14/2.750% 194,789 0.92176,000 Germany (Federal Republic of) 04.01.24/6.250% 253,781 1.2018,000 Germany (Federal Republic of) 04.07.42/3.250% 21,413 0.10
250,000 Germany (Federal Republic of) 08.04.16/2.750% 272,237 1.29160,000 KfW - Kreditanstalt fuer
Wiederaufbau 21.01.19/3.875% 177,845 0.8460,000 Merck Financial Services 24.03.20/4.500% 64,520 0.30
1,161,879 5.49
FRANCE150,000 BNP Paribas Home Loan Covered
Bonds 12.01.17/3.375% 152,487 0.72200,000 Caisse d’Amortissement de la
Dette Sociale 25.04.15/3.625% 210,074 0.99100,000 Caisse Refinancement de
l’Habitat 08.04.19/5.000% 110,390 0.5250,000 Casino Guichard Perrachon 12.11.18/4.481% 48,079 0.23
100,000 Cie de St-Gobain 15.12.16/5.625% 129,461 0.6185,000 France Telecom 14.09.21/4.125% 66,506 0.3245,000 RCI Banque 27.01.15/4.375% 44,314 0.21
200,000 Société des AutoroutesParis-Rhin-Rhone 12.01.17/5.000% 203,592 0.96
964,903 4.56
JAPAN34,000,000 Japan (Government of) 20.09.14/1.500% 351,474 1.6650,100,000 Japan (Government of) 20.03.20/1.300% 521,872 2.465,000,000 Japan (Government of) 20.09.35/2.500% 56,529 0.27
929,875 4.39
SPAIN100,000 Amadeus Capital Markets 15.07.16/4.875% 101,352 0.48100,000 Banco Bilbao Vizcaya Argentaria 25.02.15/3.500% 97,404 0.46100,000 Banco Santander 28.01.15/3.125% 96,649 0.46100,000 BBVA Senior Finance 15.04.16/4.875% 98,723 0.46150,000 Fund for Ordered Bank
Restructuring 19.11.14/3.000% 145,369 0.6980,000 Telefonica Emisiones 16.02.21/5.462% 59,385 0.28
598,882 2.83
NETHERLANDS100,000 ING Bank 30.09.14/3.000% 103,154 0.49265,000 LeasePlan 22.05.14/3.250% 277,382 1.3150,000 Linde Finance 01.06.21/3.875% 53,266 0.25
433,802 2.05
SWEDEN190,000 Swedbank Hypotek 07.09.15/2.250% 192,047 0.9190,000 Vattenfall Treasury 19.05.14/4.250% 95,728 0.45
100,000 Volvo Treasury 31.05.17/5.000% 103,741 0.49
391,516 1.85
MEXICO100,000 America Movil 30.03.20/5.000% 85,321 0.4040,000 Mexico (United Mexican States) 05.12.24/10.000% 285,471 1.35
370,792 1.75
NORWAY185,000 DNB Boligkreditt 18.10.16/2.500% 187,121 0.8920,000 Sparebank 1 Boligkreditt 22.11.16/2.375% 16,734 0.08
138,000 Sparebank 1 Boligkreditt GMTN 22.11.16/2.375% 138,608 0.65
342,463 1.62
SOUTH KOREA503,000,000 Korea (Republic of) 10.06.12/4.000% 336,241 1.59
336,241 1.59
FINLAND200,000 Nordea Bank Finland 16.11.15/2.250% 202,468 0.96100,000 OP Mortgage Bank 19.11.14/3.125% 104,018 0.49
306,486 1.45
98
JPMorgan Investment Funds - Global Enhanced Bond Fund
Schedule of Investments (Market Value Expressed in EUR)
As at 31 December 2011
Quantity/Nominal
Value
Name of Securities Maturity/Coupon
MarketValue
%of
NetAssets
Quantity/Nominal
Value
Name of Securities Maturity/Coupon
MarketValue
%of
NetAssets

BRAZIL275 Brazil (Republic of) 01.01.13/10.000% 119,152 0.56
100,000 Brazil (Republic of) 17.01.17/6.000% 90,405 0.43
209,557 0.99
CANADA95,000 Canadian Natural Resources 01.12.14/4.900% 80,464 0.3855,000 Encana 15.08.37/6.625% 51,370 0.2470,000 Suncor Energy 15.06.38/6.500% 66,820 0.32
198,654 0.94
CAYMAN ISLANDS40,000 Transocean 15.12.21/6.375% 32,498 0.15
120,000 Vale Overseas 15.09.19/5.625% 101,775 0.48
134,273 0.63
DENMARK80,000 Carlsberg Breweries 13.10.17/3.375% 80,443 0.3850,000 DONG Energy 07.05.14/4.875% 53,587 0.25
134,030 0.63
RUSSIAN FEDERATION116,900 Russian (Republic of) 31.03.30/7.500%* 104,776 0.50
104,776 0.50
INTERNATIONAL AGENCIES100,000 Eurasian Development
Bank 144A 29.09.14/7.375% 81,286 0.38
81,286 0.38
PERU25,000 Peru (Republic of) 21.11.33/8.750% 29,351 0.15
29,351 0.15
Total Bonds 13,101,467 61.91
Total Transferable Securities Admitted to an OfficialExchange Listing
13,101,467 61.91
Transferable Securities Dealt in on Another Regulated Market
Bonds
UNITED STATES OF AMERICA45,162 ACE Securities 2005-HE4 M1 25.07.35/0.794%* 33,838 0.1618,166 Asset Backed Funding
Certificates 2005-HE2 M1 25.06.35/0.774%* 13,735 0.0631,020 Banc of America Mortgage
Securities 2004-5 3A2 25.06.19/4.750% 24,584 0.12195,000 Bear Stearns Commercial
Mortgage Securities2005-PWR9 A4A 11.09.42/4.871% 163,338 0.77
30,000 Bear Stearns CommercialMortgage Securities2006-PW14 AM 11.12.38/5.243% 22,786 0.11
55,000 Cisco Systems 15.01.40/5.500% 52,027 0.2550,000 Comcast 15.11.17/6.300% 45,646 0.2249,921 Credit Suisse First Boston
Mortgage Securities 2004-3 2A1 25.04.19/5.000% 39,727 0.1942,832 Credit Suisse First Boston
Mortgage Securities2005-C2 AAB 15.04.37/4.681% 33,820 0.16
40,000 DCP Midstream 144A 15.03.20/5.350% 33,440 0.1645,000 DCP Midstream 144A 15.03.19/9.750% 45,198 0.21216,023 Fannie Mae Pool No: 889183 01.09.21/5.500% 180,541 0.85
190,040 Fannie Mae Pool No: 984281 01.05.38/6.000% 161,205 0.76144,036 Fannie Mae Pool No: AC6082 01.11.24/4.500% 119,416 0.56579,607 Fannie Mae Pool No: AJ1230 01.09.41/4.500% 475,336 2.25105,527 Fannie Mae Pool No: AJ2329 01.10.26/3.500% 84,993 0.4097,729 Fannie Mae Pool No: AL1064 01.10.39/6.500% 83,771 0.4025,271 Fannie Mae REMICS 2006-78 BC 25.01.34/6.500% 19,516 0.09
358,677 Fannie Mae REMICS 2010-116 BI 25.08.20/5.000% 28,190 0.1375,000 Gilead Sciences 01.04.21/4.500% 61,145 0.29
138,945 Ginnie Mae I pool No: 781986 15.09.35/5.500% 120,237 0.57467,025 Ginnie Mae II pool No: 4834 20.10.40/4.500% 391,665 1.85160,000 Greenwich Capital Commercial
Funding 2005-GG3 A4 10.08.42/4.799%* 132,612 0.63649,607 Harborview Mortgage Loan Trust
2005-11 2A1A 19.08.45/0.595% 329,937 1.56393,085 Indymac Index Mortgage Loan
Trust 2004-AR14 2A1A 25.01.35/0.654% 153,591 0.7340,000 JP Morgan Chase Commercial
Mortgage Securities2004-CBX A6 12.01.37/4.899% 32,708 0.15
47,645 JP Morgan Mortgage Trust2005-S2 1A1 25.08.20/4.500% 36,906 0.17
260,000 LB-UBS Commercial MortgageTrust 2005-C1 A4 15.02.30/4.742% 214,311 1.01
25,000 LB-UBS Commercial MortgageTrust 2005-C2 A5 15.04.30/5.150% 20,706 0.10
235,000 LB-UBS Commercial MortgageTrust 2006-C6 A4 15.09.39/5.372% 201,305 0.95
100,000 LG&E and KU Energy 15.11.15/2.125% 75,839 0.3640,000 Merrill Lynch Mortgage Trust
2005-CKI1 A6 12.11.37/5.220% 34,220 0.16230,000 Metropolitan Life Global
Funding I 144A 10.04.13/5.125% 185,137 0.8844,019 Morgan Stanley ABS Capital I
2004-SD2 A 25.04.34/0.744%* 29,455 0.14110,000 Morgan Stanley Capital I
2005-HQ7 A4 14.11.42/5.202%* 93,407 0.4455,000 NBCUniversal Media 01.04.21/4.375% 45,091 0.2180,000 NBCUniversal Media 30.04.20/5.150% 68,945 0.33303,535 New Century Home Equity Loan
Trust 2005-4 A2B 25.09.35/0.564% 223,585 1.0610,000 News America 15.02.41/6.150% 8,893 0.0440,000 Oracle 15.07.40/5.375% 37,694 0.18
5,000 Oracle 08.07.39/6.125% 5,125 0.0240,000 Park Place Securities
2005-WHQ3 M1 25.06.35/0.714%* 27,120 0.1390,000 Prudential Financial 16.11.41/5.800% 70,554 0.33126,186 Residential Asset Mortgage
Products 2004-RS11 M1 25.11.34/0.914%* 89,018 0.4230,167 Residential Funding Mortgage
Securities I 2006-S12 2A2 25.12.36/6.000% 21,345 0.1035,000 Roche Holdings 01.03.39/7.000% 38,583 0.1835,000 State of California 01.04.39/7.550% 32,953 0.1620,000 State of Illinois 01.06.33/5.100% 13,984 0.0753,200 Structured Asset Securities
2005-WF4 A4 25.11.35/0.654%* 38,821 0.18105,000 US Treasury 31.01.12/4.750% 81,184 0.38100,000 US Treasury 15.02.17/4.625% 91,348 0.43
91,000 US Treasury 17.05.12/0.000% 70,092 0.3370,000 US Treasury 30.11.18/1.375% 54,058 0.26115,000 US Treasury 15.11.21/2.000% 89,487 0.4275,000 US Treasury 15.08.41/3.750% 67,809 0.3210,000 US Treasury 15.02.31/5.375% 10,971 0.0590,000 Wachovia Bank Commercial
Mortgage Trust 2005-C17 A4 15.03.42/5.083% 75,320 0.3645,000 Wachovia Bank Commercial
Mortgage Trust 2005-C20 A7 15.07.42/5.118% 38,103 0.18325,000 Wachovia Bank Commercial
Mortgage Trust 2005-C21 A4 15.10.44/5.204%* 274,855 1.3020,000 Wachovia Bank Commercial
Mortgage Trust 2006-C25 A5 15.05.43/5.737% 17,129 0.0835,000 Wachovia Bank Commercial
Mortgage Trust 2006-C26 A3 15.06.45/6.011% 30,241 0.14160,000 Wells Fargo & Co. 15.06.16/3.676% 129,183 0.61
75,000 Wells Fargo Home Equity Trust2004-2 AI6 25.05.34/5.000% 57,666 0.27
42,048 Wells Fargo Mortgage BackedSecurities Trust 2005-2 2A1 25.04.20/4.750% 33,424 0.16
5,616,869 26.54
UNITED KINGDOM200,000 AWG Parent 21.08.23/6.875%* 304,906 1.44
35,000 PPL WEM Holdings 144A 01.05.21/5.375% 28,278 0.13
333,184 1.57
CANADA99,000 Canada (Government of) 01.06.33/5.750% 115,011 0.5556,000 Canada (Government of) 01.06.37/5.000% 61,828 0.2940,000 Xstrata Canada Financial 144A 15.11.41/6.000% 31,738 0.15
208,577 0.99
SWEDEN115,000 Svenska Handelsbanken 144A 10.06.14/4.875% 92,173 0.44
92,173 0.44
FRANCE110,000 BNP Paribas 23.02.16/3.600% 80,538 0.38
80,538 0.38
CURACAO70,000 Teva Pharmaceutical Finance 10.11.16/2.400% 54,792 0.26
54,792 0.26
99
JPMorgan Investment Funds - Global Enhanced Bond Fund
Schedule of Investments (Market Value Expressed in EUR) (continued)
As at 31 December 2011
Quantity/Nominal
Value
Name of Securities Maturity/Coupon
MarketValue
%of
NetAssets
Quantity/Nominal
Value
Name of Securities Maturity/Coupon
MarketValue
%of
NetAssets

BELGIUM25,000 Delhaize Group 01.10.40/5.700% 19,868 0.09
19,868 0.09
Total Bonds 6,406,001 30.27
Investment Funds
LUXEMBOURG65 JPMorgan Liquidity Funds - Euro Liquidity Fund (JPM
Euro Liquidity X (acc)) 913,162 4.31
913,162 4.31
Total Investment Funds 913,162 4.31
Total Transferable Securities Dealt in on AnotherRegulated Market
7,319,163 34.58
Other Transferable Securities
Bonds
UNITED STATES OF AMERICA750,000 Lehman Brothers Holdings
(Defaulted) 03.04.09/0.000% 150,225 0.71520,000 Lehman Brothers Holdings
Capital Trust VII (Defaulted) 31.12.49/5.857% 240 0.00
150,465 0.71
Total Bonds 150,465 0.71
Total Other Transferable Securities 150,465 0.71
Total Investments 20,571,095 97.20
Cash 951,209 4.50
Other Assets/(Liabilities) (359,403) (1.70)
Total Net Assets 21,162,901 100.00
* Variable coupon rates are those quoted as at 31 December 2011.
Allocation of Portfolio as at 31 December 2011 % ofNet Assets
Fixed Income SecuritiesUnited States of America 42.37United Kingdom 16.56Germany 5.49France 4.94Japan 4.39Spain 2.83Sweden 2.29Netherlands 2.05Canada 1.93Mexico 1.75Norway 1.62South Korea 1.59Finland 1.45Brazil 0.99Cayman Islands 0.63Denmark 0.63Russian Federation 0.50International Agencies 0.38Curacao 0.26Peru 0.15Belgium 0.09Total Fixed Income Securities 92.89Investment FundsLuxembourg 4.31Total Investment Funds 4.31Cash and Other Assets/(Liabilities) 2.80
Total 100.00
Allocation of Portfolio as at 30 June 2011 (Unaudited) % ofNet Assets
Fixed Income SecuritiesUnited States of America 40.03United Kingdom 14.59France 7.39Japan 7.37Netherlands 4.14Germany 2.79South Africa 2.76Mexico 1.77Canada 1.61South Korea 1.58Spain 1.44Finland 1.43Sweden 1.38Brazil 0.96Denmark 0.63Russia 0.48Italy 0.46Cayman Islands 0.43International Agencies 0.37Luxembourg 0.18Peru 0.11Belgium 0.08Isle of Man 0.07Total Fixed Income Securities 92.05Investment FundsLuxembourg 2.42Total Investment Funds 2.42Cash and Other Assets/(Liabilities) 5.53
Total 100.00
100
JPMorgan Investment Funds - Global Enhanced Bond Fund
Schedule of Investments (Market Value Expressed in EUR) (continued)
As at 31 December 2011
Quantity/Nominal
Value
Name of Securities Maturity/Coupon
MarketValue
%of
NetAssets
Quantity/Nominal
Value
Name of Securities Maturity/Coupon
MarketValue
%of
NetAssets
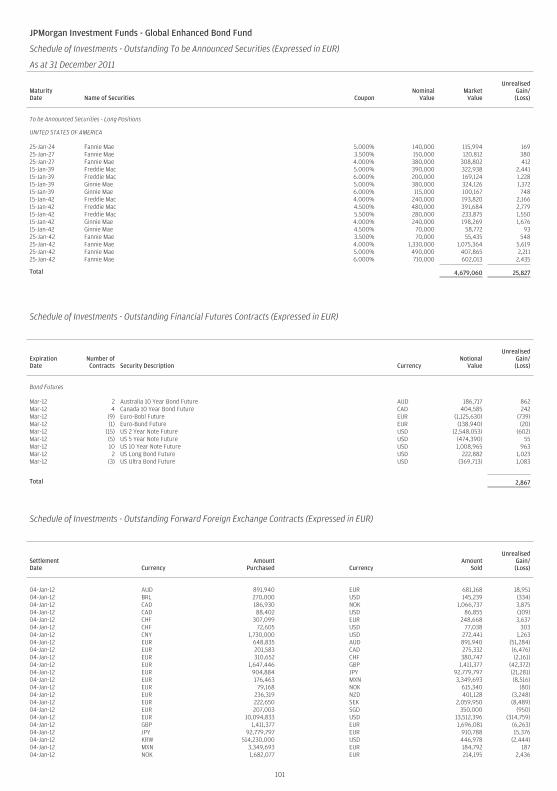
JPMorgan Investment Funds - Global Enhanced Bond Fund
Schedule of Investments - Outstanding To be Announced Securities (Expressed in EUR)
As at 31 December 2011
MaturityDate Name of Securities Coupon
NominalValue
MarketValue
UnrealisedGain/(Loss)
To be Announced Securities - Long Positions
UNITED STATES OF AMERICA
25-Jan-24 Fannie Mae 5.000% 140,000 115,994 16925-Jan-27 Fannie Mae 3.500% 150,000 120,812 38025-Jan-27 Fannie Mae 4.000% 380,000 308,802 41215-Jan-39 Freddie Mac 5.000% 390,000 322,938 2,44115-Jan-39 Freddie Mac 6.000% 200,000 169,124 1,22815-Jan-39 Ginnie Mae 5.000% 380,000 324,126 1,37215-Jan-39 Ginnie Mae 6.000% 115,000 100,167 74815-Jan-42 Freddie Mac 4.000% 240,000 193,820 2,16615-Jan-42 Freddie Mac 4.500% 480,000 391,684 2,77915-Jan-42 Freddie Mac 5.500% 280,000 233,875 1,55015-Jan-42 Ginnie Mae 4.000% 240,000 198,269 1,67615-Jan-42 Ginnie Mae 4.500% 70,000 58,772 9325-Jan-42 Fannie Mae 3.500% 70,000 55,435 54825-Jan-42 Fannie Mae 4.000% 1,330,000 1,075,364 5,61925-Jan-42 Fannie Mae 5.000% 490,000 407,865 2,21125-Jan-42 Fannie Mae 6.000% 710,000 602,013 2,435
Total 4,679,060 25,827
Schedule of Investments - Outstanding Financial Futures Contracts (Expressed in EUR)
ExpirationDate
Number ofContracts Security Description Currency
NotionalValue
UnrealisedGain/(Loss)
Bond Futures
Mar-12 2 Australia 10 Year Bond Future AUD 186,717 862Mar-12 4 Canada 10 Year Bond Future CAD 404,585 242Mar-12 (9) Euro-Bobl Future EUR (1,125,630) (739)Mar-12 (1) Euro-Bund Future EUR (138,940) (20)Mar-12 (15) US 2 Year Note Future USD (2,548,053) (602)Mar-12 (5) US 5 Year Note Future USD (474,390) 55Mar-12 10 US 10 Year Note Future USD 1,008,965 963Mar-12 2 US Long Bond Future USD 222,882 1,023Mar-12 (3) US Ultra Bond Future USD (369,713) 1,083
Total 2,867
JPMorgan Investment Funds - Global Enhanced Bond Fund
Schedule of Investments - Outstanding Forward Foreign Exchange Contracts (Expressed in EUR) (continued)
As at 31 December 2011
SettlementDate Currency
AmountPurchased Currency
AmountSold
UnrealisedGain/(Loss)
04-Jan-12 AUD 891,940 EUR 681,168 18,95104-Jan-12 BRL 270,000 USD 145,239 (334)04-Jan-12 CAD 186,930 NOK 1,066,737 3,87504-Jan-12 CAD 88,402 USD 86,855 (109)04-Jan-12 CHF 307,099 EUR 248,668 3,63704-Jan-12 CHF 72,605 USD 77,038 30304-Jan-12 CNY 1,730,000 USD 272,441 1,26304-Jan-12 EUR 648,835 AUD 891,940 (51,284)04-Jan-12 EUR 201,583 CAD 275,332 (6,476)04-Jan-12 EUR 310,652 CHF 380,747 (2,161)04-Jan-12 EUR 1,647,446 GBP 1,411,377 (42,372)04-Jan-12 EUR 904,884 JPY 92,779,797 (21,281)04-Jan-12 EUR 176,463 MXN 3,349,693 (8,516)04-Jan-12 EUR 79,168 NOK 615,340 (80)04-Jan-12 EUR 236,319 NZD 401,128 (3,248)04-Jan-12 EUR 222,650 SEK 2,059,950 (8,489)04-Jan-12 EUR 207,003 SGD 350,000 (950)04-Jan-12 EUR 10,094,833 USD 13,512,396 (314,759)04-Jan-12 GBP 1,411,377 EUR 1,696,081 (6,263)04-Jan-12 JPY 92,779,797 EUR 910,788 15,37604-Jan-12 KRW 514,230,000 USD 446,978 (2,444)04-Jan-12 MXN 3,349,693 EUR 184,792 18704-Jan-12 NOK 1,682,077 EUR 214,195 2,436
101

JPMorgan Investment Funds - Global Enhanced Bond Fund
Schedule of Investments - Outstanding Forward Foreign Exchange Contracts (Expressed in EUR) (continued)
As at 31 December 2011
SettlementDate Currency
AmountPurchased Currency
AmountSold
UnrealisedGain/(Loss)
04-Jan-12 NZD 401,128 EUR 223,166 16,40104-Jan-12 SEK 2,059,950 EUR 228,343 2,79604-Jan-12 SGD 350,000 USD 271,484 (1,192)04-Jan-12 USD 141,140 BRL 270,000 (2,825)04-Jan-12 USD 273,388 CNY 1,730,000 (534)04-Jan-12 USD 13,958,018 EUR 10,677,553 75,33704-Jan-12 USD 439,885 KRW 514,230,000 (3,020)03-Feb-12 CAD 167,439 EUR 125,169 1,24003-Feb-12 CNY 1,730,000 USD 272,785 31503-Feb-12 EUR 299,262 AUD 387,565 (3,774)03-Feb-12 EUR 1,695,205 GBP 1,411,377 6,23203-Feb-12 EUR 910,988 JPY 92,779,797 (15,441)03-Feb-12 EUR 83,865 MXN 1,516,688 33903-Feb-12 EUR 227,972 SEK 2,059,950 (2,750)03-Feb-12 EUR 10,730,663 USD 14,029,503 (75,018)03-Feb-12 GBP 21,313 EUR 25,503 103-Feb-12 NOK 597,057 CAD 101,442 20903-Feb-12 NOK 615,340 EUR 79,074 7003-Feb-12 NZD 401,128 EUR 235,815 3,17703-Feb-12 SGD 350,000 EUR 206,955 93003-Feb-12 USD 144,215 BRL 270,000 55003-Feb-12 USD 63,068 EUR 48,218 35703-Feb-12 USD 119,671 JPY 9,350,438 (1,194)03-Feb-12 USD 446,040 KRW 514,230,000 2,673
Total (417,859)
102

Transferable Securities Admitted to an Official Exchange Listing
Shares
UNITED STATES OF AMERICA45,679 Aflac 1,974,475 1.6120,269 American Express 960,953 0.7838,605 Ameriprise Financial 1,933,338 1.58
489,365 Bank of America 2,664,592 2.1825,500 Capital One Financial 1,084,005 0.89
175,652 Citigroup 4,682,004 3.8225,980 Goldman Sachs Group 2,346,643 1.9275,159 Hartford Financial Services Group 1,230,729 1.00
109,238 MetLife 3,413,141 2.79183,764 Morgan Stanley 2,781,268 2.27
31,958 PNC Financial Services Group 1,846,853 1.5161,418 Prudential Financial 3,080,113 2.5171,472 State Street 2,900,334 2.3775,349 US Bancorp 2,046,102 1.67
242,313 Wells Fargo & Co. 6,710,859 5.48
39,655,409 32.38
UNITED KINGDOM623,726 Barclays 1,706,135 1.39617,812 HSBC Holdings 4,715,559 3.85
3,122,749 Lloyds Banking Group 1,255,568 1.022,139,750 RBS Group 670,773 0.55
282,256 Prudential 2,798,793 2.2963,902 Standard Chartered 1,399,618 1.14
12,546,446 10.24
SWITZERLAND43,096 ACE 3,037,191 2.4897,964 Crédit Suisse Group Registered Shares 2,302,577 1.8815,469 Swiss Re 785,410 0.64
138,649 UBS Registered Shares 1,643,472 1.3410,893 Zurich Financial Services 2,466,230 2.02
10,234,880 8.36
AUSTRALIA110,812 ANZ Banking Group 2,320,458 1.8953,341 Macquarie Group 1,295,585 1.0656,092 National Australia Bank 1,339,249 1.09111,207 Westpac Banking 2,272,622 1.86
7,227,914 5.90
CHINA3,878,450 China Construction Bank - H Shares * 2,701,587 2.211,373,550 China Merchants Bank - H Shares * 2,774,795 2.26
78,500 Ping An Insurance Group Co. of China - H Shares * 517,239 0.42
5,993,621 4.89
FRANCE126,058 AXA 1,631,796 1.3343,520 BNP Paribas 1,706,880 1.4064,946 Société Générale 1,412,710 1.15
4,751,386 3.88
CANADA63,599 Manulife Financial 671,614 0.5567,436 RBC 3,415,791 2.79
4,087,405 3.34
INDIA64,619 Housing Development Finance 789,700 0.65
692,080 Infrastructure Development Finance 1,188,789 0.97436,562 Yes Bank 1,964,591 1.60
3,943,080 3.22
HONG KONG303,000 AIA Group 946,058 0.77272,000 Henderson Land Development 1,348,320 1.10105,000 Sun Hung Kai Properties 1,314,072 1.08
3,608,450 2.95
SPAIN260,127 Banco Santander 1,962,467 1.60154,527 BBVA 1,313,322 1.07
3,275,789 2.67
JAPAN194 Advance Residence Investment 373,923 0.31
91 Kenedix Realty Investment 264,717 0.22275,300 Mitsubishi UFJ Financial Group 1,162,913 0.9537,700 Sumitomo Mitsui Financial Group 1,047,100 0.85
2,848,653 2.33
BERMUDA47,333 Invesco 951,393 0.7816,787 Everest Re Group 1,425,972 1.16
2,377,365 1.94
GERMANY24,744 Allianz Registered Shares 2,367,969 1.93
2,367,969 1.93
NETHERLANDS242,020 ING Groep - CVA 1,741,670 1.42
1,741,670 1.42
SOUTH KOREA7,514 Samsung Fire & Marine Insurance 1,367,840 1.12
1,367,840 1.12
SOUTH AFRICA306,801 African Bank Investments 1,299,863 1.06
1,299,863 1.06
GUERNSEY315,700 Resolution 1,236,220 1.01
1,236,220 1.01
CAYMAN ISLANDS658,000 China Resources Land 1,057,314 0.86
1,057,314 0.86
MEXICO284,782 Grupo Financiero Banorte - O Shares 880,736 0.72
880,736 0.72
BELGIUM34,295 KBC Groep 421,773 0.34
421,773 0.34
Total Shares 110,923,783 90.56
Total Transferable Securities Admitted to anOfficial Exchange Listing
110,923,783 90.56
Transferable Securities Dealt in on Another Regulated Market
Investment Funds
LUXEMBOURG10,802,299 JPMorgan Liquidity Funds - US Dollar Liquidity Fund
(JPM US Dollar Liquidity X (dist)) 10,802,299 8.82
10,802,299 8.82
Total Investment Funds 10,802,299 8.82
Total Transferable Securities Dealt in on AnotherRegulated Market
10,802,299 8.82
Total Investments 121,726,082 99.38
Cash 617,458 0.50
Other Assets/(Liabilities) 141,582 0.12
Total Net Assets 122,485,122 100.00
* Hong Kong Registered Shares.
103
JPMorgan Investment Funds - Global Financials Fund
Schedule of Investments (Market Value Expressed in USD)
As at 31 December 2011
Quantity/Nominal
Value
Name of Securities MarketValue
%of
NetAssets
Quantity/Nominal
Value
Name of Securities MarketValue
%of
NetAssets

Allocation of Portfolio as at 31 December 2011 % ofNet Assets
SharesFinancials 90.56Investment Companies 8.82Total Shares 99.38Cash and Other Assets/(Liabilities) 0.62
Total 100.00
Allocation of Portfolio as at 30 June 2011 (Unaudited) % ofNet Assets
SharesFinancials 96.44Investment Companies 1.72Industrials 1.15Total Shares 99.31Cash and Other Assets/(Liabilities) 0.69
Total 100.00
104
JPMorgan Investment Funds - Global Financials Fund
Schedule of Investments (Market Value Expressed in USD) (continued)
As at 31 December 2011
Quantity/Nominal
Value
Name of Securities MarketValue
%of
NetAssets
Quantity/Nominal
Value
Name of Securities MarketValue
%of
NetAssets

JPMorgan Investment Funds - Global Financials Fund
Schedule of Investments - Outstanding Forward Foreign Exchange Contracts (Expressed in USD)
As at 31 December 2011
SettlementDate Currency
AmountPurchased Currency
AmountSold
UnrealisedGain/(Loss)
16-Feb-12 AUD 4,956,517 USD 4,969,304 55,44716-Feb-12 CAD 8,171,719 USD 7,943,973 63,61816-Feb-12 CHF 578,358 USD 618,085 (744)16-Feb-12 EUR 3,214,139 USD 4,250,449 (76,762)16-Feb-12 GBP 1,030,568 USD 1,611,924 (10,916)16-Feb-12 HKD 5,321,007 USD 683,913 1,28116-Feb-12 JPY 663,358,789 USD 8,535,766 66,21716-Feb-12 NOK 4,259,825 USD 727,313 (16,321)16-Feb-12 SEK 16,636,811 USD 2,413,178 4,75216-Feb-12 SGD 3,176,666 USD 2,437,815 11,94916-Feb-12 USD 799,493 AUD 795,783 (7,245)16-Feb-12 USD 848,369 CAD 878,431 (12,418)16-Feb-12 USD 3,289,299 CHF 3,077,300 4,57916-Feb-12 USD 1,136,513 EUR 871,307 5,08716-Feb-12 USD 3,874,349 GBP 2,489,215 7,30216-Feb-12 USD 3,945,844 HKD 30,691,826 (6,387)16-Feb-12 USD 973,618 JPY 75,737,184 (8,490)16-Feb-12 USD 407,363 SGD 527,801 336
Total 81,285
105

Transferable Securities Admitted to an Official Exchange Listing
Bonds
UNITED STATES OF AMERICA2,538,000 ACCO Brands 15.03.15/10.625% 2,836,215 0.202,000,000 ACCO Brands 15.08.15/7.625% 2,050,000 0.143,170,000 AES 15.10.17/8.000% 3,487,000 0.247,140,000 Alcatel-Lucent USA 15.03.29/6.450% 5,158,650 0.366,470,000 American Axle & Manufacturing 01.03.17/7.875% 6,405,300 0.454,365,000 Arch Coal 01.08.16/8.750% 4,790,587 0.334,975,000 Avaya 01.11.15/9.750% 4,502,375 0.311,035,000 Belden 15.03.17/7.000% 1,038,881 0.074,120,000 Cablevision Systems 15.09.17/8.625% 4,593,800 0.322,860,000 Chesapeake Energy 15.08.20/6.625% 3,074,500 0.21
295,000 Chesapeake Energy 15.12.18/7.250% 327,450 0.027,135,000 Cincinnati Bell 15.10.20/8.375% 7,135,000 0.50
14,991,192 CIT Group 01.05.16/7.000% 15,047,409 1.055,117,069 CIT Group 01.05.17/7.000% 5,136,258 0.36
4,655,000 Community Health Systems 15.07.15/8.875% 4,847,019 0.343,015,000 Constellation Brands 01.09.16/7.250% 3,327,806 0.233,170,000 Dana Holding 15.02.19/6.500% 3,217,550 0.222,050,000 DaVita 01.11.18/6.375% 2,096,125 0.15
380,000 DaVita 01.11.20/6.625% 391,875 0.034,210,000 Denbury Resources 15.02.20/8.250% 4,715,200 0.33
425,000 El Paso 15.06.17/7.000% 470,478 0.0325,000 El Paso 01.06.18/7.250% 27,677 0.00
835,000 El Paso 15.01.32/7.750% 968,600 0.071,890,000 Encore Acquisition 01.05.16/9.500% 2,088,450 0.153,215,000 Energy Future Intermediate
Holding 01.12.20/10.000% 3,407,900 0.241,890,000 Fidelity National Information
Services 15.07.17/7.625% 2,055,375 0.147,355,000 Ford Motor Credit 15.08.17/6.625% 8,021,201 0.56
11,205,000 Ford Motor Credit 15.05.18/5.000% 11,247,534 0.791,160,000 Ford Motor Credit 02.08.21/5.875% 1,210,734 0.081,907,000 Forest Oil 15.06.19/7.250% 1,940,372 0.141,295,000 Frontier Communications 15.03.15/6.625% 1,288,525 0.091,940,000 Frontier Communications 15.04.20/8.500% 1,983,650 0.143,346,000 General Cable 01.04.17/7.125% 3,354,365 0.234,135,000 Geo Group 15.10.17/7.750% 4,414,112 0.31
267,000 Goodyear Tire & Rubber 15.05.16/10.500% 295,702 0.024,430,000 Goodyear Tire & Rubber 15.08.20/8.250% 4,850,850 0.342,930,000 Goodyear Tire & Rubber 15.08.20/8.750% 3,223,000 0.233,365,000 Hanesbrands 15.12.16/8.000% 3,676,262 0.26
162,000 HCA 15.02.17/9.875% 177,795 0.01475,000 HCA 15.02.20/6.500% 495,781 0.03
17,455,000 HCA 15.02.22/7.500% 17,935,012 1.255,257,000 Health Management Associates 15.04.16/6.125% 5,467,280 0.382,365,000 Healthsouth 01.10.18/7.250% 2,359,088 0.173,290,000 Healthsouth 15.09.22/7.750% 3,252,988 0.23
500,000 Hertz 01.01.14/7.875% 646,997 0.051,635,000 Huntsman International 30.06.16/5.500% 1,618,650 0.112,225,000 International Lease Finance 15.05.16/5.750% 2,062,769 0.14
865,000 International Lease Finance 15.05.19/6.250% 799,107 0.061,580,000 International Lease Finance 15.12.20/8.250% 1,599,750 0.114,145,000 Iron Mountain 15.07.18/8.750% 4,331,525 0.302,410,000 Iron Mountain 15.08.21/8.375% 2,584,725 0.182,945,000 Jarden 15.01.20/7.500% 3,121,700 0.223,490,000 JC Penney 01.04.17/7.950% 3,821,550 0.27
845,000 JC Penney 15.02.18/5.750% 846,217 0.06775,000 Lear 15.03.18/7.875% 842,813 0.06
2,120,000 Manitowoc 15.02.18/9.500% 2,268,400 0.163,900,000 Manitowoc 01.11.20/8.500% 4,129,125 0.291,470,000 Masco 15.03.20/7.125% 1,483,653 0.106,360,000 MetroPCS Wireless 01.09.18/7.875% 6,455,400 0.45
80,000 MGM Resorts International 01.04.16/6.875% 73,600 0.018,615,000 MGM Resorts International 01.06.16/7.500% 8,270,400 0.582,495,000 MGM Resorts International 15.11.17/11.125% 2,859,894 0.203,145,000 Mueller Water Products 01.09.20/8.750% 3,431,981 0.242,135,000 Parker Drilling 01.04.18/9.125% 2,252,425 0.163,130,000 Petrohawk Energy 15.08.18/7.250% 3,536,900 0.251,915,000 PolyOne 15.09.20/7.375% 1,977,238 0.143,852,000 RailAmerica 01.07.17/9.250% 4,227,570 0.303,950,000 Regions Bank 15.05.18/7.500% 3,950,000 0.28
875,000 Regions Financial 15.06.15/5.750% 844,375 0.063,455,000 Rite Aid 12.06.16/9.750% 3,817,775 0.272,210,000 Rite Aid 01.03.17/7.500% 2,221,050 0.162,015,000 Rite Aid 15.06.17/9.500% 1,843,725 0.131,630,000 Rite Aid 15.10.19/10.250% 1,803,187 0.131,812,000 RSC Equipment Rental 01.12.14/9.500% 1,870,890 0.131,031,000 Scotts Miracle-Gro 15.01.18/7.250% 1,087,705 0.08
11,251,000 Sealy Mattress 15.06.14/8.250% 11,194,745 0.781,430,000 Service Corp. International 15.06.17/7.000% 1,558,700 0.11
815,000 Service Corp. International 01.10.18/7.625% 910,763 0.062,775,000 Service Corp. International 15.05.19/7.000% 2,934,563 0.21
4,045,000 Spirit Aerosystems 01.10.17/7.500% 4,409,050 0.311,110,000 Sprint Capital 01.05.19/6.900% 921,300 0.06
22,465,000 Sprint Capital 15.03.32/8.750% 18,280,894 1.284,995,000 Supervalu 01.05.16/8.000% 5,182,313 0.364,509,000 Tenet Healthcare 01.02.15/9.250% 4,768,268 0.33
740,000 Tenet Healthcare 01.05.18/10.000% 849,150 0.06970,000 Tenet Healthcare 01.07.19/8.875% 1,093,675 0.08
5,950,000 Tenet Healthcare 01.08.20/8.000% 5,979,750 0.424,720,000 Terex 15.11.17/8.000% 4,649,200 0.332,430,000 United Rentals North America 15.12.19/9.250% 2,557,575 0.185,120,000 United Rentals North America 15.09.20/8.375% 5,017,600 0.351,385,000 Vulcan Materials 01.12.16/6.500% 1,436,938 0.10
320,817,311 22.45
LUXEMBOURG5,504,000 MagnaChip Semiconductor
Finance 15.04.18/10.500% 5,751,680 0.402,300,000 Wind Acquisition Finance 144A 15.02.18/7.250% 2,087,250 0.15
7,838,930 0.55
BERMUDA3,120,000 Aircastle 01.08.18/9.750% 3,283,800 0.23
3,283,800 0.23
GERMANY2,350,000 Kinove German Bondco 144A 15.06.18/9.625% 2,220,750 0.16
2,220,750 0.16
LIBERIA1,330,000 Royal Caribbean Cruises 15.06.16/7.250% 1,436,400 0.10
1,436,400 0.10
Total Bonds 335,597,191 23.49
Total Transferable Securities Admitted to anOfficial Exchange Listing
335,597,191 23.49
Transferable Securities Dealt in on Another Regulated Market
Bonds
UNITED STATES OF AMERICA3,890,000 Academy Finance 144A 01.08.19/9.250% 3,860,825 0.274,575,000 Accellent 01.11.17/10.000% 3,728,625 0.263,395,000 Accellent 01.02.17/8.375% 3,344,075 0.232,220,000 AES 15.04.16/9.750% 2,553,000 0.181,285,000 Aleris International 15.02.18/7.625% 1,254,481 0.095,200,000 Allison Transmission 144A 15.05.19/7.125% 5,122,000 0.367,170,000 Ally Financial 01.12.14/6.750% 7,241,700 0.51
15,430,000 Ally Financial 01.12.17/6.250% 14,973,087 1.061,485,000 AMC Entertainment 01.06.19/8.750% 1,544,400 0.115,610,000 AMC Entertainment 01.12.20/9.750% 5,357,550 0.37
558,000 American Axle & ManufacturingHoldings 144A 15.01.17/9.250% 608,220 0.04
3,120,000 American Tire Distributors 01.06.17/9.750% 3,229,200 0.233,580,000 Amkor Technology 01.05.18/7.375% 3,669,500 0.262,720,000 Amsted Industries 144A 15.03.18/8.125% 2,896,800 0.202,515,000 Arch Coal 144A 15.06.19/7.000% 2,577,875 0.18
2,030,000 Arch Coal 144A 15.06.21/7.250% 2,095,975 0.152,825,000 Aspect Software 15.05.17/10.625% 2,930,937 0.216,736,000 Associated Materials 01.11.17/9.125% 5,910,840 0.414,150,000 Atkore International 01.01.18/9.875% 4,004,750 0.282,670,000 Audatex North America 144A 15.06.18/6.750% 2,710,050 0.192,932,084 Avaya 01.11.15/10.125% 2,653,536 0.194,150,000 Avaya 144A 01.04.19/7.000% 4,046,250 0.282,735,000 Avis Budget Car Rental 15.03.18/9.625% 2,844,400 0.206,555,000 Avis Budget Car Rental 15.01.19/8.250% 6,538,612 0.466,665,000 Bank of America 31.12.49/8.000%* 5,846,838 0.411,611,000 Belden 15.06.19/9.250% 1,727,797 0.12
18,485,000 Biomet 15.10.17/10.375% 20,148,650 1.412,645,000 Bon-Ton Department Stores 15.03.14/10.250% 1,709,331 0.123,155,000 BreitBurn Energy Partners 15.10.20/8.625% 3,312,750 0.232,597,000 Brigham Exploration 01.10.18/8.750% 3,194,310 0.22
165,000 Building Materials Corp ofAmerica 144A 15.08.18/6.875% 173,250 0.01
3,110,000 Building Materials Corp ofAmerica 144A 01.05.21/6.750% 3,242,175 0.23
6,102,000 Bumble Bee Acquisition 144A 15.12.17/9.000% 6,224,040 0.443,875,000 BWAY Holding 15.06.18/10.000% 4,146,250 0.29
15,725,000 Caesars EntertainmentOperating 01.06.17/11.250% 16,766,781 1.17
3,828,000 Caesars EntertainmentOperating 15.12.18/10.000% 2,641,320 0.19
4,165,000 Calpine 144A 15.10.17/7.250% 4,394,075 0.31
106
JPMorgan Investment Funds - Global High Yield Bond Fund
Schedule of Investments (Market Value Expressed in USD)
As at 31 December 2011
Quantity/Nominal
Value
Name of Securities Maturity/Coupon
MarketValue
%of
NetAssets
Quantity/Nominal
Value
Name of Securities Maturity/Coupon
MarketValue
%of
NetAssets
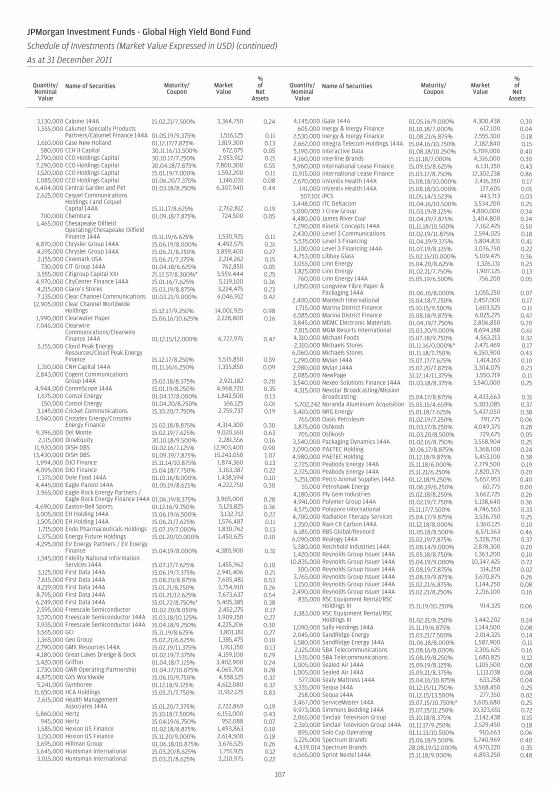
3,130,000 Calpine 144A 15.02.21/7.500% 3,364,750 0.241,555,000 Calumet Specialty Products
Partners/Calumet Finance 144A 01.05.19/9.375% 1,516,125 0.111,610,000 Case New Holland 01.12.17/7.875% 1,819,300 0.13
580,000 CCH II Capital 30.11.16/13.500% 672,075 0.052,790,000 CCO Holdings Capital 30.10.17/7.250% 2,953,912 0.217,290,000 CCO Holdings Capital 30.04.18/7.875% 7,800,300 0.551,520,000 CCO Holdings Capital 15.01.19/7.000% 1,592,200 0.111,085,000 CCO Holdings Capital 01.06.20/7.375% 1,146,031 0.08
6,404,000 Central Garden and Pet 01.03.18/8.250% 6,307,940 0.442,625,000 Cequel Communications
Holdings I and CequelCapital 144A 15.11.17/8.625% 2,762,812 0.19
700,000 Chemtura 01.09.18/7.875% 724,500 0.051,465,000 Chesapeake Oilfield
Operating/Chesapeake OilfieldFinance 144A 15.11.19/6.625% 1,530,925 0.11
4,870,000 Chrysler Group 144A 15.06.19/8.000% 4,492,575 0.314,195,000 Chrysler Group 144A 15.06.21/8.250% 3,859,400 0.272,155,000 Cinemark USA 15.06.21/7.375% 2,214,262 0.15
730,000 CIT Group 144A 01.04.18/6.625% 762,850 0.053,555,000 Citigroup Capital XXI 21.12.57/8.300%* 3,559,444 0.254,970,000 CityCenter Finance 144A 15.01.16/7.625% 5,119,100 0.364,215,000 Claire’s Stores 15.03.19/8.875% 3,224,475 0.237,135,000 Clear Channel Communications 01.03.21/9.000% 6,046,912 0.42
12,905,000 Clear Channel WorldwideHoldings 15.12.17/9.250% 14,001,925 0.98
1,990,000 Clearwater Paper 15.06.16/10.625% 2,228,800 0.167,045,000 Clearwire
Communications/ClearwireFinance 144A 01.12.15/12.000% 6,727,975 0.47
5,155,000 Cloud Peak EnergyResources/Cloud Peak EnergyFinance 15.12.17/8.250% 5,515,850 0.39
1,310,000 CNH Capital 144A 01.11.16/6.250% 1,355,850 0.092,843,000 Cogent Communications
Group 144A 15.02.18/8.375% 2,921,182 0.204,944,000 CommScope 144A 15.01.19/8.250% 4,968,720 0.351,675,000 Consol Energy 01.04.17/8.000% 1,842,500 0.13
150,000 Consol Energy 01.04.20/8.250% 166,125 0.013,145,000 Cricket Communications 15.10.20/7.750% 2,759,737 0.193,940,000 Crosstex Energy/Crosstex
Energy Finance 15.02.18/8.875% 4,314,300 0.309,396,000 Del Monte 15.02.19/7.625% 9,020,160 0.632,115,000 DineEquity 30.10.18/9.500% 2,281,556 0.16
11,920,000 DISH DBS 01.02.16/7.125% 12,903,400 0.9013,430,000 DISH DBS 01.09.19/7.875% 15,243,050 1.071,994,000 DJO Finance 15.11.14/10.875% 1,874,360 0.134,095,000 DJO Finance 15.04.18/7.750% 3,163,387 0.221,375,000 Dole Food 144A 01.10.16/8.000% 1,438,594 0.10
4,445,000 Eagle Parent 144A 01.05.19/8.625% 4,222,750 0.303,965,000 Eagle Rock Energy Partners /
Eagle Rock Energy Finance 144A 01.06.19/8.375% 3,965,000 0.284,690,000 Easton-Bell Sports 01.12.16/9.750% 5,123,825 0.363,005,000 EH Holding 144A 15.06.19/6.500% 3,132,712 0.221,505,000 EH Holding 144A 15.06.21/7.625% 1,576,487 0.111,715,000 Endo Pharmaceuticals Holdings 15.07.19/7.000% 1,830,762 0.131,375,000 Energy Future Holdings 15.01.20/10.000% 1,450,625 0.104,295,000 EV Energy Partners / EV Energy
Finance 15.04.19/8.000% 4,380,900 0.311,345,000 Fidelity National Information
Services 144A 15.07.17/7.625% 1,455,962 0.103,125,000 First Data 144A 15.06.19/7.375% 2,941,406 0.217,615,000 First Data 144A 15.08.20/8.875% 7,605,481 0.534,219,000 First Data 144A 15.01.21/8.250% 3,754,910 0.268,795,000 First Data 144A 15.01.21/12.625% 7,673,637 0.546,249,000 First Data 144A 15.01.22/8.750%* 5,405,385 0.382,595,000 Freescale Semiconductor 01.02.20/8.050% 2,452,275 0.173,570,000 Freescale Semiconductor 144A 15.03.18/10.125% 3,909,150 0.273,935,000 Freescale Semiconductor 144A 15.04.18/9.250% 4,225,206 0.303,565,000 GCI 15.11.19/8.625% 3,801,181 0.271,365,000 Geo Group 15.02.21/6.625% 1,385,475 0.102,790,000 GMX Resources 144A 15.02.19/11.375% 1,911,150 0.134,180,000 Great Lakes Dredge & Dock 01.02.19/7.375% 4,159,100 0.293,420,000 Griffon 01.04.18/7.125% 3,402,900 0.243,730,000 GWR Operating Partnership 01.04.17/10.875% 4,065,700 0.284,875,000 GXS Worldwide 15.06.15/9.750% 4,558,125 0.325,241,000 Gymboree 01.12.18/9.125% 4,612,080 0.32
11,650,000 HCA Holdings 15.05.21/7.750% 11,912,125 0.832,615,000 Health Management
Associates 144A 15.01.20/7.375% 2,722,869 0.195,860,000 Hertz 15.10.18/7.500% 6,153,000 0.43
945,000 Hertz 15.04.19/6.750% 952,088 0.071,585,000 Hexion US Finance 01.02.18/8.875% 1,493,863 0.103,150,000 Hexion US Finance 15.11.20/9.000% 2,614,500 0.183,695,000 Hillman Group 01.06.18/10.875% 3,676,525 0.261,645,000 Huntsman International 15.03.20/8.625% 1,751,925 0.123,015,000 Huntsman International 15.03.21/8.625% 3,210,975 0.22
4,145,000 iGate 144A 01.05.16/9.000% 4,300,438 0.30605,000 Inergy & Inergy Finance 01.10.18/7.000% 617,100 0.04
2,530,000 Inergy & Inergy Finance 01.08.21/6.875% 2,555,300 0.182,662,000 Integra Telecom Holdings 144A 15.04.16/10.750% 2,182,840 0.155,190,000 Interactive Data 01.08.18/10.250% 5,709,000 0.404,160,000 Interline Brands 15.11.18/7.000% 4,316,000 0.305,960,000 International Lease Finance 15.09.15/8.625% 6,131,350 0.4311,915,000 International Lease Finance 15.03.17/8.750% 12,302,238 0.862,670,000 inVentiv Health 144A 15.08.18/10.000% 2,416,350 0.17
141,000 inVentiv Health 144A 15.08.18/10.000% 127,605 0.01507,101 iPCS 01.05.14/3.523% 443,713 0.03
3,448,000 ITC Deltacom 01.04.16/10.500% 3,534,200 0.255,000,000 J Crew Group 01.03.19/8.125% 4,800,000 0.344,480,000 James River Coal 01.04.19/7.875% 3,404,800 0.247,290,000 Kinetic Concepts 144A 01.11.18/10.500% 7,162,425 0.502,430,000 Level 3 Communications 01.02.19/11.875% 2,594,025 0.185,535,000 Level 3 Financing 01.04.19/9.375% 5,804,831 0.413,100,000 Level 3 Financing 144A 01.07.19/8.125% 3,076,750 0.224,753,000 Libbey Glass 15.02.15/10.000% 5,109,475 0.363,055,000 Linn Energy 15.04.20/8.625% 3,326,131 0.231,825,000 Linn Energy 01.02.21/7.750% 1,907,125 0.13
760,000 Linn Energy 144A 15.05.19/6.500% 756,200 0.051,050,000 Longview Fibre Paper &
Packaging 144A 01.06.16/8.000% 1,055,250 0.072,400,000 Mantech International 15.04.18/7.250% 2,457,000 0.171,715,000 Marina District Finance 15.10.15/9.500% 1,603,525 0.11
6,585,000 Marina District Finance 15.08.18/9.875% 6,025,275 0.423,845,000 MEMC Electronic Materials 01.04.19/7.750% 2,806,850 0.207,815,000 MGM Resorts International 15.03.20/9.000% 8,694,188 0.614,310,000 Michael Foods 15.07.18/9.750% 4,563,213 0.322,310,000 Michaels Stores 01.11.16/0.000%* 2,471,469 0.17
6,060,000 Michaels Stores 01.11.18/7.750% 6,150,900 0.431,290,000 Mylan 144A 15.07.17/7.625% 1,414,163 0.102,980,000 Mylan 144A 15.07.20/7.875% 3,304,075 0.232,085,000 NewPage 31.12.14/11.375% 1,550,719 0.113,540,000 Nexeo Solutions Finance 144A 01.03.18/8.375% 3,540,000 0.254,315,000 Nexstar Broadcasting/Mission
Broadcasting 15.04.17/8.875% 4,433,663 0.315,702,242 Noranda Aluminium Acquisition 15.05.15/4.659% 5,303,085 0.375,410,000 NRG Energy 15.01.18/7.625% 5,437,050 0.38
765,000 Oasis Petroleum 01.02.19/7.250% 791,775 0.063,875,000 Oshkosh 01.03.17/8.250% 4,049,375 0.28
705,000 Oshkosh 01.03.20/8.500% 729,675 0.053,540,000 Packaging Dynamics 144A 01.02.16/8.750% 3,558,904 0.253,090,000 PAETEC Holding 30.06.17/8.875% 3,368,100 0.244,980,000 PAETEC Holding 01.12.18/9.875% 5,453,100 0.382,725,000 Peabody Energy 144A 15.11.18/6.000% 2,779,500 0.192,725,000 Peabody Energy 144A 15.11.21/6.250% 2,820,375 0.205,251,000 Petco Animal Supplies 144A 01.12.18/9.250% 5,657,953 0.40
55,000 Petrohawk Energy 01.06.19/6.250% 60,775 0.004,180,000 Ply Gem Industries 15.02.18/8.250% 3,662,725 0.264,941,000 Polymer Group 144A 01.02.19/7.750% 5,138,640 0.364,575,000 Polypore International 15.11.17/7.500% 4,746,563 0.334,700,000 Radiation Therapy Services 15.04.17/9.875% 3,536,750 0.251,350,000 Rain CII Carbon 144A 01.12.18/8.000% 1,360,125 0.106,185,000 RBS Global/Rexnord 01.05.18/8.500% 6,571,563 0.46
6,090,000 Realogy 144A 15.02.19/7.875% 5,328,750 0.375,380,000 Reichhold Industries 144A 15.08.14/9.000% 2,878,300 0.201,420,000 Reynolds Group Issuer 144A 15.05.18/8.750% 1,363,200 0.10
10,835,000 Reynolds Group Issuer 144A 15.04.19/9.000% 10,347,425 0.72300,000 Reynolds Group Issuer 144A 15.08.19/7.875% 314,250 0.02
3,765,000 Reynolds Group Issuer 144A 15.08.19/9.875% 3,670,875 0.261,150,000 Reynolds Group Issuer 144A 15.02.21/6.875% 1,144,250 0.08
2,490,000 Reynolds Group Issuer 144A 15.02.21/8.250% 2,216,100 0.16835,000 RSC Equipment Rental/RSC
Holdings III 15.11.19/10.250% 914,325 0.063,383,000 RSC Equipment Rental/RSC
Holdings III 01.02.21/8.250% 3,442,202 0.241,090,000 Sally Holdings 144A 15.11.19/6.875% 1,144,500 0.082,045,000 SandRidge Energy 15.03.21/7.500% 2,014,325 0.141,580,000 SandRidge Energy 144A 01.06.18/8.000% 1,587,900 0.112,125,000 SBA Telecommunications 15.08.16/8.000% 2,305,625 0.161,535,000 SBA Telecommunications 15.08.19/8.250% 1,680,825 0.121,005,000 Sealed Air 144A 15.09.19/8.125% 1,105,500 0.081,005,000 Sealed Air 144A 15.09.21/8.375% 1,113,038 0.08
577,000 Sealy Mattress 144A 15.04.16/10.875% 633,258 0.043,335,000 Sequa 144A 01.12.15/11.750% 3,568,450 0.25
258,000 Sequa 144A 01.12.15/13.500% 277,350 0.023,467,000 ServiceMaster 144A 15.07.15/10.750%* 3,605,680 0.259,973,000 Simmons Bedding 144A 15.07.15/11.250% 10,323,651 0.722,065,000 Sinclair Television Group 15.10.18/8.375% 2,142,438 0.152,310,000 Sinclair Television Group 144A 01.11.17/9.250% 2,529,450 0.18
895,000 Solo Cup Operating 01.11.13/10.500% 910,663 0.065,225,000 Spectrum Brands 15.06.18/9.500% 5,740,969 0.404,539,014 Spectrum Brands 28.08.19/12.000% 4,970,220 0.356,565,000 Sprint Nextel 144A 15.11.18/9.000% 6,893,250 0.48
107
JPMorgan Investment Funds - Global High Yield Bond Fund
Schedule of Investments (Market Value Expressed in USD) (continued)
As at 31 December 2011
Quantity/Nominal
Value
Name of Securities Maturity/Coupon
MarketValue
%of
NetAssets
Quantity/Nominal
Value
Name of Securities Maturity/Coupon
MarketValue
%of
NetAssets

1,120,000 Sprint Nextel 144A 15.11.21/11.500% 1,110,200 0.084,650,000 SSI Investments II/SSI Co-Issuer 01.06.18/11.125% 4,940,625 0.352,930,000 Stewart Enterprises 15.04.19/6.500% 2,959,300 0.21
12,265,000 Sungard Data Systems 15.08.15/10.250% 12,755,600 0.894,025,000 SunGard Data Systems 15.11.18/7.375% 4,135,688 0.293,857,626 Surgical Care Affiliates 144A 15.07.15/8.875%* 3,867,270 0.271,625,000 Syniverse Holdings 15.01.19/9.125% 1,730,625 0.12
2,400,000 Tenet Healthcare 144A 01.11.18/6.250% 2,448,000 0.175,250,000 Texas Competitive Electric
Holdings 144A 01.10.20/11.500% 4,482,188 0.313,868,000 Tomkins 01.10.18/9.000% 4,307,985 0.30
920,000 Travelport 01.09.14/4.879%* 464,600 0.03180,000 Travelport 01.09.14/9.875% 109,350 0.01980,000 Travelport 01.03.16/9.000% 551,250 0.04
4,100,000 UCI International 15.02.19/8.625% 3,997,500 0.284,015,000 United Surgical Partners
International 01.05.17/8.875% 4,020,019 0.283,440,000 United Surgical Partners
International 01.05.17/9.250% 3,474,400 0.244,940,000 US Oncology 15.08.17/9.125% 86,450 0.01
555,000 Valeant PharmaceuticalsInternational 144A 01.10.17/6.750% 557,775 0.04
7,585,000 Valeant PharmaceuticalsInternational 144A 01.12.18/6.875% 7,622,925 0.53
1,215,000 Valeant PharmaceuticalsInternational 144A 01.10.20/7.000% 1,208,925 0.09
5,150,000 Valeant PharmaceuticalsInternational 144A 15.07.22/7.250% 5,072,750 0.36
2,945,000 Venoco 15.02.19/8.875% 2,657,863 0.193,160,000 Vertellus Specialties 144A 01.10.15/9.375% 2,417,400 0.176,085,000 Visant 01.10.17/10.000% 5,598,200 0.392,120,000 Visteon 144A 15.04.19/6.750% 2,109,400 0.151,385,000 Vulcan Materials 15.06.21/7.500% 1,506,188 0.11
6,080,000 Windstream 01.09.18/8.125% 6,543,600 0.463,105,000 Windstream 01.10.21/7.750% 3,198,150 0.222,645,000 Windstream 01.04.23/7.500% 2,625,163 0.183,555,000 WMG Acquisition 15.06.16/9.500% 3,874,950 0.272,190,000 WMG Acquisition 144A 01.10.18/11.500% 2,184,525 0.152,815,000 WPX Energy 144A 15.01.22/6.000% 2,892,413 0.20
355,000 Wynn Las Vegas Capital 01.05.20/7.875% 392,719 0.034,554,000 Yankee Candle 15.02.17/9.750% 4,440,150 0.31
775,000 YCC Holdings/Yankee Finance 15.02.16/10.250% 682,000 0.053,100,000 Zayo Group/Zayo Capital 15.03.17/10.250% 3,317,000 0.23
847,095,802 59.31
LUXEMBOURG9,084,000 Intelsat Jackson Holdings 15.06.16/11.250% 9,560,910 0.673,395,000 Intelsat Jackson Holdings 15.10.20/7.250% 3,437,437 0.243,050,000 Intelsat Jackson Holdings 144A 01.04.19/7.250% 3,111,000 0.223,420,000 Intelsat Luxembourg 04.02.17/11.250% 3,334,500 0.233,455,000 Intelsat Luxembourg 04.02.17/11.500% 3,334,075 0.233,880,000 Intelsat Luxembourg 144A 04.02.17/11.500%* 3,744,200 0.264,495,000 Wind Acquisition Finance 144A 15.07.17/11.750% 4,034,262 0.29
30,556,384 2.14
CANADA3,585,000 Kodiak Oil & Gas 144A 01.12.19/8.125% 3,719,437 0.262,525,000 Novelis 15.12.17/8.375% 2,695,437 0.193,235,000 Novelis 15.12.20/8.750% 3,469,537 0.247,995,000 Quebecor Media 15.03.16/7.750% 8,264,831 0.583,909,000 Trinidad Drilling 144A 15.01.19/7.875% 4,045,815 0.28
22,195,057 1.55
NETHERLANDS278,000 NXP/NXP Funding 144A 15.07.13/10.000% 302,325 0.02
7,825,000 NXP/NXP Funding 144A 01.08.18/9.750% 8,568,375 0.605,200,000 Sensata Technologies 144A 15.05.19/6.500% 5,161,000 0.36
14,031,700 0.98
UNITED KINGDOM8,410,000 Ineos Finance 144A 15.05.15/9.000% 8,578,200 0.605,763,000 Ineos Group Holdings 144A 15.02.16/8.500% 4,610,400 0.32
13,188,600 0.92
IRELAND1,785,000 Ardagh Packaging Finance 144A 15.10.17/7.375% 1,811,775 0.136,875,000 Ardagh Packaging Finance 144A 15.10.20/9.125% 6,840,625 0.48
420,360 AWAS Aviation Capital 144A 17.10.16/7.000% 422,987 0.03
9,075,387 0.64
AUSTRALIA2,758,000 FMG Resources August 2006 Pty
144A 01.11.15/7.000% 2,785,580 0.19755,000 FMG Resources August 2006 Pty
144A 01.02.16/6.375% 734,237 0.052,855,000 FMG Resources August 2006 Pty
144A 01.02.18/6.875% 2,726,525 0.192,490,000 FMG Resources August 2006 Pty
144A 01.11.19/8.250% 2,521,125 0.18
8,767,467 0.61
CAYMAN ISLANDS7,300,000 UPCB Finance III 144A 01.07.20/6.625% 7,227,000 0.50
960,000 UPCB Finance V 144A 15.11.21/7.250% 976,800 0.07
8,203,800 0.57
BERMUDA1,250,000 Aircastle 144A 01.08.18/9.750% 1,309,375 0.091,550,000 Digicel 144A 01.09.17/8.250% 1,581,000 0.112,505,000 Digicel Group 144A 15.04.18/10.500% 2,530,050 0.18
5,420,425 0.38
Total Bonds 958,534,622 67.10
Commercial Paper
UNITED STATES OF AMERICA900,000 Freddie Mac Discount Notes 23.01.12/0.000% 899,977 0.06
30,000,000 Freddie Mac Discount Notes 08.02.12/0.000% 29,999,675 2.1046,155,000 Freddie Mac Discount Notes 22.02.12/0.000% 46,154,320 3.23
77,053,972 5.39
Total Commercial Paper 77,053,972 5.39
Total Transferable Securities Dealt in on AnotherRegulated Market
1,035,588,594 72.49
Other Transferable Securities
Bonds
UNITED STATES OF AMERICA1,605,000 Quebecor Printing 01.08.27/6.500% 68,213 0.00
68,213 0.00
Total Bonds 68,213 0.00
Total Other Transferable Securities 68,213 0.00
Total Investments 1,371,253,998 95.98
Cash 32,636,922 2.28
Other Assets/(Liabilities) 24,829,288 1.74
Total Net Assets 1,428,720,208 100.00
* Variable coupon rates are those quoted as at 31 December 2011.
108
JPMorgan Investment Funds - Global High Yield Bond Fund
Schedule of Investments (Market Value Expressed in USD) (continued)
As at 31 December 2011
Quantity/Nominal
Value
Name of Securities Maturity/Coupon
MarketValue
%of
NetAssets
Quantity/Nominal
Value
Name of Securities Maturity/Coupon
MarketValue
%of
NetAssets

Allocation of Portfolio as at 31 December 2011 % ofNet Assets
Fixed Income SecuritiesUnited States of America 87.15Luxembourg 2.69Canada 1.55Netherlands 0.98United Kingdom 0.92Ireland 0.64Australia 0.61Bermuda 0.61Cayman Islands 0.57Germany 0.16Liberia 0.10Total Fixed Income Securities 95.98Cash and Other Assets/(Liabilities) 4.02
Total 100.00
Allocation of Portfolio as at 30 June 2011 (Unaudited) % ofNet Assets
Fixed Income SecuritiesUnited States of America 82.92Luxembourg 2.42Canada 1.48United Kingdom 0.99Netherlands 0.84Ireland 0.72Bermuda 0.50Cayman Islands 0.43Australia 0.29Liberia 0.16Germany 0.09Total Fixed Income Securities 90.84SharesConsumer Discretionary 0.01Total Shares 0.01Cash and Other Assets/(Liabilities) 9.15
Total 100.00
109
JPMorgan Investment Funds - Global High Yield Bond Fund
Schedule of Investments (Market Value Expressed in USD) (continued)
As at 31 December 2011
Quantity/Nominal
Value
Name of Securities Maturity/Coupon
MarketValue
%of
NetAssets
Quantity/Nominal
Value
Name of Securities Maturity/Coupon
MarketValue
%of
NetAssets

JPMorgan Investment Funds - Global High Yield Bond Fund
Schedule of Investments - Outstanding Forward Foreign Exchange Contracts (Expressed in USD)
As at 31 December 2011
SettlementDate Currency
AmountPurchased Currency
AmountSold
UnrealisedGain/(Loss)
30-Jan-12 EUR 414,387,534 USD 539,946,537 (1,950,831)30-Jan-12 USD 6,466,113 EUR 4,949,082 40,763
Total (1,910,068)
Schedule of Investments - Outstanding Credit Default Swaps (Expressed in USD)
TerminationDate Counterparty Referenced Obligation
ProtectionBuyer/Seller Currency Nominal
MarketValue
UnrealisedGain/(Loss)
20-Jun-16 Barclays Bank CDX.NA.HY_S16.V1 Seller USD 25,000,000 (1,068,873) (1,712,970)20-Jun-16 Barclays Bank CDX.NA.HY_S16.V1 Seller USD 10,000,000 (427,549) (622,688)20-Jun-16 Morgan Stanley CDX.NA.HY_S16.V1 Seller USD 15,000,000 (641,324) (924,657)20-Dec-16 Morgan Stanley CDX.NA.HY_S17.V1 Seller USD 25,000,000 (1,679,127) (88,850)
Total (3,816,873) (3,349,165)
110

111
Transferable Securities Admitted to an Official Exchange Listing
Shares
UNITED STATES OF AMERICA19,394 Abbott Laboratories 842,142 0.2212,500 American Campus Communities 407,245 0.11
1,852 Bank of America Preference Shares 1,096,462 0.291,800 Boston Properties 139,037 0.04
74,400 Brandywine Realty Trust 552,820 0.1540,240 Bristol-Myers Squibb 1,096,947 0.2953,692 CenterPoint Energy 837,406 0.2217,169 Chevron 1,418,306 0.376,000 Citigroup Capital XIII Preference Shares 120,897 0.03
40,574 Coca-Cola 2,195,694 0.5920,931 ConocoPhillips 1,176,154 0.31
66,600 DCT Industrial Trust 262,439 0.0772,800 Duke Realty 686,189 0.1851,894 EI du Pont de Nemours & Co. 1,832,211 0.4932,797 General Motors Preference Shares 863,857 0.236,000 GMAC Capital Trust I Preference Shares 89,488 0.02
26,000 HCP 838,157 0.2325,375 HCP Preference Shares 499,661 0.137,600 Health Care REIT 321,787 0.0911,687 International Business Machines 1,675,912 0.4526,925 Kilroy Realty Preference Shares 517,840 0.1415,400 Liberty Property Trust 367,960 0.107,540 M/I HOMES Preference Shares 65,755 0.026,900 Macerich 271,391 0.0717,100 Mack-Cali Realty 353,118 0.1056,330 Mattel 1,212,263 0.3318,437 McDonald’s 1,424,196 0.3863,552 Merck & Co. 1,851,897 0.5062,816 Microsoft 1,258,449 0.3438,200 NextEra Energy 1,587,682 0.4312,700 Omega Healthcare Investors 192,107 0.0536,265 Paychex 838,561 0.2221,500 Pennsylvania Real Estate Investment Trust 176,151 0.05
100,183 Pfizer 1,679,814 0.4526,145 PG&E 834,876 0.2235,650 PPL 1,521,795 0.4125,700 ProLogis Preference Shares 445,080 0.1225,525 PS Business Parks Preference Shares 494,356 0.1324,550 Public Storage Preference Shares - M Shares 480,484 0.1310,600 Realty Income 289,937 0.0813,900 Regency Centers 407,882 0.1126,225 Regency Centers Preference Shares 499,428 0.13
20,000 Senior Housing Properties Trust 351,065 0.0940,676 Sysco 917,682 0.2525,525 Taubman Centers Preference Shares 504,384 0.1381,832 Time Warner 2,306,401 0.623,325 US Concrete 6,878 0.00
12,473 Ventas 533,205 0.1449,084 Verizon Communications 1,508,575 0.40
1,300 Vornado Realty Trust 77,096 0.0226,925 Vornado Realty Trust Preference Shares 523,441 0.1412,300 Weingarten Realty Investors 209,840 0.0671,093 Wells Fargo & Co. 1,516,830 0.4175,016 Xcel Energy 1,601,686 0.43
43,780,916 11.71
JAPAN99 Advance Residence Investment 147,002 0.04
48,300 Canon 1,641,709 0.4420,100 Daito Trust Construction 1,324,256 0.36
34 Daiwahouse Residential Investment 162,318 0.04550 Japan Retail Fund Investment 625,618 0.17392 Japan Tobacco 1,418,489 0.38220 Kenedix Realty Investment 493,027 0.13
39,600 Nippon Telegraph & Telephone 1,554,518 0.41107 Nomura Real Estate Residential Fund 354,612 0.09139 Orix JREIT 441,933 0.12115 Premier Investment 286,418 0.08
165,400 Sumitomo 1,717,946 0.4676 Tokyu REIT 294,169 0.08
10,462,015 2.80
UNITED KINGDOM54,399 British American Tobacco 1,992,117 0.53
165,054 British Land 913,027 0.24177,030 Cairn Energy 564,036 0.15
349,700 Centrica 1,211,112 0.3286,041 GlaxoSmithKline 1,515,680 0.41
197,258 HSBC Holdings 1,159,899 0.3124,520 Land Securities Group 186,648 0.05
46,510 Segro 116,332 0.0350,124 Standard Chartered 845,764 0.23
829,007 Vodafone Group 1,776,255 0.48
10,280,870 2.75
FRANCE34,855 Compagnie de Saint-Gobain 1,024,563 0.2743,325 GDF Suez 900,077 0.2410,575 PPR 1,171,446 0.3115,117 Sanofi 851,767 0.23
47,168 Schneider Electric 1,893,441 0.5123,102 Sodexo 1,278,580 0.3473,729 Suez Environnement 652,797 0.1732,233 Total 1,267,885 0.346,645 Unibail-Rodamco 915,515 0.25
9,956,071 2.66
AUSTRALIA61,795 ANZ Banking Group 996,893 0.27
118,885 CFS Retail Property Trust 157,996 0.04881,906 Commonwealth Property Office Fund 659,594 0.18
1,563,009 Dexus Property Group 1,015,591 0.27129,652 QBE Insurance Group 1,321,427 0.36108,891 Stockland 271,472 0.07356,408 Tatts Group 682,852 0.18128,233 Westfield Group 788,911 0.21311,440 Westfield Retail Trust 607,701 0.16
6,502,437 1.74
NETHERLANDS13,751 Corio 457,805 0.12
10,344 Eurocommercial Properties - CVA 252,264 0.0754,800 Koninklijke KPN 506,571 0.1342,749 Nieuwe Steen Investment Funds 398,186 0.1174,772 Royal Dutch Shell - A Shares 2,120,002 0.5747,865 Unilever - CVA 1,267,944 0.349,444 Vastned Retail 326,148 0.09
5,328,920 1.43
GERMANY13,098 Allianz Registered Shares 965,650 0.2625,327 BASF 1,360,693 0.3627,054 Deutsche Boerse 1,093,184 0.2978,058 E.ON 1,294,397 0.35
4,713,924 1.26
CHINA3,083,000 China Construction Bank - H Shares** 1,654,409 0.44
760,000 Jiangsu Expressway - H Shares** 538,627 0.15978,000 PetroChina - H Shares** 939,045 0.25964,000 Zhejiang Expressway - H Shares** 481,447 0.13
3,613,528 0.97
SOUTH AFRICA179,247 African Bank Investments 585,061 0.16
17,783 Arrowhead Properties - A Shares 9,533 0.0017,783 Arrowhead Properties - B Shares 6,895 0.00
224,300 Growthpoint Properties 397,934 0.1114,300 Kumba Iron Ore 682,668 0.1863,739 MTN Group 873,121 0.23
563,900 Redefine Properties 398,825 0.1149,800 Vodacom Group Pty 421,662 0.11
3,375,699 0.90
HONG KONG118,500 China Mobile 891,844 0.2486,100 Hang Seng Bank 787,633 0.21
257,000 Hutchison Whampoa 1,662,721 0.44
3,342,198 0.89
SWITZERLAND28,770 Nestlé Registered Shares 1,275,784 0.34
9,551 Roche Holding - Genussschein 1,247,252 0.3320,635 Swiss Re 807,137 0.22
3,330,173 0.89
TAIWAN64,000 Asustek Computer 351,142 0.0956,000 MediaTek 394,831 0.11
224,000 Novatek Microelectronics 432,071 0.12305,000 Quanta Computer 494,461 0.13
JPMorgan Investment Funds - Global Income Fund
Schedule of Investments (Market Value Expressed in EUR)
As at 31 December 2011
Quantity/Nominal
Value
Name of Securities Maturity/Coupon
MarketValue
%of
NetAssets
Quantity/Nominal
Value
Name of Securities Maturity/Coupon
MarketValue
%of
NetAssets

216,000 Taiwan Mobile 518,809 0.14108,400 Taiwan Semiconductor Manufacturing ADR 1,092,727 0.29
3,284,041 0.88
BRAZIL48,200 AES Tiete 470,760 0.1323,600 Cielo 470,020 0.1227,900 Companhia de Bebidas das Americas Preference
Shares ADR 780,654 0.2121,200 Companhia de Transmissao de Energia Eletrica
Paulista Preference Shares 506,464 0.1427,000 EDP - Energias do Brasil 461,649 0.1253,100 Souza Cruz 503,247 0.13
3,192,794 0.85
SOUTH KOREA187,084 KT ADR 2,250,543 0.60
13,500 KT&G 730,796 0.20
2,981,339 0.80
SINGAPORE993,000 Ascendas India Trust 410,050 0.11215,000 Ascendas Real Estate Investment Trust 233,133 0.06425,061 Ascott Residence Trust 251,291 0.07803,055 Cambridge Industrial Trust 227,835 0.06418,000 CapitaCommercial Trust 261,397 0.07
1,039,000 Hutchison Port Holdings Trust 498,269 0.13398,000 Singapore Telecommunications 731,891 0.20
2,613,866 0.70
THAILAND227,800 Advanced Info Service (Foreign) Registered Shares 777,417 0.21
1,023,600 Bangkok Expressway (Foreign) 454,560 0.12906,300 Charoen Pokphand Foods (Foreign) 724,996 0.19
1,956,973 0.52
MALAYSIA426,600 Berjaya Sports Toto 454,092 0.12263,700 Lafarge Malayan Cement 447,957 0.13187,000 Malayan Banking 383,333 0.09426,600 Telekom Malaysia 514,742 0.14
1,800,124 0.48
ITALY95,669 ENI 1,521,615 0.41
1,521,615 0.41
NEW ZEALAND1,229,173 Telecom Corp. of New Zealand 1,505,232 0.40
1,505,232 0.40
TURKEY126,497 Arcelik 322,807 0.0931,300 Tupras Turkiye Petrol Rafinerileri 514,390 0.14
202,000 Turk Telekomunikasyon 584,764 0.15
1,421,961 0.38
SWEDEN173,174 Telefonaktiebolaget LM Ericsson - B Shares 1,355,099 0.36
1,355,099 0.36
RUSSIAN FEDERATION159,200 Mechel Preference Shares ADR 430,486 0.1241,300 Mobile Telesystems OJSC ADR 460,232 0.1219,500 Tatneft ADR 443,540 0.12
1,334,258 0.36
PANAMA49,092 Carnival 1,243,515 0.33
1,243,515 0.33
ISLE OF MAN28,350 AngloGold Ashanti Holdings Finance Preference
Shares 1,041,790 0.28
1,041,790 0.28
POLAND6,800 Powszechny Zaklad Ubezpieczen 474,594 0.12
128,200 Telekomunikacja Polska 495,819 0.14
970,413 0.26
FINLAND110,810 UPM-Kymmene 934,959 0.25
934,959 0.25
MEXICO11,000 Grupo Aeroportuario del Sureste ADR 473,117 0.13
106,200 Kimberly-Clark de Mexico - A Shares 437,980 0.11
911,097 0.24
PHILIPPINES19,400 Philippine Long Distance Telephone ADR 853,238 0.24
853,238 0.24
INDONESIA3,081,000 Perusahaan Gas Negara 827,792 0.22
827,792 0.22
CANADA26,644 First Capital Realty 349,452 0.10
21,115 RioCan Real Estate Investment Trust 421,827 0.11
771,279 0.21
NORWAY89,863 DnB NOR 677,385 0.18
677,385 0.18
CZECH REPUBLIC41,300 Telefonica Czech Republic 616,156 0.16
616,156 0.16
CAYMAN ISLANDS58,300 ASM Pacific Technology 503,829 0.13
503,829 0.13
KAZAKHSTAN38,900 KazMunaiGas Exploration Production
RegisteredShares GDR 445,774 0.12
445,774 0.12
CHILE2,900 Banco Santander Chile ADR 166,397 0.04
166,397 0.04
Total Shares 137,617,677 36.80
Bonds
UNITED STATES OF AMERICA140,000 ACCO Brands 15.03.15/10.625% 120,527 0.03250,000 ACCO Brands 15.08.15/7.625% 197,412 0.05145,000 Advanced Micro Devices 15.12.17/8.125% 115,487 0.03100,000 Advanced Micro Devices 01.08.20/7.750% 79,113 0.02
1,000,000 AES 15.10.17/8.000% 846,216 0.23138,000 AK Steel 15.05.20/7.625% 101,423 0.03
800,000 Alcatel-Lucent USA 15.03.29/6.450% 445,283 0.12275,000 Alliance One International 15.07.16/10.000% 192,260 0.0575,000 Alpha Natural Resources 01.06.19/6.000% 56,118 0.02
125,000 Alpha Natural Resources 01.06.21/6.250% 93,289 0.02500,000 American International Group 15.05.58/8.175%* 341,214 0.09250,000 AmeriGas Finance 20.08.19/6.250% 192,597 0.05
75,000 Arch Coal 01.10.20/7.250% 59,079 0.02400,000 Ashtead Capital 144A 15.08.16/9.000% 322,792 0.09250,000 Avaya 01.11.15/9.750% 174,300 0.05100,000 Ball 15.05.21/5.750% 80,510 0.02200,000 Belden 15.03.17/7.000% 154,655 0.04175,000 Bill Barrett 15.07.16/9.875% 148,973 0.0495,000 Bill Barrett 01.10.19/7.625% 76,663 0.02
200,000 Cablevision Systems 15.04.18/7.750% 163,716 0.04140,000 Cablevision Systems 15.04.20/8.000% 115,674 0.03200,000 Carriage Services 15.01.15/7.875% 156,003 0.04300,000 CB Richard Ellis Services 15.10.20/6.625% 238,049 0.06600,000 Cenveo 01.02.18/8.875% 405,608 0.11
70,000 CF Industries 01.05.18/6.875% 61,881 0.0235,000 CF Industries 01.05.20/7.125% 31,884 0.01
100,000 Chesapeake Energy 15.02.15/9.500% 88,270 0.02200,000 Chesapeake Energy 15.08.18/6.875% 165,633 0.04
112
JPMorgan Investment Funds - Global Income Fund
Schedule of Investments (Market Value Expressed in EUR) (continued)
As at 31 December 2011
Quantity/Nominal
Value
Name of Securities Maturity/Coupon
MarketValue
%of
NetAssets
Quantity/Nominal
Value
Name of Securities Maturity/Coupon
MarketValue
%of
NetAssets

125,000 Chesapeake Energy 15.02.21/6.125% 99,187 0.037,000 Chiquita Brands International 01.11.14/7.500% 5,480 0.00
150,000 Cincinnati Bell 15.03.18/8.750% 107,539 0.03792,000 Cincinnati Bell 15.10.20/8.375% 611,757 0.16189,000 Cinemark USA 15.06.19/8.625% 158,371 0.04
3,300,000 CIT Group 01.05.17/7.000% 2,548,631 0.681,390,000 Citigroup Funding 27.07.20/11.000% 964,075 0.26
784,000 Community Health Systems 15.07.15/8.875% 624,854 0.17307,000 Comstock Resources 15.10.17/8.375% 230,005 0.06
75,000 Concho Resources/Midland 15.01.21/7.000% 62,329 0.02265,000 Concho Resources/Midland 15.01.22/6.500% 213,850 0.0690,000 Constellation Brands 01.09.16/7.250% 76,528 0.02
100,000 Constellation Brands 15.05.17/7.250% 85,128 0.02125,000 Continental Resources 01.10.20/7.375% 105,447 0.03250,000 Corrections Corp. of Amercia 01.06.17/7.750% 209,930 0.06140,000 Covanta Holding 01.12.20/7.250% 113,766 0.03200,000 DaVita 01.11.18/6.375% 157,544 0.04
50,000 DaVita 01.11.20/6.625% 39,723 0.01100,000 Dean Foods 01.06.16/7.000% 76,461 0.02250,000 Denbury Resources 01.03.16/9.750% 213,301 0.06356,000 Denbury Resources 15.02.20/8.250% 307,168 0.08100,000 Developers Diversified Realty 01.09.20/7.875% 85,816 0.02200,000 DR Horton 15.01.16/5.625% 157,929 0.04
45,000 DR Horton 15.04.16/6.500% 36,097 0.01500,000 Dynegy Holdings 01.06.19/7.750% 246,905 0.07
54,000 Edison Mission Energy 15.05.17/7.000% 26,536 0.01600,000 Edison Mission Energy 15.05.19/7.200% 291,206 0.08125,000 El Paso 15.06.14/6.875% 105,253 0.0330,000 El Paso Pipeline Partners
Operating 01.04.20/6.500% 25,549 0.01450,000 Energy Future Intermediate
Holding 01.12.20/10.000% 367,599 0.1050,000 Fidelity National Information
Services 15.07.17/7.625% 41,890 0.01300,000 Fidelity National Information
Services 15.07.20/7.875% 250,761 0.07309,000 Ford Holdings 01.03.30/9.300% 293,628 0.08
15,000 Ford Motor 01.08.26/7.500% 12,331 0.00300,000 Ford Motor 16.07.31/7.450% 275,323 0.07150,000 Ford Motor 15.06.43/7.750% 116,714 0.03135,000 Ford Motor 15.02.47/9.980% 129,383 0.03100,000 Ford Motor Credit 15.12.16/8.000% 87,705 0.02750,000 Ford Motor Credit 15.08.17/6.625% 629,973 0.17
1,000,000 Ford Motor Credit 15.05.18/5.000% 773,768 0.21100,000 Ford Motor Credit 15.01.20/8.125% 91,084 0.02250,000 Forest City Enterprises 01.02.17/6.500% 181,041 0.05125,000 Forest Oil 15.06.19/7.250% 97,984 0.03100,000 Fresenius Medical Care US
Finance 144A 15.09.18/6.500% 81,083 0.0225,000 Frontier Communications 15.04.17/8.250% 19,674 0.0150,000 Frontier Communications 15.03.19/7.125% 37,942 0.01
350,000 Frontier Communications 15.04.20/8.500% 275,702 0.07150,000 FTI Consulting 01.10.16/7.750% 120,180 0.03500,000 Geo Group 15.10.17/7.750% 411,194 0.11
75,000 Glatfelter 01.05.16/7.125% 60,127 0.0240,000 Global Geophysical Services 01.05.17/10.500% 29,121 0.01
900,000 Goodyear Tire & Rubber 15.08.20/8.250% 754,643 0.20175,000 Graphic Packaging International 15.06.17/9.500% 147,962 0.04750,000 Hanesbrands 15.12.16/8.000% 631,235 0.1790,000 Hartford Financial Services
Group 15.06.38/8.125%* 69,161 0.02150,000 HCA 01.10.18/8.000% 122,058 0.03750,000 HCA 15.02.20/6.500% 603,068 0.16100,000 Health Management Associates 15.04.16/6.125% 80,120 0.02
33,000 Hexcel 01.02.15/6.750% 25,899 0.0150,000 Holly 15.06.17/9.875% 42,660 0.01
350,000 Host Hotels & Resorts 01.06.16/6.750% 276,721 0.07740,000 Huntsman International 30.06.16/5.500% 561,204 0.15726,000 International Lease Finance 15.12.20/8.250% 566,680 0.15
75,000 International Lease Finance 15.01.22/8.625% 58,646 0.02500,000 Iron Mountain 15.07.18/8.750% 402,527 0.11497,000 Iron Mountain 15.08.21/8.375% 410,641 0.11250,000 Jarden 01.05.17/7.500% 205,115 0.05725,000 Jarden 15.01.20/7.500% 592,042 0.16128,000 K Hovnanian Enterprises 15.10.16/10.625% 79,134 0.02105,000 Kemet 01.05.18/10.500% 85,946 0.02200,000 Key Energy Services 01.03.21/6.750% 154,077 0.04
94,000 Lender Processing Services 01.07.16/8.125% 71,935 0.02150,000 Lennar 01.06.17/12.250% 138,092 0.04235,000 Lennar 01.06.18/6.950% 177,420 0.05
72,000 LIN Television 15.05.13/6.500% 55,676 0.0177,000 LIN Television 15.05.13/6.500% 59,542 0.02
117,000 Mac-Gray 15.08.15/7.625% 92,727 0.02100,000 Mandalay Resort Group 15.07.13/7.625% 77,424 0.02210,000 MarkWest Energy Partners 01.11.20/6.750% 170,275 0.05140,000 MarkWest Energy Partners 15.06.22/6.250% 112,977 0.03
135,000 McClatchy 15.02.17/11.500% 101,142 0.03100,000 Media General 15.02.17/11.750% 73,957 0.02975,000 MetroPCS Wireless 01.09.18/7.875% 751,239 0.20325,000 MetroPCS Wireless 15.11.20/6.625% 234,414 0.06982,000 MGM Resorts International 01.06.16/7.500% 726,236 0.19658,000 MGM Resorts International 15.01.17/7.625% 485,370 0.13
75,000 Newfield Exploration 01.09.14/6.625% 58,501 0.02200,000 Newfield Exploration 01.02.20/6.875% 164,618 0.04185,000 Newfield Exploration 30.01.22/5.750% 153,923 0.04450,000 Nextel Communications 01.08.15/7.375% 316,409 0.08460,000 Omnicare 01.06.20/7.750% 382,285 0.10
50,000 Patriot Coal 30.04.18/8.250% 37,364 0.01281,000 Penn Virginia 15.06.16/10.375% 230,550 0.0640,000 Penn Virginia 15.04.19/7.250% 28,350 0.0175,000 Penn Virginia Resource Partners 15.04.18/8.250% 58,357 0.02
250,000 PetroHawk Energy 01.06.15/7.875% 206,078 0.06250,000 Petrohawk Energy 15.08.18/7.250% 217,634 0.06100,000 Pinnacle Entertainment 01.08.17/8.625% 81,854 0.02225,000 Pinnacle Entertainment 15.05.20/8.750% 170,304 0.0550,000 Pioneer Natural Resources 15.03.17/6.650% 42,745 0.0135,000 Pioneer Natural Resources 15.01.20/7.500% 31,713 0.0135,000 Plains Exploration & Production 01.04.20/7.625% 29,323 0.01
365,000 PolyOne 15.09.20/7.375% 290,330 0.08325,000 QEP Resources 01.03.21/6.875% 271,657 0.07650,000 Quiksilver 15.04.15/6.875% 467,576 0.13125,000 Qwest 15.06.15/7.625% 107,150 0.03
850,000 Qwest CommunicationsInternational 01.10.15/8.000% 700,804 0.19
354,000 RailAmerica 01.07.17/9.250% 299,307 0.08100,000 Range Resources 01.06.21/5.750% 83,202 0.02175,000 Regal Cinemas 15.07.19/8.625% 146,277 0.04
850,000 Rite Aid 12.06.16/9.750% 713,950 0.19750,000 Rite Aid 01.03.17/7.500% 580,679 0.16500,000 Rite Aid 15.06.17/9.500% 352,452 0.09
15,000 Rite Aid 15.10.19/10.250% 12,784 0.00162,000 RSC Equipment Rental 01.12.14/9.500% 128,859 0.03850,000 Scotts Miracle-Gro 15.01.18/7.250% 690,844 0.18
1,600,000 Sealy Mattress 15.06.14/8.250% 1,226,455 0.33280,000 Service Corp. International 01.04.15/6.750% 232,965 0.06470,000 Service Corp. International 01.04.16/6.750% 394,216 0.11
19,000 Service Corp. International 15.06.17/7.000% 15,955 0.0135,000 Service Corp. International 01.10.18/7.625% 30,132 0.0135,000 Service Corp. International 15.05.19/7.000% 28,514 0.01
200,000 Service Corp. International 15.11.21/8.000% 172,567 0.05175,000 Smithfield Foods 01.07.17/7.750% 148,468 0.04
1,075,000 Springleaf Finance 15.12.17/6.900% 592,677 0.16250,000 Sprint Capital 01.05.19/6.900% 158,491 0.04
3,000,000 Sprint Capital 15.03.32/8.750% 1,880,706 0.50230,000 Sprint Nextel 01.12.16/6.000% 147,917 0.04
20,000 Sprint Nextel 15.08.17/8.375% 13,886 0.00100,000 Standard Pacific 15.09.16/10.750% 81,179 0.02120,000 Standard Pacific 15.05.18/8.375% 88,055 0.02
1,430,000 Supervalu 01.05.16/8.000% 1,137,952 0.31154,000 Swift Energy 01.06.17/7.125% 118,640 0.03279,000 Swift Energy 15.01.20/8.875% 226,759 0.06200,000 Tenet Healthcare 01.02.15/9.250% 162,937 0.04
1,500,000 Tenet Healthcare 01.08.20/8.000% 1,161,357 0.3149,000 Triumph Group 15.11.17/8.000% 40,486 0.0135,000 Triumph Group 15.07.18/8.625% 29,660 0.01
100,000 Tyson Foods 01.04.16/6.850% 84,935 0.0240,000 Unit 15.05.21/6.625% 30,970 0.0115,000 United Rentals North America 15.06.16/10.875% 12,885 0.0085,000 United Rentals North America 15.12.19/9.250% 68,921 0.02
380,000 United States Steel 01.04.20/7.375% 287,220 0.08150,000 Vector Group 15.08.15/11.000% 120,180 0.03
3,485,000 VistaPrint 15.02.22/7.500% 2,758,628 0.74310,000 Wachovia Capital Trust III 31.12.49/5.570%* 199,713 0.05
45,502,471 12.17
BRAZIL2,385,000 Brazil (Republic of) 17.08.40/11.000% 2,435,482 0.65
2,435,482 0.65
ARGENTINA365,000 Argentina (Republic of) 12.09.13/7.000% 282,125 0.08
2,241,900 Argentina (Republic of) 02.06.17/8.750% 1,626,368 0.4326,346 Argentina (Republic of) 31.12.33/8.280% 14,905 0.00
1,923,398 0.51
GERMANY1,440,000 Deutsche Bank/London 19.07.27/10.250% 1,659,630 0.44
300,000 Unitymedia Hessen & Co. 144A 01.12.17/8.125% 245,561 0.07
1,905,191 0.51
113
JPMorgan Investment Funds - Global Income Fund
Schedule of Investments (Market Value Expressed in EUR) (continued)
As at 31 December 2011
Quantity/Nominal
Value
Name of Securities Maturity/Coupon
MarketValue
%of
NetAssets
Quantity/Nominal
Value
Name of Securities Maturity/Coupon
MarketValue
%of
NetAssets

NIGERIA2,330,000 Nigeria (Federal Republic of) 28.01.21/6.750% 1,886,438 0.50
1,886,438 0.50
COLOMBIA1,540,000 Colombia (Republic of) 25.02.20/11.750% 1,871,271 0.50
1,871,271 0.50
KAZAKHSTAN2,055,000 KazMunayGas National 23.01.15/11.750% 1,866,147 0.50
1,866,147 0.50
MEXICO750,000 Cemex SAB de 144A 30.09.15/5.579%* 435,509 0.12
1,410,000 Mexico (United Mexican States) 12.10.10/5.750% 1,156,997 0.31
1,592,506 0.43
VENEZUELA2,385,000 Venezuela (Republic of) 05.08.31/11.950% 1,508,436 0.40
1,508,436 0.40
DOMINICAN REPUBLIC1,411,397 Dominican Republic 23.01.18/9.040% 1,191,840 0.32295,104 Dominican Republic 144A 23.01.18/9.040% 250,078 0.07
1,441,918 0.39
RUSSIAN FEDERATION1,080,000 Russian (Republic of) 24.06.28/12.750% 1,425,537 0.38
1,425,537 0.38
EL SALVADOR1,650,000 El Salvador (Republic of) 24.01.23/7.750% 1,392,048 0.37
1,392,048 0.37
PERU1,390,000 Peru (Republic of) 06.02.15/9.875% 1,329,043 0.36
1,329,043 0.36
SRI LANKA1,650,000 Sri Lanka (Republic of) 22.01.15/7.400% 1,327,957 0.36
1,327,957 0.36
PHILIPPINES1,090,000 Philippines (Republic of) 16.03.25/10.625% 1,325,823 0.35
1,325,823 0.35
INTERNATIONAL AGENCIES1,600,000 Eurasian Development Bank 29.09.14/7.375% 1,295,790 0.35
1,295,790 0.35
LUXEMBOURG250,000 MagnaChip Semiconductor
Finance 15.04.18/10.500% 201,263 0.051,235,000 RSHB Capital for OJSC Russian
Agricultural Bank 11.06.14/9.000% 1,029,615 0.28
1,230,878 0.33
UNITED ARAB EMIRATES1,300,000 Dubai Electricity & Water
Authority 22.04.15/8.500% 1,087,667 0.29
1,087,667 0.29
URUGUAY605,000 Uruguay (Republic of) 21.03.36/7.625% 647,915 0.17
647,915 0.17
IRELAND400,000 Elan Finance 15.10.16/8.750% 329,918 0.09450,000 VIP Finance Ireland 144A 02.02.21/7.748% 298,183 0.08
628,101 0.17
BERMUDA300,000 Aircastle 01.08.18/9.750% 243,250 0.06200,000 Seadrill 05.10.15/6.500% 147,115 0.04
390,365 0.10
JAPAN200,000 eAccess 144A 01.04.18/8.250% 147,144 0.04
147,144 0.04
Total Bonds 74,161,526 19.83
Convertible Bonds
UNITED KINGDOM1,300,000 Cable & Wireless Worldwide 24.11.14/5.750% 1,304,602 0.35
200,000 SVG Capital 05.06.16/8.250% 240,066 0.071,100,000 TUI Travel 05.10.14/6.000% 1,153,738 0.311,500,000 Vedanta Resources Jersey II 30.03.17/4.000% 988,529 0.26
3,686,935 0.99
INDIA1,600,000 Jaiprakash Power Ventures 13.02.15/5.000% 790,805 0.21
180,000 Suzlon Energy 12.06.12/0.000% 167,195 0.05900,000 Tata Steel 21.11.14/4.500% 615,807 0.16
1,573,807 0.42
SOUTH KOREA1,800,000 STX Pan Ocean 20.11.14/4.500% 1,248,026 0.33
1,248,026 0.33
AUSTRIA1,250,000 Steinhoff Finance Holding 31.03.18/4.500% 1,016,563 0.27
1,016,563 0.27
CAYMAN ISLANDS1,100,000 Agile Property Holdings 28.04.16/4.000% 668,195 0.18
668,195 0.18
UNITED ARAB EMIRATES500,000 Aabar Investments 27.05.16/4.000% 438,123 0.12
438,123 0.12
SPAIN350,000 Abengoa 03.02.17/4.500% 301,880 0.08
301,880 0.08
BERMUDA700,000 Petroplus Finance 16.10.15/4.000% 215,366 0.06
215,366 0.06
AUSTRALIA267,000 Western Areas 02.07.14/6.375% 203,500 0.05
203,500 0.05
NETHERLANDS200,000 Q-Cells International Finance 26.05.14/5.750% 43,776 0.01
43,776 0.01
Total Convertible Bonds 9,396,171 2.51
Total Transferable Securities Admitted to anOfficial Exchange Listing
221,175,374 59.14
Transferable Securities Dealt in on Another Regulated Market
Bonds
UNITED STATES OF AMERICA500,000 AbitibiBowater 144A 15.10.18/10.250% 426,601 0.11750,000 Accellent 01.02.17/8.375% 569,123 0.15600,000 ACE Cash Express 144A 01.02.19/11.000% 425,253 0.11
50,000 Aleris International 15.02.18/7.625% 37,604 0.01150,000 Allbritton Communications 15.05.18/8.000% 115,269 0.03
2,200,000 Ally Financial 01.12.14/6.750% 1,705,621 0.461,550,000 Ally Financial 15.09.20/7.500% 1,203,652 0.32
435,000 Ally Financial 01.11.31/8.000% 327,261 0.09900,000 Ally Financial 01.12.17/6.250% 656,372 0.18165,000 Alta Mesa Holdings 15.10.18/9.625% 123,936 0.03650,000 AMC Entertainment 01.06.19/8.750% 520,781 0.14400,000 AMC Entertainment 01.12.20/9.750% 294,288 0.08105,000 American Achievement 144A 15.04.16/10.875% 62,690 0.02248,350 American Airlines 2011-1 Class B
Pass Through Trust 31.01.18/7.000% 170,279 0.05255,000 American Airlines 2011-2 Class A
Pass Through Trust 15.10.21/8.625% 200,377 0.05100,000 American International Group 15.09.16/4.875% 73,756 0.02
114
JPMorgan Investment Funds - Global Income Fund
Schedule of Investments (Market Value Expressed in EUR) (continued)
As at 31 December 2011
Quantity/Nominal
Value
Name of Securities Maturity/Coupon
MarketValue
%of
NetAssets
Quantity/Nominal
Value
Name of Securities Maturity/Coupon
MarketValue
%of
NetAssets

160,000 American StandardAmericas 144A 15.01.16/10.750% 73,957 0.02
340,000 Ameristar Casinos 15.04.21/7.500% 269,789 0.07675,000 Amkor Technology 01.05.18/7.375% 531,659 0.1480,000 Amkor Technology 01.06.21/6.625% 59,320 0.02
609,000 Appleton Papers 144A 15.06.15/10.500% 465,060 0.12250,000 Arch Coal 144A 15.06.19/7.000% 197,893 0.05
1,125,000 Arch Coal 144A 15.06.21/7.250% 892,685 0.241,465,000 Argent Securities 2004-W7 M2 25.05.34/0.894%* 897,907 0.24
500,000 Armored Autogroup 144A 01.11.18/9.250% 299,488 0.08329,308 Asset Backed Funding
Certificates 2004-OPT3 M1 25.09.33/1.044%* 198,573 0.05184,457 Asset Backed Funding
Certificates 2005-OPT1 A2C 25.07.35/0.654%* 133,241 0.04841,168 Asset Backed Securities Corp
Home Equity 2001-HE3 M1 15.11.31/1.178%* 483,894 0.1350,000 Atkore International 01.01.18/9.875% 37,171 0.0175,000 Audatex North America 144A 15.06.18/6.750% 58,646 0.02
500,000 Avaya 01.11.15/10.125%* 348,600 0.091,080,000 Avaya 144A 01.04.19/7.000% 811,217 0.22
150,000 Avis Budget Car Rental 15.05.16/7.750% 117,002 0.031,175,000 Avis Budget Car Rental 15.03.18/9.625% 941,412 0.25350,000 Avis Budget Car Rental 15.01.19/8.250% 268,427 0.07113,000 Aviv Healthcare Capital 15.02.19/7.750% 85,748 0.02160,280 Banc of America Alternative
Loan Trust 2005-6 7A1 25.07.20/5.500% 115,538 0.0389,212 Banc of America Alternative
Loan Trust 2004-12 2CB1 25.01.35/6.000% 71,481 0.02725,715 Banc of America Alternative
Loan Trust 2005-12 5A1 25.01.21/5.250% 527,408 0.14244,512 Banc of America Alternative
Loan Trust 2005-4 3A1 25.05.20/5.500% 179,765 0.0598,907 Banc of America Alternative
Loan Trust 2006-4 2A1 25.05.21/6.000% 71,845 0.02490,094 Banc of America Alternative
Loan Trust 2006-5 CB7 25.06.46/6.000% 256,999 0.071,114,172 Banc of America
Funding 2007-4 8A1 25.11.34/5.500% 843,562 0.23453,779 Banc of America Large Loan
2010-HLTN HLTN 15.11.15/2.028%* 316,572 0.08580,563 Banc of America Mortgage
Securities 2007-3 1A1 25.09.37/6.000% 386,764 0.10541,000 Bank of America 31.12.49/8.000%* 365,617 0.10700,000 Bank of America 31.12.49/8.125%* 475,167 0.13120,000 B-Corp Merger Sub 144A 01.06.19/8.250% 88,286 0.02100,000 BE Aerospace 01.10.20/6.875% 83,568 0.0220,000 Berry Plastics 15.11.15/8.250% 16,448 0.00112,000 Berry Plastics 15.05.18/9.500% 86,930 0.02
100,000 Berry Plastics 15.01.21/9.750% 77,424 0.021,710,000 Biomet 15.10.17/10.375%* 1,435,923 0.38
125,000 Block Communications 144A 15.12.15/8.250% 98,585 0.03250,000 Boise Paper Holdings 01.04.20/8.000% 204,152 0.05650,000 BreitBurn Energy Partners /
BreitBurn Finance 15.10.20/8.625% 525,789 0.1435,000 Bresnan Broadband
Holdings 144A 15.12.18/8.000% 28,042 0.0126,000 Brigham Exploration 01.10.18/8.750% 24,637 0.01
275,000 Brightstar 144A 01.12.16/9.500% 217,153 0.061,000,000 Brown Shoe 15.05.19/7.125% 733,793 0.20
245,000 Building Materialsof America 144A 01.05.21/6.750% 196,766 0.05
928,000 Bumble Bee Acquisition 144A 15.12.17/9.000% 729,217 0.20100,000 Burger King 15.10.18/9.875% 84,195 0.02
3,035,000 Caesars EntertainmentOperating 01.06.17/11.250% 2,493,023 0.67
500,000 Calpine 144A 15.02.21/7.500% 414,083 0.1190,000 Calpine 144A 15.01.23/7.875% 74,882 0.02
300,000 Calpine ConstructionFinance 144A 01.06.16/8.000% 250,761 0.07
50,000 Calumet Finance 144A 01.05.19/9.375% 37,556 0.0190,000 Calumet Specialty Products
Partners/Calumet Finance 144A 01.05.19/9.375% 67,601 0.02150,000 Capella Healthcare 01.07.17/9.250% 118,302 0.03135,000 Capital One Financial 15.08.39/10.250% 108,099 0.03650,000 Case New Holland 01.12.17/7.875% 561,467 0.15145,000 Casella Waste Systems 15.07.14/11.000% 121,760 0.0375,000 Casella Waste Systems 15.02.19/7.750% 56,768 0.02215,768 Catalent Pharma Solutions 15.04.15/9.500%* 171,627 0.05
225,000 CCH II Capital 30.11.16/13.500% 200,854 0.05647,000 CCO Holdings 30.10.17/7.250% 527,723 0.14
1,550,000 CCO Holdings 30.04.18/7.875% 1,277,686 0.34315,000 CCO Holdings 30.04.20/8.125% 266,939 0.0755,000 CCO Holdings 01.06.20/7.375% 44,755 0.01
350,000 CCO Holdings 30.04.21/6.500% 274,354 0.0750,000 Celanese US Holdings 15.10.18/6.625% 41,023 0.01
850,000 Central Garden and Pet 01.03.18/8.250% 645,006 0.17
774,000 Cequel CommunicationsHoldings I and CequelCapital 144A 15.11.17/8.625% 627,584 0.17
801,547 Chase Funding Mortgage LoanAsset-Backed Certificates2003-4 1A5 25.05.33/5.416%* 595,011 0.16
562,864 Chase Funding Mortgage LoanAsset-Backed Certificates2003-5 1M2 25.09.32/5.641%* 231,527 0.06
360,000 Chemtura 01.09.18/7.875% 287,046 0.08140,000 Chesapeake Oilfield Operating
LLC/Chesapeake OilfieldFinance 144A 15.11.19/6.625% 112,708 0.03
200,000 Chrysler Group 144A 15.06.19/8.000% 142,136 0.041,400,000 Chrysler Group 144A 15.06.21/8.250% 992,258 0.27
250,000 Chukchansi EconomicDevelopment Authority 144A 15.11.13/8.000% 125,188 0.03
50,000 Cinemark USA 15.06.21/7.375% 39,579 0.01885,000 CIT Group 144A 02.05.17/7.000% 681,509 0.18320,000 CIT Group 144A 01.04.18/6.625% 257,617 0.07
95,000 Citgo Petroleum 144A 01.07.17/11.500% 81,603 0.02250,000 Citigroup Capital XXI 21.12.57/8.300%* 194,849 0.05
1,242,725 Citigroup Mortgage Loan Trust2005-9 2A2 25.11.35/5.500% 902,250 0.24
416,184 Citigroup Mortgage Loan Trust2005-OPT1 M4 25.02.35/0.994%* 163,734 0.04
154,790 Citigroup Mortgage Loan Trust2005-WF2 AF4 25.08.35/4.964%* 113,671 0.03
574,101 Citigroup Mortgage Loan Trust2005-WF2 AF7 25.08.35/5.249%* 385,544 0.10
1,001,032 Citigroup Mortgage Loan Trust2007-WFH2 A2 25.03.37/0.444%* 710,799 0.19
63,339 Citimortgage Alternative LoanTrust 2006-A1 2A1 25.03.21/5.250% 47,937 0.01
100,000 CityCenter Finance 144A 15.01.16/7.625% 79,350 0.02475,012 CityCenter Finance 144A 15.01.17/10.750%* 378,751 0.1048,959 CKE Holdings 144A 14.03.16/10.500%* 36,209 0.01
235,000 CKE Restaurants 15.07.18/11.375% 198,240 0.051,250,000 Claire’s Stores 15.03.19/8.875% 736,682 0.20
615,000 Clear Channel Communications 01.03.21/9.000% 401,535 0.11100,000 Clear Channel Worldwide
Holdings 15.12.17/9.250% 83,202 0.022,550,000 Clear Channel Worldwide
Holdings 15.12.17/9.250% 2,131,466 0.57336,000 Clearwire Finance 144A 01.12.15/12.000% 247,202 0.07
85,000 Cloud Peak Energy Resources 15.12.17/8.250% 70,067 0.02230,000 CNG Holdings 144A 15.02.15/12.250% 183,390 0.05
75,000 CNH Capital 144A 01.11.16/6.250% 59,801 0.02215,000 CNL Lifestyle Properties 15.04.19/7.250% 154,039 0.04100,000 CNO Financial Group 144A 15.01.18/9.000% 81,468 0.0263,000 Colt Defense 144A 15.11.17/8.750% 33,731 0.0190,000 Columbus McKinnon 01.02.19/7.875% 72,368 0.02
249,000 Commercial Barge Line 15.07.17/12.500% 207,172 0.06120,000 Community Choice
Financial 144A 01.05.19/10.750% 91,753 0.02100,000 Consol Energy 01.04.17/8.000% 84,743 0.02135,000 Consol Energy 01.04.20/8.250% 115,182 0.0335,000 Consol Energy 144A 01.03.21/6.375% 27,166 0.0128,233 Continental Airlines 2003-ERJ1 02.07.18/7.875% 21,206 0.0179,732 Continental Airlines 2004-ERJ1 01.09.19/9.558% 63,574 0.02
118,555 Continental Airlines 2005-ERJ1 01.04.21/9.798% 94,530 0.03174,169 Continental Airlines
2006-ERJ1 144A 01.11.19/9.318% 135,520 0.0425,000 Continental Resources 01.04.21/7.125% 20,945 0.01
463,656 Countrywide Alternative LoanTrust 2004-28CB 2A4 25.01.35/5.750% 345,742 0.09
59,608 Countrywide Alternative LoanTrust 2005-28CB 1A5 25.08.35/5.500% 45,115 0.01
228,135 Countrywide Alternative LoanTrust 2005-50CB 4A1 25.11.20/5.000% 151,480 0.04
119,526 Countrywide Alternative LoanTrust 2005-70CB A5 25.12.35/5.500% 73,162 0.02
505,373 Countrywide Alternative LoanTrust 2005-J11 5A1 25.11.20/5.500% 343,833 0.09
41,125 Countrywide Alternative LoanTrust 2005-J6 2A1 25.07.25/5.500% 29,436 0.01
589,357 Countrywide Alternative LoanTrust 2007-25 2A1 25.11.22/6.000% 417,425 0.11
274,083 Countrywide Asset - BackedCertificates 2003-BC1 A1 25.03.33/1.094%* 165,764 0.04
676,586 Countrywide Asset-BackedCertificates 2002-3 M1 25.03.32/1.419%* 404,148 0.11
1,044,293 Countrywide Asset-BackedCertificates 2004-1 M2 25.03.34/1.119%* 690,326 0.18
357,539 Countrywide Home LoanMortgage Pass Through Trust2005-20 A7 25.12.27/5.250% 245,409 0.07
115
JPMorgan Investment Funds - Global Income Fund
Schedule of Investments (Market Value Expressed in EUR) (continued)
As at 31 December 2011
Quantity/Nominal
Value
Name of Securities Maturity/Coupon
MarketValue
%of
NetAssets
Quantity/Nominal
Value
Name of Securities Maturity/Coupon
MarketValue
%of
NetAssets

113,421 Countrywide Home LoanMortgage Pass Through Trust2006-15 A1 25.10.36/6.250% 71,973 0.02
33,000 CPM Holdings 01.09.14/10.625% 27,202 0.012,256,150 Credit Suisse First Boston
Mortgage Securities2005-10 11A1 25.11.20/5.500% 1,648,960 0.44
836,018 Credit-Based Asset Servicing andSecuritization 2005-CB8 AF2 25.12.35/5.303%* 583,383 0.16
15,000 Cricket Communications 15.05.16/7.750% 11,918 0.00450,000 Cricket Communications 15.10.20/7.750% 304,569 0.08500,000 Crosstex Energy 15.02.18/8.875% 421,787 0.11
78,000 CSC Holdings 15.02.19/8.625% 69,626 0.021,180,000 Del Monte 15.02.19/7.625% 872,694 0.23
159,000 Delta Air Lines 144A 15.09.14/9.500% 126,779 0.03175,387 Delta Air Lines 2007-1 C 10.08.14/8.954% 134,778 0.04
350,000 Deluxe 144A 15.03.19/7.000% 265,591 0.07115,000 DineEquity 30.10.18/9.500% 95,571 0.03
3,493,000 DISH DBS 01.09.19/7.875% 3,058,841 0.82360,000 DISH DBS 01.06.21/6.750% 300,220 0.08250,000 DJO Finance 15.11.14/10.875% 181,041 0.05350,000 DJO Finance 15.04.18/7.750% 208,293 0.06125,000 Downstream Development
Authority of the Quapaw Tribe ofOklahoma 144A 01.07.19/10.500% 91,724 0.02
90,000 DPL 144A 15.10.16/6.500% 73,322 0.0275,000 DPL 144A 15.10.21/7.250% 62,112 0.02
162,000 DuPont Fabros Technology 15.12.17/8.500% 134,163 0.04300,000 Dynegy Roseton/Danskammer
Pass Through Trust Series B 08.11.16/7.670% 140,981 0.04500,000 Eastman Kodak 144A 01.03.18/9.750% 294,673 0.08850,000 Easton-Bell Sports 01.12.16/9.750% 715,400 0.19500,000 EH Holding 144A 15.06.19/6.500% 401,564 0.11
90,000 Emergency Medical Services 01.06.19/8.125% 69,421 0.02100,000 Endo Pharmaceuticals Holdings 15.07.19/7.000% 82,239 0.02130,000 Endo Pharmaceuticals Holdings 15.01.22/7.250% 107,036 0.03125,000 Energy XXI Gulf Coast 15.12.17/9.250% 104,965 0.0335,000 Equinix 01.03.18/8.125% 29,727 0.01
180,000 Equinix 15.07.21/7.000% 146,296 0.04499,921 Equity One ABS 2003-2 M1 25.09.33/5.050%* 315,759 0.08215,000 Ferrellgas Finance 01.05.21/6.500% 146,585 0.04
59,932 FGI Holding 01.10.15/11.250%* 46,055 0.0145,000 Fidelity National Information
Services 15.07.17/7.625% 37,527 0.01254,000 First Data 24.09.15/9.875% 184,916 0.05700,000 First Data 144A 15.08.20/8.875% 538,596 0.14
16,000 First Data 144A 15.01.21/8.250% 10,970 0.001,123,000 First Data 144A 15.01.21/12.625% 754,838 0.201,950,000 First Data 144A 15.01.22/8.750%* 1,299,449 0.35
963,600 First Franklin Mortgage LoanAsset Backed Certificates2005-FF11 A2D 25.11.35/0.634%* 615,249 0.16
204,874 First Horizon AlternativeMortgage Securities2005-FA1 1A4 25.03.35/5.500% 137,171 0.04
981,777 First Horizon AlternativeMortgage Securities2006-FA6 3A1 25.11.21/5.750% 696,902 0.19
515,581 First Horizon Asset Securities2005-6 1A1 25.11.35/5.500% 402,014 0.11
108,669 First Horizon Asset Securities2005-8 2A1 25.02.21/5.250% 82,979 0.02
138,290 First Horizon Asset Securities2006-3 1A13 25.11.36/6.250% 97,353 0.03
70,000 First Industrial 01.06.14/6.420% 53,898 0.0150,000 First Wind Capital 144A 01.06.18/10.250% 38,038 0.0151,000 Fisher Communications 15.09.14/8.625% 40,076 0.0175,000 Foresight Energy 144A 15.08.17/9.625% 59,512 0.02
280,000 Freescale Semiconductor 01.02.20/8.050% 203,844 0.0513,000 Freescale Semiconductor 01.08.20/10.750% 10,491 0.00
1,088,000 Freescale Semiconductor 144A 15.03.18/10.125% 917,808 0.25625,000 Freescale Semiconductor 144A 15.04.18/9.250% 517,001 0.1420,000 Frontier Communications 15.04.22/8.750% 15,331 0.0025,000 Gannett 01.09.15/6.375% 19,549 0.0190,000 Gannett 15.11.17/9.375% 75,575 0.0275,000 Gannett 01.09.18/7.125% 57,201 0.02
500,000 GCI 15.11.19/8.625% 410,712 0.1150,000 Genesis Energy 15.12.18/7.875% 38,519 0.01
250,000 Geo Group 15.02.21/6.625% 195,486 0.05630,000 Griffon 01.04.18/7.125% 482,917 0.13
30,000 Grifols 01.02.18/8.250% 24,412 0.01209,722 GSAMP Trust 2005-SEA2 A1 25.01.45/0.664%* 142,717 0.04
1,068,456 GSR Mortgage Loan Trust2006-9F 8A1 25.08.21/5.500% 763,586 0.20
200,000 Gymboree 01.12.18/9.125% 135,588 0.04180,000 Harland Clarke Holdings 15.05.15/6.000%* 91,522 0.0238,000 Harland Clarke Holdings 15.05.15/9.500% 21,371 0.01
500,000 HCA Holdings 15.05.21/7.750% 393,860 0.11
90,000 Health ManagementAssociates 144A 15.01.20/7.375% 72,195 0.02
150,000 Hertz 15.10.18/7.500% 121,336 0.031,105,000 Hertz 30.11.12/6.750% 857,662 0.23
150,000 Hertz 15.01.21/7.375% 118,014 0.03425,000 Hilcorp Finance 144A 15.02.20/8.000% 350,333 0.0950,000 Holly Energy Finance 15.03.18/8.250% 40,445 0.0125,000 Host Hotels & Resorts 144A 01.10.21/6.000% 19,789 0.01
237,000 HUB International Holdings 144A 15.06.15/10.250% 181,669 0.0574,000 Huntington Ingalls
Industries 144A 15.03.18/6.875% 56,296 0.0240,000 Huntington Ingalls
Industries 144A 15.03.21/7.125% 30,430 0.01350,000 Huntsman International 15.03.20/8.625% 287,162 0.08357,000 IASIS Healthcare 15.05.19/8.375% 240,993 0.06195,000 iGate 144A 01.05.16/9.000% 155,859 0.04700,000 ILFC E-Capital Trust II 144A 21.12.65/6.250%* 366,704 0.10
75,000 Inergy & Inergy Finance 01.08.21/6.875% 58,357 0.02150,000 Ingles Markets 15.05.17/8.875% 125,380 0.03100,000 Insight Communications 144A 15.07.18/9.375% 88,402 0.02146,000 Intcomex 15.12.14/13.250% 107,134 0.03480,000 Interactive Data 01.08.18/10.250% 406,764 0.11900,000 International Lease Finance 15.09.15/8.625% 705,350 0.19
2,280,000 International Lease Finance 15.03.17/8.750% 1,813,567 0.4950,000 International Wire Group 144A 15.04.15/9.750% 38,905 0.01
150,000 inVentiv Health 15.08.18/10.000% 104,580 0.03155,000 Isle of Capri Casinos 01.03.14/7.000% 112,245 0.03350,000 Isle of Capri Casinos 15.03.19/7.750% 247,053 0.07400,000 J Crew Group 01.03.19/8.125% 295,828 0.08
35,000 James River Coal 01.04.19/7.875% 20,492 0.017,000 JBS USA 01.05.14/11.625% 6,127 0.00
195,000 JBS USA Finance 144A 01.06.21/7.250% 140,461 0.0485,000 JM Huber 144A 01.11.19/9.875% 67,284 0.02115,000 JMC Steel Group 144A 15.03.18/8.250% 86,047 0.02286,593 JP Morgan Mortgage Trust
2006-S3 2A4 25.08.21/5.500% 217,927 0.06401,406 JP Morgan Mortgage
Trust2005-S2 2A9 25.09.35/5.500% 306,742 0.0885,000 Kennedy-Wilson 144A 01.04.19/8.750% 64,173 0.02
750,000 Kinetic Concepts 144A 01.11.18/10.500% 567,678 0.15250,000 Knowledge Learning 144A 01.02.15/7.750% 180,559 0.0545,000 Landry’s Holdings 144A 01.06.14/11.500% 34,147 0.01
250,000 Landry’s Restaurants 01.12.15/11.625% 203,671 0.0545,000 Lawson Software 144A 15.07.18/11.500% 33,801 0.01
525,000 Level 3 Escrow 144A 01.07.19/8.125% 401,419 0.1196,000 Level 3 Financing 01.11.14/9.250% 75,991 0.02
135,000 Level 3 Financing 01.02.18/10.000% 110,762 0.03555,000 Level 3 Financing 01.04.19/9.375% 448,408 0.12720,000 Libbey Glass 15.02.15/10.000% 596,279 0.16500,000 Liberty Mutual Group 144A 15.03.37/7.800% 345,711 0.09492,000 Liberty Mutual Group 144A 15.06.58/10.750%* 479,473 0.13
75,000 Liberty Tire Recycling 144A 01.10.16/11.000% 57,923 0.0250,000 LifePoint Hospitals 01.10.20/6.625% 40,156 0.01
321,840 Long Beach Mortgage Loan Trust2004-3 M2 25.07.34/1.194%* 198,845 0.05
550,000 Lyondell Chemical 01.05.18/11.000% 463,219 0.12175,000 M/I Homes 15.11.18/8.625% 119,651 0.03
1,200,000 Marina District Finance 15.08.18/9.875% 827,256 0.22432,853 MASTR Alternative Loans Trust
2005-3 1A1 25.04.35/5.500% 311,099 0.08232,817 MASTR Alternative Loans Trust
2005-5 3A1 25.08.35/5.750% 146,256 0.04900,453 MASTR Alternative Loans Trust
2006-3 3A1 25.06.21/5.500% 615,249 0.16160,000 McJunkin Red Man 15.12.16/9.500% 125,111 0.03263,000 Mediacom 15.08.19/9.125% 216,035 0.06662,000 MEMC Electronic Materials 01.04.19/7.750% 372,297 0.10100,000 MGM Resorts International 01.11.16/10.000% 80,987 0.02
1,850,000 MGM Resorts International 15.03.20/9.000% 1,585,922 0.42150,000 Michael Foods 15.07.18/9.750% 122,347 0.03622,000 Michaels Stores 01.11.16/11.375% 510,279 0.14
1,050,000 Michaels Stores 01.11.18/7.750% 821,039 0.22367,180 Midwest Generation 02.01.16/8.560% 285,699 0.0860,000 Mobile Mini 01.12.20/7.875% 46,685 0.01
205,805 Morgan Stanley ABS Capital I2004-NC7 M3 25.07.34/0.944%* 132,614 0.04
987,549 Morgan Stanley ABS Capital I2005-HE1 M3 25.12.34/0.814%* 551,764 0.15
460,821 Morgan Stanley ABS Capital I2005-NC1 M3 25.01.35/0.804%* 266,146 0.07
711,914 Morgan Stanley Mortgage LoanTrust 2004-9 1A 25.11.34/5.877%* 533,999 0.14
610,000 Multiplan 144A 01.09.18/9.875% 490,495 0.13100,000 Murray Energy 144A 15.10.15/10.250% 76,846 0.02550,000 Mylan 144A 15.07.17/7.625% 464,495 0.12300,000 Mylan 144A 15.07.20/7.875% 256,250 0.07
50,000 NAI EntertainmentHoldings 144A 15.12.17/8.250% 40,927 0.01
116
JPMorgan Investment Funds - Global Income Fund
Schedule of Investments (Market Value Expressed in EUR) (continued)
As at 31 December 2011
Quantity/Nominal
Value
Name of Securities Maturity/Coupon
MarketValue
%of
NetAssets
Quantity/Nominal
Value
Name of Securities Maturity/Coupon
MarketValue
%of
NetAssets

25,000 NB Capital Trust II 15.12.26/7.830% 17,213 0.0050,000 NB Capital Trust IV 15.04.27/8.250% 35,727 0.01
137,000 Nebraska Book 15.03.12/8.625% 35,357 0.01541,700 New Century Home Equity Loan
Trust 2004-2 M2 25.08.34/0.914%* 344,581 0.091,152,077 New Century Home Equity Loan
Trust 2005-A A6 25.08.35/4.954%* 840,359 0.22850,000 NewPage 31.12.14/11.375% 487,029 0.13700,000 Nexstar Broadcasting 15.04.17/8.875% 554,100 0.15100,000 NFR Energy 144A 15.02.17/9.750% 69,720 0.0260,000 NFR Energy 144A 15.02.17/9.750% 41,370 0.0150,000 Nielsen Finance 15.10.18/7.750% 41,793 0.0150,000 NII Capital 15.08.16/10.000% 44,008 0.01
185,000 NII Capital 15.12.19/8.875% 150,716 0.0460,000 NII Capital 01.04.21/7.625% 46,108 0.01351,154 Noranda Aluminium Acquisition 15.05.15/4.659%* 251,588 0.07
110,000 Nortek 144A 15.04.21/8.500% 72,031 0.02160,323 Northwest Airlines 2007-1 A 01.11.19/7.027% 125,821 0.0360,126 Northwest Airlines 2007-1 B 01.11.17/8.028% 45,162 0.01
950,000 NRG Energy 15.01.18/7.625% 735,526 0.2090,000 NRG Energy 144A 15.05.19/7.625% 68,295 0.02
100,000 NRG Energy 144A 15.05.21/7.875% 75,113 0.0280,000 Number Merger Sub 144A 15.12.19/11.000% 62,555 0.02
345,000 Oil States International 01.06.19/6.500% 273,092 0.07215,000 Omnova Solutions 01.11.18/7.875% 144,101 0.0485,000 OnCure Holdings 15.05.17/11.750% 52,059 0.01
125,000 Oppenheimer Holdings 15.04.18/8.750% 90,039 0.02670,000 Option One Mortgage Loan Trust
2004-3 M2 25.11.34/0.864%* 405,754 0.11820,000 PAETEC Holding 30.06.17/8.875% 688,571 0.18500,000 PAETEC Holding 01.12.18/9.875% 421,787 0.11
65,000 Park Place Securities2005-WHQ3 M1 25.06.35/0.714%* 44,070 0.01
155,000 Peabody Energy 144A 15.11.18/6.000% 121,798 0.03630,000 Peabody Energy 144A 15.11.21/6.250% 502,330 0.13250,000 Peninsula Gaming 15.08.17/10.750% 202,708 0.05
2,753,572 People’s Choice Home LoanSecurities Trust 2004-2 M3 25.10.34/2.019%* 1,226,135 0.33
255,000 Petrohawk Energy 01.06.19/6.250% 217,076 0.0665,000 PHI 15.10.18/8.625% 50,325 0.01
120,000 Pilgrim’s Pride 15.12.18/7.875% 87,362 0.02180,000 Pioneer Drilling 15.03.18/9.875% 145,603 0.04
55,000 Pioneer Drilling 144A 15.03.18/9.875% 44,490 0.01750,000 Polymer Group 144A 01.02.19/7.750% 600,901 0.16
75,000 Quality Distribution 01.11.18/9.875% 59,801 0.02110,000 Qwest Communications
International 01.04.18/7.125% 87,750 0.0290,000 Radiation Therapy Services 15.04.17/9.875% 52,174 0.01
350,000 RadioShack 15.05.19/6.750% 233,909 0.0660,000 Rain CII Carbon 144A 01.12.18/8.000% 46,570 0.01
900,000 RBS Global/Rexnord 01.05.18/8.500% 736,682 0.2045,000 Real Mex Restaurants 01.01.13/14.000% 19,934 0.01
190,000 Regency Energy Finance 15.07.21/6.500% 152,960 0.04571,486 Renaissance Home Equity Loan
Trust 2003-3 M1 25.12.33/1.024%* 293,621 0.08581,783 Renaissance Home Equity Loan
Trust 2003-4 M2F 25.03.34/5.744%* 297,778 0.08856,910 Renaissance Home Equity Loan
Trust 2005-4 A3 25.02.36/5.565%* 575,738 0.151,221,535 Residential Accredit Loans
2006-QS4 A2 25.04.36/6.000% 561,120 0.15891,775 Residential Asset Mortgage
Products 2002-RS2 AI5 25.03.32/6.030%* 617,068 0.17175,259 Residential Asset Mortgage
Products 2004-RS11 M1 25.11.34/0.914%* 123,636 0.03279,436 Residential Asset Securitization
Trust 2004-A6 A1 25.08.19/5.000% 215,243 0.061,839,594 Residential Asset Securitization
Trust 2005-A8CB A11 25.07.35/6.000% 1,191,752 0.32155,146 Residential Funding Mortgage
Securities I 2006-S12 2A2 25.12.36/6.000% 109,773 0.03100,000 Reynolds Group Issuer 144A 15.10.16/8.750% 81,468 0.02750,000 Reynolds Group Issuer 144A 15.05.18/9.250% 554,678 0.15433,000 Reynolds Group Issuer 144A 15.04.19/7.125% 340,249 0.09
1,700,000 Reynolds Group Issuer 144A 15.04.19/9.000% 1,250,722 0.33850,000 Reynolds Group Issuer 144A 15.08.19/9.875% 638,458 0.17100,000 Reynolds Group Issuer 144A 15.02.21/6.875% 76,653 0.02230,000 ROC Finance 1 144A 01.09.18/12.125% 187,377 0.0580,000 RR Donnelley & Sons Co. 15.05.18/7.250% 59,936 0.02
465,000 RR Donnelley & Sons Co. 15.06.20/7.625% 336,736 0.09880,000 RSC Equipment Rental 01.02.21/8.250% 689,804 0.18350,000 Sally Holdings/Sally Capital 144A 15.11.19/6.875% 283,117 0.08150,000 San Pasqual Casino 144A 15.09.13/8.000% 114,402 0.0350,000 Sealed Air 144A 15.09.21/8.375% 42,660 0.01
555,000 Sears Holdings 15.10.18/6.625% 326,418 0.09450,000 Seminole Hard Rock
Entertainment 144A 15.03.14/3.046%* 325,873 0.09
25,000 Seminole Indian Tribeof Florida 144A 01.10.17/7.750% 20,126 0.01
200,000 Seneca Gaming 144A 01.12.18/8.250% 151,381 0.04250,000 ServiceMaster 144A 15.07.15/10.750%* 200,300 0.05300,000 Shingle Springs Tribal Gaming
Authority 144A 15.06.15/9.375% 130,580 0.03950,000 Simmons Bedding 144A 15.07.15/11.250% 759,312 0.20250,000 Simmons Foods 144A 01.11.17/10.500% 161,300 0.04111,000 Sinclair Television Group 144A 01.11.17/9.250% 93,637 0.03
225,000 Sitel 01.04.18/11.500% 128,703 0.03515,000 SM Energy 144A 15.02.19/6.625% 410,635 0.11
3,000 Smithfield Foods 15.07.14/10.000% 2,704 0.001,000,000 Spectrum Brands 15.06.18/9.500% 846,462 0.23
377,360 Spectrum Brands 28.08.19/12.000%* 318,331 0.09100,000 Speedway Motorsports 01.02.19/6.750% 78,194 0.02590,000 Sprint Nextel 144A 15.11.18/9.000% 478,579 0.13
70,000 Sprint Nextel 144A 15.11.21/11.500% 53,455 0.01239,000 SquareTwo Financial 01.04.17/11.625% 178,599 0.05110,000 Standard Pacific 15.01.21/8.375% 80,082 0.02
300,000 Steel Dynamics 15.03.20/7.625% 244,405 0.0750,000 Stream Global Services 01.10.14/11.250% 39,290 0.01
2,145,486 Structured Asset InvestmentLoan Trust 2004-7 M1 25.08.34/1.344%* 1,231,105 0.33
474,981 Structured Asset Securities2003-35 B1 25.12.33/5.527%* 300,695 0.08
100,000 Sugarhouse HSP GamingFinance 144A 15.04.16/8.625% 79,350 0.02
2,000,000 Sungard Data Systems 15.08.15/10.250% 1,602,404 0.43550,000 SunGard Data Systems 15.11.18/7.375% 435,365 0.12135,000 Swift Energy 144A 01.03.22/7.875% 102,962 0.03485,000 Targa Resources Partners
Finance 144A 01.02.21/6.875% 379,242 0.10120,000 Tenet Healthcare 144A 01.11.18/6.250% 94,295 0.03200,000 Texas Competitive Electric
Holdings 01.11.15/10.250% 55,468 0.01500,000 Texas Competitive Electric
Holdings 144A 01.10.20/11.500% 328,859 0.0950,000 Titan International 01.10.17/7.875% 40,253 0.01
110,000 Tops Holding 15.10.15/10.125% 89,086 0.02250,000 TransUnion Financing 15.06.18/11.375% 221,005 0.06200,000 Trimas 15.12.17/9.750% 167,944 0.04280,000 Tutor Perini 01.11.18/7.625% 204,384 0.05
80,073 United Airlines Pass ThroughTrust 2007 02.07.22/6.636% 61,687 0.02
400,000 United Surgical PartnersInternational 01.05.17/8.875% 308,540 0.08
250,000 United Surgical PartnersInternational 01.05.17/9.250%* 194,523 0.05
450,000 Univision Communications 144A 15.05.19/6.875% 336,274 0.09400,000 Univision Communications 144A 01.11.20/7.875% 314,318 0.08285,000 US Treasury 31.01.12/0.875% 219,714 0.06655,000 Vail Resorts 01.05.19/6.500% 517,218 0.14150,000 Valassis Communications 01.02.21/6.625% 108,047 0.03450,000 Valeant Pharmaceuticals
International 144A 15.07.16/6.500% 347,541 0.09835,000 Valeant Pharmaceuticals
International 144A 01.10.17/6.750% 646,489 0.17650,000 Valeant Pharmaceuticals
International 144A 01.12.18/6.875% 502,003 0.13450,000 Valeant Pharmaceuticals
International 144A 01.10.20/7.000% 344,941 0.09700,000 Valeant Pharmaceuticals
International 144A 15.07.22/7.250% 531,181 0.14150,000 Vanguard Health Holding Co II 01.02.18/8.000% 115,125 0.0360,000 Vanguard Health Holding Co II 01.02.19/7.750% 44,605 0.0111,000 Venoco 15.02.19/8.875% 7,648 0.00
180,000 Verso Paper Holdings 01.07.14/11.500% 142,136 0.04500,000 Visant 01.10.17/10.000% 354,378 0.09405,000 Vulcan Materials 15.06.21/7.500% 339,307 0.09
50,000 VWR Funding 144A 30.06.17/10.750% 37,942 0.01258,000 W&T Offshore 144A 15.06.19/8.500% 205,716 0.06
75,000 WCA Waste 144A 15.06.19/7.500% 58,501 0.02824,343 Wells Fargo Mortgage Backed
Securities Trust 2007-15 A1 25.11.37/6.000% 570,240 0.15135,311 Wells Fargo Mortgage Backed
Securities Trust 2007-5 2A3 25.05.22/5.500% 102,631 0.03185,000 Wendy’s 15.07.16/10.000% 156,548 0.0470,000 Western Refining 144A 15.06.17/11.250% 61,612 0.0275,000 Windstream 01.08.13/8.125% 61,900 0.02
125,000 Windstream 01.11.17/7.875% 104,501 0.031,375,000 Windstream 01.09.18/8.125% 1,140,051 0.31
110,000 Windstream 144A 01.06.22/7.500% 84,743 0.02171,000 WMG Acquisition 15.06.16/9.500% 143,592 0.0425,000 WMG Acquisition 144A 15.06.16/9.500% 20,993 0.0170,000 WMG Acquisition 144A 01.10.18/11.500% 53,927 0.02
125,000 WPX Energy 144A 15.01.17/5.250% 97,021 0.03125,000 WPX Energy 144A 15.01.22/6.000% 98,947 0.03150,000 Wynn Las Vegas Capital 01.11.17/7.875% 128,260 0.04
117
JPMorgan Investment Funds - Global Income Fund
Schedule of Investments (Market Value Expressed in EUR) (continued)
As at 31 December 2011
Quantity/Nominal
Value
Name of Securities Maturity/Coupon
MarketValue
%of
NetAssets
Quantity/Nominal
Value
Name of Securities Maturity/Coupon
MarketValue
%of
NetAssets

175,000 Wynn Las Vegas Capital 01.05.20/7.875% 149,142 0.04135,000 Wynn Las Vegas Capital 15.08.20/7.750% 115,651 0.0350,000 XM Satellite Radio 144A 01.08.13/13.000% 43,912 0.01
750,000 Yankee Candle 15.02.17/9.750% 563,345 0.15250,000 Zayo Group/Zayo Capital 15.03.17/10.250% 206,078 0.06
127,051,403 33.98
LUXEMBOURG225,000 APERAM 144A 01.04.18/7.750% 144,736 0.04200,000 Calcipar 144A 01.05.18/6.875% 143,292 0.04500,000 Intelsat Jackson Holdings 15.06.16/9.500% 404,164 0.11
1,250,000 Intelsat Jackson Holdings 15.06.16/11.250% 1,018,836 0.271,000,000 Intelsat Jackson Holdings 15.10.20/7.250% 780,016 0.21
125,000 Intelsat Jackson Holdings 144A 01.04.19/7.250% 98,224 0.031,125,000 Intelsat Luxembourg 04.02.17/11.250% 845,018 0.22
745,492 Intelsat Luxembourg 04.02.17/11.500%* 554,216 0.15370,000 Intelsat Luxembourg 144A 04.02.17/11.500%* 275,066 0.07400,000 Wind Acquisition Finance 144A 15.07.17/11.750% 276,459 0.07
4,540,027 1.21
CANADA225,000 Cascades 15.12.17/7.750% 172,470 0.0535,000 Cascades 15.01.20/7.875% 26,289 0.01
120,000 Garda World Security 144A 15.03.17/9.750% 94,295 0.02275,000 Novelis 15.12.20/8.750% 227,216 0.0660,000 Pioneer Drilling 144A 15.12.21/6.500% 47,148 0.0155,000 Precision Drilling 15.11.20/6.625% 43,325 0.01
1,300,000 Quebecor Media 15.03.16/7.750% 1,035,303 0.2850,000 Taseko Mines 15.04.19/7.750% 34,860 0.0162,000 Telesat Canada 01.11.15/11.000% 51,525 0.01
100,000 Thompson Creek Metals 01.06.18/7.375% 68,757 0.02190,000 Trinidad Drilling 144A 15.01.19/7.875% 151,474 0.04
1,952,662 0.52
IRELAND200,000 Ardagh Packaging Finance 144A 15.10.17/7.375% 156,388 0.04
2,050,000 Ardagh Packaging Finance 144A 15.10.20/9.125% 1,571,396 0.42110,000 XL Capital 31.12.49/6.500%* 66,664 0.02
1,794,448 0.48
NETHERLANDS100,000 Bluewater Holding 17.07.14/3.403%* 61,631 0.01225,000 LyondellBasell Industries 144A 15.11.21/6.000% 180,270 0.05
1,225,000 NXP/NXP Funding 144A 01.08.18/9.750% 1,033,377 0.28200,000 Sensata Technologies 144A 15.05.19/6.500% 152,922 0.04
1,428,200 0.38
CAYMAN ISLANDS235,000 MCE Finance 15.05.18/10.250% 196,578 0.0550,000 Seagate HDD Cayman 01.05.20/6.875% 39,771 0.01
130,000 Seagate HDD Cayman 144A 15.12.18/7.750% 106,910 0.03300,000 Seagate HDD Cayman 144A 01.11.21/7.000% 237,472 0.07500,000 UPCB Finance III 144A 01.07.20/6.625% 381,341 0.10150,000 UPCB Finance V 144A 15.11.21/7.250% 117,580 0.03
1,079,652 0.29
UNITED KINGDOM950,000 Ineos Finance 144A 15.05.15/9.000% 746,504 0.20300,000 Virgin Media Finance 15.10.19/8.375% 251,153 0.07
997,657 0.27
AUSTRALIA105,000 Boart Longyear Management
144A 01.04.21/7.000% 82,508 0.0275,000 FMG Resources August 2006 Pty
144A 01.11.15/7.000% 58,432 0.02385,000 FMG Resources August 2006 Pty
144A 01.02.18/6.875% 283,252 0.08400,000 FMG Resources August 2006 Pty
144A 01.11.19/8.250% 309,926 0.08
734,118 0.20
MARSHALL ISLANDS109,000 General Maritime 15.11.17/12.000% 1,994 0.0090,000 Navios Logistics Finance US
144A 15.04.19/9.250% 56,161 0.01307,000 Navios Maritime Holdings 01.11.17/8.875% 227,048 0.06300,000 Ocean Rig UDW 27.04.16/9.500% 214,360 0.06
499,563 0.13
BERMUDA300,000 Catlin Insurance 144A 31.12.49/7.249%* 198,182 0.05
198,182 0.05
MEXICO100,000 Kansas City Southern de Mexico 01.02.18/8.000% 85,128 0.0244,000 Kansas City Southern de Mexico 15.12.20/6.625% 36,270 0.0145,000 Kansas City Southern de Mexico 15.06.21/6.125% 35,967 0.01
157,365 0.04
AUSTRIA200,000 Sappi Papier Holding 144A 15.04.21/6.625% 132,506 0.04
132,506 0.04
FRANCE150,000 Pernod-Ricard 144A 07.04.21/5.750% 131,503 0.04
131,503 0.04
BAHAMAS162,000 Ultrapetrol Bahamas 24.11.14/9.000% 114,350 0.03
114,350 0.03
Total Bonds 140,811,636 37.66
Convertible Bonds
UNITED STATES OF AMERICA295,000 Advanced Micro Devices 01.05.15/6.000% 222,719 0.06
1,895,000 Apollo Investment 144A 15.01.16/5.750% 1,226,301 0.331,294,000 Ares Capital 144A 01.06.16/5.125% 930,837 0.25
200,000 Stewart Enterprises 15.07.14/3.125% 147,336 0.04125,000 Stewart Enterprises 15.07.16/3.375% 90,400 0.02
2,617,593 0.70
MARSHALL ISLANDS2,189,000 DryShips 01.12.14/5.000% 1,155,167 0.31
1,155,167 0.31
MEXICO1,900,000 Cemex SAB de 15.03.15/4.875% 958,973 0.26
958,973 0.26
CAYMAN ISLANDS300,000 Polarcus 27.04.16/2.875% 174,224 0.05
1,473,000 Suntech Power Holdings 15.03.13/3.000% 465,259 0.12
639,483 0.17
Total Convertible Bonds 5,371,216 1.44
Investment Funds
UNITED STATES OF AMERICA4,726,138 JPMorgan US Dollar Liquidity
Fund - Morgan (dist) 31.12.49/0.000% 3,640,953 0.97
3,640,953 0.97
Total Investment Funds 3,640,953 0.97
Total Transferable Securities Dealt in on AnotherRegulated Market
149,823,805 40.07
Other Transferable Securities
Shares
UNITED STATES OF AMERICA3,000 CoBank ACB 144A Preference Shares 105,591 0.031,500 CoBank ACB Preference Shares 62,474 0.02
45 Constar International*** 2,427 0.00450 Constar International*** 97 0.00
170,589 0.05
Total Shares 170,589 0.05
118
JPMorgan Investment Funds - Global Income Fund
Schedule of Investments (Market Value Expressed in EUR) (continued)
As at 31 December 2011
Quantity/Nominal
Value
Name of Securities Maturity/Coupon
MarketValue
%of
NetAssets
Quantity/Nominal
Value
Name of Securities Maturity/Coupon
MarketValue
%of
NetAssets

Bonds
UNITED STATES OF AMERICA32,621 Constar International*** 31.12.17/11.000% 25,131 0.01
250,000 US Oncology 15.08.17/9.125% 3,370 0.00
28,501 0.01
Total Bonds 28,501 0.01
Convertible Bonds
UNITED STATES OF AMERICA15,000 US Concrete 144A 31.08.15/9.500% 11,296 0.00
11,296 0.00
Total Convertible Bonds 11,296 0.00
Total Other Transferable Securities 210,386 0.06
Total Investments 371,209,565 99.27
Cash 2,569,041 0.69
Other Assets/(Liabilities) 138,253 0.04
Total Net Assets 373,916,859 100.00
* Variable coupon rates are those quoted as at 31 December 2011.** Hong Kong Registered Shares.*** This security is fair valued.
Allocation of Portfolio as at 31 December 2011 % ofNet Assets
Fixed Income SecuritiesUnited States of America 46.86Luxembourg 1.54United Kingdom 1.26Mexico 0.73Brazil 0.65Ireland 0.65Cayman Islands 0.64Canada 0.52Argentina 0.51Germany 0.51Nigeria 0.50Colombia 0.50Kazakhstan 0.50Marshall Islands 0.44India 0.42United Arab Emirates 0.41Venezuela 0.40Netherlands 0.39Dominican Republic 0.39Russian Federation 0.38El Salvador 0.37Peru 0.36Sri Lanka 0.36Philippines 0.35International Agencies 0.35South Korea 0.33Austria 0.31Australia 0.25Bermuda 0.21Uruguay 0.17Spain 0.08Japan 0.04France 0.04Bahamas 0.03Total Fixed Income Securities 61.45SharesFinancials 11.14Telecommunication Services 4.50Utilities 3.40Consumer Staples 3.16Energy 2.78Consumer Discretionary 2.61Information Technology 2.46Health Care 2.43Materials 2.19Industrials 2.18Investment Companies 0.97Total Shares 37.82Cash and Other Assets/(Liabilities) 0.73
Total 100.00
119
JPMorgan Investment Funds - Global Income Fund
Schedule of Investments (Market Value Expressed in EUR) (continued)
As at 31 December 2011
Quantity/Nominal
Value
Name of Securities Maturity/Coupon
MarketValue
%of
NetAssets
Quantity/Nominal
Value
Name of Securities Maturity/Coupon
MarketValue
%of
NetAssets

Allocation of Portfolio as at 30 June 2011 (Unaudited) % ofNet Assets
Fixed Income SecuritiesUnited States of America 38.63Luxembourg 1.51United Kingdom 1.24Bermuda 0.63Kazakhstan 0.59Ireland 0.59Russia 0.58Brazil 0.57Canada 0.56Mexico 0.54Australia 0.49Argentina 0.47Cayman Islands 0.44El Salvador 0.44Marshall Islands 0.41Colombia 0.41International Agencies 0.39Sri Lanka 0.37Peru 0.37Dominican Republic 0.36Austria 0.35Belarus 0.34India 0.34Netherlands 0.31United Arab Emirates 0.30Ukraine 0.30Ghana 0.29Venezuela 0.27South Korea 0.17Uruguay 0.14France 0.14Spain 0.12Sweden 0.11Germany 0.04Bahamas 0.04Japan 0.04Norway 0.01Total Fixed Income Securities 52.90SharesFinancials 13.37Telecommunication Services 3.95Consumer Discretionary 3.86Utilities 3.85Industrials 3.83Health Care 3.74Materials 3.48Energy 3.17Consumer Staples 2.24Investment Companies 1.44Information Technology 1.19Total Shares 44.12Cash and Other Assets/(Liabilities) 2.98
Total 100.00
120
JPMorgan Investment Funds - Global Income Fund
Schedule of Investments (Market Value Expressed in EUR) (continued)
As at 31 December 2011
Quantity/Nominal
Value
Name of Securities Maturity/Coupon
MarketValue
%of
NetAssets
Quantity/Nominal
Value
Name of Securities Maturity/Coupon
MarketValue
%of
NetAssets

JPMorgan Investment Funds - Global Income Fund
Schedule of Investments - Outstanding Financial Futures Contracts (Expressed in EUR)
As at 31 December 2011
ExpirationDate
Number ofContracts Security Description Currency
NotionalValue
UnrealisedGain/(Loss)
Bond Futures
Mar-12 82 US Long Bond Future USD 9,137,192 (64,159)
Total (64,159)
Schedule of Investments - Outstanding Forward Foreign Exchange Contracts (Expressed in EUR)
SettlementDate Currency
AmountPurchased Currency
AmountSold
UnrealisedGain/(Loss)
11-Jan-12 EUR 1,130,516 AUD 1,487,499 (36,066)11-Jan-12 EUR 309,355,989 USD 412,177,154 (8,161,068)11-Jan-12 USD 7,160,691 AUD 7,061,610 (21,945)11-Jan-12 USD 2,768,040 CHF 2,565,997 24,06811-Jan-12 USD 1,379,072 EUR 1,064,227 (1,871)11-Jan-12 USD 18,914,384 GBP 12,076,979 112,51311-Jan-12 USD 3,410,522 HKD 26,529,224 (4,078)11-Jan-12 USD 12,861,945 JPY 998,322,308 (57,977)11-Jan-12 USD 691,249 NOK 3,972,538 21,01711-Jan-12 USD 1,450,335 SEK 9,788,297 19,41711-Jan-12 USD 2,546,654 SGD 3,302,111 (42)14-Feb-12 EUR 2,150,963 USD 2,773,231 15,261
Total (8,090,771)
121

Transferable Securities Admitted to an Official Exchange Listing
Shares
UNITED STATES OF AMERICA922 Amazon.com 160,506 1.01
3,087 American Express 146,355 0.92850 Apple 344,556 2.16296 Autozone 96,317 0.60
1,768 Biogen Idec 194,957 1.223,352 Broadcom - A Shares 98,767 0.623,673 Capital One Financial 156,139 0.987,835 CBS - Non voting B Shares 215,032 1.352,095 Celgene 141,276 0.894,172 CenterPoint Energy 84,462 0.533,160 Chevron 338,847 2.128,350 Cisco Systems 152,346 0.967,559 Citigroup 201,485 1.262,386 Coca-Cola 167,605 1.051,892 Cognizant Technology Solutions - A Shares 121,268 0.76
856 Colgate-Palmolive 79,570 0.506,554 Comcast - A Shares 156,018 0.982,712 CVS Caremark 111,002 0.701,578 Dominion Resources 84,320 0.532,226 EI du Pont de Nemours & Co. 102,018 0.644,438 EMC/Massachusetts 96,504 0.611,334 Emerson Electric 62,305 0.393,535 Fluor 178,694 1.123,236 Kraft Foods - A Shares 121,334 0.76
145 Mastercard - A Shares 54,541 0.345,571 Merck & Co. 210,723 1.328,326 Microsoft 216,518 1.363,144 Occidental Petroleum 295,835 1.869,237 Oracle 238,176 1.492,317 Paccar 87,038 0.551,284 SanDisk 63,847 0.405,328 SunTrust Banks 93,506 0.592,915 Target 149,525 0.947,715 TD Ameritrade Holding 120,315 0.755,297 Time Warner 193,791 1.221,262 TJX 81,525 0.511,657 Union Pacific 175,418 1.103,348 United Technologies 246,898 1.554,469 UnitedHealth Group 228,053 1.433,321 Verizon Communications 132,491 0.832,259 Vertex Pharmaceuticals 74,615 0.471,382 VF 175,956 1.10
11,890 Wells Fargo & Co. 329,294 2.073,274 Xilinx 105,832 0.66
6,885,580 43.20
UNITED KINGDOM1,289 BG Group 27,581 0.17
16,726 BP 119,619 0.751,401 British American Tobacco 66,597 0.42
18,392 Cairn Energy 76,064 0.4832,637 Centrica 146,720 0.9211,577 GlaxoSmithKline 264,722 1.666,553 Intercontinental Hotels Group 118,040 0.74
203,524 Lloyds Banking Group 81,831 0.5210,773 Prudential 106,823 0.67
3,731 Rio Tinto 181,254 1.147,058 Standard Chartered 154,588 0.972,926 Tullow Oil 63,621 0.40
120,519 Vodafone Group 335,192 2.10
1,742,652 10.94
SWITZERLAND10,633 ABB Registered Shares 200,368 1.262,938 ACE 207,056 1.302,867 Compagnie Financiere Richemont - Bearer A Shares 145,613 0.91
945 Holcim Registered Shares 50,490 0.323,838 Nestlé Registered Shares 220,919 1.39
858 Roche Holding - Genussschein 145,440 0.911,535 Swiss Re 77,937 0.494,225 TE Connectivity 130,912 0.823,083 Tyco International 144,254 0.90
1,322,989 8.30
JAPAN5,000 Bridgestone 112,958 0.71
76 Dai-ichi Life Insurance 74,449 0.4714,000 Fuji Heavy Industries 84,172 0.53
18,000 Fujitsu 93,528 0.5935 Japan Retail Fund Investment 51,678 0.3251 Japan Tobacco 239,553 1.50
19,000 JX Holdings 114,726 0.727 KDDI 44,898 0.28
27,000 Mitsubishi Heavy Industries 114,577 0.727,800 Nissan Motor 69,839 0.441,370 ORIX 112,991 0.71
18,000 Toshiba 73,236 0.467,000 Toto 53,878 0.34
990 Yamada Denki 67,090 0.42
1,307,573 8.21
GERMANY1,419 Allianz Registered Shares 135,797 0.851,327 BASF 92,542 0.582,545 Bayer Registered Shares 162,493 1.025,530 E.ON 119,033 0.751,110 Volkswagen Preference Shares 166,236 1.04
676,101 4.24
FRANCE1,012 L’Oréal 105,497 0.66
505 PPR 72,615 0.463,450 Schneider Electric 179,769 1.132,294 Sodexo 164,802 1.044,826 Suez Environnement 55,465 0.35
578,148 3.64
NETHERLANDS5,012 EADS 156,172 0.982,350 Koninklijke KPN 28,198 0.185,786 Unilever - CVA 198,954 1.25
383,324 2.41
JERSEY9,422 Experian 128,132 0.806,580 Shire 229,281 1.44
357,413 2.24
CURACAO4,087 Schlumberger 276,792 1.74
276,792 1.74
IRELAND3,959 Covidien 178,868 1.121,538 Paddy Power 89,788 0.56
268,656 1.68
CANADA7,332 First Quantum Minerals 142,878 0.907,597 Kinross Gold 87,901 0.55
230,779 1.45
SOUTH KOREA237 Samsung Electronics 216,688 1.36
216,688 1.36
SWEDEN16,756 Telefonaktiebolaget LM Ericsson - B Shares 170,196 1.07
170,196 1.07
FINLAND11,326 Stora Enso - R Shares 67,157 0.426,539 UPM-Kymmene 71,617 0.45
138,774 0.87
ISRAEL3,200 Teva Pharmaceutical Industries ADR 130,192 0.82
130,192 0.82
PANAMA3,878 Carnival 127,509 0.80
127,509 0.80
BELGIUM1,518 Solvay 124,778 0.78
124,778 0.78
122
JPMorgan Investment Funds - Global Select 130/30 Fund
Schedule of Investments (Market Value Expressed in USD)
As at 31 December 2011
Quantity/Nominal
Value
Name of Securities MarketValue
%of
NetAssets
Quantity/Nominal
Value
Name of Securities MarketValue
%of
NetAssets

DENMARK1,693 Carlsberg - B Shares 119,437 0.75
119,437 0.75
TAIWAN21,325 Hon Hai Precision Industry Registered Shares GDR 117,767 0.74
117,767 0.74
ITALY21,139 Snam Rete Gas 92,553 0.58
92,553 0.58
HONG KONG52,000 China Overseas Land & Investment 86,770 0.54
86,770 0.54
INDIA6,144 Housing Development Finance 75,085 0.47
75,085 0.47
BERMUDA854 Everest Re Group 72,543 0.45
72,543 0.45
CAYMAN ISLANDS41,000 Belle International Holdings 71,477 0.45
71,477 0.45
AUSTRALIA8,388 Westfield Group 66,985 0.42
66,985 0.42
NORWAY4,165 Petroleum Geo-Services 45,436 0.29
45,436 0.29
ISLE OF MAN9,872 Lamprell 41,457 0.26
41,457 0.26
CHINA7,000 China Merchants Bank - H Shares * 14,141 0.09
14,141 0.09
Total Shares 15,741,795 98.79
Total Transferable Securities Admitted to an OfficialExchange Listing
15,741,795 98.79
Total Investments 15,741,795 98.79
Cash 85,495 0.54
Other Assets/(Liabilities) 106,986 0.67
Total Net Assets 15,934,276 100.00
* Hong Kong Registered Shares.
Allocation of Portfolio as at 31 December 2011 % ofNet Assets
SharesConsumer Discretionary 15.32Information Technology 14.96Financials 14.84Health Care 11.28Industrials 10.43Consumer Staples 8.98Energy 8.79Materials 7.14Utilities 3.66Telecommunication Services 3.39Total Shares 98.79Cash and Other Assets/(Liabilities) 1.21
Total 100.00
Allocation of Portfolio as at 30 June 2011 (Unaudited) % ofNet Assets
SharesFinancials 19.29Consumer Discretionary 14.16Information Technology 13.06Health Care 11.14Materials 10.34Industrials 9.65Energy 7.48Consumer Staples 6.87Utilities 3.58Telecommunication Services 2.89Total Shares 98.46Cash and Other Assets/(Liabilities) 1.54
Total 100.00
123
JPMorgan Investment Funds - Global Select 130/30 Fund
Schedule of Investments (Market Value Expressed in USD) (continued)
As at 31 December 2011
Quantity/Nominal
Value
Name of Securities MarketValue
%of
NetAssets
Quantity/Nominal
Value
Name of Securities MarketValue
%of
NetAssets

JPMorgan Investment Funds - Global Select 130/30 Fund
Schedule of Investments - Outstanding Forward Foreign Exchange Contracts (Expressed in USD)
As at 31 December 2011
SettlementDate Currency
AmountPurchased Currency
AmountSold
UnrealisedGain/(Loss)
10-Jan-12 AUD 774,826 USD 795,395 (6,472)10-Jan-12 CAD 591,492 USD 581,305 (1,185)10-Jan-12 EUR 56,007 CHF 69,370 (1,283)10-Jan-12 EUR 34,930 SGD 59,802 (779)10-Jan-12 EUR 428,407 USD 577,798 (21,675)10-Jan-12 GBP 54,582 CHF 79,169 38710-Jan-12 GBP 289,489 USD 459,092 (9,205)10-Jan-12 JPY 4,443,036 CHF 53,329 69810-Jan-12 JPY 15,796,380 USD 202,914 1,78610-Jan-12 NOK 597,988 USD 105,863 (5,912)10-Jan-12 SEK 1,323,315 USD 199,548 (6,869)10-Jan-12 SGD 291,868 USD 229,791 (4,691)10-Jan-12 USD 79,754 AUD 80,980 (2,700)10-Jan-12 USD 355,414 CHF 317,324 16,97510-Jan-12 USD 1,489,013 EUR 1,084,550 81,14110-Jan-12 USD 1,159,689 GBP 723,860 34,75810-Jan-12 USD 604,325 JPY 47,058,045 (5,487)10-Jan-12 USD 109,191 NOK 646,842 1,074
Total 70,561
Schedule of Investments - Outstanding Total Return Swaps (Expressed in USD) (Please refer to note 2l)
EconomicExposure(in contractcurrency) Currency Sub-Fund Receives Sub-Fund Pays Counterparty
UnrealisedGain/(Loss)
(111,312) TRY TRY-1D-ON-UBS Performance of the underlying basket of equities UBS 12,846
(327,432) DKK DKK-1D-LIBID Performance of the underlying basket of equities UBS (56,739)
458,031 GBP Performance of the underlying basket of equities GBP-1M-LIBOR + 0.25% UBS23,970
(441,864) GBP GBP-1D-LIBID Performance of the underlying basket of equities UBS
1,485,565 HKD Performance of the underlying basket of equities HKD-1D-ON-BANKS + 0.40% UBS(13,657)
(1,581,120) HKD HKD-1D-ON-BANKS Performance of the underlying basket of equities UBS
647,785 USD Performance of the underlying basket of equities USD-1M-LIBOR + 0.25% UBS(701,241)
(1,293,800) USD USD-1D-FUNDS-FED Performance of the underlying basket of equities UBS
8,724 CAD Performance of the underlying basket of equities CAD-1M-LIBOR + 0.25% UBS 8,571
174,424 NOK Performance of the underlying basket of equities NOK-1D-ON-BANKS + 0.25% UBS 32,649
87,671 CHF Performance of the underlying basket of equities CHF-1M-LIBOR + 0.25% UBS 157,732
(150,958) AUD AUD-1D-LIBID Performance of the underlying basket of equities UBS (158,918)
779,366 EUR Performance of the underlying basket of equities EUR-1M-LIBOR + 0.25% UBS512,507
(419,239) EUR EUR-1D-LIBID Performance of the underlying basket of equities UBS
(84,390) SGD SGD-1D-ON-BANKS Performance of the underlying basket of equities UBS (65,315)
86,845,200 JPY Performance of the underlying basket of equities JPY-1M-LIBOR + 0.40% UBS485,226
(46,847,400) JPY JPY-1D-LIBID Performance of the underlying basket of equities UBS
226,768 SEK Performance of the underlying basket of equities SEK-1M-LIBOR + 0.25% UBS(176,963)
(1,449,960) SEK SEK-1D-LIBID Performance of the underlying basket of equities UBS
Total 60,668
124

Net Geographic Distribution based on Economic Exposure of Swap Portfolio(expressed in Sub-Fund Currency)
% ofTotal
NetAssets
Japan 3.23United Kingdom 2.89Germany 0.77Switzerland 0.63France 0.61Cayman Islands 0.39China 0.35Jersey 0.35Italy 0.23Norway 0.18Canada 0.05Bermuda (0.30)Finland (0.33)Denmark (0.36)Turkey (0.36)Singapore (0.41)Netherlands (0.53)Austria (0.61)Hong Kong (0.81)Australia (0.96)Sweden (1.11)United States of America (4.10)
125
JPMorgan Investment Funds - Global Select 130/30 Fund
Schedule of Investments - Outstanding Total Return Swaps (Expressed in USD) (Please refer to note 2l) (continued)
As at 31 December 2011

Transferable Securities Admitted to an Official Exchange Listing
Shares
UNITED STATES OF AMERICA40,696 Adobe Systems 1,157,598 0.4731,005 Aflac 1,340,191 0.5429,291 Air Products & Chemicals 2,492,811 1.00
7,621 Alexion Pharmaceuticals 545,321 0.2210,312 Allergan 908,590 0.3721,724 Amazon.com 3,781,823 1.52
24,464 Anadarko Petroleum 1,875,288 0.7524,869 Apple 10,080,898 4.06
2,506 Autozone 815,440 0.3331,268 Baker Hughes 1,516,498 0.61
173,220 Bank of America 943,183 0.3821,899 Biogen Idec 2,414,803 0.9770,418 CBS - Non voting B Shares 1,932,622 0.7836,531 Celgene 2,463,468 0.9918,685 Chevron 2,003,593 0.81
189,062 Cisco Systems 3,449,436 1.3948,845 Citigroup 1,301,963 0.5311,879 Citrix Systems 726,282 0.2951,127 Coca-Cola 3,591,416 1.4521,283 Cognizant Technology Solutions - A Shares 1,364,134 0.55
205,907 CSX 4,337,431 1.7559,234 EI du Pont de Nemours & Co. 2,714,694 1.0924,872 Emerson Electric 1,161,647 0.4724,169 Fluor 1,221,743 0.4936,979 General Mills 1,497,465 0.6049,079 General Motors 995,322 0.4010,293 Goldman Sachs Group 929,715 0.3855,237 Honeywell International 3,018,426 1.2116,622 Humana 1,465,562 0.59
43,340 Johnson Controls 1,350,691 0.5430,172 Kohl’s 1,498,342 0.60
112,066 Kraft Foods - A Shares 4,201,915 1.694,915 Mastercard - A Shares 1,848,753 0.749,948 McKesson 779,873 0.32
112,483 Merck & Co. 4,254,669 1.7138,127 MetLife 1,191,278 0.48
159,174 Microsoft 4,139,320 1.6750,248 Morgan Stanley 760,504 0.3124,940 NextEra Energy 1,523,086 0.6211,893 Nike - B Shares 1,154,037 0.47
20,954 Occidental Petroleum 1,971,667 0.7968,073 Oracle 1,755,262 0.7140,264 Paccar 1,512,517 0.6131,244 PG&E 1,295,064 0.5257,782 Procter & Gamble 3,865,327 1.5617,889 Prudential Financial 897,133 0.3633,806 Safeway 712,123 0.29
293,972 Sprint Nextel 686,425 0.2729,469 State Street 1,195,852 0.48
129,104 Time Warner 4,723,270 1.9012,158 TJX 785,407 0.3238,510 United Technologies 2,839,920 1.1448,254 UnitedHealth Group 2,462,402 0.9979,552 Verizon Communications 3,173,727 1.2717,134 Vertex Pharmaceuticals 565,936 0.237,697 VF 979,982 0.39
13,442 Wal-Mart Stores 804,705 0.3251,405 Wells Fargo & Co. 1,423,661 0.57
116,400,211 46.86
UNITED KINGDOM1,035,545 Afren 1,380,098 0.55
31,431 ASOS 605,008 0.24439,948 Barclays 1,203,430 0.48584,652 BT Group 1,735,098 0.70321,684 Cairn Energy 1,330,397 0.54192,136 HSBC Holdings 1,466,512 0.59
220,868 Intercontinental Hotels Group 3,978,535 1.60339,311 International Power 1,781,149 0.72
1,842,239 ITV 1,949,845 0.781,367,137 Lloyds Banking Group 549,687 0.22
177,139 Prudential 1,756,474 0.71113,299 Rolls-Royce Holdings 1,314,066 0.5357,086 SABMiller 2,012,017 0.81
988,910 Vodafone Group 2,750,397 1.1174,481 Weir Group 2,356,840 0.95
26,169,553 10.53
JAPAN22,200 Astellas Pharma 898,931 0.3642,900 Benesse Holdings 2,060,923 0.8350,700 Electric Power Development 1,343,131 0.5436,500 FUJIFILM Holdings 861,007 0.3555,500 Izumi 914,393 0.37
92 Japan Real Estate Investment 713,469 0.29485 Japan Tobacco 2,278,102 0.91320 KDDI 2,052,478 0.83
60,800 Komatsu 1,416,500 0.57270,000 Minebea 1,130,029 0.45
67,000 Mitsubishi Estate 997,078 0.406,100 Nintendo 837,046 0.34
267,900 Nissan Motor 2,398,690 0.9759,500 Otsuka Holdings 1,666,077 0.6733,700 Softbank 988,839 0.40
133,000 Sumitomo Bakelite 741,905 0.30224,000 Sumitomo Heavy Industries 1,301,769 0.52271,000 Tokyu Land 1,021,846 0.41
23,622,213 9.51
FRANCE18,574 Atos 815,520 0.3316,776 BNP Paribas 657,964 0.2625,985 Compagnie de Saint-Gobain 991,488 0.4069,817 GDF Suez 1,882,754 0.7620,219 Lafarge 709,344 0.2913,755 L’Oréal 1,433,909 0.586,903 PPR 992,593 0.4020,175 Sanofi 1,475,572 0.5918,585 Schneider Electric 968,408 0.3932,885 Société Générale 715,317 0.2970,214 Suez Environnement 806,965 0.32
11,449,834 4.61
SWITZERLAND118,539 ABB Registered Shares 2,233,747 0.9023,192 ACE 1,634,456 0.66
26,998 Compagnie Financiere Richemont - Bearer A Shares 1,371,206 0.5539,878 Crédit Suisse Group Registered Shares 937,305 0.3816,431 Roche Holding - Genussschein 2,785,227 1.12
105,896 UBS Registered Shares 1,255,235 0.505,226 Zurich Financial Services 1,183,193 0.48
11,400,369 4.59
NETHERLANDS97,131 EADS 3,026,572 1.22
64,018 Koninklijke KPN 768,163 0.31147,920 Royal Dutch Shell - A Shares 5,416,053 2.18
9,210,788 3.71
GERMANY17,922 Allianz Registered Shares 1,715,113 0.6933,290 Bayer Registered Shares 2,125,494 0.8620,292 Continental 1,263,597 0.5116,438 HeidelbergCement 702,639 0.2819,532 Henkel & Co. KGaA Non Voting Preference Shares 1,133,682 0.458,574 Volkswagen Non Voting Preference Shares 1,284,064 0.52
8,224,589 3.31
SOUTH KOREA3,957 Samsung Electronics 3,617,874 1.46
3,617,874 1.46
CAYMAN ISLANDS937,000 Belle International Holdings 1,633,510 0.66
1,032,000 China Resources Land 1,658,280 0.67
3,291,790 1.33
JERSEY235,276 Black Earth Farming SDR 472,986 0.19154,671 Glencore International 941,727 0.3840,888 Shire 1,424,749 0.57
2,839,462 1.14
CHINA1,456,000 Angang Steel - H Shares * 1,046,066 0.42
803,650 China Merchants Bank - H Shares * 1,623,504 0.65
2,669,570 1.07
126
JPMorgan Investment Funds - Global Select Equity Fund
Schedule of Investments (Market Value Expressed in USD)
As at 31 December 2011
Quantity/Nominal
Value
Name of Securities MarketValue
%of
NetAssets
Quantity/Nominal
Value
Name of Securities MarketValue
%of
NetAssets

BERMUDA14,373 Everest Re Group 1,220,915 0.4948,761 Genpact 718,493 0.29
795,659 Sylvania Platinum 264,264 0.11
2,203,672 0.89
NORWAY200,403 Petroleum Geo-Services 2,186,196 0.88
2,186,196 0.88
INDIA18,155 Infosys 942,938 0.3876,201 Reliance Capital 337,674 0.14
183,687 Yes Bank 826,617 0.33
2,107,229 0.85
AUSTRIA20,815 Schoeller-Bleckmann Oilfield Equipment 1,829,180 0.74
1,829,180 0.74
CURACAO26,969 Schlumberger 1,826,476 0.74
1,826,476 0.74
CANADA83,123 First Quantum Minerals 1,619,814 0.65
1,619,814 0.65
ISRAEL31,697 Teva Pharmaceutical Industries ADR 1,289,592 0.52
1,289,592 0.52
ISLE OF MAN305,764 Lamprell 1,284,040 0.52
1,284,040 0.52
LUXEMBOURG12,475 Millicom International Cellular SDR 1,266,218 0.51
1,266,218 0.51
IRELAND26,512 Covidien 1,197,812 0.48
1,197,812 0.48
NEW ZEALAND110,067 Chorus 265,854 0.11550,335 Telecom Corporation of New Zealand 874,801 0.35
1,140,655 0.46
SWEDEN55,101 Tele2 - B Shares 1,066,380 0.43
1,066,380 0.43
TAIWAN186,404 Hon Hai Precision Industry Registered Shares GDR 1,029,416 0.41
1,029,416 0.41
ITALY223,321 Snam Rete Gas 977,771 0.39
977,771 0.39
SPAIN109,350 BBVA 929,364 0.37
929,364 0.37
AUSTRALIA37,248 Macquarie Group 904,706 0.36
904,706 0.36
THAILAND78,100 Siam Cement - NVDR 770,886 0.31
770,886 0.31
INDONESIA1,506,500 XL Axiata 749,678 0.30
749,678 0.30
HONG KONG5,448,000 IRC 740,036 0.30
740,036 0.30
BELGIUM45,936 KBC Groep 564,938 0.23
564,938 0.23
FINLAND442,120 Ruukki Group 502,157 0.20
502,157 0.20
GREECE108,474 Sidenor Steel Products Manufacturing 140,945 0.05
140,945 0.05
Total Shares 245,223,414 98.71
Total Transferable Securities Admitted to anOfficial Exchange Listing
245,223,414 98.71
Transferable Securities Dealt in on Another Regulated Market
Investment Funds
LUXEMBOURG2,500,000 JPMorgan Liquidity Funds - US Dollar Liquidity Fund
(JPM US Dollar Liquidity X (dist)) 2,500,000 1.01
2,500,000 1.01
Total Investment Funds 2,500,000 1.01
Total Transferable Securities Dealt in on AnotherRegulated Market
2,500,000 1.01
Other Transferable Securities
Shares
UNITED STATES OF AMERICA404,538 Vimetco Registered Shares GDR** 222,496 0.09
222,496 0.09
Total Shares 222,496 0.09
Total Other Transferable Securities 222,496 0.09
Total Investments 247,945,910 99.81
Cash 13,489 0.01
Other Assets/(Liabilities) 449,338 0.18
Total Net Assets 248,408,737 100.00
* Hong Kong Registered Shares.** This security is fair valued.
127
JPMorgan Investment Funds - Global Select Equity Fund
Schedule of Investments (Market Value Expressed in USD) (continued)
As at 31 December 2011
Quantity/Nominal
Value
Name of Securities MarketValue
%of
NetAssets
Quantity/Nominal
Value
Name of Securities MarketValue
%of
NetAssets

Allocation of Portfolio as at 31 December 2011 % ofNet Assets
SharesConsumer Discretionary 15.47Financials 13.94Information Technology 13.38Industrials 10.88Health Care 10.70Energy 9.11Consumer Staples 8.53Telecommunication Services 6.59Materials 6.33Utilities 3.87Investment Companies 1.01Total Shares 99.81Cash and Other Assets/(Liabilities) 0.19
Total 100.00
Allocation of Portfolio as at 30 June 2011 (Unaudited) % ofNet Assets
SharesConsumer Discretionary 58.06Utilities 16.32Materials 12.97Consumer Staples 6.49Information Technology 4.57Investment Companies 0.64Industrials 0.43Health Care 0.23Total Shares 99.71Cash and Other Assets/(Liabilities) 0.29
Total 100.00
128
JPMorgan Investment Funds - Global Select Equity Fund
Schedule of Investments (Market Value Expressed in USD) (continued)
As at 31 December 2011
Quantity/Nominal
Value
Name of Securities MarketValue
%of
NetAssets
Quantity/Nominal
Value
Name of Securities MarketValue
%of
NetAssets

JPMorgan Investment Funds - Global Select Equity Fund
Schedule of Investments - Outstanding Forward Foreign Exchange Contracts (Expressed in USD)
As at 31 December 2011
SettlementDate Currency
AmountPurchased Currency
AmountSold
UnrealisedGain/(Loss)
23-Feb-12 AUD 8,376,975 USD 8,299,907 186,03823-Feb-12 CAD 11,880,402 USD 11,498,647 141,40723-Feb-12 CHF 668,964 CAD 743,046 (13,844)23-Feb-12 DKK 3,528,030 USD 621,602 (5,137)23-Feb-12 EUR 944,513 USD 1,230,345 (3,757)23-Feb-12 SEK 10,441,621 USD 1,506,119 10,95823-Feb-12 SGD 938,394 AUD 722,147 (7,869)23-Feb-12 SGD 1,164,064 USD 894,320 3,38423-Feb-12 USD 2,266,401 CHF 2,125,272 (2,488)23-Feb-12 USD 7,327,465 EUR 5,600,193 54,80423-Feb-12 USD 3,600,944 GBP 2,312,912 8,02323-Feb-12 USD 1,825,491 HKD 14,203,595 (3,574)23-Feb-12 USD 1,295,613 JPY 100,695,337 (10,299)
Total 357,646
129

Transferable Securities Admitted to an Official Exchange Listing
Shares
UNITED STATES OF AMERICA6,216 Air Products & Chemicals 407,544 0.805,640 Apache 392,612 0.776,937 Baker Hughes 259,192 0.513,373 Chevron 278,639 0.547,480 Citigroup 153,599 0.3011,320 Guess? 260,838 0.5112,433 Hewlett-Packard 247,070 0.4841,950 Merck & Co. 1,222,417 2.3917,400 Morgan Stanley 202,881 0.4015,621 Veeco Instruments 252,899 0.491,780 Apple 555,865 1.09
4,233,556 8.28
FRANCE11,029 Sanofi 621,429 1.21
20,950 Total 824,068 1.6132,505 Vivendi 546,165 1.07
1,991,662 3.89
GERMANY7,209 Bayer Registered Shares 354,593 0.697,809 Bechtle 204,381 0.407,860 Rheinmetall 270,011 0.534,144 Volkswagen Preference Shares 478,114 0.93
1,307,099 2.55
BERMUDA315,000 Ports Design 367,443 0.72321,000 China Yurun Food Group 324,453 0.63
691,896 1.35
ISRAEL23,282 Teva Pharmaceutical Industries ADR 729,732 1.43
729,732 1.43
BELGIUM12,906 Anheuser-Busch InBev 610,744 1.20
610,744 1.20
UNITED KINGDOM270,255 Vodafone Group 579,057 1.13
579,057 1.13
CAYMAN ISLANDS62,300 Giant Interactive Group ADR 194,620 0.3833,500 Perfect World ADR 270,596 0.5351,300 VisionChina Media ADR 51,970 0.10
517,186 1.01
SINGAPORE11,737 Avago Technologies 260,501 0.51
260,501 0.51
NETHERLANDS28,172 Koninklijke KPN 260,422 0.51
260,422 0.51
Total Shares 11,181,855 21.86
Total Transferable Securities Admitted to an OfficialExchange Listing
11,181,855 21.86
Transferable Securities Dealt in on Another Regulated Market
Investment Funds
LUXEMBOURG4,593,520 JPMorgan Liquidity Funds - Euro Liquidity Fund (JPM
Euro Liquidity X (dist)) 4,593,520 8.98
4,593,520 8.98
Total Investment Funds 4,593,520 8.98
Total Transferable Securities Dealt in on AnotherRegulated Market
4,593,520 8.98
Other Transferable Securities
Shares
UNITED STATES OF AMERICA7,500,000 China Hongxing Sports* 274,782 0.54
274,782 0.54
Total Shares 274,782 0.54
Total Other Transferable Securities 274,782 0.54
Total Investments 16,050,157 31.38
Cash Equivalents
Time Deposits
UNITED KINGDOM8,000,000 Bank of Scotland 03.01.12/0.150% 8,000,000 15.63
8,000,000 15.63
NETHERLANDS8,000,000 Rabobank Nederland 03.01.12/0.100% 8,000,000 15.63
8,000,000 15.63
Total Time Deposits 16,000,000 31.26
Total Cash Equivalents 16,000,000 31.26
Total Investments plus Total Cash Equivalents 32,050,157 62.64
Cash 19,437,807 37.99
Other Assets/(Liabilities) (320,010) (0.63)
Total Net Assets 51,167,954 100.00
* This security is fair valued.
130
JPMorgan Investment Funds - Global Total Return Fund
Schedule of Investments (Market Value Expressed in EUR)
As at 31 December 2011
Quantity/Nominal
Value
Name of Securities Maturity/Coupon
MarketValue
%of
NetAssets
Quantity/Nominal
Value
Name of Securities Maturity/Coupon
MarketValue
%of
NetAssets

Allocation of Portfolio as at 31 December 2011 % ofNet Assets
SharesInvestment Companies 8.98Health Care 5.03Information Technology 3.88Energy 3.43Consumer Discretionary 2.80Telecommunication Services 2.71Consumer Staples 1.83Materials 1.49Financials 0.70Industrials 0.53Total Shares 31.38Cash Equivalents, Cash and Other Assets/(Liabilities) 68.62
Total 100.00
Allocation of Portfolio as at 30 June 2011 (Unaudited) % ofNet Assets
SharesEnergy 14.70Health Care 14.33Information Technology 12.55Consumer Discretionary 11.23Financials 6.87Telecommunication Services 4.79Consumer Staples 3.15Materials 2.79Industrials 1.69Total Shares 72.10Cash and Other Assets/(Liabilities) 27.90
Total 100.00
131
JPMorgan Investment Funds - Global Total Return Fund
Schedule of Investments (Market Value Expressed in EUR) (continued)
As at 31 December 2011
Quantity/Nominal
Value
Name of Securities Maturity/Coupon
MarketValue
%of
NetAssets
Quantity/Nominal
Value
Name of Securities Maturity/Coupon
MarketValue
%of
NetAssets

JPMorgan Investment Funds - Global Total Return Fund
Schedule of Investments - Outstanding Forward Foreign Exchange Contracts (Expressed in EUR)
As at 31 December 2011
SettlementDate Currency
AmountPurchased Currency
AmountSold
UnrealisedGain/(Loss)
20-Jan-12 CHF 158,337 EUR 127,538 2,57120-Jan-12 EUR 1,484,850 GBP 1,303,919 (75,911)20-Jan-12 EUR 263,078 HKD 2,824,934 (17,108)20-Jan-12 EUR 174,927 SGD 301,293 (4,057)20-Jan-12 EUR 6,487,337 USD 8,950,437 (407,139)20-Jan-12 GBP 949,386 EUR 1,104,122 32,27120-Jan-12 USD 3,513,334 EUR 2,580,870 125,434
Total (343,939)
Schedule of Investments - Outstanding Total Return Swaps (Expressed in EUR) (Please refer to note 2l)
EconomicExposure (incontractcurrency) Currency Sub-Fund Receives Sub-Fund Pays Counterparty
UnrealisedGain/(Loss)
(2,388,308) SEK SEK-1D-LIBID Performance of the underlying basket of equities UBS (5,544)
(3,294,043) USD USD-1D-FUNDS-FED Performance of the underlying basket of equities UBS 8,745
Total 3,201
Net Geographic Distribution based on Economic Exposure of Swap Portfolio(expressed in Sub-Fund Currency)
% ofTotal
NetAssets
Sweden (0.52)United States of America (4.96)
132
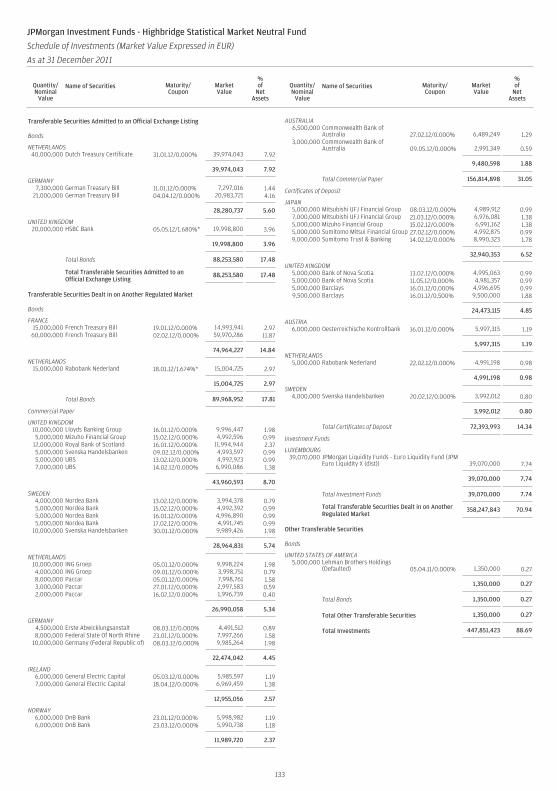
Transferable Securities Admitted to an Official Exchange Listing
Bonds
NETHERLANDS40,000,000 Dutch Treasury Certificate 31.01.12/0.000% 39,974,043 7.92
39,974,043 7.92
GERMANY7,300,000 German Treasury Bill 11.01.12/0.000% 7,297,016 1.44
21,000,000 German Treasury Bill 04.04.12/0.000% 20,983,721 4.16
28,280,737 5.60
UNITED KINGDOM20,000,000 HSBC Bank 05.05.12/1.680%* 19,998,800 3.96
19,998,800 3.96
Total Bonds 88,253,580 17.48
Total Transferable Securities Admitted to anOfficial Exchange Listing
88,253,580 17.48
Transferable Securities Dealt in on Another Regulated Market
Bonds
FRANCE15,000,000 French Treasury Bill 19.01.12/0.000% 14,993,941 2.9760,000,000 French Treasury Bill 02.02.12/0.000% 59,970,286 11.87
74,964,227 14.84
NETHERLANDS15,000,000 Rabobank Nederland 18.01.12/1.674%* 15,004,725 2.97
15,004,725 2.97
Total Bonds 89,968,952 17.81
Commercial Paper
UNITED KINGDOM10,000,000 Lloyds Banking Group 16.01.12/0.000% 9,996,447 1.985,000,000 Mizuho Financial Group 15.02.12/0.000% 4,992,596 0.99
12,000,000 Royal Bank of Scotland 16.01.12/0.000% 11,994,944 2.375,000,000 Svenska Handelsbanken 09.02.12/0.000% 4,993,597 0.995,000,000 UBS 13.02.12/0.000% 4,992,923 0.997,000,000 UBS 14.02.12/0.000% 6,990,086 1.38
43,960,593 8.70
SWEDEN4,000,000 Nordea Bank 13.02.12/0.000% 3,994,378 0.795,000,000 Nordea Bank 15.02.12/0.000% 4,992,392 0.995,000,000 Nordea Bank 16.01.12/0.000% 4,996,890 0.995,000,000 Nordea Bank 17.02.12/0.000% 4,991,745 0.99
10,000,000 Svenska Handelsbanken 30.01.12/0.000% 9,989,426 1.98
28,964,831 5.74
NETHERLANDS10,000,000 ING Groep 05.01.12/0.000% 9,998,224 1.984,000,000 ING Groep 09.01.12/0.000% 3,998,751 0.798,000,000 Paccar 05.01.12/0.000% 7,998,761 1.583,000,000 Paccar 27.01.12/0.000% 2,997,583 0.592,000,000 Paccar 16.02.12/0.000% 1,996,739 0.40
26,990,058 5.34
GERMANY4,500,000 Erste Abwicklungsanstalt 08.03.12/0.000% 4,491,512 0.898,000,000 Federal State Of North Rhine 23.01.12/0.000% 7,997,266 1.58
10,000,000 Germany (Federal Republic of) 08.03.12/0.000% 9,985,264 1.98
22,474,042 4.45
IRELAND6,000,000 General Electric Capital 05.03.12/0.000% 5,985,597 1.197,000,000 General Electric Capital 18.04.12/0.000% 6,969,459 1.38
12,955,056 2.57
NORWAY6,000,000 DnB Bank 23.01.12/0.000% 5,998,982 1.196,000,000 DnB Bank 23.03.12/0.000% 5,990,738 1.18
11,989,720 2.37
AUSTRALIA6,500,000 Commonwealth Bank of
Australia 27.02.12/0.000% 6,489,249 1.293,000,000 Commonwealth Bank of
Australia 09.05.12/0.000% 2,991,349 0.59
9,480,598 1.88
Total Commercial Paper 156,814,898 31.05
Certificates of Deposit
JAPAN5,000,000 Mitsubishi UFJ Financial Group 08.03.12/0.000% 4,989,912 0.997,000,000 Mitsubishi UFJ Financial Group 21.03.12/0.000% 6,976,081 1.385,000,000 Mizuho Financial Group 15.02.12/0.000% 6,991,162 1.385,000,000 Sumitomo Mitsui Financial Group 27.02.12/0.000% 4,992,875 0.999,000,000 Sumitomo Trust & Banking 14.02.12/0.000% 8,990,323 1.78
32,940,353 6.52
UNITED KINGDOM5,000,000 Bank of Nova Scotia 13.02.12/0.000% 4,995,063 0.995,000,000 Bank of Nova Scotia 11.05.12/0.000% 4,981,357 0.995,000,000 Barclays 16.01.12/0.000% 4,996,695 0.999,500,000 Barclays 16.01.12/0.500% 9,500,000 1.88
24,473,115 4.85
AUSTRIA6,000,000 Oesterreichische Kontrollbank 16.01.12/0.000% 5,997,315 1.19
5,997,315 1.19
NETHERLANDS5,000,000 Rabobank Nederland 22.02.12/0.000% 4,991,198 0.98
4,991,198 0.98
SWEDEN4,000,000 Svenska Handelsbanken 20.02.12/0.000% 3,992,012 0.80
3,992,012 0.80
Total Certificates of Deposit 72,393,993 14.34
Investment Funds
LUXEMBOURG39,070,000 JPMorgan Liquidity Funds - Euro Liquidity Fund (JPM
Euro Liquidity X (dist)) 39,070,000 7.74
39,070,000 7.74
Total Investment Funds 39,070,000 7.74
Total Transferable Securities Dealt in on AnotherRegulated Market
358,247,843 70.94
Other Transferable Securities
Bonds
UNITED STATES OF AMERICA5,000,000 Lehman Brothers Holdings
(Defaulted) 05.04.11/0.000% 1,350,000 0.27
1,350,000 0.27
Total Bonds 1,350,000 0.27
Total Other Transferable Securities 1,350,000 0.27
Total Investments 447,851,423 88.69
133
JPMorgan Investment Funds - Highbridge Statistical Market Neutral Fund
Schedule of Investments (Market Value Expressed in EUR)
As at 31 December 2011
Quantity/Nominal
Value
Name of Securities Maturity/Coupon
MarketValue
%of
NetAssets
Quantity/Nominal
Value
Name of Securities Maturity/Coupon
MarketValue
%of
NetAssets

Cash Equivalents
Time Deposits
FRANCE25,000,000 BNP Paribas 02.01.12/0.700% 25,000,000 4.9525,000,000 BPCE 02.01.12/0.450% 25,000,000 4.95
50,000,000 9.90
UNITED KINGDOM7,000,000 Lloyds TSB Bank 03.01.12/0.250% 7,000,000 1.38
7,000,000 1.38
Total Time Deposits 57,000,000 11.28
Total Cash Equivalents 57,000,000 11.28
Total Investments plus Total Cash Equivalents 504,851,423 99.97
Cash 203,941 0.04
Other Assets/(Liabilities) (39,918) (0.01)
Total Net Assets 505,015,446 100.00
* Variable coupon rates are those quoted as at 31 December 2011.
Allocation of Portfolio as at 31 December 2011 % ofNet Assets
Fixed Income SecuritiesUnited Kingdom 17.51Netherlands 17.21France 14.84Germany 10.05Sweden 6.54Japan 6.52Ireland 2.57Norway 2.37Australia 1.88Austria 1.19United States of America 0.27Total Fixed Income Securities 80.95Investment FundsLuxembourg 7.74Total Investment Funds 7.74Cash Equivalents, Cash and Other Assets/(Liabilities) 11.31
Total 100.00
Allocation of Portfolio as at 30 June 2011 (Unaudited) % ofNet Assets
Fixed Income SecuritiesFrance 29.87Netherlands 17.06Luxembourg 7.76United Kingdom 7.59Germany 7.03Sweden 5.59Belgium 3.33Finland 2.10Australia 1.80Denmark 1.00Canada 0.94Hong Kong 0.89Netherlands Antilles 0.78Ireland 0.67United States of America 0.57Japan 0.55Total Fixed Income Securities 87.53Cash Equivalents, Cash and Other Assets/(Liabilities) 12.47
Total 100.00
134
JPMorgan Investment Funds - Highbridge Statistical Market Neutral Fund
Schedule of Investments (Market Value Expressed in EUR) (continued)
As at 31 December 2011
Quantity/Nominal
Value
Name of Securities Maturity/Coupon
MarketValue
%of
NetAssets
Quantity/Nominal
Value
Name of Securities Maturity/Coupon
MarketValue
%of
NetAssets

JPMorgan Investment Funds - Highbridge Statistical Market Neutral Fund
Schedule of Investments - Outstanding Forward Foreign Exchange Contracts (Expressed in EUR)
As at 31 December 2011
SettlementDate Currency
AmountPurchased Currency
AmountSold
UnrealisedGain/(Loss)
13-Jan-12 CHF 1,495,758 EUR 1,209,475 19,50013-Jan-12 EUR 1,211,513 CHF 1,495,758 (17,463)13-Jan-12 EUR 1,430,056 GBP 1,226,382 (38,065)13-Jan-12 EUR 3,790,401 GBP 3,250,914 (101,318)13-Jan-12 EUR 31,177,072 SEK 281,686,290 (412,478)13-Jan-12 EUR 6,991,882 USD 9,229,629 (117,986)13-Jan-12 GBP 1,226,382 EUR 1,455,508 12,61313-Jan-12 GBP 29,004,176 EUR 34,007,028 714,32313-Jan-12 SEK 478,412,684 EUR 52,914,165 737,15613-Jan-12 USD 7,403,092 EUR 5,551,811 151,02030-Jan-12 EUR 569,045 USD 736,064 2,09730-Jan-12 USD 24,164,670 EUR 18,491,638 121,03513-Feb-12 EUR 23,797 GBP 20,006 (139)14-Feb-12 EUR 14,269 SEK 127,959 (54)
Total 1,070,241
Schedule of Investments - Outstanding Total Return Swaps (Expressed in EUR) (Please refer to note 2l)
EconomicExposure(in contractcurrency) Currency Sub-Fund Receives Sub-Fund Pays Counterparty
UnrealisedGain/(Loss)
6,936,132 CHF Performance of the underlying basket of equities CHF-1M-LIBOR +0.45% Merrill Lynch(4,140)
(2,453,455) CHF CHF-1M-LIBOR -0.35% Performance of the underlying basket of equities Merrill Lynch
4,882,697 CHF Performance of the underlying basket of equities CHF-1M-LIBOR + variable spread Morgan Stanley(646,807)
(10,224,057) CHF CHF-1M-LIBOR - variable spread Performance of the underlying basket of equities Morgan Stanley
22,346,944 DKK Performance of the underlying basket of equities DKK-1M-CIBOR-DKNA13 +0.45% Merrill Lynch(156,217)
(3,748,032) DKK DKK-1M-CIBOR-DKNA13 -0.35% Performance of the underlying basket of equities Merrill Lynch
12,495,158 DKK Performance of the underlying basket of equities DKK-1M-CIBOR-DKNA13 + variable spread Morgan Stanley(33,974)
(15,930,415) DKK DKK-1M-CIBOR-DKNA13 - variable spread Performance of the underlying basket of equities Morgan Stanley
40,808,419 EUR Performance of the underlying basket of equities EUR-1M-EURIBOR + 0.45% Merrill Lynch102,914
(15,739,801) EUR EUR-1M-EURIBOR - 0.35% Performance of the underlying basket of equities Merrill Lynch
45,819,826 EUR Performance of the underlying basket of equities EUR-1M-EURIBOR + variable spread Morgan Stanley1,081,303
(75,456,581) EUR EUR-1M-EURIBOR - variable spread Performance of the underlying basket of equities Morgan Stanley
2,597,368 GBP Performance of the underlying basket of equities GBP-1M-LIBOR +0.45% Merrill Lynch(112,008)
(24,175,884) GBP GBP-1M-LIBOR -0.35% Performance of the underlying basket of equities Merrill Lynch
44,294,935 GBP Performance of the underlying basket of equities GBP-1M-LIBOR + variable spread Morgan Stanley(196,016)
(22,550,104) GBP GBP-1M-LIBOR - variable spread Performance of the underlying basket of equities Morgan Stanley
18,395,686 NOK Performance of the underlying basket of equities NOK-1M-NIBOR-NIBR + 0.45% Merrill Lynch19,349
(3,176,838) NOK NOK-1M-NIBOR-NIBR - 0.35% Performance of the underlying basket of equities Merrill Lynch
18,894,353 NOK Performance of the underlying basket of equities NOK-1M-NIBOR-NIBR + variable spread Morgan Stanley90,634
(2,540,915) NOK NOK-1M-NIBOR-NIBR - variable spread Performance of the underlying basket of equities Morgan Stanley
37,569,265 SEK Performance of the underlying basket of equities SEK-1M-STIBOR-SIDE +0.45% Merrill Lynch(74,998)
(23,550,753) SEK SEK-1M-STIBOR-SIDE -0.35% Performance of the underlying basket of equities Merrill Lynch
61,357,742 SEK Performance of the underlying basket of equities SEK-1M-STIBOR-SIDE + variable spread Morgan Stanley(227,108)
(80,055,189) SEK SEK-1M-STIBOR-SIDE - variable spread Performance of the underlying basket of equities Morgan Stanley
348,501,676 USD Performance of the underlying basket of equities USD-1M-LIBOR + variable spread Morgan Stanley(598,981)
(354,374,594) USD USD-1M-LIBOR - variable spread Performance of the underlying basket of equities Morgan Stanley
76,210,998 USD Performance of the underlying basket of equities USD-LIBOR + 0.30% Merrill Lynch911,786
(71,733,177) USD USD-1M-LIBOR Performance of the underlying basket of equities Merrill Lynch
Total 155,737
135

Net Geographic Distribution based on Economic Exposure of Swap Portfolio(expressed in Sub-Fund Currency)
% ofTotal
NetAssets
Jersey 1.55Norway 0.86France 0.64Denmark 0.40Germany 0.38Cyprus 0.06Netherlands 0.06Guernsey 0.01Canada 0.00Italy 0.00Gibraltar (0.02)Luxembourg (0.02)Ireland (0.07)Sweden (0.10)Bermuda (0.11)Austria (0.13)Switzerland (0.14)Belgium (0.18)United States of America (0.21)Portugal (0.45)Finland (0.50)Spain (0.64)United Kingdom (1.50)
136
JPMorgan Investment Funds - Highbridge Statistical Market Neutral Fund
Schedule of Investments - Outstanding Total Return Swaps (Expressed in EUR) (Please refer to note 2l) (continued)
As at 31 December 2011

Transferable Securities Admitted to an Official Exchange Listing
Shares and Warrants
UNITED STATES OF AMERICA96,479 AbitibiBowater 1,398,945 0.0210,900 Ally Financial 144A Preference Shares 7,813,937 0.15
376,462 General Motors 7,634,649 0.14175,959 General Motors - Warrants 10.07.16 2,060,480 0.04175,959 General Motors - Warrants 10.07.19 1,391,836 0.0340,000 General Motors Preference Shares 1,368,000 0.0360,000 GMAC Capital Trust I 1,161,600 0.02111,544 M/I HOMES Preference Shares 1,262,678 0.02
141 Quad/Graphics 2,080 0.00140,343 US Concrete 376,821 0.01
24,471,026 0.46
NETHERLANDS10,129 LyondellBasell Industries - A Shares 331,522 0.01
331,522 0.01
Total Shares and Warrants 24,802,548 0.47
Bonds
UNITED STATES OF AMERICA2,125,000 ACCO Brands 15.03.15/10.625% 2,374,687 0.041,805,000 ACCO Brands 15.08.15/7.625% 1,850,125 0.031,675,000 AES 15.10.17/8.000% 1,839,870 0.034,475,000 Alcatel-Lucent USA 15.03.29/6.450% 3,233,187 0.062,345,000 American Axle & Manufacturing 01.03.17/7.875% 2,321,550 0.041,370,000 American Axle & Manufacturing 15.11.19/7.750% 1,349,450 0.035,900,000 American International Group 22.05.38/8.625%* 7,521,131 0.14
10,050,000 Anadarko Petroleum 15.09.17/6.375% 11,663,678 0.223,600,000 Arch Coal 01.08.16/8.750% 3,959,100 0.074,000,000 Arch Coal 01.10.20/7.250% 4,090,000 0.081,620,000 Ashtead Capital 144A 15.08.16/9.000% 1,696,950 0.03
16,550,000 Avaya 01.11.15/9.750% 14,977,750 0.282,000,000 BAC Capital Trust VII 10.08.35/5.250% 2,367,746 0.045,000,000 Bank of America 01.08.16/6.500% 5,035,925 0.09
475,000 Belden 15.03.17/7.000% 476,781 0.014,300,000 Cablevision Systems 15.09.17/8.625% 4,794,500 0.098,250,000 Catalent Pharma Solutions 15.04.17/9.750% 9,798,655 0.182,800,000 Cenveo 01.02.18/8.875% 2,457,000 0.052,510,000 Chesapeake Energy 15.08.20/6.625% 2,698,250 0.052,358,000 Chiquita Brands International 01.11.14/7.500% 2,396,317 0.054,205,000 Cincinnati Bell 15.10.20/8.375% 4,216,101 0.08
382,344 CIT Group 01.05.15/7.000% 383,179 0.018,853,030 CIT Group 01.05.16/7.000% 8,868,213 0.174,229,243 CIT Group 01.05.17/7.000% 4,239,816 0.081,669,000 Clean Harbors 15.08.16/7.625% 1,783,744 0.03
12,895,000 Community Health Systems 15.07.15/8.875% 13,340,587 0.252,700,000 Constellation Brands 01.09.16/7.250% 2,980,125 0.06
425,000 Corrections Corp. of America 15.03.13/6.250% 426,062 0.011,020,000 Corrections Corp. of America 31.01.14/6.750% 1,025,100 0.02
885,000 Corrections Corp. of Amercia 01.06.17/7.750% 964,650 0.022,225,000 Crown Castle International 15.01.15/9.000% 2,426,329 0.051,140,000 Dana Holding 15.02.19/6.500% 1,157,100 0.02
335,000 Dana Holding 15.02.21/6.750% 345,050 0.011,780,000 DaVita 01.11.18/6.375% 1,820,050 0.04
720,000 DaVita 01.11.20/6.625% 742,500 0.01240,000 Denbury Resources 15.02.20/8.250% 268,800 0.01653,000 Dole Food 15.03.14/13.875% 759,929 0.01
11,553,000 Dynegy Holdings 01.06.19/7.750% 7,405,357 0.14697,000 Dynegy Holdings 15.10.26/7.625% 449,565 0.01
5,860,000 Edison Mission Energy 15.05.17/7.000% 3,737,889 0.074,870,000 Edison Mission Energy 15.05.19/7.200% 3,068,100 0.062,240,000 El Paso 01.06.18/7.250% 2,479,859 0.051,180,000 Encore Acquisition 01.05.16/9.500% 1,303,900 0.02
12,840,000 Energy Future IntermediateHolding 01.12.20/10.000% 13,615,022 0.26
925,000 Fidelity National InformationServices 15.07.17/7.625% 1,005,937 0.02
195,000 Fidelity National InformationServices 15.07.20/7.875% 211,575 0.00
5,191,000 Ford Holdings 01.03.30/9.300% 6,402,969 0.12150,000 Ford Motor 01.08.26/7.500% 160,056 0.00750,000 Ford Motor 15.06.43/7.750% 757,500 0.01550,000 Ford Motor 15.02.47/9.980% 684,225 0.01500,000 Ford Motor Credit 01.06.12/7.800% 513,200 0.01
6,940,000 HCA 15.02.22/7.500% 7,130,850 0.131,000,000 Ford Motor Credit 01.06.14/8.000% 1,089,760 0.025,000,000 Ford Motor Credit 15.01.15/3.875% 4,997,500 0.091,000,000 Ford Motor Credit 15.09.15/5.625% 1,036,525 0.027,150,000 Ford Motor Credit 15.12.16/8.000% 8,139,989 0.157,925,000 Ford Motor Credit 15.08.17/6.625% 8,640,746 0.16
6,440,000 Ford Motor Credit 15.05.18/5.000% 6,468,272 0.12650,000 Ford Motor Credit 02.08.21/5.875% 676,370 0.01
2,460,000 Forest Oil 15.06.19/7.250% 2,503,050 0.051,185,000 Frontier Communications 15.03.15/6.625% 1,183,341 0.02
570,000 Frontier Communications 15.04.20/8.500% 582,825 0.012,375,000 General Cable 01.04.17/7.125% 2,380,937 0.042,200,000 Genworth Financial 15.06.20/7.700% 2,113,408 0.042,315,000 Geo Group 15.10.17/7.750% 2,471,262 0.051,550,000 Glatfelter 01.05.16/7.125% 1,612,976 0.031,700,000 Global Geophysical Services 01.05.17/10.500% 1,606,500 0.034,100,000 Goldman Sachs Group 01.08.15/3.700% 4,035,445 0.08
65,000 Goodyear Tire & Rubber 15.05.16/10.500% 72,090 0.003,650,000 Goodyear Tire & Rubber 15.08.20/8.250% 3,972,678 0.07
565,000 Goodyear Tire & Rubber 15.08.20/8.750% 621,500 0.011,240,000 Hanesbrands 15.12.16/8.000% 1,354,700 0.035,593,000 HCA 15.03.14/5.750% 5,714,088 0.111,808,000 HCA 15.01.15/6.375% 1,850,940 0.03
12,015,000 HCA 01.10.18/8.000% 12,690,844 0.24955,000 HCA 15.02.20/6.500% 996,781 0.02
2,940,000 Health Management Associates 15.04.16/6.125% 3,057,600 0.062,460,000 Healthsouth 01.10.18/7.250% 2,453,850 0.051,140,000 Healthsouth 15.09.22/7.750% 1,127,175 0.022,287,500 Homer City Funding 01.10.19/8.137% 2,013,000 0.041,528,640 Homer City Funding 01.10.26/8.734% 1,306,987 0.02
3,045,000 Host Hotels & Resorts 15.03.15/6.375% 3,113,512 0.062,708,000 Huntsman International 30.06.16/5.500% 2,665,809 0.051,585,000 International Lease Finance 15.05.16/5.750% 1,478,805 0.03
270,000 International Lease Finance 15.05.19/6.250% 247,761 0.006,108,000 International Lease Finance 15.12.20/8.250% 6,188,595 0.121,245,000 Iron Mountain 01.01.16/6.625% 1,252,781 0.022,960,000 Iron Mountain 15.07.18/8.750% 3,093,200 0.06
410,000 Jabil Circuit 15.07.16/7.750% 459,712 0.011,735,000 Jarden 01.05.16/8.000% 1,886,812 0.041,765,000 Jarden 01.05.17/7.500% 1,879,725 0.041,845,000 JC Penney 01.04.17/7.950% 2,020,275 0.04
550,000 JC Penney 15.02.18/5.750% 555,500 0.014,183,000 K Hovnanian Enterprises 15.10.16/10.625% 3,356,857 0.06
465,000 Lear 15.03.18/7.875% 505,687 0.01420,000 Lear 15.03.20/8.125% 464,100 0.01
2,660,000 Lennar 01.06.17/12.250% 3,178,700 0.06600,000 Ltd Brands 01.04.21/6.625% 639,000 0.01
1,565,000 Macy’s Retail Holdings 15.07.15/8.125% 1,837,513 0.032,445,000 Manitowoc 15.02.18/9.500% 2,616,150 0.051,305,000 Manitowoc 01.11.20/8.500% 1,381,669 0.033,565,000 Masco 15.03.20/7.125% 3,582,718 0.073,570,000 MetroPCS Wireless 01.09.18/7.875% 3,570,535 0.07
250,000 MGM Resorts International 01.04.13/6.750% 252,500 0.004,500,000 MGM Resorts International 27.02.14/5.875% 4,376,250 0.085,715,000 MGM Resorts International 15.07.15/6.625% 5,447,224 0.108,525,000 MGM Resorts International 01.06.16/7.500% 8,183,744 0.151,095,000 MGM Resorts International 15.01.17/7.625% 1,048,462 0.022,650,000 MGM Resorts International 15.11.17/11.125% 3,037,562 0.06
515,000 MGM Resorts International 01.03.18/11.375% 569,719 0.0113,750,000 Morgan Stanley 24.07.15/4.000% 12,967,075 0.24
750,000 Mueller Water Products 01.09.20/8.750% 818,437 0.022,250,000 Nextel Communications 01.08.15/7.375% 2,053,575 0.04
515,000 Owens-Brockway GlassContainer 15.05.16/7.375% 565,212 0.01
795,000 Parker Drilling 01.04.18/9.125% 838,725 0.021,859,000 PEP Boys-Manny Moe & Jack 15.12.14/7.500% 1,886,885 0.04
635,000 Petrohawk Energy 15.08.18/7.250% 717,550 0.015,000,000 Pinnacle Entertainment 15.05.20/8.750% 4,912,500 0.09
965,000 PolyOne 15.09.20/7.375% 996,362 0.023,410,000 Quiksilver 15.04.15/6.875% 3,184,087 0.062,370,000 Qwest Communications
International 15.02.14/7.500% 2,385,182 0.042,245,000 Qwest Communications
International 15.02.14/7.500% 2,259,381 0.041,625,000 RailAmerica 01.07.17/9.250% 1,783,437 0.031,180,000 Regions Bank 15.05.18/7.500% 1,180,000 0.022,190,000 Rite Aid 12.06.16/9.750% 2,387,724 0.047,380,000 Rite Aid 01.03.17/7.500% 7,416,900 0.14
18,565,000 Rite Aid 15.06.17/9.500% 16,986,975 0.32295,000 Rite Aid 15.10.19/10.250% 326,344 0.01
13,279,000 RSC Equipment Rental 01.12.14/9.500% 13,710,567 0.262,350,000 Scotts Miracle-Gro 15.01.18/7.250% 2,479,250 0.054,385,000 Sealy Mattress 15.06.14/8.250% 4,363,075 0.081,520,000 Select Medical 01.02.15/7.625% 1,444,000 0.03
530,000 Service Corp. International 01.04.15/6.750% 572,400 0.013,325,000 Service Corp. International 01.04.16/6.750% 3,620,094 0.07
155,000 Service Corp. International 15.06.17/7.000% 168,950 0.00680,000 Service Corp. International 01.10.18/7.625% 759,900 0.02
1,495,000 Service Corp. International 15.05.19/7.000% 1,580,962 0.031,688,000 Smithfield Foods 15.05.13/7.750% 1,801,940 0.033,000,000 Smithfield Foods 01.07.17/7.750% 3,303,750 0.06
670,000 Solutia 01.11.17/8.750% 733,650 0.01
137
JPMorgan Investment Funds - Income Opportunity Fund
Schedule of Investments (Market Value Expressed in USD)
As at 31 December 2011
Quantity/Nominal
Value
Name of Securities Maturity/Coupon
MarketValue
%of
NetAssets
Quantity/Nominal
Value
Name of Securities Maturity/Coupon
MarketValue
%of
NetAssets

1,780,000 Spirit Aerosystems 01.10.17/7.500% 1,940,200 0.0412,597,000 Springleaf Finance 15.12.17/6.900% 9,015,043 0.17
655,000 Sprint Capital 01.05.19/6.900% 539,009 0.0114,275,000 Sprint Capital 15.03.32/8.750% 11,616,281 0.222,400,000 Standard Pacific 15.05.18/8.375% 2,286,000 0.04
865,000 Starwood Hotels & ResortsWorldwide 15.10.14/7.875% 975,287 0.02
880,000 Starwood Hotels & ResortsWorldwide 15.05.18/6.750% 998,800 0.02
1,150,000 Supervalu 15.11.14/7.500% 1,175,875 0.022,895,000 Supervalu 01.05.16/8.000% 2,990,390 0.06
720,000 Tenet Healthcare 01.05.18/10.000% 826,200 0.021,210,000 Tenet Healthcare 01.07.19/8.875% 1,364,275 0.033,715,000 Tenet Healthcare 01.08.20/8.000% 3,733,575 0.073,555,000 Terex 15.11.17/8.000% 3,475,599 0.07
405,000 Triumph Group 15.07.18/8.625% 445,500 0.012,250,000 United Rentals North America 15.06.16/10.875% 2,508,750 0.051,730,000 United Rentals North America 15.12.19/9.250% 1,820,825 0.043,025,000 United Rentals North America 15.09.20/8.375% 2,951,674 0.06
515,000 Vulcan Materials 01.12.16/6.500% 534,312 0.012,019,000 Wachovia Capital Trust III 31.12.49/5.570%* 1,688,389 0.03
215,000 Whiting Petroleum 01.10.18/6.500% 225,481 0.00
486,554,361 9.15
IRELAND10,000,000 Ardagh Packaging Finance 144A 15.10.17/7.375% 12,785,792 0.24
5,950,000 Elan Finance 15.10.16/8.750% 6,370,219 0.12
19,156,011 0.36
NETHERLANDS660,000 Hertz Holdings Netherlands 31.07.15/8.500% 885,982 0.01
1,600,000 Hertz Holdings Netherlands 144A 31.07.15/8.500% 2,144,378 0.042,675,000 RBS 09.03.15/1.240%* 1,994,828 0.04
5,025,188 0.09
LUXEMBOURG3,185,000 MagnaChip Semiconductor
Finance 15.04.18/10.500% 3,328,325 0.065,650,000 Wind Acquisition Finance 144A 15.02.18/7.250% 5,127,375 0.10
8,455,700 0.16
LIBERIA1,600,000 Royal Caribbean Cruises 15.06.13/7.000% 1,687,592 0.03
56,000 Royal Caribbean Cruises 01.12.13/6.875% 59,473 0.002,212,000 Royal Caribbean Cruises 15.07.15/11.875% 2,621,220 0.05
2,456,000 Royal Caribbean Cruises 15.06.16/7.250% 2,663,507 0.05
7,031,792 0.13
NORWAY43,109,375 Boa Deep 27.04.16/8.660%* 6,774,917 0.13
6,774,917 0.13
UNITED KINGDOM1,688,000 RBS 14.10.16/1.181%* 1,166,670 0.021,000,000 Towergate Finance 144A 15.02.18/8.500% 1,375,467 0.023,250,000 Towergate Finance 144A 15.02.19/10.500% 4,091,431 0.08
6,633,568 0.12
JAPAN4,500,000 eAccess 01.04.18/8.375% 5,086,246 0.091,000,000 eAccess 144A 01.04.18/8.250% 955,000 0.02
6,041,246 0.11
MARSHALL ISLANDS23,000,000 Teekay Offshore Partners 29.11.13/7.990%* 3,859,738 0.08
3,859,738 0.08
BERMUDA2,190,000 Aircastle 01.08.18/9.750% 2,304,975 0.05
2,304,975 0.05
FRANCE1,950,000 CMA CGM 144A 15.04.17/8.500% 877,500 0.011,660,000 CMA CGM 144A 15.04.19/8.875% 937,322 0.02
1,814,822 0.03
GERMANY1,500,000 Kinove German Bondco 144A 15.06.18/9.625% 1,417,500 0.03
1,417,500 0.03
MEXICO1,000,000 Cemex SAB de 144A 30.09.15/5.579%* 753,750 0.01
753,750 0.01
CANADA625,000 Nova Chemicals 01.11.19/8.625% 690,625 0.01
690,625 0.01
Total Bonds 556,514,193 10.46
Total Transferable Securities Admitted to anOfficial Exchange Listing
581,316,741 10.93
Transferable Securities Dealt in on Another Regulated Market
Shares
UNITED STATES OF AMERICA50,000 CoBank ACB 144A Preference Shares 2,284,375 0.0469,000 CoBank ACB Preference Shares 3,730,312 0.07
6,014,687 0.11
Total Shares 6,014,687 0.11
Bonds
UNITED STATES OF AMERICA12,801,000 AbitibiBowater 144A 15.10.18/10.250% 14,177,107 0.272,560,000 Academy Finance 144A 01.08.19/9.250% 2,540,800 0.052,750,000 Accellent 01.02.17/8.375% 2,708,750 0.051,640,000 Accellent 01.11.17/10.000% 1,336,600 0.033,205,000 ACE Cash Express 144A 01.02.19/11.000% 2,948,600 0.063,387,133 ACE Securities 2005-HE4 M1 25.07.35/0.794%* 3,294,256 0.06
2,245,000 AES 15.04.16/9.750% 2,581,750 0.054,000,000 AES Eastern Energy 02.01.29/9.670% 1,580,000 0.035,000,000 Affinia Group 30.11.14/9.000% 4,975,000 0.09
330,000 Aleris International 15.02.18/7.625% 322,162 0.013,910,000 Allison Transmission 144A 15.05.19/7.125% 3,831,800 0.071,800,000 Ally Financial 28.08.12/6.875% 1,827,000 0.031,525,000 Ally Financial 31.12.13/7.500% 1,576,087 0.03
4,560,000 Ally Financial 01.12.14/6.750% 4,588,979 0.099,580,000 Ally Financial 01.12.17/6.250% 9,069,099 0.174,000,000 Ally Financial 15.09.20/7.500% 4,032,000 0.083,850,000 Ally Financial 01.11.31/8.000% 3,759,737 0.072,245,000 AMC Entertainment 01.06.19/8.750% 2,334,800 0.042,100,000 AMC Entertainment 01.12.20/9.750% 2,005,500 0.044,850,000 American Airlines 2011-2 Class A
Pass Through Trust 15.10.21/8.625% 4,947,000 0.09938,617 American Airlines Pass Through
Trust 09-1A 02.07.19/10.375% 985,548 0.02640,057 American Airlines Pass Through
Trust 2001-01 23.05.19/7.377% 115,210 0.00787,000 American Axle & Manufacturing
Holdings 144A 15.01.17/9.250% 857,830 0.021,166,110 American Home Mortgage
Assets 2006-2 2A1 25.09.46/0.484%* 551,454 0.01950,000 American Standard Americas 144A 15.01.16/10.750% 570,000 0.01
1,305,000 American Tire Distributors 01.06.17/9.750% 1,350,675 0.031,330,000 Ameristar Casinos 15.04.21/7.500% 1,369,900 0.032,885,000 Amkor Technology 01.05.18/7.375% 2,949,624 0.062,248,451 Amresco Residential Securities
Mortgage Loan Trust 1998-3 M1A 25.09.28/0.924%* 1,675,199 0.031,170,000 Amsted Industries 144A 15.03.18/8.125% 1,246,050 0.027,773,000 Appleton Papers 144A 15.06.15/10.500% 7,704,986 0.151,000,000 Aptalis Pharma 01.03.16/12.750% 1,060,000 0.02
500,000 Aptalis Pharma 01.03.16/12.750% 530,000 0.01755,000 Arch Coal 144A 15.06.19/7.000% 775,762 0.01
1,900,000 Arch Coal 144A 15.06.21/7.250% 1,957,000 0.041,125,000 Ashland 01.06.17/9.125% 1,260,000 0.02
1,590,000 Aspect Software 07.05.17/10.625% 1,649,625 0.03680,380 Asset Backed Funding
Certificates 2005-HE2 M1 25.06.35/0.774%* 667,756 0.01768,571 Asset Backed Funding
Certificates 2005-OPT1 A2C 25.07.35/0.654%* 720,641 0.01950,909 Asset Backed Securities Corp
Home Equity 2005-HE4 M1 25.05.35/0.606%* 934,157 0.022,100,000 Associated Materials 01.11.17/9.125% 1,842,750 0.032,590,000 Atkore International 01.01.18/9.875% 2,499,350 0.051,695,000 Audatex North America 144A 15.06.18/6.750% 1,720,425 0.03
925,781 Avaya 01.11.15/10.125%* 837,832 0.022,150,000 Avaya 144A 01.04.19/7.000% 2,096,250 0.041,646,000 Avis Budget Car Rental 15.05.14/2.957%* 1,547,240 0.033,000,000 Avis Budget Car Rental 15.05.16/7.750% 3,037,500 0.062,275,000 Avis Budget Car Rental 15.03.18/9.625% 2,366,000 0.04
4,050,000 Avis Budget Car Rental / AvisBudget Finance 15.01.19/8.250% 4,031,856 0.08
138
JPMorgan Investment Funds - Income Opportunity Fund
Schedule of Investments (Market Value Expressed in USD) (continued)
As at 31 December 2011
Quantity/Nominal
Value
Name of Securities Maturity/Coupon
MarketValue
%of
NetAssets
Quantity/Nominal
Value
Name of Securities Maturity/Coupon
MarketValue
%of
NetAssets

5,566,675 Banc of America AlternativeLoan Trust 2004-1 1A1 25.02.34/6.000% 5,877,334 0.11
2,908,317 Banc of America AlternativeLoan Trust 2004-12 2CB1 25.01.35/6.000% 3,024,801 0.06
3,004,149 Banc of America AlternativeLoan Trust 2005-2 2CB1 25.03.35/6.000% 2,671,896 0.05
3,600,205 Banc of America AlternativeLoan Trust 2006-4 2A1 25.05.21/6.000% 3,394,610 0.06
2,145,007 Banc of America Funding2006-1 2A1 25.01.36/5.500% 2,021,089 0.04
3,973,406 Banc of America Funding2006-3 4A19 25.03.36/5.750% 3,889,390 0.07
15,380,728 Banc of America Large Loan2010-HLTN HLTN 15.11.15/2.028%* 13,928,241 0.26
2,200,000 Banc of America Merrill LynchCommercial Mortgage 2005-3 A4 10.07.43/4.668% 2,388,495 0.04
1,441,990 Banc of America MortgageSecurities 2005-10 1A13 25.11.35/5.500% 1,371,961 0.03
2,431,566 Banc of America MortgageSecurities 2005-11 2A1 25.12.20/5.250% 2,422,235 0.05
8,449,507 Banc of America MortgageSecurities 2007-3 1A1 25.09.37/6.000% 7,306,669 0.14
11,312,000 Bank of America 31.12.49/8.000%* 9,923,395 0.19901,000 BankAmerica Institutional
Capital B 144A 31.12.26/7.700% 804,142 0.021,245,000 Bausch & Lomb 01.11.15/9.875% 1,311,919 0.02
211,000 Belden 15.06.19/9.250% 226,297 0.003,227,000 Berry Plastics 15.05.18/9.500% 3,251,202 0.061,500,000 Berry Plastics 15.01.21/9.750% 1,507,500 0.03
10,625,000 Biomet 15.10.17/10.375% 11,581,250 0.221,415,000 Bon-Ton Department Stores 15.03.14/10.250% 894,216 0.021,830,000 BreitBurn Energy Partners /
BreitBurn Finance 15.10.20/8.625% 1,921,500 0.04957,000 Brigham Exploration 01.10.18/8.750% 1,177,110 0.02
1,245,000 Building Materials Corp ofAmerica 144A 15.08.18/6.875% 1,307,250 0.02
1,100,000 Building Materials of America 144A 01.05.21/6.750% 1,146,750 0.024,401,000 Bumble Bee Acquisition 144A 15.12.17/9.000% 4,489,020 0.081,000,000 Burger King 15.10.18/9.875% 1,092,890 0.022,300,000 BWAY Holding 15.06.18/10.000% 2,461,000 0.05
17,245,000 Caesars EntertainmentOperating 01.06.17/11.250% 18,387,481 0.35
1,940,000 Caesars EntertainmentOperating 15.12.18/10.000% 1,338,600 0.03
1,165,000 Calpine 144A 15.10.17/7.250% 1,229,075 0.022,945,000 Calpine 144A 31.07.20/7.875% 3,187,962 0.062,408,000 Calpine 144A 15.02.21/7.500% 2,588,600 0.051,100,000 Calpine 144A 15.01.23/7.875% 1,188,000 0.02
555,000 Calumet Finance 144A 01.05.19/9.375% 541,125 0.01777,919 Capmark Financial Group 30.09.14/7.000%* 784,726 0.01
6,250,736 Catalent Pharma Solutions 15.04.15/9.500%* 6,453,885 0.12950,000 CCH II Capital 30.11.16/13.500% 1,100,812 0.02
1,355,000 CCO Holdings 01.06.20/7.375% 1,431,219 0.032,395,000 CCO Holdings Capital 30.10.17/7.250% 2,535,706 0.055,240,000 CCO Holdings Capital 30.04.18/7.875% 5,606,800 0.112,030,000 CCO Holdings Capital 15.01.19/7.000% 2,126,425 0.042,000,000 CCO Holdings Capital 30.04.21/6.500% 2,035,000 0.044,792,000 Cemex Finance 144A 14.12.17/9.625% 4,774,046 0.091,669,630 Centex Home Equity 2005-C AF6 25.06.35/4.638%* 1,617,728 0.034,260,000 Central Garden and Pet 01.03.18/8.250% 4,196,100 0.08
917,000 Cenveo 144A 15.08.16/10.500% 776,011 0.015,670,000 Cequel Communications Holdings I
and Cequel Capital 144A 15.11.17/8.625% 5,967,675 0.11400,000 Chemtura 01.09.18/7.875% 414,000 0.01
1,560,000 Chesapeake OilfieldOperating/Chesapeake OilfieldFinance 144A 15.11.19/6.625% 1,630,200 0.03
4,295,000 Chrysler Group Co-Issuer 144A 15.06.19/8.000% 3,962,137 0.0717,550,000 Chrysler Group Co-Issuer 144A 15.06.21/8.250% 16,146,000 0.301,250,000 Chukchansi Economic
Development Authority 144A 15.11.12/4.159%* 793,750 0.016,350,000 Chukchansi Economic
Development Authority 144A 15.11.13/8.000% 4,127,500 0.08820,000 Cinemark USA 15.06.21/7.375% 842,550 0.02
1,750,000 CIT Group 144A 01.04.18/6.625% 1,828,750 0.034,700,000 CIT Group 144A 02.05.16/7.000% 4,701,950 0.095,000,000 CIT Group 144A 02.05.17/7.000% 4,997,925 0.091,500,000 Citgo Petroleum 144A 01.07.17/11.500% 1,672,500 0.03
759,740 Citicorp Mortgage Securities2007-2 1A5 25.02.37/5.750% 753,529 0.01
1,500,000 Citicorp Residential MortgageSecurities 2006-1 A4 25.07.36/5.939%* 1,424,323 0.03
909,730 Citigroup Mortgage Loan Trust2005-WF2 AF4 25.08.35/4.964%* 867,182 0.02
2,576,482 Citigroup Mortgage Loan Trust2006-4 1A1 25.12.20/5.500% 2,293,274 0.04
1,358,927 Citigroup Mortgage Loan Trust2007-AMC1 A2A 25.12.36/0.334%* 1,067,525 0.02
2,726,986 Citimortgage Alternative LoanTrust 2006-A1 1A5 25.04.36/5.500% 1,950,685 0.04
879,673 Citimortgage Alternative LoanTrust 2006-A1 1A6 25.04.36/6.000% 641,229 0.01
995,239 Citimortgage Alternative LoanTrust 2007-A1 1A7 25.01.37/6.000% 619,076 0.01
4,341,426 Citimortgage Alternative LoanTrust 2007-A6 1A5 25.06.37/6.000% 2,955,161 0.06
6,945,000 CityCenter Finance 144A 15.01.16/7.625% 7,153,350 0.1315,076,612 CityCenter Finance 144A 15.01.17/10.750% 15,604,293 0.298,331,000 CKE Restaurants 15.07.18/11.375% 9,122,445 0.171,905,000 Claire’s Stores 15.03.19/8.875% 1,457,325 0.03
13,030,000 Clear Channel Communications 01.03.21/9.000% 11,042,925 0.2112,015,000 Clear Channel Worldwide
Holdings 15.12.17/9.250% 13,036,275 0.252,000,000 Clear Channel Worldwide
Holdings 15.12.17/9.250% 2,160,000 0.041,320,000 Clearwater Paper 15.06.16/10.625% 1,478,400 0.03
120,000 Clearwater Paper 01.11.18/7.125% 125,400 0.0014,021,000 Clearwire Finance 144A 01.12.15/12.000% 13,390,055 0.256,700,000 Clearwire Finance 144A 01.12.15/12.000% 6,398,500 0.121,640,000 Cloud Peak Energy Resources 15.12.17/8.250% 1,754,800 0.036,020,000 CNG Holdings 144A 15.02.15/12.250% 6,230,700 0.121,610,000 CNH Capital 144A 01.11.16/6.250% 1,666,350 0.03
4,430,000 CNL Lifestyle Properties 15.04.19/7.250% 4,119,900 0.081,285,000 Cogent Communications Group 144A 15.02.18/8.375% 1,326,762 0.021,608,000 Colt Defense 144A 15.11.17/8.750% 1,117,560 0.021,801,000 Commercial Barge Line 15.07.17/12.500% 1,945,080 0.04
3,000,000 Commercial Mortgage PassThrough Certificates 2011-THL D 09.06.28/5.605% 3,009,213 0.06
1,000,000 Commercial Mortgage PassThrough Certificates 2011-THL E 09.06.28/5.949% 997,333 0.02
3,195,000 CommScope 144A 15.01.19/8.250% 3,195,000 0.06920,000 Community Choice Financial 144A 01.05.19/10.750% 913,100 0.02640,000 Consol Energy 01.04.17/8.000% 704,000 0.01470,000 Consol Energy 01.04.20/8.250% 520,525 0.01
5,945,247 Continental Airlines 2003-ERJ1 02.07.18/7.875% 5,796,615 0.113,139,439 Continental Airlines 2004-ERJ1 01.09.19/9.558% 3,249,320 0.066,057,426 Continental Airlines 2005-ERJ1 01.04.21/9.798% 6,269,436 0.122,425,144 Continental Airlines
2006-ERJ1 144A 01.11.19/9.318% 2,449,395 0.051,578,552 Countrywide Alternative Loan
Trust 2004-5CB 2A1 25.05.19/5.000% 1,616,762 0.03858,911 Countrywide Alternative Loan
Trust 2005-28CB 1A5 25.08.35/5.500% 843,832 0.027,393,283 Countrywide Alternative Loan
Trust 2005-28CB 1A6 25.08.35/5.500% 6,359,103 0.121,403,679 Countrywide Alternative Loan
Trust 2005-50CB 4A1 25.11.20/5.000% 1,209,826 0.027,045,837 Countrywide Alternative Loan
Trust 2005-70CB A5 25.12.35/5.500% 5,598,213 0.112,213,533 Countrywide Alternative Loan
Trust 2005-J11 5A1 25.11.20/5.500% 1,954,846 0.042,146,359 Countrywide Alternative Loan
Trust 2005-J3 3A1 25.09.34/6.500% 2,081,561 0.044,331,875 Countrywide Alternative Loan
Trust 2005-J6 2A1 25.07.25/5.500% 4,024,732 0.083,102,971 Countrywide Alternative Loan
Trust 2006-19CB A15 25.08.36/6.000% 2,248,793 0.042,909,092 Countrywide Alternative Loan
Trust 2006-24CB A1 25.06.36/6.000% 2,492,895 0.056,600,634 Countrywide Alternative Loan
Trust 2006-24CB A23 25.06.36/6.000% 4,506,592 0.081,280,003 Countrywide Alternative Loan
Trust 2006-28CB A17 25.10.36/6.000% 799,050 0.025,357,993 Countrywide Alternative Loan
Trust 2006-31CB A3 25.11.36/6.000% 3,820,265 0.071,254,457 Countrywide Alternative Loan
Trust 2006-41CB 2A17 25.01.37/6.000% 821,232 0.02464,995 Countrywide Alternative Loan
Trust 2006-J3 2A1 25.12.20/4.750% 421,377 0.011,511,574 Countrywide Alternative Loan
Trust 2007-5CB 1A31 25.04.37/5.500% 862,298 0.02495,923 Countrywide Alternative Loan
Trust 2008-2R 2A1 25.08.37/6.000% 370,970 0.011,250,000 Countrywide Asset-Backed
Certificates 2005-12 1A4 25.02.36/5.323%* 1,195,613 0.022,142,209 Countrywide Home Loan
Mortgage Pass Through Trust2005-10 A1 25.05.35/5.500% 2,095,251 0.04
2,876,753 Countrywide Home LoanMortgage Pass Through Trust2005-20 A7 25.12.27/5.250% 2,563,072 0.05
1,020,089 Countrywide Home LoanMortgage Pass Through Trust2005-21 A2 25.10.35/5.500% 906,871 0.02
3,194,703 Countrywide Home LoanMortgage Pass Through Trust2006-15 A1 25.10.36/6.250% 2,631,474 0.05
139
JPMorgan Investment Funds - Income Opportunity Fund
Schedule of Investments (Market Value Expressed in USD) (continued)
As at 31 December 2011
Quantity/Nominal
Value
Name of Securities Maturity/Coupon
MarketValue
%of
NetAssets
Quantity/Nominal
Value
Name of Securities Maturity/Coupon
MarketValue
%of
NetAssets

2,447,905 Countrywide Home LoanMortgage Pass Through Trust2006-20 1A36 25.02.37/5.750% 2,049,286 0.04
11,546,090 Countrywide Home LoanMortgage Pass Through Trust2007-16 A1 25.10.37/6.500% 9,842,869 0.19
9,899,795 Countrywide Home LoanMortgage Pass Through Trust2007-17 1A1 25.10.37/6.000% 8,790,047 0.17
2,809,818 Crédit Suisse First BostonMortgage Securities 2003-AR242A4 25.10.33/2.560%* 2,359,533 0.04
767,039 Crédit Suisse First BostonMortgage Securities2004-AR3 6M1 25.04.34/1.394%* 703,958 0.01
1,939,998 Credit-Based Asset Servicingand Securitization2005-CB4 AF4 25.08.35/5.028%* 1,905,520 0.04
1,530,000 Cricket Communications 15.10.20/7.750% 1,344,174 0.032,685,000 Crosstex Energy 15.02.18/8.875% 2,940,075 0.065,645,000 Del Monte 15.02.19/7.625% 5,419,200 0.101,403,098 Delta Air Lines 2007-1 C 10.08.14/8.954% 1,399,590 0.031,175,976 Deutsche ALT-A Securities
Alternate Loan Trust 2005-1 2A1 25.02.20/5.579%* 1,202,237 0.021,320,000 DineEquity 30.10.18/9.500% 1,423,950 0.037,600,000 Discover Bank 18.11.19/8.700% 8,666,212 0.163,945,000 DISH DBS 01.02.16/7.125% 4,272,021 0.0810,135,000 DISH DBS 01.09.19/7.875% 11,520,556 0.22
1,615,000 DISH DBS 01.06.21/6.750% 1,748,238 0.031,710,000 DJO Finance 15.04.18/7.750% 1,320,975 0.02
2,460,000 DJO Finance 15.11.14/10.875% 2,312,400 0.041,310,000 Dole Food 144A 01.10.16/8.000% 1,370,588 0.036,115,000 Downstream Development
Authority of the Quapaw Tribeof Oklahoma 144A 01.07.19/10.500% 5,824,538 0.11
2,825,000 Eagle Parent 144A 01.05.19/8.625% 2,683,750 0.052,480,000 Eagle Rock Energy Partners /
Eagle Rock Energy Finance 144A 01.06.19/8.375% 2,480,000 0.054,480,000 Easton-Bell Sports 01.12.16/9.750% 4,894,400 0.091,065,000 EH Holding 144A 15.06.19/6.500% 1,110,263 0.02
530,000 EH Holding 144A 15.06.21/7.625% 553,188 0.01620,000 Endo Pharmaceuticals Holdings 15.07.19/7.000% 661,850 0.01
1,240,000 Energy Future Holdings 15.01.20/10.000% 1,308,200 0.021,850,000 EV Energy Partners / EV Energy
Finance 15.04.19/8.000% 1,887,000 0.042,161,831 Fannie Mae Interest Strip 366 18 01.10.35/4.000% 181,079 0.00
2,907,998 Fannie Mae Interest Strip 377 2 01.10.36/5.000% 431,705 0.014,225,279 Fannie Mae Interest Strip 379 2 01.05.37/5.500% 532,969 0.01
11,008,903 Fannie Mae Interest Strip 390 C7 25.07.23/4.000% 789,435 0.0117,177,344 Fannie Mae Interest Strip 390 C8 25.07.23/4.500% 1,433,445 0.034,414,746 Fannie Mae REMICS 2003-22 IO 25.04.33/6.000% 701,412 0.016,683,379 Fannie Mae REMICS 2003-80 DI 25.10.31/5.500% 616,255 0.012,259,733 Fannie Mae REMICS 2004-17 DS 25.11.32/6.856%* 173,588 0.001,878,812 Fannie Mae REMICS 2004-41 SA 25.02.32/6.856%* 128,169 0.00536,839 Fannie Mae REMICS 2004-52 SX 25.09.32/6.756%* 42,454 0.00
4,725,592 Fannie Mae REMICS 2004-60 SW 25.04.34/6.756%* 728,063 0.011,579,732 Fannie Mae REMICS 2004-61 NS 25.08.34/7.406%* 358,069 0.01
4,080,834 Fannie Mae REMICS 2004-72 S 25.09.34/6.206%* 726,218 0.013,565,128 Fannie Mae REMICS 2004-92 SQ 25.05.34/6.356%* 504,041 0.012,080,112 Fannie Mae REMICS 2005-13 AS 25.03.35/5.806%* 269,546 0.01
4,376,089 Fannie Mae REMICS 2005-23 SG 25.04.35/6.406%* 769,735 0.016,169,808 Fannie Mae REMICS 2005-57 DI 25.03.35/6.406%* 769,077 0.0116,131,079 Fannie Mae REMICS 2005-74 SE 25.09.35/5.806%* 2,279,225 0.047,514,240 Fannie Mae REMICS 2005-79 NS 25.09.35/5.796%* 1,101,107 0.029,412,114 Fannie Mae REMICS 2005-82 SY 25.09.35/6.436%* 1,706,103 0.036,071,711 Fannie Mae REMICS 2005-90 SP 25.09.35/6.456%* 850,982 0.02
2,564,228 Fannie Mae REMICS 2006-106 CS 25.11.36/6.296%* 425,256 0.012,514,446 Fannie Mae REMICS 2006-108 S 25.11.36/6.906%* 475,386 0.014,191,636 Fannie Mae REMICS 2006-109 SG 25.11.36/6.336%* 709,455 0.016,808,415 Fannie Mae REMICS 2006-113 PQ 25.07.36/6.356%* 865,412 0.024,112,675 Fannie Mae REMICS 2006-20 IG 25.04.36/6.356%* 673,086 0.01
4,892,387 Fannie Mae REMICS 2006-3 SB 25.07.35/6.406%* 759,265 0.0112,827,764 Fannie Mae REMICS 2006-43 SD 25.06.36/6.306%* 1,794,139 0.038,717,989 Fannie Mae REMICS 2006-56 SA 25.11.35/5.196%* 922,403 0.02
22,285,530 Fannie Mae REMICS 2006-58 SI 25.07.36/6.246%* 3,375,226 0.0610,886,229 Fannie Mae REMICS 2006-70 JI 25.06.36/6.306%* 1,605,257 0.03
1,908,581 Fannie Mae REMICS 2006-72 XI 25.08.36/6.206%* 251,380 0.006,743,067 Fannie Mae REMICS 2007-109 GI 25.12.37/5.776%* 1,133,945 0.02
19,336,076 Fannie Mae REMICS 2007-33 SD 25.04.37/5.816%* 3,001,187 0.0617,864,903 Fannie Mae REMICS 2007-36 SB 25.04.37/6.306%* 3,041,205 0.069,844,042 Fannie Mae REMICS 2007-55 S 25.06.37/6.466%* 1,782,906 0.032,724,406 Fannie Mae REMICS 2007-88 MI 25.09.37/6.226%* 464,242 0.016,973,465 Fannie Mae REMICS 2008-17 KS 25.11.37/6.056%* 974,402 0.023,041,548 Fannie Mae REMICS 2008-41 S 25.11.36/6.506%* 535,569 0.0111,641,942 Fannie Mae REMICS 2008-61 S 25.07.38/5.806%* 1,714,464 0.0315,616,892 Fannie Mae REMICS 2008-71 SB 25.10.29/6.191%* 1,206,172 0.0231,870,295 Fannie Mae REMICS 2008-92 SA 25.12.38/6.156%* 5,700,009 0.1125,116,372 Fannie Mae REMICS 2009-110 SD 25.01.40/6.956%* 4,325,665 0.08
30,500,747 Fannie Mae REMICS 2009-87 SG 25.11.39/5.956%* 4,734,973 0.0911,538,066 Fannie Mae REMICS 2009-95 HI 25.12.38/6.000% 1,668,037 0.037,690,336 Fannie Mae REMICS 2010-102 S 25.09.40/6.256%* 1,263,859 0.02
24,997,333 Fannie Mae REMICS 2010-107 PS 25.06.40/6.336%* 4,346,731 0.0811,622,964 Fannie Mae REMICS 2010-107 SP 25.06.40/6.356%* 2,072,198 0.0420,760,771 Fannie Mae REMICS 2010-131 SA 25.11.40/6.306%* 3,558,296 0.0744,411,974 Fannie Mae REMICS 2010-134 SB 25.08.38/5.806%* 5,077,976 0.1021,616,202 Fannie Mae REMICS 2010-135 SE 25.01.40/5.696%* 3,345,492 0.0623,377,644 Fannie Mae REMICS 2010-136 CS 25.06.38/5.706%* 2,553,234 0.0533,630,214 Fannie Mae REMICS 2010-139 SA 25.12.40/5.736%* 5,338,020 0.1026,391,343 Fannie Mae REMICS 2010-99 SD 25.03.39/5.806%* 3,084,332 0.0618,867,540 Fannie Mae REMICS 2011-118 CS 25.10.39/6.206%* 2,932,944 0.0639,786,287 Fannie Mae REMICS 2011-86 KS 25.09.41/5.656%* 5,634,176 0.11
9,191,957 Fannie Mae REMICS 2011-93 ES 25.09.41/6.206%* 1,668,387 0.0340,000,000 Federal Home Loan Mortgage 04.02.13/0.245%* 40,027,640 0.75
5,780,865 FGI Holding 01.10.15/11.250%* 5,766,413 0.11820,000 Fidelity National Information
Services 144A 15.07.17/7.625% 887,650 0.024,283,000 FireKeepers Development
Authority 144A 01.05.15/13.875% 4,882,620 0.093,183,000 First Data 24.09.15/9.875% 3,007,935 0.063,450,000 First Data 144A 15.06.19/7.375% 3,247,313 0.063,225,000 First Data 144A 15.08.20/8.875% 3,220,969 0.063,905,000 First Data 144A 15.01.21/8.250% 3,475,450 0.078,978,000 First Data 144A 15.01.21/12.625% 7,833,305 0.158,521,000 First Data 144A 15.01.22/8.750%* 7,370,665 0.141,450,140 First Horizon Alternative Mortgage
Securities 2006-FA7 A1 25.12.36/5.750% 979,027 0.023,739,954 First Horizon Asset Securities
2007-5 A4 25.11.37/6.250% 3,175,135 0.065,506,141 Freddie Mac REMICS 2906 SW 15.11.34/6.422%* 502,911 0.018,837,782 Freddie Mac REMICS 3001 IH 15.05.35/6.422%* 1,460,583 0.0322,597,181 Freddie Mac REMICS 3045 DI 15.10.35/6.452%* 3,836,773 0.0710,152,169 Freddie Mac REMICS 3153 JI 15.05.36/6.342%* 1,795,572 0.039,796,584 Freddie Mac REMICS 3155 PS 15.05.36/6.872%* 1,466,480 0.03
19,957,545 Freddie Mac REMICS 3171 ST 15.06.36/6.207%* 3,192,106 0.063,232,625 Freddie Mac REMICS 3218 AS 15.09.36/6.302%* 557,933 0.013,252,733 Freddie Mac REMICS 3236 IS 15.11.36/6.372%* 518,795 0.01
13,830,264 Freddie Mac REMICS 3240 S 15.11.36/6.342%* 2,365,942 0.043,823,065 Freddie Mac REMICS 3244 SB 15.11.36/6.382%* 616,932 0.011,543,213 Freddie Mac REMICS 3279 SD 15.02.37/6.152%* 208,369 0.00
11,734,314 Freddie Mac REMICS 3303 SD 15.04.37/5.182%* 1,718,271 0.036,249,027 Freddie Mac REMICS 3311 IA 15.05.37/6.132%* 1,006,645 0.026,249,027 Freddie Mac REMICS 3311 IB 15.05.37/6.132%* 1,006,632 0.026,249,027 Freddie Mac REMICS 3311 IC 15.05.37/6.132%* 1,006,632 0.026,249,027 Freddie Mac REMICS 3311 ID 15.05.37/6.132%* 1,006,645 0.022,805,348 Freddie Mac REMICS 3370 SH 15.10.37/6.172%* 505,958 0.0112,155,188 Freddie Mac REMICS 3612 JI 15.05.24/4.500% 1,163,410 0.025,594,922 Freddie Mac REMICS 3673 SA 15.05.40/6.142%* 879,758 0.027,569,782 Freddie Mac REMICS 3692 PS 15.05.38/6.322%* 1,160,117 0.02
15,978,599 Freddie Mac REMICS 3751 MI 15.02.34/4.000% 878,940 0.0234,073,475 Freddie Mac REMICS 3754 NS 15.11.34/6.372%* 3,864,249 0.072,876,050 Freddie Mac REMICS 3762 CS 15.04.35/6.422%* 407,693 0.019,361,906 Freddie Mac REMICS 3762 JS 15.04.35/6.422%* 1,170,919 0.02
40,043,621 Freddie Mac REMICS 3763 LS 15.02.39/5.722%* 5,043,282 0.0917,703,931 Freddie Mac REMICS 3767 DS 15.02.39/6.422%* 2,892,107 0.0523,102,251 Freddie Mac REMICS 3803 DS 15.11.35/6.322%* 3,167,785 0.061,660,000 Freescale Semiconductor 01.02.20/8.050% 1,568,700 0.036,890,000 Freescale Semiconductor 144A 15.03.18/10.125% 7,544,550 0.144,135,000 Freescale Semiconductor 144A 15.04.18/9.250% 4,439,956 0.082,260,000 GCI 15.11.19/8.625% 2,409,725 0.054,000,000 General Motors 15.07.23/8.250% 50,000 0.001,650,000 Genworth Life Institutional
Funding Trust 03.05.13/5.875% 1,677,192 0.031,330,000 Georgia-Pacific 144A 01.05.16/8.250% 1,477,542 0.032,000,000 Gibraltar Industries 01.12.15/8.000% 2,010,000 0.048,043,610 Ginnie Mae 2005-13 20.02.35/6.515% 1,492,502 0.031,070,000 GMX Resources 144A 15.02.19/11.375% 732,950 0.013,250,000 Goodman Networks 144A 01.07.18/12.125% 3,120,000 0.061,752,001 Government National Mortgage
Association 2001-57 SF 17.05.29/7.917%* 368,280 0.011,462,807 Government National Mortgage
Association 2003-42 SE 16.01.30/6.317%* 255,257 0.00734,983 Government National Mortgage
Association 2003-46 SB 16.06.33/6.997%* 149,459 0.002,602,454 Government National Mortgage
Association 2003-82 16.09.33/6.317% 429,024 0.012,261,427 Government National Mortgage
Association 2004-76 S 20.09.34/6.315%* 378,258 0.01832,453 Government National Mortgage
Association 2005-7 NL 17.03.33/6.467%* 133,602 0.003,895,127 Government National Mortgage
Association 2008-54 NI 16.06.38/5.967%* 692,340 0.016,613,070 Government National Mortgage
Association 2009-41 GS 16.06.39/5.767%* 880,204 0.0217,259,347 Government National Mortgage
Association 2009-76 SB 16.09.39/5.817%* 2,845,807 0.05
140
JPMorgan Investment Funds - Income Opportunity Fund
Schedule of Investments (Market Value Expressed in USD) (continued)
As at 31 December 2011
Quantity/Nominal
Value
Name of Securities Maturity/Coupon
MarketValue
%of
NetAssets
Quantity/Nominal
Value
Name of Securities Maturity/Coupon
MarketValue
%of
NetAssets

16,203,359 Government National MortgageAssociation 2011-13 SA 16.01.41/5.667%* 2,452,490 0.05
2,200,000 Graham Packaging 15.10.14/9.875% 2,246,750 0.042,670,000 Great Lakes Dredge & Dock 01.02.19/7.375% 2,656,650 0.051,830,360 Greenpoint Mortgage Funding
Trust 2005-AR4 4A1A 25.10.45/0.604%* 945,459 0.022,320,000 Griffon 01.04.18/7.125% 2,308,400 0.04
773,634 GSAA Trust 2005-15 M2 25.01.36/0.727%* 732 0.001,340,000 GWR Operating Partnership 01.04.17/10.875% 1,460,600 0.031,935,000 GXS Worldwide 15.06.15/9.750% 1,809,225 0.033,205,000 Gymboree 01.12.18/9.125% 2,820,400 0.051,051,000 Hanesbrands 15.12.14/4.146%* 1,051,000 0.02
220,000 Hanesbrands 15.12.20/6.375% 224,480 0.0098,831 Harborview Mortgage Loan
Trust 2005-11 2A1A 19.08.45/0.595%* 65,158 0.00341,110 Harborview Mortgage Loan
Trust 2005-16 2A1A 19.01.36/0.525%* 185,321 0.00468,444 Harborview Mortgage Loan
Trust 2005-8 1A2A 19.09.35/0.615%* 259,317 0.0094,016 Harborview Mortgage Loan
Trust 2005-9 2A1A 20.06.35/0.625%* 70,324 0.007,908,000 Harland Clarke Holdings 15.05.15/6.000%* 5,219,280 0.106,490,000 Harland Clarke Holdings 15.05.15/9.500% 4,737,700 0.092,400,000 Hartford Life Institutional
Funding 15.08.13/0.777%* 2,392,699 0.054,030,000 HCA Holdings 15.05.21/7.750% 4,120,675 0.081,355,000 Health Management
Associates 144A 15.01.20/7.375% 1,410,894 0.034,914,000 Helix Energy Solutions
Group 144A 15.01.16/9.500% 5,135,130 0.103,150,000 Hertz 15.10.18/7.500% 3,307,500 0.062,210,000 Hertz 30.11.12/6.750% 2,226,575 0.04
240,000 Hertz 15.01.21/7.375% 245,100 0.002,635,000 Hexion US Finance 01.02.18/8.875% 2,483,488 0.05
920,000 Hexion US Finance 15.11.20/9.000% 763,600 0.012,240,000 Hillman Group 01.06.18/10.875% 2,228,800 0.041,247,860 Home Equity Asset Trust
2005-2 M2 25.07.35/0.774%* 1,191,032 0.021,120,000 Host Hotels & Resorts 15.05.17/9.000% 1,223,600 0.021,150,000 HSN 01.08.16/11.250% 1,273,625 0.02
11,600,000 HUB InternationalHoldings 144A 15.06.15/10.250% 11,542,000 0.22
2,170,000 Huntsman International 15.03.20/8.625% 2,311,050 0.041,615,000 Huntsman International 15.03.21/8.625% 1,719,975 0.03
637,000 IASIS Healthcare 15.05.19/8.375% 558,171 0.011,470,000 iGate 144A 01.05.16/9.000% 1,525,125 0.036,680,000 ILFC E-Capital Trust I 144A 21.12.65/4.340%* 3,918,822 0.075,643,000 ILFC E-Capital Trust II 144A 21.12.65/6.250%* 3,837,240 0.071,075,591 Impac CMB Trust 2005-5 A1 25.08.35/0.934%* 632,235 0.01
256,567 Indymac Index Mortgage LoanTrust 2005-AR14 2A1A 25.07.35/0.594%* 144,486 0.00
1,260,000 Inergy & Inergy Finance 01.10.18/7.000% 1,285,200 0.02170,000 Inergy & Inergy Finance 01.08.21/6.875% 171,700 0.00
1,500,000 Ingles Markets 15.05.17/8.875% 1,627,500 0.033,000,000 Intcomex 15.12.14/13.250% 2,857,500 0.051,575,000 Integra Telecom Holdings 144A 15.04.16/10.750% 1,291,500 0.022,100,000 Interactive Data 01.08.18/10.250% 2,310,000 0.041,525,000 Interline Brands 15.11.18/7.000% 1,582,188 0.036,475,000 International Lease Finance 15.09.15/8.625% 6,587,082 0.125,170,000 International Lease Finance 15.03.17/8.750% 5,338,025 0.102,003,000 inVentiv Health144A 15.08.18/10.000% 1,812,715 0.03
472,000 inVentiv Health 144A 15.08.18/10.000% 427,160 0.011,329,999 iPCS 01.05.14/3.679%* 1,163,749 0.02
10,280,000 Isle of Capri Casinos 01.03.14/7.000% 9,663,200 0.182,500,000 Isle of Capri Casinos 15.03.19/7.750% 2,290,625 0.041,815,000 ITC Deltacom 01.04.16/10.500% 1,860,375 0.04
3,450,000 J Crew Group 01.03.19/8.125% 3,312,000 0.061,585,000 James River Coal 01.04.19/7.875% 1,204,600 0.029,031,000 JB Poindexter & Co. 15.03.14/8.750% 9,042,289 0.17
946,000 JBS USA 01.05.14/11.625% 1,074,893 0.022,276,000 Jefferson Smurfit 01.10.12/8.250% 54,055 0.001,488,025 JP Morgan Alternative Loan
Trust 2006-A4 A1 25.09.36/5.950%* 1,456,015 0.03690,000 Kennedy-Wilson 144A 01.04.19/8.750% 676,200 0.01
4,600,000 Kinetic Concepts 144A 01.11.18/10.500% 4,519,500 0.091,520,000 Landry’s Holdings 144A 01.06.14/11.500% 1,497,200 0.035,015,000 Landry’s Restaurants 01.12.15/11.625% 5,303,363 0.102,810,000 Lawson Software 144A 15.07.18/11.500% 2,739,750 0.055,623,485 Lehman Mortgage Trust
2005-1 7A1 25.11.20/5.500% 5,476,651 0.102,156,482 Lehman Mortgage Trust
2006-4 3A1 25.08.21/5.000% 1,935,979 0.044,955,000 Level 3 Communications 01.02.19/11.875% 5,289,463 0.104,165,000 Level 3 Escrow 144A 01.07.19/8.125% 4,133,763 0.088,609,000 Level 3 Financing 01.11.14/9.250% 8,845,748 0.175,150,000 Level 3 Financing 01.02.18/10.000% 5,484,750 0.106,610,000 Level 3 Financing 01.04.19/9.375% 6,932,238 0.131,515,000 Libbey Glass 15.02.15/10.000% 1,628,625 0.03
2,400,000 Liberty Mutual Group 144A 15.03.37/7.800% 2,154,000 0.0413,725,000 Liberty Mutual Group 144A 15.06.58/10.750%* 17,362,125 0.331,800,000 Liberty Tire Recycling 144A 01.10.16/11.000% 1,804,500 0.031,400,000 Linn Energy 15.04.20/8.625% 1,524,250 0.03
990,000 Linn Energy 01.02.21/7.750% 1,034,550 0.021,415,000 Linn Energy 144A 15.05.19/6.500% 1,407,925 0.031,200,000 Long Beach Mortgage Loan
Trust 2004-3 M1 25.07.34/1.149%* 850,051 0.02370,000 Longview Fibre Paper &
Packaging 144A 01.06.16/8.000% 371,850 0.011,329,000 Lyondell Chemical 01.11.17/8.000% 1,455,255 0.03
627,000 Lyondell Chemical 01.11.17/8.000% 686,565 0.0124,230,642 Lyondell Chemical 01.05.18/11.000% 26,489,907 0.50
1,635,000 Mantech International 15.04.18/7.250% 1,673,831 0.03540,000 Marina District Finance 15.10.15/9.500% 504,900 0.01
4,185,000 Marina District Finance 15.08.18/9.875% 3,744,947 0.073,547,689 MASTR Alternative Loans Trust
2005-5 3A1 25.08.35/5.750% 2,892,915 0.053,025,000 McJunkin Red Man 15.12.16/9.500% 3,070,375 0.06
49,000 Mediacom 15.08.19/9.125% 52,246 0.002,000,000 Mediacom Broadband 15.10.15/8.500% 2,059,500 0.041,955,000 MEMC Electronic Materials 01.04.19/7.750% 1,427,150 0.031,600,000 MetLife Capital Trust X 144A 08.04.38/9.250% 1,800,000 0.0317,105,000 MetLife Institutional
Funding II 144A 12.07.12/0.794%* 17,124,414 0.321,800,000 Metropolitan Life Global
Funding I 144A 10.04.13/5.125% 1,880,746 0.042,100,000 Metropolitan Life Global
Funding I 144A 18.09.13/5.200% 2,227,178 0.049,350,000 MGM Resorts International 01.11.16/10.000% 9,829,188 0.194,220,000 MGM Resorts International 15.03.20/9.000% 4,695,847 0.092,750,000 Michael Foods 15.07.18/9.750% 2,911,563 0.05
15,430,000 Michaels Stores 01.11.16/13.000%* 16,508,557 0.319,147,000 Michaels Stores 01.11.16/11.375% 9,740,640 0.184,030,000 Michaels Stores 01.11.18/7.750% 4,090,450 0.08
3,671,801 Midwest Generation 02.01.16/8.560% 3,708,519 0.072,415,000 Mission Broadcasting 15.04.17/8.875% 2,481,413 0.052,086,878 Morgan Stanley ABS Capital I
2004-OP1 M1 25.11.34/0.874%* 1,514,626 0.03596,639 Morgan Stanley Capital I
2004-HQ3 A3 13.01.41/4.490% 598,946 0.014,250,000 Multiplan 144A 01.09.18/9.875% 4,435,938 0.08
360,000 Mylan 144A 15.07.17/7.625% 394,650 0.012,470,000 Mylan 144A 15.07.20/7.875% 2,738,613 0.054,900,000 Nationwide Mutual
Insurance 144A 15.08.39/9.375% 5,923,419 0.11825,000 NBC Acquisition 15.03.13/11.000% 16,500 0.00
7,601,000 Nebraska Book 15.03.12/8.625% 2,546,335 0.05324,582 New Century Home Equity Loan
Trust 2003-5 AI7 25.11.33/5.150%* 331,744 0.013,328,995 New Century Home Equity Loan
Trust 2005-C A2C 25.12.35/0.544%* 2,608,624 0.053,275,000 New Enterprise Stone & Lime 01.09.18/11.000% 2,701,875 0.05
22,237,000 NewPage 31.12.14/11.375% 16,538,769 0.312,145,000 Nexeo Solutions Finance 144A 01.03.18/8.375% 2,145,000 0.042,500,000 NFR Energy 144A 15.02.17/9.750% 2,237,500 0.04
455,000 NII Capital 15.08.16/10.000% 519,838 0.015,180,354 Noranda Aluminium Acquisition 15.05.15/4.659%* 4,817,729 0.099,653,301 Northwest Airlines 2007-1 A 01.11.19/7.027% 9,833,818 0.19
2,850,000 NRG Energy 15.01.18/7.625% 2,864,250 0.05875,000 NRG Energy 01.09.20/8.250% 879,375 0.02290,000 Oasis Petroleum 01.02.19/7.250% 300,150 0.01
1,610,000 OnCure Holdings 15.05.17/11.750% 1,279,950 0.022,600,000 Oshkosh 01.03.17/8.250% 2,717,000 0.05
310,000 Oshkosh 01.03.20/8.500% 320,850 0.011,760,000 Packaging Dynamics 144A 01.02.16/8.750% 1,768,800 0.03
650,000 PAETEC Holding 15.07.15/9.500% 685,750 0.011,330,000 PAETEC Holding 30.06.17/8.875% 1,449,700 0.032,850,000 PAETEC Holding 01.12.18/9.875% 3,120,750 0.062,325,000 Park Place Securities
2005-WHQ3 M1 25.06.35/0.714%* 2,046,198 0.043,500,000 Park Place Securities
2005-WHQ3 M2 25.06.35/0.744%* 2,314,627 0.041,400,000 Peabody Energy 144A 15.11.18/6.000% 1,428,000 0.031,630,000 Peabody Energy 144A 15.11.21/6.250% 1,687,050 0.037,387,000 Peninsula Gaming 15.08.17/10.750% 7,774,818 0.151,910,000 Petco Animal Supplies 144A 01.12.18/9.250% 2,058,025 0.04
580,000 Petrohawk Energy 01.06.19/6.250% 640,900 0.01437,000 Pilgrim’s Pride 15.12.18/7.875% 412,965 0.01
1,138,000 Pilgrim’s Pride 144A 15.12.18/7.875% 1,075,410 0.02325,000 Pittsburgh Glass Works 144A 15.04.16/8.500% 314,438 0.01
1,500,000 Plastipak Holdings 144A 15.12.15/8.500% 1,537,500 0.032,280,000 Ply Gem Industries 15.02.18/8.250% 1,997,850 0.043,730,000 Polymer Group 144A 01.02.19/7.750% 3,879,200 0.071,645,000 Polypore International 15.11.17/7.500% 1,706,688 0.032,800,000 Pricoa Global Funding I 144A 25.06.12/4.625% 2,845,016 0.053,500,000 Pricoa Global Funding I 144A 26.06.12/0.704%* 3,488,569 0.07
141
JPMorgan Investment Funds - Income Opportunity Fund
Schedule of Investments (Market Value Expressed in USD) (continued)
As at 31 December 2011
Quantity/Nominal
Value
Name of Securities Maturity/Coupon
MarketValue
%of
NetAssets
Quantity/Nominal
Value
Name of Securities Maturity/Coupon
MarketValue
%of
NetAssets

1,285,934 Prime Mortgage Trust2006-1 2A5 25.06.36/6.000% 1,136,890 0.02
1,100,000 Qwest CommunicationsInternational 01.04.18/7.125% 1,139,037 0.02
2,705,000 Radiation Therapy Services 15.04.17/9.875% 2,035,513 0.04500,000 Radio One 24.05.16/15.000%* 358,750 0.01590,000 Rain CII Carbon 144A 01.12.18/8.000% 594,425 0.01
3,500,000 RBS Global/Rexnord 01.05.18/8.500% 3,718,750 0.072,065,000 Real Mex Restaurants 01.01.13/14.000% 1,187,375 0.022,460,000 Realogy 144A 15.02.19/7.875% 2,152,500 0.043,285,000 Reichhold Industries 144A 15.08.14/9.000% 1,757,475 0.03
683,956 Renaissance Home Equity LoanTrust 2005-4 A3 25.02.36/5.565%* 596,498 0.01
4,215,258 Residential Accredit Loans2003-QS16 A1 25.08.18/5.000% 4,286,494 0.08
1,643,040 Residential Accredit Loans2003-QS20 CB 25.11.18/5.000% 1,694,538 0.03
298,179 Residential Accredit Loans2005-QO4 2A1 25.12.45/0.574%* 152,330 0.00
869,463 Residential Accredit Loans2006-QS18 3A3 25.12.21/5.750% 747,017 0.01
1,700,727 Residential Accredit Loans2007-QS4 5A2 25.04.22/5.500% 1,464,955 0.03
1,186,796 Residential Asset SecuritizationTrust 2004-A6 A1 25.08.19/5.000% 1,186,622 0.02
5,661,540 Residential Funding MortgageSecurities I 2006-S10 1A1 25.10.36/6.000% 4,569,981 0.09
3,699,932 Residential Funding MortgageSecurities I 2006-S9 A1 25.09.36/6.250% 3,106,477 0.06
2,410,000 Revlon Consumer Products 15.11.15/9.750% 2,584,725 0.05910,000 Reynolds Group Issuer 144A 15.05.18/9.250% 873,600 0.02
8,080,000 Reynolds Group Issuer 144A 15.04.19/9.000% 7,716,400 0.1510,913,000 Reynolds Group Issuer 144A 15.08.19/7.875% 11,431,368 0.225,190,000 Reynolds Group Issuer 144A 15.08.19/9.875% 5,060,250 0.10
475,000 Reynolds Group Issuer 144A 15.02.21/6.875% 472,625 0.011,030,000 Reynolds Group Issuer 144A 15.02.21/8.250% 916,700 0.02
4,000,000 ROC Finance 1 144A 01.09.18/12.125% 4,230,000 0.087,800,000 Roseton Danskammer Pass
Through Trust Series B 08.11.16/7.670% 4,758,000 0.092,988,000 Rouse 15.09.12/7.200% 3,044,025 0.0613,525,000 RR Donnelley & Sons Co. 15.06.20/7.625% 12,713,500 0.243,050,000 RSC Equipment Rental 15.11.19/10.250% 3,339,750 0.062,075,000 RSC Equipment Rental 01.02.21/8.250% 2,111,313 0.04
225,000 RSC Equipment Rental 144A 15.07.17/10.000% 260,438 0.001,640,000 Sally Holdings 144A 15.11.19/6.875% 1,722,000 0.03
785,000 SandRidge Energy 15.03.21/7.500% 773,225 0.011,055,000 SandRidge Energy 144A 01.06.18/8.000% 1,060,275 0.022,121,202 Saxon Asset Securities Trust
2002-3 AF6 25.05.31/5.407%* 2,067,034 0.04510,000 SBA Telecommunications 15.08.16/8.000% 553,350 0.01520,000 SBA Telecommunications 15.08.19/8.250% 569,400 0.01740,000 Sealed Air 144A 15.09.19/8.125% 814,000 0.02450,000 Sealed Air 144A 15.09.21/8.375% 498,375 0.01
2,213,000 Sealy Mattress 144A 15.04.16/10.875% 2,428,768 0.053,485,000 Seminole Hard Rock
Entertainment 144A 15.03.14/3.046%* 3,275,900 0.062,000,000 Seneca Gaming 144A 01.12.18/8.250% 1,965,000 0.041,853,000 Sequa 144A 01.12.15/11.750% 1,982,710 0.042,760,000 ServiceMaster 144A 15.07.15/10.750%* 2,870,400 0.05
49,801 SG Mortgage Securities Trust2006-OPT2 A3A 25.10.36/0.344%* 49,444 0.00
4,715,000 Shingle Springs Tribal GamingAuthority 144A 15.06.15/9.375% 2,663,975 0.05
7,880,000 Simmons Bedding 144A 15.07.15/11.250% 8,175,500 0.151,990,000 Sinclair Television Group 15.10.18/8.375% 2,064,625 0.04
670,000 Sinclair Television Group 144A 01.11.17/9.250% 733,650 0.012,750,000 Sirius XM Radio 144A 01.04.15/8.750% 3,028,438 0.064,747,000 Sitel 01.04.18/11.500% 3,524,648 0.07
672,000 Sizzling Platter 144A 15.04.16/12.250% 668,640 0.0138,000 Smithfield Foods 15.07.14/10.000% 44,460 0.00
4,785,000 Smurfit-Stone ContainerEnterprises 01.07.12/8.375% 89,719 0.00
5,396,000 Smurfit-Stone ContainerEnterprises 15.03.17/8.000% 128,155 0.00
565,000 Solo Cup Operating 01.11.13/10.500% 573,356 0.0115,137,452 Spectrum Brands 28.08.19/12.000%* 16,575,510 0.313,885,000 Spectrum Brands Holdings 15.06.18/9.500% 4,268,644 0.081,190,000 Spectrum Brands Holdings 144A 15.06.18/9.500% 1,307,513 0.021,060,000 Speedy Cash 144A 15.05.18/10.750% 1,070,600 0.02
12,835,000 Sprint Nextel 144A 15.11.18/9.000% 13,514,164 0.254,725,000 Sprint Nextel 144A 15.11.21/11.500% 4,683,656 0.09
620,000 SPX 01.09.17/6.875% 672,700 0.013,675,000 SquareTwo Financial 01.04.17/11.625% 3,564,750 0.072,535,000 SSI Investments II/SSI Co-Issuer 01.06.18/11.125% 2,693,438 0.051,390,000 Stewart Enterprises 15.04.19/6.500% 1,403,900 0.03
200,000 Stream Global Services 01.10.14/11.250% 204,000 0.004,322,483 Structured Asset Securities
2005-WF4 A4 25.11.35/0.654%* 4,094,327 0.08
3,468,000 Sugarhouse HSP GamingFinance 144A 15.04.16/8.625% 3,572,040 0.07
6,640,000 Sungard Data Systems 15.08.15/10.250% 6,905,600 0.132,375,000 SunGard Data Systems 15.11.18/7.375% 2,440,313 0.051,229,846 Surgical Care Affiliates 144A 15.07.15/8.875%* 1,232,921 0.02
735,000 Syniverse Holdings 15.01.19/9.125% 782,775 0.011,740,000 Teavana Holdings Inc 01.12.17/7.875% 1,950,975 0.046,860,000 Tenet Healthcare 01.02.15/9.250% 7,254,450 0.141,430,000 Tenet Healthcare 144A 01.11.18/6.250% 1,458,600 0.034,805,000 Texas Competitive Electric
Holdings 144A 01.10.20/11.500% 4,102,269 0.082,456,000 Tomkins 01.10.18/9.000% 2,735,370 0.055,500,000 Toys R US 15.04.13/7.875% 5,616,875 0.11
470,000 Travelport 01.09.14/9.875% 285,525 0.01775,000 Travelport 01.03.16/9.000% 435,938 0.01
1,000,000 TRW Automotive 144A 15.03.17/7.250% 1,075,000 0.02469,630 UAL 2009-2B Pass Through
Trust 144A 15.01.16/12.000% 497,808 0.012,665,000 Uncle Acquisition 2010 15.02.19/8.625% 2,598,375 0.052,402,189 United Airlines Pass Through
Trust 2007-1 02.07.22/6.636% 2,402,189 0.051,014,307 United Airlines Pass Through
Trust 2007-1- C Shares 02.07.14/3.059%* 943,306 0.021,905,000 United Surgical Partners
International 01.05.17/8.875% 1,907,381 0.042,545,000 United Surgical Partners
International 01.05.17/9.250%* 2,570,450 0.055,000,000 Univision Communications 144A 15.05.19/6.875% 4,850,000 0.095,000,000 Univision Communications 144A 01.11.20/7.875% 5,100,000 0.10
750,000 Univision Communications 144A 15.05.21/8.500% 686,250 0.013,355,000 US Oncology 15.08.17/9.125% 58,713 0.00
10,000,000 US Treasury 29.02.12/0.875% 10,013,477 0.196,230,000 US Treasury 15.03.12/0.000% 6,229,801 0.12
88,822,000 US Treasury 31.12.16/0.875% 88,887,923 1.675,531,000 US Treasury 15.11.41/3.125% 5,783,352 0.112,273,000 USI Holdings 144A 15.05.15/9.750% 2,182,080 0.042,285,000 Vail Resorts 01.05.19/6.500% 2,342,125 0.044,350,000 Valeant Pharmaceuticals
International 144A 15.07.16/6.500% 4,360,875 0.082,120,000 Valeant Pharmaceuticals
International 144A 01.10.17/6.750% 2,130,600 0.043,120,000 Valeant Pharmaceuticals
International 144A 01.12.18/6.875% 3,127,800 0.061,435,000 Valeant Pharmaceuticals
International 144A 01.10.20/7.000% 1,427,825 0.034,285,000 Valeant Pharmaceuticals
International 144A 15.07.22/7.250% 4,220,725 0.081,120,000 Venoco 15.02.19/8.875% 1,010,800 0.021,950,000 Verso Paper Holdings 01.07.14/11.500% 1,998,750 0.041,510,000 Vertellus Specialties 144A 01.10.15/9.375% 1,155,150 0.021,994,000 Viasystems 144A 15.01.15/12.000% 2,146,043 0.043,135,000 Visant 01.10.17/10.000% 2,884,200 0.052,455,000 Visteon 144A 15.04.19/6.750% 2,442,725 0.051,430,000 Vulcan Materials 15.06.21/7.500% 1,555,125 0.03
907,850 Washington Mutual AlternativeMortgage Pass-ThroughCertificates 2005-8 1A8 25.10.35/5.500% 809,794 0.02
2,004,454 Washington Mutual AlternativeMortgage Pass-ThroughCertificates 2006-1 3A2 25.02.36/5.750% 1,503,373 0.03
49,000,000 Wells Fargo & Co. 24.01.12/0.506%* 49,008,526 0.9213,381,994 Wells Fargo Alternative Loan
Trust 2007-PA3 3A6 25.07.37/6.500% 8,852,410 0.174,310,000 Wells Fargo Home Equity Trust
2004-2 AI6 25.05.34/5.000%* 4,301,546 0.08963,699 Wells Fargo Mortgage Backed
Securities Trust 2005-16 A8 25.01.36/5.750% 982,244 0.024,416,944 Wells Fargo Mortgage Backed
Securities Trust 2006-1 A3 25.03.21/5.000% 4,414,466 0.081,131,269 Wells Fargo Mortgage Backed
Securities Trust 2006-11 A2 25.09.36/6.000% 1,082,141 0.021,661,744 Wells Fargo Mortgage Backed
Securities Trust 2006-11 A8 25.09.36/6.000% 1,524,813 0.03622,854 Wells Fargo Mortgage Backed
Securities Trust 2007-11 A85 25.08.37/6.000% 568,682 0.01718,678 Wells Fargo Mortgage Backed
Securities Trust 2007-11 A96 25.08.37/6.000% 648,942 0.012,144,223 Wells Fargo Mortgage Backed
Securities Trust 2007-3 3A1 25.04.22/5.500% 2,214,388 0.042,664,469 Wells Fargo Mortgage Backed
Securities Trust 2007-5 2A3 25.05.22/5.500% 2,623,297 0.052,155,000 Wendy’s/Arby’s Restaurants 15.07.16/10.000% 2,367,095 0.04
4,000,000 Western Refining 144A 15.06.17/11.250% 4,570,000 0.09810,000 Windstream 01.09.18/8.125% 871,763 0.02
1,765,000 Windstream 01.10.21/7.750% 1,817,950 0.034,005,000 Windstream 01.04.23/7.500% 3,974,963 0.071,555,000 WMG Acquisition 15.06.16/9.500% 1,694,950 0.031,905,000 WMG Acquisition 144A 01.10.18/11.500% 1,905,000 0.041,790,000 WPX Energy 144A 15.01.22/6.000% 1,839,225 0.03
142
JPMorgan Investment Funds - Income Opportunity Fund
Schedule of Investments (Market Value Expressed in USD) (continued)
As at 31 December 2011
Quantity/Nominal
Value
Name of Securities Maturity/Coupon
MarketValue
%of
NetAssets
Quantity/Nominal
Value
Name of Securities Maturity/Coupon
MarketValue
%of
NetAssets

20,000 Wynn Las Vegas Capital 01.11.17/7.875% 22,198 0.00935,000 Wynn Las Vegas Capital 01.05.20/7.875% 1,034,344 0.02380,000 Wynn Las Vegas Capital 15.08.20/7.750% 422,564 0.01
9,000,000 XM Satellite Radio 144A 01.08.13/13.000% 10,260,000 0.193,172,000 Yankee Candle 15.02.17/9.750% 3,092,700 0.06
315,000 YCC Holdings / Yankee Finance 15.02.16/10.250%* 277,200 0.012,200,000 Yonkers Racing 144A 15.07.16/11.375% 2,255,000 0.041,960,000 Zayo Group/Zayo Capital 15.03.17/10.250% 2,097,200 0.04
1,823,807,268 34.33
LUXEMBOURG6,910,000 Intelsat Jackson Holdings 15.06.16/11.250% 7,310,780 0.141,115,000 Intelsat Jackson Holdings 15.06.16/9.500% 1,169,914 0.02
2,500,000 Intelsat Jackson Holdings 15.10.20/7.250% 2,531,250 0.051,860,000 Intelsat Jackson Holdings 144A 01.04.19/7.250% 1,897,200 0.043,495,000 Intelsat Luxembourg 04.02.17/11.250% 3,407,625 0.06
24,657,982 Intelsat Luxembourg 04.02.17/11.500%* 23,794,953 0.452,120,000 Intelsat Luxembourg 144A 04.02.17/11.500%* 2,045,800 0.04
4,988,000 Wind Acquisition Finance 144A 15.07.17/11.750% 4,474,959 0.08802,476 Wind Acquisition Finance 144A 15.07.17/12.250%* 585,807 0.01
47,218,288 0.89
CANADA3,000,000 Abitibi-Consolidated Co. of
Canada 01.04.15/8.375% 16,500 0.00905,000 Bombardier 144A 15.03.18/7.500% 970,613 0.02
1,965,000 Gateway Casinos &Entertainment 144A 15.11.17/8.875% 1,975,795 0.04
1,665,000 Novelis 15.12.17/8.375% 1,777,388 0.033,675,000 Novelis 15.12.20/8.750% 3,941,438 0.084,915,000 Quebecor Media 15.03.16/7.750% 5,080,881 0.101,125,000 Telesat Canada 01.11.15/11.000% 1,213,594 0.02
4,425,000 Telesat Canada/Telesat 01.11.17/12.500% 4,967,063 0.092,480,000 Trinidad Drilling 144A 15.01.19/7.875% 2,566,411 0.051,230,000 Videotron Ltee 15.12.15/6.375% 1,257,675 0.02
23,767,358 0.45
CAYMAN ISLANDS4,500,000 Dryden XXII Senior Loan Fund
2011-22X SUB 15.01.22/0.000% 3,217,500 0.068,000,000 MCE Finance 15.05.18/10.250% 8,686,560 0.164,500,000 Stoneheath RE 31.12.49/3.523% 3,183,750 0.063,585,000 UPCB Finance III 144A 01.07.20/6.625% 3,549,150 0.071,805,000 UPCB Finance V 144A 15.11.21/7.250% 1,836,588 0.04
20,473,548 0.39
NETHERLANDS1,800,000 Bluewater Holding 17.07.14/3.403%* 1,440,000 0.03
530,000 NXP/NXP Funding 15.10.13/3.153%* 531,988 0.01970,000 NXP/NXP Funding 15.10.15/9.500% 1,010,740 0.02
6,480,000 NXP/NXP Funding 144A 01.08.18/9.750% 7,095,600 0.134,555,000 Sensata Technologies 144A 15.05.19/6.500% 4,520,838 0.08
14,599,166 0.27
UNITED KINGDOM5,245,000 Ineos Finance 144A 15.05.15/9.000% 5,349,900 0.102,880,000 Ineos Group Holdings 144A 15.02.16/8.500% 2,304,000 0.057,150,000 Lloyds TSB Bank 13.01.20/5.800% 6,883,913 0.13
14,537,813 0.28
AUSTRALIA3,888,000 FMG Resources August
2006 Pty 144A 01.11.15/7.000% 3,931,934 0.074,059,000 FMG Resources August
2006 Pty 144A 01.02.16/6.375% 3,947,378 0.082,190,000 FMG Resources August
2006 Pty 144A 01.02.18/6.875% 2,091,450 0.04
1,720,000 FMG Resources August2006 Pty 144A 01.11.19/8.250% 1,729,890 0.03
11,700,652 0.22
IRELAND1,225,000 Ardagh Packaging Finance 144A 15.10.17/7.375% 1,243,375 0.034,295,000 Ardagh Packaging Finance 144A 15.10.20/9.125% 4,273,525 0.081,148,080 AWAS Aviation Capital 144A 15.10.16/7.000% 1,155,256 0.02
3,500,000 Elan Finance 15.10.16/8.750% 3,753,750 0.07
10,425,906 0.20
BERMUDA260,000 Aircastle 144A 01.08.18/9.750% 274,300 0.00
2,325,000 Catlin Insurance 144A 31.12.49/7.249%* 1,993,688 0.04670,000 Digicel 144A 01.09.17/8.250% 683,400 0.01
895,000 Digicel Group 144A 15.04.18/10.500% 903,950 0.023,219,000 Stratus Technologies 29.03.15/12.000% 2,913,195 0.05
6,768,533 0.12
LIBERIA3,022,000 Royal Caribbean Cruises 144A 27.01.14/5.625% 3,844,253 0.07
3,844,253 0.07
INTERNATIONAL AGENCIES2,657,000 World Bank Discount Notes 05.01.12/0.000% 2,656,995 0.05
2,656,995 0.05
AUSTRIA2,000,000 PE Paper Escrow 144A 01.08.14/12.000% 2,130,000 0.04
2,130,000 0.04
MARSHALL ISLANDS8,927,000 General Maritime 15.11.17/12.000% 212,016 0.00
450,000 Navios Logistics Finance US144A 15.04.19/9.250% 364,500 0.00
407,000 Navios Maritime Acquisition 01.11.17/8.625% 293,040 0.01903,000 Navios Maritime Holdings 01.11.17/8.875% 866,880 0.02
1,736,436 0.03
Total Bonds 1,983,666,216 37.35
Commercial Paper
UNITED STATES OF AMERICA3,850,000 Amsterdam Funding 27.01.12/0.000% 3,849,162 0.07
50,000,000 Argento Variable Funding 06.01.12/0.000% 49,996,704 0.9419,750,000 Aspen Funding 04.01.12/0.000% 19,748,946 0.3775,000,000 Cancara Asset Securitisation 05.01.12/0.000% 74,995,750 1.4130,000,000 Cancara Asset Securitisation 03.01.12/0.000% 29,998,934 0.5716,750,000 CRC Funding 11.01.12/0.000% 16,748,409 0.32
44,000,000 Gemini 17.01.12/0.000% 43,990,532 0.831,750,000 General Electric Capital 11.01.12/0.000% 1,749,987 0.03
50,000,000 Govco 15.02.12/0.000% 49,978,785 0.94700,000 Kells Funding 10.01.12/0.000% 699,887 0.01500,000 Kells Funding 27.01.12/0.000% 499,823 0.01
50,000,000 Kells Funding 02.02.12/0.000% 49,978,256 0.9424,700,000 Macquarie Bank 16.02.12/0.000% 24,681,228 0.4748,000,000 Manhattan Asset Funding 06.01.12/0.000% 47,996,670 0.9033,650,000 Manhattan Asset Funding 11.01.12/0.000% 33,646,254 0.6379,000,000 Mont Blanc Capital 03.01.12/0.000% 78,997,032 1.4975,000,000 Nordea North America 18.01.12/0.000% 74,985,192 1.4150,000,000 Nordea North America 01.02.12/0.000% 49,982,853 0.9435,000,000 Nordea North America 08.02.12/0.000% 34,983,475 0.668,000,000 Oversea-Chinese Banking 17.01.12/0.000% 7,998,305 0.15
49,700,000 Oversea-Chinese Banking 27.02.12/0.000% 49,654,703 0.9424,425,000 Public Financial Holdings 17.01.12/0.000% 24,416,028 0.4667,099,000 Regency Markets No.1 20.01.12/0.000% 67,087,264 1.2662,000,000 Salisbury 01.02.12/0.000% 61,979,782 1.1733,600,000 Sheffield Receivables 19.01.12/0.000% 33,593,354 0.6331,530,000 Straight Funding 30.01.12/0.000% 31,524,783 0.5974,750,000 Surrey Funding 18.01.12/0.000% 74,735,976 1.4120,750,000 Tasman Funding 06.01.12/0.000% 20,748,238 0.3925,000,000 Tasman Funding 18.01.12/0.000% 24,995,242 0.4750,000,000 Tasman Funding 20.01.12/0.000% 49,989,462 0.9445,000,000 Thames Asset Global
Securitization 12.01.12/0.000% 44,994,627 0.8550,000,000 Toyota Motor Credit 19.03.12/0.000% 49,944,136 0.9426,000,000 UBS/Delaware 20.01.12/0.000% 25,996,682 0.4945,872,000 Windmill Funding 06.01.12/0.000% 45,868,878 0.86
1,301,035,339 24.49
AUSTRALIA60,000,000 ANZ Banking Group 18.04.12/0.000% 59,915,203 1.1330,000,000 Commonwealth Bank of
Australia 06.02.12/0.000% 29,988,346 0.56100,000,000 Commonwealth Bank of
Australia 15.03.12/0.000% 99,946,636 1.881,500,000 Liberty Funding 17.01.12/0.000% 1,499,891 0.03
45,000,000 Regency Markets No.1 18.01.12/0.000% 44,993,858 0.8575,000,000 Suncorp-Metway 12.01.12/0.000% 74,990,765 1.4150,000,000 Westpac Banking 27.03.12/0.000% 49,943,778 0.9430,000,000 Westpac Banking 01.05.12/0.000% 29,952,850 0.5636,000,000 Westpac Banking 03.05.12/0.000% 35,942,500 0.68
427,173,827 8.04
GERMANY50,000,000 NRW Bank 09.01.12/0.000% 49,996,399 0.94
49,996,399 0.94
143
JPMorgan Investment Funds - Income Opportunity Fund
Schedule of Investments (Market Value Expressed in USD) (continued)
As at 31 December 2011
Quantity/Nominal
Value
Name of Securities Maturity/Coupon
MarketValue
%of
NetAssets
Quantity/Nominal
Value
Name of Securities Maturity/Coupon
MarketValue
%of
NetAssets

UNITED KINGDOM50,000,000 Rheingold Securitization 10.01.12/0.000% 49,988,368 0.94
49,988,368 0.94
SWITZERLAND250,000 Crédit Suisse 21.02.12/0.000% 249,813 0.00
249,813 0.00
Total Commercial Paper 1,828,443,746 34.41
Certificates of Deposit
JAPAN25,000,000 Mitsubishi Trust & Banking 28.02.12/0.465% 25,000,000 0.4750,000,000 Mitsubishi Trust & Banking 07.03.12/0.458% 50,000,000 0.9447,350,000 Mizuho Corporate Bank 03.01.12/0.320% 47,349,569 0.8915,000,000 Mizuho Corporate Bank 27.02.12/0.500% 15,000,000 0.2850,000,000 Norinchukin Bank 10.02.12/0.480% 50,000,000 0.9475,000,000 Norinchukin Bank 14.02.12/0.500% 75,000,000 1.4130,000,000 Norinchukin Bank 21.02.12/0.510% 30,000,000 0.5725,000,000 Shizuoka Bank 05.01.12/0.300% 25,000,000 0.4722,000,000 Shizuoka Bank 12.01.12/0.400% 22,000,871 0.424,800,000 Sumitomo Trust & Banking 14.02.12/0.460% 4,800,000 0.09
344,150,440 6.48
UNITED STATES OF AMERICA25,000,000 DnB Bank/New York 30.01.12/0.370% 25,000,000 0.4775,000,000 DnB Bank/New York 13.03.12/0.520% 75,000,000 1.4150,000,000 RBC/New York 24.02.12/0.320% 50,000,000 0.9420,000,000 RBC/New York 27.02.12/0.506%* 20,008,390 0.38
170,008,390 3.20
NETHERLANDS79,600,000 Rabobank Nederland 05.01.12/0.370% 79,600,263 1.50
8,100,000 Rabobank Nederland 01.02.12/0.400% 8,100,000 0.15
87,700,263 1.65
CANADA14,000,000 Bank of Nova Scotia 02.02.12/0.310% 14,000,000 0.26
1,910,000 National Bank of Canada 11.01.12/0.090% 1,910,000 0.0450,000,000 Toronto-Dominion 06.02.12/0.320% 50,000,000 0.94
65,910,000 1.24
SWEDEN51,249,000 Svenska Handelsbanken 24.01.12/0.380% 51,249,000 0.96
51,249,000 0.96
AUSTRALIA30,000,000 National Australia Bank 06.02.12/0.380% 30,000,161 0.5720,000,000 Westpac Banking 13.02.12/0.350% 19,999,496 0.38
49,999,657 0.95
FRANCE20,000,000 Caisse des Dépôts et
Consignations 09.03.12/0.360% 20,000,194 0.38
20,000,194 0.38
GERMANY1,100,000 Deutsche Bank/New York 19.01.12/0.706%* 1,100,092 0.02
1,100,092 0.02
Total Certificates of Deposit 790,118,036 14.88
Investment Funds
UNITED STATES OF AMERICA364,387 Advent Claymore Global Convertible Securities &
Income Fund 2,302,926 0.04137,000 Dreyfus High Yield Strategies Fund 604,855 0.01305,100 ING Prime Rate Trust 1,557,536 0.03259,000 Invesco Van Kampen Senior Income Trust 1,114,995 0.02399,500 Nuveen Multi-Strategy Income and Growth Fund 2 3,213,978 0.06274,358 Nuveen Municipal Value Fund 2,695,567 0.0550,700 SPDR Barclays Capital High Yield Bond 1,951,697 0.04
13,441,554 0.25
Total Investment Funds 13,441,554 0.25
Total Transferable Securities Dealt in on AnotherRegulated Market
4,621,684,239 86.99
Other Transferable Securities
Shares
UNITED STATES OF AMERICA20,662 Constar International** 5,785 0.002,084 Constar International** 145,880 0.00
166,826 General Motors Preference Shares** 63,394 0.0084,916 General Motors Preference Shares** 32,268 0.0025,581 General Motors Preference Shares** 9,721 0.00
2,110 General Motors Preference Shares** 1,371 0.00704,913 General Motors Preference Shares** 458,193 0.01290,634 General Motors Preference Shares** 188,912 0.01479,196 General Motors Preference Shares** 182,094 0.00
1,087,618 0.02
Total Shares 1,087,618 0.02
Bonds
UNITED STATES OF AMERICA4,227,500 ACL I 144A 15.02.16/10.625%* 3,445,413 0.071,535,750 CKE Holdings 144A 14.03.16/10.500%* 1,474,320 0.03
1,000,000 CNG Holdings 144A 15.08.15/13.750% 1,040,000 0.021,495,677 Constar International** 31.12.17/11.000% 1,495,677 0.03
77,380 Lehman XS Trust2005-5N 3A1A (Defaulted) 25.11.35/0.594%* 51,570 0.00
1,109,000 Nationwide MutualInsurance 144A 01.12.31/8.250% 1,192,856 0.02
745,000 Quebecor 15.01.15/9.750% 33,525 0.001,840,000 Quebecor Printing 01.08.27/6.500% 64,400 0.001,755,000 Quebecor World Capital 15.11.13/6.125% 74,588 0.00
959,820 United Airlines Pass ThroughTrust 2009-1 01.11.16/10.400% 1,061,753 0.02
6,000,000 USI Holdings 144A 15.11.14/4.332%* 5,527,500 0.10913,558 VWR Funding 144A 30.06.17/10.750% 1,188,808 0.02
400,000 VWR Funding 144A 30.06.17/10.750% 394,000 0.02
17,044,410 0.33
CANADA750,000 Abitibi Consolidated (Defaulted) 20.06.13/6.000% 4,125 0.00129,000 Abitibi Consolidated (Defaulted) 01.04.28/7.500% 710 0.00
6,558,000 Abitibi Consolidated (Defaulted) 01.08.29/8.500% 36,069 0.001,787,000 Abitibi Consolidated (Defaulted) 01.08.30/8.850% 9,829 0.002,255,000 Kodiak Oil & Gas 144A 01.12.19/8.125% 2,339,563 0.04
2,390,296 0.04
Total Bonds 19,434,706 0.37
Convertible Bonds
UNITED STATES OF AMERICA647,000 US Concrete 144A 31.08.15/9.500% 632,443 0.01
632,443 0.01
Total Convertible Bonds 632,443 0.01
Total Other Transferable Securities 21,154,767 0.40
Total Investments 5,224,155,747 98.32
Cash 481,590,141 9.07
Other Assets/(Liabilities) (392,959,493) (7.39)
Total Net Assets 5,312,786,395 100.00
* Variable coupon rates are those quoted as at 31 December 2011.** This security is fair valued.
144
JPMorgan Investment Funds - Income Opportunity Fund
Schedule of Investments (Market Value Expressed in USD) (continued)
As at 31 December 2011
Quantity/Nominal
Value
Name of Securities Maturity/Coupon
MarketValue
%of
NetAssets
Quantity/Nominal
Value
Name of Securities Maturity/Coupon
MarketValue
%of
NetAssets

Allocation of Portfolio as at 31 December 2011 % ofNet Assets
Fixed Income SecuritiesUnited States of America 71.52Australia 9.21Japan 6.59Netherlands 2.01Canada 1.74United Kingdom 1.34Luxembourg 1.05Germany 0.99Sweden 0.96Ireland 0.56France 0.41Cayman Islands 0.39Liberia 0.20Bermuda 0.17Norway 0.13Marshall Islands 0.11International Agencies 0.05Austria 0.04Mexico 0.01Switzerland 0.00Total Fixed Income Securities 97.48Shares and WarrantsConsumer Discretionary 0.28Financials 0.28Investment Companies 0.25Materials 0.04Industrials 0.00Total Shares and Warrants 0.85Cash and Other Assets/(Liabilities) 1.67
Total 100.00
Allocation of Portfolio as at 30 June 2011 (Unaudited) % ofNet Assets
Fixed Income SecuritiesUnited States of America 50.36United Kingdom 8.17Australia 7.84Japan 6.59France 6.23Germany 3.63Netherlands 3.03Switzerland 2.51Canada 1.91Norway 1.59Denmark 1.39Sweden 1.12Luxembourg 1.02Belgium 0.75Finland 0.59International Agencies 0.33Marshall Islands 0.17Ireland 0.14New Zealand 0.13Bermuda 0.12Liberia 0.10Cayman Islands 0.03Mexico 0.01Total Fixed Income Securities 97.76Shares and WarrantsFinancials 0.30Consumer Discretionary 0.30Investment Companies 0.27Materials 0.04Industrials 0.00Total Shares and Warrants 0.91Cash and Other Assets/(Liabilities) 1.33
Total 100.00
145
JPMorgan Investment Funds - Income Opportunity Fund
Schedule of Investments (Market Value Expressed in USD) (continued)
As at 31 December 2011
Quantity/Nominal
Value
Name of Securities Maturity/Coupon
MarketValue
%of
NetAssets
Quantity/Nominal
Value
Name of Securities Maturity/Coupon
MarketValue
%of
NetAssets

JPMorgan Investment Funds - Income Opportunity Fund
Schedule of Investments - Outstanding To be Announced Securities (Expressed in USD)
As at 31 December 2011
MaturityDate Name of Securities Coupon
NominalValue
MarketValue
UnrealisedGain/(Loss)
To be Announced Securities - Long Positions
UNITED STATES OF AMERICA
25-Jan-42 Fannie Mae 4.000% 126,448,000 132,711,134 1,083,07725-Jan-42 Fannie Mae 4.500% 2,850,000 3,033,914 24,04725-Jan-42 Fannie Mae 5.500% 57,815,000 62,900,928 49,58125-Mar-42 Fannie Mae 4.000% 21,897,000 22,868,679 67,572
Total To be Announced Securities - Long Positions 221,514,655 1,224,277
To be Announced Securities - Short Positions
UNITED STATES OF AMERICA
25-Jan-42 Fannie Mae 5.000% (361,890,000) (391,010,836) (2,035,449)
Total To be Announced Securities - Short Positions (391,010,836) (2,035,449)
Total (169,496,181) (811,172)
Schedule of Investments - Outstanding Financial Futures Contracts (Expressed in USD)
ExpirationDate
Number ofContracts Security Description Currency
NotionalValue
UnrealisedGain/(Loss)
Bond Futures
Mar-12 (3,172) US 2 Year Note Future USD (699,401,220) (87,191)Mar-12 (1,966) US 5 Year Note Future USD (242,132,867) (561,375)Mar-12 (191) US 10 Year Note Future USD (25,016,524) (59,852)Mar-12 (17) US Long Bond Future USD (2,458,891) (23,641)
Total Bond Futures (732,059)
Interest Rate Futures
Jan-12 (10) 90 Day Euro$ Future USD (2,485,219) (1,719)Mar-12 (244) 90 Day Euro$ Future USD (60,608,075) (65,575)Mar-12 346 Fed Fund 30 Day Future USD 144,048,440 72,089Jun-12 (676) 90 Day Euro$ Future USD (167,812,775) 141,851Jul-12 198 Fed Fund 30 Day Future USD 82,405,529 108,425Aug-12 198 Fed Fund 30 Day Future USD 82,397,279 128,302Sep-12 (243) 90 Day Euro$ Future USD (60,301,969) 68,344Dec-12 (244) 90 Day Euro$ Future USD (60,534,875) 44,225Mar-13 (712) 90 Day Euro$ Future USD (176,651,650) (188,712)Jun-13 (136) 90 Day Euro$ Future USD (33,737,350) 16,650Sep-13 (88) 90 Day Euro$ Future USD (21,823,450) (8,250)Dec-13 (88) 90 Day Euro$ Future USD (21,811,350) (18,150)Jun-15 (576) 90 Day Euro$ Future USD (141,577,200) (32,400)
Total Interest Rate Futures 265,080
Total (466,979)
JPMorgan Investment Funds - Income Opportunity Fund
Schedule of Investments - Outstanding Forward Foreign Exchange Contracts (Expressed in USD) (continued)
As at 31 December 2011
SettlementDate Currency
AmountPurchased Currency
AmountSold
UnrealisedGain/(Loss)
13-Jan-12 EUR 2,625,192,035 USD 3,510,225,787 (102,350,022)13-Jan-12 GBP 332,390,773 USD 521,052,622 (4,508,153)13-Jan-12 SEK 1,003,734,223 USD 149,240,742 (3,117,552)13-Jan-12 USD 128,940,187 EUR 98,072,630 1,627,84713-Jan-12 USD 27,338,066 GBP 17,599,940 (12,729)13-Jan-12 USD 5,316,918 SEK 36,647,789 (18,251)20-Jan-12 CHF 294,072 USD 314,494 (789)
146

JPMorgan Investment Funds - Income Opportunity Fund
Schedule of Investments - Outstanding Forward Foreign Exchange Contracts (Expressed in USD) (continued)
As at 31 December 2011
SettlementDate Currency
AmountPurchased Currency
AmountSold
UnrealisedGain/(Loss)
20-Jan-12 USD 1,545 CHF 1,462 (14)26-Jan-12 USD 1,938,172 CAD 2,000,000 (22,575)26-Jan-12 USD 46,095,253 EUR 34,500,000 1,305,40526-Jan-12 USD 18,717,600 GBP 12,000,000 71,64826-Jan-12 USD 11,179,487 NOK 66,000,000 154,60313-Feb-12 SEK 362,444 USD 52,198 48513-Feb-12 USD 961,040 EUR 743,758 (4,727)13-Feb-12 USD 141,623 GBP 91,654 (767)13-Feb-12 USD 317,124 SEK 2,200,508 (2,732)19-Mar-12 EUR 8,068,600 USD 10,893,030 (411,516)19-Mar-12 USD 19,213,475 EUR 13,908,000 1,146,288
Total (106,143,551)
Schedule of Investments - Outstanding Interest Rate Swaps (Expressed in USD)
TerminationDate Counterparty Description Currency Nominal
MarketValue
UnrealisedGain/(Loss)
09-Aug-16 Deutsche Bank Receive floating rate USD LIBOR 3 Month USD 66,927,971 (2,894,835) (2,894,835)Pay fixed rate 1.975%
09-Aug-41 Deutsche Bank Receive fixed rate 4.045% USD 14,039,939 4,589,858 4,589,858Pay floating rate USD LIBOR 3 Month
18-Jul-13 Deutsche Bank Receive floating rate USD LIBOR 3 Month USD 3,520,000 (1,876) (1,876)Pay fixed rate 0.635%
17-Oct-21 Bank of America Receive floating rate USD LIBOR 3 Month USD 16,307,000 (513,129) (513,129)Pay fixed rate 2.336%
27-Oct-16 Bank of America Receive floating rate USD LIBOR 3 Month USD 7,377,000 (69,884) (69,884)Pay fixed rate 1.393%
11-Feb-16 Barclays Receive floating rate USD LIBOR 3 Month USD 14,289,000 (64,310) (64,310)Pay fixed rate 1.299%
11-Feb-21 Barclays Receive floating rate USD LIBOR 3 Month USD 7,840,000 (220,402) (220,402)Pay fixed rate 2.314%
23-Dec-16 RBS Receive floating rate USD LIBOR 3 Month USD 87,568,000 (9,916) (9,916)Pay fixed rate 1.263%
28-Dec-21 Bank of America Receive floating rate USD LIBOR 3 Month USD 84,156,000 (298,113) (298,113)Pay fixed rate 3.010%
Total 517,393 517,393
JPMorgan Investment Funds - Income Opportunity Fund
Schedule of Investments - Outstanding Credit Default Swaps (Expressed in USD) (continued)
As at 31 December 2011
TerminationDate Counterparty Referenced Obligation
ProtectionBuyer/Seller Currency Nominal
MarketValue
UnrealisedGain/(Loss)
20-Jun-2013 Barclays Bank K Hovnanian Enterprises 8.625% 15/01/2017 Buyer USD 3,400,000 919,139 717,50020-Jun-2013 Barclays Bank K Hovnanian Enterprises 8.625% 15/01/2017 Buyer USD 3,350,000 905,623 673,91420-Jun-2013 Deutsche Bank K Hovnanian Enterprises 8.625% 15/01/2017 Buyer USD 3,350,000 905,623 586,90720-Jun-2013 UBS K Hovnanian Enterprises 8.625% 15/01/2017 Buyer USD 3,400,000 919,139 704,75020-Jun-2013 UBS K Hovnanian Enterprises 8.625% 15/01/2017 Buyer USD 6,800,000 1,838,279 1,299,94620-Sep-2013 Morgan Stanley Beazer Homes USA 9.125% 15/06/2018 Buyer USD 1,650,000 102,266 49,10020-Dec-2013 Bank of America Ally Financial 8.300% 12/02/2015 Buyer USD 5,850,000 57,314 (76,748)20-Dec-2013 Barclays Bank Ally Financial 8.300% 12/02/2015 Buyer USD 1,550,000 15,186 (44,877)20-Dec-2013 Deutsche Bank Ally Financial 8.300% 12/02/2015 Buyer USD 1,550,000 15,186 (44,877)20-Mar-2014 UBS Ally Financial 8.300% 12/02/2015 Buyer USD 1,550,000 19,611 (40,451)20-Jun-2016 BNP Paribas Gannett 6.375% 01/04/2012 Buyer USD 3,400,000 (230,872) 105,92920-Jun-2016 BNP Paribas Gannett 6.375% 01/04/2012 Buyer USD 3,350,000 (227,477) 90,18320-Jun-2016 Morgan Stanley Gannett 6.375% 01/04/2012 Buyer USD 3,400,000 (230,872) 105,92920-Jun-2016 UBS Gannett 6.375% 01/04/2012 Buyer USD 6,800,000 (461,743) 200,10820-Jun-2016 UBS Gannett 6.375% 01/04/2012 Buyer USD 5,000,000 (339,517) 150,97120-Sep-2016 Bank of America Aetna 6.625% 15/06/2036 Buyer USD 3,350,000 (45,239) (11,180)20-Sep-2016 Barclays Bank Aetna 6.625% 15/06/2036 Buyer USD 4,950,000 (66,846) (14,087)20-Sep-2016 Barclays Bank Aetna 6.625% 15/06/2036 Buyer USD 3,250,000 (43,889) (8,965)20-Sep-2016 Citibank Beazer Homes USA 5.750% 15/06/2014 Buyer USD 4,950,000 280,653 116,58420-Sep-2016 Bank of America Beazer Homes USA 9.125% 15/06/2018 Buyer USD 1,600,000 394,209 (159,347)20-Sep-2016 Citibank Beazer Homes USA 9.125% 15/06/2018 Buyer USD 3,300,000 813,055 255,26420-Sep-2016 Citibank Beazer Homes USA 9.125% 15/06/2018 Buyer USD 700,000 172,466 40,34120-Sep-2016 Deutsche Bank Beazer Homes USA 9.125% 15/06/2018 Buyer USD 1,600,000 394,209 (143,347)20-Sep-2016 UBS Beazer Homes USA 9.125% 15/06/2018 Buyer USD 1,600,000 394,209 (159,347)20-Sep-2016 Citibank Hartford Financial Services Group 4.000% 30/03/2015 Buyer USD 3,300,000 318,479 158,898
147

JPMorgan Investment Funds - Income Opportunity Fund
Schedule of Investments - Outstanding Credit Default Swaps (Expressed in USD) (continued)
As at 31 December 2011
TerminationDate Counterparty Referenced Obligation
ProtectionBuyer/Seller Currency Nominal
MarketValue
UnrealisedGain/(Loss)
20-Sep-2016 Deutsche Bank Hartford Financial Services Group 4.000% 30/03/2015 Buyer USD 5,000,000 482,543 238,54020-Sep-2016 UBS Hartford Financial Services Group 4.000% 30/03/2015 Buyer USD 3,250,000 313,653 24,07320-Sep-2016 UBS International Paper 5.300% 01/04/2015 Buyer USD 1,600,000 29,320 (44,743)20-Sep-2016 Deutsche Bank Jones Group 5.125% 15/11/2014 Buyer USD 3,200,000 (47,525) 104,46920-Sep-2016 Deutsche Bank Jones Group 5.125% 15/11/2014 Buyer USD 1,600,000 (23,763) 58,88320-Sep-2016 Morgan Stanley Jones Group 5.125% 15/11/2014 Buyer USD 3,200,000 (47,525) 86,97220-Sep-2016 UBS Lincoln National 6.200% 15/12/2011 Buyer USD 9,175,000 897,617 613,62220-Sep-2016 Deutsche Bank Ltd Brands 6.900% 15/07/2017 Buyer USD 3,150,000 131,431 (99,569)20-Sep-2016 Citibank People’s Republic of China 4.750% 29/10/2013 Buyer USD 8,150,000 140,101 57,90320-Sep-2016 Citibank UK Treasury 4.250% 07/06/2032 Buyer USD 8,300,000 (33,275) 57,23120-Sep-2016 UBS UK Treasury 4.250% 07/06/2032 Buyer USD 8,300,000 (33,275) 63,36020-Sep-2016 Deutsche Bank US Treasury 4.875% 15/08/2016 Buyer EUR 8,300,000 121,480 (30,560)20-Sep-2016 UBS US Treasury 4.875% 15/08/2016 Buyer EUR 16,550,000 242,229 (95,469)20-Dec-2016 Barclays Bank CDX.EM.16-V1 Buyer USD 51,750,000 (4,499,063) (448,188)20-Dec-2016 Barclays Bank CDX.EM.16-V1 Buyer USD 7,250,000 (630,303) 111,45220-Dec-2016 Morgan Stanley CDX.EM.16-V1 Buyer USD 7,850,000 (682,467) (194,415)20-Dec-2016 Morgan Stanley CDX.EM.16-V1 Buyer USD 7,750,000 (673,773) (109,960)20-Dec-2016 Morgan Stanley CDX.EM.16-V1 Buyer USD 7,750,000 (673,773) (97,259)20-Dec-2016 UBS CDX.EM.16-V1 Buyer USD 25,400,000 (2,208,236) 43,19220-Dec-2016 UBS CDX.EM.16-V1 Buyer USD 2,450,000 (212,999) 12,87720-Dec-2016 Bank of America Clear Channel Communications 6.875% 15/06/2018 Buyer USD 1,550,000 712,606 (58,734)20-Dec-2016 Bank of America Ford Motor Credit 7.250% 25/10/2011 Buyer USD 1,550,000 (123,267) (66,675)20-Dec-2016 Barclays Bank Ford Motor Credit 7.250% 25/10/2011 Buyer USD 3,100,000 (246,534) (133,350)20-Dec-2016 Bank of America General Electric Capital 5.625% 15/09/2017 Buyer USD 6,250,000 421,936 (158,642)20-Dec-2016 Citibank Germany (Federal Republic of) 6.000% 20/06/2016 Buyer USD 15,650,000 546,764 (4,171)20-Dec-2016 Citibank Germany (Federal Republic of) 6.000% 20/06/2016 Buyer USD 47,050,000 1,643,786 (46,010)20-Dec-2016 UBS Germany (Federal Republic of) 6.000% 20/06/2016 Buyer USD 31,350,000 1,095,275 (12,150)20-Dec-2016 Citibank iStar Financial 5.875% 15/03/2016 Buyer USD 1,550,000 243,399 (17,948)20-Dec-2016 Barclays Bank Knight Ridder 5.750% 01/09/2017 Buyer USD 1,550,000 479,419 (198,922)20-Dec-2016 Bank of America MCDXNA 16-1 Buyer USD 14,650,000 632,568 93,94120-Dec-2016 Citibank MCDXNA 16-1 Buyer USD 14,600,000 630,409 80,66820-Dec-2016 Morgan Stanley MCDXNA 16-1 Buyer USD 16,900,000 729,720 120,43020-Dec-2016 Morgan Stanley MCDXNA 16-1 Buyer USD 7,250,000 313,045 33,58220-Dec-2016 Bank of America People’s Republic of China 4.750% 28/10/2014 Buyer USD 7,350,000 150,609 60,30420-Dec-2016 Citibank People’s Republic of China 4.750% 28/10/2014 Buyer USD 6,300,000 129,094 51,68920-Dec-2016 Citibank People’s Republic of China 4.750% 28/10/2014 Buyer USD 7,250,000 148,560 (5,456)20-Dec-2016 Citibank People’s Republic of China 4.750% 28/10/2014 Buyer USD 7,250,000 148,560 35,09420-Dec-2016 Credit Suisse People’s Republic of China 4.750% 29/10/2013 Buyer USD 7,850,000 160,855 (123,746)20-Dec-2016 Credit Suisse People’s Republic of China 4.750% 29/10/2013 Buyer USD 4,700,000 96,308 (41,238)20-Dec-2016 Credit Suisse People’s Republic of China 4.750% 29/10/2013 Buyer USD 7,800,000 159,830 (60,351)20-Dec-2016 Deutsche Bank People’s Republic of China 4.750% 29/10/2013 Buyer USD 5,575,000 114,238 45,74120-Dec-2016 Deutsche Bank People’s Republic of China 4.750% 29/10/2013 Buyer USD 4,350,000 89,136 21,05620-Dec-2016 RBS People’s Republic of China 4.750% 29/10/2013 Buyer USD 3,150,000 64,547 (45,547)20-Dec-2016 Bank of America PulteGroup 5.250% 15/01/2014 Buyer USD 8,900,000 (76,111) 120,32620-Dec-2016 Barclays Bank PulteGroup 5.250% 15/01/2014 Buyer USD 7,350,000 (62,856) 5,45420-Dec-2016 Deutsche Bank PulteGroup 5.250% 15/01/2014 Buyer USD 2,850,000 (24,373) 50,73720-Dec-2016 Bank of America Realogy 11.500% 15/04/2017 Buyer USD 1,550,000 475,206 (141,134)20-Dec-2016 Morgan Stanley Spain (Kingdom of) 5.550% 30/07/2017 Buyer USD 7,800,000 918,391 (268,576)20-Mar-2017 Citibank Alcoa 5.720% 23/02/2019 Buyer USD 11,500,000 1,407,579 (33,053)20-Mar-2017 Barclays Bank Belo 7.750% 01/06/2027 Buyer USD 8,600,000 (513,860) (76,983)20-Mar-2017 UBS Brazil (Republic of) 12.250% 06/03/2030 Buyer USD 14,400,000 428,572 (13,427)20-Mar-2017 Barclays Bank Darden Restaurants 6.000% 15/08/2035 Buyer USD 14,500,000 211,359 (57,034)20-Mar-2017 UBS Ltd Brands 6.900% 15/07/2017 Buyer USD 14,500,000 777,364 23,21320-Mar-2017 UBS Mexico (United Mexican States) 5.950% 19/03/2019 Buyer USD 31,500,000 818,731 (12,213)20-Mar-2017 UBS Mexico (United Mexican States) 5.950% 19/03/2019 Buyer USD 28,790,000 748,294 (11,163)20-Dec-2017 Credit Suisse CDX.NA.IG.9-V4 Buyer USD 32,750,000 1,209,877 285,76120-Dec-2017 Credit Suisse CDX.NA.IG.9-V4 Buyer USD 8,500,000 314,014 108,71820-Dec-2017 Morgan Stanley CDX.NA.IG.9-V4 Buyer USD 17,000,000 628,028 226,01420-Dec-2017 Morgan Stanley CDX.NA.IG.9-V4 Buyer USD 15,550,000 574,460 (147,827)20-Dec-2017 RBS CDX.NA.IG.9-V4 Buyer USD 16,350,000 604,015 (147,573)20-Dec-2017 RBS CDX.NA.IG.9-V4 Buyer USD 15,750,000 581,849 (136,951)20-Dec-2017 UBS CDX.NA.IG.9-V4 Buyer USD 16,350,000 604,015 171,06720-Dec-2017 UBS CDX.NA.IG.9-V4 Buyer USD 32,850,000 1,213,571 191,06420-Dec-2017 UBS CDX.NA.IG.9-V4 Buyer USD 32,850,000 1,213,571 93,39112-Jan-2038 Citibank IOS FN30 650 Indices Buyer USD 56,200,000 106,610 (188,251)12-Jan-2038 Credit Suisse IOS FN30 650 Indices Buyer USD 57,400,000 108,886 68,92712-Jan-2038 RBS IOS FN30 650 Indices Buyer USD 57,400,000 108,886 68,08312-Jan-2038 RBS IOS FN30 650 Indices Buyer USD 57,400,000 108,886 39,74412-Jan-2041 Bank of America IOS FN30 500 Indices Buyer USD 31,850,000 98,476 (224,420)12-Jan-2041 Citibank IOS FN30 500 Indices Buyer USD 38,500,000 119,037 179,95612-Jan-2041 Citibank IOS FN30 500 Indices Buyer USD 19,300,000 59,673 228,21812-Jan-2041 Citibank IOS FN30 500 Indices Buyer USD 35,500,000 109,762 583,56912-Jan-2041 Citibank IOS FN30 500 Indices Buyer USD 14,734,000 45,556 34,76612-Jan-2041 Citibank IOS FN30 500 Indices Buyer USD 19,281,000 59,614 45,49525-May-2046 RBS ABX.HE.PENAAA Buyer USD 2,500,000 434,450 (26,686)25-May-2046 Citibank AXHAAA 06-2 Buyer USD 4,100,000 712,497 (369,577)25-May-2046 Citibank AXHAAA 06-2 Buyer USD 5,500,000 955,789 (301,410)25-May-2046 Deutsche Bank AXHAAA 06-2 Buyer USD 6,300,000 1,094,813 (218,676)25-May-2046 RBS AXHAAA 06-2 Buyer USD 2,200,000 382,316 (367,696)25-May-2046 RBS AXHAAA 06-2 Buyer USD 9,900,000 1,720,420 (1,221,297)25-Aug-2047 Deutsche Bank ABX.HE.PENAAA Buyer USD 3,000,000 521,340 174,05415-Mar-2049 Morgan Stanley CMBX-02-1 Buyer USD 20,000 9,184 (1,165)15-Mar-2049 Deutsche Bank CMNAA 02-1 Buyer USD 2,670,000 1,226,058 138,32215-Mar-2049 Morgan Stanley CMNAA 02-1 Buyer USD 2,630,000 1,207,690 (107,102)15-Mar-2049 Morgan Stanley CMNAA 02-1 Buyer USD 5,350,000 2,456,708 343,94815-Mar-2049 Morgan Stanley CMNAJ 02-1 Buyer USD 7,250,000 1,881,895 977,621
148

JPMorgan Investment Funds - Income Opportunity Fund
Schedule of Investments - Outstanding Credit Default Swaps (Expressed in USD) (continued)
As at 31 December 2011
TerminationDate Counterparty Referenced Obligation
ProtectionBuyer/Seller Currency Nominal
MarketValue
UnrealisedGain/(Loss)
13-Dec-2049 Barclays Bank CMNAA 03-1 Buyer USD 5,350,000 3,323,528 288,28513-Dec-2049 Morgan Stanley CMNAA 03-1 Buyer USD 2,670,000 1,658,657 110,49815-Feb-2051 Credit Suisse CMBX-05-1 Buyer USD 2,900,000 2,299,030 (165,970)17-Feb-2051 Citibank CMBX-04-1 Buyer USD 3,850,000 2,779,479 (298,383)17-Feb-2051 Citibank CMBX-04-1 Buyer USD 2,900,000 2,093,633 (366,936)12-Oct-2052 Morgan Stanley CMBX_1 Buyer USD 7,400,000 845,991 (354,146)12-Oct-2052 RBS CMBX_NA_AAA_1 Buyer USD 7,300,000 368,778 (87,006)12-Oct-2052 Deutsche Bank CMBX_NA_AAA_1 Buyer USD 4,300,000 217,225 (610,166)20-Mar-2012 Morgan Stanley Caesars Entertainment Operating 5.625% 01/06/2015 Seller USD 1,550,000 (20,656) 54,47620-Mar-2012 Bank of America Eastman Kodak 7.250% 15/11/2013 Seller USD 1,000,000 (418,619) (318,897)20-Mar-2012 Barclays Bank Eastman Kodak 7.250% 15/11/2013 Seller USD 1,550,000 (648,859) (116,047)20-Mar-2012 Morgan Stanley Eastman Kodak 7.250% 15/11/2013 Seller USD 600,000 (251,171) (41,921)20-Mar-2012 Morgan Stanley Eastman Kodak 7.250% 15/11/2013 Seller USD 570,000 (238,613) (37,213)20-Mar-2012 Morgan Stanley Eastman Kodak 7.250% 15/11/2013 Seller USD 1,150,000 (481,412) (63,898)20-Mar-2012 RBS Eastman Kodak 7.250% 15/11/2013 Seller USD 1,450,000 (606,997) (55,997)20-Mar-2012 Credit Suisse Texas Competitive Electric Holdings 10.250% 01/11/2015 Seller USD 2,200,000 (92,838) 70,02320-Mar-2012 Deutsche Bank Texas Competitive Electric Holdings 10.250% 01/11/2015 Seller USD 4,900,000 (206,776) (27,109)20-Mar-2012 Morgan Stanley Texas Competitive Electric Holdings 10.250% 01/11/2015 Seller USD 6,300,000 (266,730) 646,77020-Mar-2012 Morgan Stanley Texas Competitive Electric Holdings 10.250% 01/11/2015 Seller USD 6,700,000 (282,735) (171,999)20-Mar-2012 UBS Texas Competitive Electric Holdings 10.250% 01/11/2015 Seller USD 3,150,000 (133,365) 166,32220-Jun-2012 Deutsche Bank CDX.NA.HY.8-V17 Seller USD 2,900,000 (726,080) 283,96520-Jun-2012 Deutsche Bank CDX.NA.HY.8-V17 Seller USD 1,350,000 (338,003) 114,33520-Jun-2012 Barclays Bank Dixons Retail 8.750% 03/08/2015 Seller EUR 3,000,000 (63,024) 40,82020-Jun-2012 Barclays Bank Dixons Retail 8.750% 03/08/2015 Seller EUR 1,650,000 (34,663) 22,15420-Jun-2012 Citibank Dixons Retail 8.750% 03/08/2015 Seller EUR 1,650,000 (34,663) 22,15420-Jun-2012 Morgan Stanley Eastman Kodak 7.250% 15/11/2013 Seller USD 1,550,000 (741,858) 138,62820-Jun-2012 UBS Eastman Kodak 7.250% 15/11/2013 Seller USD 2,950,000 (1,411,924) 21,69420-Jun-2012 Bank of America Texas Competitive Electric Holdings 10.250% 01/11/2015 Seller USD 1,000,000 (87,705) (51,732)20-Jun-2012 Barclays Bank Texas Competitive Electric Holdings 10.250% 01/11/2015 Seller USD 1,600,000 (140,327) (38,994)20-Jun-2012 BNP Paribas Texas Competitive Electric Holdings 10.250% 01/11/2015 Seller USD 1,650,000 (144,713) (85,358)20-Jun-2012 BNP Paribas Texas Competitive Electric Holdings 10.250% 01/11/2015 Seller USD 1,650,000 (144,713) (102,088)20-Jun-2012 Credit Suisse Texas Competitive Electric Holdings 10.250% 01/11/2015 Seller USD 1,650,000 (144,713) (62,671)20-Jun-2012 Deutsche Bank Texas Competitive Electric Holdings 10.250% 01/11/2015 Seller USD 1,650,000 (144,713) (48,462)20-Jun-2012 Deutsche Bank Texas Competitive Electric Holdings 10.250% 01/11/2015 Seller USD 4,100,000 (359,589) (136,936)20-Jun-2012 Deutsche Bank Texas Competitive Electric Holdings 10.250% 01/11/2015 Seller USD 1,700,000 (149,098) (115,334)20-Jun-2012 Deutsche Bank Texas Competitive Electric Holdings 10.250% 01/11/2015 Seller USD 6,700,000 (587,621) (475,954)20-Jun-2012 Morgan Stanley Texas Competitive Electric Holdings 10.250% 01/11/2015 Seller USD 3,250,000 (285,040) (228,165)20-Jun-2012 UBS Texas Competitive Electric Holdings 10.250% 01/11/2015 Seller USD 1,650,000 (144,713) (85,358)20-Jun-2012 UBS Texas Competitive Electric Holdings 10.250% 01/11/2015 Seller USD 3,150,000 (276,270) 84,23020-Sep-2012 Deutsche Bank Block Financial 5.125% 30/10/2014 Seller USD 900,000 (7,707) (3,547)20-Sep-2012 Deutsche Bank Block Financial 5.125% 30/10/2014 Seller USD 2,900,000 (24,834) (1,676)20-Sep-2012 Barclays Bank Eastman Kodak 7.250% 15/11/2013 Seller USD 1,700,000 (873,150) (720,150)20-Sep-2012 Barclays Bank Eastman Kodak 7.250% 15/11/2013 Seller USD 1,700,000 (873,150) (691,580)20-Sep-2012 Barclays Bank Eastman Kodak 7.250% 15/11/2013 Seller USD 3,400,000 (1,746,299) (1,357,660)20-Sep-2012 Barclays Bank Eastman Kodak 7.250% 15/11/2013 Seller USD 1,650,000 (847,469) (607,073)20-Sep-2012 Barclays Bank Eastman Kodak 7.250% 15/11/2013 Seller USD 1,650,000 (847,469) (574,531)20-Sep-2012 Citibank Eastman Kodak 7.250% 15/11/2013 Seller USD 3,400,000 (1,746,299) (1,498,855)20-Sep-2012 Citibank Eastman Kodak 7.250% 15/11/2013 Seller USD 1,650,000 (847,469) (590,573)20-Sep-2012 Citibank Eastman Kodak 7.250% 15/11/2013 Seller USD 1,650,000 (847,469) (571,781)20-Sep-2012 Credit Suisse Eastman Kodak 7.250% 15/11/2013 Seller USD 1,600,000 (821,788) (681,788)20-Sep-2012 Deutsche Bank Eastman Kodak 7.250% 15/11/2013 Seller USD 3,400,000 (1,746,299) (1,437,466)20-Sep-2012 Deutsche Bank Eastman Kodak 7.250% 15/11/2013 Seller USD 3,400,000 (1,746,299) (1,465,327)20-Sep-2012 Deutsche Bank Eastman Kodak 7.250% 15/11/2013 Seller USD 1,650,000 (847,469) (550,698)20-Sep-2012 Morgan Stanley Eastman Kodak 7.250% 15/11/2013 Seller USD 1,700,000 (873,150) (687,094)20-Sep-2012 Morgan Stanley Eastman Kodak 7.250% 15/11/2013 Seller USD 2,350,000 (1,207,001) (932,834)20-Sep-2012 Morgan Stanley Eastman Kodak 7.250% 15/11/2013 Seller USD 1,650,000 (847,469) (614,865)20-Sep-2012 Morgan Stanley Eastman Kodak 7.250% 15/11/2013 Seller USD 1,600,000 (821,788) (564,899)20-Sep-2012 Morgan Stanley Eastman Kodak 7.250% 15/11/2013 Seller USD 1,650,000 (847,469) (575,448)20-Sep-2012 UBS Eastman Kodak 7.250% 15/11/2013 Seller USD 5,050,000 (2,593,768) (1,971,468)20-Sep-2012 Morgan Stanley K Hovnanian Enterprises 8.625% 15/01/2017 Seller USD 1,700,000 (233,255) (136,922)20-Sep-2012 RBS K Hovnanian Enterprises 8.625% 15/01/2017 Seller USD 1,600,000 (219,534) 69,35520-Sep-2012 UBS K Hovnanian Enterprises 8.625% 15/01/2017 Seller USD 1,600,000 (219,534) (36,201)20-Sep-2012 UBS K Hovnanian Enterprises 8.625% 15/01/2017 Seller USD 1,650,000 (226,394) 11,02220-Sep-2012 Barclays Bank Rite Aid 7.700% 15/02/2027 Seller USD 1,400,000 3,604 28,49320-Sep-2012 Bank of America Texas Competitive Electric Holdings 10.250% 01/11/2015 Seller USD 3,250,000 (421,969) (220,650)20-Sep-2012 BNP Paribas Texas Competitive Electric Holdings 10.250% 01/11/2015 Seller USD 1,700,000 (220,722) (115,653)20-Sep-2012 Credit Suisse Texas Competitive Electric Holdings 10.250% 01/11/2015 Seller USD 1,700,000 (220,722) (115,653)20-Sep-2012 Credit Suisse Texas Competitive Electric Holdings 10.250% 01/11/2015 Seller USD 3,300,000 (428,461) (148,877)20-Sep-2012 Deutsche Bank Texas Competitive Electric Holdings 10.250% 01/11/2015 Seller USD 3,350,000 (434,953) (227,904)20-Sep-2012 Deutsche Bank Texas Competitive Electric Holdings 10.250% 01/11/2015 Seller USD 3,350,000 (434,953) (187,425)20-Sep-2012 Deutsche Bank Texas Competitive Electric Holdings 10.250% 01/11/2015 Seller USD 3,300,000 (428,461) (177,752)20-Sep-2012 Deutsche Bank Texas Competitive Electric Holdings 10.250% 01/11/2015 Seller USD 1,650,000 (214,230) (57,939)20-Dec-2012 Citibank Block Financial 5.125% 30/10/2014 Seller USD 2,900,000 (37,378) (23,346)20-Dec-2012 Citibank Caesars Entertainment Operating 5.625% 01/06/2015 Seller USD 2,900,000 (214,213) (134,463)20-Dec-2012 Credit Suisse Caesars Entertainment Operating 5.625% 01/06/2015 Seller USD 1,450,000 (107,106) (65,419)20-Dec-2012 RBS Caesars Entertainment Operating 5.625% 01/06/2015 Seller USD 1,450,000 (107,106) (1,377)20-Dec-2012 Barclays Bank Eastman Kodak 7.250% 15/11/2013 Seller USD 7,300,000 (3,931,908) (946,005)20-Dec-2012 Barclays Bank Eastman Kodak 7.250% 15/11/2013 Seller USD 1,550,000 (834,857) (162,545)20-Dec-2012 Barclays Bank Eastman Kodak 7.250% 15/11/2013 Seller USD 1,550,000 (834,857) (162,545)20-Dec-2012 Barclays Bank Eastman Kodak 7.250% 15/11/2013 Seller USD 1,550,000 (834,857) (162,545)20-Dec-2012 Barclays Bank Eastman Kodak 7.250% 15/11/2013 Seller USD 1,550,000 (834,857) (139,725)20-Dec-2012 Barclays Bank Eastman Kodak 7.250% 15/11/2013 Seller USD 1,500,000 (807,926) 12,07420-Dec-2012 Barclays Bank Eastman Kodak 7.250% 15/11/2013 Seller USD 2,850,000 (1,535,060) (171,810)20-Dec-2012 Barclays Bank Eastman Kodak 7.250% 15/11/2013 Seller USD 1,450,000 (780,995) (87,412)20-Dec-2012 Barclays Bank Eastman Kodak 7.250% 15/11/2013 Seller USD 5,760,000 (3,102,437) (320,037)20-Dec-2012 Barclays Bank Eastman Kodak 7.250% 15/11/2013 Seller USD 1,440,000 (775,609) (80,009)
149

JPMorgan Investment Funds - Income Opportunity Fund
Schedule of Investments - Outstanding Credit Default Swaps (Expressed in USD) (continued)
As at 31 December 2011
TerminationDate Counterparty Referenced Obligation
ProtectionBuyer/Seller Currency Nominal
MarketValue
UnrealisedGain/(Loss)
20-Dec-2012 Barclays Bank Eastman Kodak 7.250% 15/11/2013 Seller USD 9,950,000 (5,359,245) (504,474)20-Dec-2012 Deutsche Bank Eastman Kodak 7.250% 15/11/2013 Seller USD 1,550,000 (834,857) (155,225)20-Dec-2012 Deutsche Bank Eastman Kodak 7.250% 15/11/2013 Seller USD 1,550,000 (834,857) 92,12920-Dec-2012 Deutsche Bank Eastman Kodak 7.250% 15/11/2013 Seller USD 1,500,000 (807,926) 12,07420-Dec-2012 Deutsche Bank Eastman Kodak 7.250% 15/11/2013 Seller USD 1,450,000 (780,995) (102,114)20-Dec-2012 Deutsche Bank Eastman Kodak 7.250% 15/11/2013 Seller USD 3,350,000 (1,804,369) (28,869)20-Dec-2012 Morgan Stanley Eastman Kodak 7.250% 15/11/2013 Seller USD 3,400,000 (1,831,300) (1,473,828)20-Dec-2012 Morgan Stanley Eastman Kodak 7.250% 15/11/2013 Seller USD 1,700,000 (915,650) (736,914)20-Dec-2012 Morgan Stanley Eastman Kodak 7.250% 15/11/2013 Seller USD 2,150,000 (1,158,028) (246,667)20-Dec-2012 Morgan Stanley Eastman Kodak 7.250% 15/11/2013 Seller USD 950,000 (511,687) (104,374)20-Dec-2012 Morgan Stanley Eastman Kodak 7.250% 15/11/2013 Seller USD 1,550,000 (834,857) (178,045)20-Dec-2012 Morgan Stanley Eastman Kodak 7.250% 15/11/2013 Seller USD 950,000 (511,687) 75,46620-Dec-2012 Morgan Stanley Eastman Kodak 7.250% 15/11/2013 Seller USD 570,000 (307,012) (45,762)20-Dec-2012 RBS Eastman Kodak 7.250% 15/11/2013 Seller USD 1,450,000 (780,995) (73,114)20-Dec-2012 Barclays Bank First Data 9.875% 24/09/2015 Seller USD 1,400,000 6,061 53,31120-Dec-2012 Barclays Bank First Data 9.875% 24/09/2015 Seller USD 550,000 2,381 12,23520-Dec-2012 Barclays Bank First Data 9.875% 24/09/2015 Seller USD 2,900,000 12,554 4,09620-Dec-2012 Barclays Bank First Data 9.875% 24/09/2015 Seller USD 2,900,000 12,554 47120-Dec-2012 Citibank First Data 9.875% 24/09/2015 Seller USD 1,400,000 6,061 53,31120-Dec-2012 UBS First Data 9.875% 24/09/2015 Seller USD 10,600,000 45,887 159,24820-Dec-2012 UBS First Data 9.875% 24/09/2015 Seller USD 2,900,000 12,554 47,19320-Dec-2012 Deutsche Bank K Hovnanian Enterprises 8.625% 15/01/2017 Seller USD 570,000 (101,325) (12,738)20-Dec-2012 Morgan Stanley K Hovnanian Enterprises 8.625% 15/01/2017 Seller USD 860,000 (152,876) (25,668)20-Dec-2012 UBS K Hovnanian Enterprises 8.625% 15/01/2017 Seller USD 1,350,000 (239,981) 66,20720-Dec-2012 UBS K Hovnanian Enterprises 8.625% 15/01/2017 Seller USD 1,500,000 (266,645) 118,14720-Dec-2012 UBS K Hovnanian Enterprises 8.625% 15/01/2017 Seller USD 1,450,000 (257,757) (43,278)20-Dec-2012 Credit Suisse Knight Ridder 5.750% 01/09/2017 Seller USD 1,550,000 (21,301) 87,62920-Dec-2012 Deutsche Bank Knight Ridder 5.750% 01/09/2017 Seller USD 2,800,000 (38,480) 17,13120-Dec-2012 Deutsche Bank Knight Ridder 5.750% 01/09/2017 Seller USD 1,400,000 (19,240) 7,01020-Dec-2012 Morgan Stanley Knight Ridder 5.750% 01/09/2017 Seller USD 1,450,000 (19,927) (13,080)20-Dec-2012 Morgan Stanley Knight Ridder 5.750% 01/09/2017 Seller USD 1,450,000 (19,927) (18,920)20-Dec-2012 UBS Knight Ridder 5.750% 01/09/2017 Seller USD 850,000 (11,681) 5,20120-Dec-2012 Bank of America MBIA Global Funding 0.484% 20/03/2015 Seller USD 2,900,000 (332,861) 111,40320-Dec-2012 UBS MBIA Global Funding 0.484% 20/03/2015 Seller USD 570,000 (65,424) 13,34720-Dec-2012 Barclays Bank Realogy 10.500% 15/04/2014 Seller USD 550,000 (15,082) 20,97320-Dec-2012 Citibank Realogy 10.500% 15/04/2014 Seller USD 2,850,000 (78,153) 87,30520-Dec-2012 Citibank Realogy 10.500% 15/04/2014 Seller USD 2,900,000 (79,524) 71,11420-Dec-2012 Citibank Realogy 10.500% 15/04/2014 Seller USD 2,900,000 (79,524) 96,89220-Dec-2012 Deutsche Bank Realogy 10.500% 15/04/2014 Seller USD 2,800,000 (76,782) 109,49620-Dec-2012 Morgan Stanley Realogy 10.500% 15/04/2014 Seller USD 2,900,000 (79,524) 64,26720-Dec-2012 UBS Realogy 10.500% 15/04/2014 Seller USD 2,900,000 (79,524) 85,61420-Mar-2013 Bank of America Block Financial 5.125% 30/10/2014 Seller USD 2,900,000 (49,798) (65,463)20-Mar-2013 Bank of America Block Financial 5.125% 30/10/2014 Seller USD 2,900,000 (49,798) (72,129)20-Mar-2013 Citibank Block Financial 5.125% 30/10/2014 Seller USD 2,800,000 (48,081) (66,798)20-Mar-2013 Deutsche Bank Block Financial 5.125% 30/10/2014 Seller USD 2,850,000 (48,940) (70,138)20-Mar-2013 UBS Block Financial 5.125% 30/10/2014 Seller USD 1,450,000 (24,899) (32,450)20-Mar-2013 Morgan Stanley Caesars Entertainment Operating 5.375% 15/12/2013 Seller USD 7,500,000 (758,603) (620,062)20-Mar-2013 RBS Caesars Entertainment Operating 5.375% 15/12/2013 Seller USD 4,700,000 (476,045) (403,587)20-Mar-2013 Barclays Bank Caesars Entertainment Operating 5.625% 01/06/2015 Seller USD 6,300,000 (638,103) (586,478)20-Mar-2013 Citibank Caesars Entertainment Operating 5.625% 01/06/2015 Seller USD 6,300,000 (638,103) (612,728)20-Mar-2013 Citibank Caesars Entertainment Operating 5.625% 01/06/2015 Seller USD 1,700,000 (171,950) (152,353)20-Mar-2013 Citibank Caesars Entertainment Operating 5.625% 01/06/2015 Seller USD 1,700,000 (171,950) (148,339)20-Mar-2013 Citibank Caesars Entertainment Operating 5.625% 01/06/2015 Seller USD 1,700,000 (171,950) (128,978)20-Mar-2013 Deutsche Bank Caesars Entertainment Operating 5.625% 01/06/2015 Seller USD 3,150,000 (319,051) (298,489)20-Mar-2013 Deutsche Bank Caesars Entertainment Operating 5.625% 01/06/2015 Seller USD 7,900,000 (800,161) (739,813)20-Mar-2013 Deutsche Bank Caesars Entertainment Operating 5.625% 01/06/2015 Seller USD 7,900,000 (800,161) (691,536)20-Mar-2013 Deutsche Bank Caesars Entertainment Operating 5.625% 01/06/2015 Seller USD 3,150,000 (319,051) (276,176)20-Mar-2013 Deutsche Bank Caesars Entertainment Operating 5.625% 01/06/2015 Seller USD 3,150,000 (319,051) (277,489)20-Mar-2013 Deutsche Bank Caesars Entertainment Operating 5.625% 01/06/2015 Seller USD 6,300,000 (638,103) (524,353)20-Mar-2013 Deutsche Bank Caesars Entertainment Operating 5.625% 01/06/2015 Seller USD 3,100,000 (313,987) (274,376)20-Mar-2013 Deutsche Bank Caesars Entertainment Operating 5.625% 01/06/2015 Seller USD 3,100,000 (313,556) (245,098)20-Mar-2013 Morgan Stanley Caesars Entertainment Operating 5.625% 01/06/2015 Seller USD 3,150,000 (319,051) (290,614)20-Mar-2013 Morgan Stanley Caesars Entertainment Operating 5.625% 01/06/2015 Seller USD 1,550,000 (156,994) (136,542)20-Mar-2013 Morgan Stanley Caesars Entertainment Operating 5.625% 01/06/2015 Seller USD 1,600,000 (162,058) (133,169)20-Mar-2013 RBS Caesars Entertainment Operating 5.625% 01/06/2015 Seller USD 3,150,000 (319,051) (298,926)20-Mar-2013 RBS Caesars Entertainment Operating 5.625% 01/06/2015 Seller USD 1,600,000 (161,835) (122,724)20-Mar-2013 RBS Caesars Entertainment Operating 5.625% 01/06/2015 Seller USD 3,250,000 (328,728) (295,325)20-Mar-2013 UBS Eastman Kodak 7.250% 15/11/2013 Seller USD 3,100,000 (1,826,456) (481,400)20-Mar-2013 Credit Suisse K Hovnanian Enterprises 8.625% 15/01/2017 Seller USD 1,450,000 (311,722) (222,305)20-Mar-2013 Credit Suisse K Hovnanian Enterprises 8.625% 15/01/2017 Seller USD 2,900,000 (623,444) (445,013)20-Mar-2013 Morgan Stanley K Hovnanian Enterprises 8.625% 15/01/2017 Seller USD 1,400,000 (300,973) (214,834)20-Mar-2013 RBS K Hovnanian Enterprises 8.625% 15/01/2017 Seller USD 580,000 (124,608) 14,35020-Mar-2013 Citibank Liz Claiborne 5.000% 08/07/2013 Seller USD 2,610,000 74,259 127,54720-Mar-2013 Citibank Liz Claiborne 5.000% 08/07/2013 Seller USD 3,400,000 97,209 74,07020-Mar-2013 UBS Liz Claiborne 5.000% 08/07/2013 Seller USD 7,200,000 204,853 351,85320-Jun-2013 Barclays Bank Clear Channel Communications 6.875% 15/06/2018 Seller USD 2,800,000 (194,644) 164,68920-Jun-2013 Barclays Bank Clear Channel Communications 6.875% 15/06/2018 Seller USD 4,200,000 (291,966) 194,53420-Jun-2013 Morgan Stanley Clear Channel Communications 6.875% 15/06/2018 Seller USD 1,550,000 (107,750) (95,694)20-Jun-2013 RBS Clear Channel Communications 6.875% 15/06/2018 Seller USD 5,150,000 (358,006) (413,798)20-Jun-2013 Barclays Bank Dixons Retail 8.750% 03/08/2015 Seller EUR 13,600,000 (1,356,446) (429,639)20-Jun-2013 Barclays Bank Dixons Retail 8.750% 03/08/2015 Seller EUR 6,800,000 (678,223) (201,334)20-Jun-2013 Barclays Bank Eastman Kodak 7.250% 15/11/2013 Seller USD 1,700,000 (1,008,973) (858,334)20-Jun-2013 Barclays Bank Eastman Kodak 7.250% 15/11/2013 Seller USD 1,650,000 (979,297) (825,755)20-Jun-2013 Barclays Bank Eastman Kodak 7.250% 15/11/2013 Seller USD 1,650,000 (979,297) (793,443)20-Jun-2013 Citibank Eastman Kodak 7.250% 15/11/2013 Seller USD 1,700,000 (1,008,973) (851,959)20-Jun-2013 Citibank Eastman Kodak 7.250% 15/11/2013 Seller USD 1,700,000 (1,008,973) (844,875)
150

JPMorgan Investment Funds - Income Opportunity Fund
Schedule of Investments - Outstanding Credit Default Swaps (Expressed in USD) (continued)
As at 31 December 2011
TerminationDate Counterparty Referenced Obligation
ProtectionBuyer/Seller Currency Nominal
MarketValue
UnrealisedGain/(Loss)
20-Jun-2013 Citibank Eastman Kodak 7.250% 15/11/2013 Seller USD 1,750,000 (1,038,648) (861,218)20-Jun-2013 Deutsche Bank Eastman Kodak 7.250% 15/11/2013 Seller USD 3,350,000 (1,988,270) (1,707,707)20-Jun-2013 Deutsche Bank Eastman Kodak 7.250% 15/11/2013 Seller USD 3,400,000 (2,017,945) (1,733,668)20-Jun-2013 Deutsche Bank Eastman Kodak 7.250% 15/11/2013 Seller USD 3,350,000 (1,988,270) (1,708,638)20-Jun-2013 Deutsche Bank Eastman Kodak 7.250% 15/11/2013 Seller USD 1,650,000 (979,297) (824,838)20-Jun-2013 Deutsche Bank Eastman Kodak 7.250% 15/11/2013 Seller USD 1,700,000 (1,008,973) (840,862)20-Jun-2013 Deutsche Bank Eastman Kodak 7.250% 15/11/2013 Seller USD 1,650,000 (979,297) (801,464)20-Jun-2013 UBS Eastman Kodak 7.250% 15/11/2013 Seller USD 1,700,000 (1,008,973) (817,487)20-Jun-2013 Barclays Bank K Hovnanian Enterprises 8.625% 15/01/2017 Seller USD 6,300,000 (1,703,111) (1,579,736)20-Jun-2013 Barclays Bank K Hovnanian Enterprises 8.625% 15/01/2017 Seller USD 4,700,000 (1,270,575) (1,101,349)20-Jun-2013 Barclays Bank K Hovnanian Enterprises 8.625% 15/01/2017 Seller USD 1,650,000 (446,053) (192,136)20-Jun-2013 Deutsche Bank K Hovnanian Enterprises 8.625% 15/01/2017 Seller USD 3,150,000 (851,556) (727,743)20-Jun-2013 Deutsche Bank K Hovnanian Enterprises 8.625% 15/01/2017 Seller USD 1,700,000 (459,570) (301,847)20-Jun-2013 Deutsche Bank K Hovnanian Enterprises 8.625% 15/01/2017 Seller USD 1,600,000 (432,536) (237,203)20-Jun-2013 Deutsche Bank K Hovnanian Enterprises 8.625% 15/01/2017 Seller USD 5,100,000 (1,378,709) (676,059)20-Jun-2013 Deutsche Bank K Hovnanian Enterprises 8.625% 15/01/2017 Seller USD 1,650,000 (446,053) (228,574)20-Jun-2013 Deutsche Bank K Hovnanian Enterprises 8.625% 15/01/2017 Seller USD 1,700,000 (459,570) (211,181)20-Jun-2013 Deutsche Bank K Hovnanian Enterprises 8.625% 15/01/2017 Seller USD 1,650,000 (446,053) (213,449)20-Jun-2013 Deutsche Bank K Hovnanian Enterprises 8.625% 15/01/2017 Seller USD 1,650,000 (446,053) (175,636)20-Jun-2013 Deutsche Bank K Hovnanian Enterprises 8.625% 15/01/2017 Seller USD 3,350,000 (905,623) (356,595)20-Jun-2013 Deutsche Bank K Hovnanian Enterprises 8.625% 15/01/2017 Seller USD 1,650,000 (446,053) (177,011)20-Jun-2013 UBS K Hovnanian Enterprises 8.625% 15/01/2017 Seller USD 1,700,000 (459,570) (173,639)20-Jun-2013 UBS K Hovnanian Enterprises 8.625% 15/01/2017 Seller USD 1,650,000 (446,053) (169,220)20-Jun-2013 UBS Lennar 6.500% 15/04/2016 Seller USD 14,175,000 707,023 (316,155)20-Jun-2013 UBS Level 3 Communications 9.000% 15/10/2013 Seller USD 1,430,000 7,837 125,61320-Jun-2013 Bank of America Realogy 10.500% 15/04/2014 Seller USD 4,350,000 (293,157) (296,178)20-Jun-2013 Bank of America Realogy 10.500% 15/04/2014 Seller USD 1,650,000 (111,198) (129,073)20-Jun-2013 Bank of America Realogy 10.500% 15/04/2014 Seller USD 3,450,000 (232,504) (262,212)20-Jun-2013 Bank of America Realogy 10.500% 15/04/2014 Seller USD 3,350,000 (225,765) (247,168)20-Jun-2013 Bank of America Realogy 10.500% 15/04/2014 Seller USD 1,700,000 (114,567) (118,345)20-Jun-2013 Citibank Realogy 10.500% 15/04/2014 Seller USD 7,100,000 (478,487) (494,265)20-Jun-2013 Deutsche Bank Realogy 10.500% 15/04/2014 Seller USD 1,700,000 (114,567) (125,428)20-Jun-2013 UBS Realogy 10.500% 15/04/2014 Seller USD 1,700,000 (114,567) (126,373)20-Jun-2013 Deutsche Bank Rite Aid 7.700% 15/02/2027 Seller USD 1,700,000 (32,493) (14,076)20-Jun-2013 Deutsche Bank Rite Aid 7.700% 15/02/2027 Seller USD 1,700,000 (32,493) (14,312)20-Jun-2013 UBS Rite Aid 7.700% 15/02/2027 Seller USD 1,650,000 (31,537) (19,849)20-Sep-2013 Deutsche Bank Clear Channel Communications 6.875% 15/06/2018 Seller USD 6,750,000 (627,733) (344,608)20-Sep-2013 Credit Suisse Eastman Kodak 7.250% 15/11/2013 Seller USD 1,600,000 (956,259) (686,926)20-Sep-2013 Morgan Stanley Eastman Kodak 7.250% 15/11/2013 Seller USD 700,000 (418,363) (304,030)20-Sep-2013 Deutsche Bank K Hovnanian Enterprises 8.625% 15/01/2017 Seller USD 1,650,000 (527,652) (215,985)20-Sep-2013 Deutsche Bank K Hovnanian Enterprises 8.625% 15/01/2017 Seller USD 1,650,000 (527,652) (213,693)20-Sep-2013 Deutsche Bank K Hovnanian Enterprises 8.625% 15/01/2017 Seller USD 1,650,000 (527,652) (233,173)20-Dec-2013 Citibank Eastman Kodak 7.250% 15/11/2013 Seller USD 2,800,000 (1,684,454) (1,554,176)20-Dec-2013 Citibank Eastman Kodak 7.250% 15/11/2013 Seller USD 2,850,000 (1,714,533) (1,623,096)20-Dec-2013 Morgan Stanley Eastman Kodak 7.250% 15/11/2013 Seller USD 4,350,000 (2,616,919) (2,433,856)20-Dec-2013 UBS Eastman Kodak 7.250% 15/11/2013 Seller USD 2,800,000 (1,684,454) (1,547,176)20-Dec-2013 Barclays Bank First Data 9.875% 24/09/2015 Seller USD 5,550,000 (224,873) 98,87720-Dec-2013 Deutsche Bank Knight Ridder 5.750% 01/09/2017 Seller USD 2,800,000 (213,246) (42,913)20-Dec-2013 Deutsche Bank Knight Ridder 5.750% 01/09/2017 Seller USD 2,850,000 (217,054) (65,845)20-Dec-2013 Morgan Stanley Knight Ridder 5.750% 01/09/2017 Seller USD 4,200,000 (319,869) (106,369)20-Dec-2013 Citibank Realogy 10.500% 15/04/2014 Seller USD 2,900,000 (323,623) 32,43320-Dec-2013 Deutsche Bank Realogy 10.500% 15/04/2014 Seller USD 6,700,000 (747,681) (516,903)20-Dec-2013 Morgan Stanley Realogy 10.500% 15/04/2014 Seller USD 2,900,000 (323,623) 52,57120-Dec-2013 UBS Realogy 10.500% 15/04/2014 Seller USD 2,900,000 (323,623) 46,12720-Dec-2013 Barclays Bank Rite Aid 7.700% 15/02/2027 Seller USD 1,450,000 (52,261) 24,26620-Dec-2013 Citibank Rite Aid 7.700% 15/02/2027 Seller USD 2,900,000 (104,523) 48,53320-Dec-2013 Deutsche Bank Rite Aid 7.700% 15/02/2027 Seller USD 2,800,000 (100,919) 125,80420-Dec-2013 Deutsche Bank Rite Aid 7.700% 15/02/2027 Seller USD 5,750,000 (207,244) 106,61120-Dec-2013 Deutsche Bank Rite Aid 7.700% 15/02/2027 Seller USD 5,800,000 (209,046) 97,06620-Dec-2013 Deutsche Bank Rite Aid 7.700% 15/02/2027 Seller USD 4,300,000 (155,580) 39,11420-Dec-2013 Deutsche Bank Rite Aid 7.700% 15/02/2027 Seller USD 7,150,000 (258,697) 115,68520-Dec-2013 UBS Rite Aid 7.700% 15/02/2027 Seller USD 2,900,000 (104,523) 53,76920-Dec-2013 UBS Rite Aid 7.700% 15/02/2027 Seller USD 1,450,000 (52,463) 9,16220-Mar-2014 Barclays Bank Clear Channel Communications 6.875% 15/06/2018 Seller USD 2,850,000 (387,455) (237,434)20-Mar-2014 Citibank Clear Channel Communications 6.875% 15/06/2018 Seller USD 2,850,000 (387,455) (238,226)20-Mar-2014 Citibank Clear Channel Communications 6.875% 15/06/2018 Seller USD 4,550,000 (618,568) (514,929)20-Mar-2014 Citibank Clear Channel Communications 6.875% 15/06/2018 Seller USD 3,150,000 (428,239) (352,989)20-Mar-2014 Citibank Clear Channel Communications 6.875% 15/06/2018 Seller USD 8,200,000 (1,114,782) (918,893)20-Mar-2014 Citibank Clear Channel Communications 6.875% 15/06/2018 Seller USD 6,300,000 (856,479) (698,104)20-Mar-2014 Morgan Stanley Clear Channel Communications 6.875% 15/06/2018 Seller USD 2,850,000 (387,455) (223,976)20-Mar-2014 Deutsche Bank Eastman Kodak 7.250% 15/11/2013 Seller USD 5,850,000 (3,541,888) (3,308,699)20-Mar-2014 Deutsche Bank Eastman Kodak 7.250% 15/11/2013 Seller USD 1,475,000 (893,040) (804,950)20-Mar-2014 Deutsche Bank Eastman Kodak 7.250% 15/11/2013 Seller USD 2,950,000 (1,786,080) (1,580,400)20-Mar-2014 Deutsche Bank Eastman Kodak 7.250% 15/11/2013 Seller USD 2,900,000 (1,755,808) (1,554,016)20-Mar-2014 Morgan Stanley Eastman Kodak 7.250% 15/11/2013 Seller USD 2,950,000 (1,786,080) (1,609,900)20-Mar-2014 Morgan Stanley Eastman Kodak 7.250% 15/11/2013 Seller USD 1,500,000 (908,176) (830,676)20-Mar-2014 UBS Eastman Kodak 7.250% 15/11/2013 Seller USD 5,850,000 (3,541,888) (3,221,762)20-Mar-2014 Barclays Bank K Hovnanian Enterprises 8.625% 15/01/2017 Seller USD 4,750,000 (1,909,710) (1,700,578)20-Mar-2014 Deutsche Bank K Hovnanian Enterprises 8.625% 15/01/2017 Seller USD 4,750,000 (1,909,710) (1,699,919)20-Mar-2014 Deutsche Bank K Hovnanian Enterprises 8.625% 15/01/2017 Seller USD 12,600,000 (5,065,758) (4,416,507)20-Mar-2014 Deutsche Bank K Hovnanian Enterprises 8.625% 15/01/2017 Seller USD 9,900,000 (3,980,238) (3,408,238)20-Mar-2014 UBS K Hovnanian Enterprises 8.625% 15/01/2017 Seller USD 9,450,000 (3,799,319) (3,429,193)20-Mar-2014 UBS K Hovnanian Enterprises 8.625% 15/01/2017 Seller USD 3,150,000 (1,266,440) (1,143,502)20-Mar-2014 UBS K Hovnanian Enterprises 8.625% 15/01/2017 Seller USD 3,150,000 (1,266,440) (1,115,065)20-Mar-2014 UBS K Hovnanian Enterprises 8.625% 15/01/2017 Seller USD 3,150,000 (1,266,440) (1,115,940)20-Mar-2014 UBS K Hovnanian Enterprises 8.625% 15/01/2017 Seller USD 3,300,000 (1,326,288) (1,004,997)
151

JPMorgan Investment Funds - Income Opportunity Fund
Schedule of Investments - Outstanding Credit Default Swaps (Expressed in USD) (continued)
As at 31 December 2011
TerminationDate Counterparty Referenced Obligation
ProtectionBuyer/Seller Currency Nominal
MarketValue
UnrealisedGain/(Loss)
20-Mar-2014 UBS K Hovnanian Enterprises 8.625% 15/01/2017 Seller USD 3,150,000 (1,266,002) (960,627)20-Mar-2014 UBS K Hovnanian Enterprises 8.625% 15/01/2017 Seller USD 3,250,000 (1,306,193) (967,651)20-Mar-2014 UBS K Hovnanian Enterprises 8.625% 15/01/2017 Seller USD 4,850,000 (1,949,242) (1,385,429)20-Mar-2014 UBS Level 3 Communications 15.000% 15/01/2013 Seller USD 5,000,000 (54,101) 14,64920-Mar-2014 Bank of America Level 3 Communications 3.500% 15/06/2012 Seller USD 1,550,000 (16,771) 4,32620-Mar-2014 Barclays Bank Level 3 Communications 9.000% 15/10/2013 Seller USD 1,450,000 (15,689) 69,90120-Mar-2014 BNP Paribas Level 3 Communications 9.000% 15/10/2013 Seller USD 2,850,000 (30,837) 90,28820-Mar-2014 BNP Paribas Level 3 Communications 9.000% 15/10/2013 Seller USD 2,900,000 (31,378) 145,03820-Mar-2014 UBS Level 3 Communications 9.000% 15/10/2013 Seller USD 2,900,000 (31,378) 116,03820-Mar-2014 UBS Level 3 Communications 9.000% 15/10/2013 Seller USD 2,900,000 (31,378) 129,73320-Mar-2014 Credit Suisse Rite Aid 7.700% 15/02/2027 Seller USD 1,650,000 (72,525) (12,254)20-Mar-2014 Deutsche Bank Rite Aid 7.700% 15/02/2027 Seller USD 19,100,000 (842,181) 325,04120-Mar-2014 Deutsche Bank Rite Aid 7.700% 15/02/2027 Seller USD 1,700,000 (74,723) 14,99920-Mar-2014 UBS Rite Aid 7.700% 15/02/2027 Seller USD 1,600,000 (70,549) 6,56220-Mar-2014 UBS Rite Aid 7.700% 15/02/2027 Seller USD 2,000,000 (88,186) 27,36920-Mar-2014 UBS Rite Aid 7.700% 15/02/2027 Seller USD 3,350,000 (147,248) 16,53020-Jun-2014 Bank of America Boyd Gaming 6.750% 15/04/2014 Seller USD 3,450,000 (339,896) (324,083)20-Jun-2014 BNP Paribas Boyd Gaming 6.750% 15/04/2014 Seller USD 1,550,000 (152,707) (113,526)20-Jun-2014 Deutsche Bank Boyd Gaming 6.750% 15/04/2014 Seller USD 3,400,000 (334,970) (289,164)20-Jun-2014 Deutsche Bank Boyd Gaming 6.750% 15/04/2014 Seller USD 16,850,000 (1,660,070) (1,603,435)20-Jun-2014 Deutsche Bank Boyd Gaming 6.750% 15/04/2014 Seller USD 17,000,000 (1,674,848) (1,639,431)20-Jun-2014 Deutsche Bank Boyd Gaming 6.750% 15/04/2014 Seller USD 10,150,000 (999,983) (959,101)20-Jun-2014 Deutsche Bank Boyd Gaming 6.750% 15/04/2014 Seller USD 11,850,000 (1,167,467) (1,096,025)20-Jun-2014 Morgan Stanley Boyd Gaming 6.750% 15/04/2014 Seller USD 6,300,000 (620,679) (527,929)20-Jun-2014 Morgan Stanley Clear Channel Communications 6.875% 15/06/2018 Seller USD 6,300,000 (1,145,402) (879,402)20-Jun-2014 Deutsche Bank Eastman Kodak 7.250% 15/11/2013 Seller USD 6,750,000 (4,124,030) (3,224,028)20-Jun-2014 Deutsche Bank Eastman Kodak 7.250% 15/11/2013 Seller USD 5,050,000 (3,085,385) (2,226,183)20-Jun-2014 Deutsche Bank Eastman Kodak 7.250% 15/11/2013 Seller USD 5,790,000 (3,537,501) (2,730,921)20-Jun-2014 UBS Eastman Kodak 7.250% 15/11/2013 Seller USD 1,020,000 (623,187) (493,562)20-Jun-2014 UBS Gannett 6.375% 01/04/2012 Seller USD 13,600,000 925,011 (512,624)20-Jun-2014 Barclays Bank K Hovnanian Enterprises 8.625% 15/01/2017 Seller USD 3,350,000 (1,442,834) (962,202)20-Jun-2014 Barclays Bank K Hovnanian Enterprises 8.625% 15/01/2017 Seller USD 3,400,000 (1,464,369) (977,980)20-Jun-2014 Barclays Bank K Hovnanian Enterprises 8.625% 15/01/2017 Seller USD 3,350,000 (1,442,834) (930,563)20-Jun-2014 Barclays Bank K Hovnanian Enterprises 8.625% 15/01/2017 Seller USD 1,650,000 (710,649) (283,483)20-Jun-2014 Deutsche Bank K Hovnanian Enterprises 8.625% 15/01/2017 Seller USD 3,350,000 (1,442,834) (830,993)20-Jun-2014 Deutsche Bank K Hovnanian Enterprises 8.625% 15/01/2017 Seller USD 1,700,000 (732,184) (413,198)20-Jun-2014 Deutsche Bank K Hovnanian Enterprises 8.625% 15/01/2017 Seller USD 1,600,000 (689,115) (361,781)20-Jun-2014 UBS K Hovnanian Enterprises 8.625% 15/01/2017 Seller USD 3,400,000 (1,464,369) (969,480)20-Jun-2014 UBS K Hovnanian Enterprises 8.625% 15/01/2017 Seller USD 6,800,000 (2,928,737) (1,820,904)20-Jun-2014 Bank of America Knight Ridder 5.750% 01/09/2017 Seller USD 6,400,000 (729,765) (679,987)20-Jun-2014 Bank of America Knight Ridder 5.750% 01/09/2017 Seller USD 1,650,000 (188,142) (175,538)20-Jun-2014 Bank of America Knight Ridder 5.750% 01/09/2017 Seller USD 6,500,000 (741,167) (692,417)20-Jun-2014 Citibank Knight Ridder 5.750% 01/09/2017 Seller USD 1,700,000 (193,844) (126,552)20-Jun-2014 Morgan Stanley Knight Ridder 5.750% 01/09/2017 Seller USD 6,550,000 (746,868) (725,035)20-Jun-2014 Morgan Stanley Knight Ridder 5.750% 01/09/2017 Seller USD 1,700,000 (193,844) (130,566)20-Jun-2014 Morgan Stanley Knight Ridder 5.750% 01/09/2017 Seller USD 2,100,000 (239,454) (142,037)20-Jun-2014 UBS Knight Ridder 5.750% 01/09/2017 Seller USD 16,350,000 (1,864,320) (1,778,029)20-Jun-2014 UBS Knight Ridder 5.750% 01/09/2017 Seller USD 6,500,000 (741,167) (692,417)20-Jun-2014 UBS Knight Ridder 5.750% 01/09/2017 Seller USD 4,900,000 (558,726) (431,462)20-Jun-2014 Bank of America Realogy 10.500% 15/04/2014 Seller USD 2,800,000 (431,052) (382,441)20-Jun-2014 Citibank Realogy 10.500% 15/04/2014 Seller USD 3,350,000 (515,722) (357,993)20-Jun-2014 Deutsche Bank Realogy 10.500% 15/04/2014 Seller USD 1,700,000 (261,710) (204,571)20-Jun-2014 Deutsche Bank Realogy 10.500% 15/04/2014 Seller USD 6,800,000 (1,046,840) (822,062)20-Jun-2014 UBS Realogy 10.500% 15/04/2014 Seller USD 1,700,000 (261,710) (194,654)20-Jun-2014 UBS Realogy 10.500% 15/04/2014 Seller USD 1,700,000 (261,710) (221,099)20-Jun-2014 Bank of America Rite Aid 7.700% 15/02/2027 Seller USD 10,000,000 (542,953) 5,65820-Sep-2014 Barclays Bank Clear Channel Communications 6.875% 15/06/2018 Seller USD 3,150,000 (703,763) (508,200)20-Sep-2014 Deutsche Bank Clear Channel Communications 6.875% 15/06/2018 Seller USD 3,250,000 (726,105) (586,625)20-Sep-2014 Morgan Stanley Clear Channel Communications 6.875% 15/06/2018 Seller USD 7,850,000 (1,753,822) (1,453,996)20-Sep-2014 Morgan Stanley Clear Channel Communications 6.875% 15/06/2018 Seller USD 3,250,000 (726,105) (601,973)20-Sep-2014 Morgan Stanley Clear Channel Communications 6.875% 15/06/2018 Seller USD 3,250,000 (726,105) (590,688)20-Sep-2014 UBS Clear Channel Communications 6.875% 15/06/2018 Seller USD 2,900,000 (648,311) (371,200)20-Sep-2014 UBS Clear Channel Communications 6.875% 15/06/2018 Seller USD 8,200,000 (1,832,018) (1,508,574)20-Sep-2014 Deutsche Bank Realogy 10.500% 15/04/2014 Seller USD 2,700,000 (472,292) (336,542)20-Sep-2014 Barclays Bank SUPERVALU 8.000% 01/05/2016 Seller USD 2,400,000 (125,586) (22,920)20-Mar-2015 Citibank Knight Ridder 5.750% 01/09/2017 Seller USD 1,450,000 (246,942) (178,268)20-Mar-2015 Citibank Knight Ridder 5.750% 01/09/2017 Seller USD 1,450,000 (246,942) (178,873)20-Mar-2015 Citibank Knight Ridder 5.750% 01/09/2017 Seller USD 2,900,000 (493,884) (392,384)20-Mar-2015 Citibank Knight Ridder 5.750% 01/09/2017 Seller USD 4,400,000 (749,341) (584,952)20-Mar-2015 Deutsche Bank Knight Ridder 5.750% 01/09/2017 Seller USD 2,850,000 (485,369) (350,389)20-Dec-2015 Citibank SUPERVALU 7.500% 15/05/2012 Seller USD 2,800,000 (254,839) (122,617)20-Dec-2015 Deutsche Bank SUPERVALU 7.500% 15/05/2012 Seller USD 2,800,000 (254,839) (122,617)20-Dec-2015 UBS SUPERVALU 7.500% 15/05/2012 Seller USD 2,800,000 (254,839) (122,617)20-Dec-2015 BNP Paribas SUPERVALU 8.000% 01/05/2016 Seller USD 1,450,000 (131,970) (35,706)20-Dec-2015 BNP Paribas SUPERVALU 8.000% 01/05/2016 Seller USD 1,450,000 (131,970) (32,283)20-Dec-2015 BNP Paribas SUPERVALU 8.000% 01/05/2016 Seller USD 1,450,000 (131,970) (32,484)20-Dec-2015 UBS SUPERVALU 8.000% 01/05/2016 Seller USD 2,800,000 (254,839) (150,228)20-Dec-2015 UBS SUPERVALU 8.000% 01/05/2016 Seller USD 2,800,000 (254,839) (112,506)20-Dec-2015 UBS SUPERVALU 8.000% 01/05/2016 Seller USD 7,250,000 (659,851) (273,184)20-Dec-2015 UBS SUPERVALU 8.000% 01/05/2016 Seller USD 2,900,000 (263,940) (85,913)20-Mar-2016 Deutsche Bank Mediacom Capital 9.125% 15/08/2019 Seller USD 3,350,000 (1,488) 112,03920-Mar-2016 BNP Paribas SUPERVALU 8.000% 01/05/2016 Seller USD 2,950,000 (289,286) (53,696)20-Mar-2016 BNP Paribas SUPERVALU 8.000% 01/05/2016 Seller USD 2,950,000 (289,286) (44,272)20-Mar-2016 BNP Paribas SUPERVALU 8.000% 01/05/2016 Seller USD 1,600,000 (156,901) (4,679)20-Mar-2016 BNP Paribas SUPERVALU 8.000% 01/05/2016 Seller USD 2,500,000 (244,811) (13,909)20-Mar-2016 Credit Suisse SUPERVALU 8.000% 01/05/2016 Seller USD 3,150,000 (308,899) (42,461)
152

JPMorgan Investment Funds - Income Opportunity Fund
Schedule of Investments - Outstanding Credit Default Swaps (Expressed in USD) (continued)
As at 31 December 2011
TerminationDate Counterparty Referenced Obligation
ProtectionBuyer/Seller Currency Nominal
MarketValue
UnrealisedGain/(Loss)
20-Mar-2016 Credit Suisse SUPERVALU 8.000% 01/05/2016 Seller USD 950,000 (93,160) 4,74320-Mar-2016 Deutsche Bank SUPERVALU 8.000% 01/05/2016 Seller USD 9,150,000 (896,010) (531,280)20-Mar-2016 Morgan Stanley SUPERVALU 8.000% 01/05/2016 Seller USD 2,850,000 (279,480) (43,959)20-Mar-2016 Morgan Stanley SUPERVALU 8.000% 01/05/2016 Seller USD 1,550,000 (151,998) (14,651)20-Mar-2016 UBS SUPERVALU 8.000% 01/05/2016 Seller USD 4,300,000 (421,671) (87,227)20-Mar-2016 UBS SUPERVALU 8.000% 01/05/2016 Seller USD 3,150,000 (308,899) 11,78920-Jun-2016 Deutsche Bank SUPERVALU 8.000% 01/05/2016 Seller USD 1,550,000 (166,354) (18,673)20-Sep-2016 Deutsche Bank Amkor Technology 9.250% 01/06/2016 Seller USD 3,400,000 (181,722) (258,151)20-Sep-2016 Deutsche Bank Block Financial 5.125% 30/10/2014 Seller USD 5,050,000 (89,889) (308,075)20-Sep-2016 Morgan Stanley Block Financial 5.125% 30/10/2014 Seller USD 3,400,000 (60,520) (142,073)20-Sep-2016 BNP Paribas SUPERVALU 8.000% 01/05/2016 Seller USD 3,200,000 (372,098) 22,12420-Dec-2016 UBS Block Financial 5.125% 30/10/2014 Seller USD 29,600,000 (517,430) (596,336)20-Dec-2016 UBS CDX.NA.IG_17 Seller USD 31,500,000 (285,795) 239,42420-Dec-2016 Morgan Stanley Copper Tire & Rubber 7.625% 15/03/2027 Seller USD 1,450,000 (33,973) 4,69420-Dec-2016 UBS Copper Tire & Rubber 7.625% 15/03/2027 Seller USD 3,900,000 (91,375) 135,61820-Dec-2016 UBS Copper Tire & Rubber 7.625% 15/03/2027 Seller USD 3,900,000 (91,375) 177,78220-Dec-2016 Barclays Bank Georgia-Pacific 7.750% 15/11/2029 Seller USD 7,850,000 (176,290) 219,41320-Dec-2016 Morgan Stanley Italy (Republic of) 6.875% 27/09/2023 Seller USD 7,800,000 (1,204,087) 235,88920-Dec-2016 Barclays Bank Standard Pacific 10.750% 15/09/2016 Seller USD 500,000 (29,603) 5,39720-Dec-2016 Barclays Bank Standard Pacific 10.750% 15/09/2016 Seller USD 7,350,000 (435,171) 78,30820-Dec-2016 Credit Suisse Standard Pacific 10.750% 15/09/2016 Seller USD 1,850,000 (109,533) (17,804)20-Dec-2016 Deutsche Bank Standard Pacific 10.750% 15/09/2016 Seller USD 9,400,000 (556,545) (42,157)20-Mar-2017 Barclays Bank ConAgra Foods 7.000% 01/10/2028 Seller USD 14,500,000 269,588 22,02220-Mar-2017 Citibank Freeport-McMoRan Copper & Gold 8.375% 01/04/2017 Seller USD 11,500,000 (552,050) 4,43620-Mar-2017 UBS Macy’s Retail Holdings 7.450% 15/07/2017 Seller USD 14,500,000 (274,704) 7,59420-Mar-2017 Barclays Bank RR Donnelley & Sons 6.125% 15/01/2017 Seller USD 8,600,000 (604,620) 59,49125-Jan-2038 Citibank ABX_07_2 Seller USD 3,300,000 (2,140,846) (95,751)25-Jan-2038 Citibank ABX_HE_PEN_07_2 Seller USD 10,000,000 (6,487,410) 186,53325-Jan-2038 Citibank ABX_HE_PEN_07_2 Seller USD 14,000,000 (9,082,375) 11,41712-Jan-2041 Credit Suisse IOS FN30 350 Indices Seller USD 7,575,000 (47,013) (27,360)15-Mar-2049 Citibank CMBX-02-1 Seller USD 4,900,000 (2,827,829) (525,169)15-Mar-2049 Deutsche Bank CMBX-02-1 Seller USD 5,550,000 (3,202,949) (400,392)15-Mar-2049 Morgan Stanley CMBX-02-1 Seller USD 5,550,000 (3,202,949) (400,392)15-Mar-2049 UBS CMBX-02-1 Seller USD 2,950,000 (493,908) 154,02615-Mar-2049 Credit Suisse CMBX-02-1 Seller USD 4,375,000 (732,491) 140,74715-Mar-2049 Credit Suisse CMBX-02-1 Seller USD 7,325,000 (1,226,399) 45,50513-Dec-2049 Barclays Bank CMBX_NA_A3 Seller USD 5,350,000 (3,908,532) (178,934)13-Dec-2049 Morgan Stanley CMBX_NA_A3 Seller USD 2,670,000 (1,950,613) (82,625)13-Dec-2049 Credit Suisse CMBX-03-1 Seller USD 4,425,000 (894,363) 287,72713-Dec-2049 Credit Suisse CMBX-03-1 Seller USD 2,900,000 (586,136) 137,69617-Feb-2051 Morgan Stanley CMBX-04-1 Seller USD 7,400,000 (1,802,811) 618,32617-Feb-2051 Citibank CMNAJ 04-1 Seller USD 6,950,000 (3,031,196) (783,171)
Total(228,297,882) (139,844,522)
153

Transferable Securities Admitted to an Official Exchange Listing
Shares
JAPAN890,000 Amada 433,430,000 2.14121,300 Astellas Pharma 379,062,500 1.86121,900 Benesse Holdings 451,944,250 2.23168,800 Canon 574,764,000 2.83
5,269 Dai-ichi Life Insurance 398,336,400 1.9645,400 Daito Trust Construction 299,640,000 1.47
667,000 Denki Kagaku Kogyo 189,428,000 0.932,798,000 DIC 390,321,000 1.92
73,100 East Japan Railway 358,190,000 1.76157,900 Electric Power Development 322,826,550 1.59201,100 FUJIFILM Holdings 366,102,550 1.80
504,000 Fujitsu 202,104,000 0.99267,000 H2O Retailing 156,729,000 0.77690,000 Hitachi 278,760,000 1.37
1,458,000 Hokuhoku Financial Group 217,971,000 1.07174,700 Honda Motor 409,758,850 2.02
2,022 Japan Tobacco 732,975,000 3.61292,300 JFE Holdings 407,466,200 2.01936,700 JX Holdings 436,502,200 2.15
614 KDDI 303,930,000 1.50128,300 Komatsu 230,683,400 1.14982,000 Marubeni 460,558,000 2.27
1,376,000 Minebea 444,448,000 2.19672,200 Mitsubishi UFJ Financial Group 219,137,200 1.08645,000 Mitsui OSK Lines 191,887,500 0.95
27,400 Nintendo 290,166,000 1.432,013,000 Nippon Sheet Glass 288,865,500 1.42
726,000 Nippon Steel 139,392,000 0.69160,800 Nippon Telegraph & Telephone 632,346,000 3.11
2,773,000 Nippon Yusen 546,281,000 2.69994,000 Nishi-Nippon City Bank 219,177,000 1.08811,700 Nissan Motor 560,884,700 2.7642,400 Nitto Denko 116,896,800 0.58
267,300 Nomura Real Estate Holdings 305,924,850 1.5134,400 ORIX 218,956,000 1.08
261,000 Otsuka Holdings 564,021,000 2.78832,200 Resona Holdings 281,699,700 1.39608,000 Ricoh 407,360,000 2.01652,200 Sapporo Hokuyo Holdings 180,659,400 0.8970,700 Sega Sammy Holdings 117,715,500 0.58
387,100 Seiko Epson 395,616,200 1.95112,000 Shiseido 158,368,000 0.7892,800 Softbank 210,145,600 1.03
475,100 Sumitomo 494,341,550 2.43469,000 Sumitomo Bakelite 201,904,500 0.99621,000 Sumitomo Chemical 174,190,500 0.86
1,075,000 Sumitomo Heavy Industries 482,137,500 2.37359,700 Sumitomo Mitsui Financial Group 771,016,950 3.80
16,000 Sumitomo Realty & Development 21,544,000 0.11304,200 Sumitomo Rubber Industries 280,776,600 1.38155,700 Sundrug 363,559,500 1.79147,700 Suzuken 314,896,400 1.5597,900 Tokio Marine Holdings 166,674,750 0.82
923,000 Tokyo Gas 326,280,500 1.61534,000 Tokyu Land 155,394,000 0.76
1,493,000 Toshiba 468,802,000 2.31419,000 Toto 248,886,000 1.22299,600 Toyota Motor 767,425,400 3.78
69,390 Yamada Denki 362,909,700 1.79
20,092,170,700 98.94
Total Shares 20,092,170,700 98.94
Total Transferable Securities Admitted to anOfficial Exchange Listing
20,092,170,700 98.94
Total Investments 20,092,170,700 98.94
Cash 210,334,750 1.03
Other Assets/(Liabilities) 5,761,271 0.03
Total Net Assets 20,308,266,721 100.00
Allocation of Portfolio as at 31 December 2011 % ofNet Assets
SharesIndustrials 20.77Financials 17.02Consumer Discretionary 16.31Information Technology 12.28Materials 9.20Health Care 6.19Consumer Staples 6.18Telecommunication Services 5.64Utilities 3.20Energy 2.15Total Shares 98.94Cash and Other Assets/(Liabilities) 1.06
Total 100.00
Allocation of Portfolio as at 30 June 2011 (Unaudited) % ofNet Assets
SharesConsumer Discretionary 20.47Industrials 19.25Financials 17.61Information Technology 11.65Materials 10.68Consumer Staples 5.67Health Care 5.58Telecommunication Services 4.38Utilities 2.74Energy 0.99Total Shares 99.02Cash and Other Assets/(Liabilities) 0.98
Total 100.00
154
JPMorgan Investment Funds - Japan 50 Equity Fund
Schedule of Investments (Market Value Expressed in JPY)
As at 31 December 2011
Quantity/Nominal
Value
Name of Securities MarketValue
%of
NetAssets
Quantity/Nominal
Value
Name of Securities MarketValue
%of
NetAssets

JPMorgan Investment Funds - Japan 50 Equity Fund
Schedule of Investments - Outstanding Financial Futures Contracts (Expressed in JPY)
As at 31 December 2011
ExpirationDate
Number ofContracts Security Description Currency
NotionalValue
UnrealisedGain/(Loss)
Equity Futures
Mar-12 15 Topix Index Future JPY 109,200,000 1,096,141
Total 1,096,141
Schedule of Investments - Outstanding Forward Foreign Exchange Contracts (Expressed in JPY)
SettlementDate Currency
AmountPurchased Currency
AmountSold
UnrealisedGain/(Loss)
13-Jan-12 EUR 1,280,998 JPY 133,112,052 (4,794,625)13-Jan-12 JPY 9,249,662 EUR 89,998 234,559
Total (4,560,066)
155

Transferable Securities Admitted to an Official Exchange Listing
Shares
JAPAN2,500 Aeon 34,224 0.783,000 Aichi Steel 15,316 0.353,000 Amada 18,931 0.432,000 Anritsu 21,950 0.50
800 Aoyama Trading 14,958 0.3411,000 Aozora Bank 30,288 0.69
700 Arc Land Sakamoto 13,102 0.301,100 Arcs 20,275 0.46
700 Asahi 14,943 0.34400 Autobacs Seven 18,309 0.42
3,000 Bando Chemical Industries 11,254 0.262,400 Bridgestone 54,220 1.233,000 Calsonic Kansei 17,026 0.392,600 Canon 114,713 2.61
800 Capcom 18,830 0.43800 Cawachi 16,140 0.37
1,100 Century Tokyo Leasing 20,703 0.472,000 Chugoku Marine Paints 12,323 0.281,300 Circle K Sunkus 21,502 0.49
900 Cocokara Fine 23,265 0.53400 Cosmos Pharmaceutical 20,564 0.47
1,600 Credit Saison 31,959 0.7310 CyberAgent 32,400 0.74
1,000 Daido Metal 10,982 0.252,000 Daihatsu Motor 35,646 0.811,100 Daiichikosho 20,717 0.47
300 Daito Trust Construction 25,656 0.593,000 Daiwa House Industry 35,646 0.812,600 DCM Holdings 20,433 0.46
600 Don Quijote 20,575 0.47600 Doshisha 17,302 0.39500 East Japan Railway 31,746 0.72
1,800 EDION 14,636 0.33400 Fanuc 61,004 1.39800 Fuji Machine Manufacturing 14,181 0.32600 Fukuda Denshi 17,050 0.39
6,000 Fukuoka Financial Group 25,190 0.573,000 Fukuyama Transporting 18,037 0.41
700 Fuyo General Lease 24,023 0.55600 Gree 20,614 0.47
3,000 Hino Motors 18,154 0.41800 HIS 22,759 0.52
16,000 Hitachi 83,758 1.911,100 Hitachi Capital 15,180 0.35
3,000 Hokuetsu Kishu Paper 20,155 0.462,100 Honda Motor 63,823 1.45
600 Horiba 17,998 0.41300 Idemitsu Kosan 30,845 0.70
2,000 Iida Home Max 14,901 0.345,400 ITOCHU 54,752 1.252,200 Itochu Enex 12,415 0.28
300 Itochu Techno-Solutions 13,411 0.304,000 Jaccs 11,895 0.27
400 Japan Petroleum Exploration 15,588 0.3612 Japan Tobacco 56,365 1.28
4,000 JFE Shoji Holdings 16,560 0.381,000 JGC 23,965 0.541,100 JS Group 20,995 0.481,700 JSP 26,742 0.61
400 K’s Holdings 15,782 0.36400 Kadokawa Group Holdings 13,857 0.31700 Kakaku.com 25,619 0.58
2,000 Kaken Pharmaceutical 26,537 0.6011 KDDI 70,554 1.60
100 Keyence 24,075 0.552,700 Komatsu 62,904 1.43
700 Konami 20,934 0.48700 Kyoei Steel 12,943 0.29
3,000 Maeda 10,943 0.252,000 Maeda Road Construction 20,965 0.487,000 Marubeni 42,540 0.976,000 Marudai Food 21,846 0.501,200 Ministop 22,344 0.512,000 Mitsuba 15,031 0.344,200 Mitsubishi 84,626 1.934,000 Mitsubishi Electric 38,199 0.87
34,900 Mitsubishi UFJ Financial Group 147,423 3.36470 Mitsubishi UFJ Lease & Finance 18,559 0.42
5,200 Mitsui & Co. 80,653 1.8354,300 Mizuho Financial Group 72,822 1.66
1,600 Namco Bandai Holdings 22,691 0.52
1,800 NEC Capital Solutions 26,064 0.59700 NEC Networks and System Integration 10,190 0.23
3,000 Nippo 28,552 0.651,500 Nippon Konpo Unyu Soko 16,142 0.371,100 Nippon Paper Group 23,938 0.54
7,000 Nippon Road 19,864 0.452,000 Nippon Shokubai 21,445 0.496,000 Nippon Soda 27,172 0.622,500 Nippon Telegraph & Telephone 127,389 2.909,000 Nishimatsu Construction 15,335 0.356,300 Nissan Motor 56,408 1.283,000 NSK 19,417 0.44
27 NTT DoCoMo 49,487 1.13900 Oiles 16,956 0.38
6,000 OJI Paper 30,671 0.704,000 Okumura 16,301 0.37
480 ORIX 39,588 0.901,000 Osaka Steel 19,041 0.431,000 Park24 13,262 0.303,000 Press Kogyo 14,383 0.33
15 Rakuten 16,064 0.36700 Ricoh Leasing 15,596 0.35200 Rinnai 14,253 0.32
4,000 Ryobi 14,538 0.333,000 Sakai Chemical Industry 11,079 0.253,000 Sakata INX 13,489 0.31
300 Sanrio 15,364 0.354,000 Sanyo Special Steel 21,199 0.484,500 Sapporo Hokuyo Holdings 16,152 0.373,000 Seino Holdings 23,246 0.534,000 Sekisui House 35,374 0.812,000 Sekisui Jushi 20,097 0.462,200 Seven & I Holdings 61,090 1.393,000 Sharp 26,142 0.60
800 Shimachu 18,317 0.4219,000 Shinsei Bank 19,819 0.45
900 Ship Healthcare Holdings 19,644 0.4545 SKY Perfect JSAT Holdings 22,522 0.51
1,200 Softbank 35,211 0.803,900 Sumitomo 52,581 1.202,800 Sumitomo Forestry 24,562 0.563,900 Sumitomo Mitsui Financial Group 108,321 2.47
12,000 Sumitomo Mitsui Trust Holdings 35,063 0.801,500 Sumitomo Rubber Industries 17,940 0.411,100 Tachi-S 19,192 0.44
2,000 Tadano 12,595 0.296,000 Taihei Kogyo 31,798 0.721,100 Takamatsu Construction Group 17,190 0.39
300 Takeda Pharmaceutical 13,120 0.30700 Tamron 16,812 0.38
1,500 Teikoku Piston Ring 17,522 0.404,000 Toagosei 16,327 0.373,000 Toei 14,150 0.321,700 Tokio Marine Holdings 37,502 0.857,000 Tosoh 18,730 0.438,000 Toyo Tire & Rubber 18,244 0.423,900 Toyota Motor 129,444 2.951,100 Toyota Tsusho 19,377 0.44
3,000 Tsubakimoto Chain 15,394 0.35700 Unipres 20,041 0.46800 Universal Entertainment 22,142 0.50
2,000 U-Shin 16,080 0.371,500 Valor 23,285 0.53
800 West Japan Railway 34,623 0.79700 Xebio 16,599 0.38600 Yachiyo Bank 14,185 0.32380 Yamada Denki 25,752 0.59
3,000 Yokohama Rubber 16,812 0.38700 Yorozu 15,932 0.36
2,000 Zeon 17,298 0.39
4,292,155 97.70
Total Shares 4,292,155 97.70
Total Transferable Securities Admitted to an OfficialExchange Listing
4,292,155 97.70
Total Investments 4,292,155 97.70
Cash 99,914 2.27
Other Assets/(Liabilities) 1,335 0.03
Total Net Assets 4,393,404 100.00
156
JPMorgan Investment Funds - Japan Behavioural Finance Equity Fund
Schedule of Investments (Market Value Expressed in USD)
As at 31 December 2011
Quantity/Nominal
Value
Name of Securities MarketValue
%of
NetAssets
Quantity/Nominal
Value
Name of Securities MarketValue
%of
NetAssets

Allocation of Portfolio as at 31 December 2011 % ofNet Assets
SharesConsumer Discretionary 28.97Industrials 23.24Financials 17.10Materials 9.39Information Technology 7.07Telecommunication Services 6.43Consumer Staples 3.15Health Care 1.29Energy 1.06Total Shares 97.70Cash and Other Assets/(Liabilities) 2.30
Total 100.00
Allocation of Portfolio as at 30 June 2011 (Unaudited) % ofNet Assets
SharesConsumer Discretionary 28.01Industrials 20.37Financials 14.02Materials 11.73Telecommunication Services 7.68Information Technology 7.48Consumer Staples 3.31Energy 3.05Health Care 1.47Total Shares 97.12Cash and Other Assets/(Liabilities) 2.88
Total 100.00
157
JPMorgan Investment Funds - Japan Behavioural Finance Equity Fund
Schedule of Investments (Market Value Expressed in USD) (continued)
As at 31 December 2011
Quantity/Nominal
Value
Name of Securities MarketValue
%of
NetAssets
Quantity/Nominal
Value
Name of Securities MarketValue
%of
NetAssets

Transferable Securities Admitted to an Official Exchange Listing
Shares
JAPAN275,000 77 Bank 91,575,000 1.30
21,900 Benesse Holdings 81,194,250 1.1585,300 Coca-Cola West 113,790,200 1.62
1,434 Dai-ichi Life Insurance 108,410,400 1.54437,000 Denki Kagaku Kogyo 124,108,000 1.76874,000 DIC 121,923,000 1.73
93,000 Dowa Holdings 45,291,000 0.64405,000 Fujikura 91,327,500 1.30259,000 Fukuoka Financial Group 83,916,000 1.19
98,300 Hitachi Capital 104,689,500 1.49790,000 Hokuhoku Financial Group 118,105,000 1.68
21,700 Honda Motor 50,897,350 0.7215,200 Idemitsu Kosan 120,612,000 1.72
258,300 ITOCHU 202,119,750 2.87474 Japan Tobacco 171,825,000 2.44
86,900 JFE Holdings 121,138,600 1.72406,300 JX Holdings 189,335,800 2.69502,000 Kobe Steel 59,487,000 0.85355,000 Marubeni 166,495,000 2.36130,200 Mitsubishi 202,461,000 2.88
604,000 Mitsubishi Materials 125,934,000 1.79827,600 Mitsubishi UFJ Financial Group 269,797,600 3.83172,100 Mitsui & Co. 206,003,700 2.93
286,000 Mitsui Chemicals 67,067,000 0.95546,000 Mitsui Mining & Smelting 109,200,000 1.55418,000 Mitsui OSK Lines 124,355,000 1.77
1,654,500 Mizuho Financial Group 171,240,750 2.4383,000 Nippon Electric Glass 63,246,000 0.9050,100 Nippon Paper Group 84,142,950 1.20
778,000 Nippon Sheet Glass 111,643,000 1.59692,000 Nippon Steel 132,864,000 1.89586,000 Nippon Yusen 115,442,000 1.64479,000 Nishi-Nippon City Bank 105,619,500 1.50246,900 Nissan Motor 170,607,900 2.43813,000 Nisshin Steel 95,934,000 1.36447,700 Nomura Holdings 104,314,100 1.48
18,440 ORIX 117,370,600 1.67378,900 Resona Holdings 128,257,650 1.82281,100 Sapporo Hokuyo Holdings 77,864,700 1.11
1,072,000 Shinsei Bank 86,296,000 1.2347,000 Sony Financial Holdings 53,321,500 0.76
189,100 Sumitomo 196,758,550 2.80280,000 Sumitomo Bakelite 120,540,000 1.71177,800 Sumitomo Electric Industries 148,729,700 2.11
970,000 Sumitomo Metal Industries 135,315,000 1.92131,000 Sumitomo Metal Mining 129,428,000 1.84116,100 Sumitomo Mitsui Financial Group 248,860,350 3.54
722,000 Sumitomo Mitsui Trust Holdings 162,811,000 2.3156,000 Suzuken 119,392,000 1.7062,500 Suzuki Motor 99,437,500 1.41
179,100 T&D Holdings 128,146,050 1.8286,200 Tokio Marine Holdings 146,755,500 2.0998,400 Tokyo Steel Manufacturing 61,549,200 0.88
106,800 Toyota Motor 273,568,200 3.89142,000 Zeon 94,785,000 1.35
6,955,299,350 98.85
Total Shares 6,955,299,350 98.85
Total Transferable Securities Admitted to anOfficial Exchange Listing
6,955,299,350 98.85
Total Investments 6,955,299,350 98.85
Cash 83,362,148 1.19
Other Assets/(Liabilities) (2,769,392) (0.04)
Total Net Assets 7,035,892,106 100.00
Allocation of Portfolio as at 31 December 2011 % ofNet Assets
SharesFinancials 32.79Materials 23.14Industrials 21.29Consumer Discretionary 10.56Energy 4.41Consumer Staples 4.06Health Care 1.70Information Technology 0.90Total Shares 98.85Cash and Other Assets/(Liabilities) 1.15
Total 100.00
Allocation of Portfolio as at 30 June 2011 (Unaudited) % ofNet Assets
SharesFinancials 31.51Industrials 19.96Materials 16.78Consumer Discretionary 13.25Consumer Staples 5.03Energy 4.36Health Care 3.31Telecommunication Services 2.86Information Technology 1.30Utilities 1.04Total Shares 99.40Cash and Other Assets/(Liabilities) 0.60
Total 100.00
158
JPMorgan Investment Funds - Japan Focus Fund
Schedule of Investments (Market Value Expressed in JPY)
As at 31 December 2011
Quantity/Nominal
Value
Name of Securities MarketValue
%of
NetAssets
Quantity/Nominal
Value
Name of Securities MarketValue
%of
NetAssets

JPMorgan Investment Funds - Japan Focus Fund
Schedule of Investments - Outstanding Financial Futures Contracts (Expressed in JPY)
As at 31 December 2011
ExpirationDate
Number ofContracts Security Description Currency
NotionalValue
UnrealisedGain/(Loss)
Equity Futures
Mar-12 5 Topix Index Future JPY 36,400,000 325,000
Total 325,000
159

Transferable Securities Admitted to an Official Exchange Listing
Shares
JAPAN218,000 77 Bank 72,594,000 0.28259,000 Amada 126,133,000 0.48110,400 Asahi Group Holdings 186,520,800 0.71189,600 Astellas Pharma 592,500,000 2.26337,000 Bank of Yokohama 122,499,500 0.47146,200 Benesse Holdings 542,036,500 2.07256,200 Canon 872,361,000 3.3359,700 Capcom 108,445,050 0.41
406,200 Citizen Holdings 181,368,300 0.6917,600 Coca-Cola West 23,478,400 0.093,343 Dai-ichi Life Insurance 252,730,800 0.96
106,700 Daikin Industries 224,976,950 0.86263,000 Dainippon Screen Manufacturing 170,555,500 0.65
41,100 Daito Trust Construction 271,260,000 1.03295,000 Daiwa House Industry 270,515,000 1.03
2,930,000 DIC 408,735,000 1.56110,500 East Japan Railway 541,450,000 2.07125,300 Electric Power Development 256,175,850 0.9812,800 Fanuc 150,656,000 0.57
496,000 Fuji Electric 104,656,000 0.40419,000 Fuji Heavy Industries 194,416,000 0.74227,400 FUJIFILM Holdings 413,981,700 1.58369,000 Fujitsu 147,969,000 0.56570,000 Fukuoka Financial Group 184,680,000 0.70421,000 H2O Retailing 247,127,000 0.94335,000 Hino Motors 156,445,000 0.6043,400 Hisamitsu Pharmaceutical 141,701,000 0.54
1,172,000 Hitachi 473,488,000 1.8151,600 Hitachi High-Technologies 86,043,000 0.33
792,000 Hokuhoku Financial Group 118,404,000 0.45313,300 Honda Motor 734,845,150 2.80314,000 Itoham Foods 96,398,000 0.37166,900 Izumi 212,213,350 0.81
2,021 Japan Tobacco 732,612,500 2.79276,500 JFE Holdings 385,441,000 1.4719,000 JGC 35,140,500 0.1396,900 JSR 137,307,300 0.52
1,342,000 JX Holdings 625,372,000 2.3960,800 Kansai Electric Power 71,744,000 0.27
627 KDDI 310,365,000 1.18165,500 Komatsu 297,569,000 1.1485,700 Kyushu Electric Power 94,355,700 0.36
595,000 Marubeni 279,055,000 1.06143,800 Marui Group 86,136,200 0.33588,000 Minebea 189,924,000 0.72
86,600 Mitsubishi 134,663,000 0.51500,000 Mitsubishi Electric 368,500,000 1.41258,000 Mitsubishi Estate 296,313,000 1.13875,000 Mitsubishi Heavy Industries 286,562,500 1.09
1,584,000 Mitsubishi UFJ Financial Group 516,384,000 1.97346,600 Mitsui & Co. 414,880,200 1.58654,000 Mitsui OSK Lines 194,565,000 0.74
25,100 Nintendo 265,809,000 1.01591,000 Nippon Express 177,300,000 0.68997,000 Nippon Sheet Glass 143,069,500 0.55906,000 Nippon Steel 173,952,000 0.66
77,100 Nippon Telegraph & Telephone 303,195,750 1.16487,000 Nippon Yusen 95,939,000 0.37882,000 Nishi-Nippon City Bank 194,481,000 0.74729,100 Nissan Motor 503,808,100 1.92
11,500 Nitori Holdings 82,915,000 0.3273,600 Nitto Denko 202,915,200 0.77
2,310 NTT DoCoMo 326,749,500 1.252,521 NTT Urban Development 132,226,450 0.51
82,330 ORIX 524,030,450 2.00533,000 Osaka Gas 161,765,500 0.62
9,000 Otsuka 47,700,000 0.18360,400 Otsuka Holdings 778,824,400 2.97839,300 Resona Holdings 284,103,050 1.08303,000 Ricoh 203,010,000 0.78306,200 Sapporo Hokuyo Holdings 84,817,400 0.32105,400 Sega Sammy Holdings 175,491,000 0.67366,200 Seiko Epson 374,256,400 1.43
12,100 Seven & I Holdings 25,930,300 0.1045,200 Shiseido 63,912,800 0.24
165,100 Softbank 373,868,950 1.42393,400 Sumitomo 409,332,700 1.56714,000 Sumitomo Bakelite 307,377,000 1.17745,000 Sumitomo Chemical 208,972,500 0.80129,100 Sumitomo Electric Industries 107,992,150 0.41
672,000 Sumitomo Heavy Industries 301,392,000 1.15
1,237,000 Sumitomo Metal Industries 172,561,500 0.66324,800 Sumitomo Mitsui Financial Group 696,208,800 2.66775,000 Sumitomo Mitsui Trust Holdings 174,762,500 0.67257,900 Sumitomo Rubber Industries 238,041,700 0.9186,800 Sundrug 202,678,000 0.78
144,900 Suzuken 308,926,800 1.18140,600 Suzuki Motor 223,694,600 0.8583,600 Tohoku Electric Power 61,613,200 0.24191,100 Tokio Marine Holdings 325,347,750 1.24
402,000 Tokyo Gas 142,107,000 0.54231,000 Tokyu 87,780,000 0.33683,000 Tokyu Land 198,753,000 0.76
1,210,000 Toshiba 379,940,000 1.45293,000 Toto 174,042,000 0.67266,300 Toyota Motor 682,127,450 2.6044,500 West Japan Railway 148,630,000 0.57
5,530 Yahoo! Japan 137,226,950 0.5338,100 Yakult Honsha 92,316,300 0.3559,570 Yamada Denki 311,551,100 1.19
109,000 Zeon 72,757,500 0.28
26,010,452,000 99.22
Total Shares 26,010,452,000 99.22
Total Transferable Securities Admitted to anOfficial Exchange Listing
26,010,452,000 99.22
Total Investments 26,010,452,000 99.22
Cash 194,441,675 0.74
Other Assets/(Liabilities) 9,622,278 0.04
Total Net Assets 26,214,515,953 100.00
Allocation of Portfolio as at 31 December 2011 % ofNet Assets
SharesIndustrials 20.73Consumer Discretionary 20.23Financials 16.97Information Technology 10.04Materials 8.56Health Care 6.95Consumer Staples 5.33Telecommunication Services 5.01Utilities 3.01Energy 2.39Total Shares 99.22Cash and Other Assets/(Liabilities) 0.78
Total 100.00
Allocation of Portfolio as at 30 June 2011 (Unaudited) % ofNet Assets
SharesConsumer Discretionary 21.42Industrials 19.72Financials 16.95Materials 9.95Information Technology 8.95Health Care 5.72Consumer Staples 5.07Telecommunication Services 4.86Utilities 3.11Energy 2.45Total Shares 98.20Cash and Other Assets/(Liabilities) 1.80
Total 100.00
160
JPMorgan Investment Funds - Japan Select Equity Fund
Schedule of Investments (Market Value Expressed in JPY)
As at 31 December 2011
Quantity/Nominal
Value
Name of Securities MarketValue
%of
NetAssets
Quantity/Nominal
Value
Name of Securities MarketValue
%of
NetAssets

Transferable Securities Admitted to an Official Exchange Listing
Shares
JAPAN52,100 ADEKA 39,361,550 0.39
94,900 Aida Engineering 33,499,700 0.3330,100 Alpen 40,755,400 0.4036,500 AOKI Holdings 45,789,250 0.4537,300 Aoyama Trading 53,823,900 0.53
317,000 Aozora Bank 67,362,500 0.6632,500 Arc Land Sakamoto 46,946,250 0.4633,800 Arcs 48,080,500 0.47
115,000 Bando Chemical Industries 33,292,500 0.3350,900 Bank of the Ryukyus 48,431,350 0.48
200,000 Bank of Yokohama 72,700,000 0.7285,450 Belluna 48,834,675 0.48
760 BIC Camera 32,604,000 0.3259,600 Bridgestone 103,912,600 1.0273,000 Calsonic Kansei 31,974,000 0.3123,900 Cawachi 37,212,300 0.37
147 Central Japan Railway 95,403,000 0.9437,000 Century Tokyo Leasing 53,742,500 0.53
109,000 Chiba Bank 53,955,000 0.5392,000 Chugoku Marine Paints 43,746,000 0.4326,200 Cocokara Fine 52,269,000 0.5142,400 Credit Saison 65,359,600 0.6441,000 Daido Metal 34,747,500 0.3429,700 Daiichikosho 43,168,950 0.43
103,000 Dainichiseika Color & Chemicals Manufacturing 34,350,500 0.3498,000 Daiwa House Industry 89,866,000 0.8890,300 DCM Holdings 54,766,950 0.5416,100 Doshisha 35,830,550 0.3567,700 EDION 42,481,750 0.4222,400 Electric Power Development 45,796,800 0.4528,000 Fuji Machine Manufacturing 38,304,000 0.3822,700 Fuji Seal International 31,541,650 0.3145,200 FUJIFILM Holdings 82,286,600 0.8167,000 Fujitec 32,160,000 0.31
200,000 Fukuoka Financial Group 64,800,000 0.64103,000 Fukuyama Transporting 47,792,000 0.47212,000 Furukawa-Sky Aluminum 40,280,000 0.40
17,800 Fuyo General Lease 47,143,300 0.46202,000 Godo Steel 38,481,000 0.38114,000 Hanwa 38,418,000 0.38
21,200 Heiwa 28,217,200 0.2839,200 Heiwado 38,651,200 0.3831,900 Hibiya Engineering 26,349,400 0.26
508,000 Hitachi 205,232,000 2.0240,700 Hitachi Capital 43,345,500 0.4336,000 Hitachi Medical 28,386,000 0.2880,000 Hokuetsu Kishu Paper 41,480,000 0.4188,500 Honda Motor 207,576,750 2.0422,900 IBJ Leasing 39,033,050 0.386,800 Idemitsu Kosan 53,958,000 0.53
61,000 Iida Home Max 35,075,000 0.3418,000 Inaba Denki Sangyo 38,790,000 0.38
108,500 Inabata & Co. 50,018,500 0.49379,000 Ishihara Sangyo Kaisha 33,541,500 0.33175,500 ITOCHU 137,328,750 1.35
72,100 Itochu Enex 31,399,550 0.31167,000 Jaccs 38,326,500 0.38115,000 JFE Shoji Holdings 36,742,500 0.3646,000 Joshin Denki 38,732,000 0.3828,400 JSP 34,477,600 0.3460,200 JTEKT 45,541,300 0.45
265,200 JX Holdings 123,583,200 1.2211,800 K’s Holdings 35,931,000 0.3519,100 Kadokawa Group Holdings 51,063,850 0.5021,500 Kato Sangyo 31,906,000 0.31
113,000 Kayaba Industry 41,188,500 0.41241 KDDI 119,295,000 1.18
232,000 Kurabo Industries 33,756,000 0.3327,800 Kyoei Steel 39,670,600 0.3956,100 Kyowa Exeo 40,756,650 0.4019,300 Macnica 34,247,850 0.34
115,000 Maeda 32,372,500 0.3250,000 Maeda Road Construction 40,450,000 0.40
259,000 Marubeni 121,471,000 1.20178,000 Marudai Food 50,018,000 0.49
26,100 Matsumotokiyoshi Holdings 40,716,000 0.4033,900 Ministop 48,714,300 0.4854,000 Mitsuba 31,320,000 0.31
126,700 Mitsubishi 197,018,500 1.94
177,000 Mitsubishi Steel Manufacturing 34,515,000 0.341,047,300 Mitsubishi UFJ Financial Group 341,419,800 3.36
16,100 Mitsubishi UFJ Lease & Finance 49,064,750 0.48170,500 Mitsui & Co. 204,088,500 2.01
1,813,600 Mizuho Financial Group 187,707,600 1.8538,400 NEC Capital Solutions 42,912,000 0.4216,200 NEC Mobiling 41,796,000 0.4136,900 NEC Networks and System Integration 41,457,150 0.4141,400 Nichiha 34,196,400 0.3447,000 Nippo 34,521,500 0.3445,000 Nippon Densetsu Kogyo 33,862,500 0.3392,000 Nippon Flour Mills 31,280,000 0.3143,300 Nippon Konpo Unyu Soko 35,960,650 0.35
330,000 Nippon Light Metal 33,495,000 0.3330,800 Nippon Paper Group 51,728,600 0.5149,000 Nippon Shokubai 40,547,500 0.40
163,000 Nippon Soda 56,968,500 0.56407,000 Nippon Steel 78,144,000 0.77
67,800 Nippon Telegraph & Telephone 266,623,500 2.6276,000 Nippon Thompson 33,896,000 0.33
261,000 Nishimatsu Construction 34,321,500 0.34248,600 Nissan Motor 171,782,600 1.69298,000 Nisshin Steel 35,164,000 0.34
32,600 Nitta 47,074,400 0.4687,000 Nittetsu Mining 26,578,500 0.26
109,000 NOF 42,782,500 0.42453,300 Nomura Holdings 105,618,900 1.04119,000 Noritake 27,191,500 0.27
1,387 NTT DoCoMo 196,191,150 1.93141,000 OJI Paper 55,624,500 0.5585,600 Okabe 32,742,000 0.3217,340 ORIX 110,369,100 1.0925,000 Osaka Steel 36,737,500 0.3684,000 Pacific Industrial 31,122,000 0.31
106,000 Press Kogyo 39,220,000 0.39102,000 Rengo 54,876,000 0.54
22,700 Ricoh Leasing 39,032,650 0.38128,000 Riken 37,056,000 0.36
31,700 Riso Kagaku 35,028,500 0.34113,000 Ryobi 31,696,500 0.3189,000 Sakai Chemical Industry 25,365,000 0.2596,000 Sakata INX 33,312,000 0.33
306,000 Sankyo-Tateyama Holdings 34,731,000 0.34111,000 Sanyo Special Steel 45,399,000 0.45
160,900 Sapporo Hokuyo Holdings 44,569,300 0.4441,700 Seiko Epson 42,617,400 0.4279,000 Seino Holdings 47,242,000 0.46
124,000 Sekisui House 84,630,000 0.8338,000 Sekisui Jushi 29,469,000 0.29
116,000 Senko 35,612,000 0.35128,000 Sharp 86,080,000 0.85
22,200 Shimachu 39,227,400 0.39504,000 Shinsei Bank 40,572,000 0.40197,000 Sumikin Bussan 38,612,000 0.38130,200 Sumitomo 135,473,100 1.33108,600 Sumitomo Electric Industries 90,843,900 0.89
75,400 Sumitomo Forestry 51,045,800 0.50112,900 Sumitomo Mitsui Financial Group 242,001,150 2.38412,000 Sumitomo Mitsui Trust Holdings 92,906,000 0.9179,000 Sumitomo Seika Chemicals 25,675,000 0.25117,000 Sumitomo Warehouse 42,646,500 0.4229,800 Tachi-S 40,125,700 0.39
128,000 Taihei Kogyo 52,352,000 0.5258,100 Teikoku Piston Ring 52,377,150 0.52
154,000 Toagosei 48,510,000 0.48122,000 Toei 44,408,000 0.4422,200 Tokai Corp/Gifu 37,595,700 0.3739,400 Tokai Rubber Industries 33,647,600 0.3377,700 Tokio Marine Holdings 132,284,250 1.3068,100 Topre 51,517,650 0.51
199,000 Topy Industries 37,511,500 0.37119,000 Toshiba TEC 32,606,000 0.3247,000 Totetsu Kogyo 30,926,000 0.30
234,000 Toyo Tire & Rubber 41,184,000 0.4124,400 Toyota Industries 51,020,400 0.50132,700 Toyota Motor 339,911,050 3.3443,700 Toyota Tsusho 59,410,150 0.5857,900 UNY 40,211,550 0.4062,200 U-Shin 38,595,100 0.3846,700 Valor 55,946,600 0.5526,500 Xebio 48,495,000 0.4813,100 Yachiyo Bank 23,900,950 0.2411,820 Yamada Denki 61,818,600 0.61
161
JPMorgan Investment Funds - Japan Strategic Value Fund
Schedule of Investments (Market Value Expressed in JPY)
As at 31 December 2011
Quantity/Nominal
Value
Name of Securities MarketValue
%of
NetAssets
Quantity/Nominal
Value
Name of Securities MarketValue
%of
NetAssets

26,900 Yellow Hat 33,046,650 0.33107,000 Yodogawa Steel Works 35,791,500 0.3599,000 Yokohama Rubber 42,817,500 0.4220,400 Yorozu 35,832,600 0.35
322,000 Yuasa Trading 36,547,000 0.36
10,047,766,875 98.86
Total Shares 10,047,766,875 98.86
Total Transferable Securities Admitted to anOfficial Exchange Listing
10,047,766,875 98.86
Total Investments 10,047,766,875 98.86
Cash 120,468,751 1.19
Other Assets/(Liabilities) (4,891,345) (0.05)
Total Net Assets 10,163,344,281 100.00
Allocation of Portfolio as at 31 December 2011 % ofNet Assets
SharesConsumer Discretionary 32.06Financials 20.48Industrials 19.81Materials 14.40Telecommunication Services 5.73Consumer Staples 2.39Energy 1.75Information Technology 1.51Utilities 0.45Health Care 0.28Total Shares 98.86Cash and Other Assets/(Liabilities) 1.14
Total 100.00
Allocation of Portfolio as at 30 June 2011 (Unaudited) % ofNet Assets
SharesConsumer Discretionary 30.46Financials 19.36Industrials 17.97Materials 12.08Telecommunication Services 6.13Consumer Staples 3.64Information Technology 3.07Energy 3.03Utilities 2.12Health Care 0.62Total Shares 98.48Cash and Other Assets/(Liabilities) 1.52
Total 100.00
162
JPMorgan Investment Funds - Japan Strategic Value Fund
Schedule of Investments (Market Value Expressed in JPY) (continued)
As at 31 December 2011
Quantity/Nominal
Value
Name of Securities MarketValue
%of
NetAssets
Quantity/Nominal
Value
Name of Securities MarketValue
%of
NetAssets

Transferable Securities Admitted to an Official Exchange Listing
Shares and Warrants
SOUTH KOREA11,500 Amorepacific 10,464,750 1.47
44,500 Hyundai Heavy Industries 9,868,859 1.3860,000 Hyundai Mobis 15,120,236 2.1290,000 Hyundai Motor 16,577,843 2.33
153,000 KT&G 10,750,916 1.51383,896 Lock & Lock 12,700,149 1.78120,000 Mando 21,326,400 2.9980,000 Samsung C&T 4,709,256 0.6632,000 Samsung Electronics 29,257,506 4.1096,000 Samsung Engineering 16,687,973 2.34
147,463,888 20.68
CHINA59,500,000 Agricultural Bank of China - H Shares * 25,549,139 3.583,800,000 Anhui Conch Cement - H Shares * 11,265,402 1.58
28,000,000 China Construction Bank - H Shares * 19,503,779 2.7329,050,000 China Eastern Airlines - H Shares * 10,304,602 1.459,000,000 China National Building Material - H Shares * 10,220,557 1.437,150,000 PICC Property & Casualty - H Shares * 9,675,473 1.36
2,600,000 Ping An Insurance Group Co. of China - H Shares * 17,131,471 2.40
103,650,423 14.53
INDONESIA3,800,000 Astra International 30,999,669 4.35
12,408,000 Bank Mandiri 9,202,007 1.2920,000,000 Bank Negara Indonesia Persero 8,408,690 1.1810,000,000 Bank Rakyat Indonesia Persero 7,471,328 1.05
8,200,000 United Tractors 23,805,139 3.34
79,886,833 11.21
INDIA3,500,000 Ambuja Cements 10,295,864 1.442,500,000 Bharti Airtel 16,207,717 2.271,500,000 HDFC Bank 12,042,542 1.693,500,000 Infrastructure Development Finance 6,011,966 0.844,000,000 ITC 15,153,114 2.13
272,461 Mahindra & Mahindra 3,492,086 0.49600,000 Reliance Industries 7,837,087 1.10
71,040,376 9.96
HONG KONG3,800,000 AIA Group 11,864,756 1.664,000,000 China Overseas Land & Investment 6,674,649 0.945,200,000 Galaxy Entertainment Group 9,527,341 1.34
27,000,000 Poly Hong Kong Investments 11,698,018 1.641,200,000 Power Assets Holdings 8,864,769 1.24
6,000,000 SJM Holdings 9,757,040 1.372,200,000 Wharf Holdings 9,949,528 1.39
68,336,101 9.58
CAYMAN ISLANDS1,600,000 China Mengniu Dairy 3,736,980 0.526,800,000 China Resources Land 10,926,648 1.536,650,000 Intime Department Store Group 6,785,540 0.954,500,000 Sands China 12,645,332 1.77
13,500,000 Sany Heavy Equipment International Holdings 10,959,288 1.543,000,000 Tingyi Cayman Island Holding 9,144,811 1.28
900,500 TPK Holding 11,734,085 1.64
65,932,684 9.23
THAILAND1,430,500 Advanced Info Service 6,336,943 0.89
20,200,000 Charoen Pokphand Foods - NVDR 20,975,205 2.941,800,000 Charoen Pokphand Foods (Foreign) 1,869,078 0.26
18,000,000 Krung Thai Bank (Foreign) 8,499,684 1.191,100,000 Siam Cement - NVDR 10,857,549 1.53
48,538,459 6.81
SINGAPORE3,000,000 Fraser and Neave 14,391,485 2.024,762,000 Keppel Land 8,134,992 1.14
22,000,000 Midas Holdings 5,481,092 0.7711,000,000 Overseas Union Enterprise 17,858,245 2.50
45,865,814 6.43
TAIWAN12,000,000 Advanced Semiconductor Engineering 10,249,554 1.442,000,000 Catcher Technology 9,292,269 1.30
4,200,000 Chunghwa Telecom 13,898,792 1.951,850,000 President Chain Store 10,091,520 1.41
43,532,135 6.10
BERMUDA9,000,000 Brilliance China Automotive Holdings 9,716,482 1.36
9,716,482 1.36
GERMANY2,500,000 Hindalco Industries - Warrants 21.09.12 5,458,000 0.77
5,458,000 0.77
Total Shares and Warrants 689,421,195 96.66
Total Transferable Securities Admitted to anOfficial Exchange Listing
689,421,195 96.66
Total Investments 689,421,195 96.66
Cash Equivalents
Time Deposits
UNITED STATES OF AMERICA14,927,773 Standard Chartered Bank 03.01.12/0.450% 14,927,773 2.09
14,927,773 2.09
Total Time Deposits 14,927,773 2.09
Total Cash Equivalents 14,927,773 2.09
Total Investments plus Total Cash Equivalents 704,348,968 98.75
Cash 3,970,925 0.56
Other Assets/(Liabilities) 4,922,748 0.69
Total Net Assets 713,242,641 100.00
* Hong Kong Registered Shares.
Allocation of Portfolio as at 31 December 2011 % ofNet Assets
SharesFinancials 29.16Consumer Discretionary 22.98Industrials 12.01Consumer Staples 11.89Information Technology 7.18Materials 5.99Telecommunication Services 5.11Utilities 1.24Energy 1.10Total Shares 96.66Cash Equivalents, Cash and Other Assets/(Liabilities) 3.34
Total 100.00
Allocation of Portfolio as at 30 June 2011 (Unaudited) % ofNet Assets
Shares and WarrantsFinancials 31.01Materials 18.59Industrials 16.84Consumer Discretionary 11.97Information Technology 7.67Consumer Staples 7.57Energy 2.00Telecommunication Services 1.62Health Care 0.62Total Shares and Warrants 97.89Cash and Other Assets/(Liabilities) 2.11
Total 100.00
163
JPMorgan Investment Funds - JF Asia ex-Japan Fund
Schedule of Investments (Market Value Expressed in USD)
As at 31 December 2011
Quantity/Nominal
Value
Name of Securities Maturity/Coupon
MarketValue
%of
NetAssets
Quantity/Nominal
Value
Name of Securities Maturity/Coupon
MarketValue
%of
NetAssets

Transferable Securities Admitted to an Official Exchange Listing
Shares
UNITED STATES OF AMERICA3,328 Dex One 5,624 0.02
5,624 0.02
Total Shares 5,624 0.02
Bonds
UNITED STATES OF AMERICA25,000 Abbott Laboratories 27.05.40/5.300% 30,131 0.0925,000 Altria Group 05.05.21/4.750% 27,557 0.0880,000 American Axle & Manufacturing 15.11.19/7.750% 78,800 0.2495,000 American Express Credit 25.08.14/5.125% 102,253 0.3170,000 American International Group 15.12.20/6.400% 70,882 0.2190,000 Anadarko Petroleum 15.09.17/6.375% 104,451 0.3180,000 Anheuser-Busch InBev Worldwide 15.01.20/5.375% 93,711 0.28
105,000 Arch Coal 01.08.16/8.750% 115,474 0.3580,000 AT&T 15.05.38/6.400% 99,549 0.3030,000 AT&T 15.08.41/5.550% 35,298 0.1165,000 Bank of America 01.05.18/5.650% 61,822 0.1890,000 Bank of America 13.05.21/5.000% 82,027 0.2565,000 Capital One Financial 15.07.21/4.750% 67,622 0.2025,000 Cigna 15.02.42/5.375% 24,932 0.0775,000 Cincinnati Bell 15.10.20/8.375% 75,198 0.23
125,000 Citigroup 21.11.17/6.125% 132,264 0.4030,000 Citigroup 14.01.22/4.500% 28,835 0.0925,000 Citigroup 29.05.37/5.875% 25,215 0.0845,000 Coventry Health Care 15.06.21/5.450% 49,914 0.15
100,000 Crédit Suisse/New York 15.05.13/5.000% 102,951 0.3190,000 Dominion Resources 15.08.19/5.200% 103,907 0.3170,000 Entergy Arkansas 15.02.21/3.750% 72,898 0.2230,000 Enterprise Products Operating 15.04.38/7.550% 38,537 0.1215,000 ERP Operating 15.12.21/4.625% 15,298 0.05
100,000 Ford Motor Credit 15.08.17/6.625% 109,031 0.3360,000 General Electric Capital 16.09.20/4.375% 62,024 0.1980,000 General Electric Capital 14.01.38/5.875% 84,646 0.2540,000 Goldman Sachs Group 18.01.18/5.950% 41,096 0.1275,000 Goldman Sachs Group 01.04.18/6.150% 77,634 0.2310,000 Goldman Sachs Group 01.02.41/6.250% 9,898 0.03
130,000 Hanesbrands 15.12.16/8.000% 142,025 0.43175,000 HCA 15.02.22/7.500% 179,812 0.5455,000 HCP 01.02.21/5.375% 57,638 0.17
100,000 Host Hotels & Resorts 01.06.16/6.750% 102,628 0.3120,000 International Paper 15.11.41/6.000% 21,722 0.06
100,000 Iron Mountain 01.01.16/6.625% 100,625 0.30110,000 Jarden 01.05.17/7.500% 117,150 0.3520,000 Kinder Morgan Energy Partners 15.03.38/6.950% 22,769 0.07
145,000 Kraft Foods 11.08.17/6.500% 172,225 0.5260,000 Midamerican Energy Holdings 15.09.37/6.500% 75,678 0.23
100,000 Morgan Stanley 01.04.18/6.625% 99,278 0.3015,000 Nisource Finance 15.06.41/5.950% 16,106 0.0530,000 Pfizer 15.03.39/7.200% 43,975 0.1325,000 Philip Morris International 16.05.18/5.650% 29,703 0.0915,000 Philip Morris International 16.05.38/6.375% 19,646 0.0645,000 Plains All American Pipeline 15.01.37/6.650% 53,108 0.1675,000 Prudential Financial 15.06.19/7.375% 89,225 0.2720,000 Richardson Electronics 15.11.21/3.500% 20,540 0.06
200,000 Sealy Mattress 15.06.14/8.250% 199,000 0.6075,000 Service Corp. International 15.05.19/7.000% 79,312 0.2445,000 Simon Property Group 01.12.21/4.125% 47,078 0.1425,000 Southern Power 15.09.41/5.150% 26,461 0.0890,000 Sprint Capital 15.03.32/8.750% 73,237 0.2260,000 Tenet Healthcare 01.07.19/8.875% 67,650 0.2030,000 Time Warner 29.03.41/6.250% 36,647 0.1145,000 UnitedHealth Group 15.10.40/5.700% 53,902 0.16
160,000 Verizon Communications 01.11.16/2.000% 160,946 0.4850,000 Verizon Communications 01.04.21/4.600% 56,679 0.1740,000 Wal-Mart Stores 15.04.41/5.625% 51,501 0.1565,000 Watson Pharmaceuticals 15.08.19/6.125% 76,452 0.23
4,316,573 12.97
INTERNATIONAL AGENCIES245,000 European Investment Bank 15.05.14/1.500% 245,946 0.74
245,946 0.74
MEXICO200,000 America Movil 08.09.16/2.375% 199,552 0.60
199,552 0.60
TURKEY200,000 Export Credit Bank of Turkey
144A 04.11.16/5.375% 198,312 0.60
198,312 0.60
UNITED KINGDOM150,000 Standard Chartered 144A 18.11.14/5.500% 159,475 0.48
15,000 WPP Finance 2010 144A 21.11.21/4.750% 14,892 0.04
174,367 0.52
CAYMAN ISLANDS45,000 Transocean 15.12.21/6.375% 47,458 0.1495,000 Vale Overseas 15.09.19/5.625% 104,586 0.32
152,044 0.46
CANADA40,000 Encana 15.08.37/6.625% 48,495 0.1550,000 Suncor Energy 01.06.39/6.850% 63,611 0.19
112,106 0.34
PERU25,000 Peru (Republic of) 21.11.33/8.750% 38,099 0.11
38,099 0.11
SPAIN30,000 Telefonica Emisiones 16.02.21/5.462% 28,907 0.09
28,907 0.09
Total Bonds 5,465,906 16.43
Total Transferable Securities Admitted to an OfficialExchange Listing
5,471,530 16.45
Transferable Securities Dealt in on Another Regulated Market
Bonds
UNITED STATES OF AMERICA125,000 AES 15.04.16/9.750% 143,750 0.43175,000 Ally Financial 01.12.14/6.750% 176,112 0.5375,000 AMC Entertainment 01.06.19/8.750% 78,000 0.2310,000 Amgen 15.06.42/5.650% 10,805 0.0365,000 Aristotle Holding 144A 15.11.21/4.750% 67,266 0.20
165,000 Avis Budget Car Rental 15.01.19/8.250% 164,261 0.49175,000 Banc of America Merrill Lynch
Commercial Mortgage 2006-2 A4 10.05.45/5.731%* 196,417 0.5939,327 Banc of America Mortgage
Securities 2005-10 1A13 25.11.35/5.500% 37,417 0.1130,000 Barrick North America Finance 30.05.41/5.700% 36,090 0.1135,000 Baxter International 15.01.17/1.850% 35,471 0.1170,000 Bear Stearns Commercial
Mortgage Securities2005-PWR9 A4A 11.09.42/4.871% 76,110 0.23
55,000 Bear Stearns CommercialMortgage Securities2006-PW14 AM 11.12.38/5.243% 54,224 0.16
150,000 Biomet 15.10.17/10.375%* 163,500 0.49100,000 Caesars Entertainment Operating 01.06.17/11.250% 106,625 0.3280,000 Calpine 144A 31.07.20/7.875% 86,600 0.26
100,000 Capital One Multi-Asset ExecutionTrust 2005-A6 A6 15.07.15/0.453%* 99,830 0.30
100,000 Case New Holland 01.12.17/7.875% 112,125 0.34105,000 CCO Holdings/CCO Holdings
Capital 30.10.17/7.250% 111,169 0.33568,708 Citimortgage Alternative Loan
Trust 2007-A1 1A7 25.01.37/6.000% 353,758 1.06200,000 Clear Channel Worldwide
Holdings 15.12.17/9.250% 217,000 0.6599,593 Commercial Mortgage Pass
Through Certificates 2011-FL1 A 17.07.28/2.467%* 98,251 0.301,170,548 Countrywide Asset-Backed
Certificates 2003-5 MF1 25.01.34/5.413%* 727,874 2.19218,536 Countrywide Asset-Backed
Certificates 2005-4 AF3 25.10.35/4.456%* 211,308 0.6467,477 CVS Pass Through Trust 144A 10.01.32/7.507% 78,794 0.2465,000 DCP Midstream 144A 15.03.19/9.750% 84,744 0.2665,000 DirecTV Holdings 01.03.21/5.000% 69,547 0.21
175,000 DISH DBS 01.09.19/7.875% 198,924 0.6085,000 Easton-Bell Sports 01.12.16/9.750% 92,862 0.2830,927 Fannie Mae Interest Strip 366 18 01.10.35/4.000% 2,591 0.01122,321 Fannie Mae Interest Strip 390 C7 25.07.23/4.000% 8,771 0.03156,871 Fannie Mae Interest Strip 390 C8 25.07.23/4.500% 13,091 0.04136,524 Fannie Mae Pool No: 672379 01.12.17/5.000% 147,493 0.44
164
JPMorgan Investment Funds - US Bond Fund
Schedule of Investments (Market Value Expressed in USD)
As at 31 December 2011
Quantity/Nominal
Value
Name of Securities Maturity/Coupon
MarketValue
%of
NetAssets
Quantity/Nominal
Value
Name of Securities Maturity/Coupon
MarketValue
%of
NetAssets

62,326 Fannie Mae Pool No: 787565 01.03.35/7.500% 74,605 0.22398,812 Fannie Mae Pool No: 889183 01.09.21/5.500% 432,649 1.30262,087 Fannie Mae Pool No: 919641 01.09.37/6.000% 288,583 0.87122,485 Fannie Mae Pool No: 930796 01.02.35/5.000% 132,341 0.40115,329 Fannie Mae Pool No: 952005 01.11.37/6.000% 126,988 0.3887,819 Fannie Mae Pool No: 965649 01.01.38/6.000% 96,696 0.29
110,023 Fannie Mae Pool No: 984281 01.05.38/6.000% 121,146 0.36127,912 Fannie Mae Pool No: AA9363 01.08.39/4.500% 136,166 0.41
234,991 Fannie Mae Pool No: AI9856 01.09.41/5.000% 253,900 0.76559,191 Fannie Mae Pool No: AJ5667 01.11.41/4.000% 587,064 1.76127,048 Fannie Mae Pool No: AL1064 01.10.39/6.500% 141,361 0.42
56,188 Fannie Mae REMICS 2003-22 IO 25.04.33/6.000% 8,927 0.03150,778 Fannie Mae REMICS 2008-17 KS 25.11.37/6.156%* 21,068 0.06164,388 Fannie Mae REMICS 2008-71 SB 25.10.29/6.291%* 12,697 0.04146,374 Fannie Mae REMICS 2009-95 HI 25.12.38/6.000% 21,161 0.06488,199 Fannie Mae REMICS 2010-116 BI 25.08.20/5.000% 49,807 0.15160,000 First Data 144A 15.08.20/8.875% 159,800 0.48400,000 Freddie Mac 27.11.13/0.375% 399,908 1.20370,000 Freddie Mac 30.07.14/1.000% 374,100 1.12394,534 Freddie Mac Gold Pool No:
G01589 01.09.33/5.000% 424,587 1.28364,774 Freddie Mac Non Gold Pool No:
1G1999 01.06.37/5.373%* 391,468 1.18354,485 Freddie Mac Non Gold Pool No:
1J0453 01.06.37/5.537%* 381,160 1.15111,515 Freddie Mac REMICS 3612 JI 15.05.24/4.500% 10,673 0.03
150,000 Freescale Semiconductor 144A 15.04.18/9.250% 161,062 0.48221,241 GE Capital Commercial Mortgage
2002-1A A3 10.12.35/6.269% 222,171 0.6745,000 Gilead Sciences 01.04.21/4.500% 47,622 0.14
248,043 Ginnie Mae I Pool No: 713334 15.05.39/4.500% 270,328 0.8138,135 Ginnie Mae I Pool No: 760377 15.09.41/5.000% 42,265 0.13
166,734 Ginnie Mae I pool No: 781986 15.09.35/5.500% 187,289 0.56560,000 Greenwich Capital Commercial
Funding 2005-GG3 A4 10.08.42/4.799%* 602,478 1.811,769,673 GSAA Trust 2006-11 2A2 25.07.36/0.354%* 685,782 2.06
130,000 Hertz 15.04.19/6.750% 130,975 0.3935,000 Hewlett-Packard 15.09.41/6.000% 39,193 0.1265,000 JP Morgan Chase Commercial
Mortgage Securities2004-CBX A6 12.01.37/4.899% 68,993 0.21
40,000 LB-UBS Commercial MortgageTrust 2005-C2 A5 15.04.30/5.150%* 43,004 0.13
95,000 LB-UBS Commercial MortgageTrust 2005-C3 A5 15.07.30/4.739% 102,753 0.31
35,000 Mattel 01.09.20/5.200% 35,206 0.1145,000 Merrill Lynch Mortgage Trust
2005-CIP1 A4 12.07.38/5.047%* 49,406 0.1535,000 Merrill Lynch Mortgage Trust
2005-CKI1 A6 12.11.37/5.220%* 38,867 0.12100,000 Metropolitan Life Global Funding
I 144A 10.04.13/5.125% 104,486 0.31135,000 Metropolitan Life Global Funding
I 144A 18.09.13/5.200% 143,176 0.4375,000 MGM Resorts International 15.03.20/9.000% 83,457 0.25
150,000 Morgan Stanley Capital I2006-IQ12 A4 15.12.43/5.332% 168,332 0.51
370,688 Morgan Stanley Dean WitterCapital I 2002-TOP7 A2 15.01.39/5.980% 373,498 1.12
120,000 Mylan 144A 15.07.20/7.875% 133,050 0.40145,000 NBC Universal 01.09.41/5.500% 154,309 0.46
15,000 News America 01.10.26/3.500% 17,315 0.0525,000 Nisource Finance 01.02.42/1.375% 26,386 0.0835,000 Oncor Electric Delivery 30.09.40/5.250% 39,755 0.1245,000 Oracle 15.07.40/5.375% 55,045 0.17
120,000 Peabody Energy 144A 15.11.21/6.250% 124,200 0.3745,363 Residential Accredit Loans
2006-QS18 3A3 25.12.21/5.750% 38,975 0.12135,000 Reynolds Group Issuer 144A 15.04.19/9.000% 128,925 0.3920,000 Roche Holdings 144A 01.03.39/7.000% 28,618 0.09
150,000 Spectrum Brands Holdings 15.06.18/9.500% 164,812 0.5075,000 Sprint Nextel 144A 15.11.18/9.000% 78,969 0.2480,000 State of California 01.04.39/7.550% 97,772 0.2950,000 State of Illinois 01.06.33/5.100% 45,381 0.1465,000 US Treasury 15.03.12/0.000% 64,998 0.20
180,000 US Treasury 30.09.13/0.125% 179,627 0.54225,000 US Treasury 15.06.14/0.750% 227,347 0.68405,000 US Treasury 31.10.16/1.000% 408,591 1.23130,000 US Treasury 31.10.18/1.750% 133,666 0.40765,000 US Treasury 15.11.21/2.000% 772,710 2.32175,000 US Treasury 15.02.31/5.375% 249,211 0.75337,000 US Treasury 15.08.39/4.500% 444,945 1.34357,000 US Treasury 15.05.41/4.375% 464,156 1.39416,000 US Treasury 15.08.41/3.750% 488,215 1.47165,000 Valeant Pharmaceuticals
International 144A 15.07.22/7.250% 162,525 0.49
70,000 Wachovia Bank CommercialMortgage Trust 2005-C17 A4 15.03.42/5.083%* 76,042 0.23
90,000 Wachovia Bank CommercialMortgage Trust 2005-C18 A4 15.04.42/4.935% 98,016 0.29
85,000 Wachovia Bank CommercialMortgage Trust 2005-C20 A7 15.07.42/5.118%* 93,423 0.28
455,000 Wachovia Bank CommercialMortgage Trust 2005-C21 A4 15.10.44/5.204%* 499,486 1.50
30,000 Wachovia Bank CommercialMortgage Trust 2006-C25 A5 15.05.43/5.737%* 33,351 0.10
30,000 Wachovia Bank CommercialMortgage Trust 2006-C26 A3 15.06.45/6.011%* 33,646 0.10
200,000 Wells Fargo & Co. 15.06.16/3.676% 209,608 0.6349,852 Wells Fargo Mortgage Backed
Securities Trust 2006-11 A8 25.09.36/6.000% 45,744 0.1455,000 Windstream 01.09.18/8.125% 59,194 0.18
105,000 Windstream 01.10.21/7.750% 108,150 0.33
18,294,141 54.99
CAYMAN ISLANDS160,128 Helios Finance 2007-S1 B1 20.10.14/0.896%* 159,754 0.48
150,000 UPCB Finance III 144A 01.07.20/6.625% 148,500 0.45
308,254 0.93
UNITED KINGDOM190,000 HSBC Bank 144A 24.05.16/3.100% 189,918 0.5760,000 PPL WEM Holdings 144A 01.05.21/5.375% 62,924 0.19
252,842 0.76
NETHERLANDS80,000 NXP/NXP Funding 144A 15.07.13/10.000% 87,000 0.26
100,000 NXP/NXP Funding 144A 01.08.18/9.750% 109,500 0.33
196,500 0.59
CANADA125,000 Quebecor Media 15.03.16/7.750% 129,219 0.3940,000 Xstrata Canada Financial 144A 15.11.41/6.000% 41,197 0.12
170,416 0.51
LUXEMBOURG100,000 Intelsat Jackson Holdings 15.10.20/7.250% 101,250 0.30
101,250 0.30
AUSTRALIA100,000 FMG Resources August
2006 Pty 144A 01.11.19/8.250% 100,575 0.30
100,575 0.30
CURACAO70,000 Teva Pharmaceutical Finance 10.11.16/2.400% 71,122 0.21
71,122 0.21
FRANCE40,000 RCI Banque 144A 12.04.16/4.600% 38,057 0.11
38,057 0.11
BELGIUM35,000 Delhaize Group 01.10.40/5.700% 36,106 0.11
36,106 0.11
Total Bonds 19,569,263 58.81
Commercial Paper
UNITED STATES OF AMERICA1,000,000 Coca-Cola 09.01.12/0.000% 999,987 3.011,000,000 Mont Blanc Capital 13.01.12/0.000% 999,877 3.001,000,000 Regency Markets No.1 17.01.12/0.000% 999,878 3.001,000,000 Tasman Funding 20.01.12/0.000% 999,799 3.001,000,000 Windmill Funding 06.01.12/0.000% 999,942 3.00
4,999,483 15.01
Total Commercial Paper 4,999,483 15.01
Total Transferable Securities Dealt in on AnotherRegulated Market
24,568,746 73.82
165
JPMorgan Investment Funds - US Bond Fund
Schedule of Investments (Market Value Expressed in USD) (continued)
As at 31 December 2011
Quantity/Nominal
Value
Name of Securities Maturity/Coupon
MarketValue
%of
NetAssets
Quantity/Nominal
Value
Name of Securities Maturity/Coupon
MarketValue
%of
NetAssets
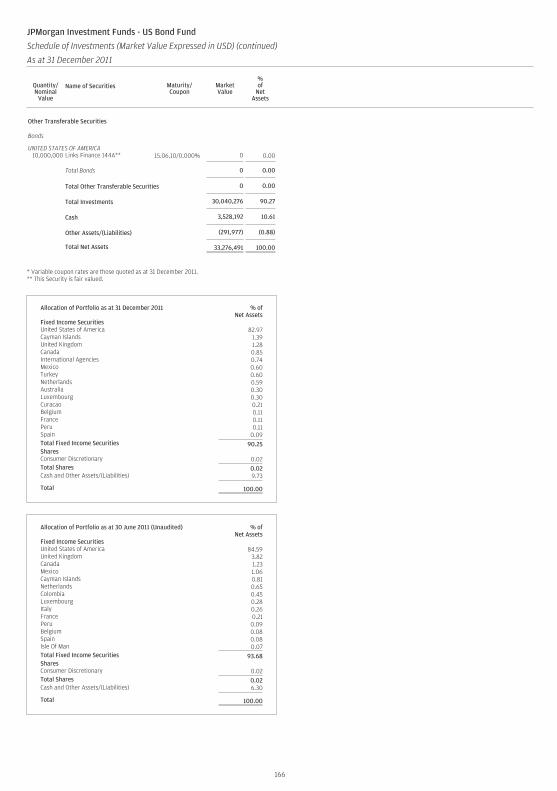
Other Transferable Securities
Bonds
UNITED STATES OF AMERICA10,000,000 Links Finance 144A** 15.06.10/0.000% 0 0.00
Total Bonds 0 0.00
Total Other Transferable Securities 0 0.00
Total Investments 30,040,276 90.27
Cash 3,528,192 10.61
Other Assets/(Liabilities) (291,977) (0.88)
Total Net Assets 33,276,491 100.00
* Variable coupon rates are those quoted as at 31 December 2011.** This Security is fair valued.
Allocation of Portfolio as at 31 December 2011 % ofNet Assets
Fixed Income SecuritiesUnited States of America 82.97Cayman Islands 1.39United Kingdom 1.28Canada 0.85International Agencies 0.74Mexico 0.60Turkey 0.60Netherlands 0.59Australia 0.30Luxembourg 0.30Curacao 0.21Belgium 0.11France 0.11Peru 0.11Spain 0.09Total Fixed Income Securities 90.25SharesConsumer Discretionary 0.02Total Shares 0.02Cash and Other Assets/(Liabilities) 9.73
Total 100.00
Allocation of Portfolio as at 30 June 2011 (Unaudited) % ofNet Assets
Fixed Income SecuritiesUnited States of America 84.59United Kingdom 3.82Canada 1.23Mexico 1.06Cayman Islands 0.81Netherlands 0.65Colombia 0.45Luxembourg 0.28Italy 0.26France 0.21Peru 0.09Belgium 0.08Spain 0.08Isle Of Man 0.07Total Fixed Income Securities 93.68SharesConsumer Discretionary 0.02Total Shares 0.02Cash and Other Assets/(Liabilities) 6.30
Total 100.00
166
JPMorgan Investment Funds - US Bond Fund
Schedule of Investments (Market Value Expressed in USD) (continued)
As at 31 December 2011
Quantity/Nominal
Value
Name of Securities Maturity/Coupon
MarketValue
%of
NetAssets
Quantity/Nominal
Value
Name of Securities Maturity/Coupon
MarketValue
%of
NetAssets

JPMorgan Investment Funds - US Bond Fund
Schedule of Investments - Outstanding To be Announced Securities (Expressed in USD)
As at 31 December 2011
MaturityDate Name of Securities Coupon
NominalValue
MarketValue
UnrealisedGain/(Loss)
To be Announced Securities - Long Positions
UNITED STATES OF AMERICA
25-Jan-24 Fannie Mae 5.000% 70,000 75,283 10925-Jan-27 Fannie Mae 3.500% 570,000 595,917 1,69225-Jan-27 Fannie Mae 4.000% 500,000 527,422 70315-Jan-39 Freddie Mac 5.000% 190,000 204,220 60615-Jan-39 Freddie Mac 6.000% 210,000 230,508 1,67315-Jan-39 Ginnie Mae 5.000% 420,000 465,019 1,96915-Jan-39 Ginnie Mae 6.000% 135,000 152,634 1,11815-Jan-42 Freddie Mac 4.000% 330,000 345,933 3,86715-Jan-42 Freddie Mac 4.500% 710,000 752,045 4,97715-Jan-42 Freddie Mac 5.500% 535,000 580,057 3,59515-Jan-42 Ginnie Mae 4.000% 340,000 364,597 3,08115-Jan-42 Ginnie Mae 4.500% 475,000 517,676 81625-Jan-42 Fannie Mae 3.500% 120,000 123,356 1,21925-Jan-42 Fannie Mae 4.000% 1,695,000 1,778,956 10,39525-Jan-42 Fannie Mae 4.500% 645,000 686,623 4,43425-Jan-42 Fannie Mae 5.000% 320,000 345,750 2,18525-Jan-42 Fannie Mae 6.000% 380,000 418,237 1,722
Total 8,164,233 44,161
Schedule of Investments - Outstanding Financial Futures Contracts (Expressed in USD)
ExpirationDate
Number ofContracts Security Description Currency
NotionalValue
UnrealisedGain/(Loss)
Bond Futures
Mar-12 2 Australia 10 Year Bond Future AUD 242,367 1,495Mar-12 1 Long Gilt Future GBP 181,764 5,518Mar-12 4 US 2 Year Note Future USD 882,000 250Mar-12 (1) US 5 Year Note Future USD (123,156) (227)Mar-12 2 US 10 Year Note Future USD 261,938 1,625Mar-12 4 US Long Bond Future USD 578,625 2,656
Total 11,317
Schedule of Investments - Outstanding Forward Foreign Exchange Contracts (Expressed in USD)
SettlementDate Currency
AmountPurchased Currency
AmountSold
UnrealisedGain/(Loss)
06-Jan-12 USD 180,309 EUR 131,000 10,26007-Feb-12 MXN 1,500,000 USD 110,424 (3,205)
Total 7,055
167

Transferable Securities Admitted to an Official Exchange Listing
Shares
UNITED STATES OF AMERICA23,900 Alaska Air Group 1,811,022 0.7210,600 Alliance Data Systems 1,103,354 0.448,400 Amazon.com 1,462,314 0.58
48,050 American Electric Power 1,995,276 0.7951,700 Ameriprise Financial 2,589,136 1.0374,900 Amgen 4,857,639 1.9333,200 Apple 13,457,952 5.3424,900 Assurant 1,027,872 0.4152,600 AT&T 1,590,361 0.635,000 AutoZone 1,626,975 0.64
53,800 Baker Hughes 2,609,300 1.03312,180 Bank of America 1,699,820 0.6731,600 Baxter International 1,574,154 0.6251,500 Broadcom - A Shares 1,517,447 0.60
60,300 Campbell Soup 2,014,924 0.80109,300 Capital One Financial 4,646,343 1.84
27,500 Caterpillar 2,507,725 0.9962,000 CBS - B Shares 1,701,590 0.68112,104 CenturyLink 4,180,358 1.6614,100 CF Industries Holdings 2,075,661 0.82
44,680 Chevron 4,791,036 1.9025,600 Cigna 1,079,808 0.4398,100 Cisco Systems 1,789,834 0.71
164,270 Citigroup 4,378,617 1.7469,600 ConAgra Foods 1,847,184 0.7329,800 ConocoPhillips 2,173,612 0.86
101,400 Constellation Brands - A Shares 2,104,557 0.8326,300 CVS Caremark 1,076,459 0.43
8,500 Dell 125,162 0.0515,800 Dillard’s - A Shares 715,345 0.2930,400 Dun & Bradstreet 2,266,776 0.9056,500 Endo Pharmaceuticals Holdings 1,954,335 0.7826,500 Energizer Holdings 2,061,302 0.82
130,290 Exxon Mobil 11,097,451 4.40151,100 Fifth Third Bancorp 1,931,813 0.77
229,000 Ford Motor 2,456,025 0.9786,000 Freeport-McMoRan Copper & Gold 3,192,320 1.2783,300 GameStop - A Shares 2,026,272 0.80
2,200 Google - A Shares 1,418,164 0.5618,000 Helmerich & Payne 1,056,510 0.4279,500 Honeywell International 4,344,277 1.7211,600 Hospitality Properties Trust 270,628 0.115,500 Humana 484,935 0.19
48,900 IAC/InterActive 2,081,673 0.8343,670 International Business Machines 8,128,734 3.2212,200 Joy Global 913,536 0.36
64,300 Kimberly-Clark 4,738,588 1.8863,100 Kroger 1,534,276 0.6110,500 Lorillard 1,198,732 0.4799,350 Macy’s 3,217,450 1.28
103,400 Marathon Oil 3,044,613 1.212,300 Mastercard - A Shares 865,134 0.34
70,700 MetLife 2,209,022 0.87275,400 Microsoft 7,161,777 2.8426,600 Monsanto 1,875,034 0.7449,400 National Oilwell Varco 3,367,104 1.3425,700 Navistar International 959,638 0.3811,000 Newmont Mining 668,085 0.2626,200 NextEra Energy 1,600,034 0.6425,500 Norfolk Southern 1,863,540 0.7420,900 Nu Skin Enterprises - A Shares 1,011,038 0.4034,400 Occidental Petroleum 3,236,868 1.2815,300 Parker Hannifin 1,167,773 0.46
438,200 Pfizer 9,537,423 3.7847,600 Philip Morris International 3,752,784 1.4951,700 PNC Financial Services Group 2,987,743 1.1819,700 PPG Industries 1,656,770 0.6642,700 PPL 1,266,696 0.5018,900 ProLogis 540,446 0.2123,400 Protective Life 528,255 0.2138,400 Prudential Financial 1,925,760 0.7653,700 Qualcomm 2,945,177 1.1712,900 Reinsurance Group of America 674,154 0.2723,000 SanDisk 1,143,675 0.4577,400 Sempra Energy 4,289,895 1.7049,700 Service Corp. International 531,790 0.2169,100 SLM 933,196 0.3780,300 Smithfield Foods 1,968,555 0.78118,600 Symantec 1,861,427 0.74
7,200 Time Warner Cable 457,776 0.1816,200 TRW Automotive Holdings 523,017 0.21
98,300 Tyson Foods - A Shares 2,038,251 0.8157,900 UnitedHealth Group 2,954,637 1.1710,200 Valero Energy 210,579 0.0820,600 Ventas 1,143,094 0.4574,550 Verizon Communications 2,974,172 1.1823,900 Vertex Pharmaceuticals 789,417 0.3115,100 VF 1,922,532 0.76
58,900 Viacom - B Shares 2,699,976 1.0768,200 Vishay Intertechnology 616,869 0.2475,150 Wal-Mart Stores 4,498,855 1.7816,200 Weight Watchers International 900,639 0.36
169,900 Wells Fargo & Co. 4,705,381 1.8761,300 Wyndham Worldwide 2,342,886 0.93
158,800 Xerox 1,255,314 0.5081,200 Xilinx 2,624,790 1.04
230,736,225 91.47
SWITZERLAND23,400 ACE 1,649,115 0.6537,100 Allied World Assurance Co Holdings 2,336,558 0.93
100,700 Tyco International 4,711,753 1.87
8,697,426 3.45
IRELAND91,200 Covidien 4,120,416 1.63
140,500 Warner Chilcott - A Shares 2,143,328 0.85
6,263,744 2.48
PANAMA27,200 Carnival 894,336 0.35
894,336 0.35
NETHERLANDS26,700 LyondellBasell Industries - A Shares 873,891 0.35
873,891 0.35
BERMUDA48,700 Freescale Semiconductor Holdings I 627,500 0.25
627,500 0.25
Total Shares 248,093,122 98.35
Total Transferable Securities Admitted to anOfficial Exchange Listing
248,093,122 98.35
Total Investments 248,093,122 98.35
Cash 5,826,979 2.31
Other Assets/(Liabilities) (1,663,699) (0.66)
Total Net Assets 252,256,402 100.00
168
JPMorgan Investment Funds - US Equity Fund
Schedule of Investments (Market Value Expressed in USD)
As at 31 December 2011
Quantity/Nominal
Value
Name of Securities MarketValue
%of
NetAssets
Quantity/Nominal
Value
Name of Securities MarketValue
%of
NetAssets

Allocation of Portfolio as at 31 December 2011 % ofNet Assets
SharesInformation Technology 22.20Financials 14.34Energy 12.52Consumer Discretionary 12.13Health Care 11.69Consumer Staples 8.83Industrials 5.44Materials 4.10Utilities 3.63Telecommunication Services 3.47Total Shares 98.35Cash and Other Assets/(Liabilities) 1.65
Total 100.00
Allocation of Portfolio as at 30 June 2011 (Unaudited) % ofNet Assets
SharesFinancials 16.94Information Technology 16.00Energy 12.93Health Care 12.87Industrials 12.74Consumer Discretionary 11.84Consumer Staples 6.30Materials 3.48Telecommunication Services 2.41Utilities 2.03Total Shares 97.54Cash and Other Assets/(Liabilities) 2.46
Total 100.00
169
JPMorgan Investment Funds - US Equity Fund
Schedule of Investments (Market Value Expressed in USD) (continued)
As at 31 December 2011
Quantity/Nominal
Value
Name of Securities MarketValue
%of
NetAssets
Quantity/Nominal
Value
Name of Securities MarketValue
%of
NetAssets

JPMorgan Investment Funds - US Equity Fund
Schedule of Investments - Outstanding Financial Futures Contracts (Expressed in USD)
As at 31 December 2011
ExpirationDate
Number ofContracts Security Description Currency
NotionalValue
UnrealisedGain/(Loss)
Equity Futures
Mar-12 25 SP 500 Emini Future USD 1,571,250 44,363
Total 44,363
Schedule of Investments - Outstanding Forward Foreign Exchange Contracts (Expressed in USD)
SettlementDate Currency
AmountPurchased Currency
AmountSold
UnrealisedGain/(Loss)
13-Jan-12 EUR 30,525,593 USD 40,826,319 (1,199,722)13-Jan-12 USD 2,459,391 EUR 1,873,433 27,40614-Feb-12 EUR 14,937 USD 19,302 93
Total (1,172,223)
170

Transferable Securities Admitted to an Official Exchange Listing
Shares
UNITED STATES OF AMERICA56,920 3M 4,680,532 0.2957,350 Abbott Laboratories 3,232,533 0.20
121,394 Adobe Systems 3,453,052 0.2139,296 Aflac 1,698,570 0.1079,088 AGL Resources 3,380,616 0.21
200,385 Air Products & Chemicals 17,053,765 1.0426,630 Alcoa 229,684 0.01
7,740 Alexandria Real Estate Equities 537,775 0.0320,053 Alexion Pharmaceuticals 1,434,892 0.0973,414 Allergan 6,468,507 0.40
174,670 Allstate 4,804,298 0.29349,653 Altera 13,064,784 0.80132,796 Amazon.com 23,117,792 1.41
140,660 American Electric Power 5,840,906 0.36133,139 American Express 6,312,120 0.3960,298 Ameriprise Financial 3,019,724 0.18
139,843 Anadarko Petroleum 10,719,665 0.6521,060 Apache 1,902,982 0.12
192,889 Apple 78,189,485 4.77302,007 AT&T 9,131,182 0.56
22,734 Autozone 7,397,530 0.45181,116 Baker Hughes 8,784,126 0.54
1,991,887 Bank of America 10,845,825 0.6663,536 Becton Dickinson & Co. 4,770,283 0.29
174,425 Biogen Idec 19,233,845 1.1725,683 Boston Properties 2,575,106 0.16
172,476 Broadcom - A Shares 5,082,005 0.3145,861 Cameron International 2,237,329 0.14
239,854 Campbell Soup 8,014,721 0.49162,608 Capital One Financial 6,912,466 0.42160,580 Cardinal Health 6,553,270 0.40538,890 CBS - Non voting B Shares 14,789,836 0.91264,215 Celgene 17,817,339 1.09121,203 CenterPoint Energy 2,453,755 0.15322,214 Chevron 34,551,007 2.11
1,654,043 Cisco Systems 30,178,015 1.84684,011 Citigroup 18,232,313 1.11
51,785 Citrix Systems 3,166,135 0.1914,830 CME Group 3,604,506 0.2264,705 Coach 3,999,093 0.24
485,453 Coca-Cola 34,100,646 2.08194,321 Cognizant Technology Solutions - A Shares 12,455,005 0.7657,320 Colgate-Palmolive 5,328,181 0.33
850,620 Comcast - A Shares 20,249,009 1.24191,948 ConocoPhillips 14,000,687 0.85
6,750 Crown Castle International 300,881 0.0259,720 Crown Holdings 2,018,536 0.12
468,110 CSX 9,860,737 0.6029,710 CubeSmart 317,303 0.02
249,631 CVS Caremark 10,217,397 0.6244,060 Darden Restaurants 2,014,864 0.1290,825 Devon Energy 5,684,283 0.3540,663 Dick’s Sporting Goods 1,504,124 0.0950,050 Dominion Resources 2,674,422 0.16
190,483 DR Horton 2,423,896 0.1579,115 DTE Energy 4,362,401 0.27
334,805 EI du Pont de Nemours & Co. 15,344,113 0.94151,130 EMC/Massachusetts 3,286,322 0.20
428,284 Emerson Electric 20,003,004 1.2280,780 EOG Resources 7,939,866 0.4864,740 Exelon 2,831,404 0.17162,762 Express Scripts 7,243,723 0.44288,814 Exxon Mobil 24,599,732 1.50
91,834 First American Financial 1,166,292 0.07212,159 Fluor 10,724,637 0.65
387,868 Freeport-McMoRan Copper & Gold 14,397,660 0.88587,673 General Electric 10,616,313 0.65238,749 General Mills 9,668,141 0.59722,532 General Motors 14,652,949 0.89127,490 Georgia Gulf 2,443,346 0.15
29,113 Global Payments 1,378,646 0.08143,473 Goldman Sachs Group 12,959,199 0.7919,290 Google - A Shares 12,434,720 0.7690,870 Halliburton 3,114,569 0.1912,470 Hartford Financial Services Group 204,196 0.0185,218 Hess 4,864,670 0.303,500 Hewlett-Packard 90,283 0.01
325,654 Home Depot 13,692,122 0.84
277,518 Honeywell International 15,164,971 0.93181,510 Humana 16,003,737 0.98
114,440 Huntington Bancshares 636,859 0.0443,295 IntercontinentalExchange 5,216,398 0.3220,850 International Business Machines 3,881,019 0.2443,300 International Paper 1,285,577 0.08
183,300 Johnson & Johnson 12,045,560 0.74728,295 Johnson Controls 22,697,314 1.39
83,412 Juniper Networks 1,712,031 0.1037,900 Kohl’s 1,882,114 0.11
685,432 Kraft Foods - A Shares 25,700,273 1.57201,504 Lam Research 7,522,144 0.46
68,119 Lennar - A Shares 1,346,713 0.08481,696 Lowe’s 12,377,179 0.76
37,150 Marathon Petroleum 1,236,538 0.0893,161 Marriott International - A Shares 2,731,946 0.17
87,740 Masco 921,709 0.0629,447 Mastercard - A Shares 11,076,342 0.6859,915 Mattel 1,673,726 0.10
120,094 McKesson 9,414,769 0.571,403,233 Merck & Co. 53,077,288 3.24
401,778 MetLife 12,553,554 0.7723,265 MICROS Systems 1,098,922 0.07
1,621,813 Microsoft 42,175,247 2.5885,504 Monsanto 6,027,177 0.37
526,542 Morgan Stanley 7,969,213 0.49182,341 Mylan 3,948,594 0.24
106,460 NetApp 3,895,371 0.24188,484 NextEra Energy 11,510,718 0.70137,889 Nike - B Shares 13,380,059 0.82213,930 Norfolk Southern 15,634,004 0.95149,773 Northeast Utilities 5,424,778 0.33
15,730 Novellus Systems 654,525 0.044,644 NVR 3,176,496 0.19
346,818 Occidental Petroleum 32,633,840 1.99977,436 Oracle 25,203,187 1.54459,843 Paccar 17,274,002 1.05693,042 Pfizer 15,084,059 0.92156,679 PG&E 6,494,345 0.40165,703 Philip Morris International 13,064,025 0.8023,990 Pioneer Natural Resources 2,148,664 0.13
233,466 PPL 6,925,769 0.42549,258 Procter & Gamble 36,742,614 2.24231,878 Prudential Financial 11,628,682 0.7173,539 PulteGroup 462,193 0.03
189,729 Qualcomm 10,405,687 0.6393,410 Regions Financial 402,130 0.02
100,787 Ryland Group 1,596,466 0.1067,656 Safeway 1,425,174 0.0917,280 SanDisk 859,248 0.0514,684 Sempra Energy 813,861 0.05
143,871 Southwestern Energy 4,632,646 0.28881,356 Sprint Nextel 2,057,966 0.13144,226 State Street 5,852,691 0.36222,653 SunTrust Banks 3,907,560 0.24
24,411 SVB Financial Group 1,171,728 0.07205,805 Target 10,556,767 0.64354,166 TD Ameritrade Holding 5,523,219 0.34924,256 Time Warner 33,813,906 2.07
82,914 TJX 5,356,244 0.3320,590 UGI 612,038 0.0488,406 Union Pacific 9,359,101 0.57
426,266 United Technologies 31,434,986 1.92388,448 UnitedHealth Group 19,822,501 1.21114,360 US Bancorp 3,105,446 0.19860,116 Verizon Communications 34,314,328 2.09136,151 Vertex Pharmaceuticals 4,497,068 0.2762,026 VF 7,897,150 0.4856,492 Vornado Realty Trust 4,348,754 0.2725,390 Wal-Mart Stores 1,519,972 0.09
1,347,402 Wells Fargo & Co. 37,316,298 2.28134,065 Williams 4,402,024 0.27477,548 Xilinx 15,436,739 0.94216,283 Yum! Brands 12,834,233 0.7992,425 Zions Bancorporation 1,509,762 0.09
177,878 Zynga - A Shares 1,640,925 0.10
1,511,780,511 92.31
CURACAO541,204 Schlumberger 36,653,041 2.24
36,653,041 2.24
171
JPMorgan Investment Funds - US Select Equity Fund
Schedule of Investments (Market Value Expressed in USD)
As at 31 December 2011
Quantity/Nominal
Value
Name of Securities Maturity/Coupon
MarketValue
%of
NetAssets
Quantity/Nominal
Value
Name of Securities Maturity/Coupon
MarketValue
%of
NetAssets

SWITZERLAND137,810 ACE 9,712,160 0.5939,013 TE Connectivity 1,208,818 0.08
311,863 Tyco International 14,592,070 0.89
25,513,048 1.56
BERMUDA32,020 Axis Capital Holdings 1,026,081 0.0633,854 Everest Re Group 2,875,728 0.18
280,496 Freescale Semiconductor Holdings 3,614,191 0.22189,798 Genpact 2,796,674 0.17387,544 Invesco 7,789,634 0.48
29,279 RenaissanceRe Holdings 2,176,015 0.13
20,278,323 1.24
IRELAND319,935 Covidien 14,454,663 0.88142,550 XL Group 2,836,032 0.18
17,290,695 1.06
PANAMA365,464 Carnival 12,016,456 0.73
12,016,456 0.73
ISRAEL7,482 Teva Pharmaceutical Industries ADR 304,405 0.02
304,405 0.02
Total Shares 1,623,836,479 99.16
Total Transferable Securities Admitted to anOfficial Exchange Listing
1,623,836,479 99.16
Transferable Securities Dealt in on Another Regulated Market
Bonds
UNITED STATES OF AMERICA2,879,000 US Treasury 30.06.12/0.625% 2,887,660 0.18
2,887,660 0.18
Total Bonds 2,887,660 0.18
Total Transferable Securities Dealt in on AnotherRegulated Market
2,887,660 0.18
Total Investments 1,626,724,139 99.34
Cash 12,855,494 0.79
Other Assets/(Liabilities) (2,053,288) (0.13)
Total Net Assets 1,637,526,345 100.00
Allocation of Portfolio as at 31 December 2011 % ofNet Assets
Fixed Income SecuritiesUnited States of America 0.18Total Fixed Income Securities 0.18SharesInformation Technology 18.98Consumer Discretionary 16.27Health Care 13.15Financials 12.26Energy 11.95Consumer Staples 8.81Industrials 7.84Materials 3.59Utilities 3.53Telecommunication Services 2.78Total Shares 99.16Cash and Other Assets/(Liabilities) 0.66
Total 100.00
Allocation of Portfolio as at 30 June 2011 (Unaudited) % ofNet Assets
Fixed Income SecuritiesUnited States of America 0.07Total Fixed Income Securities 0.07SharesInformation Technology 17.55Consumer Discretionary 14.52Financials 13.50Health Care 13.00Energy 12.85Industrials 9.42Consumer Staples 7.71Materials 3.81Utilities 3.51Telecommunication Services 3.45Total Shares 99.32Cash and Other Assets/(Liabilities) 0.61
Total 100.00
172
JPMorgan Investment Funds - US Select Equity Fund
Schedule of Investments (Market Value Expressed in USD) (continued)
As at 31 December 2011
Quantity/Nominal
Value
Name of Securities Maturity/Coupon
MarketValue
%of
NetAssets
Quantity/Nominal
Value
Name of Securities Maturity/Coupon
MarketValue
%of
NetAssets

JPMorgan Investment Funds - US Select Equity Fund
Schedule of Investments - Outstanding Financial Futures Contracts (Expressed in USD)
As at 31 December 2011
ExpirationDate
Number ofContracts Security Description Currency
NotionalValue
UnrealisedGain/(Loss)
Equity Futures
Mar-12 123 SP 500 Emini Future USD 7,730,550 96,988
Total 96,988
Schedule of Investments - Outstanding Forward Foreign Exchange Contracts (Expressed in USD)
SettlementDate Currency
AmountPurchased Currency
AmountSold
UnrealisedGain/(Loss)
13-Jan-12 EUR 103,343,718 USD 138,503,338 (4,348,371)13-Jan-12 USD 15,061,603 EUR 11,507,735 122,91314-Feb-12 EUR 102,509 USD 132,523 587
Total (4,224,871)
173

1. Fund Total Expense Ratios# (continued)For the
yearended
31 Dec 11
For theyear
ended31 Dec 11***
For theyear
ended31 Dec 10
For theyear
ended31 Dec 09
For theyear
ended31 Dec 08
For theyear
ended31 Dec 07
CappedExpense
Ratio31 Dec 11
InceptionDate
JPMorgan Investment Funds - Blue and Green FundJPM Blue and Green 0.85% - 0.85% 0.85% 0.85% 0.85% - 16-Sep-96
JPMorgan Investment Funds - Emerging Markets Corporate Bond Portfolio Fund IJPM Emerging Markets Corporate Bond Portfolio I - A (div) - USD 1.40% - 1.40% - - - - 31-May-10JPM Emerging Markets Corporate Bond Portfolio I - A (div) - EUR (hedged) 1.40% - 1.40% - - - - 31-May-10JPM Emerging Markets Corporate Bond Portfolio I - B (div) - USD 0.85% - 0.85% - - - - 15-Jun-10JPM Emerging Markets Corporate Bond Portfolio I - B (div) - EUR (hedged) 0.85% - 0.85% - - - - 30-Jun-10JPM Emerging Markets Corporate Bond Portfolio I - C (div) - USD 0.70% - 0.70% - - - - 30-Jun-10JPM Emerging Markets Corporate Bond Portfolio I - D (div) - USD 1.90% - 1.90% - - - - 31-May-10JPM Emerging Markets Corporate Bond Portfolio I - D (div) - EUR (hedged) 1.90% - 1.90% - - - - 31-May-10
JPMorgan Investment Funds - Euro Liquid Market FundJPM Euro Liquid Market A (acc) - EUR 0.65% - 0.65% 0.65% 0.65% 0.65% - 16-Jan-95JPM Euro Liquid Market C (acc) - EUR 0.26% - 0.26% 0.25% 0.25% 0.25% - 18-Dec-03JPM Euro Liquid Market D (acc) - EUR 0.75% - 0.75% 0.75% 0.75% - - 10-Oct-08JPM Euro Liquid Market X (acc) - EUR* - - - - - 0.05% 0.05% 08-May-02
JPMorgan Investment Funds - Europe Bond FundJPM Europe Bond A (acc) - EUR 0.90% - 0.90% 0.90% 0.90% 1.00% - 01-Jul-97JPM Europe Bond A (inc) - EUR 0.90% - 0.90% 0.90% 0.90% 1.00% - 18-Oct-05JPM Europe Bond B (acc) - EUR 0.60% - 0.60% 0.60% 0.60% 0.60% - 23-Sep-97JPM Europe Bond C (acc) - EUR 0.50% - 0.50% 0.50% 0.50% 0.54% - 16-Jun-98JPM Europe Bond D (acc) - EUR 1.25% - 1.25% 1.25% 1.25% 1.40% - 16-Jul-01JPM Europe Bond X (acc) - EUR 0.08% - 0.10% 0.10% 0.10% 0.09% 0.10% 30-Apr-98
JPMorgan Investment Funds - Europe Recovery FundJPM Europe Recovery A (acc) - EUR 1.90% - 1.90% 1.90% 1.90% 1.90% - 27-May-03JPM Europe Recovery A (dist) - EUR 1.90% - 1.90% 1.90% 1.90% 1.90% - 15-May-06JPM Europe Recovery B (acc) - EUR** 1.15% - 1.15% 1.15% 1.15% 1.15% - 13-Oct-03JPM Europe Recovery C (acc) - EUR 1.00% - 1.00% 1.00% 1.00% 0.95% - 06-Nov-03JPM Europe Recovery D (acc) - EUR 2.90% - 2.90% 2.90% 2.90% 2.90% - 27-May-03JPM Europe Recovery X (acc) - EUR 0.11% - 0.13% 0.14% - 0.11% 0.15% 27-May-03
JPMorgan Investment Funds - Europe Select Equity FundJPM Europe Select Equity A (acc) - EUR 1.90% - 1.90% 1.90% 1.90% 1.90% - 29-Aug-97JPM Europe Select Equity A (acc) - USD 1.90% - 1.90% 1.90% 1.90% 1.90% - 24-Oct-07JPM Europe Select Equity A (dist) - EUR 1.90% - 1.90% 1.90% 1.90% 1.90% - 15-May-06JPM Europe Select Equity B (acc) - EUR 1.15% - 1.15% 1.15% 1.15% 1.15% - 13-Oct-03JPM Europe Select Equity C (acc) - EUR 0.85% - 0.85% 0.85% 0.85% 0.63% - 07-Jan-98JPM Europe Select Equity D (acc) - EUR 2.65% - 2.65% 2.65% 2.65% 2.65% - 19-Mar-07JPM Europe Select Equity D (acc) - USD 2.65% - 2.65% 2.65% 2.65% 2.65% - 20-Dec-07JPM Europe Select Equity I (acc) - EUR 0.76% - 0.57% - - - 0.81% 13-Apr-10JPM Europe Select Equity X (acc) - EUR 0.11% - 0.13% 0.15% 0.15% 0.12% 0.15% 21-May-01JPM Europe Select Equity X (acc) - EUR (hedged) 0.11% - 0.13% 0.15% 0.15% 0.02% 0.15% 24-Oct-07
JPMorgan Investment Funds - Europe Strategic Dividend FundJPM Europe Strategic Dividend A (acc) - EUR 1.90% - 1.90% 1.90% 1.90% 1.90% - 27-Feb-05JPM Europe Strategic Dividend A (dist) - EUR 1.90% - 1.90% 1.90% 1.90% 1.90% - 15-May-06JPM Europe Strategic Dividend A (inc) - EUR 1.90% - 1.90% 1.90% 1.90% 1.90% - 04-Apr-07JPM Europe Strategic Dividend A (div) - EUR 1.90% - - - - - - 01-Dec-11JPM Europe Strategic Dividend B (acc) - EUR 1.15% - 1.15% 1.15% - - - 04-Apr-07JPM Europe Strategic Dividend C (acc) - EUR 0.85% - 0.85% 0.85% 0.85% 0.63% - 20-Apr-07JPM Europe Strategic Dividend D (acc) - EUR 2.65% - 2.65% 2.65% 2.65% 2.65% - 12-Dec-05JPM Europe Strategic Dividend D (div) - EUR 2.65% - - - - - - 01-Dec-11JPM Europe Strategic Dividend I (acc) - EUR 0.76% - - - - - 0.81% 05-May-11JPM Europe Strategic Dividend X (acc) - EUR 0.11% - 0.11% 0.15% 0.15% 0.09% 0.15% 21-May-07
JPMorgan Investment Funds - Global Balanced Fund (EUR)JPM Global Balanced (EUR) A (acc) - EUR 1.65% - 1.65% 1.65% 1.65% 1.65% - 18-Jul-95JPM Global Balanced (EUR) A (dist) - EUR 1.65% - 1.65% 1.65% 1.65% 1.65% - 15-May-06JPM Global Balanced (EUR) B (acc) - EUR 1.05% - 1.05% 1.05% 1.05% 1.05% - 19-Jan-95JPM Global Balanced (EUR) C (acc) - EUR 0.90% - 0.90% 0.90% 0.90% 0.89% - 21-Jan-98JPM Global Balanced (EUR) D (acc) - EUR 2.15% - 2.15% 2.15% 2.15% 2.15% - 11-Jul-02JPM Global Balanced (EUR) T (acc) - EUR 2.15% - - - - - - 28-Jun-11
JPMorgan Investment Funds - Global Balanced Fund (USD)JF Global Balanced (USD) A (acc) - USD 1.70% - 1.70% 1.70% 1.70% 1.70% - 04-Apr-03JPM Global Balanced (USD) A (acc) - USD 1.65% - 1.65% 1.65% 1.65% 1.65% - 01-Jul-97JPM Global Balanced (USD) A (dist) - USD 1.65% - 1.65% 1.65% 1.65% 1.65% - 15-May-06JPM Global Balanced (USD) B (acc) - USD 1.05% - 1.05% 1.05% 1.05% 1.05% - 01-Jul-97JPM Global Balanced (USD) C (acc) - USD 0.90% - 0.90% 0.90% 0.90% 0.89% - 22-Jul-03JPM Global Balanced (USD) D (acc) - USD 2.15% - 2.15% 2.15% 2.15% 2.15% - 01-Feb-02JPM Global Balanced (USD) X (acc) - USD 0.10% - 0.09% 0.10% 0.10% 0.10% 0.10% 19-Dec-97
174
JPMorgan Investment Funds
Appendix - Unaudited Additional Disclosures (continued)
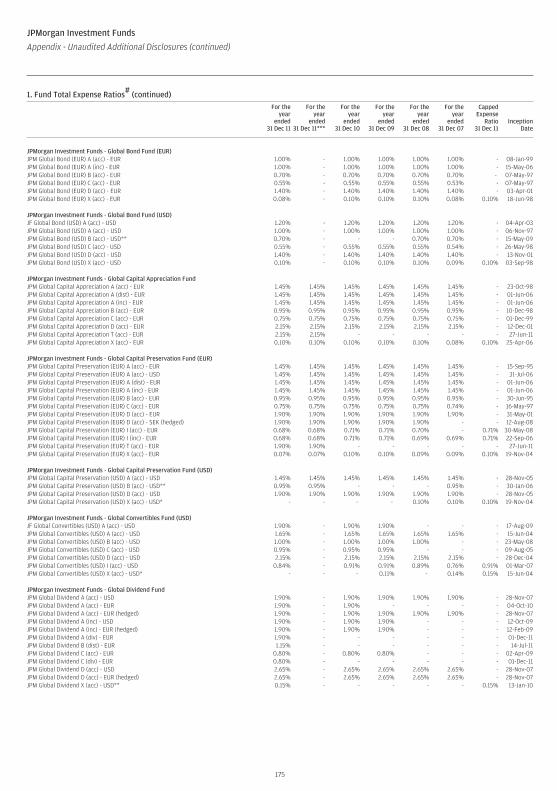
1. Fund Total Expense Ratios# (continued)For the
yearended
31 Dec 11
For theyear
ended31 Dec 11***
For theyear
ended31 Dec 10
For theyear
ended31 Dec 09
For theyear
ended31 Dec 08
For theyear
ended31 Dec 07
CappedExpense
Ratio31 Dec 11
InceptionDate
JPMorgan Investment Funds - Global Bond Fund (EUR)JPM Global Bond (EUR) A (acc) - EUR 1.00% - 1.00% 1.00% 1.00% 1.00% - 08-Jan-99JPM Global Bond (EUR) A (inc) - EUR 1.00% - 1.00% 1.00% 1.00% 1.00% - 15-May-06JPM Global Bond (EUR) B (acc) - EUR 0.70% - 0.70% 0.70% 0.70% 0.70% - 07-May-97JPM Global Bond (EUR) C (acc) - EUR 0.55% - 0.55% 0.55% 0.55% 0.53% - 07-May-97JPM Global Bond (EUR) D (acc) - EUR 1.40% - 1.40% 1.40% 1.40% 1.40% - 03-Apr-01JPM Global Bond (EUR) X (acc) - EUR 0.08% - 0.10% 0.10% 0.10% 0.08% 0.10% 18-Jun-98
JPMorgan Investment Funds - Global Bond Fund (USD)JF Global Bond (USD) A (acc) - USD 1.20% - 1.20% 1.20% 1.20% 1.20% - 04-Apr-03JPM Global Bond (USD) A (acc) - USD 1.00% - 1.00% 1.00% 1.00% 1.00% - 06-Nov-97JPM Global Bond (USD) B (acc) - USD** 0.70% - - - 0.70% 0.70% - 15-May-09JPM Global Bond (USD) C (acc) - USD 0.55% - 0.55% 0.55% 0.55% 0.54% - 26-May-98JPM Global Bond (USD) D (acc) - USD 1.40% - 1.40% 1.40% 1.40% 1.40% - 13-Nov-01JPM Global Bond (USD) X (acc) - USD 0.10% - 0.10% 0.10% 0.10% 0.09% 0.10% 03-Sep-98
JPMorgan Investment Funds - Global Capital Appreciation FundJPM Global Capital Appreciation A (acc) - EUR 1.45% 1.45% 1.45% 1.45% 1.45% 1.45% - 23-Oct-98JPM Global Capital Appreciation A (dist) - EUR 1.45% 1.45% 1.45% 1.45% 1.45% 1.45% - 01-Jun-06JPM Global Capital Appreciation A (inc) - EUR 1.45% 1.45% 1.45% 1.45% 1.45% 1.45% - 01-Jun-06JPM Global Capital Appreciation B (acc) - EUR 0.95% 0.95% 0.95% 0.95% 0.95% 0.95% - 10-Dec-98JPM Global Capital Appreciation C (acc) - EUR 0.75% 0.75% 0.75% 0.75% 0.75% 0.75% - 01-Dec-99JPM Global Capital Appreciation D (acc) - EUR 2.15% 2.15% 2.15% 2.15% 2.15% 2.15% - 12-Dec-01JPM Global Capital Appreciation T (acc) - EUR 2.15% 2.15% - - - - - 27-Jun-11JPM Global Capital Appreciation X (acc) - EUR 0.10% 0.10% 0.10% 0.10% 0.10% 0.08% 0.10% 25-Apr-06
JPMorgan Investment Funds - Global Capital Preservation Fund (EUR)JPM Global Capital Preservation (EUR) A (acc) - EUR 1.45% 1.45% 1.45% 1.45% 1.45% 1.45% - 15-Sep-95JPM Global Capital Preservation (EUR) A (acc) - USD 1.45% 1.45% 1.45% 1.45% 1.45% 1.45% - 31-Jul-06JPM Global Capital Preservation (EUR) A (dist) - EUR 1.45% 1.45% 1.45% 1.45% 1.45% 1.45% - 01-Jun-06JPM Global Capital Preservation (EUR) A (inc) - EUR 1.45% 1.45% 1.45% 1.45% 1.45% 1.45% - 01-Jun-06JPM Global Capital Preservation (EUR) B (acc) - EUR 0.95% 0.95% 0.95% 0.95% 0.95% 0.95% - 30-Jun-95JPM Global Capital Preservation (EUR) C (acc) - EUR 0.75% 0.75% 0.75% 0.75% 0.75% 0.74% - 16-May-97JPM Global Capital Preservation (EUR) D (acc) - EUR 1.90% 1.90% 1.90% 1.90% 1.90% 1.90% - 31-May-01JPM Global Capital Preservation (EUR) D (acc) - SEK (hedged) 1.90% 1.90% 1.90% 1.90% 1.90% - - 12-Aug-08JPM Global Capital Preservation (EUR) I (acc) - EUR 0.68% 0.68% 0.71% 0.71% 0.70% - 0.71% 30-May-08JPM Global Capital Preservation (EUR) I (inc) - EUR 0.68% 0.68% 0.71% 0.71% 0.69% 0.69% 0.71% 22-Sep-06JPM Global Capital Preservation (EUR) T (acc) - EUR 1.90% 1.90% - - - - - 27-Jun-11JPM Global Capital Preservation (EUR) X (acc) - EUR 0.07% 0.07% 0.10% 0.10% 0.09% 0.09% 0.10% 19-Nov-04
JPMorgan Investment Funds - Global Capital Preservation Fund (USD)JPM Global Capital Preservation (USD) A (acc) - USD 1.45% 1.45% 1.45% 1.45% 1.45% 1.45% - 28-Nov-05JPM Global Capital Preservation (USD) B (acc) - USD** 0.95% 0.95% - - - 0.95% - 30-Jan-06JPM Global Capital Preservation (USD) D (acc) - USD 1.90% 1.90% 1.90% 1.90% 1.90% 1.90% - 28-Nov-05JPM Global Capital Preservation (USD) X (acc) - USD* - - - - 0.10% 0.10% 0.10% 19-Nov-04
JPMorgan Investment Funds - Global Convertibles Fund (USD)JF Global Convertibles (USD) A (acc) - USD 1.90% - 1.90% 1.90% - - - 17-Aug-09JPM Global Convertibles (USD) A (acc) - USD 1.65% - 1.65% 1.65% 1.65% 1.65% - 15-Jun-04JPM Global Convertibles (USD) B (acc) - USD 1.00% - 1.00% 1.00% 1.00% - - 23-May-08JPM Global Convertibles (USD) C (acc) - USD 0.95% - 0.95% 0.95% - - - 09-Aug-05JPM Global Convertibles (USD) D (acc) - USD 2.15% - 2.15% 2.15% 2.15% 2.15% - 28-Dec-04JPM Global Convertibles (USD) I (acc) - USD 0.84% - 0.91% 0.91% 0.89% 0.76% 0.91% 01-Mar-07JPM Global Convertibles (USD) X (acc) - USD* - - - 0.11% - 0.14% 0.15% 15-Jun-04
JPMorgan Investment Funds - Global Dividend FundJPM Global Dividend A (acc) - USD 1.90% - 1.90% 1.90% 1.90% 1.90% - 28-Nov-07JPM Global Dividend A (acc) - EUR 1.90% - 1.90% - - - - 04-Oct-10JPM Global Dividend A (acc) - EUR (hedged) 1.90% - 1.90% 1.90% 1.90% 1.90% - 28-Nov-07JPM Global Dividend A (inc) - USD 1.90% - 1.90% 1.90% - - - 12-Oct-09JPM Global Dividend A (inc) - EUR (hedged) 1.90% - 1.90% 1.90% - - - 12-Feb-09JPM Global Dividend A (div) - EUR 1.90% - - - - - - 01-Dec-11JPM Global Dividend B (dist) - EUR 1.15% - - - - - - 14-Jul-11JPM Global Dividend C (acc) - EUR 0.80% - 0.80% 0.80% - - - 02-Apr-09JPM Global Dividend C (div) - EUR 0.80% - - - - - - 01-Dec-11JPM Global Dividend D (acc) - USD 2.65% - 2.65% 2.65% 2.65% 2.65% - 28-Nov-07JPM Global Dividend D (acc) - EUR (hedged) 2.65% - 2.65% 2.65% 2.65% 2.65% - 28-Nov-07JPM Global Dividend X (acc) - USD** 0.15% - - - - - 0.15% 13-Jan-10
175
JPMorgan Investment Funds
Appendix - Unaudited Additional Disclosures (continued)

1. Fund Total Expense Ratios# (continued)For the
yearended
31 Dec 11
For theyear
ended31 Dec 11***
For theyear
ended31 Dec 10
For theyear
ended31 Dec 09
For theyear
ended31 Dec 08
For theyear
ended31 Dec 07
CappedExpense
Ratio31 Dec 11
InceptionDate
JPMorgan Investment Funds - Global Enhanced Bond FundJPM Global Enhanced Bond A (acc) - EUR 1.10% - 1.10% 1.10% 1.10% 1.10% - 12-Dec-00JPM Global Enhanced Bond A (inc) - EUR 1.10% - 1.10% 1.10% 1.10% 1.10% - 15-May-06JPM Global Enhanced Bond B (acc) - EUR* - - 0.75% 0.75% 0.75% 0.75% - 02-Jan-01JPM Global Enhanced Bond C (acc) - EUR 0.60% - 0.60% 0.60% 0.60% 0.58% - 30-May-00JPM Global Enhanced Bond D (acc) - EUR 1.40% - 1.40% 1.40% 1.40% 1.40% - 30-May-01JPM Global Enhanced Bond X (acc) - EUR 0.10% - 0.10% 0.10% 0.10% 0.09% 0.10% 30-May-00
JPMorgan Investment Funds - Global Financials FundJPM Global Financials A (acc) - USD 1.90% - 1.90% 1.90% 1.90% 1.90% - 11-Dec-00JPM Global Financials A (acc) - EUR 1.90% - 1.90% 1.90% 1.90% 1.90% - 14-Sep-06JPM Global Financials A (acc) - SGD 1.90% - - - - - - 21-Sep-11JPM Global Financials A (dist) - USD 1.90% - 1.90% 1.90% 1.90% 1.90% - 15-May-06JPM Global Financials B (acc) - USD 1.15% - 1.15% 1.15% 1.15% 1.15% - 10-Dec-07JPM Global Financials C (acc) - USD 1.05% - 1.05% 1.05% 1.05% 0.99% - 28-Dec-00JPM Global Financials D (acc) - USD 2.90% - 2.90% 2.90% 2.90% 2.90% - 12-Jul-01JPM Global Financials X (acc) - USD 0.14% - 0.15% 0.20% 0.19% 0.17% 0.20% 07-Feb-02
JPMorgan Investment Funds - Global High Yield Bond FundJPM Global High Yield Bond A (acc) - USD 1.25% 1.25% 1.25% 1.25% - - 02-Sep-08JPM Global High Yield Bond A (acc) - EUR (hedged) 1.25% - 1.25% 1.25% 1.25% 1.25% - 24-Mar-00JPM Global High Yield Bond A (inc) - EUR (hedged) 1.25% - 1.25% 1.25% 1.25% 1.25% - 15-May-06JPM Global High Yield Bond A (mth) - USD 1.25% - 1.25% 1.25% 1.25% - - 17-Sep-08JPM Global High Yield Bond B (acc) - USD 0.90% - - - - - - 25-Aug-11JPM Global High Yield Bond B (acc) - EUR (hedged) 0.90% - 0.90% 0.90% 0.90% 0.90% - 24-Mar-00JPM Global High Yield Bond C (acc) - USD 0.60% - 0.60% 0.60% 0.60% - - 18-Aug-08JPM Global High Yield Bond C (acc) - EUR (hedged) 0.60% - 0.60% 0.60% 0.60% 0.59% - 24-Mar-00JPM Global High Yield Bond D (acc) - USD 1.65% - 1.65% - - - - 17-Sep-10JPM Global High Yield Bond D (acc) - EUR (hedged) 1.65% - 1.65% 1.65% 1.65% 1.65% - 18-Apr-01JPM Global High Yield Bond I (acc) - USD 0.52% - 0.54% 0.56% - - 0.56% 19-Nov-09JPM Global High Yield Bond I (inc) - EUR (hedged) 0.52% - 0.54% 0.56% 0.54% - 0.56% 09-Mar-07JPM Global High Yield Bond X (acc) - USD 0.07% - - - - - 0.10% 06-Jan-11JPM Global High Yield Bond X (acc) - EUR (hedged) 0.08% - 0.10% 0.10% 0.09% 0.08% 0.10% 24-Mar-00
JPMorgan Investment Funds - Global Income FundJPM Global Income A (div) - EUR 1.45% - 1.45% 1.45% 1.45% - - 11-Dec-08JPM Global Income B (div) - EUR 1.05% - - - - - - 11-Apr-11JPM Global Income C (div) - EUR 0.75% - 0.75% - - - - 16-Feb-10JPM Global Income D (div) - EUR 1.80% - 1.80% 1.80% - - - 08-Jul-09JPM Global Income T (div) - EUR 1.80% - - - - - - 28-Jun-11JPM Global Income X (div) - EUR 0.10% - - - - - 0.10% 16-Nov-11
JPMorgan Investment Funds - Global Select 130/30 FundJPM Global Select 130/30 A (acc) - USD 1.90% 1.90% 1.90% 1.90% 1.90% 1.90% - 29-May-98JPM Global Select 130/30 A (acc) - EUR* - - - 1.90% 1.90% - - 09-Dec-08JPM Global Select 130/30 A (dist) - USD 1.90% 1.90% 1.90% 1.90% 1.90% 1.90% - 15-May-06JPM Global Select 130/30 C (acc) - USD 1.00% 1.00% 1.00% 1.00% 1.00% 1.00% - 10-Jul-98JPM Global Select 130/30 D (acc) - USD 2.90% 2.90% 2.90% 2.90% 2.90% 2.90% - 06-Feb-01
JPMorgan Investment Funds - Global Select Equity FundJPM Global Select Equity A (acc) - USD 1.90% - 1.90% 1.90% 1.90% 1.90% - 05-Dec-97JPM Global Select Equity A (dist) - USD 1.90% - 1.90% 1.90% 1.90% 1.90% - 15-May-06JPM Global Select Equity B (acc) - USD 1.15% - 1.15% 1.15% 1.15% 1.15% - 05-Dec-97JPM Global Select Equity C (acc) - USD 0.80% - 0.80% 0.80% 0.80% 0.79% - 26-Mar-98JPM Global Select Equity C (acc) - EUR 0.80% - - - - - - 05-Apr-11JPM Global Select Equity D (acc) - USD 2.65% - 2.65% 2.65% 2.65% 2.65% - 15-Apr-02JPM Global Select Equity X (acc) - USD 0.11% - 0.11% 0.15% 0.14% 0.15% 0.15% 22-Sep-99
JPMorgan Investment Funds - Global Total Return FundJPM Global Total Return A (acc) - EUR 1.65% 1.65% 1.65% 1.65% 1.65% 1.65% - 29-Apr-04JPM Global Total Return A (dist) - EUR 1.65% 1.65% 1.65% 1.65% 1.65% 1.65% - 01-Jun-06JPM Global Total Return A (inc) - EUR 1.65% 1.65% 1.65% 1.65% 1.65% 1.65% - 01-Jun-06JPM Global Total Return B (acc) - EUR* - - 1.00% - 1.00% 1.00% - 17-Mar-05JPM Global Total Return C (acc) - EUR 0.80% 0.80% 0.80% 0.80% 0.80% 0.73% - 10-Nov-04JPM Global Total Return D (acc) - EUR 2.65% 2.65% 2.65% 2.65% 2.65% 2.65% - 29-Apr-04JPM Global Total Return I (acc) - EUR* - - - - - - 0.76% 30-Nov-06
176
JPMorgan Investment Funds
Appendix - Unaudited Additional Disclosures (continued)

1. Fund Total Expense Ratios# (continued)For the
yearended
31 Dec 11
For theyear
ended31 Dec 11***
For theyear
ended31 Dec 10
For theyear
ended31 Dec 09
For theyear
ended31 Dec 08
For theyear
ended31 Dec 07
CappedExpense
Ratio31 Dec 11
InceptionDate
JPMorgan Investment Funds - Highbridge Statistical Market Neutral FundJPM Highbridge Statistical Market Neutral A (acc) - EUR 1.90% 1.90% 1.90% 1.90% 1.90% 1.90% - 06-Nov-06JPM Highbridge Statistical Market Neutral A (acc) - SEK (hedged) 1.90% 1.90% 1.90% 1.90% 1.90% - - 12-Aug-08JPM Highbridge Statistical Market Neutral A (acc) - USD 1.90% 1.90% 1.90% 1.90% 1.90% 1.90% - 06-Nov-06JPM Highbridge Statistical Market Neutral A (acc) - USD (hedged) 1.90% 1.90% 1.90% 1.90% 1.90% - - 24-Jul-08JPM Highbridge Statistical Market Neutral A (dist) - GBP 1.90% 1.90% 1.90% 1.90% 1.90% 1.90% - 08-Feb-07JPM Highbridge Statistical Market Neutral A (dist) - GBP (hedged) 1.90% 1.90% 1.90% 1.90% 1.90% - - 11-Jul-08JPM Highbridge Statistical Market Neutral A (inc) - EUR 1.90% 1.90% 1.90% 1.90% 1.90% 1.90% - 23-Apr-07JPM Highbridge Statistical Market Neutral B (acc) - EUR 1.15% 1.15% 1.15% 1.15% 1.15% 1.15% - 08-Feb-07JPM Highbridge Statistical Market Neutral B (acc) - USD* - - - 1.15% 1.15% - - 24-Apr-07JPM Highbridge Statistical Market Neutral B (dist) - GBP (hedged) 1.15% 1.15% - - - - - 15-Jul-11JPM Highbridge Statistical Market Neutral C (acc) - EUR 1.00% 1.00% 1.00% 1.00% 1.00% 1.00% - 18-Jan-07JPM Highbridge Statistical Market Neutral C (dist) - GBP (hedged) 1.00% 1.00% 1.00% 1.00% 1.00% - - 23-Jun-08JPM Highbridge Statistical Market Neutral C (dist) - USD (hedged) 1.00% 1.00% 1.00% 1.00% - - - 01-Apr-09JPM Highbridge Statistical Market Neutral D (acc) - EUR 2.65% 2.65% 2.65% 2.65% 2.65% 2.65% - 06-Nov-06JPM Highbridge Statistical Market Neutral D (acc) - USD 2.65% 2.65% 2.65% 2.65% 2.65% - - 06-Nov-08JPM Highbridge Statistical Market Neutral D (acc) - USD (hedged) 2.65% 2.65% 2.65% 2.65% 2.65% - - 18-Aug-08JPM Highbridge Statistical Market Neutral I (acc) - EUR* - - 0.92% 0.96% 0.92% 0.90% 0.96% 28-Nov-06JPM Highbridge Statistical Market Neutral I (dist) - EUR 0.95% 0.95% 0.77% - - - 0.96% 16-Mar-10JPM Highbridge Statistical Market Neutral T (acc) - EUR 2.65% 2.65% - - - - - 27-Jun-11JPM Highbridge Statistical Market Neutral X (acc) - EUR 0.14% 0.14% 0.22% 0.15% 0.12% 0.10% 0.15% 20-Nov-06JPM Highbridge Statistical Market Neutral X (acc) - USD (hedged)* - - - 0.11% - - 0.15% 12-Mar-09
JPMorgan Investment Funds - Income Opportunity FundJPM Income Opportunity A (acc) - USD 1.20% 1.20% 1.20% 1.20% 1.20% 1.20% - 14-Oct-08JPM Income Opportunity A (acc) - CHF (hedged) 1.20% 2.30% - - - - - 28-Sep-11JPM Income Opportunity A (acc) - EUR (hedged) 1.20% 1.20% 1.20% - 1.20% 1.20% - 19-Jul-07JPM Income Opportunity A (acc) - SEK (hedged) 1.20% 1.20% 1.20% 1.20% - 1.45% - 02-Jul-09JPM Income Opportunity A (inc) - EUR (hedged) 1.20% 1.20% 1.20% - - 1.20% - 19-Jul-07JPM Income Opportunity A (dist) - GBP (hedged) 1.20% 1.20% 1.20% 1.20% 1.20% - - 06-Feb-08JPM Income Opportunity B (acc) - USD 0.80% 0.80% 0.80% 0.80% - - - 18-Nov-09JPM Income Opportunity B (acc) - EUR (hedged) 0.80% 0.80% 0.80% 0.80% - - - 26-Jun-09JPM Income Opportunity B (dist) - GBP (hedged) 0.80% 0.80% - - - - - 15-Jul-11JPM Income Opportunity C (acc) - USD 0.70% 0.70% 0.70% 0.70% - - - 22-Oct-09JPM Income Opportunity C (acc) - USD (hedged to BRL)* - - 0.70% - - - - 29-Apr-10JPM Income Opportunity C (acc) - EUR (hedged) 0.70% 0.70% 0.70% - 0.70% - - 18-Jan-08JPM Income Opportunity C (acc) - SEK (hedged) 0.70% 1.31% 0.70% - - - - 18-Mar-10JPM Income Opportunity C (dist) - GBP (hedged) 0.70% 0.70% 0.70% 0.70% - - - 17-Feb-09JPM Income Opportunity D (acc) - EUR (hedged) 1.45% 1.45% 1.45% - 1.45% 1.45% - 19-Jul-07JPM Income Opportunity D (inc) - EUR (hedged) 1.45% 1.45% 1.45% - - 1.45% - 05-Oct-10JPM Income Opportunity I (acc) - USD* - - - - - - 0.66% 19-Jan-11JPM Income Opportunity X (acc) - USD 0.09% 0.10% 0.09% 0.10% - - 0.10% 12-Mar-09JPM Income Opportunity X (acc) - EUR (hedged) 0.09% 0.09% 0.09% - - - 0.10% 17-Nov-09JPM Income Opportunity X (acc) - GBP (hedged) 0.09% 0.09% 0.09% 0.10% - - 0.10% 09-Dec-09JPM Income Opportunity X (dist) - GBP (hedged) 0.10% 0.10% - - - - 0.10% 24-May-11
JPMorgan Investment Funds - Japan 50 Equity FundJPM Japan 50 Equity A (acc) - JPY 1.90% - 1.90% 1.90% 1.90% 1.90% - 15-May-06JPM Japan 50 Equity A (acc) - EUR 1.90% - 1.90% 1.90% 1.90% 1.90% - 27-Dec-04JPM Japan 50 Equity A (acc) - EUR (hedged) 1.90% - - - - - - 18-Apr-11JPM Japan 50 Equity A (dist) - JPY 1.90% - 1.90% 1.90% 1.90% 1.90% - 08-May-07JPM Japan 50 Equity C (acc) - JPY 0.95% - 0.95% 0.95% - - - 02-Apr-09JPM Japan 50 Equity C (acc) - EUR (hedged) 0.95% - - - - - - 18-Apr-11JPM Japan 50 Equity D (acc) - EUR (hedged) 2.90% - - - - - - 07-Oct-11JPM Japan 50 Equity D (acc) - JPY 2.90% - 2.90% 2.90% 2.90% 2.90% - 26-Jul-06JPM Japan 50 Equity I (acc) - JPY* - - - - 0.86% 0.86% 0.91% 19-May-06JPM Japan 50 Equity X (acc) - JPY 0.11% - 0.15% 0.15% 0.12% 0.11% 0.15% 20-Dec-04
JPMorgan Investment Funds - Japan Behavioural Finance Equity FundJPM Japan Behavioural Finance Equity A (acc) - USD 1.90% - 1.90% 1.90% 1.90% 1.90% - 03-Apr-07JPM Japan Behavioural Finance Equity A (acc) - EUR 1.90% - 1.90% 1.90% 1.90% 1.90% - 03-Apr-07JPM Japan Behavioural Finance Equity A (dist) - USD 1.90% - 1.90% 1.90% 1.90% 1.90% - 03-Apr-07JPM Japan Behavioural Finance Equity C (acc) - USD* - - - 0.95% 0.95% 0.20% - 03-Apr-07JPM Japan Behavioural Finance Equity D (acc) - USD* - - - 2.65% - 2.65% - 03-Apr-07JPM Japan Behavioural Finance Equity D (acc) - EUR 2.65% - 2.65% 2.65% 2.65% 2.65% - 03-Apr-07JPM Japan Behavioural Finance Equity I (inc) - EUR* - - - 0.91% - 0.56% 0.91% 31-May-07JPM Japan Behavioural Finance Equity X (acc) - USD* - - 0.13% 0.15% 0.14% 0.06% 0.15% 31-May-07
JPMorgan Investment Funds - Japan Focus FundJPM Japan Focus A (acc) - JPY 1.90% 1.90% 1.90% 1.90% 1.90% - - 15-Feb-08JPM Japan Focus A (dist) - JPY 1.90% 1.90% 1.90% 1.90% - - - 24-Nov-09JPM Japan Focus B (acc) - JPY 1.15% 1.15% - - - - - 13-May-11JPM Japan Focus C (acc) - JPY 0.95% 0.95% - - - - - 17-Jan-11JPM Japan Focus D (acc) - JPY 2.90% 2.90% 2.90% 2.90% 2.50% - - 15-Feb-08JPM Japan Focus I (acc) - JPY 0.88% 0.88% 0.90% 0.91% 0.91% - 0.91% 02-Jul-08JPM Japan Focus X (acc) - JPY 0.13% 0.13% 0.14% 0.15% 0.15% - 0.15% 16-Jun-08
177
JPMorgan Investment Funds
Appendix - Unaudited Additional Disclosures (continued)

1. Fund Total Expense Ratios# (continued)For the
yearended
31 Dec 11
For theyear
ended31 Dec 11***
For theyear
ended31 Dec 10
For theyear
ended31 Dec 09
For theyear
ended31 Dec 08
For theyear
ended31 Dec 07
CappedExpense
Ratio31 Dec 11
InceptionDate
JPMorgan Investment Funds - Japan Select Equity FundJPM Japan Select Equity A (acc) - JPY 1.90% - 1.90% 1.90% 1.90% 1.90% - 02-Apr-97JPM Japan Select Equity A (dist) - JPY 1.90% - 1.90% 1.90% 1.90% 1.90% - 15-May-06JPM Japan Select Equity B (acc) - JPY 1.15% - 1.15% 1.15% 1.15% 1.15% - 04-Jul-97JPM Japan Select Equity C (acc) - JPY 0.95% - 0.95% 0.95% 0.95% 0.89% - 03-Jun-99JPM Japan Select Equity D (acc) - JPY 2.65% - 2.65% 2.65% 2.65% 2.65% - 22-Mar-02JPM Japan Select Equity I (acc) - JPY 0.84% - 0.85% 0.91% 0.86% 0.85% 0.91% 17-Nov-06JPM Japan Select Equity X (acc) - JPY 0.09% - 0.10% 0.15% 0.11% 0.10% 0.15% 26-May-98
JPMorgan Investment Funds - Japan Strategic Value FundJPM Japan Strategic Value A (acc) - JPY 1.90% - 1.90% 1.90% 1.90% 1.90% - 30-Nov-07JPM Japan Strategic Value A (acc) - EUR 1.90% - 1.90% 1.90% 1.90% 1.90% - 30-Nov-07JPM Japan Strategic Value A (dist) - GBP 1.90% - 1.90% 1.90% 1.90% 1.90% - 30-Nov-07JPM Japan Strategic Value C (acc) - JPY 0.95% - 0.95% 0.95% - - - 02-Apr-09JPM Japan Strategic Value D (acc) - JPY 2.65% - 2.65% 2.65% 2.65% 2.65% - 30-Nov-07JPM Japan Strategic Value D (acc) - EUR 2.65% - 2.65% 2.65% 2.65% 2.65% - 30-Nov-07JPM Japan Strategic Value X (acc) - JPY 0.11% - 0.14% 0.15% - - 0.15% 30-Apr-09
JPMorgan Investment Funds - JF Asia ex-Japan FundJF Asia ex-Japan A (acc) - USD 1.90% - 1.90% 1.90% 1.90% 1.90% - 12-Dec-97JF Asia ex-Japan A (dist) - USD 1.90% - 1.90% 1.90% 1.90% 1.90% - 15-May-06JF Asia ex-Japan B (acc) - USD 1.15% - 1.15% 1.15% 1.15% 1.15% - 31-Dec-97JF Asia ex-Japan C (acc) - USD 1.00% - 1.00% 1.00% 1.00% 0.97% - 14-Dec-00JF Asia ex-Japan C (dist) - USD 1.00% - - - - - - 14-Jul-11JF Asia ex-Japan D (acc) - USD 2.65% - 2.65% 2.65% 2.65% 2.65% - 12-Mar-02JF Asia ex-Japan I (acc) - USD 0.86% - 0.96% 0.96% 0.90% 0.92% 0.96% 26-Jun-06JF Asia ex-Japan X (acc) - USD 0.11% - 0.13% 0.20% 0.17% 0.17% 0.20% 29-Jun-98JF Asia ex-Japan X (dist) - USD 0.19% - - - - - 0.20% 23-May-11
JPMorgan Investment Funds - US Bond FundJPM US Bond A (acc) - USD 1.10% - 1.10% 1.10% 1.10% 1.10% - 15-May-97JPM US Bond A (inc) - USD 1.10% - 1.10% 1.10% 1.10% 1.10% - 15-May-06JPM US Bond B (acc) - USD 0.75% - 0.75% 0.75% 0.75% 0.75% - 15-May-97JPM US Bond C (acc) - USD 0.60% - 0.60% 0.60% 0.60% 0.57% - 12-Feb-98JPM US Bond D (acc) - USD 1.35% - 1.35% 1.35% 1.35% 1.35% - 13-Nov-01JPM US Bond X (acc) - USD* - - - - - 0.08% 0.10% 06-Apr-98
JPMorgan Investment Funds - US Equity FundJPM US Equity A (acc) - USD 1.90% - 1.90% 1.90% 1.90% 1.90% - 27-Dec-06JPM US Equity A (acc) - EUR (hedged) 1.90% - 1.90% 1.90% 1.90% 1.90% - 27-Dec-06JPM US Equity A (dist) - GBP 1.90% - 1.90% 1.90% - - - 25-Aug-09JPM US Equity C (acc) - USD 0.85% - 0.85% 0.85% 0.85% 0.67% - 22-Mar-07JPM US Equity D (acc) - USD 2.40% - 2.40% 2.40% 2.40% 2.40% - 27-Dec-06JPM US Equity D (acc) - EUR (hedged) 2.40% - 2.40% 2.40% 2.40% 2.40% - 27-Dec-06JPM US Equity X (acc) - USD 0.14% - 0.15% 0.15% 0.12% 0.12% 0.15% 21-May-07
JPMorgan Investment Funds - US Select Equity FundJPM US Select Equity A (acc) - USD 1.90% - 1.90% 1.90% 1.90% 1.90% - 17-Mar-97JPM US Select Equity A (acc) - EUR 1.90% - 1.90% 1.90% 1.90% - - 10-Jun-08JPM US Select Equity A (acc) - EUR (hedged) 1.90% - 1.90% 1.90% 1.90% 1.90% - 15-Mar-07JPM US Select Equity A (dist) - USD 1.90% - 1.90% 1.90% 1.90% 1.90% - 15-May-06JPM US Select Equity B (acc) - USD 1.15% - 1.15% 1.15% 1.15% 1.15% - 29-Oct-97JPM US Select Equity C (acc) - USD 0.85% - 0.85% 0.85% 0.85% 0.80% - 03-Feb-08JPM US Select Equity C (acc) - EUR 0.85% - - - - - - 06-Sep-11JPM US Select Equity C (acc) - EUR (hedged) 0.85% - 0.85% 0.85% 0.85% - - 19-Sep-08JPM US Select Equity C (dist) - GBP 0.85% - - - - - - 06-Sep-11JPM US Select Equity D (acc) - USD 2.40% - 2.40% 2.40% 2.40% 2.40% - 01-Feb-02JPM US Select Equity D (acc) - EUR (hedged) 2.40% - 2.40% 2.40% 2.40% 2.40% - 15-Mar-07JPM US Select Equity I (acc) - USD 0.71% - 0.72% 0.81% 0.77% 0.50% 0.81% 15-May-07JPM US Select Equity X (acc) - USD 0.07% - 0.08% 0.15% 0.12% 0.12% 0.15% 06-Apr-98
Expense ratios are calculated in accordance with the guidelines dated 16 May 2008 issued by the Swiss Fund Association.
# The capped expense ratios and total expense ratios for some share classes may have changed over the previous five years. All details concerning these changes have been disclosed in previousyears’ financial statements.* Share Class inactive at the end of the year.** Share Class reactivated during the year.*** These figures include the Performance Fees, where applicable.
178
JPMorgan Investment Funds
Appendix - Unaudited Additional Disclosures (continued)
JPMorgan Investment Funds
Appendix - Unaudited Additional Disclosures (continued)
2. Summary of Investment Objectives of the Sub-Funds
Blue and Green FundSeeks to achieve, over a medium-term horizon (2 to 3 years), a return in excess of its cash benchmark from a portfolio of securities, globally, using derivativestrategies where appropriate.
Emerging Markets Corporate Bond Portfolio Fund ISeeks to achieve a return profile comparable to that achieved by holding, from purchase to maturity, a five-year below investment grade emerging marketcorporate bond, but with increased diversification by investing primarily in a portfolio of below investment grade emerging market corporate fixed andfloating rate debt securities, with maturity dates within twelve months of the termination of the Principal Investment Period.
Euro Liquid Market FundSeeks to achieve a competitive level of total return in the reference currency and a high degree of liquidity by investing primarily in EUR denominatedshort-term fixed and floating rate debt securities.
Europe Bond FundSeeks to achieve a return in excess of the European bond markets by investing primarily in European fixed and floating rate debt securities, using derivativestrategies where appropriate.
Europe Recovery FundSeeks to provide long-term capital growth by investing primarily in European companies that the Investment Manager believes to be in recovery situations.
Europe Select Equity FundSeeks to achieve a return in excess of the European equity markets by investing primarily in European companies.
Europe Strategic Dividend FundSeeks to provide long-term returns by investing primarily in high dividend-yielding equities of European companies.
Global Balanced Fund (EUR)Seeks to provide long-term capital growth and income by investing primarily in companies and sovereign issuers, globally.
Global Balanced Fund (USD)Seeks to provide long-term capital growth and income by investing primarily in companies and sovereign issuers, globally.
Global Bond Fund (EUR)Seeks to achieve a return in excess of global government bond markets by investing primarily in global fixed and floating rate debt securities, usingderivative strategies where appropriate.
Global Bond Fund (USD)Seeks to achieve a return in excess of global government bond markets by investing primarily in global fixed and floating rate debt securities, usingderivative strategies where appropriate.
Global Capital Appreciation FundSeeks to achieve capital appreciation in excess of its cash benchmark by investing primarily in securities, globally, using derivative strategies whereappropriate.
Global Capital Preservation Fund (EUR)Seeks to achieve, over a medium-term horizon (2 to 3 years), a return in excess of its cash benchmark from a portfolio of securities, globally, using derivativestrategies where appropriate.
Global Capital Preservation Fund (USD)Seeks to achieve, over a medium-term horizon (2 to 3 years), a return in excess of its cash benchmark from a portfolio of securities, globally, using derivativestrategies where appropriate.
Global Convertibles Fund (USD)Seeks to provide a return by investing primarily in a diversified portfolio of convertible securities and warrants, globally.
Global Dividend FundSeeks to provide long-term capital growth by investing primarily in companies, globally, that generate high and rising income.
Global Enhanced Bond FundSeeks to achieve a return in excess of global non-government bond markets by investing primarily in global fixed and floating rate debt securities, usingderivative strategies where appropriate.
Global Financials FundSeeks to achieve a high return by investing primarily in companies from the financial, banking, insurance and property sectors (“Financial Companies”),globally.
Global High Yield Bond FundSeeks to achieve a return in excess of global bond markets by investing primarily in below investment grade global fixed and floating rate debt securities,using derivative strategies where appropriate.
Global Income FundSeeks to provide regular income by investing primarily in a portfolio of income generating securities, globally, and through the use of financial derivativeinstruments.
Global Select 130/30 FundSeeks to provide long-term capital growth primarily through exposure to companies, globally, by direct investment in securities of such companies andthrough the use of financial derivative instruments.
179

JPMorgan Investment Funds
Appendix - Unaudited Additional Disclosures (continued)
2. Summary of Investment Objectives of the Sub-Funds (continued)
Global Select Equity FundSeeks to achieve a return in excess of the global equity markets by investing primarily in companies, globally.
Global Total Return FundSeeks to achieve a total return in EUR in excess of its cash benchmark over an economic cycle by investing primarily in a concentrated portfolio of companiesglobally, using financial derivatives instruments where appropriate.
Highbridge Statistical Market Neutral FundSeeks to provide a total return in all market environments in excess of the return on short-term instruments, through a market neutral strategy. Derivativeswill be used where appropriate to gain exposure primarily to European and US equity securities.
Income Opportunity FundSeeks to achieve a return in excess of the benchmark by exploiting investment opportunities in, amongst others, the fixed income and currency markets,using derivative strategies where appropriate.
Japan 50 Equity FundSeeks to achieve a return in excess of the Japanese equity market primarily from a concentrated portfolio of medium to large sized Japanese companies.
Japan Behavioural Finance Equity FundSeeks to provide long-term capital growth by investing primarily in Japanese companies.
Japan Focus FundSeeks to provide superior long-term capital growth by investing primarily in an aggressively managed portfolio of Japanese companies.
Japan Select Equity FundSeeks to achieve a return in excess of the Japanese equity market by investing primarily in Japanese companies.
Japan Strategic Value FundSeeks to provide long-term capital growth by investing primarily in a value style biased portfolio of Japanese companies.
JF Asia ex-Japan FundSeeks to provide long-term capital growth by investing primarily in companies in Asia (excluding Japan).
US Bond FundSeeks to achieve a return in excess of US bond markets by investing primarily in US fixed and floating rate debt securities, using derivative strategies whereappropriate.
US Equity FundSeeks to maximise long-term capital growth by investing primarily in an actively managed portfolio of medium to large capitalisation US companies.
US Select Equity FundSeeks to achieve a return in excess of the US equity market by investing primarily in US companies.
180

3. Performance and VolatilityPerformance
Returns for periods greater than one year are annualised. Fund performance includes reinvestment of income and is net of all expenses.
Past performance is no indication of current or future performance.
The performance data do not take into account the commissions and costs incurred on the issue and redemption of units.
Volatility
The standard deviation (D) of the price is calculated on a daily basis throughout each Fund’s financial year. The details below relate to the year from 1 January 2011 to31 December 2011.
If D is equal to or less than 0.1 then volatility will be LowIf D is greater than 0.1 but less than or equal to 1.0 then volatility will be MediumIf D is greater than 1.0 but less than or equal to 2.4 then volatility will be HighIf D is greater than 2.4 then volatility will be Very High
Performance (continued) 3 Months 6 Months 9 Months 1 Year 2 Years 3 Years 4 Years 5 Years Volatility
JPMorgan Investment Funds - Blue and Green FundJPM Blue and Green -4.56% -1.00% -1.96% -3.16% -1.02% 2.46% 0.11% 1.20% Medium
JPMorgan Investment Funds - Emerging Markets Corporate Bond Portfolio Fund IJPM Emerging Markets Corporate Bond Portfolio I - A (div) - USD 5.29% -4.63% -3.36% 0.94% - - - - MediumJPM Emerging Markets Corporate Bond Portfolio I - A (div) - EUR (hedged) 5.19% -4.76% -3.27% 1.06% - - - - MediumJPM Emerging Markets Corporate Bond Portfolio I - B (div) - USD 5.43% -4.38% -2.96% 1.48% - - - - MediumJPM Emerging Markets Corporate Bond Portfolio I - B (div) - EUR (hedged) 5.34% -4.49% -2.86% 1.62% - - - - MediumJPM Emerging Markets Corporate Bond Portfolio I - C (div) - USD 5.46% -4.31% -2.85% 1.63% - - - - MediumJPM Emerging Markets Corporate Bond Portfolio I - D (div) - USD 5.16% -4.87% -3.72% 0.45% - - - - MediumJPM Emerging Markets Corporate Bond Portfolio I - D (div) - EUR (hedged) 5.07% -4.99% -3.63% 0.57% - - - - Medium
JPMorgan Investment Funds - Euro Liquid Market FundJPM Euro Liquid Market A (acc) - EUR 0.07% 0.19% 0.30% 0.34% 0.18% 0.31% 1.20% 1.69% LowJPM Euro Liquid Market C (acc) - EUR 0.17% 0.39% 0.60% 0.76% 0.56% 0.70% 1.61% - LowJPM Euro Liquid Market D (acc) - EUR 0.05% 0.15% 0.23% 0.25% 0.13% 0.24% - - LowJPM Euro Liquid Market X (acc) - EUR* - - - - - - - - Low
JPMorgan Investment Funds - Europe Bond FundJPM Europe Bond A (acc) - EUR -0.36% 2.66% 3.38% 2.33% 3.32% 5.33% -0.77% -1.01% MediumJPM Europe Bond A (inc) - EUR -0.36% 2.65% 3.38% 2.33% 3.32% 5.33% -0.77% -0.97% MediumJPM Europe Bond B (acc) - EUR -0.28% 2.77% 3.56% 2.60% 3.61% 5.66% -0.49% -0.74% MediumJPM Europe Bond C (acc) - EUR -0.25% 2.87% 3.69% 2.74% 3.75% 5.80% -0.38% -0.61% MediumJPM Europe Bond D (acc) - EUR -0.45% 2.47% 3.10% 1.97% 2.94% 4.93% -1.12% -1.35% MediumJPM Europe Bond X (acc) - EUR -0.16% 3.07% 4.00% 3.16% 4.18% 6.27% 0.02% -0.21% Medium
JPMorgan Investment Funds - Europe Recovery FundJPM Europe Recovery A (acc) - EUR 1.89% -17.03% -20.44% -22.85% -2.25% 6.76% -7.55% -6.14% HighJPM Europe Recovery A (dist) - EUR 1.88% -17.03% -20.44% -22.74% -2.16% 6.56% -7.41% -6.03% HighJPM Europe Recovery B (acc) - EUR** 2.09% -16.71% -19.97% -20.20% -14.65% -3.41% -11.88% -9.54% HighJPM Europe Recovery C (acc) - EUR 2.07% -16.69% -19.93% -22.19% -1.40% 7.85% -6.91% -5.50% HighJPM Europe Recovery D (acc) - EUR 1.63% -17.45% -21.03% -23.62% -3.19% 5.58% -8.24% -6.82% HighJPM Europe Recovery X (acc) - EUR 2.34% -16.28% -19.35% -21.46% -0.53% - -13.07% -10.35% High
JPMorgan Investment Funds - Europe Select Equity FundJPM Europe Select Equity A (acc) - EUR 7.22% -13.01% -13.59% -13.26% -1.98% 11.52% -7.04% -6.03% HighJPM Europe Select Equity A (acc) - USD 3.61% -21.96% -20.92% -15.95% -6.61% 7.84% -9.13% - HighJPM Europe Select Equity A (dist) - EUR 7.24% -13.02% -13.59% -13.17% -1.92% 5.30% -9.47% -7.93% HighJPM Europe Select Equity B (acc) - EUR 7.43% -12.68% -13.10% -12.61% -1.24% 12.55% -6.49% - HighJPM Europe Select Equity C (acc) - EUR 7.50% -12.55% -12.92% -12.36% -0.96% 12.96% -6.27% - HighJPM Europe Select Equity D (acc) - EUR 7.01% -13.35% -14.09% -13.92% -2.69% 10.52% -7.57% - HighJPM Europe Select Equity D (acc) - USD 3.41% -22.26% -21.37% -16.58% -7.26% 6.92% -9.60% - HighJPM Europe Select Equity I (acc) - EUR 7.54% -12.50% -12.84% -12.28% - - - - HighJPM Europe Select Equity X (acc) - EUR 7.71% -12.22% -12.42% -11.71% -0.25% 13.96% -5.73% -4.75% HighJPM Europe Select Equity X (acc) - EUR (hedged) 6.12% -15.10% -15.28% -13.44% -3.15% 9.51% -6.13% - High
JPMorgan Investment Funds - Europe Strategic Dividend FundJPM Europe Strategic Dividend A (acc) - EUR 7.81% -8.08% -8.42% -7.35% 1.57% 14.94% -4.27% -4.04% HighJPM Europe Strategic Dividend A (dist) - EUR 7.83% -8.07% -8.41% -7.24% 1.58% 13.86% -4.70% -4.34% HighJPM Europe Strategic Dividend A (div) - EUR*** - - - - - - - - HighJPM Europe Strategic Dividend A (inc) - EUR 7.81% -8.07% -8.42% -7.24% 1.58% 13.86% -4.71% - HighJPM Europe Strategic Dividend B (acc) - EUR 8.01% -7.73% -7.90% -6.66% - - - - HighJPM Europe Strategic Dividend C (acc) - EUR 8.10% -7.59% -7.69% -6.38% 2.66% 16.48% -3.38% - HighJPM Europe Strategic Dividend D (acc) - EUR 7.61% -8.42% -8.93% -8.04% 0.81% 13.86% -4.88% -4.62% HighJPM Europe Strategic Dividend D (div) - EUR*** - - - - - - - - HighJPM Europe Strategic Dividend I (acc) - EUR 8.12% -7.55% - - - - - - HighJPM Europe Strategic Dividend X (acc) - EUR 8.30% -7.24% -7.19% -5.70% 3.98% 18.09% -2.52% - High
181
JPMorgan Investment Funds
Appendix - Unaudited Additional Disclosures (continued)
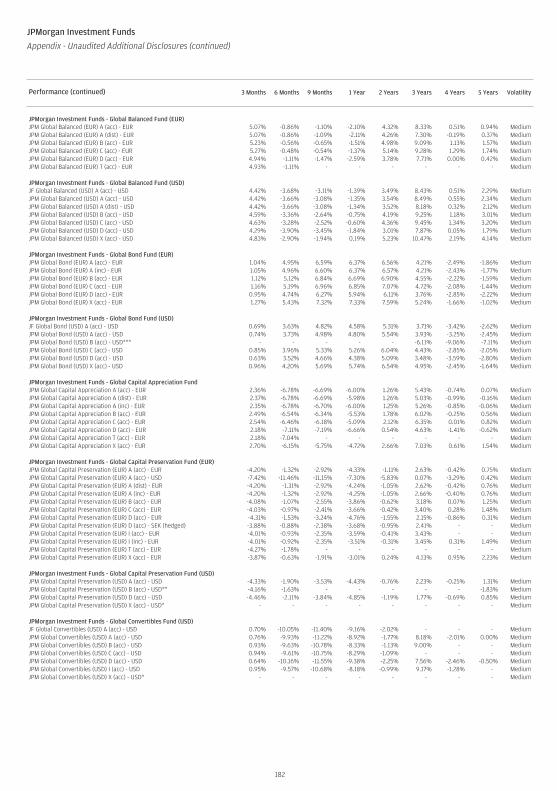
Performance (continued) 3 Months 6 Months 9 Months 1 Year 2 Years 3 Years 4 Years 5 Years Volatility
JPMorgan Investment Funds - Global Balanced Fund (EUR)JPM Global Balanced (EUR) A (acc) - EUR 5.07% -0.86% -1.10% -2.10% 4.32% 8.33% 0.51% 0.94% MediumJPM Global Balanced (EUR) A (dist) - EUR 5.07% -0.86% -1.09% -2.11% 4.26% 7.30% -0.19% 0.37% MediumJPM Global Balanced (EUR) B (acc) - EUR 5.23% -0.56% -0.65% -1.51% 4.98% 9.09% 1.13% 1.57% MediumJPM Global Balanced (EUR) C (acc) - EUR 5.27% -0.48% -0.54% -1.37% 5.14% 9.28% 1.29% 1.74% MediumJPM Global Balanced (EUR) D (acc) - EUR 4.94% -1.11% -1.47% -2.59% 3.78% 7.71% 0.00% 0.42% MediumJPM Global Balanced (EUR) T (acc) - EUR 4.93% -1.11% - - - - - - Medium
JPMorgan Investment Funds - Global Balanced Fund (USD)JF Global Balanced (USD) A (acc) - USD 4.42% -3.68% -3.11% -1.39% 3.49% 8.43% 0.51% 2.29% MediumJPM Global Balanced (USD) A (acc) - USD 4.42% -3.66% -3.08% -1.35% 3.54% 8.49% 0.55% 2.34% MediumJPM Global Balanced (USD) A (dist) - USD 4.42% -3.66% -3.08% -1.34% 3.52% 8.18% 0.32% 2.12% MediumJPM Global Balanced (USD) B (acc) - USD 4.59% -3.36% -2.64% -0.75% 4.19% 9.25% 1.18% 3.01% MediumJPM Global Balanced (USD) C (acc) - USD 4.63% -3.28% -2.52% -0.60% 4.36% 9.45% 1.34% 3.20% MediumJPM Global Balanced (USD) D (acc) - USD 4.29% -3.90% -3.45% -1.84% 3.01% 7.87% 0.05% 1.79% MediumJPM Global Balanced (USD) X (acc) - USD 4.83% -2.90% -1.94% 0.19% 5.23% 10.47% 2.19% 4.14% Medium
JPMorgan Investment Funds - Global Bond Fund (EUR)JPM Global Bond (EUR) A (acc) - EUR 1.04% 4.95% 6.59% 6.37% 6.56% 4.21% -2.49% -1.86% MediumJPM Global Bond (EUR) A (inc) - EUR 1.05% 4.96% 6.60% 6.37% 6.57% 4.21% -2.43% -1.77% MediumJPM Global Bond (EUR) B (acc) - EUR 1.12% 5.12% 6.84% 6.69% 6.90% 4.55% -2.22% -1.59% MediumJPM Global Bond (EUR) C (acc) - EUR 1.16% 5.19% 6.96% 6.85% 7.07% 4.72% -2.08% -1.44% MediumJPM Global Bond (EUR) D (acc) - EUR 0.95% 4.74% 6.27% 5.94% 6.11% 3.76% -2.85% -2.22% MediumJPM Global Bond (EUR) X (acc) - EUR 1.27% 5.43% 7.32% 7.33% 7.59% 5.24% -1.66% -1.02% Medium
JPMorgan Investment Funds - Global Bond Fund (USD)JF Global Bond (USD) A (acc) - USD 0.69% 3.63% 4.82% 4.58% 5.31% 3.71% -3.42% -2.62% MediumJPM Global Bond (USD) A (acc) - USD 0.74% 3.73% 4.98% 4.80% 5.54% 3.93% -3.25% -2.45% MediumJPM Global Bond (USD) B (acc) - USD*** - - - - - -6.11% -9.06% -7.11% MediumJPM Global Bond (USD) C (acc) - USD 0.85% 3.96% 5.33% 5.26% 6.04% 4.43% -2.85% -2.05% MediumJPM Global Bond (USD) D (acc) - USD 0.63% 3.52% 4.66% 4.38% 5.09% 3.48% -3.59% -2.80% MediumJPM Global Bond (USD) X (acc) - USD 0.96% 4.20% 5.69% 5.74% 6.54% 4.95% -2.45% -1.64% Medium
JPMorgan Investment Funds - Global Capital Appreciation FundJPM Global Capital Appreciation A (acc) - EUR 2.36% -6.78% -6.69% -6.00% 1.26% 5.43% -0.74% 0.07% MediumJPM Global Capital Appreciation A (dist) - EUR 2.37% -6.78% -6.69% -5.98% 1.26% 5.03% -0.99% -0.16% MediumJPM Global Capital Appreciation A (inc) - EUR 2.35% -6.78% -6.70% -6.00% 1.25% 5.26% -0.85% -0.06% MediumJPM Global Capital Appreciation B (acc) - EUR 2.49% -6.54% -6.34% -5.53% 1.78% 6.02% -0.25% 0.56% MediumJPM Global Capital Appreciation C (acc) - EUR 2.54% -6.46% -6.18% -5.09% 2.12% 6.35% 0.01% 0.82% MediumJPM Global Capital Appreciation D (acc) - EUR 2.18% -7.11% -7.19% -6.66% 0.54% 4.63% -1.41% -0.62% MediumJPM Global Capital Appreciation T (acc) - EUR 2.18% -7.04% - - - - - - MediumJPM Global Capital Appreciation X (acc) - EUR 2.70% -6.15% -5.75% -4.72% 2.66% 7.03% 0.61% 1.54% Medium
JPMorgan Investment Funds - Global Capital Preservation Fund (EUR)JPM Global Capital Preservation (EUR) A (acc) - EUR -4.20% -1.32% -2.92% -4.33% -1.11% 2.63% -0.42% 0.75% MediumJPM Global Capital Preservation (EUR) A (acc) - USD -7.42% -11.46% -11.15% -7.30% -5.83% 0.07% -3.29% 0.42% MediumJPM Global Capital Preservation (EUR) A (dist) - EUR -4.20% -1.31% -2.92% -4.24% -1.05% 2.62% -0.42% 0.76% MediumJPM Global Capital Preservation (EUR) A (inc) - EUR -4.20% -1.32% -2.92% -4.25% -1.05% 2.66% -0.40% 0.76% MediumJPM Global Capital Preservation (EUR) B (acc) - EUR -4.08% -1.07% -2.55% -3.86% -0.62% 3.18% 0.07% 1.25% MediumJPM Global Capital Preservation (EUR) C (acc) - EUR -4.03% -0.97% -2.41% -3.66% -0.42% 3.40% 0.28% 1.48% MediumJPM Global Capital Preservation (EUR) D (acc) - EUR -4.31% -1.53% -3.24% -4.76% -1.55% 2.15% -0.86% 0.31% MediumJPM Global Capital Preservation (EUR) D (acc) - SEK (hedged) -3.88% -0.88% -2.38% -3.68% -0.95% 2.41% - - MediumJPM Global Capital Preservation (EUR) I (acc) - EUR -4.01% -0.93% -2.35% -3.59% -0.41% 3.43% - - MediumJPM Global Capital Preservation (EUR) I (inc) - EUR -4.01% -0.92% -2.35% -3.51% -0.31% 3.45% 0.31% 1.49% MediumJPM Global Capital Preservation (EUR) T (acc) - EUR -4.27% -1.78% - - - - - - MediumJPM Global Capital Preservation (EUR) X (acc) - EUR -3.87% -0.63% -1.91% -3.01% 0.24% 4.13% 0.95% 2.23% Medium
JPMorgan Investment Funds - Global Capital Preservation Fund (USD)JPM Global Capital Preservation (USD) A (acc) - USD -4.33% -1.90% -3.53% -4.43% -0.76% 2.23% -0.25% 1.31% MediumJPM Global Capital Preservation (USD) B (acc) - USD** -4.16% -1.63% - - - - - -1.83% MediumJPM Global Capital Preservation (USD) D (acc) - USD -4.46% -2.11% -3.84% -4.85% -1.19% 1.77% -0.69% 0.85% MediumJPM Global Capital Preservation (USD) X (acc) - USD* - - - - - - - - Medium
JPMorgan Investment Funds - Global Convertibles Fund (USD)JF Global Convertibles (USD) A (acc) - USD 0.70% -10.05% -11.40% -9.16% -2.02% - - - MediumJPM Global Convertibles (USD) A (acc) - USD 0.76% -9.93% -11.22% -8.92% -1.77% 8.18% -2.01% 0.00% MediumJPM Global Convertibles (USD) B (acc) - USD 0.93% -9.63% -10.78% -8.33% -1.13% 9.00% - - MediumJPM Global Convertibles (USD) C (acc) - USD 0.94% -9.61% -10.75% -8.29% -1.09% - - - MediumJPM Global Convertibles (USD) D (acc) - USD 0.64% -10.16% -11.55% -9.38% -2.25% 7.56% -2.46% -0.50% MediumJPM Global Convertibles (USD) I (acc) - USD 0.95% -9.57% -10.68% -8.18% -0.99% 9.17% -1.28% - MediumJPM Global Convertibles (USD) X (acc) - USD* - - - - - - - - Medium
182
JPMorgan Investment Funds
Appendix - Unaudited Additional Disclosures (continued)

Performance (continued) 3 Months 6 Months 9 Months 1 Year 2 Years 3 Years 4 Years 5 Years Volatility
JPMorgan Investment Funds - Global Dividend FundJPM Global Dividend A (acc) - USD 6.44% -11.27% -10.61% -6.57% 0.46% 8.00% -5.63% - HighJPM Global Dividend A (acc) - EUR 10.14% -1.11% -2.33% -3.59% - - - - HighJPM Global Dividend A (acc) - EUR (hedged) 7.14% -7.71% -8.21% -6.67% 0.72% 6.21% -5.46% - HighJPM Global Dividend A (div) - EUR*** - - - - - - - - HighJPM Global Dividend A (inc) - USD 6.43% -11.28% -10.61% -6.48% 0.50% - - - HighJPM Global Dividend A (inc) - EUR (hedged) 7.12% -7.72% -8.22% -6.61% 0.72% - - - HighJPM Global Dividend B (dist) - EUR 10.35% - - - - - - - HighJPM Global Dividend C (acc) - EUR 10.44% -0.56% -1.52% -2.53% 7.08% - - - HighJPM Global Dividend C (div) - EUR*** - - - - - - - - HighJPM Global Dividend D (acc) - USD 6.23% -11.62% -11.11% -7.28% -0.30% 7.07% -6.21% - HighJPM Global Dividend D (acc) - EUR (hedged) 6.93% -8.06% -8.72% -7.37% -0.03% 5.34% -6.04% - HighJPM Global Dividend X (acc) - USD** 6.90% -10.49% -9.42% - - - - - High
JPMorgan Investment Funds - Global Enhanced Bond FundJPM Global Enhanced Bond A (acc) - EUR 1.78% 4.11% 6.01% 6.60% 9.40% 10.04% -0.24% -0.86% MediumJPM Global Enhanced Bond A (inc) - EUR 1.79% 4.12% 6.03% 6.61% 9.37% 9.86% -0.35% -0.93% MediumJPM Global Enhanced Bond B (acc) - EUR* - - - - - - - - MediumJPM Global Enhanced Bond C (acc) - EUR 1.90% 4.36% 6.41% 7.13% 10.00% 10.69% 0.26% -0.37% MediumJPM Global Enhanced Bond D (acc) - EUR 1.70% 3.95% 5.77% 6.29% 9.05% 9.65% -0.53% -1.15% MediumJPM Global Enhanced Bond X (acc) - EUR 2.03% 4.63% 6.82% 7.67% 10.63% 11.38% 0.78% 0.12% Medium
JPMorgan Investment Funds - Global Financials FundJPM Global Financials A (acc) - USD 5.35% -24.31% -27.29% -23.21% -10.52% 3.29% -12.94% -10.93% HighJPM Global Financials A (acc) - EUR 9.00% -15.64% -20.57% -20.77% -6.31% 6.09% -11.36% -10.79% HighJPM Global Financials A (acc) - SGD 4.76% - - - - - - - HighJPM Global Financials A (dist) - USD 5.33% -24.31% -27.30% -23.19% -10.45% 1.81% -13.29% -11.19% HighJPM Global Financials B (acc) - USD 5.54% -24.08% -26.88% -22.60% -9.87% 4.18% -12.54% - HighJPM Global Financials C (acc) - USD 5.57% -24.00% -26.85% -22.57% -9.86% 4.23% -12.53% -10.53% HighJPM Global Financials D (acc) - USD 5.09% -24.69% -27.84% -23.97% -11.30% 2.21% -13.42% -11.37% HighJPM Global Financials X (acc) - USD 5.81% -23.64% -26.32% -21.85% -9.12% 5.25% -12.08% -10.11% High
JPMorgan Investment Funds - Global High Yield Bond FundJPM Global High Yield Bond A (acc) - USD 6.08% 0.68% 0.93% 4.06% 9.33% 26.25% - - MediumJPM Global High Yield Bond A (acc) - EUR (hedged) 5.81% 0.61% 1.07% 4.26% 9.11% 25.95% 3.08% 2.74% MediumJPM Global High Yield Bond A (inc) - EUR (hedged) 5.80% 0.60% 1.06% 4.16% 8.49% 22.11% 1.13% 1.13% MediumJPM Global High Yield Bond A (mth) - USD 6.00% 0.56% 0.81% 3.91% 8.87% 24.65% - - MediumJPM Global High Yield Bond B (acc) - USD 6.18% - - - - - - - MediumJPM Global High Yield Bond B (acc) - EUR (hedged) 5.90% 0.78% 1.33% 4.62% 9.53% 26.58% 3.48% 3.14% MediumJPM Global High Yield Bond C (acc) - USD 6.26% 1.01% 1.42% 4.74% 10.11% 27.42% - - MediumJPM Global High Yield Bond C (acc) - EUR (hedged) 5.98% 0.94% 1.56% 4.93% 9.88% 27.12% 3.82% 3.50% MediumJPM Global High Yield Bond D (acc) - USD 5.98% 0.48% 0.62% 3.65% - - - - MediumJPM Global High Yield Bond D (acc) - EUR (hedged) 5.70% 0.41% 0.77% 3.84% 8.64% 25.25% 2.64% 2.29% MediumJPM Global High Yield Bond I (acc) - USD 6.38% 1.18% 1.62% 4.96% 10.27% - - - MediumJPM Global High Yield Bond I (inc) - EUR (hedged) 6.01% 0.98% 1.63% 4.88% 9.23% 25.43% - - MediumJPM Global High Yield Bond X (acc) - USD 6.40% 1.28% 1.83% - - - - - MediumJPM Global High Yield Bond X (acc) - EUR (hedged) 6.13% 1.21% 1.97% 5.48% 10.50% 28.04% 4.41% - Medium
JPMorgan Investment Funds - Global Income FundJPM Global Income A (div) - EUR 5.43% -4.13% -3.96% -1.50% 4.95% 14.09% - - MediumJPM Global Income B (div) - EUR 5.58% -3.90% - - - - - - MediumJPM Global Income C (div) - EUR 5.62% -3.79% -3.47% -1.80% - - - - MediumJPM Global Income D (div) - EUR 5.34% -4.29% -4.21% -1.84% 4.58% - - - MediumJPM Global Income T (div) - EUR 5.34% -4.26% - - - - - - MediumJPM Global Income X (div) - EUR*** - - - - - - - - Medium
JPMorgan Investment Funds - Global Select 130/30 FundJPM Global Select 130/30 A (acc) - USD 7.13% -13.36% -12.57% -9.93% -0.75% 11.06% -5.60% -2.93% HighJPM Global Select 130/30 A (acc) - EUR* - - - - - - - - HighJPM Global Select 130/30 A (dist) - USD 7.15% -13.35% -12.56% -9.89% -0.74% 10.53% -5.81% -3.11% HighJPM Global Select 130/30 C (acc) - USD 7.37% -12.96% -11.96% -9.09% 0.15% 12.23% -4.89% -2.14% HighJPM Global Select 130/30 D (acc) - USD 6.86% -13.79% -13.23% -10.82% -1.72% 9.80% -6.35% -3.76% High
JPMorgan Investment Funds - Global Select Equity FundJPM Global Select Equity A (acc) - USD 6.67% -15.29% -16.09% -12.66% -1.98% 11.72% -6.23% -3.06% HighJPM Global Select Equity A (dist) - USD 6.66% -15.29% -16.10% -12.63% -1.95% 11.44% -6.32% -3.15% HighJPM Global Select Equity B (acc) - USD 6.87% -14.97% -15.62% -12.00% -1.26% 12.73% -5.66% -2.44% HighJPM Global Select Equity C (acc) - USD 6.96% -14.82% -15.39% -11.70% -0.91% 13.24% -5.38% -2.10% HighJPM Global Select Equity C (acc) - EUR 10.67% -5.06% - - - - - - HighJPM Global Select Equity D (acc) - USD 6.47% -15.60% -16.56% -13.31% -2.69% 10.71% -6.78% -3.68% HighJPM Global Select Equity X (acc) - USD 7.14% -14.52% -14.96% -11.09% -0.24% 14.17% -4.85% -1.50% High
183
JPMorgan Investment Funds
Appendix - Unaudited Additional Disclosures (continued)
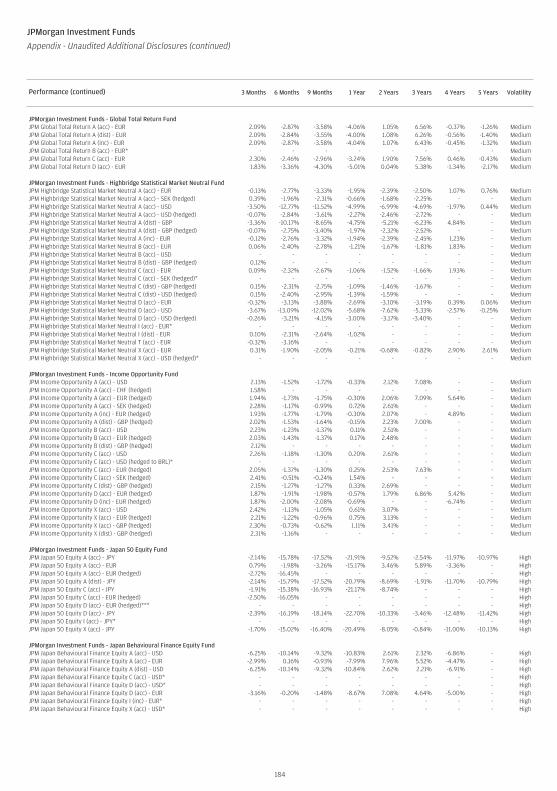
Performance (continued) 3 Months 6 Months 9 Months 1 Year 2 Years 3 Years 4 Years 5 Years Volatility
JPMorgan Investment Funds - Global Total Return FundJPM Global Total Return A (acc) - EUR 2.09% -2.87% -3.58% -4.06% 1.05% 6.56% -0.37% -1.26% MediumJPM Global Total Return A (dist) - EUR 2.09% -2.84% -3.55% -4.00% 1.08% 6.26% -0.56% -1.40% MediumJPM Global Total Return A (inc) - EUR 2.09% -2.87% -3.58% -4.04% 1.07% 6.43% -0.45% -1.32% MediumJPM Global Total Return B (acc) - EUR* - - - - - - - - MediumJPM Global Total Return C (acc) - EUR 2.30% -2.46% -2.96% -3.24% 1.90% 7.56% 0.46% -0.43% MediumJPM Global Total Return D (acc) - EUR 1.83% -3.36% -4.30% -5.01% 0.04% 5.38% -1.34% -2.17% Medium
JPMorgan Investment Funds - Highbridge Statistical Market Neutral FundJPM Highbridge Statistical Market Neutral A (acc) - EUR -0.13% -2.77% -3.33% -1.95% -2.39% -2.50% 1.07% 0.76% MediumJPM Highbridge Statistical Market Neutral A (acc) - SEK (hedged) 0.39% -1.96% -2.31% -0.66% -1.68% -2.25% - - MediumJPM Highbridge Statistical Market Neutral A (acc) - USD -3.50% -12.77% -11.52% -4.99% -6.99% -4.69% -1.97% 0.44% MediumJPM Highbridge Statistical Market Neutral A (acc) - USD (hedged) -0.07% -2.84% -3.61% -2.27% -2.46% -2.72% - - MediumJPM Highbridge Statistical Market Neutral A (dist) - GBP -3.36% -10.17% -8.65% -4.75% -5.21% -6.23% 4.84% - MediumJPM Highbridge Statistical Market Neutral A (dist) - GBP (hedged) -0.07% -2.75% -3.40% -1.97% -2.32% -2.52% - - MediumJPM Highbridge Statistical Market Neutral A (inc) - EUR -0.12% -2.76% -3.32% -1.94% -2.39% -2.45% 1.23% - MediumJPM Highbridge Statistical Market Neutral B (acc) - EUR 0.06% -2.40% -2.78% -1.21% -1.67% -1.81% 1.83% - MediumJPM Highbridge Statistical Market Neutral B (acc) - USD - - - - - - - - MediumJPM Highbridge Statistical Market Neutral B (dist) - GBP (hedged) 0.12% - - - - - - - MediumJPM Highbridge Statistical Market Neutral C (acc) - EUR 0.09% -2.32% -2.67% -1.06% -1.52% -1.66% 1.93% - MediumJPM Highbridge Statistical Market Neutral C (acc) - SEK (hedged)* - - - - - - - - MediumJPM Highbridge Statistical Market Neutral C (dist) - GBP (hedged) 0.15% -2.31% -2.75% -1.09% -1.46% -1.67% - - MediumJPM Highbridge Statistical Market Neutral C (dist) - USD (hedged) 0.15% -2.40% -2.95% -1.39% -1.59% - - - MediumJPM Highbridge Statistical Market Neutral D (acc) - EUR -0.32% -3.13% -3.88% -2.69% -3.10% -3.19% 0.39% 0.06% MediumJPM Highbridge Statistical Market Neutral D (acc) - USD -3.67% -13.09% -12.02% -5.68% -7.62% -5.33% -2.57% -0.25% MediumJPM Highbridge Statistical Market Neutral D (acc) - USD (hedged) -0.26% -3.21% -4.15% -3.00% -3.17% -3.40% - - MediumJPM Highbridge Statistical Market Neutral I (acc) - EUR* - - - - - - - - MediumJPM Highbridge Statistical Market Neutral I (dist) - EUR 0.10% -2.31% -2.64% -1.02% - - - - MediumJPM Highbridge Statistical Market Neutral T (acc) - EUR -0.32% -3.16% - - - - - - MediumJPM Highbridge Statistical Market Neutral X (acc) - EUR 0.31% -1.90% -2.05% -0.21% -0.68% -0.82% 2.90% 2.61% MediumJPM Highbridge Statistical Market Neutral X (acc) - USD (hedged)* - - - - - - - - Medium
JPMorgan Investment Funds - Income Opportunity FundJPM Income Opportunity A (acc) - USD 2.13% -1.52% -1.72% -0.33% 2.12% 7.08% - - MediumJPM Income Opportunity A (acc) - CHF (hedged) 1.58% - - - - - - - MediumJPM Income Opportunity A (acc) - EUR (hedged) 1.94% -1.73% -1.75% -0.30% 2.06% 7.09% 5.64% - MediumJPM Income Opportunity A (acc) - SEK (hedged) 2.28% -1.17% -0.99% 0.72% 2.61% - - - MediumJPM Income Opportunity A (inc) - EUR (hedged) 1.93% -1.77% -1.79% -0.30% 2.07% - 4.89% - MediumJPM Income Opportunity A (dist) - GBP (hedged) 2.02% -1.53% -1.64% -0.15% 2.23% 7.00% - - MediumJPM Income Opportunity B (acc) - USD 2.23% -1.23% -1.37% 0.11% 2.51% - - - MediumJPM Income Opportunity B (acc) - EUR (hedged) 2.03% -1.43% -1.37% 0.17% 2.48% - - - MediumJPM Income Opportunity B (dist) - GBP (hedged) 2.12% - - - - - - - MediumJPM Income Opportunity C (acc) - USD 2.26% -1.18% -1.30% 0.20% 2.61% - - - MediumJPM Income Opportunity C (acc) - USD (hedged to BRL)* - - - - - - - - MediumJPM Income Opportunity C (acc) - EUR (hedged) 2.05% -1.37% -1.30% 0.25% 2.53% 7.63% - - MediumJPM Income Opportunity C (acc) - SEK (hedged) 2.41% -0.51% -0.24% 1.54% - - - - MediumJPM Income Opportunity C (dist) - GBP (hedged) 2.15% -1.27% -1.27% 0.33% 2.69% - - - MediumJPM Income Opportunity D (acc) - EUR (hedged) 1.87% -1.91% -1.98% -0.57% 1.79% 6.86% 5.42% - MediumJPM Income Opportunity D (inc) - EUR (hedged) 1.87% -2.00% -2.08% -0.69% - - -6.74% - MediumJPM Income Opportunity X (acc) - USD 2.42% -1.13% -1.05% 0.61% 3.07% - - - MediumJPM Income Opportunity X (acc) - EUR (hedged) 2.21% -1.22% -0.96% 0.75% 3.13% - - - MediumJPM Income Opportunity X (acc) - GBP (hedged) 2.30% -0.73% -0.62% 1.11% 3.41% - - - MediumJPM Income Opportunity X (dist) - GBP (hedged) 2.31% -1.16% - - - - - - Medium
JPMorgan Investment Funds - Japan 50 Equity FundJPM Japan 50 Equity A (acc) - JPY -2.14% -15.78% -17.52% -21.91% -9.52% -2.54% -11.97% -10.97% HighJPM Japan 50 Equity A (acc) - EUR 0.79% -1.98% -3.26% -15.17% 3.46% 5.89% -3.36% - HighJPM Japan 50 Equity A (acc) - EUR (hedged) -2.72% -16.45% - - - - - - HighJPM Japan 50 Equity A (dist) - JPY -2.14% -15.79% -17.52% -20.79% -8.69% -1.91% -11.70% -10.79% HighJPM Japan 50 Equity C (acc) - JPY -1.91% -15.38% -16.93% -21.17% -8.74% - - - HighJPM Japan 50 Equity C (acc) - EUR (hedged) -2.50% -16.05% - - - - - - HighJPM Japan 50 Equity D (acc) - EUR (hedged)*** - - - - - - - - HighJPM Japan 50 Equity D (acc) - JPY -2.39% -16.19% -18.14% -22.70% -10.33% -3.46% -12.48% -11.42% HighJPM Japan 50 Equity I (acc) - JPY* - - - - - - - - HighJPM Japan 50 Equity X (acc) - JPY -1.70% -15.02% -16.40% -20.49% -8.05% -0.84% -11.00% -10.13% High
JPMorgan Investment Funds - Japan Behavioural Finance Equity FundJPM Japan Behavioural Finance Equity A (acc) - USD -6.25% -10.14% -9.32% -10.83% 2.61% 2.32% -6.86% - HighJPM Japan Behavioural Finance Equity A (acc) - EUR -2.99% 0.16% -0.93% -7.99% 7.96% 5.52% -4.47% - HighJPM Japan Behavioural Finance Equity A (dist) - USD -6.25% -10.14% -9.32% -10.84% 2.62% 2.21% -6.91% - HighJPM Japan Behavioural Finance Equity C (acc) - USD* - - - - - - - - HighJPM Japan Behavioural Finance Equity D (acc) - USD* - - - - - - - - HighJPM Japan Behavioural Finance Equity D (acc) - EUR -3.16% -0.20% -1.48% -8.67% 7.08% 4.64% -5.00% - HighJPM Japan Behavioural Finance Equity I (inc) - EUR* - - - - - - - - HighJPM Japan Behavioural Finance Equity X (acc) - USD* - - - - - - - - High
184
JPMorgan Investment Funds
Appendix - Unaudited Additional Disclosures (continued)

Performance (continued) 3 Months 6 Months 9 Months 1 Year 2 Years 3 Years 4 Years 5 Years Volatility
JPMorgan Investment Funds - Japan Focus FundJPM Japan Focus A (acc) - JPY -3.48% -15.79% -18.43% -18.46% -5.66% -0.04% - - HighJPM Japan Focus A (dist) - JPY -3.47% -15.96% -18.58% -18.46% -5.78% - - - HighJPM Japan Focus B (acc) - JPY -3.30% -15.77% - - - - - - HighJPM Japan Focus C (acc) - JPY -3.24% -15.56% -18.02% - - - - - HighJPM Japan Focus D (acc) - JPY -3.72% -16.43% -19.24% -19.38% -6.54% -1.02% - - HighJPM Japan Focus I (acc) - JPY -3.22% -15.41% -17.86% -17.64% -4.68% 1.04% - - HighJPM Japan Focus X (acc) - JPY -3.03% -15.15% -17.45% -17.07% -4.34% 16.49% - - High
JPMorgan Investment Funds - Japan Select Equity FundJPM Japan Select Equity A (acc) - JPY -2.13% -14.76% -16.91% -21.28% -10.53% -4.28% -12.82% -11.59% HighJPM Japan Select Equity A (dist) - JPY -2.11% -14.76% -16.90% -20.95% -10.27% -4.10% -12.74% -11.54% HighJPM Japan Select Equity B (acc) - JPY -1.96% -14.45% -16.46% -20.78% -9.98% -3.66% -12.46% -11.29% HighJPM Japan Select Equity C (acc) - JPY -1.90% -14.36% -16.32% -20.54% -9.78% -3.45% -12.34% -11.17% HighJPM Japan Select Equity D (acc) - JPY -2.31% -15.08% -17.39% -21.87% -11.12% -4.94% -13.18% -11.90% HighJPM Japan Select Equity I (acc) - JPY -1.87% -14.31% -16.25% -20.43% -9.68% -3.36% -12.29% -11.14% HighJPM Japan Select Equity X (acc) - JPY -1.68% -13.98% -15.77% -19.83% -9.07% -2.67% -11.91% -10.80% High
JPMorgan Investment Funds - Japan Strategic Value FundJPM Japan Strategic Value A (acc) - JPY -5.83% -12.59% -13.48% -13.78% -4.80% -0.40% -10.00% - HighJPM Japan Strategic Value A (acc) - EUR -3.04% 1.73% 1.46% -6.35% 9.68% 8.61% -0.09% - HighJPM Japan Strategic Value A (dist) - GBP -6.18% -6.03% -4.13% -9.07% 5.52% 2.47% 3.15% - HighJPM Japan Strategic Value C (acc) - JPY -5.61% -12.18% -12.86% -12.95% -3.94% - - - HighJPM Japan Strategic Value D (acc) - JPY -6.01% -12.93% -13.97% -14.42% -5.48% -1.14% -10.44% - HighJPM Japan Strategic Value D (acc) - EUR -3.22% 1.35% 0.89% -7.05% 8.79% 7.68% -0.82% - HighJPM Japan Strategic Value X (acc) - JPY -5.42% -11.83% -12.34% -12.26% -3.20% - - - High
JPMorgan Investment Funds - JF Asia ex-Japan FundJF Asia ex-Japan A (acc) - USD 4.04% -23.22% -24.24% -24.57% -4.65% 17.75% -8.14% -0.36% HighJF Asia ex-Japan A (dist) - USD 4.04% -23.22% -24.24% -24.58% -4.65% 16.24% -8.58% -0.86% HighJF Asia ex-Japan B (acc) - USD 4.24% -22.93% -23.81% -24.01% -3.97% 18.90% -7.62% 0.36% HighJF Asia ex-Japan C (acc) - USD 4.27% -22.87% -23.72% -23.89% -3.83% 19.14% -7.52% 0.54% HighJF Asia ex-Japan C (dist) - USD 4.27% - - - - - - - HighJF Asia ex-Japan D (acc) - USD 3.85% -23.50% -24.66% -25.14% -5.32% 16.61% -8.64% -1.07% HighJF Asia ex-Japan I (acc) - USD 4.32% -22.80% -23.63% -23.78% -3.70% 19.33% -7.44% 0.64% HighJF Asia ex-Japan X (acc) - USD 4.51% -22.52% -23.21% -23.21% -3.01% 20.51% -6.92% 1.42% HighJF Asia ex-Japan X (dist) - USD 4.48% -22.56% - - - - - - High
JPMorgan Investment Funds - US Bond FundJPM US Bond A (acc) - USD 1.77% 4.62% 6.68% 7.99% 9.58% 14.83% 3.98% 2.26% MediumJPM US Bond A (inc) - USD 1.77% 4.62% 6.68% 7.99% 9.58% 14.83% 3.85% 2.11% MediumJPM US Bond B (acc) - USD 1.86% 4.80% 6.95% 8.37% 9.99% 15.33% 4.38% 2.64% MediumJPM US Bond C (acc) - USD 1.90% 4.88% 7.08% 8.53% 10.18% 15.55% 4.57% 2.83% MediumJPM US Bond D (acc) - USD 1.70% 4.49% 6.47% 7.72% 9.28% 14.47% 3.69% 1.98% MediumJPM US Bond X (acc) - USD* - - - - - - - - Medium
JPMorgan Investment Funds - US Equity FundJPM US Equity A (acc) - USD 10.23% -6.89% -6.49% 0.40% 5.33% 13.92% -3.23% -2.18% HighJPM US Equity A (acc) - EUR (hedged) 9.92% -7.01% -6.44% 0.35% 4.76% 12.80% -3.89% -2.94% HighJPM US Equity A (dist) - GBP 10.37% -4.14% -3.47% 0.63% 7.59% - - - HighJPM US Equity C (acc) - USD 10.53% -6.40% -5.75% 1.47% 6.50% 15.43% -2.29% - HighJPM US Equity D (acc) - USD 10.10% -7.12% -6.83% -0.09% 4.79% 13.22% -3.66% -2.62% HighJPM US Equity D (acc) - EUR (hedged) 9.78% -7.25% -6.80% -0.14% 4.21% 12.12% -4.32% -3.37% HighJPM US Equity X (acc) - USD 10.71% -6.08% -5.26% 2.17% 7.29% 16.47% -1.65% - High
JPMorgan Investment Funds - US Select Equity FundJPM US Select Equity A (acc) - USD 10.07% -6.13% -7.25% -3.01% 3.75% 14.43% -2.57% -0.34% HighJPM US Select Equity A (acc) - EUR 13.90% 4.63% 1.33% 0.08% 9.49% 18.08% - - HighJPM US Select Equity A (acc) - EUR (hedged) 9.80% -6.16% -7.04% -2.79% 3.37% 13.35% -3.24% - HighJPM US Select Equity A (dist) - USD 10.07% -6.13% -7.24% -3.01% 3.75% 14.42% -2.57% -0.34% HighJPM US Select Equity B (acc) - USD 10.28% -5.77% -6.73% -2.28% 4.56% 15.51% -1.89% 0.40% HighJPM US Select Equity C (acc) - USD 10.35% -5.64% -6.52% -1.99% 4.89% 15.95% -1.61% 0.76% HighJPM US Select Equity C (acc) - EUR 14.19% - - - - - - - HighJPM US Select Equity C (acc) - EUR (hedged) 10.10% -5.65% -6.29% -1.75% 4.51% 14.85% - - HighJPM US Select Equity C (dist) - GBP 10.51% - - - - - - - HighJPM US Select Equity D (acc) - USD 9.93% -6.37% -7.60% -3.49% 3.22% 13.71% -3.02% -0.82% HighJPM US Select Equity D (acc) - EUR (hedged) 9.68% -6.38% -7.38% -3.26% 2.85% 12.65% -3.67% - HighJPM US Select Equity I (acc) - USD 10.43% -5.54% -6.39% -1.82% 5.05% 16.13% -1.51% - HighJPM US Select Equity X (acc) - USD 10.57% -5.25% -5.95% -1.21% 5.75% 17.09% -0.90% 1.51% High
* Share Class inactive as at end of the year.** Share Class reactivated during the year.*** No data is applicable for these Share Classes because they were launched or reactivated less than 3 months before the year end.
185
JPMorgan Investment Funds
Appendix - Unaudited Additional Disclosures (continued)

4. Interest Rate Received/(Charged) on Bank Accounts
Basis for Bank Interest Rates
The rates are based on the JPMorgan Chase Treasury rates and consequently may change on a daily basis. The bank interest amount is posted to each of theFund’s bank accounts on a monthly basis on the first business day of the subsequent month based on the bank balances from the prior month.
5. Sub-Fund Share Classes Subject to Taxe d’Abonnement Rate of 0.01%
The following Sub-Fund share classes have been subject to an asset based tax of 0.01% per annum:
Share Class NameJPM Blue and GreenJPM Euro Liquid Market A (acc) - EURJPM Europe Bond X (acc) - EURJPM Europe Recovery X (acc) - EURJPM Europe Select Equity I (acc) - EURJPM Europe Select Equity X (acc) - EURJPM Europe Select Equity X (acc) - EUR (hedged)JPM Europe Strategic Dividend I (acc) - EURJPM Europe Strategic Dividend X (acc) - EURJPM Global Balanced (USD) X (acc) - USDJPM Global Bond (EUR) X (acc) - EURJPM Global Bond (USD) X (acc) - USDJPM Global Capital Appreciation X (acc) - EURJPM Global Capital Preservation (EUR) I (acc) - EURJPM Global Capital Preservation (EUR) I (inc) - EURJPM Global Capital Preservation (EUR) X (acc) - EURJPM Global Convertibles (USD) I (acc) - USDJPM Global Dividend X (acc) - USDJPM Global Enhanced Bond X (acc) - EURJPM Global Financial X (acc) - USDJPM Global Income X (div) - EURJPM Global High Yield Bond I (acc) - USDJPM Global High Yield Bond I (inc) - EUR (hedged)JPM Global High Yield Bond X (acc) - EUR (hedged)JPM Global High Yield Bond X (acc) - USDJPM Global Select Equity X (acc) - USDJPM Highbridge Statistical Market Neutral I (dist) - EURJPM Highbridge Statistical Market Neutral X (acc) - EURJPM Income Opportunity X (acc) - EUR (hedged)JPM Income Opportunity X (acc) - GBP (hedged)JPM Income Opportunity X (acc) - USDJPM Income Opportunity X (dist) - GBP (hedged)JPM Japan 50 Equity X (acc) - JPYJPM Japan Behavioural Finance Equity X (acc) - USDJPM Japan Focus I (acc) - JPYJPM Japan Focus X (acc) - JPYJPM Japan Select Equity I (acc) - JPYJPM Japan Select Equity X (acc) - JPYJPM Japan Strategic Value X (acc) - JPYJF Asia ex-Japan I (acc) - USDJF Asia ex-Japan X (acc) - USDJF Asia ex-Japan X (dist) - USDJPM US Equity X (acc) - USDJPM US Select Equity I (acc) - USDJPM US Select Equity X (acc) - USD
6. Sub-Fund Share Classes Exempt from Taxe d’AbonnementThe following Sub-Fund share classes have been exempt from an asset based tax:JPM Euro Liquid Market C (acc) - EURJPM Euro Liquid Market D (acc) - EUR
186
JPMorgan Investment Funds
Appendix - Unaudited Additional Disclosures (continued)

JPMorgan Investment Funds
Appendix - Unaudited Additional Disclosures (continued)
7. Portfolio Turnover Ratio
The Portfolio Turnover Ratio is an indicator of the relevance of the additional costs incurred by a fund when buying and selling investments according to itsinvestment policy. The portfolio turnover rate is calculated in accordance with the guidelines dated 16 May 2008 issued by the Swiss Fund Association asoutlined below:
(Total securities’ purchases and sales - total subscriptions and redemptions of Sub-Fund shares)
Average net Sub-Fund assets in Sub-Fund currency
The Portfolio Turnover Ratio is expressed as a percentage and in the case the outcome of the calculation is negative, a zero value has been published.
Sub-Fund Portfolio Turnover Ratio
JPMorgan Investment Funds - Blue and Green Fund 293.40
JPMorgan Investment Funds - Emerging Markets Corporate Bond Portfolio Fund I 33.08
JPMorgan Investment Funds - Euro Liquid Market Fund 0.00*
JPMorgan Investment Funds - Europe Bond Fund 68.25
JPMorgan Investment Funds - Europe Recovery Fund 1584.53
JPMorgan Investment Funds - Europe Select Equity Fund 205.26
JPMorgan Investment Funds - Europe Strategic Dividend Fund 0.00
JPMorgan Investment Funds - Global Balanced Fund (EUR) 43.34
JPMorgan Investment Funds - Global Balanced Fund (USD) 14.35
JPMorgan Investment Funds - Global Bond Fund (EUR) 113.04
JPMorgan Investment Funds - Global Bond Fund (USD) 128.48
JPMorgan Investment Funds - Global Capital Appreciation Fund 121.34
JPMorgan Investment Funds - Global Capital Preservation Fund (EUR) 206.88
JPMorgan Investment Funds - Global Capital Preservation Fund (USD) 140.08
JPMorgan Investment Funds - Global Convertibles Fund (USD) 88.91
JPMorgan Investment Funds - Global Dividend Fund 71.38
JPMorgan Investment Funds - Global Enhanced Bond Fund 125.29
JPMorgan Investment Funds - Global Financials Fund 24.44
JPMorgan Investment Funds - Global High Yield Bond Fund 0.00
JPMorgan Investment Funds - Global Income Fund 122.16
JPMorgan Investment Funds - Global Select 130/30 Fund 153.06
JPMorgan Investment Funds - Global Select Equity Fund 98.17
JPMorgan Investment Funds - Global Total Return Fund 98.59
JPMorgan Investment Funds - Highbridge Statistical Market Neutral Fund 0.00
JPMorgan Investment Funds - Income Opportunity Fund 0.00
JPMorgan Investment Funds - Japan 50 Equity Fund 61.29
JPMorgan Investment Funds - Japan Behavioural Finance Equity Fund 118.50
JPMorgan Investment Funds - Japan Focus Fund 65.24
JPMorgan Investment Funds - Japan Select Equity Fund 67.27
JPMorgan Investment Funds - Japan Strategic Value Fund 124.08
JPMorgan Investment Funds - JF Asia ex-Japan Fund 152.86
JPMorgan Investment Funds - US Bond Fund 5.42
JPMorgan Investment Funds - US Equity Fund 82.78
JPMorgan Investment Funds - US Select Equity Fund 67.81
* Due to the fact underlying investments have short term maturity and that they are replaced only at maturity, no portfolio turnover statistics are calculated for the Fund.
187

8. Calculation method of the risk exposure
Global exposure using the VaR approach
Sub-Fund NameMarketRisk Limit
Maximumusage ofreg limit*
Minimumusage ofreg limit*
Averageusage of
reg limit* Reference portfolio ModelConfidence
IntervalHolding
period
Effectiveobservation
period Leverage**
JPMorgan Investment Funds -Blue and Green Fund Absolute 20% 46.64% 3.44% 12.62% n/a
MonteCarloSimulation
99% 20 days 250 days 250%
JPMorgan Investment Funds -Europe Bond Fund Relative 200% 54.91% 42.86% 49.44%
J.P. Morgan EMU Government BondInvestment Grade Index, in EUR(Total Return Gross)
MonteCarloSimulation
99% 20 days 250 days 31%
JPMorgan Investment Funds -Global Bond Fund (EUR) Relative 200% 62.55% 44.41% 52.51%
J.P. Morgan Global GovernmentBond Index, hedged into EUR (TotalReturn Gross)
MonteCarloSimulation
99% 20 days 250 days 36%
JPMorgan Investment Funds -Global Bond Fund (USD) Relative 200% 72.93% 46.42% 56.71%
Citigroup World Government BondIndex, hedged into USD (TotalReturn Gross)
MonteCarloSimulation
99% 20 days 250 days 32%
JPMorgan Investment Funds -Global Capital Appreciation Fund Absolute 20% 43.41% 12.29% 22.76% n/a
MonteCarloSimulation
99% 20 days 250 days 251%
JPMorgan Investment Funds -Global Capital Preservation Fund(EUR)
Absolute 20% 34.66% 3.54% 12.77% n/aMonteCarloSimulation
99% 20 days 250 days 245%
JPMorgan Investment Funds -Global Capital Preservation Fund(USD)
Absolute 20% 33.14% 3.24% 12.48% n/aMonteCarloSimulation
99% 20 days 250 days 265%
JPMorgan Investment Funds -Global Enhanced Bond Fund Relative 200% 64.34% 35.71% 55.16%
Barclays Capital Global Aggregateexcluding Treasuries Index, hedgedinto EUR (Total Return Gross)
MonteCarloSimulation
99% 20 days 250 days 35%
JPMorgan Investment Funds -Global High Yield Bond Fund Relative 200% 62.20% 39.34% 52.49%
BofA Merrill Lynch US High YieldMaster II Constrained Index (TotalReturn Gross)
MonteCarloSimulation
99% 20 days 250 days 5%
JPMorgan Investment Funds -Global Income Fund Relative 200% 67.05% 45.90% 56.76%
16.6% JPMorgan Government Bondindex hedged into EUR; 51.6% BofAMerrill Lynch High Yield BB Indexhedged into EUR; 31.6% MorganStanley Capital International (MSCI)World Index hedged into EUR.
MonteCarloSimulation
99% 20 days 250 days 5%
JPMorgan Investment Funds -Global Select 130/30 Fund Relative 200% 58.86% 50.44% 53.81%
Morgan Stanley CapitalInternational (MSCI) World IndexUSD (Total Return Net)
MonteCarloSimulation
99% 20 days 250 days 45%
JPMorgan Investment Funds -Highbridge Statistical MarketNeutral Fund
Absolute 20% 11.84% 4.43% 7.15% n/aHistoricalmethod 99% 20 days 250 days 200%
JPMorgan Investment Funds -Income Opportunity Fund Absolute 20% 16.17% 2.20% 6.80% n/a
MonteCarloSimulation
99% 20 days 250 days 267%
JPMorgan Investment Funds -US Bond Fund Relative 200% 60.34% 29.67% 52.14%
Barclays Capital US Aggregate BondIndex, in USD (Total Return Gross)
MonteCarloSimulation
99% 20 days 250 days 30%
*over the last 12 months versus regulatory limit** Leverage is calculated using the commitment conversion methodology for the month of December.
Global exposure using the commitment approach
JPMorgan Investment Funds - Emerging Markets Corporate Bond Portfolio Fund IJPMorgan Investment Funds - Europe Recovery FundJPMorgan Investment Funds - Europe Select Equity FundJPMorgan Investment Funds - Europe Strategic Dividend FundJPMorgan Investment Funds - Global Balanced Fund (EUR)JPMorgan Investment Funds - Global Balanced Fund (USD)JPMorgan Investment Funds - Global Convertibles Fund (USD)JPMorgan Investment Funds - Global Dividend FundJPMorgan Investment Funds - Global Financials FundJPMorgan Investment Funds - Global Select Equity FundJPMorgan Investment Funds - Global Total Return FundJPMorgan Investment Funds - Japan 50 Equity FundJPMorgan Investment Funds - Japan Behavioural Finance Equity FundJPMorgan Investment Funds - Japan Focus FundJPMorgan Investment Funds - Japan Select Equity FundJPMorgan Investment Funds - Japan Strategic Value FundJPMorgan Investment Funds - JF Asia ex-Japan FundJPMorgan Investment Funds - US Equity FundJPMorgan Investment Funds - US Select Equity Fund
Funds not making use of financial derivative instruments
JPMorgan Investment Funds - Euro Liquid Market Fund
188
JPMorgan Investment Funds
Appendix - Unaudited Additional Disclosures (continued)

JPMorgan Investment Funds
Appendix - Unaudited Additional Disclosures (continued)
Shares Outstandingat the Beginning
of the Year
Shares Subscribed Shares Redeemed Shares Outstandingat the End
of the Year
9. Historical Statement of Changes in the Number of Shares - for the year ended 31 December 2010 (continued)JPMorgan Investment Funds - Blue and Green FundJPM Blue and Green 3,449.615 - - 3,449.615
JPMorgan Investment Funds - Emerging Markets Corporate Bond Portfolio Fund I (1)JPM Emerging Markets Corporate Bond Portfolio I - A (div) - USD - 97,296.841 500.000 96,796.841JPM Emerging Markets Corporate Bond Portfolio I - A (div) - EUR (hedged) - 206,335.742 2,006.076 204,329.666JPM Emerging Markets Corporate Bond Portfolio I - B (div) - USD - 25,003.001 - 25,003.001JPM Emerging Markets Corporate Bond Portfolio I - B (div) - EUR (hedged) - 24,518.818 - 24,518.818JPM Emerging Markets Corporate Bond Portfolio I - C (div) - USD - 136,700.000 - 136,700.000JPM Emerging Markets Corporate Bond Portfolio I - D (div) - USD - 57,128.940 3,512.975 53,615.965JPM Emerging Markets Corporate Bond Portfolio I - D (div) - EUR (hedged) - 455,372.255 4,931.390 450,440.865
JPMorgan Investment Funds - Euro Liquid Market FundJPM Euro Liquid Market A (acc) - EUR 149,671.651 57,458.903 140,356.319 66,774.235JPM Euro Liquid Market C (acc) - EUR 325,510.990 305,779.926 575,712.386 55,578.530JPM Euro Liquid Market D (acc) - EUR 146,033.808 130,229.764 197,619.026 78,644.546
JPMorgan Investment Funds - Europe Bond FundJPM Europe Bond A (acc) - EUR 331,426.264 278,114.370 427,760.353 181,780.281JPM Europe Bond A (inc) - EUR 84,833.393 2,148.105 24,951.215 62,030.283JPM Europe Bond B (acc) - EUR 1,717.396 18,725.703 19,209.025 1,234.074JPM Europe Bond C (acc) - EUR 82,887.016 60,580.268 140,439.958 3,027.326JPM Europe Bond D (acc) - EUR 47,271.496 48,401.823 48,769.090 46,904.229JPM Europe Bond X (acc) - EUR 299.985 - 159.267 140.718
JPMorgan Investment Funds - Europe Recovery FundJPM Europe Recovery A (acc) - EUR 901,054.841 175,053.680 243,404.131 832,704.390JPM Europe Recovery A (dist) - EUR 262,526.879 50,551.663 54,862.837 258,215.705JPM Europe Recovery B (acc) - EUR 3,642.463 984.411 3,642.464 984.410JPM Europe Recovery C (acc) - EUR 122,874.958 55,527.226 90,990.995 87,411.189JPM Europe Recovery D (acc) - EUR 23,957.363 6,586.577 13,425.073 17,118.867JPM Europe Recovery X (acc) - EUR 142,702.264 86,268.000 12,886.000 216,084.264
JPMorgan Investment Funds - Europe Select Equity FundJPM Europe Select Equity A (acc) - EUR 81,906.853 17,796.828 63,866.118 35,837.563JPM Europe Select Equity A (acc) - USD 167.709 3,246.308 467.508 2,946.509JPM Europe Select Equity A (dist) - EUR 213.427 8,331.265 6,690.413 1,854.279JPM Europe Select Equity B (acc) - EUR 145,058.058 69,681.076 166,150.898 48,588.236JPM Europe Select Equity C (acc) - EUR 881,404.287 547,041.232 694,454.700 733,990.819JPM Europe Select Equity D (acc) - EUR 83,682.839 39,820.364 54,894.654 68,608.549JPM Europe Select Equity D (acc) - USD 34.860 2,064.836 2,064.836 34.860JPM Europe Select Equity I (acc) - EUR - 493,728.349 163,600.001 330,128.348JPM Europe Select Equity X (acc) - EUR 320,005.082 91,306.846 25,111.648 386,200.280JPM Europe Select Equity X (acc) - EUR (hedged) 844,138.363 67,683.688 252,284.453 659,537.598
JPMorgan Investment Funds - Europe Strategic Dividend FundJPM Europe Strategic Dividend A (acc) - EUR 1,130,477.610 3,089,108.649 1,983,757.332 2,235,828.927JPM Europe Strategic Dividend A (dist) - EUR 26,925.104 44,272.739 21,784.060 49,413.783JPM Europe Strategic Dividend A (inc) - EUR 14,127.651 67,081.265 5,359.651 75,849.265JPM Europe Strategic Dividend B (acc) - EUR - 52,700.000 - 52,700.000JPM Europe Strategic Dividend C (acc) - EUR 1,109,029.715 799,923.400 1,087,888.722 821,064.393JPM Europe Strategic Dividend D (acc) - EUR 285,026.346 310,810.020 444,041.287 151,795.079JPM Europe Strategic Dividend X (acc) - EUR 2,080.138 420,763.883 420,763.884 2,080.137
JPMorgan Investment Funds - Global Balanced Fund (EUR)JPM Global Balanced (EUR) A (acc) - EUR 78,707.381 54,929.034 55,110.245 78,526.170JPM Global Balanced (EUR) A (dist) - EUR 173.187 40.000 31.000 182.187JPM Global Balanced (EUR) B (acc) - EUR 9,154.924 1,800.823 6,389.928 4,565.819JPM Global Balanced (EUR) C (acc) - EUR 26,777.906 20,099.086 43,552.566 3,324.426JPM Global Balanced (EUR) D (acc) - EUR 201,500.292 184,727.371 68,162.350 318,065.313
JPMorgan Investment Funds - Global Balanced Fund (USD)JF Global Balanced (USD) A (acc) - USD 129,627.307 18,072.557 95,285.410 52,414.454JPM Global Balanced (USD) A (acc) - USD 1,027,862.423 474,610.137 670,738.010 831,734.550JPM Global Balanced (USD) A (dist) - USD 50.000 324.027 - 374.027JPM Global Balanced (USD) B (acc) - USD 461,454.525 3,545.441 392,007.596 72,992.370JPM Global Balanced (USD) C (acc) - USD 403,204.181 22,977.221 271,247.096 154,934.306JPM Global Balanced (USD) D (acc) - USD 175,506.970 92,902.702 65,007.908 203,401.764JPM Global Balanced (USD) X (acc) - USD 736,606.116 - 390,010.804 346,595.312
JPMorgan Investment Funds - Global Bond Fund (EUR)JPM Global Bond (EUR) A (acc) - EUR 392,179.802 182,682.791 264,535.257 310,327.336JPM Global Bond (EUR) A (inc) - EUR 32,747.000 4,601.913 12,064.000 25,284.913JPM Global Bond (EUR) B (acc) - EUR 14,699.981 1,519.746 3,793.107 12,426.620JPM Global Bond (EUR) C (acc) - EUR 117,629.314 19,360.981 19,667.879 117,322.416JPM Global Bond (EUR) D (acc) - EUR 43,219.999 85,234.530 74,329.282 54,125.247JPM Global Bond (EUR) X (acc) - EUR 1,241.025 - 140.717 1,100.308
(1) This Sub-Fund was launched on 31 May 2010.
189

JPMorgan Investment Funds
Appendix - Unaudited Additional Disclosures (continued)
Shares Outstandingat the Beginning
of the Year
Shares Subscribed Shares Redeemed Shares Outstandingat the End
of the Year
9. Historical Statement of Changes in the Number of Shares - for the year ended 31 December 2010 (continued)JPMorgan Investment Funds - Global Bond Fund (USD)JF Global Bond (USD) A (acc) - USD 2,646.809 6,499.904 5,926.065 3,220.648JPM Global Bond (USD) A (acc) - USD 212,186.758 83,350.587 122,330.009 173,207.336JPM Global Bond (USD) C (acc) - USD 3,458.674 71.587 - 3,530.261JPM Global Bond (USD) D (acc) - USD 48,516.740 40,839.525 39,426.935 49,929.330JPM Global Bond (USD) X (acc) - USD 236,378.854 - - 236,378.854
JPMorgan Investment Funds - Global Capital Appreciation FundJPM Global Capital Appreciation A (acc) - EUR 248,788.129 333,233.395 376,476.720 205,544.804JPM Global Capital Appreciation A (dist) - EUR 1,326.278 95.904 6.007 1,416.175JPM Global Capital Appreciation A (inc) - EUR 7,090.965 129.856 597.046 6,623.775JPM Global Capital Appreciation B (acc) - EUR 8,150.331 5,637.999 12,470.982 1,317.348JPM Global Capital Appreciation C (acc) - EUR 80,776.490 339,107.807 281,969.351 137,914.946JPM Global Capital Appreciation D (acc) - EUR 472,503.724 148,784.052 249,106.932 372,180.844JPM Global Capital Appreciation X (acc) - EUR 261,184.709 - - 261,184.709
JPMorgan Investment Funds - Global Capital Preservation Fund (EUR)JPM Global Capital Preservation (EUR) A (acc) - EUR 753,788.748 536,037.995 622,026.619 667,800.124JPM Global Capital Preservation (EUR) A (acc) - USD 51,748.678 18,717.312 30,701.401 39,764.589JPM Global Capital Preservation (EUR) A (dist) - EUR 363,155.336 530,682.941 423,869.979 469,968.298JPM Global Capital Preservation (EUR) A (inc) - EUR 93,690.115 2,153.911 21,900.000 73,944.026JPM Global Capital Preservation (EUR) B (acc) - EUR 29,308.795 19,618.416 25,111.453 23,815.758JPM Global Capital Preservation (EUR) C (acc) - EUR 191,341.288 135,191.442 224,730.357 101,802.373JPM Global Capital Preservation (EUR) D (acc) - EUR 5,833,712.517 1,213,857.028 2,508,434.257 4,539,135.288JPM Global Capital Preservation (EUR) D (acc) - SEK (hedged) 629,273.012 433,342.262 499,218.267 563,397.007JPM Global Capital Preservation (EUR) I (acc) - EUR 342,485.692 283,736.000 434,006.000 192,215.692JPM Global Capital Preservation (EUR) I (inc) - EUR 103,595.103 124,293.964 7,000.001 220,889.066JPM Global Capital Preservation (EUR) X (acc) - EUR 324,263.949 84,991.110 7,796.737 401,458.322
JPMorgan Investment Funds - Global Capital Preservation Fund (USD)JPM Global Capital Preservation (USD) A (acc) - USD 456,584.883 449,596.960 445,996.181 460,185.662JPM Global Capital Preservation (USD) D (acc) - USD 189,760.015 115,053.802 142,816.858 161,996.959
JPMorgan Investment Funds - Global Convertibles Fund (USD)JF Global Convertibles (USD) A (acc) - USD 2,425.698 1,612.928 3,494.671 543.955JPM Global Convertibles (USD) A (acc) - USD 2,935,327.386 2,433,597.219 2,634,526.228 2,734,398.377JPM Global Convertibles (USD) B (acc) - USD 320,072.511 640,115.804 543,145.726 417,042.589JPM Global Convertibles (USD) C (acc) - USD 228,700.495 384,545.546 350,309.685 262,936.356JPM Global Convertibles (USD) D (acc) - USD 378,602.303 160,676.400 223,346.712 315,931.991JPM Global Convertibles (USD) I (acc) - USD 148,834.905 63,190.243 145,018.148 67,007.000JPM Global Convertibles (USD) X (acc) - USD* 195,296.000 18,870.000 214,166.000 -
JPMorgan Investment Funds - Global Dividend FundJPM Global Dividend A (acc) - USD 113,331.681 630,650.297 358,990.970 384,991.008JPM Global Dividend A (acc) - EUR - 10,232.085 959.298 9,272.787JPM Global Dividend A (acc) - EUR (hedged) 13,863.096 152,802.563 57,536.147 109,129.512JPM Global Dividend A (inc) - USD 1,161.116 12,449.054 822.585 12,787.585JPM Global Dividend A (inc) - EUR (hedged) 2,662.099 10,739.013 5,443.625 7,957.487JPM Global Dividend C (acc) - EUR 181,010.969 59,048.083 204,738.872 35,320.180JPM Global Dividend D (acc) - USD 11,586.250 11,363.602 6,438.174 16,511.678JPM Global Dividend D (acc) - EUR (hedged) 15,640.572 20,593.911 8,873.778 27,360.705JPM Global Dividend X (acc) - USD* - 155,894.367 155,894.367 -
JPMorgan Investment Funds - Global Enhanced Bond FundJPM Global Enhanced Bond A (acc) - EUR 149,072.020 44,386.600 63,432.484 130,026.136JPM Global Enhanced Bond A (inc) - EUR 41.718 10.821 3.000 49.539JPM Global Enhanced Bond B (acc) - EUR 4,319.054 5,136.721 1,124.341 8,331.434JPM Global Enhanced Bond C (acc) - EUR 22,947.121 - 745.383 22,201.738JPM Global Enhanced Bond D (acc) - EUR 19,404.323 80,726.413 54,896.162 45,234.574JPM Global Enhanced Bond X (acc) - EUR 2,242.717 - 2,044.967 197.750
JPMorgan Investment Funds - Global Financials FundJPM Global Financials A (acc) - USD 848,079.803 458,896.279 567,601.046 739,375.036JPM Global Financials A (acc) - EUR 362,164.761 425,524.595 192,191.728 595,497.628JPM Global Financials A (dist) - USD 188,087.896 609,102.535 94,591.122 702,599.309JPM Global Financials B (acc) - USD 412,565.384 293,051.972 367,196.764 338,420.592JPM Global Financials C (acc) - USD 11,810.617 248,042.087 26,520.752 233,331.952JPM Global Financials D (acc) - USD 75,430.963 35,857.184 44,700.813 66,587.334JPM Global Financials X (acc) - USD 10,719.673 215.564 750.000 10,185.237
JPMorgan Investment Funds - Global High Yield Bond FundJPM Global High Yield Bond A (acc) - USD 777,810.222 3,850,389.765 1,345,589.421 3,282,610.566JPM Global High Yield Bond A (acc) - EUR (hedged) 642,374.157 1,447,770.532 1,126,831.458 963,313.231JPM Global High Yield Bond A (inc) - EUR (hedged) 65,167.139 42,170.547 47,572.760 59,764.926JPM Global High Yield Bond A (mth) - USD 180,599.299 871,558.816 484,771.314 567,386.801JPM Global High Yield Bond B (acc) - EUR (hedged) 54,221.862 237,679.217 137,200.575 154,700.504JPM Global High Yield Bond C (acc) - USD 193,934.780 969,559.756 394,834.838 768,659.698JPM Global High Yield Bond C (acc) - EUR (hedged) 479,981.346 1,341,285.041 853,414.357 967,852.030JPM Global High Yield Bond D (acc) - USD - 823.395 - 823.395JPM Global High Yield Bond D (acc) - EUR (hedged) 156,321.512 213,342.629 87,350.576 282,313.565JPM Global High Yield Bond I (acc) - USD 360,000.000 2,120,040.843 1,043,054.359 1,436,986.484JPM Global High Yield Bond I (inc) - EUR (hedged) 173,754.250 141,712.467 220,073.250 95,393.467JPM Global High Yield Bond X (acc) - EUR (hedged) 36,133.150 77,448.800 59,216.333 54,365.617
190

JPMorgan Investment Funds
Appendix - Unaudited Additional Disclosures (continued)
Shares Outstandingat the Beginning
of the Year
Shares Subscribed Shares Redeemed Shares Outstandingat the End
of the Year
9. Historical Statement of Changes in the Number of Shares - for the year ended 31 December 2010 (continued)JPMorgan Investment Funds - Global Income FundJPM Global Income A (div) - EUR 148,419.625 113,007.586 125,891.555 135,535.656JPM Global Income C (div) - EUR - 166,662.454 65,770.647 100,891.807JPM Global Income D (div) - EUR 195,050.578 945,912.004 119,597.551 1,021,365.031
JPMorgan Investment Funds - Global Select 130/30 FundJPM Global Select 130/30 A (acc) - USD 130,051.383 56,934.569 77,128.431 109,857.521JPM Global Select 130/30 A (acc) - EUR* 642.508 - 642.508 -JPM Global Select 130/30 A (dist) - USD 530.394 1.532 - 531.926JPM Global Select 130/30 C (acc) - USD 36,278.750 6,363.599 13,434.809 29,207.540JPM Global Select 130/30 D (acc) - USD 39,758.076 18,779.723 25,154.917 33,382.882
JPMorgan Investment Funds - Global Select Equity FundJPM Global Select Equity A (acc) - USD 399,254.727 216,892.267 168,275.359 447,871.635JPM Global Select Equity A (dist) - USD 930.918 8,341.777 - 9,272.695JPM Global Select Equity B (acc) - USD 6,520.808 362.000 6,522.808 360.000JPM Global Select Equity C (acc) - USD 475,915.617 509,269.001 280,427.074 704,757.544JPM Global Select Equity D (acc) - USD 72,852.701 31,337.893 39,362.437 64,828.157JPM Global Select Equity X (acc) - USD 865,977.872 53,710.601 576,846.952 342,841.521
JPMorgan Investment Funds - Global Total Return FundJPM Global Total Return A (acc) - EUR 497,735.861 402,075.166 582,548.767 317,262.260JPM Global Total Return A (dist) - EUR 712.913 6.039 - 718.952JPM Global Total Return A (inc) - EUR 89.650 9.027 0.705 97.972JPM Global Total Return C (acc) - EUR 171,328.188 75,948.088 219,695.952 27,580.324JPM Global Total Return D (acc) - EUR 443,787.645 62,489.316 165,011.838 341,265.123
JPMorgan Investment Funds - Highbridge Statistical Market Neutral FundJPM Highbridge Statistical Market Neutral A (acc) - EUR 5,814,589.629 1,297,336.999 4,859,982.903 2,251,943.725JPM Highbridge Statistical Market Neutral A (acc) - SEK (hedged) 187,792.602 212,251.134 168,650.137 231,393.599JPM Highbridge Statistical Market Neutral A (acc) - USD 163,287.483 55,787.694 105,272.099 113,803.078JPM Highbridge Statistical Market Neutral A (acc) - USD (hedged) 382,366.069 81,280.858 319,266.534 144,380.393JPM Highbridge Statistical Market Neutral A (dist) - GBP 41,114.671 3,587.340 33,581.624 11,120.387JPM Highbridge Statistical Market Neutral A (dist) - GBP (hedged) 427,969.137 61,294.236 411,370.683 77,892.690JPM Highbridge Statistical Market Neutral A (inc) - EUR 82,493.024 3,387.993 29,227.787 56,653.230JPM Highbridge Statistical Market Neutral B (acc) - EUR 906,281.584 218,590.242 830,540.103 294,331.723JPM Highbridge Statistical Market Neutral B (acc) - USD* 1,906.214 - 1,906.214 -JPM Highbridge Statistical Market Neutral C (acc) - EUR 4,621,483.619 1,939,910.869 5,269,925.052 1,291,469.436JPM Highbridge Statistical Market Neutral C (acc) - SEK (hedged)* - 19,917.817 19,917.817 -JPM Highbridge Statistical Market Neutral C (dist) - GBP (hedged) 1,213,931.558 1,201,291.161 955,263.003 1,459,959.716JPM Highbridge Statistical Market Neutral C (dist) - USD (hedged) 136,664.498 12,514.189 108,337.029 40,841.658JPM Highbridge Statistical Market Neutral D (acc) - EUR 7,831,983.678 715,120.891 6,028,535.645 2,518,568.924JPM Highbridge Statistical Market Neutral D (acc) - USD 40,753.146 20,598.175 40,959.808 20,391.513JPM Highbridge Statistical Market Neutral D (acc) - USD (hedged) 50,937.127 11,602.292 53,839.557 8,699.862JPM Highbridge Statistical Market Neutral I (acc) - EUR 587,873.838 68,566.103 459,372.279 197,067.662JPM Highbridge Statistical Market Neutral I (dist) - EUR - 295,105.705 148,935.207 146,170.498JPM Highbridge Statistical Market Neutral X (acc) - EUR 64,246.127 129,061.254 89,341.660 103,965.721JPM Highbridge Statistical Market Neutral X (acc) - USD (hedged)* 13,087.207 34,433.970 47,521.177 -
JPMorgan Investment Funds - Income Opportunity Fund (2)JPM Income Opportunity A (acc) - USD 4,236,097.565 3,807,948.063 2,318,583.528 5,725,462.100JPM Income Opportunity A (acc) - EUR (hedged) 2,477,663.429 5,241,589.882 2,666,370.263 5,052,883.048JPM Income Opportunity A (acc) - SEK (hedged) 35,948.460 522,427.356 53,187.550 505,188.266JPM Income Opportunity A (dist) - EUR (hedged) 266,079.968 458,552.589 75,008.559 649,623.998JPM Income Opportunity A (dist) - GBP (hedged) 1,453,198.893 1,343,339.075 269,564.690 2,526,973.278JPM Income Opportunity B (acc) - USD 736,294.982 781,535.414 520,507.981 997,322.415JPM Income Opportunity B (acc) - EUR (hedged) 389,458.985 1,474,552.169 872,652.438 991,358.716JPM Income Opportunity C (acc) - USD 1,310,487.213 1,530,051.980 1,272,407.889 1,568,131.304JPM Income Opportunity C (acc) - USD (hedged to BRL) - 125,490.809 57,809.483 67,681.326JPM Income Opportunity C (acc) - EUR (hedged) 1,914,852.706 6,206,558.027 1,736,940.154 6,384,470.579JPM Income Opportunity C (acc) - SEK (hedged) - 99,197.377 4,171.001 95,026.376JPM Income Opportunity C (dist) - GBP (hedged) 383,045.018 621,652.494 133,505.962 871,191.550JPM Income Opportunity D (acc) - EUR (hedged) 623,506.518 3,041,490.201 646,743.514 3,018,253.205JPM Income Opportunity D (inc) - EUR (hedged) - 68.985 - 68.985JPM Income Opportunity X (acc) - USD 1,234,001.877 110,031.619 1,058,518.724 285,514.772JPM Income Opportunity X (acc) - EUR (hedged) 22,330.000 208,243.273 30,217.379 200,355.894JPM Income Opportunity X (acc) - GBP (hedged) 23,695.001 5,169.999 - 28,865.000
JPMorgan Investment Funds - Japan 50 Equity FundJPM Japan 50 Equity A (acc) - JPY 296,215.887 1,656,701.688 1,208,144.954 744,772.621JPM Japan 50 Equity A (acc) - EUR 52,156.903 249,243.333 67,404.433 233,995.803JPM Japan 50 Equity A (dist) - JPY 4,144.027 57,677.916 56,802.336 5,019.607JPM Japan 50 Equity C (acc) - JPY 219,232.262 863,952.324 542,551.559 540,633.027JPM Japan 50 Equity D (acc) - JPY 4,671.573 59,455.657 54,775.801 9,351.429JPM Japan 50 Equity X (acc) - JPY 935,188.149 259,763.972 47,967.970 1,146,984.151
JPMorgan Investment Funds - Japan Behavioural Finance Equity FundJPM Japan Behavioural Finance Equity A (acc) - USD 20,484.803 - - 20,484.803JPM Japan Behavioural Finance Equity A (acc) - EUR 21,596.599 77,848.293 82,990.044 16,454.848JPM Japan Behavioural Finance Equity A (dist) - USD 17,905.103 - - 17,905.103JPM Japan Behavioural Finance Equity D (acc) - EUR 337.997 4,478.519 1,157.976 3,658.540JPM Japan Behavioural Finance Equity X (acc) - USD 24,004.393 - 12,469.212 11,535.181
(2) This Sub-Fund changed its currency to USD on 4 January 2010.
191

JPMorgan Investment Funds
Appendix - Unaudited Additional Disclosures (continued)
Shares Outstandingat the Beginning
of the Year
Shares Subscribed Shares Redeemed Shares Outstandingat the End
of the Year
9. Historical Statement of Changes in the Number of Shares - for the year ended 31 December 2010 (continued)JPMorgan Investment Funds - Japan Focus FundJPM Japan Focus A (acc) - JPY 233,602.957 854,699.036 448,906.275 639,395.718JPM Japan Focus A (dist) - JPY 8.888 - - 8.888JPM Japan Focus D (acc) - JPY 27,762.521 14,512.778 36,154.353 6,120.946JPM Japan Focus I (acc) - JPY 573,560.388 61,055.236 283,271.925 351,343.699JPM Japan Focus X (acc) - JPY 260,808.757 - - 260,808.757
JPMorgan Investment Funds - Japan Select Equity FundJPM Japan Select Equity A (acc) - JPY 2,893,166.755 1,882,711.508 2,873,822.846 1,902,055.417JPM Japan Select Equity A (dist) - JPY 36,886.412 64,448.098 93,956.519 7,377.991JPM Japan Select Equity B (acc) - JPY 153,238.804 495,538.751 491,282.498 157,495.057JPM Japan Select Equity C (acc) - JPY 1,806,306.742 1,748,637.285 1,468,488.600 2,086,455.427JPM Japan Select Equity D (acc) - JPY 145,641.969 200,529.163 225,042.189 121,128.943JPM Japan Select Equity I (acc) - JPY 302,140.000 - - 302,140.000JPM Japan Select Equity X (acc) - JPY 1,292,507.635 309,578.511 459,291.435 1,142,794.711
JPMorgan Investment Funds - Japan Strategic Value FundJPM Japan Strategic Value A (acc) - JPY 281,873.842 735,855.363 412,154.296 605,574.909JPM Japan Strategic Value A (acc) - EUR 22,014.211 1,479.396 - 23,493.607JPM Japan Strategic Value A (dist) - GBP 62,358.574 19,078.493 25,969.493 55,467.574JPM Japan Strategic Value C (acc) - JPY 108,149.600 70,138.204 65,293.896 112,993.908JPM Japan Strategic Value D (acc) - JPY 24,090.318 6,449.860 4,918.370 25,621.808JPM Japan Strategic Value D (acc) - EUR 22,014.211 1,906.133 360.030 23,560.314JPM Japan Strategic Value X (acc) - JPY 228,139.000 136,618.421 50,198.000 314,559.421
JPMorgan Investment Funds - JF Asia ex-Japan FundJF Asia ex-Japan A (acc) - USD 1,226,426.524 547,735.962 591,999.462 1,182,163.024JF Asia ex-Japan A (dist) - USD 179,363.561 64,336.188 79,646.807 164,052.942JF Asia ex-Japan B (acc) - USD 173,447.124 102,616.045 112,950.141 163,113.028JF Asia ex-Japan C (acc) - USD 790,014.329 598,637.440 597,490.453 791,161.316JF Asia ex-Japan D (acc) - USD 262,512.205 144,209.745 189,850.383 216,871.567JF Asia ex-Japan I (acc) - USD 5,315,048.328 610,501.169 2,042,513.889 3,883,035.608JF Asia ex-Japan X (acc) - USD 256,141.060 106,163.739 176,342.894 185,961.905
JPMorgan Investment Funds - US Bond FundJPM US Bond A (acc) - USD 194,447.810 321,239.230 353,669.672 162,017.368JPM US Bond A (inc) - USD 1,542.000 21.226 481.000 1,082.226JPM US Bond B (acc) - USD 5,922.047 20,435.305 21,718.309 4,639.043JPM US Bond C (acc) - USD 5,400.198 61,894.321 56,280.265 11,014.254JPM US Bond D (acc) - USD 124,600.615 45,819.497 85,280.451 85,139.661
JPMorgan Investment Funds - US Equity FundJPM US Equity A (acc) - USD 928,634.873 609,645.983 507,101.689 1,031,179.167JPM US Equity A (acc) - EUR (hedged) 111,521.804 94,869.522 114,642.998 91,748.328JPM US Equity A (dist) - GBP 2,470.405 25,390.273 4,195.504 23,665.174JPM US Equity C (acc) - USD 72,976.004 326,538.353 118,252.427 281,261.930JPM US Equity D (acc) - USD 10,775.941 22,811.253 6,904.011 26,683.183JPM US Equity D (acc) - EUR (hedged) 30,028.997 27,760.408 22,406.599 35,382.806JPM US Equity X (acc) - USD 1,396.370 120,346.811 - 121,743.181
JPMorgan Investment Funds - US Market Neutral Fund (3)JPM US Market Neutral A (acc) - USD 32,867.065 12,120.220 44,987.285 -JPM US Market Neutral A (acc) - EUR (hedged) 10,765.218 917.957 11,683.175 -JPM US Market Neutral A (dist) - USD 15,361.153 - 15,361.153 -JPM US Market Neutral A (dist) - GBP 15,097.352 - 15,097.352 -JPM US Market Neutral D (acc) - USD 13,765.559 4,985.936 18,751.495 -JPM US Market Neutral D (acc) - EUR (hedged) 15,379.635 1,943.735 17,323.370 -JPM US Market Neutral X (acc) - USD 33,377.094 - 33,377.094 -
JPMorgan Investment Funds - US Select Equity FundJPM US Select Equity A (acc) - USD 4,287,012.741 5,395,573.381 2,070,179.466 7,612,406.656JPM US Select Equity A (acc) - EUR 303,148.027 1,559,729.541 539,098.080 1,323,779.488JPM US Select Equity A (acc) - EUR (hedged) 1,469,260.818 918,499.804 1,896,944.505 490,816.117JPM US Select Equity A (dist) - USD 1,064,409.884 278,108.502 720,601.283 621,917.103JPM US Select Equity B (acc) - USD 544,175.749 388,748.658 198,381.620 734,542.787JPM US Select Equity C (acc) - USD 2,343,303.460 858,318.575 757,858.524 2,443,763.511JPM US Select Equity C (acc) - EUR (hedged) 148,590.709 327,104.481 112,297.125 363,398.065JPM US Select Equity D (acc) - USD 345,454.907 486,366.400 245,146.370 586,674.937JPM US Select Equity D (acc) - EUR (hedged) 540,595.604 436,206.973 463,994.244 512,808.333JPM US Select Equity I (acc) - USD 808,968.114 - 308,523.554 500,444.560JPM US Select Equity X (acc) - USD 119,987.057 33,538.854 40,366.386 113,159.525
(3) This Sub-Fund was liquidated on 15 December 2010.
* Share Class inactive as at the end of the year.
192

JPMorgan Investment Funds
Appendix - Unaudited Additional Disclosures (continued)
Shares Outstandingat the Beginning
of the Year
Shares Subscribed Shares Redeemed Shares Outstandingat the End
of the Year
10. Historical Statement of Changes in the Number of Shares - for the year ended 31 December 2009 (continued)JPMorgan Investment Funds - Blue and Green FundJPM Blue and Green Fund 3,449.615 - - 3,449.615
JPMorgan Investment Funds - Euro Liquid Market FundJPM Euro Liquid Market A (acc) - EUR 337,042.849 119,282.235 306,653.433 149,671.651JPM Euro Liquid Market C (acc) - EUR 904,953.771 512,537.783 1,091,980.564 325,510.990JPM Euro Liquid Market D (acc) - EUR 79,083.020 361,311.221 294,360.433 146,033.808
JPMorgan Investment Funds - Europe Bond FundJPM Europe Bond A (acc) - EUR 452,350.578 244,529.021 365,453.335 331,426.264JPM Europe Bond A (inc) - EUR 110,081.452 3,687.113 28,935.172 84,833.393JPM Europe Bond B (acc) - EUR 5,410.046 - 3,692.650 1,717.396JPM Europe Bond C (acc) - EUR 19,348.792 141,062.046 77,523.822 82,887.016JPM Europe Bond D (acc) - EUR 54,183.395 29,626.512 36,538.411 47,271.496JPM Europe Bond X (acc) - EUR 299.985 - - 299.985
JPMorgan Investment Funds - Europe Recovery FundJPM Europe Recovery A (acc) - EUR 970,990.677 444,229.251 514,165.087 901,054.841JPM Europe Recovery A (dist) - EUR 302,242.860 46,221.183 85,937.164 262,526.879JPM Europe Recovery B (acc) - EUR 8,304.238 33,460.566 38,122.341 3,642.463JPM Europe Recovery C (acc) - EUR 9,199.300 366,584.240 252,908.582 122,874.958JPM Europe Recovery D (acc) - EUR 28,633.652 13,821.606 18,497.895 23,957.363JPM Europe Recovery X (acc) - EUR - 254,223.189 111,520.925 142,702.264
JPMorgan Investment Funds - Europe Select Equity FundJPM Europe Select Equity A (acc) - EUR 16,656.442 94,735.747 29,485.336 81,906.853JPM Europe Select Equity A (acc) - USD 34.860 2,913.800 2,780.951 167.709JPM Europe Select Equity A (dist) - EUR 3,168.062 1,342.826 4,297.461 213.427JPM Europe Select Equity B (acc) - EUR 41,812.041 155,279.516 52,033.499 145,058.058JPM Europe Select Equity C (acc) - EUR 397,336.432 638,715.280 154,647.425 881,404.287JPM Europe Select Equity D (acc) - EUR 21,435.173 109,103.030 46,855.364 83,682.839JPM Europe Select Equity D (acc) - USD 34.860 - - 34.860JPM Europe Select Equity X (acc) - EUR 101,630.344 327,488.105 109,113.367 320,005.082JPM Europe Select Equity X (acc) - EUR (hedged) 844,138.363 - - 844,138.363
JPMorgan Investment Funds - Europe Select Mega Cap Fund (1)JPM Europe Select Mega Cap A (acc) - EUR 79,296.459 1,780.944 81,077.403 -JPM Europe Select Mega Cap A (dist) - EUR 66.913 - 66.913 -JPM Europe Select Mega Cap B (acc) - EUR 3,958.587 - 3,958.587 -JPM Europe Select Mega Cap C (acc) - EUR 3,582.551 - 3,582.551 -JPM Europe Select Mega Cap D (acc) - EUR 63,784.486 487.936 64,272.422 -JPM Europe Select Mega Cap X (acc) - EUR 26,158.461 373.021 26,531.482 -
JPMorgan Investment Funds - Europe Short Duration Fund (2)JPM Europe Short Duration A (acc) - EUR 43,248.540 - 43,248.540 -JPM Europe Short Duration B (acc) - EUR 698.381 - 698.381 -JPM Europe Short Duration D (acc) - EUR 43,977.048 - 43,977.048 -
JPMorgan Investment Funds - Europe Strategic Dividend FundJPM Europe Strategic Dividend A (acc) - EUR 792,396.145 969,922.377 631,840.912 1,130,477.610JPM Europe Strategic Dividend A (dist) - EUR 4,213.117 25,256.980 2,544.993 26,925.104JPM Europe Strategic Dividend A (inc) - EUR 2,977.000 12,045.093 894.442 14,127.651JPM Europe Strategic Dividend C (acc) - EUR 46,281.320 1,347,795.816 285,047.421 1,109,029.715JPM Europe Strategic Dividend D (acc) - EUR 97,637.891 227,165.575 39,777.120 285,026.346JPM Europe Strategic Dividend X (acc) - EUR 10,520.000 3,966.000 12,405.862 2,080.138
JPMorgan Investment Funds - Global Balanced Fund (EUR)JPM Global Balanced (EUR) A (acc) - EUR 80,465.325 34,294.960 36,052.904 78,707.381JPM Global Balanced (EUR) A (dist) - EUR 193.353 2,973.623 2,993.789 173.187JPM Global Balanced (EUR) B (acc) - EUR 14,183.361 3,580.047 8,608.484 9,154.924JPM Global Balanced (EUR) C (acc) - EUR 16,653.663 43,700.896 33,576.653 26,777.906JPM Global Balanced (EUR) D (acc) - EUR 204,034.481 62,514.284 65,048.473 201,500.292
JPMorgan Investment Funds - Global Balanced Fund (USD)JF Global Balanced (USD) A (acc) - USD 11,040.731 124,666.642 6,080.066 129,627.307JPM Global Balanced (USD) A (acc) - USD 798,641.815 580,422.323 351,201.715 1,027,862.423JPM Global Balanced (USD) A (dist) - USD 50.000 - - 50.000JPM Global Balanced (USD) B (acc) - USD 466,287.514 199.626 5,032.615 461,454.525JPM Global Balanced (USD) C (acc) - USD 157,382.507 285,731.290 39,909.616 403,204.181JPM Global Balanced (USD) D (acc) - USD 110,573.620 102,970.829 38,037.479 175,506.970JPM Global Balanced (USD) X (acc) - USD 1,340,264.788 611,038.748 1,214,697.420 736,606.116
JPMorgan Investment Funds - Global Bond Fund (EUR)JPM Global Bond (EUR) A (acc) - EUR 472,540.605 151,301.691 231,662.494 392,179.802JPM Global Bond (EUR) A (inc) - EUR 59,817.000 1,753.000 28,823.000 32,747.000JPM Global Bond (EUR) B (acc) - EUR 27,087.334 3,231.878 15,619.231 14,699.981JPM Global Bond (EUR) C (acc) - EUR 78,462.855 44,434.179 5,267.720 117,629.314JPM Global Bond (EUR) D (acc) - EUR 72,246.077 8,794.961 37,821.039 43,219.999JPM Global Bond (EUR) X (acc) - EUR 158,235.559 20,962.000 177,956.534 1,241.025
(1) This Sub-Fund merged into Europe Select Equity Fund on 12 June 2009.(2) This Sub-Fund was liquidated on 30 January 2009.
193

JPMorgan Investment Funds
Appendix - Unaudited Additional Disclosures (continued)
Shares Outstandingat the Beginning
of the Year
Shares Subscribed Shares Redeemed Shares Outstandingat the End
of the Year
10. Historical Statement of Changes in the Number of Shares - for the year ended 31 December 2009 (continued)JPMorgan Investment Funds - Global Bond Fund (USD)JF Global Bond (USD) A (acc) - USD 87,594.148 7,312.128 92,259.467 2,646.809JPM Global Bond (USD) A (acc) - USD 242,922.924 17,102.368 47,838.534 212,186.758JPM Global Bond (USD) B (acc) - USD* 599.999 0.001 600.000 -JPM Global Bond (USD) C (acc) - USD 4,058.676 713.206 1,313.208 3,458.674JPM Global Bond (USD) D (acc) - USD 57,332.850 13,723.652 22,539.762 48,516.740JPM Global Bond (USD) X (acc) - USD 237,256.664 - 877.810 236,378.854
JPMorgan Investment Funds - Global Capital Appreciation FundJPM Global Capital Appreciation A (acc) - EUR 257,254.745 240,111.053 248,577.669 248,788.129JPM Global Capital Appreciation A (dist) - EUR 1,090.551 635.727 400.000 1,326.278JPM Global Capital Appreciation A (inc) - EUR 12,029.440 2,465.853 7,404.328 7,090.965JPM Global Capital Appreciation B (acc) - EUR 10,554.878 6,000.000 8,404.547 8,150.331JPM Global Capital Appreciation C (acc) - EUR 227,375.399 262,382.375 408,981.284 80,776.490JPM Global Capital Appreciation D (acc) - EUR 566,126.126 107,098.795 200,721.197 472,503.724JPM Global Capital Appreciation X (acc) - EUR 470,455.401 - 209,270.692 261,184.709
JPMorgan Investment Funds - Global Capital Preservation Fund (EUR)JPM Global Capital Preservation (EUR) A (acc) - EUR 779,000.924 211,954.501 237,166.677 753,788.748JPM Global Capital Preservation (EUR) A (acc) - USD 92,529.997 10,375.371 51,156.690 51,748.678JPM Global Capital Preservation (EUR) A (dist) - EUR 584,055.737 101,351.698 322,252.099 363,155.336JPM Global Capital Preservation (EUR) A (inc) - EUR 108,892.993 3,268.601 18,471.479 93,690.115JPM Global Capital Preservation (EUR) B (acc) - EUR 24,312.469 19,465.134 14,468.808 29,308.795JPM Global Capital Preservation (EUR) C (acc) - EUR 126,988.318 123,914.274 59,561.304 191,341.288JPM Global Capital Preservation (EUR) D (acc) - EUR 7,213,438.828 986,402.981 2,366,129.292 5,833,712.517JPM Global Capital Preservation (EUR) D (acc) - SEK (hedged) 199,813.212 432,757.400 3,297.600 629,273.012JPM Global Capital Preservation (EUR) I (acc) - EUR 283,473.000 159,634.692 100,622.000 342,485.692JPM Global Capital Preservation (EUR) I (inc) - EUR 102,378.095 1,217.008 - 103,595.103JPM Global Capital Preservation (EUR) X (acc) - EUR 186,997.509 266,351.549 129,085.109 324,263.949
JPMorgan Investment Funds - Global Capital Preservation Fund (USD)JPM Global Capital Preservation (USD) A (acc) - USD 437,699.978 208,252.618 189,367.713 456,584.883JPM Global Capital Preservation (USD) D (acc) - USD 190,691.876 107,272.997 108,204.858 189,760.015JPM Global Capital Preservation (USD) X (acc) - USD* 6,263.113 - 6,263.113 -
JPMorgan Investment Funds - Global Convertibles Fund (USD)JF Global Convertibles (USD) A (acc) - USD - 2,425.699 0.001 2,425.698JPM Global Convertibles (USD) A (acc) - USD 1,112,950.931 3,076,025.578 1,253,649.123 2,935,327.386JPM Global Convertibles (USD) B (acc) - USD 40,000.000 351,276.184 71,203.673 320,072.511JPM Global Convertibles (USD) C (acc) - USD - 314,629.446 85,928.951 228,700.495JPM Global Convertibles (USD) D (acc) - USD 292,900.055 204,022.223 118,319.975 378,602.303JPM Global Convertibles (USD) I (acc) - USD 64,597.000 500,759.374 416,521.469 148,834.905JPM Global Convertibles (USD) X (acc) - USD - 212,445.001 17,149.001 195,296.000
JPMorgan Investment Funds - Global Dividend FundJPM Global Dividend A (acc) - USD 7,500.000 113,421.991 7,590.310 113,331.681JPM Global Dividend A (inc) - USD - 1,161.117 0.001 1,161.116JPM Global Dividend A (acc) - EUR (hedged) 8,608.776 6,111.635 857.315 13,863.096JPM Global Dividend A (inc) - EUR (hedged) - 2,662.100 0.001 2,662.099JPM Global Dividend C (acc) - EUR - 187,104.464 6,093.495 181,010.969JPM Global Dividend D (acc) - USD 8,189.892 4,333.634 937.276 11,586.250JPM Global Dividend D (acc) - EUR (hedged) 8,569.067 15,594.109 8,522.604 15,640.572
JPMorgan Investment Funds - Global Enhanced Bond FundJPM Global Enhanced Bond A (acc) - EUR 204,106.306 31,270.345 86,304.631 149,072.020JPM Global Enhanced Bond A (inc) - EUR 54.718 1.000 14.000 41.718JPM Global Enhanced Bond B (acc) - EUR 4,319.054 9,508.000 9,508.000 4,319.054JPM Global Enhanced Bond C (acc) - EUR 66,703.995 - 43,756.874 22,947.121JPM Global Enhanced Bond D (acc) - EUR 49,707.567 3,764.764 34,068.008 19,404.323JPM Global Enhanced Bond X (acc) - EUR 2,072.717 170.000 - 2,242.717
JPMorgan Investment Funds - Global ex-US Select Small Cap Fund (3)JPM Global ex-US Select Small Cap A (acc) - EUR 92,676.578 - 92,676.578 -JPM Global ex-US Select Small Cap A (dist) - EUR 659.168 - 659.168 -JPM Global ex-US Select Small Cap B (acc) - EUR 170.000 - 170.000 -JPM Global ex-US Select Small Cap C (acc) - EUR 6,167.953 - 6,167.953 -JPM Global ex-US Select Small Cap D (acc) - EUR 31,304.831 - 31,304.831 -
JPMorgan Investment Funds - Global Financials FundJPM Global Financials A (acc) - USD 915,853.151 944,086.104 1,011,859.452 848,079.803JPM Global Financials A (acc) - EUR 29,053.662 520,643.198 187,532.099 362,164.761JPM Global Financials A (dist) - USD 7,859.140 180,228.756 - 188,087.896JPM Global Financials B (acc) - USD 8,906.326 995,002.076 591,343.018 412,565.384JPM Global Financials C (acc) - USD 610,657.762 182,551.146 781,398.291 11,810.617JPM Global Financials D (acc) - USD 67,827.112 105,485.228 97,881.377 75,430.963JPM Global Financials X (acc) - USD 10,938.618 731.055 950.000 10,719.673
(3) This Sub-Fund was liquidated on 9 February 2009.
194

195
JPMorgan Investment Funds
Appendix - Unaudited Additional Disclosures (continued)
Shares Outstandingat the Beginning
of the Year
Shares Subscribed Shares Redeemed Shares Outstandingat the End
of the Year
10. Historical Statement of Changes in the Number of Shares - for the year ended 31 December 2009 (continued)JPMorgan Investment Funds - Global Healthtech Fund (4)JPM Global Healthtech A (acc) - USD 103,860.385 95,849.136 199,709.521 -JPM Global Healthtech A (dist) - USD 50.000 2,417.972 2,467.972 -JPM Global Healthtech B (acc) - USD 8,590.893 2,523.938 11,114.831 -JPM Global Healthtech C (acc) - USD 400.603 44,703.435 45,104.038 -JPM Global Healthtech D (acc) - USD 33,387.742 4,733.299 38,121.041 -
JPMorgan Investment Funds - Global High Yield Bond FundJPM Global High Yield Bond A (acc) - USD 107,530.516 1,031,866.355 361,586.649 777,810.222JPM Global High Yield Bond A (acc) - EUR (hedged) 395,886.052 1,015,940.154 769,452.049 642,374.157JPM Global High Yield Bond A (inc) - EUR (hedged) 85,394.679 425,892.193 446,119.733 65,167.139JPM Global High Yield Bond A (mth) - USD 1,359.720 280,755.181 101,515.602 180,599.299JPM Global High Yield Bond B (acc) - EUR (hedged) 8,962.730 54,691.087 9,431.955 54,221.862JPM Global High Yield Bond C (acc) - USD 2,150.000 223,086.571 31,301.791 193,934.780JPM Global High Yield Bond C (acc) - EUR (hedged) 416,620.633 711,382.721 648,022.008 479,981.346JPM Global High Yield Bond D (acc) - EUR (hedged) 86,047.587 118,452.833 48,178.908 156,321.512JPM Global High Yield Bond I (acc) - USD - 360,000.001 0.001 360,000.000JPM Global High Yield Bond I (inc) - EUR (hedged) 131,000.000 156,254.250 113,500.000 173,754.250JPM Global High Yield Bond X (acc) - EUR (hedged) 36,505.870 25,061.247 25,433.967 36,133.150
JPMorgan Investment Funds - Global Income FundJPM Global Income A (div) - EUR 116,054.160 38,963.535 6,598.070 148,419.625JPM Global Income D (div) - EUR - 196,449.837 1,399.259 195,050.578
JPMorgan Investment Funds - Global Select 130/30 FundJPM Global Select 130/30 A (acc) - USD 178,493.515 92,150.319 140,592.451 130,051.383JPM Global Select 130/30 A (acc) - EUR 642.508 - - 642.508JPM Global Select 130/30 A (dist) - USD 517.762 12.632 - 530.394JPM Global Select 130/30 C (acc) - USD 566.138 56,302.318 20,589.706 36,278.750JPM Global Select 130/30 D (acc) - USD 68,716.451 18,817.031 47,775.406 39,758.076
JPMorgan Investment Funds - Global Select Equity FundJPM Global Select Equity A (acc) - USD 191,000.811 377,925.276 169,671.360 399,254.727JPM Global Select Equity A (dist) - USD 528.464 539.046 136.592 930.918JPM Global Select Equity B (acc) - USD 38,969.659 17,240.193 49,689.044 6,520.808JPM Global Select Equity C (acc) - USD 502,428.557 410,731.634 437,244.574 475,915.617JPM Global Select Equity D (acc) - USD 62,932.873 23,017.968 13,098.140 72,852.701JPM Global Select Equity X (acc) - USD 378,884.834 523,136.351 36,043.313 865,977.872
JPMorgan Investment Funds - Global Short Duration Fund (5)JPM Global Short Duration A (acc) - USD 13,518.138 - 13,518.138 -JPM Global Short Duration C (acc) - USD 225,530.507 - 225,530.507 -JPM Global Short Duration D (acc) - USD 10,847.808 - 10,847.808 -
JPMorgan Investment Funds - Global Teletech Fund (6)JPM Global Teletech A (acc) - USD 162,385.964 - 162,385.964 -JPM Global Teletech A (dist) - USD 197.561 - 197.561 -JPM Global Teletech B (acc) - USD 1,584.053 - 1,584.053 -JPM Global Teletech C (acc) - USD 2,542.079 - 2,542.079 -JPM Global Teletech D (acc) - USD 28,567.742 - 28,567.742 -
JPMorgan Investment Funds - Global Total Return FundJPM Global Total Return A (acc) - EUR 531,600.707 71,481.093 105,345.939 497,735.861JPM Global Total Return A (dist) - EUR 87.551 625.362 - 712.913JPM Global Total Return A (inc) - EUR 89.650 - - 89.650JPM Global Total Return B (acc) - EUR* 675.680 - 675.680 -JPM Global Total Return C (acc) - EUR 9,373.040 171,078.185 9,123.037 171,328.188JPM Global Total Return D (acc) - EUR 577,607.727 36,979.978 170,800.060 443,787.645
JPMorgan Investment Funds - Highbridge Statistical Market Neutral FundJPM Highbridge Statistical Market Neutral A (acc) - EUR 8,399,271.396 5,096,003.886 7,680,685.653 5,814,589.629JPM Highbridge Statistical Market Neutral A (acc) - SEK (hedged) 56,189.598 283,229.360 151,626.356 187,792.602JPM Highbridge Statistical Market Neutral A (acc) - USD 257,862.521 82,446.597 177,021.635 163,287.483JPM Highbridge Statistical Market Neutral A (acc) - USD (hedged) 294,917.477 828,993.308 741,544.716 382,366.069JPM Highbridge Statistical Market Neutral A (dist) - GBP 84,925.765 187,276.457 231,087.551 41,114.671JPM Highbridge Statistical Market Neutral A (dist) - GBP (hedged) 392,942.593 665,322.601 630,296.057 427,969.137JPM Highbridge Statistical Market Neutral A (inc) - EUR 78,105.069 27,562.596 23,174.641 82,493.024JPM Highbridge Statistical Market Neutral B (acc) - EUR 803,731.335 790,743.463 688,193.214 906,281.584JPM Highbridge Statistical Market Neutral B (acc) - USD 1,906.214 - - 1,906.214JPM Highbridge Statistical Market Neutral C (acc) - EUR 3,471,704.609 4,580,064.651 3,430,285.641 4,621,483.619JPM Highbridge Statistical Market Neutral C (dist) - GBP (hedged) 410,225.603 1,143,614.350 339,908.395 1,213,931.558JPM Highbridge Statistical Market Neutral C (dist) - USD (hedged) - 177,747.927 41,083.429 136,664.498JPM Highbridge Statistical Market Neutral D (acc) - EUR 10,119,774.407 4,475,059.844 6,762,850.573 7,831,983.678JPM Highbridge Statistical Market Neutral D (acc) - USD 46,631.915 45,643.924 51,522.693 40,753.146JPM Highbridge Statistical Market Neutral D (acc) - USD (hedged) 45,469.095 59,966.811 54,498.779 50,937.127JPM Highbridge Statistical Market Neutral I (acc) - EUR 793,769.216 191,516.000 397,411.378 587,873.838JPM Highbridge Statistical Market Neutral X (acc) - EUR 94,625.507 11,566.468 41,945.848 64,246.127JPM Highbridge Statistical Market Neutral X (acc) - USD (hedged) - 448,857.146 435,769.939 13,087.207
(4) This Sub-Fund merged into JPMorgan Funds - Global Healthcare Fund on 2 October 2009.(5) This Sub-Fund was liquidated on 30 January 2009.(6) This Sub-Fund was liquidated on 25 February 2009.

JPMorgan Investment Funds
Appendix - Unaudited Additional Disclosures (continued)
Shares Outstandingat the Beginning
of the Year
Shares Subscribed Shares Redeemed Shares Outstandingat the End
of the Year
10. Historical Statement of Changes in the Number of Shares - for the year ended 31 December 2009 (continued)JPMorgan Investment Funds - Income Opportunity FundJPM Income Opportunity A (acc) - EUR 557,538.921 2,698,280.792 778,156.284 2,477,663.429JPM Income Opportunity A (acc) - SEK (hedged) - 36,369.764 421.304 35,948.460JPM Income Opportunity A (acc) - USD (hedged) 12,908.510 5,169,247.930 946,058.875 4,236,097.565JPM Income Opportunity A (dist) - GBP (hedged) 434,396.219 1,072,740.636 53,937.962 1,453,198.893JPM Income Opportunity A (inc) - EUR - 277,603.997 11,524.029 266,079.968JPM Income Opportunity B (acc) - USD (hedged) - 770,527.198 34,232.216 736,294.982JPM Income Opportunity B (acc) - EUR - 399,817.738 10,358.753 389,458.985JPM Income Opportunity C (acc) - EUR 226,050.038 1,960,239.245 271,436.577 1,914,852.706JPM Income Opportunity C (acc) - USD (hedged) - 1,311,014.894 527.681 1,310,487.213JPM Income Opportunity C (dist) - GBP (hedged) - 389,787.170 6,742.152 383,045.018JPM Income Opportunity D (acc) - EUR 45,525.132 654,877.436 76,896.050 623,506.518JPM Income Opportunity X (acc) - USD (hedged) - 1,234,675.188 673.311 1,234,001.877JPM Income Opportunity X (acc) - EUR - 48,125.001 25,795.001 22,330.000JPM Income Opportunity X (acc) - GBP (hedged) - 25,795.001 2,100.000 23,695.001
JPMorgan Investment Funds - Japan 50 Equity FundJPM Japan 50 Equity A (acc) - EUR 275,551.609 116,484.905 339,879.611 52,156.903JPM Japan 50 Equity A (acc) - JPY 218,496.308 621,653.374 543,933.795 296,215.887JPM Japan 50 Equity A (dist) - JPY 2,108.030 2,177.651 141.654 4,144.027JPM Japan 50 Equity C (acc) - JPY - 241,630.517 22,398.255 219,232.262JPM Japan 50 Equity D (acc) - JPY 3,634.907 4,992.729 3,956.063 4,671.573JPM Japan 50 Equity I (acc) - JPY* 4,002,103.435 94,513.649 4,096,617.084 -JPM Japan 50 Equity X (acc) - JPY 941,904.592 668,704.328 675,420.771 935,188.149
JPMorgan Investment Funds - Japan Behavioural Finance Equity FundJPM Japan Behavioural Finance Equity A (acc) - EUR 257,054.291 15,328.003 250,785.695 21,596.599JPM Japan Behavioural Finance Equity A (acc) - USD 169,510.758 34,663.087 183,689.042 20,484.803JPM Japan Behavioural Finance Equity A (dist) - USD 58,534.874 17,968.264 58,598.035 17,905.103JPM Japan Behavioural Finance Equity C (acc) - USD* 39,570.190 - 39,570.190 -JPM Japan Behavioural Finance Equity D (acc) - EUR 345.561 287.778 295.342 337.997JPM Japan Behavioural Finance Equity X (acc) - USD 174,966.493 - 150,962.100 24,004.393
JPMorgan Investment Funds - Japan Focus FundJPM Japan Focus A (acc) - JPY 379,060.338 157,300.027 302,757.408 233,602.957JPM Japan Focus A (dist) - JPY - 8.888 - 8.888JPM Japan Focus D (acc) - JPY 27,111.060 2,370.333 1,718.872 27,762.521JPM Japan Focus I (acc) - JPY 666,719.092 25,918.206 119,076.910 573,560.388JPM Japan Focus X (acc) - JPY 7,525.000 265,876.153 12,592.396 260,808.757
JPMorgan Investment Funds - Japan Select Equity FundJPM Japan Select Equity A (acc) - JPY 5,663,927.019 2,346,145.854 5,116,906.118 2,893,166.755JPM Japan Select Equity A (dist) - JPY 18,461.567 42,094.795 23,669.950 36,886.412JPM Japan Select Equity B (acc) - JPY 217,039.531 34,467.052 98,267.779 153,238.804JPM Japan Select Equity C (acc) - JPY 2,007,056.550 877,552.863 1,078,302.671 1,806,306.742JPM Japan Select Equity D (acc) - JPY 280,901.515 20,097.132 155,356.678 145,641.969JPM Japan Select Equity I (acc) - JPY 316,242.235 - 14,102.235 302,140.000JPM Japan Select Equity X (acc) - JPY 1,736,552.945 516,967.800 961,013.110 1,292,507.635
JPMorgan Investment Funds - Japan Strategic Value FundJPM Japan Strategic Value A (acc) - EUR 120,947.211 243,825.000 342,758.000 22,014.211JPM Japan Strategic Value A (acc) - JPY 21,528.842 443,582.890 183,237.890 281,873.842JPM Japan Strategic Value A (dist) - GBP 22,119.574 68,432.000 28,193.000 62,358.574JPM Japan Strategic Value C (acc) - JPY - 134,817.999 26,668.399 108,149.600JPM Japan Strategic Value D (acc) - EUR 22,014.211 1,437.422 1,437.422 22,014.211JPM Japan Strategic Value D (acc) - JPY 21,922.312 2,778.171 610.165 24,090.318JPM Japan Strategic Value X (acc) - JPY - 229,639.000 1,500.000 228,139.000
JPMorgan Investment Funds - JF Asia ex-Japan FundJF Asia ex-Japan A (acc) - USD 936,215.019 1,024,816.613 734,605.108 1,226,426.524JF Asia ex-Japan A (dist) - USD 58,805.816 163,826.068 43,268.323 179,363.561JF Asia ex-Japan B (acc) - USD 52,265.654 219,251.126 98,069.656 173,447.124JF Asia ex-Japan C (acc) - USD 615,225.128 640,927.998 466,138.797 790,014.329JF Asia ex-Japan D (acc) - USD 214,100.841 152,120.730 103,709.366 262,512.205JF Asia ex-Japan I (acc) - USD 2,599,067.020 2,945,664.375 229,683.067 5,315,048.328JF Asia ex-Japan X (acc) - USD 98,255.743 250,162.260 92,276.943 256,141.060
JPMorgan Investment Funds - US Bond FundJPM US Bond A (acc) - USD 390,580.210 69,757.252 265,889.652 194,447.810JPM US Bond A (inc) - USD 2,617.000 - 1,075.000 1,542.000JPM US Bond B (acc) - USD 7,133.057 27.119 1,238.129 5,922.047JPM US Bond C (acc) - USD 1,988.126 3,631.072 219.000 5,400.198JPM US Bond D (acc) - USD 158,561.074 12,648.196 46,608.655 124,600.615
JPMorgan Investment Funds - US Disciplined Equity Fund (7)JPM US Disciplined Equity A (acc) - USD 19,705.527 - 19,705.527 -JPM US Disciplined Equity A (dist) - USD 50.000 - 50.000 -JPM US Disciplined Equity B (acc) - USD 2,945.633 - 2,945.633 -JPM US Disciplined Equity C (acc) - USD 285.610 - 285.610 -JPM US Disciplined Equity D (acc) - USD 81,240.420 - 81,240.420 -JPM US Disciplined Equity X (acc) - USD 1,237.084 - 1,237.084 -
(7) This Sub-Fund was liquidated on 25 February 2009.
196

JPMorgan Investment Funds
Appendix - Unaudited Additional Disclosures (continued)
Shares Outstandingat the Beginning
of the Year
Shares Subscribed Shares Redeemed Shares Outstandingat the End
of the Year
10. Historical Statement of Changes in the Number of Shares - for the year ended 31 December 2009 (continued)JPMorgan Investment Funds - US Dynamic Small Cap Fund (8)JPM US Dynamic Small Cap A (acc) - USD 158,527.481 2,330.825 160,858.306 -JPM US Dynamic Small Cap A (dist) - USD 11.653 - 11.653 -JPM US Dynamic Small Cap D (acc) - USD 12,154.873 168.725 12,323.598 -JPM US Dynamic Small Cap X (acc) - USD 2,259.000 835.000 3,094.000 -
JPMorgan Investment Funds - US Equity FundJPM US Equity A (acc) - USD 154,664.749 988,133.638 214,163.514 928,634.873JPM US Equity A (acc) - EUR (hedged) 116,895.546 85,880.540 91,254.282 111,521.804JPM US Equity A (dist) - GBP - 2,470.405 - 2,470.405JPM US Equity C (acc) - USD 43,918.465 114,062.512 85,004.973 72,976.004JPM US Equity D (acc) - USD 5,665.643 11,217.590 6,107.292 10,775.941JPM US Equity D (acc) - EUR (hedged) 4,888.678 35,790.411 10,650.092 30,028.997JPM US Equity X (acc) - USD 18,421.539 6,827.370 23,852.539 1,396.370
JPMorgan Investment Funds - US Market Neutral FundJPM US Market Neutral A (acc) - USD 37,831.457 19,795.979 24,760.371 32,867.065JPM US Market Neutral A (acc) - EUR (hedged) 270,330.559 9,415.017 268,980.358 10,765.218JPM US Market Neutral A (dist) - USD 33,330.000 - 17,968.847 15,361.153JPM US Market Neutral A (dist) - GBP 33,495.437 50.000 18,448.085 15,097.352JPM US Market Neutral D (acc) - USD 41,002.966 3,461.018 30,698.425 13,765.559JPM US Market Neutral D (acc) - EUR (hedged) 46,332.074 11,030.533 41,982.972 15,379.635JPM US Market Neutral X (acc) - USD 79,899.141 3,177.654 49,699.701 33,377.094
JPMorgan Investment Funds - US Select Equity FundJPM US Select Equity A (acc) - USD 2,445,478.291 5,423,872.291 3,582,337.841 4,287,012.741JPM US Select Equity A (acc) - EUR 128,571.124 243,771.889 69,194.986 303,148.027JPM US Select Equity A (acc) - EUR (hedged) 671,764.636 3,700,507.621 2,903,011.439 1,469,260.818JPM US Select Equity A (dist) - USD 970,474.034 790,737.208 696,801.358 1,064,409.884JPM US Select Equity B (acc) - USD 60,215.014 693,438.694 209,477.959 544,175.749JPM US Select Equity C (acc) - USD 968,170.102 1,829,239.324 454,105.966 2,343,303.460JPM US Select Equity C (acc) - EUR (hedged) 105,153.564 154,678.581 111,241.436 148,590.709JPM US Select Equity D (acc) - USD 43,091.581 376,833.434 74,470.108 345,454.907JPM US Select Equity D (acc) - EUR (hedged) 122,179.428 533,443.725 115,027.549 540,595.604JPM US Select Equity I (acc) - USD 278,833.547 530,134.567 - 808,968.114JPM US Select Equity X (acc) - USD 111,799.942 121,740.128 113,553.013 119,987.057
* Share Class inactive as at the end of the year.
(8) This Sub-Fund was liquidated on 30 April 2009.
197

JPMorgan Investment Funds
Appendix - Unaudited Additional Disclosures (continued)
Shares Outstandingat the Beginning
of the Year
Shares Subscribed Shares Redeemed Shares Outstandingat the End
of the Year
11. Historical Statement of Changes in the Number of Shares - for the year ended 31 December 2008 (continued)JPMorgan Investment Funds - Asset-Backed Fund (EUR) (1)JPM Asset-Backed (EUR) A (acc) - EUR 67,152.624 700.923 67,853.547 -JPM Asset-Backed (EUR) D (acc) - EUR 43,679.957 1,152.747 44,832.704 -JPM Asset-Backed (EUR) X (acc) - EUR 250.000 - 250.000 -
JPMorgan Investment Funds - Blue and Green FundJPM Blue and Green Fund 3,449.615 - - 3,449.615
JPMorgan Investment Funds - Euro Liquid Market FundJPM Euro Liquid Market A (acc) - EUR 312,923.669 492,514.589 468,395.409 337,042.849JPM Euro Liquid Market C (acc) - EUR 33,600.000 1,888,990.041 1,017,636.270 904,953.771JPM Euro Liquid Market D (acc) - EUR - 81,660.596 2,577.576 79,083.020JPM Euro Liquid Market X (acc) - EUR* 148,311.853 - 148,311.853 -
JPMorgan Investment Funds - Europe Bond FundJPM Europe Bond A (acc) - EUR 1,886,071.355 263,257.543 1,696,978.320 452,350.578JPM Europe Bond A (inc) - EUR 203,356.151 10,673.558 103,948.257 110,081.452JPM Europe Bond B (acc) - EUR 125,145.068 50,518.343 170,253.365 5,410.046JPM Europe Bond C (acc) - EUR 598,613.929 9,589.000 588,854.137 19,348.792JPM Europe Bond D (acc) - EUR 181,779.126 27,904.571 155,500.302 54,183.395JPM Europe Bond X (acc) - EUR 369,646.068 27,761.824 397,107.907 299.985
JPMorgan Investment Funds - Europe Corporate Bond Fund (2)JPM Europe Corporate Bond A (acc) - EUR 90,765.143 7,765.797 98,530.940 -JPM Europe Corporate Bond C (acc) - EUR 6,000.006 - 6,000.006 -JPM Europe Corporate Bond D (acc) - EUR 12,154.410 6,900.259 19,054.669 -
JPMorgan Investment Funds - Europe Recovery FundJPM Europe Recovery A (acc) - EUR 1,867,609.469 127,553.645 1,024,172.437 970,990.677JPM Europe Recovery A (dist) - EUR 582,249.708 4,986.864 284,993.712 302,242.860JPM Europe Recovery B (acc) - EUR 26,330.550 28,406.408 46,432.720 8,304.238JPM Europe Recovery C (acc) - EUR 75,143.706 - 65,944.406 9,199.300JPM Europe Recovery D (acc) - EUR 52,599.259 9,455.888 33,421.495 28,633.652JPM Europe Recovery X (acc) - EUR* 32,617.701 - 32,617.701 -
JPMorgan Investment Funds - Europe Select Equity FundJPM Europe Select Equity A (acc) - EUR 171,490.663 16,939.943 171,774.164 16,656.442JPM Europe Select Equity A (acc) - USD 34.860 - - 34.860JPM Europe Select Equity A (dist) - EUR 54,233.360 1,412.163 52,477.461 3,168.062JPM Europe Select Equity B (acc) - EUR 89,273.612 71,372.782 118,834.353 41,812.041JPM Europe Select Equity C (acc) - EUR 267,209.237 427,482.669 297,355.474 397,336.432JPM Europe Select Equity D (acc) - EUR 41,364.284 30,010.470 49,939.581 21,435.173JPM Europe Select Equity D (acc) - USD 34.860 - - 34.860JPM Europe Select Equity X (acc) - EUR 286,597.337 22,051.896 207,018.889 101,630.344JPM Europe Select Equity X (acc) - EUR (hedged) 846,138.363 - 2,000.000 844,138.363
JPMorgan Investment Funds - Europe Select Mega Cap FundJPM Europe Select Mega Cap A (acc) - EUR 266,215.403 79,336.063 266,255.007 79,296.459JPM Europe Select Mega Cap A (dist) - EUR 83.162 28.789 45.038 66.913JPM Europe Select Mega Cap B (acc) - EUR 19,005.350 - 15,046.763 3,958.587JPM Europe Select Mega Cap C (acc) - EUR 19,407.323 - 15,824.772 3,582.551JPM Europe Select Mega Cap D (acc) - EUR 94,398.338 55,631.691 86,245.543 63,784.486JPM Europe Select Mega Cap X (acc) - EUR 55,435.778 1,733.144 31,010.461 26,158.461
JPMorgan Investment Funds - Europe Short Duration FundJPM Europe Short Duration A (acc) - EUR 781,894.308 29,927.993 768,573.761 43,248.540JPM Europe Short Duration B (acc) - EUR 32,658.931 10,324.382 42,284.932 698.381JPM Europe Short Duration C (acc) - EUR* 91,090.184 37,789.157 128,879.341 -JPM Europe Short Duration D (acc) - EUR 176,185.764 65,954.556 198,163.272 43,977.048JPM Europe Short Duration X (acc) - EUR* 474,308.931 - 474,308.931 -
JPMorgan Investment Funds - Europe Strategic Dividend FundJPM Europe Strategic Dividend A (acc) - EUR 904,678.552 361,713.091 473,995.498 792,396.145JPM Europe Strategic Dividend A (dist) - EUR 3,473.713 1,434.678 695.274 4,213.117JPM Europe Strategic Dividend A (inc) - EUR 3,949.000 6,523.000 7,495.000 2,977.000JPM Europe Strategic Dividend C (acc) - EUR 23,035.026 87,184.803 63,938.509 46,281.320JPM Europe Strategic Dividend D (acc) - EUR 176,508.970 26,543.880 105,414.959 97,637.891JPM Europe Strategic Dividend X (acc) - EUR 9,356.100 1,201.000 37.100 10,520.000
JPMorgan Investment Funds - Flexible Bond Fund (EUR) (3)JPM Flexible Bond (EUR) A (acc) - EUR 38,860.236 120.663 38,980.899 -JPM Flexible Bond (EUR) D (acc) - EUR 55,478.218 2,082.601 57,560.819 -
JPMorgan Investment Funds - Global Balanced Fund (EUR)JPM Global Balanced (EUR) A (acc) - EUR 94,862.372 20,022.585 34,419.632 80,465.325JPM Global Balanced (EUR) A (dist) - EUR 8,995.315 159.143 8,961.105 193.353JPM Global Balanced (EUR) B (acc) - EUR 21,456.707 320.526 7,593.872 14,183.361JPM Global Balanced (EUR) C (acc) - EUR 27,752.761 647.517 11,746.615 16,653.663JPM Global Balanced (EUR) D (acc) - EUR 379,303.929 41,816.405 217,085.853 204,034.481
(1) This Sub-Fund was liquidated on 31 July 2008.(2) This Sub-Fund was liquidated on 8 December 2008.(3) This Sub-Fund was liquidated on 31 July 2008.
198

JPMorgan Investment Funds
Appendix - Unaudited Additional Disclosures (continued)
Shares Outstandingat the Beginning
of the Year
Shares Subscribed Shares Redeemed Shares Outstandingat the End
of the Year
11. Historical Statement of Changes in the Number of Shares - for the year ended 31 December 2008 (continued)JPMorgan Investment Funds - Global Balanced Fund (USD)JF Global Balanced (USD) A (acc) - USD 14,111.205 3,853.125 6,923.599 11,040.731JPM Global Balanced (USD) A (acc) - USD 1,088,347.041 176,149.105 465,854.331 798,641.815JPM Global Balanced (USD) A (dist) - USD 50.000 - - 50.000JPM Global Balanced (USD) B (acc) - USD 468,553.512 4,694.799 6,960.797 466,287.514JPM Global Balanced (USD) C (acc) - USD 157,382.507 - - 157,382.507JPM Global Balanced (USD) D (acc) - USD 115,868.691 69,401.263 74,696.334 110,573.620JPM Global Balanced (USD) X (acc) - USD 1,415,826.141 - 75,561.353 1,340,264.788
JPMorgan Investment Funds - Global Bond Fund (EUR)JPM Global Bond (EUR) A (acc) - EUR 3,832,542.165 486,812.287 3,846,813.847 472,540.605JPM Global Bond (EUR) A (inc) - EUR 356,782.394 2,091.268 299,056.662 59,817.000JPM Global Bond (EUR) B (acc) - EUR 363,569.282 1,949.284 338,431.232 27,087.334JPM Global Bond (EUR) C (acc) - EUR 364,486.796 15,965.183 301,989.124 78,462.855JPM Global Bond (EUR) D (acc) - EUR 361,263.906 29,937.012 318,954.841 72,246.077JPM Global Bond (EUR) X (acc) - EUR 483,896.744 8,672.217 334,333.402 158,235.559
JPMorgan Investment Funds - Global Bond Fund (USD)JF Global Bond (USD) A (acc) - USD 184,618.107 3,524.806 100,548.765 87,594.148JPM Global Bond (USD) A (acc) - USD 1,194,838.421 58,828.465 1,010,743.962 242,922.924JPM Global Bond (USD) B (acc) - USD 181,999.679 - 181,399.680 599.999JPM Global Bond (USD) C (acc) - USD 413,983.108 62,282.001 472,206.433 4,058.676JPM Global Bond (USD) D (acc) - USD 105,997.188 37,870.451 86,534.789 57,332.850JPM Global Bond (USD) X (acc) - USD 560,673.314 - 323,416.650 237,256.664
JPMorgan Investment Funds - Global Capital Appreciation FundJPM Global Capital Appreciation A (acc) - EUR 453,978.284 162,842.636 359,566.175 257,254.745JPM Global Capital Appreciation A (dist) - EUR 531.860 583.579 24.888 1,090.551JPM Global Capital Appreciation A (inc) - EUR 4,642.986 8,828.864 1,442.410 12,029.440JPM Global Capital Appreciation B (acc) - EUR 434.450 10,323.998 203.570 10,554.878JPM Global Capital Appreciation C (acc) - EUR 275,088.670 649,934.188 697,647.459 227,375.399JPM Global Capital Appreciation D (acc) - EUR 910,732.087 147,576.878 492,182.839 566,126.126JPM Global Capital Appreciation X (acc) - EUR 478,505.401 - 8,050.000 470,455.401
JPMorgan Investment Funds - Global Capital Preservation Fund (EUR)JPM Global Capital Preservation (EUR) A (acc) - EUR 1,021,476.576 701,787.790 944,263.442 779,000.924JPM Global Capital Preservation (EUR) A (acc) - USD 92,674.229 218,299.222 218,443.454 92,529.997JPM Global Capital Preservation (EUR) A (dist) - EUR 286,834.864 445,135.150 147,914.277 584,055.737JPM Global Capital Preservation (EUR) A (inc) - EUR 20,519.145 113,153.235 24,779.387 108,892.993JPM Global Capital Preservation (EUR) B (acc) - EUR 26,657.330 62,031.302 64,376.163 24,312.469JPM Global Capital Preservation (EUR) C (acc) - EUR 203,310.337 300,720.968 377,042.987 126,988.318JPM Global Capital Preservation (EUR) D (acc) - EUR 9,000,257.848 4,712,477.313 6,499,296.333 7,213,438.828JPM Global Capital Preservation (EUR) D (acc) - SEK (hedged) - 202,148.856 2,335.644 199,813.212JPM Global Capital Preservation (EUR) I (acc) - EUR - 376,494.000 93,021.000 283,473.000JPM Global Capital Preservation (EUR) I (inc) - EUR 523,616.234 418,236.010 839,474.149 102,378.095JPM Global Capital Preservation (EUR) X (acc) - EUR 978,296.996 655,236.892 1,446,536.379 186,997.509
JPMorgan Investment Funds - Global Capital Preservation Fund (USD)JPM Global Capital Preservation (USD) A (acc) - USD 256,549.993 479,055.271 297,905.286 437,699.978JPM Global Capital Preservation (USD) D (acc) - USD 223,365.250 208,530.159 241,203.533 190,691.876JPM Global Capital Preservation (USD) X (acc) - USD 8,334.239 - 2,071.126 6,263.113
JPMorgan Investment Funds - Global Convertibles Fund (USD)JPM Global Convertibles (USD) A (acc) - USD 1,174,955.684 1,304,157.945 1,366,162.698 1,112,950.931JPM Global Convertibles (USD) B (acc) - USD - 40,633.619 633.619 40,000.000JPM Global Convertibles (USD) D (acc) - USD 168,854.472 373,446.087 249,400.504 292,900.055JPM Global Convertibles (USD) I (acc) - USD 88,334.000 35,322.000 59,059.000 64,597.000JPM Global Convertibles (USD) X (acc) - USD* 83,364.000 23,498.000 106,862.000 -
JPMorgan Investment Funds - Global Dividend FundJPM Global Dividend A (acc) - USD 7,500.000 - - 7,500.000JPM Global Dividend A (acc) - EUR (hedged) 7,442.598 1,166.178 - 8,608.776JPM Global Dividend D (acc) - USD 7,500.000 910.561 220.669 8,189.892JPM Global Dividend D (acc) - EUR (hedged) 7,442.598 1,813.048 686.579 8,569.067
JPMorgan Investment Funds - Global Enhanced Bond FundJPM Global Enhanced Bond A (acc) - EUR 962,963.395 177,724.254 936,581.343 204,106.306JPM Global Enhanced Bond A (inc) - EUR 103.392 15.990 64.664 54.718JPM Global Enhanced Bond B (acc) - EUR 4,319.054 - - 4,319.054JPM Global Enhanced Bond C (acc) - EUR 178,091.773 4.291 111,392.069 66,703.995JPM Global Enhanced Bond D (acc) - EUR 154,361.824 12,432.660 117,086.917 49,707.567JPM Global Enhanced Bond X (acc) - EUR 55,673.842 16.591 53,617.716 2,072.717
JPMorgan Investment Funds - Global ex-US Bond Fund (4)JPM Global ex-US Bond A (acc) - USD 167,717.153 7,655.949 175,373.102 -JPM Global ex-US Bond B (acc) - USD 11,833.584 - 11,833.584 -JPM Global ex-US Bond D (acc) - USD 4,499.407 685.041 5,184.448 -JPM Global ex-US Bond X (acc) - USD 379,174.033 2,213.803 381,387.836 -
(4) This Sub-Fund was liquidated on 15 September 2008.
199

JPMorgan Investment Funds
Appendix - Unaudited Additional Disclosures (continued)
Shares Outstandingat the Beginning
of the Year
Shares Subscribed Shares Redeemed Shares Outstandingat the End
of the Year
11. Historical Statement of Changes in the Number of Shares - for the year ended 31 December 2008 (continued)JPMorgan Investment Funds - Global ex-US Select Small Cap FundJPM Global ex-US Select Small Cap A (acc) - EUR 165,971.814 92,950.815 166,246.051 92,676.578JPM Global ex-US Select Small Cap A (dist) - EUR 491.238 196.498 28.568 659.168JPM Global ex-US Select Small Cap B (acc) - EUR 2,033.000 124.895 1,987.895 170.000JPM Global ex-US Select Small Cap C (acc) - EUR 12,730.203 5,167.750 11,730.000 6,167.953JPM Global ex-US Select Small Cap D (acc) - EUR 46,872.465 5,923.637 21,491.271 31,304.831
JPMorgan Investment Funds - Global Financials FundJPM Global Financials A (acc) - USD 963,261.037 952,725.752 1,000,133.638 915,853.151JPM Global Financials A (acc) - EUR 20,154.980 60,040.938 51,142.256 29,053.662JPM Global Financials A (dist) - USD 330.357 10,638.494 3,109.711 7,859.140JPM Global Financials B (acc) - USD 18,900.924 252,603.060 262,597.658 8,906.326JPM Global Financials C (acc) - USD 18,804.000 1,197,420.787 605,567.025 610,657.762JPM Global Financials D (acc) - USD 82,008.484 59,635.746 73,817.118 67,827.112JPM Global Financials X (acc) - USD 11,518.658 2,579.960 3,160.000 10,938.618
JPMorgan Investment Funds - Global Healthtech FundJPM Global Healthtech A (acc) - USD 315,876.920 112,379.259 324,395.794 103,860.385JPM Global Healthtech A (dist) - USD 620.000 43.804 613.804 50.000JPM Global Healthtech B (acc) - USD 947.700 16,208.000 8,564.807 8,590.893JPM Global Healthtech C (acc) - USD 15,486.295 235,748.607 250,834.299 400.603JPM Global Healthtech D (acc) - USD 50,186.429 9,880.853 26,679.540 33,387.742
JPMorgan Investment Funds - Global High Yield Bond Fund (5)JPM Global High Yield Bond A (acc) - EUR (hedged) 481,167.189 1,163,996.906 1,249,278.043 395,886.052JPM Global High Yield Bond A (inc) - EUR (hedged) 6,901.390 211,640.467 133,147.178 85,394.679JPM Global High Yield Bond B (acc) - EUR (hedged) 11,863.057 66,889.369 69,789.696 8,962.730JPM Global High Yield Bond C (acc) - EUR (hedged) 790,179.664 459,341.332 832,900.363 416,620.633JPM Global High Yield Bond D (acc) - EUR (hedged) 174,004.523 92,387.365 180,344.301 86,047.587JPM Global High Yield Bond I (inc) - EUR (hedged) - 131,000.000 - 131,000.000JPM Global High Yield Bond X (acc) - EUR (hedged) 88,242.703 6,262.791 57,999.624 36,505.870JPM Global High Yield Bond A (acc) - USD - 189,148.053 81,617.537 107,530.516JPM Global High Yield Bond A (mth) - USD - 2,020.434 660.714 1,359.720JPM Global High Yield Bond C (acc) - USD - 160,960.898 158,810.898 2,150.000
JPMorgan Investment Funds - Global Income Fund (6)JPM Global Income A (div) - EUR - 116,054.160 - 116,054.160
JPMorgan Investment Funds - Global Select 130/30 Fund (7)JPM Global Select 130/30 A (acc) - USD 392,648.107 154,478.593 368,633.185 178,493.515JPM Global Select 130/30 A (acc) - EUR - 642.508 - 642.508JPM Global Select 130/30 A (dist) - USD 514.111 3.651 - 517.762JPM Global Select 130/30 C (acc) - USD 1,117.113 - 550.975 566.138JPM Global Select 130/30 D (acc) - USD 140,610.354 50,279.108 122,173.011 68,716.451
JPMorgan Investment Funds - Global Select Equity FundJPM Global Select Equity A (acc) - USD 416,781.099 153,755.100 379,535.388 191,000.811JPM Global Select Equity A (dist) - USD 430.000 756.359 657.895 528.464JPM Global Select Equity B (acc) - USD 16,650.869 31,769.368 9,450.578 38,969.659JPM Global Select Equity C (acc) - USD 19,393.217 1,779,048.356 1,296,013.016 502,428.557JPM Global Select Equity D (acc) - USD 80,017.111 48,256.377 65,340.615 62,932.873JPM Global Select Equity X (acc) - USD 565,545.592 1,340.003 188,000.761 378,884.834
JPMorgan Investment Funds - Global Short Duration FundJPM Global Short Duration A (acc) - USD 368,623.811 7,602.041 362,707.714 13,518.138JPM Global Short Duration B (acc) - USD* 92,944.753 - 92,944.753 -JPM Global Short Duration C (acc) - USD 322,811.321 1,200.000 98,480.814 225,530.507JPM Global Short Duration D (acc) - USD 21,651.558 18,014.900 28,818.650 10,847.808JPM Global Short Duration X (acc) - USD* 689,535.523 5,385.923 694,921.446 -
JPMorgan Investment Funds - Global Teletech FundJPM Global Teletech A (acc) - USD 842,121.733 204,659.567 884,395.336 162,385.964JPM Global Teletech A (dist) - USD 145.928 90.076 38.443 197.561JPM Global Teletech B (acc) - USD 21,834.768 35.936 20,286.651 1,584.053JPM Global Teletech C (acc) - USD - 270,128.334 267,586.255 2,542.079JPM Global Teletech D (acc) - USD 43,707.109 8,877.567 24,016.934 28,567.742
JPMorgan Investment Funds - Global Total Return Fund (8)JPM Global Total Return A (acc) - EUR 1,215,250.957 23,332.763 706,983.013 531,600.707JPM Global Total Return A (dist) - EUR 165.481 - 77.930 87.551JPM Global Total Return A (inc) - EUR 89.650 - - 89.650JPM Global Total Return B (acc) - EUR 675.680 393.713 393.713 675.680JPM Global Total Return C (acc) - EUR 79,770.826 3,674.781 74,072.567 9,373.040JPM Global Total Return D (acc) - EUR 1,104,973.496 20,572.475 547,938.244 577,607.727
(5) This Sub-Fund changed its currency to USD on 1 August 2008.(6) This Sub-Fund was launched on 11 December 2008.(7) This Sub-Fund changed its name from Global 50 Equity Fund on 26 March 2008.(8) This Sub-Fund changed its name from Global Total Return Fund (EUR) on 30 June 2008.
200

JPMorgan Investment Funds
Appendix - Unaudited Additional Disclosures (continued)
Shares Outstandingat the Beginning
of the Year
Shares Subscribed Shares Redeemed Shares Outstandingat the End
of the Year
11. Historical Statement of Changes in the Number of Shares - for the year ended 31 December 2008 (continued)JPMorgan Investment Funds - Global Total Return Fund (USD) (9)JPM Global Total Return (USD) A (acc) - USD 7,201.183 - 7,201.183 -JPM Global Total Return (USD) A (dist) - USD 50.943 - 50.943 -JPM Global Total Return (USD) B (acc) - USD 4,999.999 - 4,999.999 -JPM Global Total Return (USD) D (acc) - USD 4,420.338 - 4,420.338 -
JPMorgan Investment Funds - Highbridge Statistical Market Neutral FundJPM Highbridge Statistical Market Neutral A (acc) - EUR 8,961,629.375 9,883,126.070 10,445,484.049 8,399,271.396JPM Highbridge Statistical Market Neutral A (acc) - SEK (hedged) - 73,017.512 16,827.914 56,189.598JPM Highbridge Statistical Market Neutral A (acc) - USD 290,093.538 509,052.492 541,283.509 257,862.521JPM Highbridge Statistical Market Neutral A (acc) - USD (hedged) - 375,635.172 80,717.695 294,917.477JPM Highbridge Statistical Market Neutral A (dist) - GBP 318,583.443 97,360.534 331,018.212 84,925.765JPM Highbridge Statistical Market Neutral A (dist) - GBP (hedged) - 435,237.595 42,295.002 392,942.593JPM Highbridge Statistical Market Neutral A (inc) - EUR 66,777.132 58,790.364 47,462.427 78,105.069JPM Highbridge Statistical Market Neutral B (acc) - EUR 127,647.375 1,758,645.641 1,082,561.681 803,731.335JPM Highbridge Statistical Market Neutral B (acc) - USD - 1,906.214 - 1,906.214JPM Highbridge Statistical Market Neutral C (acc) - EUR 3,979,962.360 7,789,642.784 8,297,900.535 3,471,704.609JPM Highbridge Statistical Market Neutral C (dist) - GBP (hedged) - 430,660.965 20,435.362 410,225.603JPM Highbridge Statistical Market Neutral D (acc) - EUR 9,495,536.762 5,378,366.423 4,754,128.778 10,119,774.407JPM Highbridge Statistical Market Neutral D (acc) - USD 13,146.401 117,624.742 84,139.228 46,631.915JPM Highbridge Statistical Market Neutral D (acc) - USD (hedged) - 46,217.000 747.905 45,469.095JPM Highbridge Statistical Market Neutral I (acc) - EUR 1,905,496.326 635,698.746 1,747,425.856 793,769.216JPM Highbridge Statistical Market Neutral X (acc) - EUR 122,924.171 44,872.249 73,170.913 94,625.507
JPMorgan Investment Funds - Income Opportunity Fund (10)JPM Income Opportunity A (acc) - EUR 46,098.232 991,445.012 480,004.323 557,538.921JPM Income Opportunity A (acc) - USD (hedged) - 23,945.584 11,037.074 12,908.510JPM Income Opportunity A (dist) - GBP (hedged) - 547,411.312 113,015.093 434,396.219JPM Income Opportunity A (inc) - EUR* 36,779.770 18,993.292 55,773.062 -JPM Income Opportunity C (acc) - EUR - 1,051,942.537 825,892.499 226,050.038JPM Income Opportunity D (acc) - EUR 46,078.837 82,250.047 82,803.752 45,525.132JPM Income Opportunity D (inc) - EUR* 36,287.100 - 36,287.100 -
JPMorgan Investment Funds - Japan 50 Equity FundJPM Japan 50 Equity A (acc) - EUR 14,020.477 365,446.441 103,915.309 275,551.609JPM Japan 50 Equity A (acc) - JPY 295,838.031 1,341,687.750 1,419,029.473 218,496.308JPM Japan 50 Equity A (dist) - JPY 5,543.400 2,418.654 5,854.024 2,108.030JPM Japan 50 Equity D (acc) - JPY 6,891.078 6,833.598 10,089.769 3,634.907JPM Japan 50 Equity I (acc) - JPY 3,904,448.663 477,751.772 380,097.000 4,002,103.435JPM Japan 50 Equity X (acc) - JPY 1,536,200.706 656,629.823 1,250,925.937 941,904.592
JPMorgan Investment Funds - Japan Behavioural Finance Equity FundJPM Japan Behavioural Finance Equity A (acc) - EUR 609,959.032 165,868.475 518,773.216 257,054.291JPM Japan Behavioural Finance Equity A (acc) - USD 51,209.878 263,680.357 145,379.477 169,510.758JPM Japan Behavioural Finance Equity A (dist) - USD 13,903.611 57,183.858 12,552.595 58,534.874JPM Japan Behavioural Finance Equity C (acc) - USD 56,000.000 79,757.277 96,187.087 39,570.190JPM Japan Behavioural Finance Equity D (acc) - EUR 25,364.349 798.559 25,817.347 345.561JPM Japan Behavioural Finance Equity D (acc) - USD* 25,000.000 - 25,000.000 -JPM Japan Behavioural Finance Equity I (inc) - EUR* 170,000.000 60,392.685 230,392.685 -JPM Japan Behavioural Finance Equity X (acc) - USD 154,496.360 56,200.574 35,730.441 174,966.493
JPMorgan Investment Funds - Japan Focus Fund (11)JPM Japan Focus A (acc) - JPY - 642,746.038 263,685.700 379,060.338JPM Japan Focus D (acc) - JPY - 27,449.242 338.182 27,111.060JPM Japan Focus I (acc) - JPY - 666,719.092 - 666,719.092JPM Japan Focus X (acc) - JPY - 7,852.000 327.000 7,525.000
JPMorgan Investment Funds - Japan Select Equity FundJPM Japan Select Equity A (acc) - JPY 6,374,104.274 6,488,098.586 7,198,275.841 5,663,927.019JPM Japan Select Equity A (dist) - JPY 32,966.386 10,815.140 25,319.959 18,461.567JPM Japan Select Equity B (acc) - JPY 324,449.705 252,431.526 359,841.700 217,039.531JPM Japan Select Equity C (acc) - JPY 1,592,991.575 2,338,763.883 1,924,698.908 2,007,056.550JPM Japan Select Equity D (acc) - JPY 765,192.964 44,104.817 528,396.266 280,901.515JPM Japan Select Equity I (acc) - JPY 787,429.714 - 471,187.479 316,242.235JPM Japan Select Equity X (acc) - JPY 2,642,652.337 806,774.700 1,712,874.092 1,736,552.945
JPMorgan Investment Funds - Japan Strategic Value FundJPM Japan Strategic Value A (acc) - EUR 22,014.211 98,933.000 - 120,947.211JPM Japan Strategic Value A (acc) - JPY 21,528.842 - - 21,528.842JPM Japan Strategic Value A (dist) - GBP 22,119.574 - - 22,119.574JPM Japan Strategic Value D (acc) - EUR 22,014.211 - - 22,014.211JPM Japan Strategic Value D (acc) - JPY 21,528.842 730.095 336.625 21,922.312
(9) This Sub-Fund was liquidated on 23 January 2008.(10) This Sub-Fund changed its name from Highbridge Income Opportunity Fund on 15 July 2008.(11) This Sub-Fund was launched on 15 February 2008.
201

JPMorgan Investment Funds
Appendix - Unaudited Additional Disclosures (continued)
Shares Outstandingat the Beginning
of the Year
Shares Subscribed Shares Redeemed Shares Outstandingat the End
of the Year
11. Historical Statement of Changes in the Number of Shares - for the year ended 31 December 2008 (continued)JPMorgan Investment Funds - JF Asia ex-Japan Fund (12)JF Asia ex-Japan A (acc) - USD 1,884,998.195 954,132.148 1,902,915.324 936,215.019JF Asia ex-Japan A (dist) - USD 28,672.246 64,959.486 34,825.916 58,805.816JF Asia ex-Japan B (acc) - USD 144,367.778 69,353.675 161,455.799 52,265.654JF Asia ex-Japan C (acc) - USD 600,262.426 538,229.080 523,266.378 615,225.128JF Asia ex-Japan D (acc) - USD 365,614.994 70,846.367 222,360.520 214,100.841JF Asia ex-Japan I (acc) - USD 1,520,321.652 1,686,251.239 607,505.871 2,599,067.020JF Asia ex-Japan X (acc) - USD 302,239.754 63,472.703 267,456.714 98,255.743
JPMorgan Investment Funds - US Bond FundJPM US Bond A (acc) - USD 1,467,364.334 66,358.319 1,143,142.443 390,580.210JPM US Bond A (inc) - USD 5,794.760 210.000 3,387.760 2,617.000JPM US Bond B (acc) - USD 135,487.710 774.586 129,129.239 7,133.057JPM US Bond C (acc) - USD 471,590.355 32,033.858 501,636.087 1,988.126JPM US Bond D (acc) - USD 613,481.238 97,235.961 552,156.125 158,561.074JPM US Bond X (acc) - USD* 3,268,414.513 - 3,268,414.513 -
JPMorgan Investment Funds - US Disciplined Equity FundJPM US Disciplined Equity A (acc) - USD 186,526.008 7,175.498 173,995.979 19,705.527JPM US Disciplined Equity A (dist) - USD 50.000 - - 50.000JPM US Disciplined Equity A (inc) - USD* 613,752.433 - 613,752.433 -JPM US Disciplined Equity B (acc) - USD 2,410.000 3,178.072 2,642.439 2,945.633JPM US Disciplined Equity C (acc) - USD 137,527.515 9,459.236 146,701.141 285.610JPM US Disciplined Equity D (acc) - USD 92,998.969 54,153.888 65,912.437 81,240.420JPM US Disciplined Equity X (acc) - USD - 1,525.361 288.277 1,237.084
JPMorgan Investment Funds - US Dollar Enhanced Yield Fund (13)JPM US Dollar Enhanced Yield A (acc) - USD 176,134.341 19,111.964 195,246.305 -JPM US Dollar Enhanced Yield B (acc) - USD 5,283.718 635.073 5,918.791 -JPM US Dollar Enhanced Yield C (acc) - USD 19,723.782 - 19,723.782 -JPM US Dollar Enhanced Yield D (acc) - USD 103,706.361 8,372.351 112,078.712 -JPM US Dollar Enhanced Yield I (acc) - USD 2,919,939.155 1,422.586 2,921,361.741 -JPM US Dollar Enhanced Yield X (acc) - USD 282,640.931 - 282,640.931 -
JPMorgan Investment Funds - US Dynamic Small Cap FundJPM US Dynamic Small Cap A (acc) - USD 177,973.633 48,786.245 68,232.397 158,527.481JPM US Dynamic Small Cap A (dist) - USD 66.294 25.473 80.114 11.653JPM US Dynamic Small Cap D (acc) - USD 18,146.268 5,241.544 11,232.939 12,154.873JPM US Dynamic Small Cap X (acc) - USD 3,980.000 415.000 2,136.000 2,259.000
JPMorgan Investment Funds - US Equity FundJPM US Equity A (acc) - USD 29,196.347 278,942.000 153,473.598 154,664.749JPM US Equity A (acc) - EUR (hedged) 176,354.531 25,736.705 85,195.690 116,895.546JPM US Equity C (acc) - USD 53,343.730 24,882.682 34,307.947 43,918.465JPM US Equity D (acc) - USD 2,234.584 6,365.731 2,934.672 5,665.643JPM US Equity D (acc) - EUR (hedged) 56,303.728 39,090.003 90,505.053 4,888.678JPM US Equity X (acc) - USD 20,566.000 1,132.000 3,276.461 18,421.539
JPMorgan Investment Funds - US Market Neutral FundJPM US Market Neutral A (acc) - USD 34,156.442 5,938.343 2,263.328 37,831.457JPM US Market Neutral A (acc) - EUR (hedged) 83,457.274 416,237.275 229,363.990 270,330.559JPM US Market Neutral A (dist) - USD 33,330.000 - - 33,330.000JPM US Market Neutral A (dist) - GBP 33,319.437 1,726.000 1,550.000 33,495.437JPM US Market Neutral D (acc) - USD 34,500.499 9,316.443 2,813.976 41,002.966JPM US Market Neutral D (acc) - EUR (hedged) 34,290.305 28,815.626 16,773.857 46,332.074JPM US Market Neutral X (acc) - USD 57,300.000 38,355.000 15,755.859 79,899.141
JPMorgan Investment Funds - US Select Equity FundJPM US Select Equity A (acc) - EUR - 155,335.144 26,764.020 128,571.124JPM US Select Equity A (acc) - USD 966,840.875 2,840,557.726 1,361,920.310 2,445,478.291JPM US Select Equity A (acc) - EUR (hedged) 377,857.697 1,087,626.963 793,720.024 671,764.636JPM US Select Equity A (dist) - USD 580,591.000 1,351,782.377 961,899.343 970,474.034JPM US Select Equity B (acc) - USD 41,266.375 106,437.263 87,488.624 60,215.014JPM US Select Equity C (acc) - USD 246,358.343 1,406,189.815 684,378.056 968,170.102JPM US Select Equity C (acc) - EUR (hedged) - 120,197.812 15,044.248 105,153.564JPM US Select Equity D (acc) - USD 16,115.872 53,083.115 26,107.406 43,091.581JPM US Select Equity D (acc) - EUR (hedged) 6,621.932 155,453.859 39,896.363 122,179.428JPM US Select Equity I (acc) - USD 761,977.493 109,805.000 592,948.946 278,833.547JPM US Select Equity X (acc) - USD 430,573.443 77,060.227 395,833.728 111,799.942
* Share Class inactive as at end of the year.(12) This Sub-Fund changed its name from JF Asia Diversified Fund on 31 March 2008.(13) This Sub-Fund was liquidated on 8 December 2008.
202

JPMorgan Investment Funds
Appendix - Unaudited Additional Disclosures (continued)
Shares Outstanding at theBeginning of the Year
Shares Subscribed Shares Redeemed Shares Outstanding at theEnd of the Year
12. Historical Statement of Changes in the Number of Shares - for the year ended 31 December 2007 (continued)JPMorgan Investment Funds - Asset-Backed Fund (EUR)JPM Asset-Backed (EUR) A (acc) - EUR 38,893.846 153,130.171 124,871.393 67,152.624JPM Asset-Backed (EUR) D (acc) - EUR 39,142.010 14,254.472 9,716.525 43,679.957JPM Asset-Backed (EUR) X (acc) - EUR 250.000 - - 250.000
JPMorgan Investment Funds - Blue and Green FundJPM Blue and Green Fund 3,449.615 - - 3,449.615
JPMorgan Investment Funds - Euro Liquid Market FundJPM Euro Liquid Market A (acc) - EUR 148,528.323 530,098.452 365,703.106 312,923.669JPM Euro Liquid Market C (acc) - EUR - 45,650.000 12,050.000 33,600.000JPM Euro Liquid Market X (acc) - EUR 136,411.228 11,900.625 - 148,311.853
JPMorgan Investment Funds - Europe Bond FundJPM Europe Bond A (acc) - EUR 5,360,084.508 2,196,038.431 5,670,051.584 1,886,071.355JPM Europe Bond A (inc) - EUR 277,401.171 67,555.378 141,600.398 203,356.151JPM Europe Bond B (acc) - EUR 354,881.288 101,037.361 330,773.581 125,145.068JPM Europe Bond C (acc) - EUR 1,362,420.355 138,167.648 901,974.074 598,613.929JPM Europe Bond D (acc) - EUR 402,117.633 127,941.697 348,280.204 181,779.126JPM Europe Bond X (acc) - EUR 1,503,230.293 101,622.871 1,235,207.096 369,646.068
JPMorgan Investment Funds - Europe Corporate Bond FundJPM Europe Corporate Bond A (acc) - EUR 97,210.259 58,947.456 65,392.572 90,765.143JPM Europe Corporate Bond C (acc) - EUR 25,639.973 6,000.006 25,639.973 6,000.006JPM Europe Corporate Bond D (acc) - EUR 14,570.547 15,066.949 17,483.086 12,154.410JPM Europe Corporate Bond X (acc) - EUR 2,861.334 - 2,861.334 -
JPMorgan Investment Funds - Europe Recovery FundJPM Europe Recovery A (acc) - EUR 3,043,691.965 202,906.731 1,378,989.227 1,867,609.469JPM Europe Recovery A (dist) - EUR 806,048.341 105,464.557 329,263.190 582,249.708JPM Europe Recovery B (acc) - EUR 22,489.512 12,828.754 8,987.716 26,330.550JPM Europe Recovery C (acc) - EUR 75,491.285 66,945.611 67,293.190 75,143.706JPM Europe Recovery D (acc) - EUR 121,959.646 4,558.615 73,919.002 52,599.259JPM Europe Recovery X (acc) - EUR 57,666.992 288.076 25,337.367 32,617.701
JPMorgan Investment Funds - Europe Select Equity FundJPM Europe Select Equity A (acc) - EUR 43,180.695 382,771.340 254,461.372 171,490.663JPM Europe Select Equity A (acc) - USD - 34.860 - 34.860JPM Europe Select Equity A (dist) - EUR 1,492.063 90,169.441 37,428.144 54,233.360JPM Europe Select Equity B (acc) - EUR - 111,617.617 22,344.005 89,273.612JPM Europe Select Equity C (acc) - EUR - 648,148.712 380,939.475 267,209.237JPM Europe Select Equity D (acc) - EUR - 553,733.560 (512,369.276) 41,364.284JPM Europe Select Equity D (acc) - USD - 34.860 - 34.860JPM Europe Select Equity X (acc) - EUR 84,277.551 1,291,369.812 1,089,050.026 286,597.337JPM Europe Select Equity X (acc) - EUR (hedged) - 849,133.091 (2,994.728) 846,138.363
JPMorgan Investment Funds - Europe Select Mega Cap Fund (1)JPM Europe Select Mega Cap A (acc) - EUR 206,194.062 188,843.248 128,821.907 266,215.403JPM Europe Select Mega Cap A (dist) - EUR 38.718 44.444 - 83.162JPM Europe Select Mega Cap B (acc) - EUR 17,275.934 30,756.852 29,027.436 19,005.350JPM Europe Select Mega Cap C (acc) - EUR 6,539.782 27,166.524 14,298.983 19,407.323JPM Europe Select Mega Cap D (acc) - EUR 70,097.505 182,551.163 158,250.330 94,398.338JPM Europe Select Mega Cap X (acc) - EUR 46,479.308 8,956.470 - 55,435.778
JPMorgan Investment Funds - Europe Short Duration FundJPM Europe Short Duration A (acc) - EUR 786,944.006 1,676,961.251 1,682,010.949 781,894.308JPM Europe Short Duration B (acc) - EUR 73,336.073 7,902.000 48,579.142 32,658.931JPM Europe Short Duration C (acc) - EUR 90,071.422 108,583.619 107,564.857 91,090.184JPM Europe Short Duration D (acc) - EUR 83,196.054 618,621.030 525,631.320 176,185.764JPM Europe Short Duration X (acc) - EUR 543,740.933 17,657.427 87,089.429 474,308.931
JPMorgan Investment Funds - Europe Strategic Dividend FundJPM Europe Strategic Dividend A (acc) - EUR 766,313.455 770,385.274 632,020.177 904,678.552JPM Europe Strategic Dividend A (dist) - EUR 38.718 3,960.782 525.787 3,473.713JPM Europe Strategic Dividend A (inc) - EUR - 4,719.000 770.000 3,949.000JPM Europe Strategic Dividend C (acc) - EUR - 157,552.747 134,517.721 23,035.026JPM Europe Strategic Dividend D (acc) - EUR 94,470.289 214,960.185 132,921.504 176,508.970JPM Europe Strategic Dividend X (acc) - EUR - 9,356.100 - 9,356.100
JPMorgan Investment Funds - Flexible Bond Fund (2)JPM Flexible Bond (EUR) A (acc) - EUR - 42,530.241 3,670.005 38,860.236JPM Flexible Bond (EUR) D (acc) - EUR - 72,460.866 16,982.648 55,478.218
JPMorgan Investment Funds - Global 50 Equity FundJPM Global 50 Equity A (acc) - USD 349,994.469 528,017.360 485,363.722 392,648.107JPM Global 50 Equity A (dist) - USD 512.577 1.534 - 514.111JPM Global 50 Equity C (acc) - USD 6,294.113 43,340.600 48,517.600 1,117.113JPM Global 50 Equity D (acc) - USD 82,227.139 129,335.358 70,952.143 140,610.354JPM Global 50 Equity X (acc) - USD - 2,897.190 2,897.190 -
(1) This Sub-Fund changed its name from Europe Select Large Cap on 1 November 2007.(2) This Sub-Fund was launched on 24 April 2007.
203

JPMorgan Investment Funds
Appendix - Unaudited Additional Disclosures (continued)
Shares Outstanding at theBeginning of the Year
Shares Subscribed Shares Redeemed Shares Outstanding at theEnd of the Year
12. Historical Statement of Changes in the Number of Shares - for the year ended 31 December 2007 (continued)JPMorgan Investment Funds - Global Balanced Fund (EUR)JPM Global Balanced (EUR) A (acc) - EUR 87,785.107 107,257.041 100,179.776 94,862.372JPM Global Balanced (EUR) A (dist) - EUR 38.718 8,958.597 2.000 8,995.315JPM Global Balanced (EUR) B (acc) - EUR 25,661.938 2,137.954 6,343.185 21,456.707JPM Global Balanced (EUR) C (acc) - EUR 72,886.593 60,814.041 105,947.873 27,752.761JPM Global Balanced (EUR) D (acc) - EUR 180,748.810 408,584.558 210,029.439 379,303.929
JPMorgan Investment Funds - Global Balanced Fund (USD)JF Global Balanced (USD) A (acc) - USD 11,606.090 9,404.932 6,899.817 14,111.205JPM Global Balanced (USD) A (acc) - USD 1,317,559.795 255,402.776 484,615.530 1,088,347.041JPM Global Balanced (USD) A (dist) - USD 50.000 120.805 120.805 50.000JPM Global Balanced (USD) B (acc) - USD 588,121.004 - 119,567.492 468,553.512JPM Global Balanced (USD) C (acc) - USD 157,177.507 205.000 - 157,382.507JPM Global Balanced (USD) D (acc) - USD 60,497.178 88,633.844 33,262.331 115,868.691JPM Global Balanced (USD) X (acc) - USD 1,582,928.290 31,160.374 198,262.523 1,415,826.141
JPMorgan Investment Funds - Global Bond Fund (EUR)JPM Global Bond (EUR) A (acc) - EUR 4,411,443.618 4,528,228.054 5,107,129.507 3,832,542.165JPM Global Bond (EUR) A (inc) - EUR 53,756.718 349,273.726 46,248.050 356,782.394JPM Global Bond (EUR) B (acc) - EUR 645,255.200 183,735.242 465,421.160 363,569.282JPM Global Bond (EUR) C (acc) - EUR 932,426.220 765,779.840 1,333,719.264 364,486.796JPM Global Bond (EUR) D (acc) - EUR 343,272.044 335,203.314 317,211.452 361,263.906JPM Global Bond (EUR) X (acc) - EUR 489,023.040 467,950.859 473,077.155 483,896.744
JPMorgan Investment Funds - Global Bond Fund (USD)JF Global Bond (USD) A (acc) - USD 180,056.503 144,376.280 139,814.676 184,618.107JPM Global Bond (USD) A (acc) - USD 2,196,852.675 1,145,825.379 2,147,839.633 1,194,838.421JPM Global Bond (USD) B (acc) - USD 547,739.534 23,720.121 389,459.976 181,999.679JPM Global Bond (USD) C (acc) - USD 269,157.912 509,649.293 364,824.097 413,983.108JPM Global Bond (USD) D (acc) - USD 87,308.984 72,967.793 54,279.589 105,997.188JPM Global Bond (USD) X (acc) - USD 1,252,658.022 151,843.918 843,828.626 560,673.314
JPMorgan Investment Funds - Global Capital Appreciation FundJPM Global Capital Appreciation A (acc) - EUR 386,080.496 484,315.036 416,417.248 453,978.284JPM Global Capital Appreciation A (dist) - EUR 38.945 493.915 1.000 531.860JPM Global Capital Appreciation A (inc) - EUR 38.945 4,606.041 2.000 4,642.986JPM Global Capital Appreciation B (acc) - EUR 434.450 - - 434.450JPM Global Capital Appreciation C (acc) - EUR 15,239.259 671,967.833 412,118.422 275,088.670JPM Global Capital Appreciation D (acc) - EUR 681,618.872 689,149.301 460,036.086 910,732.087JPM Global Capital Appreciation X (acc) - EUR 807,970.008 470,455.401 799,920.008 478,505.401
JPMorgan Investment Funds - Global Capital Preservation Fund (EUR)JPM Global Capital Preservation (EUR) A (acc) - EUR 1,181,910.800 1,001,485.027 1,161,919.251 1,021,476.576JPM Global Capital Preservation (EUR) A (acc) - USD 5,748.622 102,612.197 15,686.590 92,674.229JPM Global Capital Preservation (EUR) A (dist) - EUR 110,548.522 218,178.342 41,892.000 286,834.864JPM Global Capital Preservation (EUR) A (inc) - EUR 3,767.739 18,242.846 1,491.440 20,519.145JPM Global Capital Preservation (EUR) B (acc) - EUR 34,009.313 1,662.985 9,014.968 26,657.330JPM Global Capital Preservation (EUR) C (acc) - EUR 228,146.489 116,182.140 141,018.292 203,310.337JPM Global Capital Preservation (EUR) D (acc) - EUR 7,946,544.931 4,872,064.264 3,818,351.347 9,000,257.848JPM Global Capital Preservation (EUR) I (inc) - EUR 75,012.519 1,947,278.237 1,498,674.522 523,616.234JPM Global Capital Preservation (EUR) X (acc) - EUR 120,854.322 980,636.764 123,194.090 978,296.996
JPMorgan Investment Funds - Global Capital Preservation Fund (USD)JPM Global Capital Preservation (USD) A (acc) - USD 272,296.841 146,568.381 162,315.229 256,549.993JPM Global Capital Preservation (USD) B (acc) - USD 50,170.154 - 50,170.154 -JPM Global Capital Preservation (USD) C (acc) - USD 169,825.168 - 169,825.168 -JPM Global Capital Preservation (USD) D (acc) - USD 144,348.847 155,272.265 76,255.862 223,365.250JPM Global Capital Preservation (USD) X (acc) - USD 9,320.803 - 986.564 8,334.239
JPMorgan Investment Funds - Global Convertibles Fund (USD)JPM Global Convertibles (USD) A (acc) - USD 435,496.043 1,243,457.768 503,998.127 1,174,955.684JPM Global Convertibles (USD) D (acc) - USD 66,025.083 174,079.588 71,250.199 168,854.472JPM Global Convertibles (USD) I (acc) - USD - 225,501.000 137,167.000 88,334.000JPM Global Convertibles (USD) X (acc) - USD 26,513.000 56,851.000 - 83,364.000
JPMorgan Investment Funds - Global Dividend Fund (3)JPM Global Dividend A (acc) - EUR (hedged) - 7,442.598 - 7,442.598JPM Global Dividend A (acc) - USD - 7,500.000 - 7,500.000JPM Global Dividend D (acc) - EUR (hedged) - 7,442.598 - 7,442.598JPM Global Dividend D (acc) - USD - 7,500.000 - 7,500.000
JPMorgan Investment Funds - Global Enhanced Bond FundJPM Global Enhanced Bond A (acc) - EUR 1,251,958.193 654,283.568 943,278.366 962,963.395JPM Global Enhanced Bond A (inc) - EUR 38.718 83.674 19.000 103.392JPM Global Enhanced Bond B (acc) - EUR 53,401.959 2,732.833 51,815.738 4,319.054JPM Global Enhanced Bond C (acc) - EUR 315,546.627 4,840.839 142,295.693 178,091.773JPM Global Enhanced Bond D (acc) - EUR 259,266.766 134,201.128 239,106.070 154,361.824JPM Global Enhanced Bond X (acc) - EUR 72,997.527 11,116.317 28,440.002 55,673.842JPM Global Enhanced Bond X (inc) - EUR 300,000.000 - 300,000.000 -
(3) This Sub-Fund was launched on 28 November 2007.
204

JPMorgan Investment Funds
Appendix - Unaudited Additional Disclosures (continued)
Shares Outstanding at theBeginning of the Year
Shares Subscribed Shares Redeemed Shares Outstanding at theEnd of the Year
12. Historical Statement of Changes in the Number of Shares - for the year ended 31 December 2007 (continued)JPMorgan Investment Funds - Global ex-US Bond FundJPM Global ex-US Bond A (acc) - USD 239,783.900 94,041.178 166,107.925 167,717.153JPM Global ex-US Bond B (acc) - USD 31,165.880 578.603 19,910.899 11,833.584JPM Global ex-US Bond D (acc) - USD 5,290.266 3,216.071 4,006.930 4,499.407JPM Global ex-US Bond X (acc) - USD 744,673.565 127,237.750 492,737.282 379,174.033
JPMorgan Investment Funds - Global ex-US Select Small Cap FundJPM Global ex-US Select Small Cap A (acc) - EUR 171,808.937 166,562.201 172,399.324 165,971.814JPM Global ex-US Select Small Cap A (dist) - EUR 38.718 1,337.292 884.772 491.238JPM Global ex-US Select Small Cap B (acc) - EUR 787.454 2,088.000 842.454 2,033.000JPM Global ex-US Select Small Cap C (acc) - EUR 18,817.909 5,704.000 11,791.706 12,730.203JPM Global ex-US Select Small Cap D (acc) - EUR 24,925.232 48,273.153 26,325.920 46,872.465
JPMorgan Investment Funds - Global Financials FundJPM Global Financials A (acc) - USD 1,272,455.761 1,052,898.925 1,362,093.649 963,261.037JPM Global Financials A (acc) - EUR 1,596.401 20,350.919 1,792.340 20,154.980JPM Global Financials A (dist) - USD 50.000 1,726.490 1,446.133 330.357JPM Global Financials B (acc) - USD - 18,900.924 - 18,900.924JPM Global Financials C (acc) - USD 19,268.704 9,300.000 9,764.704 18,804.000JPM Global Financials D (acc) - USD 68,048.252 101,198.247 87,238.015 82,008.484JPM Global Financials X (acc) - USD 19,073.446 3,211.816 10,766.604 11,518.658
JPMorgan Investment Funds - Global Healthtech FundJPM Global Healthtech A (acc) - USD 399,982.562 411,030.638 495,136.280 315,876.920JPM Global Healthtech A (dist) - USD 50.000 570.000 - 620.000JPM Global Healthtech B (acc) - USD 23,904.121 5,121.905 28,078.326 947.700JPM Global Healthtech C (acc) - USD 323.894 17,727.302 2,564.901 15,486.295JPM Global Healthtech D (acc) - USD 66,631.945 24,332.686 40,778.202 50,186.429
JPMorgan Investment Funds - Global High Yield Bond FundJPM Global High Yield Bond A (acc) - EUR 1,208,051.670 1,512,251.305 2,239,135.786 481,167.189JPM Global High Yield Bond A (inc) - EUR 2,992.718 29,302.672 25,394.000 6,901.390JPM Global High Yield Bond B (acc) - EUR 2,394.762 16,028.096 6,559.801 11,863.057JPM Global High Yield Bond C (acc) - EUR 790,358.033 759,154.974 759,333.343 790,179.664JPM Global High Yield Bond D (acc) - EUR 196,705.103 526,988.135 549,688.715 174,004.523JPM Global High Yield Bond I (inc) - EUR - 44,860.000 44,860.000 -JPM Global High Yield Bond X (acc) - EUR - 1,161,611.438 1,073,368.735 88,242.703
JPMorgan Investment Funds - Global Select Equity FundJPM Global Select Equity A (acc) - USD 256,777.976 509,182.494 349,179.371 416,781.099JPM Global Select Equity A (dist) - USD 302.407 1,030.000 902.407 430.000JPM Global Select Equity B (acc) - USD 36,704.908 6,644.690 26,698.729 16,650.869JPM Global Select Equity C (acc) - USD 87,160.324 55,511.544 123,278.651 19,393.217JPM Global Select Equity D (acc) - USD 106,608.256 56,847.562 83,438.707 80,017.111JPM Global Select Equity X (acc) - USD 582,847.334 58,077.621 75,379.363 565,545.592
JPMorgan Investment Funds - Global Short Duration FundJPM Global Short Duration A (acc) - USD 401,477.117 224,977.224 257,830.530 368,623.811JPM Global Short Duration B (acc) - USD 186,864.211 20,889.194 114,808.653 92,944.752JPM Global Short Duration C (acc) - USD 146,858.165 220,839.708 44,886.552 322,811.321JPM Global Short Duration D (acc) - USD 27,276.010 38,214.957 43,839.409 21,651.558JPM Global Short Duration X (acc) - USD 809,203.857 2,814.660 122,482.994 689,535.523
JPMorgan Investment Funds - Global Teletech FundJPM Global Teletech A (acc) - USD 271,744.635 1,038,742.386 468,365.288 842,121.733JPM Global Teletech A (dist) - USD 50.000 295.928 200.000 145.928JPM Global Teletech B (acc) - USD 18,096.154 3,738.614 - 21,834.768JPM Global Teletech D (acc) - USD 29,355.372 55,251.370 40,899.633 43,707.109JPM Global Teletech X (acc) - USD 134,191.043 - 134,191.043 -
JPMorgan Investment Funds - Global Total Return Fund (EUR)JPM Global Total Return (EUR) A (acc) - EUR 3,643,032.385 2,116,725.872 4,544,507.300 1,215,250.957JPM Global Total Return (EUR) A (dist) - EUR 10,821.124 3,835.528 14,491.171 165.481JPM Global Total Return (EUR) A (inc) - EUR 88.945 0.705 - 89.650JPM Global Total Return (EUR) B (acc) - EUR 27,008.229 1,059.340 27,391.889 675.680JPM Global Total Return (EUR) C (acc) - EUR 2,361,680.804 1,202,114.431 3,484,024.409 79,770.826JPM Global Total Return (EUR) D (acc) - EUR 3,915,214.571 411,900.335 3,222,141.410 1,104,973.496JPM Global Total Return (EUR) I (acc) - EUR 30,000.000 - 30,000.000 -
JPMorgan Investment Funds - Global Total Return Fund (USD)JPM Global Total Return (USD) A (acc) - USD 78,916.629 9,530.743 81,246.189 7,201.183JPM Global Total Return (USD) A (dist) - USD 58.226 213.635 220.918 50.943JPM Global Total Return (USD) B (acc) - USD 77,262.259 18,928.516 91,190.776 4,999.999JPM Global Total Return (USD) D (acc) - USD 32,288.109 2,115.463 29,983.234 4,420.338
JPMorgan Investment Funds - Highbridge Income Opportunity Fund (4)JPM Highbridge Income Opportunity A (acc) - EUR - 51,553.302 5,455.070 46,098.232JPM Highbridge Income Opportunity A (inc) - EUR - 36,779.770 - 36,779.770JPM Highbridge Income Opportunity D (acc) - EUR - 46,078.837 - 46,078.837JPM Highbridge Income Opportunity D (inc) - EUR - 36,287.100 - 36,287.100
(4) This Sub-Fund was launched on 19 July 2007.
205

JPMorgan Investment Funds
Appendix - Unaudited Additional Disclosures (continued)
Shares Outstanding at theBeginning of the Year
Shares Subscribed Shares Redeemed Shares Outstanding at theEnd of the Year
12. Historical Statement of Changes in the Number of Shares - for the year ended 31 December 2007 (continued)JPMorgan Investment Funds - Highbridge Statistical Market Neutral FundJPM Highbridge Statistical Market Neutral A (acc) - EUR 767,424.034 42,483,599.412 34,289,394.071 8,961,629.375JPM Highbridge Statistical Market Neutral A (acc) - USD 17,835.017 1,006,735.586 734,477.065 290,093.538JPM Highbridge Statistical Market Neutral A (dist) - GBP - 5,441,028.622 5,122,445.179 318,583.443JPM Highbridge Statistical Market Neutral A (inc) - EUR - 441,221.911 374,444.779 66,777.132JPM Highbridge Statistical Market Neutral B (acc) - EUR - 1,131,067.988 1,003,420.613 127,647.375JPM Highbridge Statistical Market Neutral B (acc) - USD - 88,209.350 88,209.350 -JPM Highbridge Statistical Market Neutral C (acc) - EUR - 19,731,129.460 15,751,167.100 3,979,962.360JPM Highbridge Statistical Market Neutral D (acc) - EUR 62,695.925 18,969,950.469 9,537,109.632 9,495,536.762JPM Highbridge Statistical Market Neutral D (acc) - USD 15,731.928 41,507.049 44,092.576 13,146.401JPM Highbridge Statistical Market Neutral I (acc) - EUR 363,878.731 3,044,193.819 1,502,576.224 1,905,496.326JPM Highbridge Statistical Market Neutral X (acc) - EUR 15,686.000 1,159,685.749 1,052,447.578 122,924.171
JPMorgan Investment Funds - Japan 50 Equity FundJPM Japan 50 Equity A (acc) - EUR - 16,296.680 2,276.203 14,020.477JPM Japan 50 Equity A (acc) - JPY 746,698.309 982,852.087 1,433,712.365 295,838.031JPM Japan 50 Equity A (dist) - JPY 55.337 10,995.980 5,507.917 5,543.400JPM Japan 50 Equity D (acc) - JPY 1,264.061 7,706.432 2,079.415 6,891.078JPM Japan 50 Equity I (acc) - JPY 3,893,656.453 10,792.210 - 3,904,448.663JPM Japan 50 Equity X (acc) - JPY 1,312,039.960 270,041.355 45,880.609 1,536,200.706
JPMorgan Investment Funds - Japan Behavioural Finance Equity Fund (5)JPM Japan Behavioural Finance Equity A (acc) - EUR - 721,593.750 111,634.718 609,959.032JPM Japan Behavioural Finance Equity A (acc) - USD - 52,194.147 984.269 51,209.878JPM Japan Behavioural Finance Equity A (dist) - USD - 13,903.611 - 13,903.611JPM Japan Behavioural Finance Equity C (acc) - USD - 56,000.000 - 56,000.000JPM Japan Behavioural Finance Equity D (acc) - EUR - 25,364.349 - 25,364.349JPM Japan Behavioural Finance Equity D (acc) - USD - 25,000.000 - 25,000.000JPM Japan Behavioural Finance Equity I (inc) - EUR - 170,000.000 - 170,000.000JPM Japan Behavioural Finance Equity X (acc) - USD - 154,738.139 241.779 154,496.360
JPMorgan Investment Funds - Japan Select Equity FundJPM Japan Select Equity A (acc) - JPY 9,754,393.845 10,787,786.596 14,168,076.167 6,374,104.274JPM Japan Select Equity A (dist) - JPY 13,368.457 34,268.565 14,670.636 32,966.386JPM Japan Select Equity B (acc) - JPY 457,824.060 768,609.480 901,983.835 324,449.705JPM Japan Select Equity C (acc) - JPY 2,720,684.661 1,716,885.885 2,844,578.971 1,592,991.575JPM Japan Select Equity D (acc) - JPY 1,258,328.826 1,184,458.148 1,677,594.010 765,192.964JPM Japan Select Equity I (acc) - JPY 302,140.000 1,031,299.350 546,009.636 787,429.714JPM Japan Select Equity X (acc) - JPY 3,345,904.047 121,563.656 824,815.366 2,642,652.337
JPMorgan Investment Funds - Japan Strategic Value Fund (6)JPM Japan Strategic Value A (acc) - EUR - 22,014.211 - 22,014.211JPM Japan Strategic Value A (acc) - JPY - 21,528.842 - 21,528.842JPM Japan Strategic Value A (dist) - GBP - 22,119.574 - 22,119.574JPM Japan Strategic Value D (acc) - EUR - 22,014.211 - 22,014.211JPM Japan Strategic Value D (acc) - JPY - 21,528.842 - 21,528.842
JPMorgan Investment Funds - JF Asia Diversified FundJF Asia Diversified A (acc) - USD 1,442,883.229 2,234,676.038 1,792,561.072 1,884,998.195JF Asia Diversified A (dist) - USD 7,877.719 23,300.378 2,505.851 28,672.246JF Asia Diversified B (acc) - USD 193,182.620 51,850.455 100,665.297 144,367.778JF Asia Diversified C (acc) - USD 455,510.332 318,213.572 173,461.478 600,262.426JF Asia Diversified D (acc) - USD 167,254.521 422,065.764 223,705.291 365,614.994JF Asia Diversified I (acc) - USD 649,062.117 1,182,984.759 311,725.224 1,520,321.652JF Asia Diversified X (acc) - USD 197,907.808 186,082.785 81,750.839 302,239.754
JPMorgan Investment Funds - US Bond FundJPM US Bond A (acc) - USD 2,086,020.538 2,556,709.689 3,175,365.893 1,467,364.334JPM US Bond A (inc) - USD 542.000 7,409.423 2,156.663 5,794.760JPM US Bond B (acc) - USD 462,859.543 84,366.192 411,738.025 135,487.710JPM US Bond C (acc) - USD 1,918,927.938 1,084,070.201 2,531,407.784 471,590.355JPM US Bond D (acc) - USD 456,027.776 499,838.914 342,385.452 613,481.238JPM US Bond I (acc) - USD - 34,000.000 34,000.000 -JPM US Bond X (acc) - USD 4,283,824.370 629,004.075 1,644,413.932 3,268,414.513
JPMorgan Investment Funds - US Disciplined Equity FundJPM US Disciplined Equity A (acc) - USD 829,679.328 124,696.410 767,849.730 186,526.008JPM US Disciplined Equity A (dist) - USD 50.000 - - 50.000JPM US Disciplined Equity A (inc) - USD 613,817.433 0.971 65.971 613,752.433JPM US Disciplined Equity B (acc) - USD 2,410.000 - - 2,410.000JPM US Disciplined Equity C (acc) - USD 167,417.656 96,430.325 126,320.466 137,527.515JPM US Disciplined Equity D (acc) - USD 135,652.241 46,603.225 89,256.497 92,998.969
JPMorgan Investment Funds - US Dollar Enhanced Yield FundJPM US Dollar Enhanced Yield A (acc) - USD 2,502,966.702 1,909,816.707 4,236,649.068 176,134.341JPM US Dollar Enhanced Yield B (acc) - USD 621,260.654 183,989.946 799,966.882 5,283.718JPM US Dollar Enhanced Yield C (acc) - USD 12,832,824.765 2,154,234.306 14,967,335.289 19,723.782JPM US Dollar Enhanced Yield D (acc) - USD 95,192.523 98,543.060 90,029.222 103,706.361JPM US Dollar Enhanced Yield I (acc) - USD 1,000.000 13,894,713.503 10,975,774.348 2,919,939.155JPM US Dollar Enhanced Yield X (acc) - USD 5,681,843.580 3,556,983.983 8,956,186.632 282,640.931
(5) This Sub-Fund was launched on 3 April 2007.(6) This Sub-Fund was launched on 30 November 2007.
206

JPMorgan Investment Funds
Appendix - Unaudited Additional Disclosures (continued)
Shares Outstanding at theBeginning of the Year
Shares Subscribed Shares Redeemed Shares Outstanding at theEnd of the Year
12. Historical Statement of Changes in the Number of Shares - for the year ended 31 December 2007 (continued)JPMorgan Investment Funds - US Dynamic Small Cap FundJPM US Dynamic Small Cap A (acc) - USD 392,121.761 125,100.777 339,248.905 177,973.633JPM US Dynamic Small Cap A (dist) - USD 50.000 16.294 - 66.294JPM US Dynamic Small Cap D (acc) - USD 10,706.410 23,799.832 16,359.974 18,146.268JPM US Dynamic Small Cap X (acc) - USD 85,497.640 175,290.000 256,807.640 3,980.000
JPMorgan Investment Funds - US Equity FundJPM US Equity A (acc) - USD 9,000.000 31,402.691 11,206.344 29,196.347JPM US Equity A (acc) - EUR (hedged) 14,943.524 230,198.130 68,787.123 176,354.531JPM US Equity C (acc) - USD - 69,310.149 15,966.419 53,343.730JPM US Equity D (acc) - USD 1,000.000 2,529.401 1,294.817 2,234.584JPM US Equity D (acc) - EUR (hedged) 14,943.524 87,803.418 46,443.214 56,303.728JPM US Equity X (acc) - USD - 22,514.000 1,948.000 20,566.000
JPMorgan Investment Funds - US Market Neutral Fund (7)JPM US Market Neutral A (acc) - USD - 34,156.442 - 34,156.442JPM US Market Neutral A (acc) - EUR (hedged) - 97,472.430 14,015.156 83,457.274JPM US Market Neutral A (dist) - USD - 33,330.000 - 33,330.000JPM US Market Neutral A (dist) - GBP - 33,319.437 - 33,319.437JPM US Market Neutral C (acc) - EUR (hedged) - 68,296.681 68,296.681 -JPM US Market Neutral D (acc) - USD - 34,500.499 - 34,500.499JPM US Market Neutral D (acc) - EUR (hedged) - 34,462.644 172.339 34,290.305JPM US Market Neutral X (acc) - USD - 57,300.000 - 57,300.000
JPMorgan Investment Funds - US Select Equity FundJPM US Select Equity A (acc) - USD 853,016.590 1,297,392.862 1,183,568.577 966,840.875JPM US Select Equity A (acc) - EUR (hedged) - 526,852.792 148,995.095 377,857.697JPM US Select Equity A (dist) - USD 110,200.000 479,991.000 9,600.000 580,591.000JPM US Select Equity B (acc) - USD 33,335.000 8,206.375 275.000 41,266.375JPM US Select Equity C (acc) - USD 359,342.951 216,458.980 329,443.588 246,358.343JPM US Select Equity D (acc) - USD 10,313.388 16,854.482 11,051.998 16,115.872JPM US Select Equity D (acc) - EUR (hedged) - 10,136.143 3,514.211 6,621.932JPM US Select Equity I (acc) - USD - 850,977.493 89,000.000 761,977.493JPM US Select Equity X (acc) - USD 93,719.443 337,319.000 465.000 430,573.443
(7) This Sub-Fund was launched on 14 June 2007.
207

Language Disclaimer Semi-Annual

JPMorgan Asset Management (Europe) S.à r.l.Postal Address: L-2888 LuxembourgTel No: (352) 34 101 Fax No: (352) 3410 8000E-mail: [email protected]
Internet: www.jpmorganassetmanagement.com
H62 04/12
For further information concerning JPMorgan Investment Funds, please contact the Global Distributor:
GB
GB


![PROSPETTO GENNAIO 2020 JPMorgan FundsPRO]_[IT_IT].pdf · JPMorgan Funds - Multi-Manager Alternatives Fund 195 JPMorgan Funds - Multi-Manager Sustainable Long-Short Fund 197 Altri](https://static.documents.pub/doc/80x56/5e92f6d54aa8b723a022e93b/prospetto-gennaio-2020-jpmorgan-proititpdf-jpmorgan-funds-multi-manager.jpg)


![Audited Annual Report JPorgan Funds Funds [ARP] [GB_EN].pdf · Audited Annual Report (R.C.S. No B 8 478) 30 June 2018 GB. JPMorgan Funds Audited Annual Report As at 30 June 2018 Contents](https://static.documents.pub/doc/80x56/5d051a7888c993dd5e8b6504/audited-annual-report-jporgan-funds-arp-gbenpdf-audited-annual-report.jpg)

