JOURNAL OF BACTERIOLOGY, Aug. 1991, p. 4692-4699 Vol. 173, No. 15 0021-9193/91/154692-08$02.00/0 Copyright C) 1991, American Society for Microbiology Expression of the bop Gene Cluster of Halobacterium halobium Is Induced by Low Oxygen Tension and by Light RICHARD F. SHANDt AND MARY C. BETLACH* Department of Biochemistry and Biophysics, University of California, San Francisco, California 94143 Received 4 February 1991/Accepted 23 May 1991 The bop gene cluster consists of at least three genes: bop (bacterio-opsin), brp (bacterio-opsin-related protein), and bat (bacterio-opsin activator). We have quantitated transcript levels from these genes in a wild-type and bacterioruberin-deficient mutant of Halobacterium halobium under conditions which affect purple membrane synthesis. In wild-type cultures grown under high oxygen tension in the dark, bop and bat transcript levels were low during steady-state growth and then increased -29- and -45-fold, respectively, upon entry into stationary phase. brp gene transcription remained very low and essentially unchanged under these conditions. In addition, exposure of wild-type cultures growing under high oxygen tension to 30,000 lx of light stimulated expression of all three genes, especially brp. In contrast to the wild-type, transcription from all three genes in the bacterioruberin mutant was very high during steady-state growth under high oxygen tension in the dark. Cultures of the bacterioruberin mutant were shifted at early stationary phase to low oxygen tension to determine whether oxygen concentrations lower than those present in stationary phase would induce transcription of the bop gene cluster in this strain. Indeed, transcription was induced, suggesting that the bop gene cluster is not completely uncoupled from regulation by oxygen tension in the bacterioruberin mutant. From these data, we propose a regulatory model involving two different mechanisms: (i) bat gene expression is induced under conditions of low oxygen tension and the bat gene product activates bop gene expression and (ii) light induces brp transcription, which stimulates or modulates bat transcription. Bacterio-opsin is the sole protein found in the purple membrane of the extremely halophilic, photosynthetic ar- chaebacterium Halobacterium halobium. The complex of this protein with the chromophore retinal constitutes bacte- riorhodopsin (BR), which mediates photophosphorylation (5, 11) by generating a transmembrane electrochemical po- tential via light-driven proton pumping (22). The structure and function of BR have been extensively studied (4, 12), but less is known about the genetics and physiology of bacterio- opsin (bop) gene expression in vivo. Characterization of some 50 spontaneous Bop mutants (1, 2, 6, 13) has shown that the gene encoding bacterio-opsin is flanked by at least two other genes that are involved in its expression: the bacterio-opsin-related protein gene (brp) and the bacterio-opsin activator gene (bat) (1, 14; Fig. 1A). All three genes have been sequenced, and their transcriptional start sites have been determined (1, 8, 9). The brp gene is located 526 bp upstream of the bop gene and is transcribed in the opposite orientation (1). The bat gene is located 1,602 bp upstream of the bop gene and is transcribed in the same orientation as the brp gene (14). There is no evidence supporting the existence of a polycistronic message arising from the brp and bat genes. Mutants containing insertion mutations in either the brp gene, the bat gene, or the intergenic region between the bop and brp genes have greatly reduced bop gene expression, varying from 0 to 23% of the parental levels (13). While some of the effects on bop gene expression caused by these insertion mutations have obvious explanations (e.g., disrup- tion of the putative bop gene promoter), disruption of brp gene expression reduces bop gene expression through an * Corresponding author. t Present address: Department of Biological Sciences, Northern Arizona University, Flagstaff, AZ 86011. unknown mechanism. In addition, these studies suggest that the bat gene product may be involved in activating brp and bop gene expression (13). Secondary structure predictions indicate that the putative bat protein would consist of alternating alpha helices and beta sheets characteristic of soluble proteins (14), whereas the putative brp protein would consist of six to seven hydrophobic alpha helices of sufficient length to span the membrane (3). It has been suggested that the brp protein may act as a membrane-bound sensor or be involved in the assembly of purple membrane (3). Neither of the putative brp or bat proteins have yet been detected in halobacterial cells, since there is no available assay. Tran- script levels from the bop gene cluster in wild-type and Bop mutants have been measured and compared only at a single point during the growth cycle (approximately late exponen- tial/early stationary phase) in aerobically grown cultures (13). brp and bat transcript levels from wild-type cultures grown aerobically in complex medium under ambient light were 2 and 4%, respectively, of bop levels (13). Oxygen tension, light intensity, and retinal synthesis all have been implicated as affecting purple membrane synthe- sis (20, 22, 26, 27). In addition, there may be some level of interaction between the synthesis of purple membrane and the major C50-isoprenoid, bacterioruberin. Bacterioruberins are a group of 4 to 6 C50-hydroxylated isoprenoids that are responsible for imparting the red pigmentation seen in H. halobium. Synthesis of bacterioruberin may impinge upon purple membrane synthesis since (i) bacterioruberin shares a common biosynthetic pathway with retinal (28) and (ii) some Bop Rub double mutants spontaneously partially revert to Rub' if the Bop mutation is located within or close to the bop gene (23). We have begun a systematic quantitation of bop gene cluster transcript levels in a wild-type strain and in a bacterioruberin-deficient mutant grown under conditions of either high or low oxygen tension and either in the light or in 4692
Transcript
JOURNAL OF BACTERIOLOGY, Aug. 1991, p. 4692-4699 Vol. 173, No. 150021-9193/91/154692-08$02.00/0Copyright C) 1991, American Society for Microbiology
Expression of the bop Gene Cluster of Halobacterium halobium IsInduced by Low Oxygen Tension and by Light
RICHARD F. SHANDt AND MARY C. BETLACH*
Department of Biochemistry and Biophysics, University of California, San Francisco, California 94143
Received 4 February 1991/Accepted 23 May 1991
The bop gene cluster consists of at least three genes: bop (bacterio-opsin), brp (bacterio-opsin-relatedprotein), and bat (bacterio-opsin activator). We have quantitated transcript levels from these genes in awild-type and bacterioruberin-deficient mutant of Halobacterium halobium under conditions which affectpurple membrane synthesis. In wild-type cultures grown under high oxygen tension in the dark, bop and battranscript levels were low during steady-state growth and then increased -29- and -45-fold, respectively, uponentry into stationary phase. brp gene transcription remained very low and essentially unchanged under theseconditions. In addition, exposure of wild-type cultures growing under high oxygen tension to 30,000 lx of lightstimulated expression of all three genes, especially brp. In contrast to the wild-type, transcription from all threegenes in the bacterioruberin mutant was very high during steady-state growth under high oxygen tension in thedark. Cultures of the bacterioruberin mutant were shifted at early stationary phase to low oxygen tension todetermine whether oxygen concentrations lower than those present in stationary phase would inducetranscription of the bop gene cluster in this strain. Indeed, transcription was induced, suggesting that the bopgene cluster is not completely uncoupled from regulation by oxygen tension in the bacterioruberin mutant.From these data, we propose a regulatory model involving two different mechanisms: (i) bat gene expression isinduced under conditions of low oxygen tension and the bat gene product activates bop gene expression and (ii)light induces brp transcription, which stimulates or modulates bat transcription.
Bacterio-opsin is the sole protein found in the purplemembrane of the extremely halophilic, photosynthetic ar-chaebacterium Halobacterium halobium. The complex ofthis protein with the chromophore retinal constitutes bacte-riorhodopsin (BR), which mediates photophosphorylation(5, 11) by generating a transmembrane electrochemical po-tential via light-driven proton pumping (22). The structureand function ofBR have been extensively studied (4, 12), butless is known about the genetics and physiology of bacterio-opsin (bop) gene expression in vivo.
Characterization of some 50 spontaneous Bop mutants (1,2, 6, 13) has shown that the gene encoding bacterio-opsin isflanked by at least two other genes that are involved in itsexpression: the bacterio-opsin-related protein gene (brp) andthe bacterio-opsin activator gene (bat) (1, 14; Fig. 1A). Allthree genes have been sequenced, and their transcriptionalstart sites have been determined (1, 8, 9). The brp gene islocated 526 bp upstream of the bop gene and is transcribed inthe opposite orientation (1). The bat gene is located 1,602 bpupstream of the bop gene and is transcribed in the sameorientation as the brp gene (14). There is no evidencesupporting the existence of a polycistronic message arisingfrom the brp and bat genes.
Mutants containing insertion mutations in either the brpgene, the bat gene, or the intergenic region between the bopand brp genes have greatly reduced bop gene expression,varying from 0 to 23% of the parental levels (13). While someof the effects on bop gene expression caused by theseinsertion mutations have obvious explanations (e.g., disrup-tion of the putative bop gene promoter), disruption of brpgene expression reduces bop gene expression through an
* Corresponding author.t Present address: Department of Biological Sciences, Northern
Arizona University, Flagstaff, AZ 86011.
unknown mechanism. In addition, these studies suggest thatthe bat gene product may be involved in activating brp andbop gene expression (13). Secondary structure predictionsindicate that the putative bat protein would consist ofalternating alpha helices and beta sheets characteristic ofsoluble proteins (14), whereas the putative brp protein wouldconsist of six to seven hydrophobic alpha helices of sufficientlength to span the membrane (3). It has been suggested thatthe brp protein may act as a membrane-bound sensor or beinvolved in the assembly of purple membrane (3). Neither ofthe putative brp or bat proteins have yet been detected inhalobacterial cells, since there is no available assay. Tran-script levels from the bop gene cluster in wild-type and Bopmutants have been measured and compared only at a singlepoint during the growth cycle (approximately late exponen-tial/early stationary phase) in aerobically grown cultures(13). brp and bat transcript levels from wild-type culturesgrown aerobically in complex medium under ambient lightwere 2 and 4%, respectively, of bop levels (13).Oxygen tension, light intensity, and retinal synthesis all
have been implicated as affecting purple membrane synthe-sis (20, 22, 26, 27). In addition, there may be some level ofinteraction between the synthesis of purple membrane andthe major C50-isoprenoid, bacterioruberin. Bacterioruberinsare a group of 4 to 6 C50-hydroxylated isoprenoids that areresponsible for imparting the red pigmentation seen in H.halobium. Synthesis of bacterioruberin may impinge uponpurple membrane synthesis since (i) bacterioruberin shares acommon biosynthetic pathway with retinal (28) and (ii) someBop Rub double mutants spontaneously partially revert toRub' if the Bop mutation is located within or close to thebop gene (23).We have begun a systematic quantitation of bop gene
cluster transcript levels in a wild-type strain and in abacterioruberin-deficient mutant grown under conditions ofeither high or low oxygen tension and either in the light or in
4692
INDUCTION OF THE bop GENE CLUSTER 4693
Alkb
bat gene brp gene bop gene
Bactivates
Low O2 bat bop
Light bip
FIG. 1. (A) Map of the bop gene cluster. Positions of the genesare indicated by the thick bars. Internal DNA fragments of the threegenes which were used to generate RNA probes used for Northernblot analyses are indicated as solid lines above the map. The extentand direction of transcription from the three genes are indicated bythe arrows located beneath the map. (B) Proposed model forregulation of the bop gene cluster. Low oxygen tension induces batgene expression, and the bat protein (which may not be the finaleffector) activates bop gene expression. High light intensity inducesbrp transcription, which stimulates and/or modulates bat transcrip-tion. The placement of an arrow from brp to bat is based on previoustranscriptional studies of mutants containing insertions in the brpgene (3, 13).
the dark. We sought to determine whether bop, brp, and batgene expression are constitutive or inducible, to determinewhether the brp and bat genes are coordinately regulatedwith the bop gene, and to obtain insights as to the mecha-nism(s) whereby the putative brp and bat gene productsinteract with the bop gene cluster.
MATERIALS AND METHODS
Bacterial strains, medium, and growth conditions. H. halo-bium strains used in this work were the wild-type strainNRC817 and its spontaneous bacterioruberin-deficient deriv-ative II-7 (23). The location and nature of the bacterioruberinmutation are unknown, but phenotypically, colonies of II-7appear light purple on solid medium due solely to purplemembrane. 11-7 is the parent of many of the spontaneous bopmutants that were critical in identifying putative bop regu-latory genes (23).
Halobacterial complex medium contained, per liter, 245 gof NaCl, 20 g of MgSO4. 7H20, 3 g of sodium citrate.2H20, 2 g of KCl, 15 g of peptone (Oxoid), and 43.75 mMTris hydrochloride (pH 7.2). Solid medium contained 1.5%agar (Oxoid). Viable counts were performed by the spreadplate technique. Optical density at 600 nm (OD6.) wasmeasured using a Beckman DU50 spectrophotometer. Cul-tures were grown routinely at 37°C in a shaking water bathunder ambient light and subcultured twice from early expo-nential phase before subculturing to an initial OD6. of -0.01at the start of each experiment. For the high-oxygen-tensionexperiment (see Fig. 3 to 5), high oxygen tension is definedas incubation at 37°C in cotton-plugged Erlenmeyer flasks atapproximately 350 rpm with a culture volume to flask
volume of 1:4. Cultures were incubated in either a shakingwater bath with the flasks covered with aluminum foil or inthe phototrophic chamber (see Fig. 2) with the flasks ex-posed to 30,000 lx of light.For shifts to low oxygen tension (see Fig. 6 to 8), a culture
was grown under high oxygen tension and ambient light toearly stationary phase. Fifty milliliters of culture was trans-ferred to each of two Monogro culture flasks (Wheaton)(warmed to 37°C; one covered with aluminum foil). Togenerate low-oxygen conditions, flasks were closed withnatural rubber sleeve stoppers (Wheaton no. 224097), sealedwith three wraps of beeswax-coated string, and tied se-curely. Two 16-gauge needles were passed through eachsleeve stopper to allow for a small amount of air exchange.The sleeve stoppers were loosely covered with aluminumfoil to prevent photooxidation of the rubber. The flasks wereplaced horizontally in the phototrophic chamber and shakenat 100 rpm. Samples (-2 to 3 ml) were removed through thesepta with syringes equipped with 25-gauge needles.
Phototrophic chamber. Figure 2 is a schematic of thephototrophic chamber that delivers 30,000 lx of light to thecultures. Incubating cultures horizontally in Monogro cul-ture flasks created a relatively large surface area (-100 cm2)and reduced culture depth to only a few millimeters, allow-ing homogeneous exposure and maximum penetration oflight. Cultures could also be grown with rapid shaking (highoxygen tension) and exposed to 30,000 lx of light in standardErlenmeyer flasks. To minimize infrared heating of both thechamber and the contents of the culture flasks, a wide-bandhot mirror was used which reflected -90% of the infraredenergy (750 to 1,200 nm), absorbed all of the UV energy(below 400 nm), and transmitted -85% of the visible light(450 to 675 nm) generated by the lamps. The light intensityrequirements are described by Oesterhelt and Krippahl (20);illumination was measured with a Minolta AutoMeter IIIlight meter equipped with a flat diffuser.
Small-scale RNA extraction and Northern (RNA) blot anal-ysis. Total RNA was extracted from 1.8-ml samples by usinga modification of the RNAzol procedure (Cinna Biotech).Culture samples were harvested in microcentrifuge tubes at13,000 rpm for 10 min in a model MC-150 Tomy microfuge atroom temperature. The supernatant was decanted, and anymedium remaining above the pellet was removed by aspira-tion. Cell pellets were quickly frozen on dry ice and stored at-65°C until extracted. RNAzol reagent (1.6 ml) was addeddirectly to frozen (-70°C) cell pellets and vortexed vigor-ously for 15 s. The remainder of the procedure is asdescribed in the product brochure. Air-dried RNA sampleswere resuspended in 25 ,ul of diethyl pyrocarbonate-treatedwater (15) and stored at -65°C. Samples of 30 to 50 ,ug oftotal RNA were routinely extracted from 1.8 ml of station-ary-phase culture.RNA (2 jig) from each time point was heated to 65°C in
50% formamide-2.2 M formaldehyde-50 mM HEPES (N-2-hydroxyethylpiperazine-N'-2-ethanesulfonic acid}-1 mMEDTA. RNA samples were electrophoresed on 1.2% verticalagarose gels (0.8 mm thick) at 75 V as described previously(1). RNA was blotted onto Hybond-N nylon membrane(Amersham) and cross-linked by UV light (Stratalinker;Stratagene). 32P-labeled RNA probes were synthesized invitro, using an SP6 polymerase riboprobe kit (PromegaBiotec) from DNA templates containing specific internalfragments of the bop, brp, and bat genes (13; Fig. 1A).Prehybridization, hybridization, and wash conditions wereas described by Melton et al. (17) except that prehybridiza-tion was performed overnight and the optimum prehybrid-
VOL. 173, 1991
4694 SHAND AND BETLACH J. BACTERIOL.
gg_/_ g l l 1 1 1 °~~~~~~~\Setamtps Metal ScrewSleeve
PlSWaterLevee Door
rFlask_S or
Culture- eweoDoEnviron mentalLLL 1
Chamber II--Flaslk Support
Shaker Shaker Platform
FIG. 2. Phototrophic chamber. The light source was a two-by-two array of 150-W tungsten spot lamps (GE 150R/SP) mounted directlyabove the chamber. Cultures were illuminated at light intensities described in Oesterhelt and Krippahl (20). These levels were 50 to 100mW/cm2, which are equal to 47 to 93 W/ft2. Xenon/mercury lamps of the type described previously (20) generate approximately 30 lm/W. Thisequals 1,410 to 2,790 foot-candles (lumens per square foot) or 15,171 to 30,020 lx (lumens per square meter, the equivalent SI unit). Excessheat was removed by evaporating water from a watertight Plexiglas tray (25 by 25 by 3 cm) that was mounted in the plastic lid of a Lab-Linemodel 3528 environmental shaker. The bottom of the tray was composed of an optically coated, wide-band hot mirror (Optical CoatingLaboratory, Inc.) installed with the coated surface down. The water level in the tray was kept constant by using an infrared RM-1 reservoirmonitor (Instruments for Research and Industry) attached to the side of the tray and connected to a reservoir through a peristaltic pump.
ization, hybridization, and wash temperatures were deter-mined to be 800C. Kodak X-Omat-R AR5 film was used forautoradiography of the filters. Exposure times were opti-mized so that blots containing high levels of message did notsaturate the film. mRNA levels were quantitated by scanningthe autoradiograms with a Joyce Loebl Ephortec densitom-eter (626-nm filter) and integrating the areas under the peaks(see legend to Fig. 4).
Quantitation of BR. Samples (400 ,il) from each time pointwere harvested as described above, quickly frozen, andstored at -650C. Pellets were resuspended and lysed in 100,ul of DNase A (40 j.Lg/ml; Sigma) in H20. The lysate wasmixed well until homogeneous and no longer viscous. For11-7 cultures, BR content was quantitated spectrophotomet-rically by scanning the lysed samples from 400 to 700 nm ona Beckman DU50 spectrophotometer. Bacteriorhodopsinconcentrations were determined according to the molarextinction coefficient for purple membrane (6568 = 63,000M-1 cm-,; 24). For NRC817 cultures, the presence ofbacterioi-uberins interferes with the spectrophotometricquantitation of BR (28). A freshly prepared 2 M stocksolution of NH2OH was made by mixing equal volumes of 4M NH2OH and 4 M NaOH. One-tenth volume of the 2 MNH2OH solution was added in the dark to the lysed NRC817sample, and an absorption spectrum was taken on a Shi-madzu UV160U spectrophotometer. The sample wasbleached (i.e., the chromophore was removed from BR) at3-min intervals, using 6.5 x 10⁵ lx of light produced by a150-W illuminator (Cole-Parmer) equipped with a yellowfilter and a heat filter. Spectra were taken until there was nofurther decrease in absorption and the amount of BR deter-mined from the difference between the bleached and un-bleached spectra at 568 nm. Total protein was determined by
using the Bio-Rad protein assay reagent with bovine serumalbumin as the standard.
RESULTS
Growth curves from high-oxygen-tension cultures. H. halo-bium strains NRC817 and II-7 were grown under conditionsof high oxygen tension in the dark and in 30,000 lx of light.Growth was monitored both by optical density (Fig. 3A) andby viable counts (Fig. 3B). There was very little difference ingeneration times during exponential growth (see legend toFig. 3), showing that NRC817 and II-7 have nearly identicalgrowth rates and that 30,000 lx of light had no effect ongrowth rate under conditions of high oxygen tension in acomplex medium. In addition, all cultures reached approxi-mately the same cell density at early stationary phase (1 x10⁹ to 2 x 10⁹ CFU/ml). In stationary phase, however, 11-7reached two- to threefold-higher OD6w levels than didNRC817 (Fig. 3A). Viable counts and optical densitiescorrelated well in the NRC817 cultures, as both stoppedincreasing at approximately the same time. In contrast,optical densities in the 11-7 cultures continued to increasewell after viable counts had stopped increasing (compareFig. 3A and B).
Transcript levels from high-oxygen-tension cultures. Figure4 shows bop, brp, and bat transcript levels from the culturesgrown under high oxygen tension shown in Fig. 3. Relativecomparisons among transcript levels from the same gene canbe made, since RNA samples were blotted, prehybridized,and hybridized in parallel with the same 32P-labeled ribo-probe. During growth of NRC817 under conditions of highoxygen tension in the dark, bop and bat transcript levelsfollowed the same pattern of expression (Fig. 4A and C):
INDUCTION OF THE bop GENE CLUSTER 4695
o 1.0-
0.1-
0.01
1010 B
108 v
107
106-0 25 50 75 100 125
Time (h)
FIG. 3. Growth curves of NRC817 and 11-7 grown under highoxygen tension in the light and in the dark as determined by OD6W(A) and by viable counts (B). For clarity, two curves are drawn inpanel A, one representing the NRC817 cultures, the other represent-ing the 11-7 cultures. Similarly, since generation times were essen-tially identical, only one curve is drawn in panel B until stationaryphase, when a second curve appears showing the deviation of theII-7 dark culture from the other three. Viable counts were performedin triplicate and averaged. Symbols: *, NRC817 in the dark; O,NRC817 in the light; 0, 11-7 in the dark; 0, 11-7 in the light.Generation times determined from the growth curves in panel B are5.6, 5.5, 5.25, and 5.7 h, respectively. The arrows indicate earlystationary phase and appear as reference markers in Fig. 4 and 5.
transcript levels were very low throughout mid- and lateexponential phase, began to rise during early stationaryphase (-72 h), reached their highest levels at 100 h, and thendeclined. The fold differences in bop and bat transcript
bop brp
levels between 60 h (indicated by arrows in Fig. 4) and theirmaxima were -29 and -45-fold, respectively. brp tran-scripts were not detectable until 80 h and then, unlike bopand bat levels, increased only slightly (Fig. 4B).Exposure of cultures ofNRC817 growing under conditions
of high oxygen tension to 30,000 lx of light resulted in asteady increase in bop, brp, and bat transcript levels duringexponential phase and early stationary phase (Fig. 4Athrough C). This increase in transcription contrasts with thevery low transcript levels observed during these stages ofgrowth in the dark culture. Even though bop transcript levelswere more abundant during exponential phase in the lightculture than in the dark culture, bop mRNA levels from thelight culture reached approximately the same maximum inthe same amount of time as the bop transcript levels in thedark culture (Fig. 4A). bat transcripts from the culturegrown in the light were also abundant during stationaryphase, but reached approximately the same maximum some40 h earlier than bat transcripts from the dark culture (Fig.4C). The greatest effect of 30,000 lx of light during growthunder high-oxygen-tension conditions was on brp transcriptlevels. While only just detectable in stationary phase of thedark culture, brp mRNA levels rose dramatically duringexponential phase and early stationary phase in the light andremained markedly elevated (Fig. 4B). The difference be-tween maximal brp transcript levels from the dark cultureand the light culture was eightfold.The bacterioruberin-deficient mutant II-7 grown under
conditions of high oxygen tension in the dark differed in itsbop gene cluster transcription patterns from its wild-typeparent in two ways (Fig. 4D through F). First, transcriptlevels from all three genes were markedly elevated duringexponential growth. bop transcript levels were nearly max-imal at about 40 h and remained elevated, with only a slightdecline from 100 to 125 h (Fig. 4D). brp transcript levelswere also maximal at 40 h and then declined (Fig. 4E). battranscripts were nearly maximal at about 60 h and then
bat
Time (h)FIG. 4. bop gene cluster transcript levels from wild-type (A to C) and mutant II-7 (D to F) cultures grown under high oxygen tension. Open
symbols represent mRNA from cultures grown in the light; closed symbols represent cultures grown in the dark. Symbols: O, *, bop mRNAlevels (A and D); 0, 0, brp mRNA levels (B and E); A, A, bat mRNA levels (C and F). For comparison of relative levels of transcriptionbetween the wild-type and II-7 strains, the fainter long and short dashed lines in panels D through F represent the corresponding bop, brp,or bat transcriptional pattern from the wild-type strain (A through C) grown in the light and dark, respectively, plotted to the same scale asthe mutant data. Autoradiography exposure times of Northern blots were 4 h at room temperature for panels A and D and 3 days at -65°Cwith an intensifying screen for the remaining panels. Levels of specific mRNAs were quantitated by scanning autoradiograms as describedin Materials and Methods. Peak areas (integrals) generated from each scan are plotted against time.
VOL. 173, 1991
4696 SHAND AND BETLACH
-H
-az0)E
CC
0
C]@do0
0.01A110 -0 25 50 75 100 125
Time (h)FIG. 5. Quantitation of BR levels from NRC817 and 11-7 cultures
grown under high oxygen tension in the dark and in the light.Symbols are as described in the legend to Fig. 3. E)
10 -
10 -
10 -
remained elevated throughout stationary phase (Fig. 4F).Second, the large inductions in bop and bat transcript levelsseen as the wild-type culture approached stationary phase(Fig. 4A and C) were absent in the II-7 culture (Fig. 4D andF). In addition, maximum levels of brp and bat from the 11-7culture grown in the dark were as high or higher than themaximum brp and bat levels in the wild-type strain grown ineither the dark or the light (Fig. 4E and F).Exposure of high-oxygen-tension cultures of mutant II-7
to 30,000 lx of light significantly increased transcript levels ofall three genes in the bop gene cluster (Fig. 4D through F).bop, brp, and bat transcript levels in mutant 11-7 rose morerapidly during the exponential and early stationary phases ofgrowth and attained maximum levels that were three- tofourfold higher than the maximum levels attained in theaerobic culture grown in the dark. This is in contrast to whatwas observed in light-exposed cultures of the wild-typestrain, for which maximum levels of bop and bat were nearlyidentical to those reached in the dark culture.BR levels from high-oxygen-tension cultures. Figure 5 com-
pares the amounts of BR from strains NRC817 and 11-7grown under conditions of high oxygen tension in the lightand in the dark as shown in Fig. 3. The increase in BRprotein levels parallels the increase in bop mRNA levelsshown in Fig. 4A and D up to 100 h. Both NRC817 and II-7cultures grown in the light produced detectable BR earlierand at higher levels than did cultures grown in the dark.However, BR levels were two- to threefold higher in strain11-7 than in strain NRC817 under identical growth condi-tions.Growth curves of II-7 cultures shifted from high to low
oxygen tension. Since strain 11-7 lacked the dramatic induc-tion of bop transcription seen in wild-type stationary-phasecultures in the dark (compare Fig. 4A and D), we aimed todetermine whether oxygen concentrations lower than thosepresent during stationary phase would affect bop gene clus-ter expression. It is well documented that reduced oxygentension is one condition necessary to cause H. halobium toproduce large amounts of purple membrane (21, 22). Classi-cal purple membrane-inducing conditions involve growingcultures aerobically under ambient light until early station-ary phase, followed by reduced aeration and increasedillumination. Consequently, we mimicked these growth con-ditions (Fig. 6) to determine whether lower oxygen tensioncould restore the induction phenomenon in strain II-7.
Figure 6 shows growth curves determined by ODwo (Fig.6A) and by viable counts (Fig. 6B) from cultures grownunder high oxygen tension (preshift) and then shifted tolow-oxygen conditions in the light and in the dark (postshift).Very large increases in optical densities but not in viable
A
rt
B_
106-50 0 50 100
Time (h)FIG. 6. Growth curves determined by OD600 (A) and viable
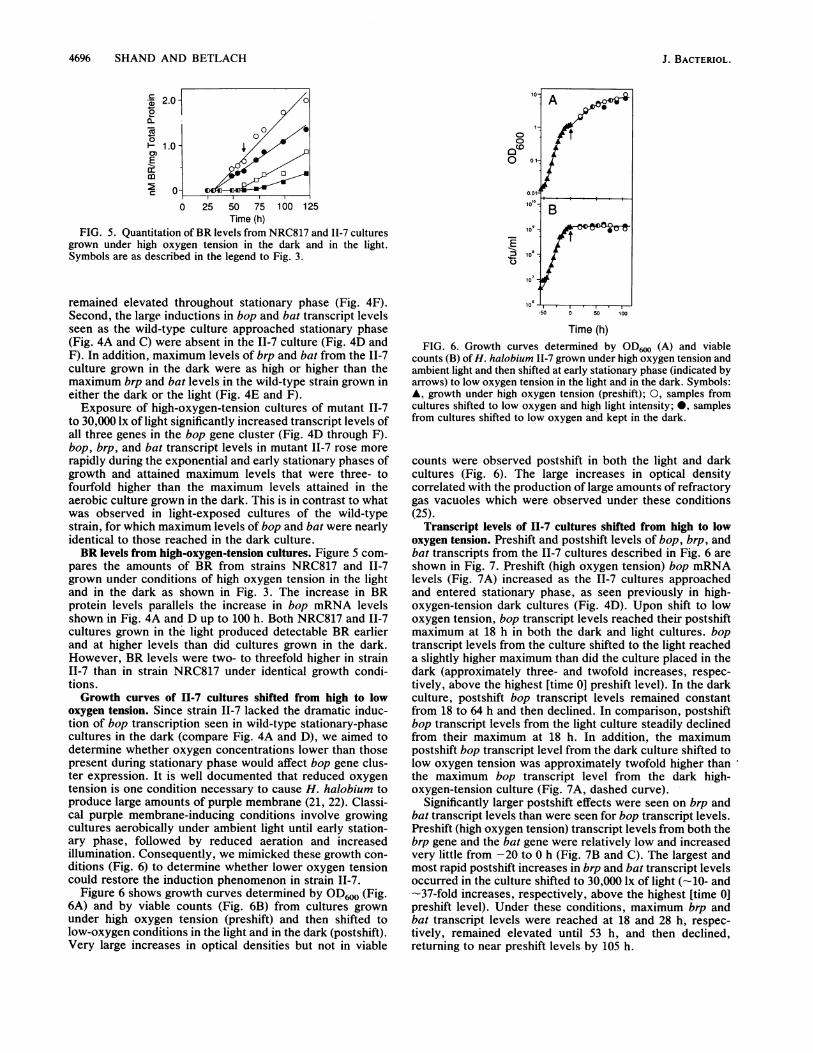
counts (B) of H. halobium 11-7 grown under high oxygen tension andambient light and then shifted at early stationary phase (indicated byarrows) to low oxygen tension in the light and in the dark. Symbols:A, growth under high oxygen tension (preshift); 0, samples fromcultures shifted to low oxygen and high light intensity; 0, samplesfrom cultures shifted to low oxygen and kept in the dark.
counts were observed postshift in both the light and darkcultures (Fig. 6). The large increases in optical densitycorrelated with the production of large amounts of refractorygas vacuoles which were observed under these conditions(25).
Transcript levels of II-7 cultures shifted from high to lowoxygen tension. Preshift and postshift levels of bop, brp, andbat transcripts from the 11-7 cultures described in Fig. 6 areshown in Fig. 7. Preshift (high oxygen tension) bop mRNAlevels (Fig. 7A) increased as the II-7 cultures approachedand entered stationary phase, as seen previously in high-oxygen-tension dark cultures (Fig. 4D). Upon shift to lowoxygen tension, bop transcript levels reached their postshiftmaximum at 18 h in both the dark and light cultures. boptranscript levels from the culture shifted to the light reacheda slightly higher maximum than did the culture placed in thedark (approximately three- and twofold increases, respec-tively, above the highest [time 0] preshift level). In the darkculture, postshift bop transcript levels remained constantfrom 18 to 64 h and then declined. In comparison, postshiftbop transcript levels from the light culture steadily declinedfrom their maximum at 18 h. In addition, the maximumpostshift bop transcript level from the dark culture shifted tolow oxygen tension was approximately twofold higher thanthe maximum bop transcript level from the dark high-oxygen-tension culture (Fig. 7A, dashed curve).
Significantly larger postshift effects were seen on brp andbat transcript levels than were seen for bop transcript levels.Preshift (high oxygen tension) transcript levels from both thebrp gene and the bat gene were relatively low and increasedvery little from -20 to 0 h (Fig. 7B and C). The largest andmost rapid postshift increases in brp and bat transcript levelsoccurred in the culture shifted to 30,000 lx of light (-10- and-37-fold increases, respectively, above the highest [time 0]preshift level). Under these conditions, maximum brp andbat transcript levels were reached at 18 and 28 h, respec-tively, remained elevated until 53 h, and then declined,returning to near preshift levels by 105 h.
J. BACTERIOL.
INDUCTION OF THE bop GENE CLUSTER 4697
< 10-
0--12 0
6
2-02-~00
Time (h)
FIG. 7. bop gene cluster transcript levels from the culturesshown in Fig. 6. Preshift (high oxygen tension) transcript levels (*)are averages of two samples. Arrows indicate shift at early station-ary phase from aerobic growth to low oxygen tension in the dark(closed symbols) and in the light (open symbols). Symbols: *, Dl,bop mRNA (A); *, 0, brp mRNA (B); A, A, bat mRNA (C). Thefainter dashed lines are derived from Fig. 4D through F andrepresent approximate corresponding transcript levels of bop, brp,and bat from 11-7 cultures grown in the dark under high oxygentension. Peak areas (integrals) generated from each scan are plottedagainst time.
brp and bat gene transcript levels also increased in theculture shifted to low oxygen tension and left in the dark(-8- and -10-fold increases, respectively, above the highest[time 0] preshift level). However, compared with brp and battranscript levels from the light culture, the kinetics of theincreases were delayed (reaching maximum levels at 64 h),and the magnitudes of the increases were smaller (-8-fold inthe dark versus -10-fold in the light for brp and -10-fold inthe dark versus -37-fold in the light for bat). The postshiftbrp and bat transcriptional maxima from dark culturesshifted to low oxygen tension were -8- and -3-fold higher,respectively, than the highest brp and bat transcript levelsfrom dark high-oxygen-tension cultures (Fig. 7B and C,dashed curves).BR levels from 11-7 cultures shifted from high to low oxygen
tension. Initial postshift BR levels from the 11-7 cultureshifted to low oxygen and high light intensity were -4-fold
c 3.
01
a- 2.
E 1 .
m
c
.0- 0
so- 0s0
.0-
-50 0 50Time (h)
FIG. 8. Quantitation of BR levels from 11-7 cultures grown underhigh oxygen tension to early stationary phase and then shifted(indicated by an arrow) to low oxygen tension in the dark (0) or thelight (0). The correlation coefficient (r) of the line described by theopen circles is 0.50.
higher than for the shifted culture that remained in the dark(Fig. 8). Similarly, initial bop mRNA levels in the cultureshifted to the light were elevated above those from theculture kept in the dark (Fig. 7A). At approximately 53 hpostshift, BR levels from the dark culture became andremained equal to the BR levels from the light culture.
DISCUSSION
High oxygen tension. We have quantitated mRNA levelsexpressed from three genes in the bop gene cluster in twostrains of H. halobium throughout the exponential andstationary phases of growth under high oxygen tension inboth the dark and the light. The growth curves of strain 11-7revealed a slight increase in optical density in stationaryphase that was not accompanied by an increase in viablecounts (Fig. 3). The reason for this difference is unknown,although increased synthesis of purple membrane and gasvacuoles could be contributing factors (25).
bop, brp, and bat transcript levels in the wild-type strainremained relatively suppressed during steady-state growth inthe dark (Fig. 4A through C). As the culture entered station-ary phase, bop mRNA levels increased 25- to 29-fold abovetranscript levels observed during exponential growth (Fig.4A). Yang and DasSarma also have observed an -20-foldincrease in bop transcription between mid-exponential-phase and stationary-phase wild-type cultures (29). The boptranscriptional profile was paralleled by BR productionthroughout the majority of the growth cycle (Fig. 4A and 5),which supports the observation that high levels of oxygenrepress the synthesis of purple membrane (22). The markeddecline in bop mRNA in late stationary phase of darkcultures was not paralleled by a decline in BR, suggestingeither decreased bop mRNA synthesis or increased bopmRNA degradation and attesting to the stability of BR.Indeed, Oesterhelt and Stoeckenius report that up to 50% ofthe total cell membrane surface area can consist of purplemembrane in stationary-phase cells (22).
In contrast, brp transcript levels in cultures of NRC817grown in the dark were barely detectable and increased onlyslightly in stationary phase (Fig. 4B). The bat gene transcrip-tional pattern, on the other hand, was nearly identical to thatof the bop gene, with bat transcript levels increasing 20- to45-fold above those observed during exponential growth(Fig. 4C). Thus, both bop and bat transcription are inducedduring stationary phase in wild-type cultures grown underhigh oxygen tension in the dark, while brp transcriptionremains relatively unaffected. This induction is most likelydue to a decrease in oxygen tension which naturally occursin stationary phase, although significant contributions byother stationary-phase effects such as depletion of nutrientsother than oxygen, a general starvation response, or accu-mulation of regulatory metabolites cannot be ruled out.Exposure of cultures of NRC817 growing under high
oxygen tension to 30,000 lx of light stimulated transcriptionfrom all three genes during steady-state growth, and tran-script levels remained elevated during stationary phase. Thisstimulation was apparent at the earliest steady-state timepoints (Fig. 4A through C) and indicates that exposure tolight mitigates the repressive effect of high oxygen tensionseen during steady-state growth.
Previously, we suggested that the brp protein may func-tion as a membrane-bound sensor, that the bat protein mayfunction as a soluble regulatory molecule (3), and that, asdetermined from analysis of transcript levels in numerousBop mutants (13), the bat gene product activated bop and
VOL. 173, 1991
4698 SHAND AND BETLACH
brp gene expression. Data in this report support most ofthese proposed functions and suggest a model (Fig. 1B) inwhich at least two mechanisms are involved in regulation ofbop gene expression, one involving oxygen and the otherinvolving light. brp transcription is induced by light but notby decreasing oxygen tension, which suggests that theputative brp protein may function as a receptor and/or atransmitter of the light signal. Such roles are consistent withthe predicted secondary structure of the putative brp pro-tein, which consists of six to seven hydrophobic alphahelices of sufficient length to span the halobacterial mem-brane and two amphipathic alpha-helical cytoplasmic re-gions (3). On the other hand, bat transcription is induced byboth light and decreased oxygen tension, and the bat geneproduct may serve as an intermediary in transmission ofboth signals. As observed by ourselves and others (29), theprimary amino acid sequence of the bat protein deducedfrom the nucleotide sequence (14) possesses a region ofsignificant homology with the nifL gene product, a putativeoxygen sensor found in Klebsiella pneumoniae (7). Finally,it is difficult to assess the temporal relationships betweenbop, brp, and bat gene expression levels during growthunder high oxygen tension within our 6- to 12-h samplingtime frame. However, in high-oxygen-tension cultures ex-posed to 30,000 lx of light, brp and bat mRNA levels reachtheir maxima at the same time and some 40 h earlier than bopmRNA maximum levels (Fig. 4 through C). Moreover,maximal bop transcript levels were reached at the same timein both the dark and light high-oxygen-tension cultures (Fig.4A).
Strain 11-7, a bacterioruberin-deficient mutant of the wild-type strain, NRC817, had significantly different patterns ofbop, brp, and bat transcription than its parent in culturesgrown under high oxygen tension in the dark. The lowsteady-state levels and large inductions of bop and battranscription observed in stationary phase in the wild-typestrain were absent in strain II-7 (Fig. 4D and F), indicatingthat in this mutant, bop and bat transcription do not respondto decreasing oxygen tension in the same fashion as in thewild-type. In addition, the constantly increasing levels ofbop, brp, and bat transcripts observed during steady-stategrowth under high oxygen tension in the dark suggest thathigh oxygen tension does not repress bop, brp, and battranscription in strain II-7. Comparisons of bop gene clustertranscriptional patterns between mutant II-7 and the wildtype (Fig. 4) reveal that II-7 grown in the dark has higher brpand bat transcript levels than does the wild-type culturegrown in the dark or the light. The maximum bop transcriptlevel attained in strain 11-7 was about 50% of the maximumattained by the wild type in the dark or the light. These datashow that strain II-7 constitutively expresses bop genecluster transcripts during steady-state growth under highoxygen tension in the dark.
Despite the apparent uncoupling of the bop gene clusterfrom regulation by oxygen tension in strain II-7, exposure ofcultures of II-7 to 30,000 lx of light during steady-stategrowth under conditions of high oxygen tension resulted inan increase in transcription from all three genes, similar tothat seen in the wild-type strain. However, mutant II-7attained three- to fourfold-higher maximum levels of bopgene cluster transcripts under these conditions than did itswild-type parent.
Strain II-7 differs from its wild-type parent by an unchar-acterized mutation which affects bacterioruberin levels. Al-though the presence of another mutation elsewhere in thegenome cannot be fully discounted, our data suggest that the
Rub mutation in strain 11-7 somehow results in an insensi-tivity of the bop gene cluster to oxygen tension. On the otherhand, the bop gene cluster in II-7 displays a sensitivity tolight similar to that of the wild-type strain, although higherlevels of expression were attained. Pfeifer et al. (23) havesuggested that there may be some level of interaction be-tween bacterio-opsin and bacterioruberin syntheses, giventhe fact that Bop mutants with insertions in or near the bopgene manifest a concomitant partial phenotypic reversion ofbacterioruberin synthesis whereas Bop mutants with insertsfurther upstream of the bop gene do not. Bacterioruberinsshare a common biosynthetic pathway with retinal, and adecrease in the synthesis of bacterioruberins could conceiv-ably increase retinal synthesis. In turn, an increase in freeretinal might signal induction of the bop gene cluster. Such ascenario may be the basis for the increased bop gene clusterexpression observed in strain II-7. Supporting this hypothe-sis is the observation that addition of exogenous retinal tocultures in which the retinal biosynthetic pathway wasblocked by nicotine resulted in a fivefold increase in BRlevels (26). In addition, an increase in bacterio-opsin tran-scription has been seen in a retinal-deficient mutant uponaddition of exogenous retinal (10).
Shift to low oxygen tension. We have quantitated transcriptlevels expressed from the bop gene cluster in cultures ofstrain II-7 grown under high oxygen tension to early station-ary phase and then shifted to low oxygen tension and eitherkept in the dark or exposed to 30,000 lx of light. This wasdone to examine the apparent uncoupling of the bop genecluster from regulation by oxygen tension in strain II-7 bydetermining whether oxygen concentrations could be low-ered sufficiently to invoke an induction response.
Following the shift to low oxygen and light, which simu-lated classical conditions for producing large quantities ofpurple membrane, the levels of all three transcripts (bop,brp, and bat) increased considerably (-3-fold for bop,-10-fold for brp, and -37-fold for bat) compared withpreshift, high-oxygen-tension transcript levels in the dark.Thus, classical methods used to produce large amounts ofpurple membrane simultaneously induced transcription of allthree genes in the bop gene cluster in strain 11-7. Theseresults also show that decreased oxygen tension alone caninduce transcription from all three genes of the bop genecluster in strain 11-7 and to significantly higher levels thanthose achieved in stationary-phase, high-oxygen-tension cul-tures.
Despite the significant increases in bop gene cluster tran-scription during shifts to low oxygen tension, addition of30,000 lx of light resulted in both higher maxima andincreased rates of synthesis (although marginal in the case ofbop expression) for the three genes (Fig. 7). These dataconfirm that light stimulates expression from the bop genecluster under low as well as high oxygen tension. Further-more, even though oxygen tension decreases upon increasedcell density and entrance to stationary phase in high-oxygen-tension cultures, the oxygen levels in the shift experimentswere much lower by design. Consequently, induction of thebop gene cluster in strain II-7 occurs if the oxygen tension islow enough, demonstrating that the bop gene cluster is notcompletely uncoupled from regulation by oxygen tension inthis strain.
In Fig. 1B, we propose a model based on data obtainedfrom wild-type cultures grown under high oxygen tension inthe light and in the dark. Our proposal that the putative brpprotein may be a membrane-bound light sensor is based inpart on the dramatic induction of brp transcription by light
J. BACTERIOL.
INDUCTION OF THE bop GENE CLUSTER 4699
and the apparent lack of induction by the somewhat loweroxygen tension present during stationary phase in wild-typecultures grown under high oxygen tension in the dark.However, brp transcription was induced in cultures of strain11-7 shifted to low oxygen in the dark. It is possible that theinduction of brp transcription seen in shifted cultures of 11-7in the dark might be a direct response either to the signifi-cantly lower oxygen tension or to an elevated level of a
regulatory protein which is induced under these conditions.Indeed, under these conditions maximum bat transcriptlevels are threefold higher than the highest levels achieved inhigh-oxygen-tension cultures in the dark. Our hypothesisthat the putative brp protein is a membrane-bound lightsensor and/or transmitter remains a possibility, since underall conditions tested brp transcription is significantly moresensitive to the presence of light than to changes in oxygentension.
Preliminary observations (25) indicate that genes involvedin the synthesis of gas vacuole proteins, retinal, and bacte-rioruberin may also be regulated by low oxygen tension andhigh light intensity. Together with the bop gene cluster,these genes may comprise a multigene family activated bycommon environmental parameters (i.e., a stimulon; 18),similar to genes in other systems which are activated bystarvation in the stationary phase of growth (16) or by heatshock (19).
ACKNOWLEDGMENTS
We thank Herbert Boyer for support; Felix and Roswitha Groppfor helpful discussions; Mark Neuman of Lab-Line for donating theenvironmental shaker, which was expertly modified by DouglasMcVay and Michael O'Grady to form the phototrophic chamber;and Bob Moody for helpful discussions about light.
This work was supported by Public Health Service grantGM31785 from the National Institute of General Medical Sciencesand National Research Service Award 5T32CA09043 to R.F.S.
REFERENCES1. Betlach, M., J. Friedman, H. W. Boyer, and F. Pfeifer. 1984.
Characterization of a halobacterial gene affecting bacterio-opsingene expression. Nucleic Acids Res. 12:7949-7959.
2. Betlach, M., F. Pfeifer, J. Friedman, and H. W. Boyer. 1983.Bacterio-opsin mutants of Halobacterium halobium. Proc. Natl.Acad. Sci. USA 80:1416-1420.
3. Betlach, M. C., R. F. Shand, and D. M. Leong. 1989. Regulationof the bacterio-opsin gene of a halophilic archaebacterium. Can.J. Microbiol. 35:134-140.
4. Braiman, M., J. Bubis, T. Doi, H. B. Chen, S. L. Flitsch, R. R.Franke, M. A. Gilles-Gonzalez, R. M. Graham, S. S. Karnik,H. G. Khorana, B. E. Knox, M. P. Krebs, T. Marti, T. Mogi,T. Nakayama, D. D. Oprian, K. L. Puckett, T. P. Sakmar,L. J. Stern, S. Subramaniam, and D. A. Thompson. 1988.Studies on light transduction by bacteriorhodopsin andrhodopsin. Cold Spring Harbor Symp. Quant. Biol. 53:355-364.
5. Danon, A., and W. Stoeckenius. 1974. Photophosphorylation inHalobacterium halobium. Proc. Natl. Acad. Sci. USA 71:1234-1238.
6. DasSarma, S., U. L. RajBhandary, and H. G. Khorana. 1983.High-frequency spontaneous mutation in the bacterio-opsingene in Halobacterium halobium is mediated by transposableelements. Proc. Natl. Acad. Sci. USA 80:2201-2205.
7. Drummond, M. H., and J. C. Wootton. 1987. Sequence of nifLfrom Klebsiella pneumoniae: mode of action and relationship totwo families of regulatory proteins. Mol. Microbiol. 1:37-44.
8. Dunn, R., J. McCoy, M. Simsek, A. Majumdar, S. Chang, U.RajBhandary, and H. G. Khorana. 1981. The bacteriorhodopsingene. Proc. Natl. Acad. Sci. USA 78:6744-6748.
9. Gropp, F., and M. Betlach. Unpublished data.10. Gropp, R., and M. Betlach. Unpublished data.11. Hartmann, R., and D. Oesterhelt. 1977. Bacteriorhodopsin-
mediated photophosphorylation in Halobacterium halobium.Eur. J. Biochem. 77:325-335.
12. Henderson, R., J. M. Baldwin, T. A. Ceska, F. Zemlin, E.Beckmann, and K. H. Downing. 1990. A model for the structureof bacteriorhodopsin based on high resolution electron cryo-microscopy. J. Mol. Biol. 213:899-929.
13. Leong, D., H. Boyer, and M. Betlach. 1988. Transcription ofgenes involved in bacterio-opsin gene expression in mutants ofa halophilic archaebacterium. J. Bacteriol. 170:4910-4915.
14. Leong, D., F. Pfeifer, H. Boyer, and M. Betlach. 1988. Charac-terization of a second gene involved in bacterio-opsin geneexpression in a halophilic archaebacterium. J. Bacteriol. 170:4903-4909.
15. Maniatis, T., E. F. Fritsch, and J. Sambrook. 1982. Molecularcloning: a laboratory manual, p. 190. Cold Spring HarborLaboratory, Cold Spring Harbor, N.Y.
16. Matin, A., E. A. Auger, P. H. Blum, and J. E. Schultz. 1989.Genetic basis of starvation survival in non-differentiating bac-teria. Annu. Rev. Microbiol. 43:293-316.
17. Melton, D., P. Krieg, M. Rebagliati, T. Maniatis, K. Zinn, andM. Green. 1984. Efficient in vitro synthesis of biologically activeRNA and RNA hybridization probes from plasmids containing abacteriophage SP6 promoter. Nucleic Acids Res. 12:7035-7056.
18. Neidhardt, F., J. Ingraham, and M. Schaechter. 1990. Physiol-ogy of the bacterial cell, p. 382-383. Sinauer Associates, Inc.,Sunderland, Mass.
19. Neidhardt, F. C., and R. A. VanBogelen. 1987. Heat shockresponse, p. 1334-1345. In J. L. Ingraham, K. B. Low, B.Magasanik, M. Schaechter, and H. E. Umbarger (ed.), Esche-richia coli and Salmonella typhimurium: cellular and molecularbiology, vol. 2. American Society for Microbiology, Washing-ton, D.C.
20. Oesterhelt, D., and G. Krippahl. 1983. Phototrophic growth ofhalobacteria and its use for isolation of photosynthetically-deficient mutants. Ann. Microbiol. Inst. Pasteur 134 B:137-150.
21. Oesterhelt, D., and W. Stoeckenius. 1971. Rhodopsin-like pro-tein from the purple membrane of Halobacterium halobium.Nature (London) New Biol. 233:149-152.
22. Oesterhelt, D., and W. Stoeckenius. 1973. Functions of a newphotoreceptor membrane. Proc. Natl. Acad. Sci. USA 70:2853-2857.
23. Pfeifer, F. A., H. W. Boyer, and M. C. Betlach. 1985. Restora-tion of bacterio-opsin gene expression in a revertant of Halo-bacterium halobium. J. Bacteriol. 164:414-420.
24. Rehorek, M., and M. P. Heyn. 1979. Binding of all-trans-retinalto the purple membrane. Evidence for cooperativity and deter-mination of the extinction coefficient. Biochemistry 18:4977-4983.
25. Shand, R. F., and M. C. Betlach. Unpublished data.26. Sumper, M., and G. Herrmann. 1976. Biosynthesis of purple
membrane: regulation of bacterio-opsin synthesis. FEBS Lett.69:149-152.
27. Sumper, M., and G. Herrmann. 1976. Biosynthesis of purplemembrane: control of retinal synthesis by bacterio-opsin. FEBSLett. 71:333-336.
28. Sumper, M., H. Reitmeier, and D. Oesterheldt. 1976. Biosynthe-sis of the purple membrane of halobacteria. Angew. Chem. Ed.Engl. 15:187-194.
29. Yang, C., and S. DasSarma. 1990. Transcriptional induction ofpurple membrane and gas vesicle synthesis in the archaebacte-rium Halobacterium halobium is blocked by a DNA gyraseinhibitor. J. Bacteriol. 172:4118-4121.