220
Aughinish Alumina Ltd Askeaton, Co. Limerick IPPC Licence Reg. P0035-04 Annual Environmental Report 2009
Aughinish Alumina Ltd Askeaton, Co. Limerick
IPPC Licence Reg. P0035-04
Annual Environmental Report
2009

Aughinish Alumina Ltd. March 2010 AER 2009
2 | P a g e
This page is intentionally blank

Aughinish Alumina Ltd. March 2010 AER 2009
3 | P a g e
Aughinish Alumina Ltd. Integrated Pollution Prevention & Control Licence
Register No. POO35-04
Annual Environmental Report 2009
March 2010
Contents 1. Introduction ......................................................................................................... 7 1.1 Description of the Activity ...................................................................................... 7 1.2 Management Structures ........................................................................................ 7 1.3 Organisational Structure ........................................................................................ 8 1.4 Environmental Policy ........................................................................................... 10 2. Emissions ........................................................................................................... 11 2.1 Emissions to Atmosphere .................................................................................... 12 2.1.1 Boiler Emissions .................................................................................................. 12 2.1.2 Calciner Emissions .............................................................................................. 14 2.1.3 CHP Emissions .................................................................................................... 15 2.1.4 Other Emission Points (Dust Collection Units) ..................................................... 16 2.1.5 Compliance Summary ......................................................................................... 17 2.2 Emissions to Water ............................................................................................. 20 2.2.1 Process Wastewater (W1-1) ................................................................................ 20 2.2.2 Toxicity Testing ................................................................................................... 21 2.2.3 Heavy Metal, Aluminium and Soda Analysis ........................................................ 22 2.2.4 Wastewater Screen (VOC) .................................................................................. 23 2.2.5 Sanitary Effluent .................................................................................................. 24 2.2.6 Surface Water Monitoring .................................................................................... 25 2.2.7 Surface Water Monitoring at the BRDA ............................................................... 25 2.2.8 Discharges to Water Compliance Summary ........................................................ 25 3 Waste Management Record .............................................................................. 26 3.1 National Waste Database (2009) ......................................................................... 26 4 Monitoring and Enforcement ............................................................................ 32 4.1 Monitoring ........................................................................................................... 32 4.2 Third Party Inspections ........................................................................................ 33 5. Energy Consumption ........................................................................................ 34 5.1 Water Consumption............................................................................................. 35 6. Environmental Incidents and Complaints ....................................................... 36 6.1 Significant Environmental Incidents ..................................................................... 36 6.2 Recordable Incidents ........................................................................................... 36 6.3 Complaints .......................................................................................................... 36 7. Environmental Management ............................................................................. 37 7.1 Environmental Management Programme Report for 2009 ................................... 37 7.2 Environmental Objectives and Targets for 2010 .................................................. 39 7.3 Pollutant Release and Transfer Register ............................................................. 41 7.3.1 Pollutant Release and Transfer Register 2009 .................................................... 41 7.3.2 Caustic Mass Balance ......................................................................................... 42 7.3.3 Proposed PRTR for 2010 .................................................................................... 43 8. Other Reports ..................................................................................................... 44 8.1 Noise Monitoring Programme .............................................................................. 45

Aughinish Alumina Ltd. March 2010 AER 2009
4 | P a g e
8.2 Groundwater Monitoring ...................................................................................... 47 8.2.1 Foreshore Springs .............................................................................................. 47 8.2.2 Plant observation wells (POW) ........................................................................... 48 8.2.3 BRDA observation wells ...................................................................................... 51 8.3 Leak Detection Monitoring System ..................................................................... 54 8.4 Fugitive Emissions in the AAL Plant Area ........................................................... 54 8.5 Ambient Air Quality Monitoring ........................................................................... 56 8.6 Bund, Tank & Pipeline Integrity Testing .............................................................. 58 8.7.1 Amendment to DRMP ......................................................................................... 59 8.7.2 Update of Closure Costs..................................................................................... 59 8.8 Environmental Liabilities Risk Assessment Review ............................................ 60 8.9 Annual Landfill Status Report ............................................................................. 61 8.9.1 Waste Composition and Tonnage Data ............................................................... 62 8.9.2 BRDA Containment Capacity ............................................................................. 63 8.9.3 Results of BRDA Monitoring programme ............................................................ 63 8.9.4 Revisions to BRDA Operational Plan .................................................................. 64 8.9.5 Summary of BRDA development/remedial works 2009 ...................................... 64 8.11 Progress on Bauxite Residue Neutralisation ....................................................... 65 8.12 Raw Materials Efficiency and Waste Reduction .................................................. 67 8.13 Programme for Public Information ...................................................................... 67
List of Tables
Table 1 Management systems at AAL Table 2 Mass emissions to air from the Boilers (Emission point A1) Table 3 Mass Emissions to air from the Calciners (Emission point A2) Table 4 Mass emissions to atmosphere from CHP Table 5 Summary of particulate emissions from dust collection units Table 6 Evaluation of Compliance with 48-hour average emissions limits Table 7 Evaluation of Compliance with monthly average emissions limits Table 8 Evaluation of Compliance 2009 - Calciners Table 9 Evaluation of Compliance 2009 - CHP Table 10 Licensed Discharges to Water Table 11 Process Wastewater Mass Emissions (W1-1) Table 12 Results of Toxicity Testing (2009) Table 13 Results of Heavy Metal Analysis 2009 (W1-1) Table 14 Results of Soda and Aluminium analysis (W1-1) Table 15 Results of VOC Screen 2009 (W1-1) Table 16 Sanitary Effluent Mass Emissions 2009 Table 17 Results of Surface Water Discharge Monitoring 2009 Table 18 Surface Water monitoring results in the BRDA 2009 Table 19 Summary Information on Waste Arising Table 20 Information on Individual Waste Streams Table 21 Number of EPA site visits 2009 Table 22 EPA Industrial Effluent Results (Emission point W1-1) Table 23 EPA Sanitary Effluent Results Table 24 EPA Emissions to Air results Table 25 Summary energy data for 2006 to 2009 Table 26 Summary water consumption data for 2006 to 2009 Table 27 EMP 2009 Report Table 28 EMP Objectives and Targets 2010 Table 29 PRTR for 2009 Table 30 Results of Caustic Mass Balance Table 31 Noise Survey Results – Noise Sensitive Locations dB (A) Table 32 Noise Survey Results – Perimeter Locations dB (A) Table 33 Summary of foreshore spring monitoring data 2009
Aughinish Alumina Ltd. March 2010 AER 2009
5 | P a g e
Table 34 Summary of POW monitoring results 2009 Table 35 Summary of BRDA observation wells monitoring results 2009 Table 36 Results of borehole monitoring 2009 Table 37 Results of headspace analysis 2009 Table 38 Dust deposition rates (mg/m2/day) in 2009
Table 39 Ambient Air Sulphur Dioxide Concentrations (g/m3) Table 40 Ambient Air Mean Particulate Deposition Rates (mg/m2/day) Table 41 Ambient Air Mean Sodium and PM10 – Annual average & range
Table 42 Ambient Mean Continuous SO2 Monitoring (g/m3) Table 43 Landfill Operational Status Table 44 Waste Composition & Tonnage (2009) Table 45 Accumulated Quantities of Waste (1983 to 2009) Table 46 Estimated Capacity of BRDA Table 47 Raw Material Efficiency and Waste Reduction
List of Figures
Figure 1 Summary of Boiler house Mass Emissions Figure 2 Summary of mass emissions from Calcination Figure 3 Summary of CHP emissions 2009 Figure 4 Treated wastewater mass emissions (2008 & 2009) Figure 5 Sanitary effluent mass emissions (2008 & 2009) Figure 6 Energy Use (2008 & 2009) Figure 7 Plant Water Consumption
Attachments
Attachment 1 Toxicity Test Reports Attachment 2 VOC Screening Report Attachment 3 Results of Waste Analysis Attachment 4 Environmental Management Programme Attachment 5 Noise Survey Report Attachment 6 Ballysteen & Foynes SO2 Graphs, Ballysteen, Aughinish & Foynes PM10 Graphs, Aughinish & Foynes Sodium Graphs Attachment 7 Graphs trending the pH and Soda for estuarine streams Attachment 8 Programme for Closure Planning & Re-vegetation of BRDA Attachment 9 BRDA Operational Plan Attachment 10 AER/PRTR Emissions Data Information

Aughinish Alumina Ltd. March 2010 AER 2009
6 | P a g e
This page is intentionally blank
Aughinish Alumina Ltd. March 2010 AER 2009
7 | P a g e
1. Introduction
This document comprises the eleventh Aughinish Alumina Limited (AAL) Annual Environmental Report (AER). The report covers the period from the 1st of January 2009 to the 31st of December 2009 and has been prepared in accordance with the Environmental Protection Agency (EPA) „Guidance Note on the Annual Environmental Report‟ and other relevant guidance as provided by the EPA on the Agency website (www.epa.ie).
1.1 Description of the Activity
AAL was granted a revised Integrated Pollution Prevention & Control (IPPC) licence in April 2008.This licence grants AAL permission to carry out the following activities:
The extraction of aluminium oxide from an ore. The burning of any fuel in a boiler or furnace with a nominal heat output
exceeding 50MW. The recovery or disposal of waste in a facility, within the meaning of the
Waste Management Act, 1996, which facility is connected or associated with another activity specified in the first schedule of the EPA Act of 1992.
This IPPC Licence (Reg. No. P0035-04) supersedes the installations previous licence (Reg. No. P0035-02), which had been issued in 2004.
The AAL plant extracts alumina from bauxite using the Bayer Process, a chemical method that has been developed and refined over the past century and is used by over 40 alumina extraction plants worldwide.
Approximately 70% of the bauxite processed by AAL comes for Guinea in West Africa with the remainder coming from Brazil. The finished product, alumina, is exported for further processing through smelting to aluminium metal.
The production output of the plant in 2009 was 1,241,283 tonnes of Alumina Hydrate representing a decrease of 34% over 2008 production levels.
1.2 Management Structures
Since March 2008 AAL has been wholly owned by United Company RUSAL, which is the largest integrated aluminium company worldwide.
AAL has a structured management approach to the operation of the business in terms of product quality, process control, environment, safety, training and analytical capability. Training of personnel is a key function in the successful operation of the plant.
Safety, environmental and quality management systems are audited on an ongoing basis by a combination of internal audit teams and external certification surveillance audits by DNV (UK). In 2004, AAL became the first company outside Denmark to implement a formalised Energy Management System Standard (DS2403).

Aughinish Alumina Ltd. March 2010 AER 2009
8 | P a g e
Table 1 Management Systems at AAL
Year System Accreditation Board
1993 International Safety Rating System (ISRS)
Det Norske Veritas (DNV)
1993 Irish Laboratory Accreditation Board (ILAB)
National Accreditation Board (NAB)
1995 ISO 9002 Quality System Det Norske Veritas (DNV)
1997 Excellence Through people (Training) FAS
2000 ISO 14001:2004 Environmental Management System
Det Norske Veritas (DNV)
2002 Continuous Professional Development Institution of Engineers of Ireland (IEI)
2004 Danish Standard 2403 Energy Management System Standard
Det Norske Veritas (DNV)
1.3 Organisational Structure
AAL operates a relatively flat management structure with a strong emphasis on team working. The company organogram is set out below and indicates the responsibility for day-to-day management of environmental issues at the plant.
As part of the site training, an Environmental Manual was issued to the on-site Contractor Alliance covering AAL‟s requirements for Environmental Management and Control.
The Environmental Co-ordinator has overall responsibility for environmental management and reports directly to the Management Team. The Environmental Co-ordinator is supported in the day-to-day activities by the Environmental Engineer(s), who have responsibility for the maintenance of the Environmental Management System, undertaking specific projects of an environmental nature and evaluating compliance with the IPPC licence. Environmental Technologists are responsible for monitoring and sampling of all emissions and discharges from the Aughinish site. This work is supported by a Co-op Student from the University of Limerick from January to September each year.

Aughinish Alumina Ltd. March 2008 AER 2008
9 | P a g e
Managing Director
Hydrate Plant
Manager
Local 1 - Digestion
Local 2 - Filtration & Mud Circuit
Local 3 -
Precipitation
Vessel Turnaround & Pump
Maintenance
SPFs
Technical Manager
Information
Technology
Plant Technology / Laboratory (Incl. Customer Liaison and Quality, Env. and
Energy Mgt Systems)
Environment
R & D
Major Projects
Calcination, Port, Utilities, Materials Supply & Eng
Manager
Local 4 Port
Local 5 Boiler house &
Calcination
Engineering
(Incl. Alliance)
Workshops Site Services
General Services
Materials Supply
Administration
Manager
Legal
Accounts
Public Affairs
HR, Recruitment and Health
Energy and Safety Manager
Energy/CHP
Safety & Security
Training &
Development
Major Purchases

Aughinish Alumina Ltd. March 2009 AER 2009
10 | P a g e
1.4 Environmental Policy
Environmental Policy Statement
Protection of the environment is a high priority for every employee, contractor and director of Aughinish Alumina Ltd. This objective requires our full co-operation in a continuing effort to improve our products and production processes.
The process we employ at Aughinish, the „Bayer Process‟, is the accepted industrial method for the manufacture of alumina worldwide. Our principal product, smelter grade alumina, is used to manufacture aluminium, a metal with many recognised environmental benefits.
Successful integration of our environmental objectives with our health, safety, quality and cost objectives is required to ensure our competitive position. We will continue to:
Comply with all legal requirements and where appropriate, use more stringent
internal standards based on our expertise Use world-class practices to ensure that we prevent pollution and meet social,
economic and environmental demands. Develop opportunities with suppliers and customers to improve our products
and to minimise waste and environmental impacts. Make effective use of environmental management systems that continually
improve our performance consistent with defined goals. Review our environmental objectives and targets regularly to ensure that these
remain both relevant and appropriate to our operations. Communicate with employees, consumers, communities, businesses and
government to achieve greater environmental understanding. Ensure that Aughinish environmental policy is communicated to all employees
and contractors and is made available to the public.
By fulfilling these objectives, we will have due regard to the environmental expectations of our many stakeholders. Damien Clancy September 2003 Managing Director

Aughinish Alumina Ltd. March 2009 AER 2009
11 | P a g e
2. Emissions
Aughinish implements a comprehensive environmental monitoring programme to assess the significance of emissions from site activities. The programme includes air emissions, discharged water, surface water and waste monitoring. An overview of the results of the monitoring conducted in the reporting period is presented in this section.
This section also includes an evaluation of compliance with the conditions and schedules of the IPPC licence, together with a summary of environmental incidents reported to the Agency during 2009. External complaints received by the plant during 2009 are detailed, together with a description of the investigations and corrective actions initiated as a result of those complaints.
Summary information on all emissions and discharges, waste arising and resource use has been compiled on an electronic spreadsheet which has been submitted to the Agency by e-mail to [email protected]. Monitoring data, summarised in the following sections, shows a high degree of compliance with the IPPC Licence emission limit values.
Aughinish Alumina Ltd. March 2009 AER 2009
12 | P a g e
2.1 Emissions to Atmosphere
There are 16 IPPC licensed air emission points at AAL, 13 of which are monitored. The primary sources of emissions to atmosphere are the Boilers (Emission Point Ref. A1) and Calciners (Emission Point Ref. A2). In 2005, 2 new major emission points (Emission Point Ref. A3-A & A3-B) were added as part of the Combined Heat and Power Plant (CHP) Project.
The remaining emission sources comprise bag house and cyclone exhausts for control of particulate emissions from materials handling operations.
2.1.1 Boiler Emissions
Boiler emissions are one of the major emission sources on the site. Depending on the parameter, monitoring varies from continuous on-line monitors, to quarterly analyses as specified in Schedule C1.1 (Control of Emissions to Atmosphere) of IPPC licence P0035-04. A summary of the annual mass emissions for the licensed parameters is tabulated in Table 2 of this report.
Actual mass emissions of oxides of sulphur (as SO2), as tabulated below, are generated by calculation, based on the sulphur content of the fuel and the quantity of fuel oil consumed in 2009. Nitrogen oxides mass emissions (as NO2) are derived from measured NO2 values, and estimated exhaust gas flow rates. Dust mass emissions from the boilers are calculated from the measured particulate emissions and estimated exhaust gas flow rates. The gas flow rate estimation is based on the quantity of fuel used, as there is a stochiometric relationship between air flow and fuel consumption.
Licensed mass emissions are based on emissions concentration and flow rate at ELV, taking a 365 day operational period.
The actual mass emission of SO2 from the boilers decreased between 2008 and 2009 by 46% due to reduced Heavy Fuel Oil (HFO) consumption linked to decreased Alumina Hydrate Production during 2009.
Emissions of nitrogen oxides (as NO2) decreased by 44% during the same period due to reduced HFO consumption and decreased boiler air flow rates which generated reduced thermal nitrogen oxides.

Aughinish Alumina Ltd. March 2009 AER 2009
13 | P a g e
Table 2 Mass Emissions to Air from the Boilers (Emission point A1)
Emission Point Ref. A1 Boilers
Mass Emission (Kgs) 2008
Mass Emission (Kgs) 2009
Licensed Mass Emissions (Kgs)
Oxides of Sulphur (as SO2)
1,456,123 788,226 5,474,299
Nitrogen Oxide (as NO2)
521,847 291,696 2,415,132
Dust 32,257 16,474 161,009
Emissions of sulphur dioxide, nitrogen oxides and dust from the main site boilers were significantly below licensed rates for these parameters.
Figure 1. Summary of Boiler Mass Emissions

Aughinish Alumina Ltd. March 2009 AER 2009
14 | P a g e
2.1.2 Calciner Emissions Emissions from the calciners are summarised in Table 3 as actual annual mass emissions (in Kgs) for the licensed parameters over the 2009 reporting period. Mass emissions of oxides of sulphur are generated by calculation, based on the measured SO2, as monitored as part of the IPPC requirements, and estimated exhaust gas flow rates. Particulate mass emissions are calculated in a similar fashion. Mass emissions of oxides of sulphur decreased between 2008 and 2009. This was due to the reduction in HFO consumption associated with the decreased rate of Alumina production in 2009 versus 2008. .
Table 3. Mass Emissions to Air from the Calciners (Emission Point A2)
Emission Point Ref. A2 – Calciner
Mass Emission (Kgs) 2008
Mass Emission (Kgs) 2009
Licensed Mass Emissions (Kgs)
Oxides of Sulphur (as SO2)
1,100,448 603,650 6,265,152
Particulates 88,149 62,575 235,060
Figure 2. Summary of Mass Emissions from Calcination

Aughinish Alumina Ltd. March 2009 AER 2009
15 | P a g e
2.1.3 CHP Emissions
Condition C1.1 of IPPC licence P0035-04 requires the monitoring of NO2 for the CHP emissions. The NO2 monitoring data for 2009 is shown below in Table 4. The emissions are significantly lower than the permitted licensed mass emissions.
Table 4 Mass Emissions to Atmosphere from CHP
Emission Point Ref. A3A & A3B –
CHP
Mass Emission (Kgs) 2008
Mass Emission (Kgs) 2009
Licensed Mass Emissions (Kgs)
Nitrogen Oxides (as NO2)
358,716 325,999 946,080
The licence requirements for the Gas Turbine heat recovery steam generator stack are as outlined below:
No 24-hour value shall exceed the emissions limit value of 75 mg/m3 No hourly value shall exceed twice the emission limit value
Figure 3. Summary of CHP emissions 2009
Aughinish Alumina Ltd. March 2009 AER 2009
16 | P a g e
There are three unmonitored licensed combustion emission points at the plant. Licensed emission points 13, 14 and 15 are associated with small scale space heating boilers at Area 73, Area 76 and Area 79 respectively. These units are fired on gas oil with less than 0.2% Sulphur. There are no emission limits set for these small boilers and no requirement to monitor emissions.
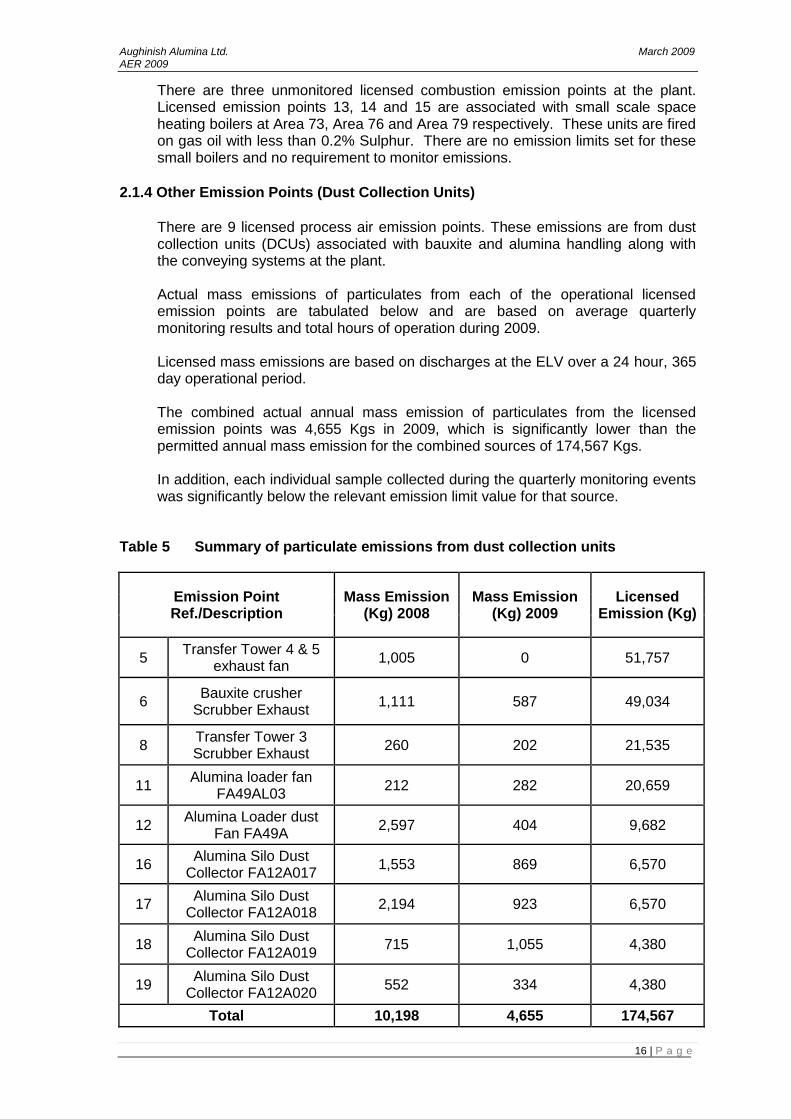
2.1.4 Other Emission Points (Dust Collection Units)
There are 9 licensed process air emission points. These emissions are from dust collection units (DCUs) associated with bauxite and alumina handling along with the conveying systems at the plant.
Actual mass emissions of particulates from each of the operational licensed emission points are tabulated below and are based on average quarterly monitoring results and total hours of operation during 2009.
Licensed mass emissions are based on discharges at the ELV over a 24 hour, 365 day operational period.
The combined actual annual mass emission of particulates from the licensed emission points was 4,655 Kgs in 2009, which is significantly lower than the permitted annual mass emission for the combined sources of 174,567 Kgs.
In addition, each individual sample collected during the quarterly monitoring events was significantly below the relevant emission limit value for that source.
Table 5 Summary of particulate emissions from dust collection units
Emission Point Ref./Description
Mass Emission (Kg) 2008
Mass Emission (Kg) 2009
Licensed Emission (Kg)
5 Transfer Tower 4 & 5
exhaust fan 1,005 0 51,757
6 Bauxite crusher
Scrubber Exhaust 1,111 587 49,034
8 Transfer Tower 3 Scrubber Exhaust
260 202 21,535
11 Alumina loader fan
FA49AL03 212 282 20,659
12 Alumina Loader dust
Fan FA49A 2,597 404 9,682
16 Alumina Silo Dust
Collector FA12A017 1,553 869 6,570
17 Alumina Silo Dust
Collector FA12A018 2,194 923 6,570
18 Alumina Silo Dust
Collector FA12A019 715 1,055 4,380
19 Alumina Silo Dust
Collector FA12A020 552 334 4,380
Total 10,198 4,655 174,567

Aughinish Alumina Ltd. March 2009 AER 2009
17 | P a g e
2.1.5 Compliance Summary
Compliance with the relevant emission limit values (ELV‟s) for emissions to atmosphere is evaluated in the following sections.
Boiler Emissions
The overall annual level of compliance with emission limit values for continuous monitoring of boiler emissions to atmosphere is tabulated below for the 48-hour and the monthly average compliance requirements of the IPPC Licence. These compliance interpretation requirements are specified in Condition 4 of the IPPC Licence.
The requirements for compliance with both 48-hour and monthly monitoring results are specified in Condition 4.1.4 of the IPPC Licence. The parameters evaluated are sulphur dioxide, nitrogen dioxide and opacity.
The evaluation indicates that boiler emissions were fully compliant with both the 48-hour (Table 6) and monthly average (Table 7) compliance interpretation as specified in condition 4.1.4 of the IPPC Licence.
Table 6 Evaluation of compliance with 48-hour average emissions limits
Parameter Oxides of Sulphur
(as SO2) Nitrogen Oxides
(as NO2) Opacity
No. Measurement
Intervals 183 183 183
Boiler Ref. A B C A B C A B C
No. of Periods
above ELV 0 0 0 0 0 0 0 0 0
% of 48-hour periods
below ELV 100% 100% 100% 100% 100% 100% 100% 100% 100%
Target % below ELV
for compliance
97% 97% 97% 95% 95% 95% 97% 97% 97%
Compliant Yes Yes Yes Yes Yes Yes Yes Yes Yes

Aughinish Alumina Ltd. March 2009 AER 2009
18 | P a g e
Table 7 Evaluation of compliance with monthly average emission limits
Parameter Oxides of Sulphur
(as SO2) Nitrogen Oxides
(as NO2) Opacity
# Measurement
Intervals 12 12 12
Boiler Ref. A B C A B C A B C
No. of Periods
above ELV 0 0 0 0 0 0 0 0 0
% of monthly periods below
ELV 100% 100% 100% 100% 100% 100% 100% 100% 100%
Target % monthly
periods below ELV for
compliance
100% 100% 100% 100% 100% 100% 100% 100% 100%
Compliant Yes Yes Yes Yes Yes Yes Yes Yes Yes
Calciner Emissions
The licence requirements for Calciner particulate emissions as outlined in the revised IPPC licence are as follows:
No daily average value shall exceed the ELV (50mg/m3) No hourly average shall exceed twice the ELV
A summary of on-line data for 2009 is included in Table 8.

Aughinish Alumina Ltd. March 2009 AER 2009
19 | P a g e
Table 8 Evaluation of Compliance 2009 – Calciners
Parameter IPPC ELV (mg/m3)
Actual 2009 (mg/m3)
Comment
Daily average particulates
50 100%<50
(Average = 13) Compliant
Hourly average
particulates 100
100% < 100 (Average = 10)
Compliant
In addition, all iso-kinetic stack gas monitoring results from quarterly sampling was fully compliant with the relevant ELV‟s for calciner emissions. CHP Emissions A summary of all data for CHP emissions is included in Table 9. In all cases, the emissions were compliant with the relevant ELVs.
Table 9 Evaluation of Compliance - CHP 2009
Parameter
IPPC ELV (mg/m3)
Actual 2009 (mg/m3)
Comment
A3-A (GT1) Daily average NOX
100%< 75 100% <75
(Average = 35) Compliant
A3-A (GT1) Average of hourly
max NOX 100%< 150
100% <150 (Average = 45)
Compliant
A3-B (GT2) Daily average NOX
100%< 75 100% <75
(Average = 30) Compliant
A3-B (GT2) Average of hourly
max NOX 100%< 150
100% <150 (Average = 43)
Compliant
Dust Collection Units
Other particulate emissions are required to be sampled on a quarterly basis.
All monitoring results for each of the emission points were fully compliant with the specified emission limit values set out in the IPPC licence.
Aughinish Alumina Ltd. March 2009 AER 2009
20 | P a g e
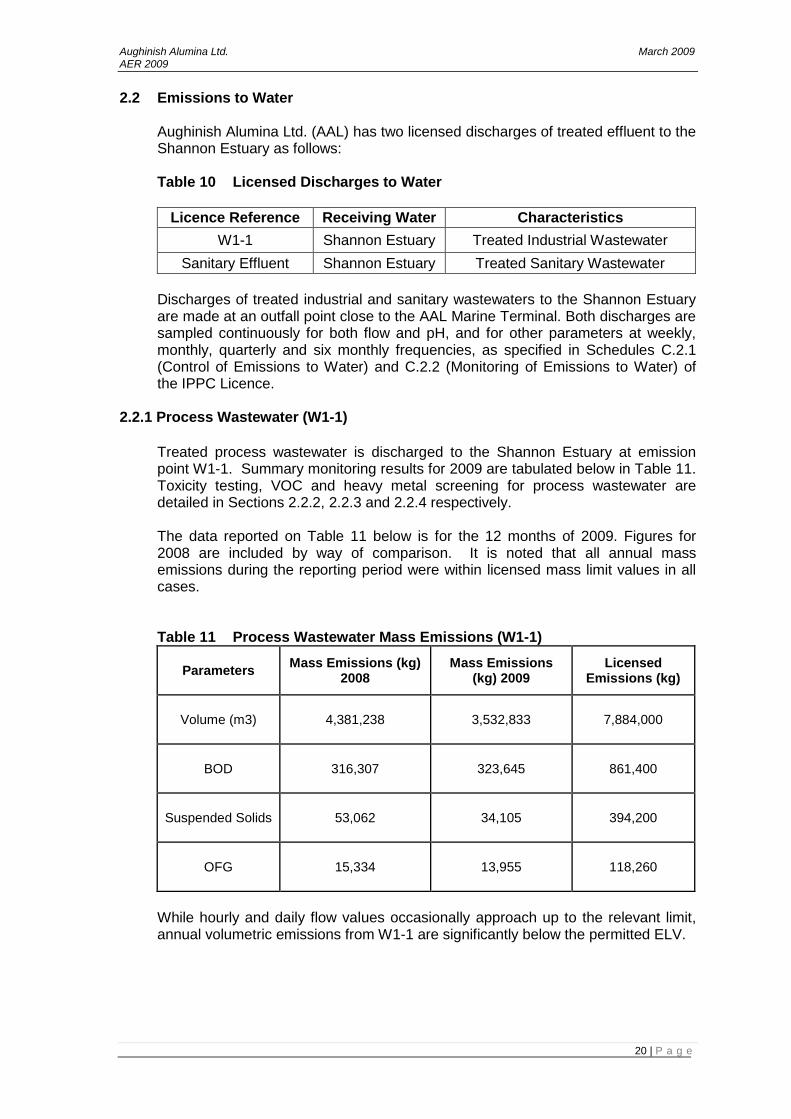
2.2 Emissions to Water
Aughinish Alumina Ltd. (AAL) has two licensed discharges of treated effluent to the Shannon Estuary as follows:
Table 10 Licensed Discharges to Water
Licence Reference Receiving Water Characteristics
W1-1 Shannon Estuary Treated Industrial Wastewater
Sanitary Effluent Shannon Estuary Treated Sanitary Wastewater
Discharges of treated industrial and sanitary wastewaters to the Shannon Estuary are made at an outfall point close to the AAL Marine Terminal. Both discharges are sampled continuously for both flow and pH, and for other parameters at weekly, monthly, quarterly and six monthly frequencies, as specified in Schedules C.2.1 (Control of Emissions to Water) and C.2.2 (Monitoring of Emissions to Water) of the IPPC Licence.
2.2.1 Process Wastewater (W1-1)
Treated process wastewater is discharged to the Shannon Estuary at emission point W1-1. Summary monitoring results for 2009 are tabulated below in Table 11. Toxicity testing, VOC and heavy metal screening for process wastewater are detailed in Sections 2.2.2, 2.2.3 and 2.2.4 respectively. The data reported on Table 11 below is for the 12 months of 2009. Figures for 2008 are included by way of comparison. It is noted that all annual mass emissions during the reporting period were within licensed mass limit values in all cases.
Table 11 Process Wastewater Mass Emissions (W1-1)
Parameters Mass Emissions (kg)
2008 Mass Emissions
(kg) 2009 Licensed
Emissions (kg)
Volume (m3) 4,381,238 3,532,833 7,884,000
BOD 316,307 323,645 861,400
Suspended Solids 53,062 34,105 394,200
OFG 15,334 13,955 118,260
While hourly and daily flow values occasionally approach up to the relevant limit, annual volumetric emissions from W1-1 are significantly below the permitted ELV.

Aughinish Alumina Ltd. March 2009 AER 2009
21 | P a g e
Figure 4 Treated wastewater mass emissions (2008 & 2009)
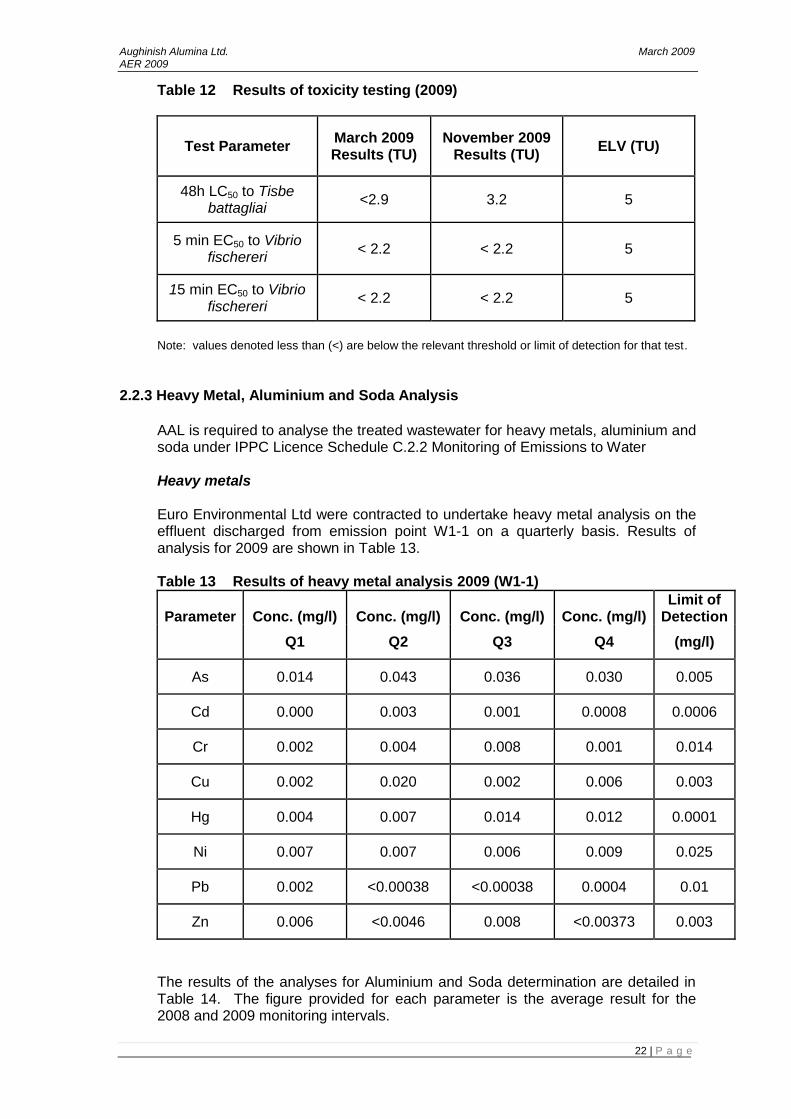
2.2.2 Toxicity Testing
Schedules B.2 (Emissions to Water) and C.2.2 (Monitoring of Emissions to Water) of the IPPC Licence require toxicity testing of the treated wastewater via Bi-Annual monitoring. The ELV for toxicity is 5 Toxic Units (TU).
2 samples of treated effluent (each consisting of 24 hour flow proportional composite samples) were collected and dispatched to the Shannon Aquatic Toxicity Laboratory (SATL) of Enterprise Ireland. These samples were collected in March and November of 2009. The acute toxicity of treated industrial wastewater was analysed on suitable sensitive aquatic indicator species i.e. Tisbe battagliai and Vibrio fischereri. The results of toxicity testing (Table 12) show that the effluent was compliant against the ELV for toxicity. The toxicity testing reports are appended as Attachment 1 of this report.
Aughinish Alumina Ltd. March 2009 AER 2009
22 | P a g e
Table 12 Results of toxicity testing (2009)
Test Parameter March 2009 Results (TU)
November 2009 Results (TU)
ELV (TU)
48h LC50 to Tisbe battagliai
<2.9 3.2 5
5 min EC50 to Vibrio fischereri
< 2.2 < 2.2 5
15 min EC50 to Vibrio fischereri
< 2.2 < 2.2 5
Note: values denoted less than (<) are below the relevant threshold or limit of detection for that test.
2.2.3 Heavy Metal, Aluminium and Soda Analysis
AAL is required to analyse the treated wastewater for heavy metals, aluminium and soda under IPPC Licence Schedule C.2.2 Monitoring of Emissions to Water Heavy metals Euro Environmental Ltd were contracted to undertake heavy metal analysis on the effluent discharged from emission point W1-1 on a quarterly basis. Results of analysis for 2009 are shown in Table 13.
Table 13 Results of heavy metal analysis 2009 (W1-1)
Parameter
Conc. (mg/l)
Conc. (mg/l)
Conc. (mg/l)
Conc. (mg/l)
Limit of Detection
Q1 Q2 Q3 Q4 (mg/l)
As 0.014 0.043 0.036 0.030 0.005
Cd 0.000 0.003 0.001 0.0008 0.0006
Cr 0.002 0.004 0.008 0.001 0.014
Cu 0.002 0.020 0.002 0.006 0.003
Hg 0.004 0.007 0.014 0.012 0.0001
Ni 0.007 0.007 0.006 0.009 0.025
Pb 0.002 <0.00038 <0.00038 0.0004 0.01
Zn 0.006 <0.0046 0.008 <0.00373 0.003
The results of the analyses for Aluminium and Soda determination are detailed in Table 14. The figure provided for each parameter is the average result for the 2008 and 2009 monitoring intervals.

Aughinish Alumina Ltd. March 2009 AER 2009
23 | P a g e
Table 14 Results of soda and aluminium analysis (W1-1)
Parameter Annual Mean
2008
Annual Mean
2009
ELV
Aluminium (as mg/l Al)
1.99 1.58 Not specified
Soda (as g/l Na2O)
2.61 3.06 Not specified
2.2.4 Wastewater Screen (VOC)
VOC screening of industrial wastewater (W1-1) is carried out on a biannual basis. Analysis was undertaken by Euro Environmental Laboratories Ltd using a modified version of the US EPA Method 524.2, as approved by the Agency (Ref. M35/AP/12). In all cases, target analytes were below the limits of detection for the parameters tested. Results are shown in Table 15. The VOC Screening Report is appended to this document in Attachment 2. Table 15 Results of VOC Screen 2009 (W1-1)
Date Test Method Result
02/04/09 VOC USEPA 542.2 < 1 .0µg/l
07/10/09 VOC USEPA 542.2 < 1 .0µg/l Note: values denoted less than (<) are below the relevant threshold or limit of detection for that test. LOD for all VOC parameters <1.0 µg/l.

Aughinish Alumina Ltd. March 2009 AER 2009
24 | P a g e
2.2.5 Sanitary Effluent
Treatment of sanitary effluent is provided for by a proprietary biological effluent treatment plant, which comprises an activated sludge stage and a settlement/clarification stage, prior to discharge. The system discharges to the industrial wastewater emission line at a point upstream of the final discharge at W1-1. An acid dosing system is in place at the sanitary effluent treatment plant to control the aeration basin pH at between 7.0 and 7.5. In the event that ingress of high pH effluent results in pH, BOD or suspended solids levels after treatment which are higher than the IPPC ELV‟s, the treated effluent is re-circulated within the system and not discharged i.e. potentially non-compliant effluent is returned for re-treatment to ensure compliance. Annual mass emissions for treated sanitary wastewater discharges are tabulated on Table 16 below.
Table 16 Sanitary effluent mass emissions 2008 & 2009
Parameters Mass Emissions
(kg) 2008 Mass Emissions
(kg) 2009 Licenced
Emissions (kg)
Volume (m3) 23,235 14,756 87,600
BOD 127 105 3,066
Suspended Solids 236 146 2,190
The annual volumetric discharge mass emissions for all parameters was significantly below permitted levels for those discharges.
Figure 5 Sanitary effluent mass emissions (2008 & 2009)

Aughinish Alumina Ltd. March 2009 AER 2009
25 | P a g e
2.2.6 Surface Water Monitoring
Monitoring of surface water run-off from the site is undertaken at five discharge locations referred to as Surface Streams (SS). Monitoring results for each emission point are summarised in Table 17 as the
average value for the monitoring period. Table 17 Results of surface water discharge monitoring 2009
Emission Point Reference
pH Conductivity
(µS/cm) Na2O (g/l)
Frequency Weekly Weekly Monthly
SS 1 7.8 134 0.010
SS 2 8.3 193 0.010
SS 3 8.2 185 0.014
SS 4 8.3 209 0.020
SS 5 8.3 356 0.030
(Note: Results are numerical average of 2009 data)
2.2.7 Surface Water Monitoring at the BRDA
Monitoring of surface water runoff in the area of the BRDA is undertaken at two locations. Results for each emission point are detailed in Table 18 and show the average value over the monitoring period. As the surface water in the area is subject to saline intrusion, the soda values are subject to sodium interference owing to the presence of sodium salts in the brackish water.
Table 18 Surface water monitoring results in the BRDA 2009
Description pH Conductivity
µS/cm Soda (Na2O) g/l
Mangan's Lough 7.00 822 0.15
OPW Channel 7.85 2433 0.49
(Note: Results are numerical average of 2009 data)
2.2.8 Discharges to Water Compliance Summary
All discharges of treated process wastewater and sanitary effluent complied fully with the relevant emission limit values set out in the IPPC licence.
Aughinish Alumina Ltd. March 2009 AER 2009
26 | P a g e
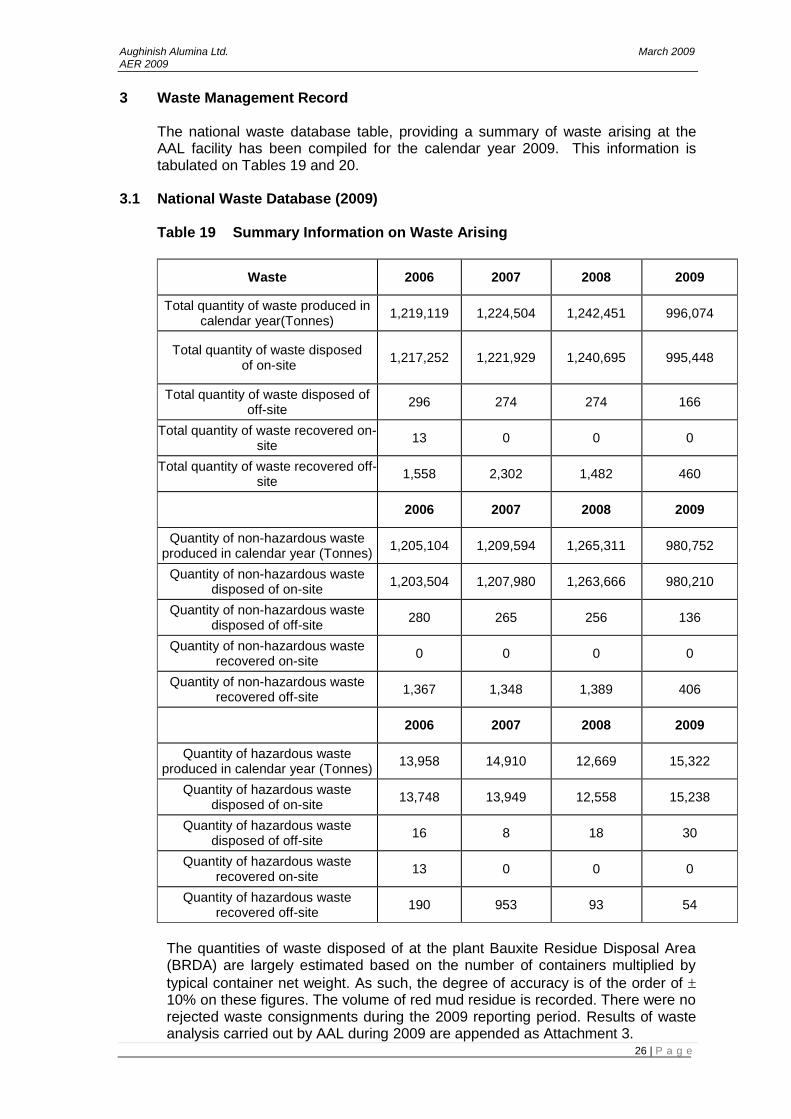
3 Waste Management Record
The national waste database table, providing a summary of waste arising at the AAL facility has been compiled for the calendar year 2009. This information is tabulated on Tables 19 and 20.
3.1 National Waste Database (2009)
Table 19 Summary Information on Waste Arising
Waste 2006 2007 2008 2009
Total quantity of waste produced in calendar year(Tonnes)
1,219,119 1,224,504 1,242,451 996,074
Total quantity of waste disposed of on-site
1,217,252 1,221,929 1,240,695 995,448
Total quantity of waste disposed of off-site
296 274 274 166
Total quantity of waste recovered on-site
13 0 0 0
Total quantity of waste recovered off-site
1,558 2,302 1,482 460
2006 2007 2008 2009
Quantity of non-hazardous waste produced in calendar year (Tonnes)
1,205,104 1,209,594 1,265,311 980,752
Quantity of non-hazardous waste disposed of on-site
1,203,504 1,207,980 1,263,666 980,210
Quantity of non-hazardous waste disposed of off-site
280 265 256 136
Quantity of non-hazardous waste recovered on-site
0 0 0 0
Quantity of non-hazardous waste recovered off-site
1,367 1,348 1,389 406
2006 2007 2008 2009
Quantity of hazardous waste produced in calendar year (Tonnes)
13,958 14,910 12,669 15,322
Quantity of hazardous waste disposed of on-site
13,748 13,949 12,558 15,238
Quantity of hazardous waste disposed of off-site
16 8 18 30
Quantity of hazardous waste recovered on-site
13 0 0 0
Quantity of hazardous waste recovered off-site
190 953 93 54
The quantities of waste disposed of at the plant Bauxite Residue Disposal Area (BRDA) are largely estimated based on the number of containers multiplied by
typical container net weight. As such, the degree of accuracy is of the order of 10% on these figures. The volume of red mud residue is recorded. There were no rejected waste consignments during the 2009 reporting period. Results of waste analysis carried out by AAL during 2009 are appended as Attachment 3.

Aughinish Alumina Ltd. March 2009 AER 2009
27 | P a g e
There was an overall decrease of 246,377 tonnes in the quantity of waste generated on site when compared to figures for 2008 and this was associated with the decrease in production from 1.89 million tonnes of alumina hydrate in 2008 to 1.24 million tonnes of alumina hydrate in 2009.
Aughinish Alumina Ltd. March 2009 AER 2008
28 | P a g e
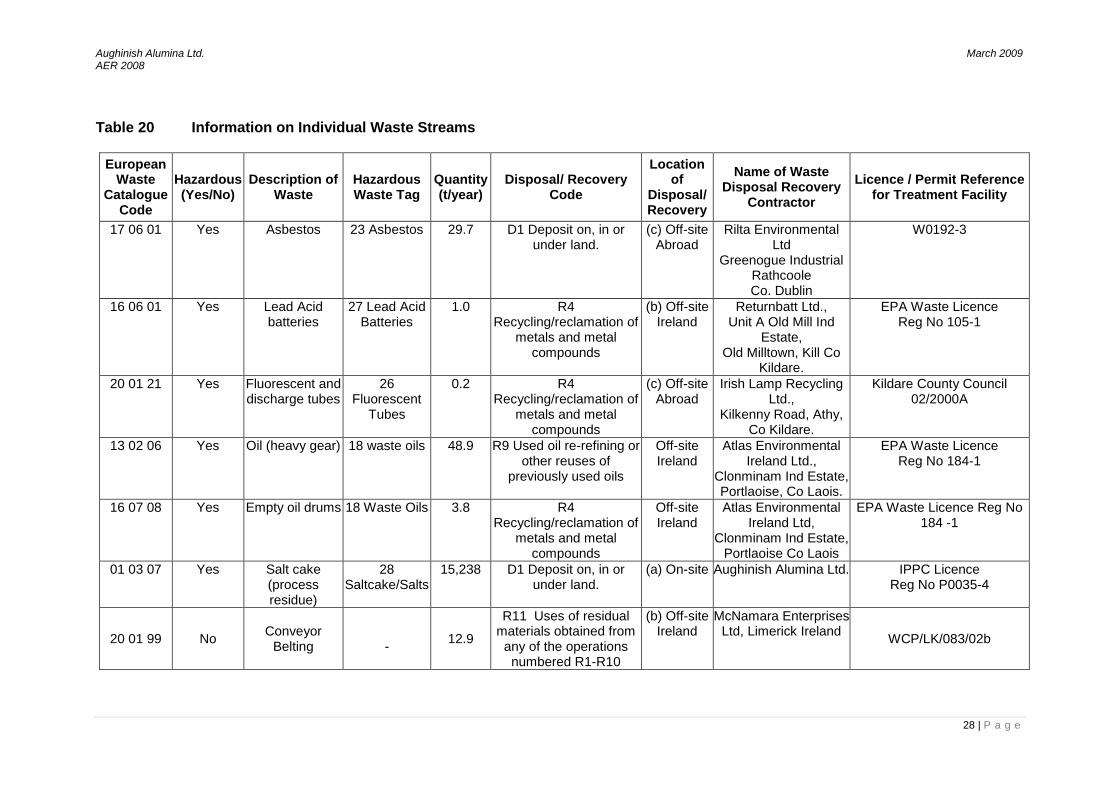
Table 20 Information on Individual Waste Streams
European Waste
Catalogue Code
Hazardous (Yes/No)
Description of Waste
Hazardous Waste Tag
Quantity (t/year)
Disposal/ Recovery Code
Location of
Disposal/ Recovery
Name of Waste Disposal Recovery
Contractor
Licence / Permit Reference for Treatment Facility
17 06 01 Yes Asbestos 23 Asbestos 29.7 D1 Deposit on, in or under land.
(c) Off-site Abroad
Rilta Environmental Ltd
Greenogue Industrial Rathcoole Co. Dublin
W0192-3
16 06 01 Yes Lead Acid batteries
27 Lead Acid Batteries
1.0 R4 Recycling/reclamation of
metals and metal compounds
(b) Off-site Ireland
Returnbatt Ltd., Unit A Old Mill Ind
Estate, Old Milltown, Kill Co
Kildare.
EPA Waste Licence Reg No 105-1
20 01 21 Yes Fluorescent and discharge tubes
26 Fluorescent
Tubes
0.2 R4 Recycling/reclamation of
metals and metal compounds
(c) Off-site Abroad
Irish Lamp Recycling Ltd.,
Kilkenny Road, Athy, Co Kildare.
Kildare County Council 02/2000A
13 02 06 Yes Oil (heavy gear) 18 waste oils 48.9 R9 Used oil re-refining or other reuses of
previously used oils
Off-site Ireland
Atlas Environmental Ireland Ltd.,
Clonminam Ind Estate, Portlaoise, Co Laois.
EPA Waste Licence Reg No 184-1
16 07 08 Yes Empty oil drums 18 Waste Oils 3.8 R4 Recycling/reclamation of
metals and metal compounds
Off-site Ireland
Atlas Environmental Ireland Ltd,
Clonminam Ind Estate, Portlaoise Co Laois
EPA Waste Licence Reg No 184 -1
01 03 07 Yes Salt cake (process residue)
28 Saltcake/Salts
15,238 D1 Deposit on, in or under land.
(a) On-site Aughinish Alumina Ltd. IPPC Licence Reg No P0035-4
20 01 99 No Conveyor
Belting -
12.9
R11 Uses of residual materials obtained from
any of the operations numbered R1-R10
(b) Off-site Ireland
McNamara Enterprises Ltd, Limerick Ireland
WCP/LK/083/02b

Aughinish Alumina Ltd. March 2009 AER 2008
29 | P a g e
European Waste
Catalogue Code
Hazardous (Yes/No)
Description of Waste
Hazardous Waste Tag
Quantity (t/year)
Disposal/ Recovery Code
Location of
Disposal/ Recovery
Name of Waste Disposal Recovery
Contractor
Licence / Permit Reference for Treatment Facility
20 03 01 No General Refuse -
120.4 D1 Deposit on, in or
under land. (b) Off-site
Ireland Veolia Environmental Services, Dock Road,
Limerick.
EPA Waste Licence Reg No 82-2
01 03 99 No Lime grits - 4371 D1 Deposit on, in or
under land. (a) On-site Aughinish Alumina Ltd. IPPC Licence
Reg No P0035-4
20 01 39 No Plastic
containers (empty)
-
18.2
R11 Uses of residual materials obtained from
any of the operations numbered R1-R10
(b) Off-site Ireland
Rilta Environmental Ltd. Greenogue Business Park,
Rathcoole, Co. Dublin
WO192-03
01 03 99 No Process waste (scales, sand
etc)
-
92,398 D1 Deposit on, in or
under land. (a) On-site Aughinish Alumina Ltd.
IPPC Licence Reg No P0035-4
01 03 09 No Red mud -
882,876
D1 Deposit on, in or under land.
(a) On-site Aughinish Alumina Ltd. IPPC Licence
Reg No P0035-4
10 01 99 No Refractory - 110 D1 Deposit on, in or
under land. (a) On-site Aughinish Alumina Ltd. IPPC Licence
Reg No P0035-4
19 08 05 No Sanitary effluent
sludge - 455
D1 Deposit on, in or under land.
(a) On-site Aughinish Alumina Ltd. IPPC Licence Reg No P0035-4
17 04 07 No Scrap metal -
327
R4 Recycling/reclamation of
metals and metal compounds
(c) Off-site Abroad
Hegarty metals Recycling,
Ballysimon Road, Limerick
Limerick County Council WP05-04
16 01 03 No Tyres (used) -
0.9
R11 Uses of residual materials obtained from
any of the operations numbered R1-R10
(b) Off-site Ireland
R Quinn Clarina Co Limerick
WCP/LK/255/05b

Aughinish Alumina Ltd. March 2009 AER 2008
30 | P a g e
European Waste
Catalogue Code
Hazardous (Yes/No)
Description of Waste
Hazardous Waste Tag
Quantity (t/year)
Disposal/ Recovery Code
Location of
Disposal/ Recovery
Name of Waste Disposal Recovery
Contractor
Licence / Permit Reference for Treatment Facility
20 01 38 No Wood -
21.8
R3 Recycling/reclamation of
organic substances which are not used as
solvents
(b) Off-site Ireland
Veolia Environmental Services, Dock Road,
Limerick. EPA Waste Licence
Reg No 82-2
20 01 37 No Wood - 14.6 D1 Deposit on, in or
under land. (b) Off-site
Ireland Veolia Environmental Services, Dock Road,
Limerick.
EPA Waste Licence Reg No 82-2
20 01 99 No Used hosing -
12.9
R11 Uses of residual materials obtained from
any of the operations numbered R1-R10
(b) Off-site Ireland
Veolia Environmental Services, Dock Road,
Limerick. EPA Waste Licence
Reg No 82-2
09 01 07 No X-ray Fixer
Replenisher & Film
-
0.7
R4 Recycling/reclamation of
metals & other metal compounds
(b) Off-site Ireland
Silver Lining, Unit 61 Cookstown Ind
Estate Tallaght , Dublin 24
EPA Waste Licence Reg No W 0122-01
18 01 04 No Clinical Waste - 1.0 D1 Deposit on, in or
under land. (b) Off-site
Ireland Transafe Ltd. Unit 4A, Beach Court Kilcoole,
Co. Wicklow CW011
20 01 38 No Timber Reels
(used) - 2.8
R11 Uses of residual materials obtained from
any of the operations numbered R1-R10
(b) Off-site Ireland
Hegarty Hammond, Tipperary Rd, Limerick
-
20 01 01 No Cardboard - 9.4 R5
Recycling/reclamation of other inorganic materials
b) Off-site Ireland
Veolia, Dock Road Limerick
EPA Waste Licence Reg No 82-2
16 01 07 Yes Oil Filters 18 waste oils 0.005
R9 Used oil re-refining or other reuses of
previously used oils
Off-site Ireland
Atlas Environmental Ireland Ltd.,
Clonminam Ind Estate, Portlaoise, Co Laois.
EPA Waste Licence Reg No 184-1

Aughinish Alumina Ltd. March 2009 AER 2009
32 | P a g e
4 Monitoring and Enforcement 4.1 Monitoring
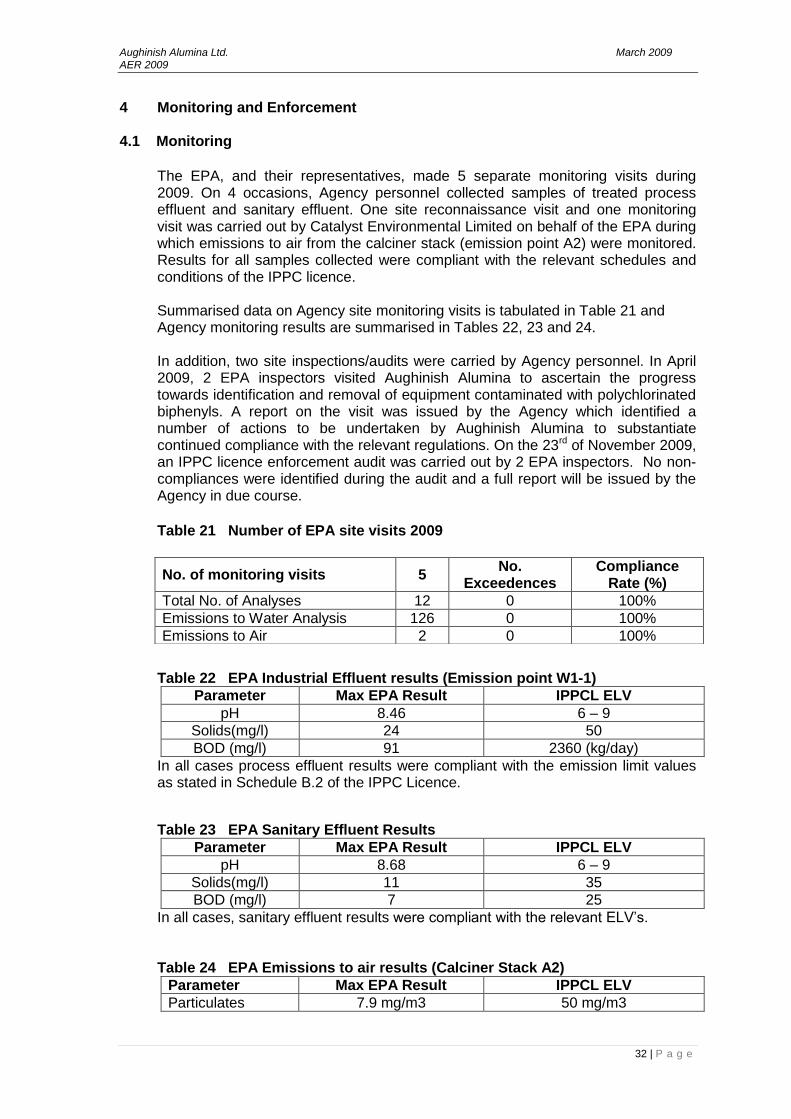
The EPA, and their representatives, made 5 separate monitoring visits during 2009. On 4 occasions, Agency personnel collected samples of treated process effluent and sanitary effluent. One site reconnaissance visit and one monitoring visit was carried out by Catalyst Environmental Limited on behalf of the EPA during which emissions to air from the calciner stack (emission point A2) were monitored. Results for all samples collected were compliant with the relevant schedules and conditions of the IPPC licence. Summarised data on Agency site monitoring visits is tabulated in Table 21 and Agency monitoring results are summarised in Tables 22, 23 and 24. In addition, two site inspections/audits were carried by Agency personnel. In April 2009, 2 EPA inspectors visited Aughinish Alumina to ascertain the progress towards identification and removal of equipment contaminated with polychlorinated biphenyls. A report on the visit was issued by the Agency which identified a number of actions to be undertaken by Aughinish Alumina to substantiate continued compliance with the relevant regulations. On the 23rd of November 2009, an IPPC licence enforcement audit was carried out by 2 EPA inspectors. No non-compliances were identified during the audit and a full report will be issued by the Agency in due course. Table 21 Number of EPA site visits 2009
Table 22 EPA Industrial Effluent results (Emission point W1-1)
Parameter Max EPA Result IPPCL ELV
pH 8.46 6 – 9
Solids(mg/l) 24 50
BOD (mg/l) 91 2360 (kg/day)
In all cases process effluent results were compliant with the emission limit values as stated in Schedule B.2 of the IPPC Licence.
Table 23 EPA Sanitary Effluent Results
Parameter Max EPA Result IPPCL ELV
pH 8.68 6 – 9
Solids(mg/l) 11 35
BOD (mg/l) 7 25
In all cases, sanitary effluent results were compliant with the relevant ELV‟s.
Table 24 EPA Emissions to air results (Calciner Stack A2)
Parameter Max EPA Result IPPCL ELV
Particulates 7.9 mg/m3 50 mg/m3
No. of monitoring visits 5 No.
Exceedences Compliance
Rate (%)
Total No. of Analyses 12 0 100%
Emissions to Water Analysis 126 0 100%
Emissions to Air 2 0 100%

Aughinish Alumina Ltd. March 2009 AER 2009
33 | P a g e
4.2 Third Party Inspections
AAL obtained certification to the international environmental management system (EMS) standard, ISO14001, in 2000. Det Norske Veritas Quality Assurance (DNV-QA) carried out a full re-certification audit in November 2009. No significant non-conformances were raised during this audit. It is noted that AAL operates a rigorous internal audit schedule in order to ensure conformance with plant operating systems (production, quality, safety, environmental) and to facilitate the process of continual improvement in those systems.
Aughinish Alumina Ltd. March 2009 AER 2009
34 | P a g e
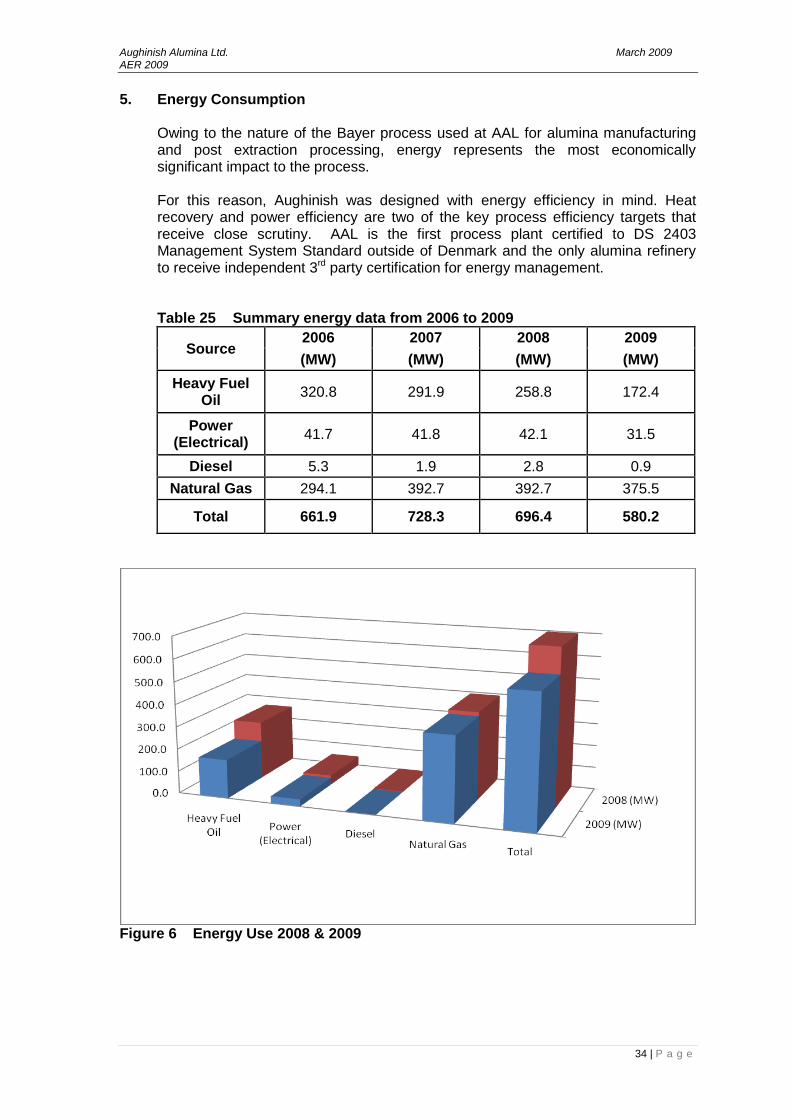
5. Energy Consumption
Owing to the nature of the Bayer process used at AAL for alumina manufacturing and post extraction processing, energy represents the most economically significant impact to the process. For this reason, Aughinish was designed with energy efficiency in mind. Heat recovery and power efficiency are two of the key process efficiency targets that receive close scrutiny. AAL is the first process plant certified to DS 2403 Management System Standard outside of Denmark and the only alumina refinery to receive independent 3rd party certification for energy management. Table 25 Summary energy data from 2006 to 2009
Source 2006 2007 2008 2009
(MW) (MW) (MW) (MW)
Heavy Fuel Oil
320.8 291.9 258.8 172.4
Power (Electrical)
41.7 41.8 42.1 31.5
Diesel 5.3 1.9 2.8 0.9
Natural Gas 294.1 392.7 392.7 375.5
Total 661.9 728.3 696.4 580.2
Figure 6 Energy Use 2008 & 2009
Aughinish Alumina Ltd. March 2009 AER 2009
35 | P a g e
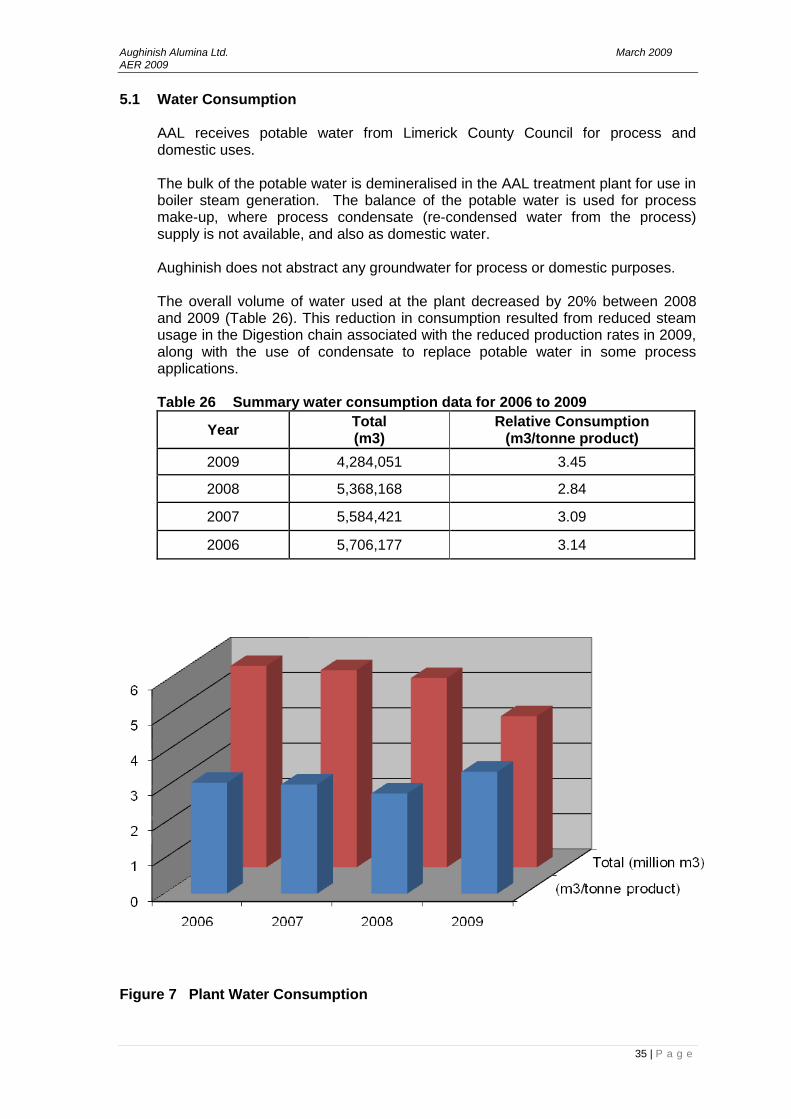
5.1 Water Consumption
AAL receives potable water from Limerick County Council for process and domestic uses. The bulk of the potable water is demineralised in the AAL treatment plant for use in boiler steam generation. The balance of the potable water is used for process make-up, where process condensate (re-condensed water from the process) supply is not available, and also as domestic water. Aughinish does not abstract any groundwater for process or domestic purposes. The overall volume of water used at the plant decreased by 20% between 2008 and 2009 (Table 26). This reduction in consumption resulted from reduced steam usage in the Digestion chain associated with the reduced production rates in 2009, along with the use of condensate to replace potable water in some process applications.
Table 26 Summary water consumption data for 2006 to 2009
Year Total (m3)
Relative Consumption (m3/tonne product)
2009 4,284,051 3.45
2008 5,368,168 2.84
2007 5,584,421 3.09
2006 5,706,177 3.14
Figure 7 Plant Water Consumption

Aughinish Alumina Ltd. March 2009 AER 2009
36 | P a g e
6. Environmental Incidents and Complaints
In the event of an environmental incident occurring, AAL informs the EPA and where appropriate, Limerick County Council and the Shannon Fisheries Board. Copies of all notification correspondence are forwarded to the installation auditors, DNV QA. As part of the requirements of the IPPC licence, AAL operates, through the plant Environmental Management System, a procedure for logging and responding to complaints received from the Public. There were no environmental incidents during 2009. 1 complaint was received during the year.
6.1 Significant Environmental Incidents
There were no significant environmental incidents during 2009.
6.2 Recordable Incidents
There were no notifiable incidents during 2009.
6.3 Complaints
In 2009 there was 1 complaint received by AAL. A telephone call was received in February 2009 from a neighbour to the site living in Fawnamore, Askeaton, Co. Limerick regarding dusting from the road adjacent to their house, which is the access road to the AAL site. Upon receipt of the telephone call, AAL organised to have the road in question washed with potable water to minimise dusting. Any dusting which may have occurred is believed to have been due to the movement of traffic to and from the Aughinish site. AAL continued to monitor all traffic leaving the site in order to assure that any potential for dusting along the relevant section of roadway was minimised.
Aughinish Alumina Ltd. March 2009 AER 2009
37 | P a g e
7. Environmental Management
Section 7 of this AER contains summary information on the AAL Environmental Management Programme (EMP). A revised Schedule of Objectives and Targets for 2010 is presented in Section 7.2 for Agency approval. Both the EMP and Schedule of Objectives and Targets fall under the site ISO 14001 Environmental Management System. Accordingly, they are included within a structured system of management review and periodic auditing by both internal auditors and independent 3rd party auditors (DNV-QA). The Pollution Release and Transfer Register, which is a requirement of Condition 6.14 of the IPPCL, has been updated to reflect emissions during the 2009 monitoring period.
7.1 Environmental Management Programme Report for 2009
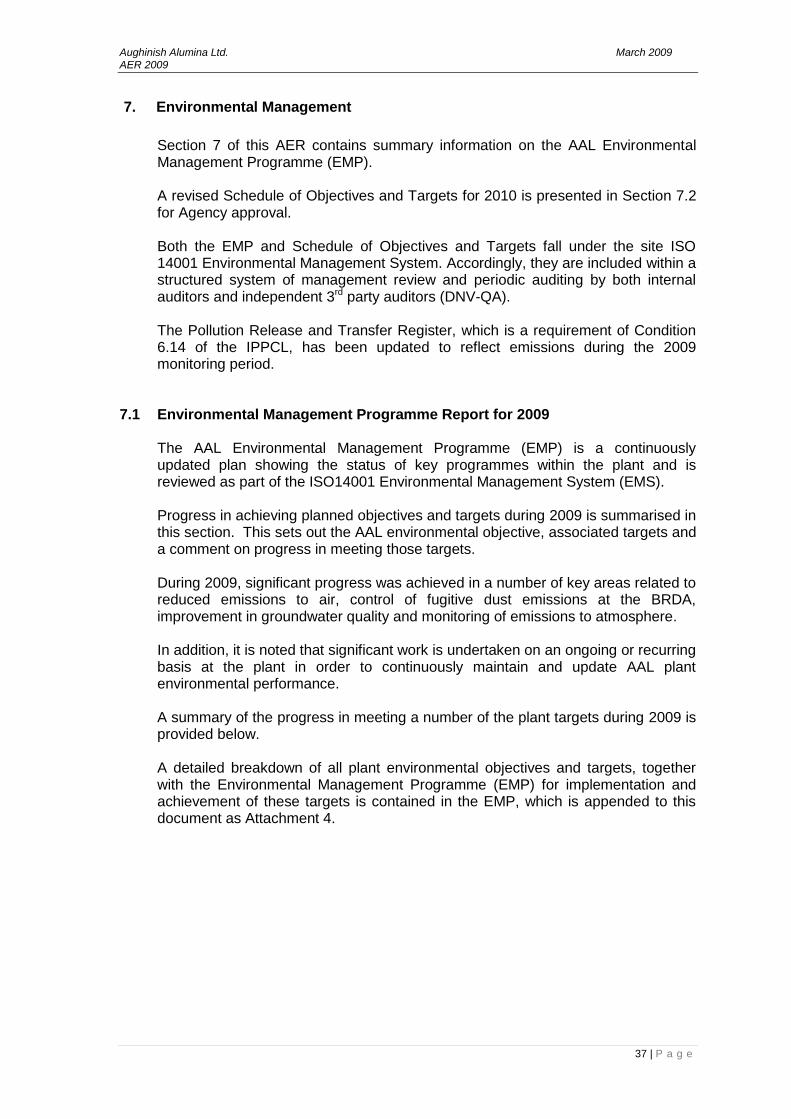
The AAL Environmental Management Programme (EMP) is a continuously updated plan showing the status of key programmes within the plant and is reviewed as part of the ISO14001 Environmental Management System (EMS). Progress in achieving planned objectives and targets during 2009 is summarised in this section. This sets out the AAL environmental objective, associated targets and a comment on progress in meeting those targets. During 2009, significant progress was achieved in a number of key areas related to reduced emissions to air, control of fugitive dust emissions at the BRDA, improvement in groundwater quality and monitoring of emissions to atmosphere. In addition, it is noted that significant work is undertaken on an ongoing or recurring basis at the plant in order to continuously maintain and update AAL plant environmental performance. A summary of the progress in meeting a number of the plant targets during 2009 is provided below. A detailed breakdown of all plant environmental objectives and targets, together with the Environmental Management Programme (EMP) for implementation and achievement of these targets is contained in the EMP, which is appended to this document as Attachment 4.
Aughinish Alumina Ltd. March 2009 AER 2009
38 | P a g e
Table 27 EMP 2009 Report
Reference Objective Target Comment
1
Improve air quality Implement NOX reduction programme on boilers
C boiler equipped with staged combustion end 2008. NOx reduced by 20% ~150 mg/nm3
2
Operate the on-site landfill to best practice
All ongoing landfill operations to be to best practice standard
Mud farming via Australian Amfirol implemented in 2009. Mud compacting faster and reduced risk of localised dust.
3 Improve visual appearance of AAL
Continue with 5 year landscaping plan
No further landscaping in 2009
4
Elimination of sources of groundwater contamination
Integrity testing & repairs to be completed as scheduled.
2009 programme completed. Bunds compliant.
5 Caustic Mass Balance
Unaccounted for caustic balance to be reduced
All caustic accounted for within balance
6
Reduction in BOD Continue to achieve BOD discharge of levels of not more than 1500kg/day
Plant test showed BOD reduction feasible via aerobic bacteria. Future permanent system under review.
7
Reduction in CO2 emissions from site
CO2 emissions in 2009 to be reduced by decreased use of boilers
Utilise natural gas in high efficiency CHP and match steam to demand with HFO. Implemented anti-scaling additives to minimise digestion tube silica fouling
8
Neutralisation step for bauxite residue prior to deposition to BRDA
Neutralisation method to be agreed with Agency in 2009
Commenced a 2 year post doctoral study in U.L. in Sept 2009 to examine neutralisation via CO2, gypsum and H2SO4
9
Implementation of recommendations of Golders Associates report
Risk reduction assessment to be completed
Engagement of consultants deferred until 2010
10
Implementation of recommendations of closure plan as per Residues Solutions report
Closure revegetation trial cell grassing to be completed.
Closure demonstration cell being assessed continuously as part of the BRDA re-vegetation post doctoral research at U.L.
11
Review of sampling & analysis methods for compliance with EPA guidelines
Review of all relevant procedures during 2009
Review completed & all procedures in order. Some additional requirements for CEMS calibration being assessed.
12
Fugitive emissions programme
Initiate Fugitive emissions monitoring programme
Survey completed and no significant issues identified. Main area for potential improvement is jetty loader.

Aughinish Alumina Ltd. March 2009 AER 2009
39 | P a g e
7.2 Environmental Objectives and Targets for 2010
AAL reviews the plant Environmental Management System on an ongoing basis with the aim of updating and refining the Environmental Management Programme (EMP) to take account of progress in meeting objectives and targets.
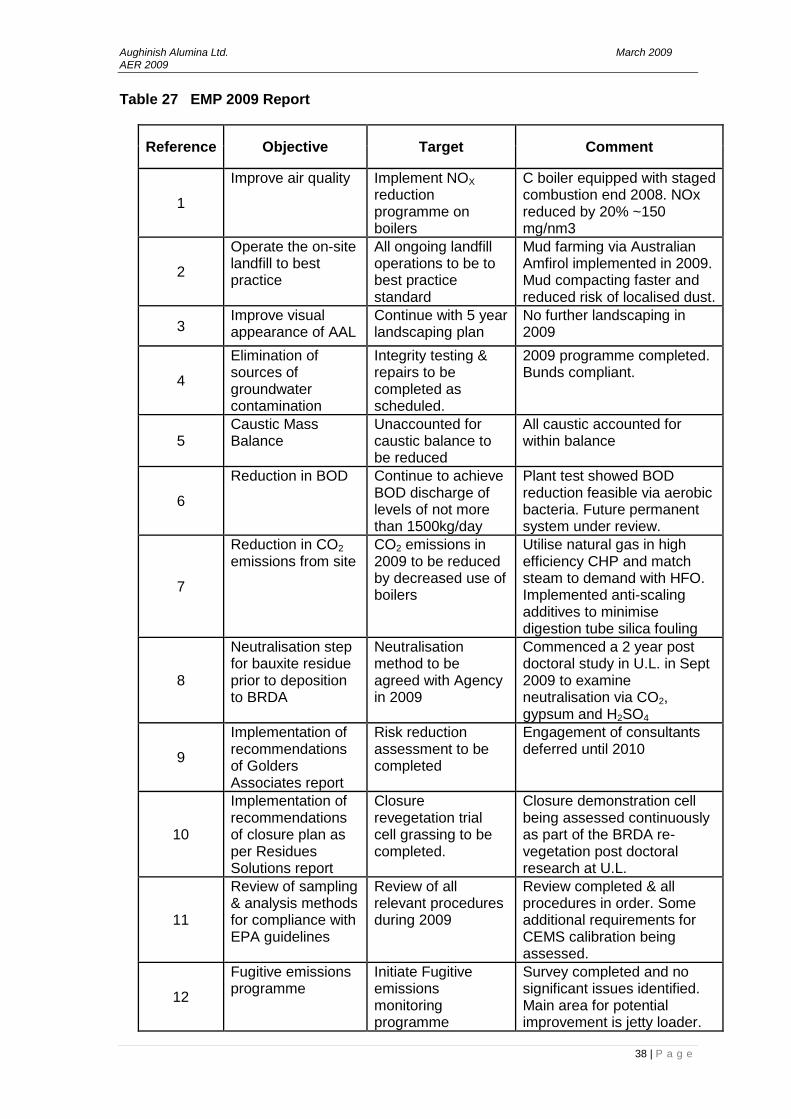
In addition, new targets are added on the basis of achievement of existing targets and where issues have been identified as requiring a formal and structured EMP approach to drive their implementation. New targets, which have been added for 2010 are summarised below in Table 28. This list highlights only those targets added to the EMP and excludes the significant work involved in ongoing programmes and projects to achieve existing targets, the detail of which is set out in the EMP for 2010. Accordingly, the primary focus of the EMP in achieving significant environmental objectives during 2010 will be the continued improvement of air emission quality, by the conversion of one of the Calciner units to a dual fuel capability which will allow for the use of natural gas in place of heavy fuel oil.
Aughinish Alumina Ltd. March 2009 AER 2009
40 | P a g e
Table 28 EMP Objectives and Targets 2010
No. Objective Target
1 Improve air quality Implement the use of natural gas on one Calciner (currently HFO)
2 Operate the on-site landfill to best practice
Enhanced use of Amfirol for mud farming & dust control.
3 Elimination of sources of groundwater contamination
Maintain the on-going improvement in groundwater quality.
4 Caustic Mass Balance Close the caustic balance for 2010
5 Reduction in BOD Implement the BOD reduction programme on a permanent basis
6 Reduction in CO2 emissions from site
CO2 emissions in 2010 to be reduced by conversion of a Calciner to dual fuel capability incorporating natural gas
7 Neutralisation step for bauxite residue prior to deposition to BRDA
Make proposal to EPA to plant test methodology for partial neutralisation
8 Implementation of recommendations of Golders Associates report
Commission consultant to conduct study on impact of climate change on BRDA integrity.
9 Implementation of recommendations of closure plan as per Residues Solutions report
Progress report on BRDA rehabilitation and sustainability
10 Fugitive emissions programme Develop improvement programme to minimise alumina fugitive dusting, focus area will be jetty.
Aughinish Alumina Ltd. March 2009 AER 2009
41 | P a g e
7.3 Pollutant Release and Transfer Register 7.3.1 Pollutant Release and Transfer Register 2009
The Pollutant Release and Transfer Register (PRTR) have been updated to provide further data for the calendar year 2009. Based upon the emissions arising from the boilers and calciners, and also emissions which currently appear on the European Pollutant Emission Register (EPER), the following substances are included in the PER for 2009; o Sulphur dioxide (SO2) o Oxides of nitrogen (as NO2) o Particulate matter o Carbon dioxide o Arsenic o Cadmium o Chromium o Copper o Nickel o Zinc o Mercury o Lead o Caustic (Sodium Hydroxide) Sulphur dioxide mass emissions are based on measured mass concentrations and calculated volumetric flow rates. Nitrogen dioxide and particulate mass emissions have been calculated based on results of direct measurement. Carbon Dioxide and Heavy metal emissions have been calculated based on fuel consumption multiplied by the appropriate emission factor. Emission factors used for calculations Hg, Cr and Cu are based on Ireland specific emission factors for oil fired power plant. All other emission calculations are based on UK NAEI dataset for fuel oil fire power stations.

Aughinish Alumina Ltd. March 2009 AER 2009
42 | P a g e
Table 29 PRTR for 2009
Emissions to Air (tonnes)
Source
CHP Calciner Boiler Total
(Tonnes) Method of
Measurement* Pollutant Name
Oxides of Sulphur (as
SO2) 10 604 788 1402 E & M
Nitrogen oxides
(as NO2) 326 373 292 991 E & M
Particulates N/A 63 16 79 E & M
Carbon Dioxide**
715,403 276,544 167,869 1,159,817 E & M
Arsenic N/A 0.010 0.006 0.016 C
Cadmium N/A 0.011 0.007 0.018 C
Chromium N/A 0.014 0.008 0.022 C
Copper N/A 0.014 0.008 0.022 C
Mercury N/A 0.002 0.001 0.003 C
Nickel N/A 0.485 0.289 0.774 C
Lead N/A 0.027 0.016 0.044 C
Zinc N/A 0.039 0.023 0.063 C
*Method of Measurement (Direct Measurement - M; Engineering Estimates – E; Calculations - C) ** Includes emissions from propane (canteen and laboratories) & diesel (space heating & CHP)
7.3.2 Caustic Mass Balance
AAL have continued to undertake a detailed evaluation of caustic flows within the process during 2009. This work has continued on previous mass balance exercises undertaken at the plant over the past few years in order to further close out the quantity of caustic which are unaccounted for. The mass balance undertaken during 2009, and tabulated below, has closed off the input-output cycle and resolved caustic consumption at the plant to approximately 3.60kg caustic (Sodium Hydroxide) per tonne of alumina hydrate produced. This is likely to be due to margins of error in sampling and measurement of caustic concentrations of minor streams which are based on periodic grab samples.

Aughinish Alumina Ltd. March 2009 AER 2009
43 | P a g e
Table 30 Results of Caustic Mass Balance
Element Units (kg/tH)
Input
Total Caustic Consumption 49.85
Outputs
Caustic in Mud 36.79
Caustic in Alumina 3.57
Caustic in Alumina Hydrate Ships 0.27
Caustic in Sand to BRDA 1.07
Caustic in Saltcake to BRDA 4.11
Caustic in process scale from Tank Turnarounds shipped to BRDA
0.83
Caustic in West pond disposal to the BRDA (Storm Water Pond)
4.01
Caustic in treated (neutralized & clarified) industrial effluents to the river
3.22
Caustic recovery to process from the BRDA -0.43
Total Output 53.44
Unaccounted (i.e. outputs over estimated) -3.60
7.3.3 Proposed PRTR for 2010
Based upon emissions arising from the boilers and calciners, and also the emissions which appear on the European Pollutant Emission Register (EPER), AAL proposes that the following substances are included in the PRTR for 2010; o Sulphur dioxide (SO2) o Oxides of nitrogen (as NO2) o Particulate matter o Carbon dioxide o Arsenic o Cadmium o Chromium o Copper o Nickel o Zinc o Mercury o Lead o Caustic (Sodium Hydroxide)
Aughinish Alumina Ltd. March 2009 AER 2009
44 | P a g e
8. Other Reports
This section contains details of other once off projects and reports required under the various conditions of the IPPC licence.
Monitoring data from annual surveys (noise) together with results from ambient air quality, dust deposition and groundwater monitoring are summarised.
The financial provisions of the plant decommissioning and closure programme along with environmental insurance requirements are updated to reflect recent changes at the plant.
The landfill status report is a recurring requirement of the IPPCL and has been updated to reflect quantities of waste deposited and development works undertaken during the 2009 calendar year.
Generally, where documentation has already been submitted to the Agency, summarised information is provided. Otherwise, full text reports are included as attachments where relevant.

Aughinish Alumina Ltd. March 2009 AER 2009
45 | P a g e
8.1 Noise Monitoring Programme
Aughinish Alumina Limited is required to carry out an annual noise survey (IPPC Licence Condition 6.13). The relevant noise limits at off-site noise sensitive locations (NSL) are:
o Day: 55 dB (A) Leq o Night: 45 dB (A) Leq
A survey of noise levels at a series of perimeter and off site noise sensitive locations was carried out on the 23/12/09 and 24/12/09.
At each monitoring point, day and night-time measurements were made for the following measurement parameters: LAeq, LAmax, LAmin, LA90 and LA10. The results of monitoring are summarised on Table 31 and 32.
Table 31 Noise Survey Results – Noise Sensitive Locations dB(A)
Noise levels measured at sensitive receptor locations during day-time periods ranged from LAeq 48dB(A) to 55dB(A) with corresponding LA90 values ranging from 43dB(A) to 48db(A).
The night-time LAeq values recorded ranged from 40dB (A) to 45dB (A) with corresponding LA90 values ranging from 36dB (A) to 45dB (A). During both survey periods the noise climate at all off-site noise sensitive receptors was dominated by road traffic on the N69 and wind generated noise. The AAL facility was inaudible.
Noise results for the seven perimeter locations are tabulated in Table 32.
Location Day time Night-Time
LAeq LA90 LA10 LAeq LA90 LA10
NSL 1 49.2 48.2 53.9 45.3 44.6 45.9
NSL 2 53.1 47.1 48.2 41.0 36.7 40.3
NSL 3 53.2 46.7 53.0 44.3 41.2 43.9
NSL 4 48.2 42.5 53.6 39.5 37.8 40.8
NSL 5 55.1 52.4 49.6 43.8 41.6 43.9
Aughinish Alumina Ltd. March 2009 AER 2009
46 | P a g e
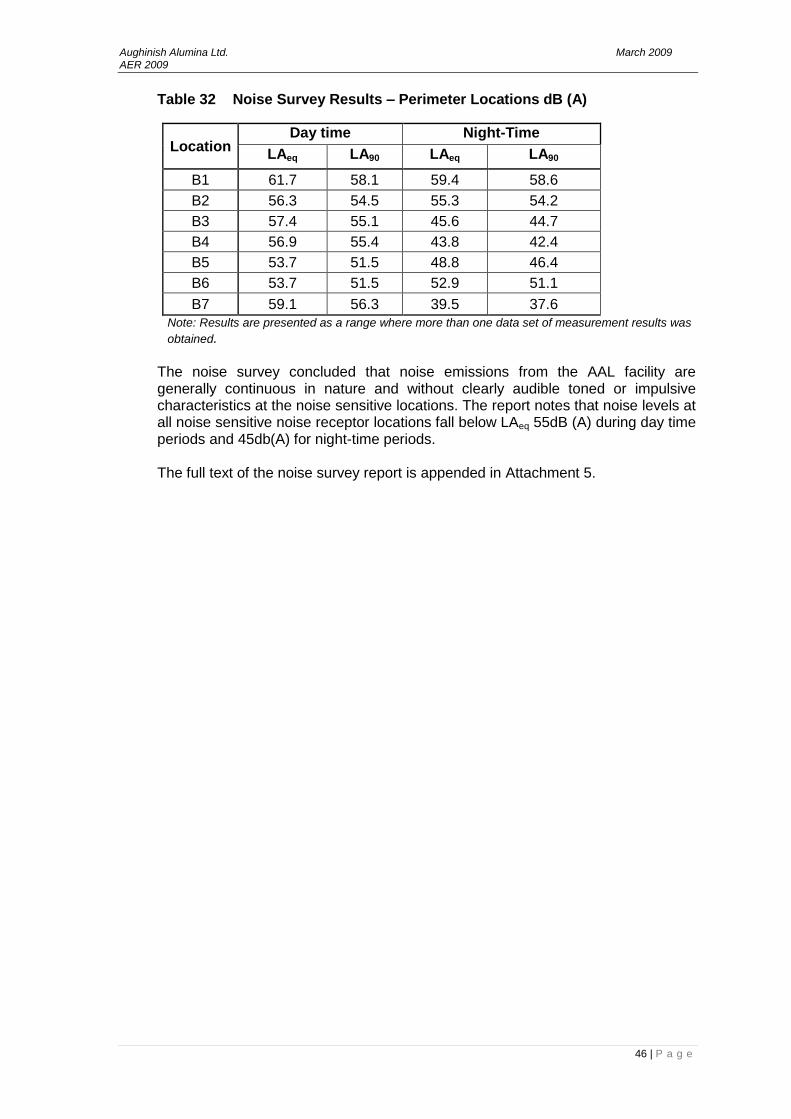
Table 32 Noise Survey Results – Perimeter Locations dB (A)
Location Day time Night-Time
LAeq LA90 LAeq LA90
B1 61.7 58.1 59.4 58.6
B2 56.3 54.5 55.3 54.2
B3 57.4 55.1 45.6 44.7
B4 56.9 55.4 43.8 42.4
B5 53.7 51.5 48.8 46.4
B6 53.7 51.5 52.9 51.1
B7 59.1 56.3 39.5 37.6
Note: Results are presented as a range where more than one data set of measurement results was
obtained.
The noise survey concluded that noise emissions from the AAL facility are generally continuous in nature and without clearly audible toned or impulsive characteristics at the noise sensitive locations. The report notes that noise levels at all noise sensitive noise receptor locations fall below LAeq 55dB (A) during day time periods and 45db(A) for night-time periods. The full text of the noise survey report is appended in Attachment 5.

Aughinish Alumina Ltd. March 2009 AER 2009
47 | P a g e
8.2 Groundwater Monitoring
The groundwater-monitoring regime at AAL comprise of three elements as follows: (i) Foreshore springs, referred to as estuarine streams (ES), on the foreshore of the AAL site (ii) plant observation wells (POW), and; (iii) Observation wells around the BRDA (OW). Monitoring of groundwater quality receives extensive attention at AAL. Overall, some 76 groundwater monitoring points have been established and are routinely monitored.
8.2.1 Foreshore Springs
Foreshore springs are locations where the water table level intersects ground level to allow groundwater to directly discharge to the surface. These are referred to as estuarine streams (ES) in the IPPC Licence. Table 33 contains a summary of analyses undertaken on those streams for the 2009 reporting period. Reporting is as per Schedule C.7 of the IPPC Licence. It should be noted that there is no direct discharge to the estuary from ES 1, ES 7/12 and ES16 as these streams are intercepted and pumped to the effluent plant for treatment. Appended to this report, as Attachment 7, are graphs trending pH and Soda for the Estuarine Streams

Aughinish Alumina Ltd. March 2009 AER 2009
48 | P a g e
Table 33 Summary of foreshore spring monitoring data 2009
Emission Point Reference
pH** Conductivity
(µS/cm) Soda (g/l)
ES 1* 11.7 3,810 1.11
ES 2 7.9 28,021 7.32
ES 3 8.0 12,163 2.98
ES 5 8.2 417 0.07
ES 6 No Flow No Flow No Flow
ES 8 9.2 10,545 2.64
ES 9 8.2 14,849 3.56
ES 10 7.7 2,190 0.43
ES 11 8.1 3,828 0.91
ES 7/12* 11.5 3,343 0.96
ES 13 9.1 429 0.08
ES 14 8.6 589 0.11
ES 15 8.3 589 0.09
ES 16* 8.4 797 0.21
* No direct discharge to estuary
** pH refers to the numerical average of the data for the period
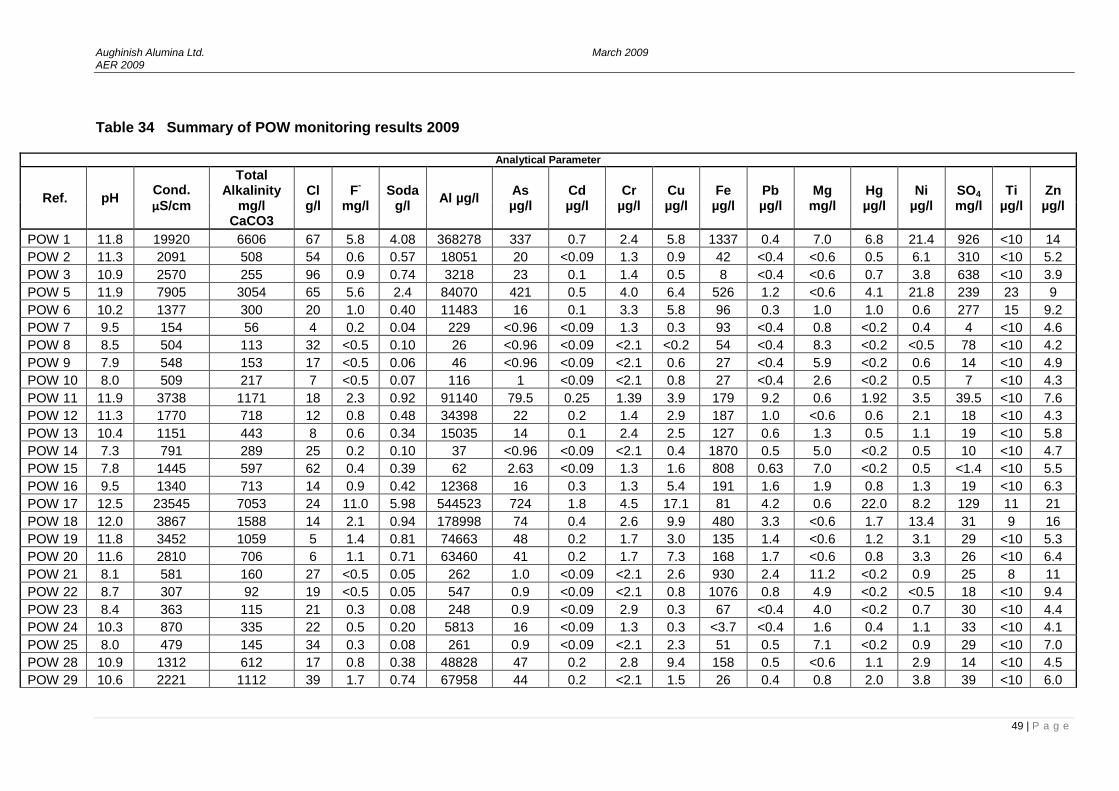
8.2.2 Plant observation wells (POW) Table 34 contains a summary of analyses undertaken on all groundwater-monitoring locations within the AAL facility. The table also includes data on those wells located around the north pond (NPW) and the south pond (SPW). Information on the status of these wells is provided on a quarterly basis. The values reported are the average of analytical results returned during the 2009 monitoring period.
Aughinish Alumina Ltd. March 2009 AER 2009
49 | P a g e
Table 34 Summary of POW monitoring results 2009
Analytical Parameter
Ref. pH Cond.
µS/cm
Total Alkalinity
mg/l CaCO3
Cl g/l
F-
mg/l Soda
g/l Al µg/l
As µg/l
Cd µg/l
Cr µg/l
Cu µg/l
Fe µg/l
Pb µg/l
Mg mg/l
Hg µg/l
Ni µg/l
SO4 mg/l
Ti µg/l
Zn µg/l
POW 1 11.8 19920 6606 67 5.8 4.08 368278 337 0.7 2.4 5.8 1337 0.4 7.0 6.8 21.4 926 <10 14
POW 2 11.3 2091 508 54 0.6 0.57 18051 20 <0.09 1.3 0.9 42 <0.4 <0.6 0.5 6.1 310 <10 5.2
POW 3 10.9 2570 255 96 0.9 0.74 3218 23 0.1 1.4 0.5 8 <0.4 <0.6 0.7 3.8 638 <10 3.9
POW 5 11.9 7905 3054 65 5.6 2.4 84070 421 0.5 4.0 6.4 526 1.2 <0.6 4.1 21.8 239 23 9
POW 6 10.2 1377 300 20 1.0 0.40 11483 16 0.1 3.3 5.8 96 0.3 1.0 1.0 0.6 277 15 9.2
POW 7 9.5 154 56 4 0.2 0.04 229 <0.96 <0.09 1.3 0.3 93 <0.4 0.8 <0.2 0.4 4 <10 4.6
POW 8 8.5 504 113 32 <0.5 0.10 26 <0.96 <0.09 <2.1 <0.2 54 <0.4 8.3 <0.2 <0.5 78 <10 4.2
POW 9 7.9 548 153 17 <0.5 0.06 46 <0.96 <0.09 <2.1 0.6 27 <0.4 5.9 <0.2 0.6 14 <10 4.9
POW 10 8.0 509 217 7 <0.5 0.07 116 1 <0.09 <2.1 0.8 27 <0.4 2.6 <0.2 0.5 7 <10 4.3
POW 11 11.9 3738 1171 18 2.3 0.92 91140 79.5 0.25 1.39 3.9 179 9.2 0.6 1.92 3.5 39.5 <10 7.6
POW 12 11.3 1770 718 12 0.8 0.48 34398 22 0.2 1.4 2.9 187 1.0 <0.6 0.6 2.1 18 <10 4.3
POW 13 10.4 1151 443 8 0.6 0.34 15035 14 0.1 2.4 2.5 127 0.6 1.3 0.5 1.1 19 <10 5.8
POW 14 7.3 791 289 25 0.2 0.10 37 <0.96 <0.09 <2.1 0.4 1870 0.5 5.0 <0.2 0.5 10 <10 4.7
POW 15 7.8 1445 597 62 0.4 0.39 62 2.63 <0.09 1.3 1.6 808 0.63 7.0 <0.2 0.5 <1.4 <10 5.5
POW 16 9.5 1340 713 14 0.9 0.42 12368 16 0.3 1.3 5.4 191 1.6 1.9 0.8 1.3 19 <10 6.3
POW 17 12.5 23545 7053 24 11.0 5.98 544523 724 1.8 4.5 17.1 81 4.2 0.6 22.0 8.2 129 11 21
POW 18 12.0 3867 1588 14 2.1 0.94 178998 74 0.4 2.6 9.9 480 3.3 <0.6 1.7 13.4 31 9 16
POW 19 11.8 3452 1059 5 1.4 0.81 74663 48 0.2 1.7 3.0 135 1.4 <0.6 1.2 3.1 29 <10 5.3
POW 20 11.6 2810 706 6 1.1 0.71 63460 41 0.2 1.7 7.3 168 1.7 <0.6 0.8 3.3 26 <10 6.4
POW 21 8.1 581 160 27 <0.5 0.05 262 1.0 <0.09 <2.1 2.6 930 2.4 11.2 <0.2 0.9 25 8 11
POW 22 8.7 307 92 19 <0.5 0.05 547 0.9 <0.09 <2.1 0.8 1076 0.8 4.9 <0.2 <0.5 18 <10 9.4
POW 23 8.4 363 115 21 0.3 0.08 248 0.9 <0.09 2.9 0.3 67 <0.4 4.0 <0.2 0.7 30 <10 4.4
POW 24 10.3 870 335 22 0.5 0.20 5813 16 <0.09 1.3 0.3 <3.7 <0.4 1.6 0.4 1.1 33 <10 4.1
POW 25 8.0 479 145 34 0.3 0.08 261 0.9 <0.09 <2.1 2.3 51 0.5 7.1 <0.2 0.9 29 <10 7.0
POW 28 10.9 1312 612 17 0.8 0.38 48828 47 0.2 2.8 9.4 158 0.5 <0.6 1.1 2.9 14 <10 4.5
POW 29 10.6 2221 1112 39 1.7 0.74 67958 44 0.2 <2.1 1.5 26 0.4 0.8 2.0 3.8 39 <10 6.0

Aughinish Alumina Ltd. March 2009 AER 2009
50 | P a g e
Table 34 (contd.) Summary of POW monitoring results 2009
Analytical Parameter
Ref. pH Cond.
µS/cm
Total Alkalinity
mg/l CaCO3
Cl g/l
F-
mg/l Soda
g/l Al µg/l
As µg/l
Cd µg/l
Cr µg/l
Cu µg/l
Fe µg/l
Pb µg/l
Mg mg/l
Hg µg/l
Ni µg/l
SO4 mg/l
Ti µg/l
Zn µg/l
POW 30 7.5 570 201 23 <0.5 0.03 539 0.9 <0.09 <2.1 1.4 129 0.4 7.0 <0.2 0.6 26 <10 5.8
POW 31 7.5 556 221 22 <0.5 0.06 52 1.2 <0.09 1.3 1.0 4938 0.4 5.6 <0.2 0.4 15 <10 5.8
POW 32 8.8 628 274 21 0.32 0.16 2022 9.58 0.15 2.9 5.02 5222 2.01 2.9 0.7 1.7 23.2 <10 6.8
POW 33 8.5 896 360 30 0.6 0.26 113 2 <0.09 1.4 1.3 1047 0.4 3.5 0.4 1.1 25 <10 5.5
SPW 1 11 1566 671 17 3.0 0.46 108715 139 0.3 <2.1 5.2 57 2.1 2.8 26.9 13.4 95 <10 22.0
SPW 2 8.9 393 120 17 0.5 0.09 803 4 0.1 1.6 2.9 279 1.4 3.4 0.2 1.4 30 30 7.4
SPW 3 7.6 423 174 14 <0.5 0.02 527 1.0 <0.09 <2.1 0.3 124 1.1 6.0 <0.2 <0.5 9 19 9.1
SPW 4 7.9 296 100 15 <0.5 0.02 403 1 0.1 <2.1 1.3 344 0.5 3.8 <0.2 0.7 10 11 6.5
SPW 5 8.5 984 184 29 0.4 0.25 74 2 <0.09 1.4 0.7 21 1.0 8.6 0.2 <0.5 266 <10 4.4
SPW 6 8.5 143 65 10 <0.5 0.02 1446 1 <0.09 18.5 3.2 2359 1.7 0.9 <0.2 1.0 4 423 7.9
NPW 1 10. 921 345 24 0.3 0.26 2071 8 0.1 <2.1 2.2 1026 0.7 1.7 0.3 1.8 72 9.6 13.6
NPW 2 8.0 602 189 24 0.30 0.10 199 1.69 <0.09 <2.1 0.73 41 <0.4 8.0 <0.2 0.6 51.2 <10 <4.6
NPW 3 7.9 368 112 22 <0.5 0.04 132 1 0.1 <2.1 1.3 332 1.2 5.2 <0.2 1.7 14 <10 7.6

Aughinish Alumina Ltd. March 2009 AER 2009
51 | P a g e
8.2.3 BRDA observation wells
Table 35 contains a summary of analyses undertaken on all BRDA Observation Wells (OWs) as per Schedule C.7 of the IPPC Licence. The IPPC Licence does not set out limit values for groundwater quality. In April 1997, OWs 3, 4, 5 & 6 were capped as part of the BRDA extension. OWs 9, 10, 11 &12 are subject to saline intrusion and accordingly, the measured soda values are subject to interference. An evaluation of elevated soda and pH levels in BRDA observation wells OW1 and OW2 was undertaken by Golders Associates UK in 2005. Recommendations of this evaluation involved installation of a pump and return system for OW1/OW2. Additional boreholes where installed in this area in 2007 to facilitate pump back to the plant for treatment and monitor the rate of remediation. A recovery pump adjacent to OW1 & OW2 abstracts groundwater and pumps it to the Storm Water Pond (SWP) for subsequent neutralisation and clarification followed by disposal. The liner of the SWP was replaced in 2008 and this has improved the quality of the groundwater in the area. Since the re-lining of the SWP there has been a marked improvement in pH and conductivity of both wells since 2007 (average pH in 2009 was 9.3, in 2007 the average pH was 12.0 and average conductivity has decreased from 11,296µs/cm in 2007 to 1,995µs/cm in 2009).

Aughinish Alumina Ltd. March 2009 AER 2009
52 | P a g e
Table 35 Summary of BRDA observation wells monitoring results 2009
Analytical Parameter
OW Ref.
pH Cond.
µS/cm
Total Alkalinity
mg/l CaCO3
Cl mg/l
Fl-
mg/l Soda
g/l Al
µg/l As µg/l
Cd µg/l
Cr µg/l
Cu µg/l
Fe µg/l
Pb µg/l
Mg mg/l
Hg µg/l
Ni µg/l
SO4 Ti
µg/l Zn µg/l
OW 1 9.0 1872 338 190 1.8 0.5 865 12.5 0.3 <2.1 3.9 662 8.5 6.9 0.5 2.5 233.3 15.5 22.2
OW 2 9.6 2117 410 246 2.7 0.6 1367 10.8 0.14 <2.1 2.6 989 1.6 3.4 0.6 6.1 242.9 9.5 54.0
OW 7 7.2 5633 610 1335 1.0 1.1 35 2.87 <0.09 1.5 0.6 2663 1.1 161 <0.2 3.5 405.3 <10 8.33
OW 8 8.1 12163 655 3541 0.6 3.0 32 3.50 <0.09 1.9 1.2 1626 1.0 265 0.2 6.9 665.3 <10 379
OW 9 7.0 13445 518 3863 1.1 3.3 32 4.04 0.1 2.4 0.5 925 0.6 282 0.1 4.5 567.8 <10 9.4
OW 10 7.3 29225 236 11472 1.0 6.4 44 1.03 <0.09 2.8 0.3 599 <0.38 783 0.2 6.0 729.7 11.2 2498
OW 11 7.1 30575 1703 10634 0.5 7.8 44 1.03 <0.09 4.2 0.5 20 <0.38 698 <0.2 0.6 367.4 11.2 19.4
OW 12 7.2 29590 1457 10429 0.5 8.2 44 1.03 <0.09 4.5 0.5 49 0.41 757 0.17 1.3 413.9 11.2 16.4
OW 13 7.6 612 176 27 <0.5 0.02 28 <0.96 <0.09 <2.1 1.1 68 < 0.38 8.9 < 0.2 <0.5 6.0 < 10 6.6
OW 14 7.4 612 201 36 <0.5 0.03 21 <0.96 <0.09 <2.1 0.3 7 < 0.38 8.2 < 0.2 0.8 13.9 < 10 4.4
OW 15 7.3 657 259 18 <0.5 0.02 19 <0.96 <0.09 <2.1 1.1 47 0.43 7.9 < 0.2 2.1 8.8 < 10 5.22
OW 16 7.1 1062 327 89 <0.5 0.08 <11 <0.96 <0.09 <2.1 0.6 4 <0.38 25.0 < 0.2 0.9 37.6 < 10 4.13
OW 17 7.1 984 312 80 <0.5 0.07 <11 <0.96 <0.09 <2.1 0.5 4 <0.38 17.2 < 0.2 0.5 33.8 < 10 3.93
OW 18 7.2 730 241 22 <0.5 0.02 1273 2.49 0.14 <2.1 2.0 2041 3.86 9.9 < 0.2 4.2 7.0 14.4 15.0
OW 19 7.2 715 268 25 <0.5 0.02 665 1.77 0.11 <2.1 1.0 1067 2.11 11.2 < 0.2 2.6 8.9 12.2 12.0
OW 20 7.5 2995 469 607 1.10 0.67 13 3.85 <0.09 <2.1 7 32 <0.38 45.1 < 0.2 14 159 <10 6.8
OW 21 7.1 28038 1826 9589 0.43 6.90 46 1.85 <0.09 4.11 0.72 802 <0.38 809 2.78 0.65 1.7 32 7.3
OW 22 7.0 4665 424 1133 0.73 0.71 20 0.93 <0.09 1.7 1.15 41 <0.38 50.0 0.2 11.2 168.4 <10 13.5
OW 23 7.1 1847 584 194 0.63 0.26 50 1.00 <0.09 1.25 1.15 45 <0.38 41.0 0.18 8.1 97.0 <10 10.7


Aughinish Alumina Ltd. March 2009 AER 2009
54 | P a g e
8.3 Leak Detection Monitoring System
Under Schedule C.7 of the IPPC Licence, AAL is required to undertake sampling from four monitoring boreholes located around the former fuel storage area at the Mobile Pool. The fuel storage area at the Mobile Pool comprised three steel underground storage tanks (UST‟s), 2 of which were used for diesel and 1 for petrol. The two diesel UST‟s were decommissioned after Agency approval in 2005.
The results of testing during 2009 are tabulated on Table 36 below.
Table 36 Results of Borehole Monitoring 2009
Borehole Ref. DRO* g/l) PRO*(g/l)
BH 1 <1 <1
BH 2 <1 <1
BH 3 <1 <1
BH 4 <1 <1 *Note: DRO – Diesel range Organics; PRO – Petroleum range organics.
Results of analysis of decommissioning of the diesel UST confirm significant improvement in ground water quality and a reduction in levels in diesel contaminants. The results from headspace testing during 2009 are tabulated in Table 37 below and confirm that the area is now fully remediated.
Table 37 Results of Headspace Analysis 2009
Borehole Ref. DRO (g per tube) PRO (g per tube)
BH 1 <1 <1
BH 2 <1 <1
BH 3 <1 <1
BH 4 <1 <1
In all cases, results of headspace analysis for petroleum related compounds – both diesel and petrol related organic compounds – were below the limits of detection.
8.4 Fugitive Emissions in the AAL Plant Area AAL undertakes monitoring for fugitive dust emissions at twenty eight locations within the site perimeter. The dust-deposition gauges (labelled D.G. 1 – 28) measure deposited particulate material, collected over a 30-day period in accordance with guidelines VDI 2119. In total, there are 19 deposition gauges located around the BRDA to monitor dusting from the landfill area (DG 4 – 13, 20 - 28). Dust deposition measures the daily quantity of dust settling over a specified area (m2) and is expressed as milligrams per square metre per day (mg/m2/day). Deposition rates were generally low and mean results for 2009 are summarised in Table 38. Results are presented as mean annual rates for each location, together with the range of monthly data recorded throughout the year.

Aughinish Alumina Ltd. March 2009 AER 2009
55 | P a g e
It is noted that D.G. 1, D.G. 18 and D.G. 19 monitoring points are located within the plant near the hydrate storage pad and bauxite sheds and are unlikely to cause nuisance to areas outside the plant. D.G. 13 and D.G.19 both reported higher than normal levels of deposited dust during 2009, where the cause was found to be extraneous contamination of the bottle during sampling, most likely by the actions of fauna.
The level of dust deposited (annual average = 28 mg/m2/day) is well below the rate predicted to cause nuisance. Enterprise Ireland suggests that average levels between 30 – 100 mg/m2/day are typical of small towns and light industrial areas and as such are „hardly noticeable‟.
Table 38 Dust deposition rates (mg/m2/day) in 2009
Deposition Gauges Average Deposition
Rate (mg/m2/day) Range mg/m2/d
D.G. 1 35 11 - 86
D.G. 2 45 9 - 83
D.G. 3 18 1 - 38
D.G. 4 22 5 - 62
D.G. 5 13 2 - 24
D.G. 6 15 5 - 49
D.G. 7 16 6 - 35
D.G. 8 25 9 - 76
D.G. 9 14 4 - 52
D.G. 10 16 6 - 40
D.G. 11 29 5 - 72
D.G. 12 28 9 - 50
D.G. 13 25 5 - 108
D.G. 14 14 3 - 38
D.G. 15 10 4 - 19
D.G. 16 67 4 - 171
D.G. 17 30 12 - 69
D.G. 18 54 24 - 86
D.G. 19 169 26 - 294
D.G. 20 13 1 - 39
D.G. 21 13 2 - 47
D.G. 22 6 3 - 80
D.G. 23 29 2 - 10
D.G. 24 23 6 - 49
D.G. 25 15 4 - 39
D.G. 26 16 3 - 38
D.G. 27 8 2 - 26
D.G. 28 15 1 - 32

Aughinish Alumina Ltd. March 2009 AER 2009
56 | P a g e
8.5 Ambient Air Quality Monitoring
A programme of off-site ambient air quality monitoring is carried out by AAL in accordance with Conditions 5.8 and 6.15 of the IPPC Licence. The parameters measured are sulphur dioxide, suspended dust, deposited dust and particulate matter below 10µm (PM10).
A summary of the ambient sulphur dioxide findings are tabulated below in Table 39. The data tabulated relates to the 2009 monitoring period (January to December 2009). Tables 40 – 42 show a summary of the remaining data gathered for the ambient air monitoring programme carried out by AAL. The results of monitoring indicate that ambient air quality in the area is generally good with the various annual and percentile values for ambient SO2 falling well within relevant National Air Quality Standards (NAQS) for those parameters.
Table 39 Ambient Air Sulphur Dioxide Concentrations (g/m3)
Monitoring Location Annual Mean
(mg/m3)
Min Result (µg/m3)
Max Result (µg/m3)
NAQS* (µg/m3)
Kenricks House (Site 1) 2.3 0.63 3.9 <50
Kenricks House (1A) 1.7 0.6 3.7 <50
Raw Water Intake (2) 2.3 0.7 3.4 <50
Keane‟s House (3) 2.9 0.8 4.4 <50
Water Works (4) 1.9 0.5 3.4 <50
Foynes (5) 8.1 1.6 26.3 <50
Moran‟s House (6) 1.2 0.4 1.6 <50
Fitzsimon‟s House (7) 2.4 0.8 3.7 <50
Aughinish (8) 5.5 1 11.2 <50
Foynes Reservoir (9) 2.8 1.5 4.7 <50
Foynes Reservoir(9A) 2.5 1.7 3.1 <50
*NAQS shown is lower assessment threshold for SO2 (40% of 24-hour limit value)
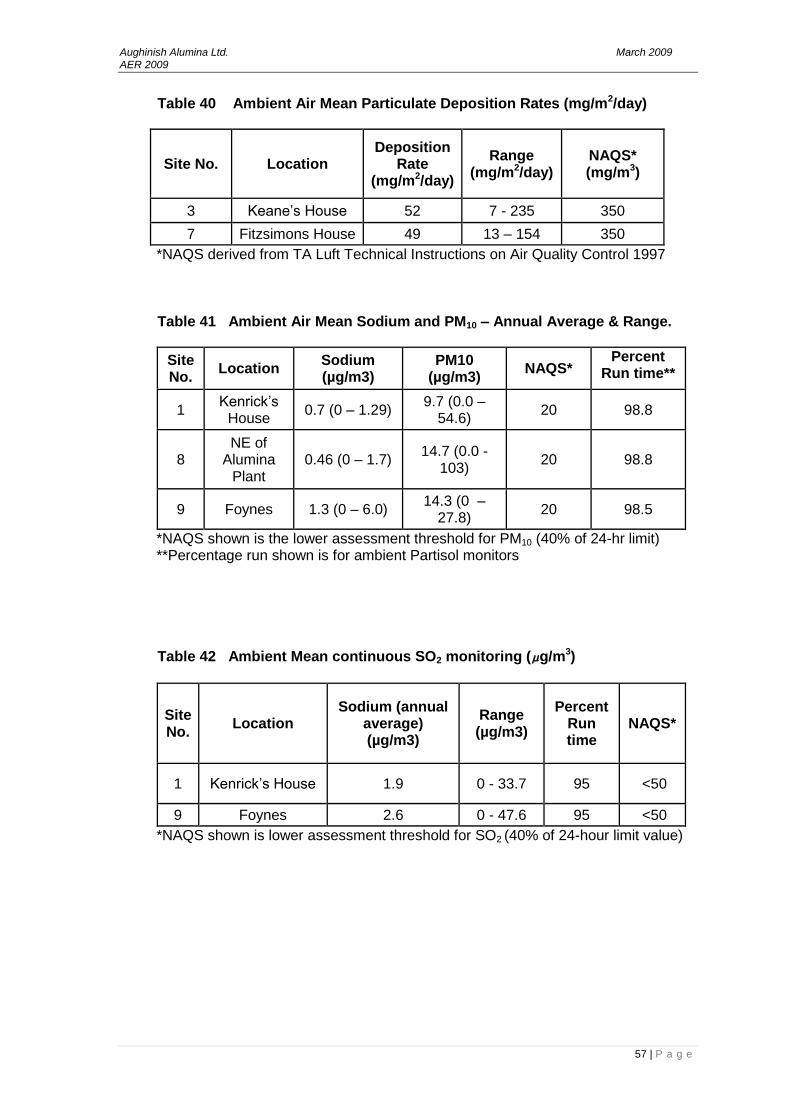
Aughinish Alumina Ltd. March 2009 AER 2009
57 | P a g e
Table 40 Ambient Air Mean Particulate Deposition Rates (mg/m2/day)
Site No. Location Deposition
Rate (mg/m2/day)
Range (mg/m2/day)
NAQS* (mg/m3)
3 Keane‟s House 52 7 - 235 350
7 Fitzsimons House 49 13 – 154 350
*NAQS derived from TA Luft Technical Instructions on Air Quality Control 1997 Table 41 Ambient Air Mean Sodium and PM10 – Annual Average & Range.
Site No.
Location Sodium (µg/m3)
PM10 (µg/m3)
NAQS* Percent
Run time**
1 Kenrick‟s
House 0.7 (0 – 1.29)
9.7 (0.0 – 54.6)
20 98.8
8 NE of
Alumina Plant
0.46 (0 – 1.7) 14.7 (0.0 -
103) 20 98.8
9 Foynes 1.3 (0 – 6.0) 14.3 (0 –
27.8) 20 98.5
*NAQS shown is the lower assessment threshold for PM10 (40% of 24-hr limit) **Percentage run shown is for ambient Partisol monitors
Table 42 Ambient Mean continuous SO2 monitoring (µg/m3)
Site No.
Location Sodium (annual
average) (µg/m3)
Range (µg/m3)
Percent Run time
NAQS*
1 Kenrick‟s House 1.9 0 - 33.7 95 <50
9 Foynes 2.6 0 - 47.6 95 <50
*NAQS shown is lower assessment threshold for SO2 (40% of 24-hour limit value)

Aughinish Alumina Ltd. March 2009 AER 2009
58 | P a g e
8.6 Bund, Tank & Pipeline Integrity Testing
Condition 6 of the IPPC Licence (Control and Monitoring) states the requirements for the protection of groundwater from spills, leaks and improper storage. Specifically, conditions 6.9 and 6.10 deal with the inspection and testing of bunding structures, tanks and underground pipelines.
8.6.1 Bunds & Tanks
The site has a number of integrity testing and repair programmes. The integrity testing of all bunding structures and tanks is carried out on an ongoing three-year cycle. In total, there are 346 separate items requiring integrity testing at AAL and in 2009 the integrity of 85 items was confirmed.
In the past few years substantial sections of the drains have been upgraded with a steel or stainless steel liner in order to minimise the risk of groundwater contamination.
8.6.2 Underground Pipelines All non-process effluent pipelines (sanitary) were tested in 2007 and all necessary repairs are completed. The report on this testing was included in the 2007 AER.

Aughinish Alumina Ltd. March 2009 AER 2009
59 | P a g e
8.7 Decommissioning & Residual Management Plan Update
Condition 10 of IPPC Licence No. P0035-04 requires that AAL shall continue to maintain a fully detailed and costed plan which is adequate to assure the Agency that AAL is at all times financially capable of financing the Decommissioning & Residuals Management Plan (DRMP). The review of the DRMP takes account of any changes or significant modifications to the range of processes carried out, layout of the plant or range of chemicals and equipment used which may influence the DRMP and associated cost.
8.7.1 Amendment to DRMP
In 2008 the DRMP was updated to reflect updated costs of closure and aftercare of the entire facility. The total cost of decommissioning all areas within the AAL site along with long term management and monitoring was estimated to be €16,576,897 as reported in AER 2008.
8.7.2 Update of Closure Costs
The projected decommissioning costs for 2009, based on the Wholesale Price Index, Capital Goods; materials & wages (as published by the Central Statistic Office for year 2009) January 2009 to December 2009, amounts to: €16,576,897 x 156.1/159.9 = €16,182,949
Rusal, AAL‟s Parent Company, has underwritten the cost of closure and de-commissioning of the facility based on the „De-commissioning and Closure Report‟ issued by AAL to the EPA in June 1999. The structure of the underwriting for this activity is such that it allows for escalations based on changes to scope or to the Wholesale Price Index (WPI).

Aughinish Alumina Ltd. March 2009 AER 2009
60 | P a g e
8.8 Environmental Liabilities Risk Assessment Review
AAL commissioned a comprehensive Environmental Liabilities Risk Assessment (ERLA), which was submitted to the Agency in 1999. The ELRA is intended to form the basis for determination of an appropriate level of environmental insurance cover and is to be reviewed annually in accordance with Condition 10.2.2 of the current IPPC licence no P0035-04. Using Shannon Estuary Oil Spill (SEOS) Computer Model to predict the movement and fate of a potential oil slick resulting from a significant spillage during a theoretical “worst case” incident, the ELRA calculated an environmental liability of IR£6 million (in 1998 IR£). This figure was based on international norms in the determination of costs associated with clean up after a major spill. The figure has been updated annually based on the Wholesale Price Index (WPI- Capital Goods; material and wages; as published by the Central Statistic Office for year 2009) January 2009 to December 2009, is used to calculate this figure. In line with IPPC Licence Condition 12.2.4 the WPI is used to calculate this figure. The updated figure for 2009 was calculated as follows: € 11.82 m x 156.1/159.9 = € 11.54m
Based on the above and in today‟s terms, AAL could generate €11.54 million pollution clean-up costs in an extreme worst-case scenario. AAL is required to have insurance cover in place to address this potential liability. The following is the summary of AAL‟s insurance arrangements. General Liability Insurance AAL has General Liability Insurance which provides environmental insurance cover to a level greater than €11.54 million in respect of:
o Liability for injury or loss of or physical damage to or destruction of tangible property, or loss of use of such property damaged or destroyed directly or indirectly caused by seepage, pollution or contamination where such seepage, pollution or contamination is caused by a sudden, unintended and unexpected happening during the Period of Insurance.
o The cost of removing, nullifying or cleaning-up seeping, polluting or contaminating substances where the seepage, pollution or contamination is caused by a sudden, unintended and unexpected happening during the Period of Insurance
Details of the relevant insurance policies have been provided to the EPA under separate cover.

Aughinish Alumina Ltd. March 2009 AER 2009
61 | P a g e
8.9 Annual Landfill Status Report Operational information required under Schedule D of the IPPC Licence in respect of the Bauxite Residue Disposal Area (BRDA) is tabulated on Table 43 below. There are no closed areas within the BRDA and all areas are currently operational. Table 43 Landfill Operational Status
Parameter
Active Areas
Landfill name & licence number Aughinish Alumina Ltd. (BRDA) IPPCL Reg. P0035-04
Landfill location Aughinish Island (National Grid R 127300E, 152200N)
Reporting period Jan 01 – Dec 31, 2009
Owner and/or operator Aughinish Alumina Ltd.
Area occupied by waste 94.5 hectares
Tonnage and composition of waste deposited in the preceding year
994,993 tonnes (See Table 44)
Methods of depositing Pumping/Trucking
Time and duration of depositing 24 hours per day, 365 days per year
Total accumulated quantities of waste deposited
20,258,613 t (See Table 45)
Calculated remaining capacity 2,094,599 t (Table 46)
Calculated final capacity of site
22,684,451 tonnes
Year in which final capacity of site is expected to be reached
2012
Stability checks undertaken See section 8.9.3
Results of monitoring programme See section 8.9.3
Summary of any monitoring non-compliances and corrective actions taken
Not Applicable
Summary of any development/remedial works carried out in the preceding year
See section 8.9.5
Revisions to Landfill Operational Plan
None
Progress on restoration of completed cells
Not Applicable
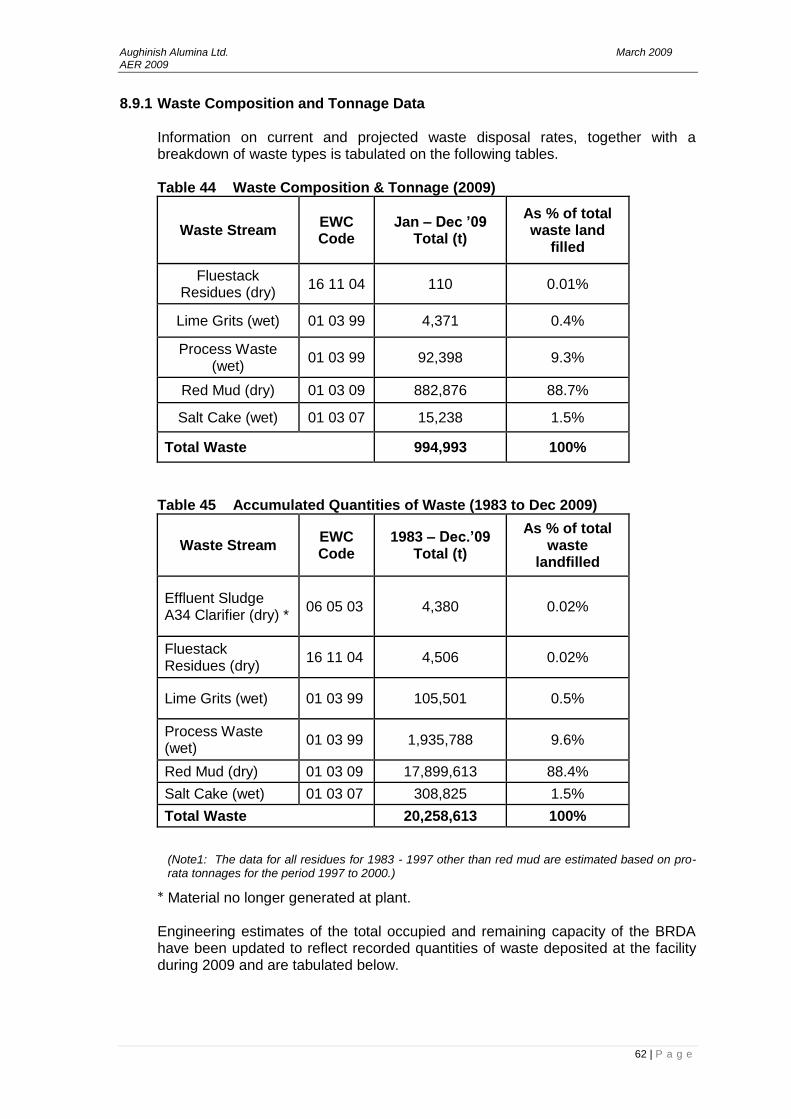
Aughinish Alumina Ltd. March 2009 AER 2009
62 | P a g e
8.9.1 Waste Composition and Tonnage Data
Information on current and projected waste disposal rates, together with a breakdown of waste types is tabulated on the following tables. Table 44 Waste Composition & Tonnage (2009)
Waste Stream EWC Code
Jan – Dec ’09 Total (t)
As % of total waste land
filled
Fluestack Residues (dry)
16 11 04 110 0.01%
Lime Grits (wet) 01 03 99 4,371 0.4%
Process Waste (wet)
01 03 99 92,398 9.3%
Red Mud (dry) 01 03 09 882,876 88.7%
Salt Cake (wet) 01 03 07 15,238 1.5%
Total Waste 994,993 100%
Table 45 Accumulated Quantities of Waste (1983 to Dec 2009)
Waste Stream EWC Code
1983 – Dec.’09 Total (t)
As % of total waste
landfilled
Effluent Sludge A34 Clarifier (dry) *
06 05 03 4,380 0.02%
Fluestack Residues (dry)
16 11 04 4,506 0.02%
Lime Grits (wet) 01 03 99 105,501 0.5%
Process Waste (wet)
01 03 99 1,935,788 9.6%
Red Mud (dry) 01 03 09 17,899,613 88.4%
Salt Cake (wet) 01 03 07 308,825 1.5%
Total Waste 20,258,613 100%
(Note1: The data for all residues for 1983 - 1997 other than red mud are estimated based on pro-rata tonnages for the period 1997 to 2000.)
* Material no longer generated at plant.
Engineering estimates of the total occupied and remaining capacity of the BRDA have been updated to reflect recorded quantities of waste deposited at the facility during 2009 and are tabulated below.
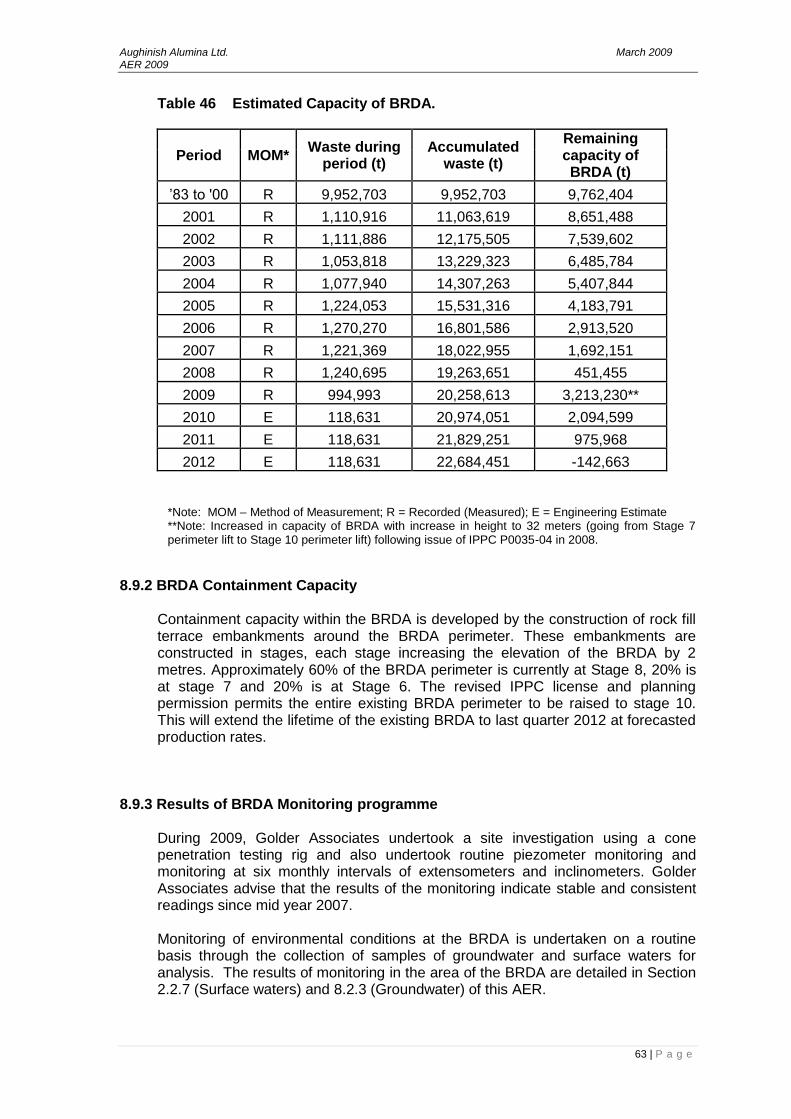
Aughinish Alumina Ltd. March 2009 AER 2009
63 | P a g e
Table 46 Estimated Capacity of BRDA.
Period MOM* Waste during
period (t) Accumulated
waste (t)
Remaining capacity of BRDA (t)
‟83 to '00 R 9,952,703 9,952,703 9,762,404
2001 R 1,110,916 11,063,619 8,651,488
2002 R 1,111,886 12,175,505 7,539,602
2003 R 1,053,818 13,229,323 6,485,784
2004 R 1,077,940 14,307,263 5,407,844
2005 R 1,224,053 15,531,316 4,183,791
2006 R 1,270,270 16,801,586 2,913,520
2007 R 1,221,369 18,022,955 1,692,151
2008 R 1,240,695 19,263,651 451,455
2009 R 994,993 20,258,613 3,213,230**
2010 E 118,631 20,974,051 2,094,599
2011 E 118,631 21,829,251 975,968
2012 E 118,631 22,684,451 -142,663
*Note: MOM – Method of Measurement; R = Recorded (Measured); E = Engineering Estimate **Note: Increased in capacity of BRDA with increase in height to 32 meters (going from Stage 7 perimeter lift to Stage 10 perimeter lift) following issue of IPPC P0035-04 in 2008.
8.9.2 BRDA Containment Capacity
Containment capacity within the BRDA is developed by the construction of rock fill terrace embankments around the BRDA perimeter. These embankments are constructed in stages, each stage increasing the elevation of the BRDA by 2 metres. Approximately 60% of the BRDA perimeter is currently at Stage 8, 20% is at stage 7 and 20% is at Stage 6. The revised IPPC license and planning permission permits the entire existing BRDA perimeter to be raised to stage 10. This will extend the lifetime of the existing BRDA to last quarter 2012 at forecasted production rates.
8.9.3 Results of BRDA Monitoring programme
During 2009, Golder Associates undertook a site investigation using a cone penetration testing rig and also undertook routine piezometer monitoring and monitoring at six monthly intervals of extensometers and inclinometers. Golder Associates advise that the results of the monitoring indicate stable and consistent readings since mid year 2007. Monitoring of environmental conditions at the BRDA is undertaken on a routine basis through the collection of samples of groundwater and surface waters for analysis. The results of monitoring in the area of the BRDA are detailed in Section 2.2.7 (Surface waters) and 8.2.3 (Groundwater) of this AER.
Aughinish Alumina Ltd. March 2009 AER 2009
64 | P a g e
There are 20 dust deposition gauges located at points along the BRDA perimeter in order to determine rates of dusting in the vicinity of the BRDA. The results of monitoring are tabulated in Section 8.4 (Fugitive Emissions in the AAL Plant Area).
8.9.4 Revisions to BRDA Operational Plan
The BRDA Operational Plan, updated in 2008, is appended in Attachment 9. In November 2004 AAL submitted a proposal to the satisfaction of the Agency to demonstrate the long-term viability of the BRDA closure plan. A trial site of 0.8 ha within the BRDA has been designated for this purpose. The conditioning of the red mud for the trial work vegetation was commenced in 2008 and continued in 2009 with further cultivation and seeding and complementary data was collected. The future results of this project will be used to predetermine the environmental effects of closing the existing BRDA and conducting the direct vegetation for this programme will be ongoing for the foreseeable future.
8.9.5 Summary of BRDA development/remedial works 2009 The contract that had been awarded in late July 2008 to BAM Contractors (previously named Ascon Ltd) to construct the Phase 2 BRDA extension in accordance with the design agreed with the Agency was suspended in January 2009. This was due to the very difficult trading conditions and significantly reduced alumina production at Aughinish as a result of the global economic recession. All environmental issues were secured prior to the contract suspension and the site was monitored during 2009 to ensure that all environmental parameters were within compliance.
8.9.6 Progress on Closure Planning & Revegeatation of BRDA IPPC licence conditions 8.3.14 requires that AAL continues to strive to implement the recommendations in the relevant sub-sections of the Residues Solutions Report submitted to the Agency in July 2007. The subsections to be addressed were:
Closure Planning
Closure Revegetation
Post-Closure Management
Alternative Uses of Residue For the last number of years AAL, in conjunction with the University of Limerick, has been carrying out an extensive research programme with the specific aim of developing the knowledge required for the closure and successful revegetation of the BRDA. This research programme has been carried out both on and off site by AAL personnel and contracted researchers. A report on this research programme is appended to this AER as Attachment 8.
Aughinish Alumina Ltd. March 2009 AER 2009
65 | P a g e
8.10 BOD Reduction Programme
Condition 2.2.2.2(iii) of the IPPC licence requires that the following is included in the annual Schedule of Environmental Objectives and Targets: “Reduction in BOD loading discharged to the River Shannon through W1-1 with the aim of achieving BOD levels of not more than 1500kg/day”
Over the past six years Aughinish Alumina has conducted a significant review of organic contaminants in the effluent discharged to the river. The organics at individual levels are low and mostly undetectable using Gas Chromatography-Mass Spectrometry (GC-MS). The organics present are similar to those present in the process liquor. AAL have, in conjunction with Bio Industries, Dublin, conducted extensive trials with a large range of bacteria in order to determine their ability to degrade the organics currently present. Aughinish has completed a 3 year project to produce bacterial cultures on-site for addition to the industrial effluent treatment process to reduce the BOD. The organics in the effluent were reduced by up to 30% as a result of this project. It is expected that the findings from this project will be implemented on a permanent basis during 2010.
8.11 Progress on Bauxite Residue Neutralisation
AAL was requested as a condition of the revised IPPC licence issued in April 2008 to review possible methods for the neutralisation of bauxite residue (red mud) prior to disposal to the Phase 2 BRDA. IPPC licence condition 8.3.15 states that by the 1st of January 2012 the mud and sand residues in Phase 2 shall be subject to a neutralisation step (soluble alkalinity as a minimum). Licence condition 8.3.17 dictates that unless otherwise agreed in writing the neutralisation referred to in Condition 8.3.15 shall be the Carbonation process. Any request for variation in this specified technology shall be supported by a comprehensive feasibility / unfeasibility statement having regard to the principles of Best Available Techniques (BAT). PM Group and Sinclair Knight Merz were engaged by AAL to investigate red mud neutralisation by carbonation and to prepare a comprehensive feasibility report with regard to the principles of BAT. The key preliminary findings of the PM & SKM neutralisation review are:
The technology for carbon dioxide neutralisation of red mud is not developed for the specific circumstances prevalent at AAL. CO2 neutralisation cannot be considered “Available” within the context of BAT.
There are no feasible sources of CO2 locally as carbon capture and storage technology is not yet commercially available. AAL should maintain a review of these technologies
The capital and operating costs of a carbon neutralisation far exceed those for sulphuric acid

Aughinish Alumina Ltd. March 2009 AER 2009
66 | P a g e
The application of sulphuric acid neutralisation is the more feasible short/medium term solution and should be pursued if the engineering problems associated with mixing acid and viscous mud can be resolved.
AAL should maintain a watching brief on the development of CO2 neutralisation.
The University of Limerick were engaged by AAL to carry out a collaborative research project to further investigate red mud neutralisation by a variety of methods, including CO2, gypsum and sulphuric acid. A brief overview of the scope of this project, as well as an outline of the preliminary findings to date, is given below in sections 8.11.1 and 8.11.2.
8.11.1 Overview The collaborative project between UL and AAL has 3 major components. The first component is to obtain a thorough understanding of the chemistry of the neutralisation of red mud. The second component is to understand the rheological and dewatering effects that the neutralising treatment may have on the handling and stacking of red mud. The third component is to examine re-use options for the treated red mud. The potential of re-using the treated red mud may depend on the ability to show that it is a more benign material. Therefore, an examination of how the treatment has affected the leaching behaviour of the red mud will be carried out.
8.11.2 Findings to Date When using sulphuric acid, the neutralisation of the liquid phase of the red mud slurry is fast and results in a carbonate/bicarbonate solution, which can react further with the solid phase of the red mud, resulting in pH reversion, such that the long term pH stability is around pH 10.5 (partial neutralisation). The same mechanism holds true for all acidic treatments, including carbon dioxide. However, as mentioned above, carbon dioxide neutralisation cannot be considered “Available” within the context of BAT. Additionally, there are grave occupational health and safety concerns surrounding the use of a mineral acid to effectuate partial neutralisation of red mud. Mud farming has shown potential to be able to perform in situ or atmospheric carbonation of the red mud within the BRDA, giving the equivalent to neutralisation achieved with carbon dioxide neutralisation, achieving partial neutralisation and a pH around 10.5. To decrease the long term pH to below 10.5 a treatment that removes the carbonate/bicarbonate from the liquid phase is required. This can be achieved through the addition of a soluble calcium or magnesium source. This is akin to „seawater‟ neutralisation as carried out in alumina refineries in Australia. However, the use of seawater requires large volumes of brackish water and the red mud must have a large disposal area allowing for „wet‟ disposal. Alternatively, addition of gypsum can achieve the same outcome. A long term stable pH of around 8.5 is achieved. A further novel application that is being examined is the potential use of flue gas desulphurisation product, a by-product from the near-by ESB Moneypoint coal-fired power station, instead of gypsum. A major consideration is the way in which the neutralising agent will be applied. To benefit from the partial neutralisation that may be achieved from mud farming, the final neutralisation step, through

Aughinish Alumina Ltd. March 2009 AER 2009
67 | P a g e
application of a soluble calcium source, would need to be applied within the BRDA.
8.12 Raw Materials Efficiency and Waste Reduction
AAL continually strives to improve the efficiency of its processes in order to reduce the raw materials consumed and the waste produced. Table 53 shows the volumes of raw materials consumed and waste produced for 2008 and 2009. The relative consumption for each parameter is calculated as the volume consumed per tonne of alumina produced.
Table 47 Raw material Efficiency and Waste Reduction
Material 2008
Consumption
Relative Consumption (Volume/tonne
alumina)
2009 Consumption
Relative Consumption (Volume/tonne
alumina)
Alumina Produced (tonnes)
1,890,200 N/A 1,241,283 N/A
Bauxite Ore Consumed
(tonnes) 4,238,178 2.2 2,769,474 2.2
Sodium Hydroxide (tonnes)
117,705 0.06 61,875 0.05
Sulphuric Acid (tonnes)
13,789 0.01 9,055 0.01
Heavy Fuel Oil (tonnes)
219,123 0.1 137,450 0.1
Water (M3) 5,359,462 2.8 4,284,051 3.5
Waste (tonnes) 1,242,451 0.7 996,074 0.8
Energy (MW) 696.4 0.0004 580.2 0.0005
8.13 Programme for Public Information
As per IPPC licence condition 2.2.2.7, AAL maintains a public awareness and information programme. As agreed with the agency, copies of quarterly monitoring reports, monthly complaint reports and annual environmental reports are retained at the gatehouse on the AAL site. This documentation can be reviewed by any member of the public at all reasonable times.

Aughinish Alumina Ltd. March 2009 AER 2009
68 | P a g e
This page is intentionally blank

Aughinish Alumina Ltd. March 2010 AER 2009
Attachment 1 Toxicity Test Reports

Aughinish Alumina Ltd. March 2010 AER 2009
This page is intentionally blank

CONFIDENTIAL REPORT SHANNON AQUATIC TOXICITY LABORATORY
Front Cover Report Sheet Dept. Toxicity Sheet no. 1 of 5 sheets Tox F020 Ver. 2.0
Client Title Aughinish Alumina Toxicological analysis of two Askeaton effluent samples Co Limerick Attn: Mr. Trevor Montgomery Report ref.: 09T049 Order no.: 2992022 Kathleen O’Rourke
File no.: R.9.04534B Report by: Robert Hernan Date recd.: 2/03/09 Approved by: Jim Clancy Head of Department Copies to: R.6. Files Date: 23/3/09 Standard Terms & Conditions for Testing and Consultancy Assignments 1. Reports issued by Enterprise Ireland are copyright to
Enterprise Ireland and shall not be used, either in whole or in part, for the purpose of advertising, publicity or litigation without the written consent of the Chief Executive or his nominee.
2. Reports shall only be reproduced in full. 3. Non-perishable samples received for testing or laboratory
work shall be disposed of after three months from date of final report unless claimed or unless instructions to the contrary have been notified to Shannon Aquatic Toxicity Laboratory, Enterprise Ireland by the client within the said three month period.
4. Payment for work carried out shall be in accordance with the
terms stated on Enterprise Ireland’s invoices
5. No action or legal proceeding shall be taken (except in the case of wilful neglect or default) against Enterprise Ireland or the Board or any member of the Board or any committee appointed by the Board or any officer or servant of Enterprise Ireland by reason of or arising out of the carrying out of research, investigation, test or analysis or the publication of
the results thereof in the name of Enterprise Ireland. 6. Enterprise Ireland will not release any information received from or provided to the client in relation to this report except as may be required by law, including the Freedom of Information Act 1997, or as specified by the client. 7. This contract is governed by the laws of Ireland whose courts
shall have exclusive jurisdiction.
Test report relates only to the sample(s) tested * Indicates that test result is not INAB accredited Opinions and interpretations expressed are outside the scope of INAB accreditation

S:\RHernan\2009 Doc\09T049.doc Page 2 of 5
TOXICOLOGICAL TESTING REPORT Form No.: ToxF035 Ver 1.8
SAMPLE DESCRIPTION Client: Aughinish Alumina Client Sample Description: Effluent composite, Ref. W1-1B, 03/3/09 Tox. Ref. No.: 09T049-1 Date of Receipt: 04/03/09 Storage Conditions: 3°C ± 3°C
SAMPLE INFORMATION (supporting data not within scope of INAB accreditation)
SATL Client Other
Sampled by: Collected by: Sampling Procedure: n/a Temperature: (°C)
21.3 pH: (at 18.4°C)
8.41
Dissolved Oxygen: (mg/l)
6.8 Dissolved Oxygen: (% saturation)
79.3
Conductivity: (mS/cm at 25°C)
5.6 Salinity ‰: (at 20°C)
3.8
TEST PROCEDURE
Test Species: Tisbe battagliai
Test Date: 04/03/09
Test Procedure: Method 6.3 based on BS 6068-5.24:1999; ISO 14669:1999; 'Water quality - Part 5: Biological methods - Section 5.24: Determination of acute lethal toxicity to marine copepods (Copepoda, Crustacea)'
TEST RESULT
Test Parameter Test Result No. of Toxic Units 95% Conf. Limits
* 48 h LC50 > 32% vol./vol. < 2.9 n/a * indicates that test result is not INAB accredited.
Method of Calculation: n/a Comments: 45% mortality occurred at 32% vol./vol. No mortality occurred at 18% vol./vol.

S:\RHernan\2009 Doc\05T049.doc Page 3 of 5
TOXICOLOGICAL TESTING REPORT Form No.: ToxF035 Ver 1.8
SAMPLE DESCRIPTION Client: Aughinish Alumina Client Sample Description: Effluent composite, Ref. W1-1B, 03/3/09 Tox. Ref. No.: 09T049-1 Date of Receipt: 04/03/09 Storage Conditions: ≤ - 20°C
SAMPLE INFORMATION (supporting data not within scope of INAB accreditation)
SATL Client Other
Sampled by: Collected by: Sampling Procedure: n/a Temperature: (°C)
21.3 pH: (at 18.4°C)
8.41
Dissolved Oxygen: (mg/l)
6.8 Dissolved Oxygen: (% saturation)
79.3
Conductivity: (mS/cm at 25°C)
5.8 Salinity ‰: (at 20°C)
3.8
TEST PROCEDURE
Test Species: Vibrio fischeri
Test Date: 04/03/09
Test Procedure: Method 6.2 based on BS EN ISO 11348-3:1999; 'Water quality - Determination of the inhibitory effect of water samples on the light emission of Vibrio fischeri (Luminescent bacteria test) - Part 3: Method using freeze-dried bacteria'
TEST RESULT
Test Parameter Test Result No. of Toxic Units 95% Conf. Limits
5 min EC50 > 45% vol./vol. < 2.2 n/a 15 min EC50 > 45% vol./vol. < 2.2 n/a
Method of Calculation: n/a Comments: Less than 50% light inhibition occurred at 45% vol./vol. compared to the control.

S:\RHernan\2009 Doc\05T049.doc Page 4 of 5
TOXICOLOGICAL TESTING REPORT Form No.: ToxF035 Ver 1.8
SAMPLE DESCRIPTION Client: Aughinish Alumina Client Sample Description: W1-1A, 03/3/09 Tox. Ref. No.: 09T049-2 Date of Receipt: 04/03/09 Storage Conditions: 3°C ± 3°C
SAMPLE INFORMATION (supporting data not within scope of INAB accreditation)
SATL Client Other
Sampled by: Collected by: Sampling Procedure: n/a Temperature: (°C)
21.8 pH: (at 18.7°C)
8.37
Dissolved Oxygen: (mg/l)
5.6 Dissolved Oxygen: (% saturation)
63.8
Conductivity: (mS/cm at 25°C)
5.4 Salinity ‰: (at 20°C)
3.0
TEST PROCEDURE
Test Species: Tisbe battagliai
Test Date: 04/03/09
Test Procedure: Method 6.3 based on BS 6068-5.24:1999; ISO 14669:1999; 'Water quality - Part 5: Biological methods - Section 5.24: Determination of acute lethal toxicity to marine copepods (Copepoda, Crustacea)'
TEST RESULT
Test Parameter Test Result No. of Toxic Units 95% Conf. Limits
* 48 h LC50 > 32% vol./vol. < 3.0 n/a * indicates that test result is not INAB accredited.
Method of Calculation: n/a Comments: 9% mortality occurred at 32% vol./vol.

S:\RHernan\2009 Doc\05T049.doc Page 5 of 5
TOXICOLOGICAL TESTING REPORT Form No.: ToxF035 Ver 1.8
SAMPLE DESCRIPTION Client: Aughinish Alumina Client Sample Description: W1 – 1A, 26.3.05 Tox. Ref. No.: 05T043-2 Date of Receipt: 29/03/05 Storage Conditions: ≤ - 20°C
SAMPLE INFORMATION (supporting data not within scope of INAB accreditation)
SATL Client Other
Sampled by: Collected by: Sampling Procedure: n/a Temperature: (°C)
21.8 pH: (at 18.7°C)
8.38
Dissolved Oxygen: (mg/l)
5.6 Dissolved Oxygen: (% saturation)
63.8
Conductivity: (mS/cm at 25°C)
5.4 Salinity ‰: (at 20°C)
3.0
TEST PROCEDURE
Test Species: Vibrio fischeri
Test Date: 04/03/09
Test Procedure: Method 6.2 based on BS EN ISO 11348-3:1999; 'Water quality - Determination of the inhibitory effect of water samples on the light emission of Vibrio fischeri (Luminescent bacteria test) - Part 3: Method using freeze-dried bacteria'
TEST RESULT
Test Parameter Test Result No. of Toxic Units 95% Conf. Limits
5 min EC50 > 45% vol./vol. < 2.2 n/a 15 min EC50 > 45% vol./vol. < 2.2 n/a
Method of Calculation: n/a Comments: Less than 50% light inhibition occurred at 45% vol./vol. compared to the control.

CONFIDENTIAL REPORT SHANNON AQUATIC TOXICITY LABORATORY
Front Cover Report Sheet Tox F020 Ver 2.0 Dept. Toxicity Sheet no. 1 of 5 sheets
Client T itle Aughinish Alumina Toxicological analysis of Askeaton two samples Co Limerick Attn: Mr Trevor Montgomery Report ref.: 09T237 Order no.: 30021481 Kathleen O’Rourke
File no.: R.9.0832C Report by: Robert Hernan Date recd.: 10.10.09 Approved by: Jim Clancy Head of Department
Copies to: R.6. Files Date: 26.10.09 Standard Terms & Conditions for Testing and Consultancy Assignments 1. Reports issued by the Shannon Aquatic Toxicity Laboratory of
Enterprise Ireland are copyright to Enterprise Ireland and shall not be used, either in whole or in part, for the purpose of advertising, publicity or litigation without the written consent of the Chief Executive or his nominee.
2. Reports shall only be reproduced in full. 3. Non-perishable samples received for testing or laboratory
work shall be disposed of after three months from date of final report unless claimed or unless instructions to the contrary have been notified to Shannon Aquatic Toxicity Laboratory, Enterprise Ireland by the client within the said three month period.
4. Payment for work carried out shall be in accordance with the
terms stated on Enterprise Ireland’s invoices
5. No action or legal proceeding shall be taken (except in the case of wilful neglect or default) against Enterprise Ireland or the Board or any member of the Board or any committee appointed by the Board or any officer or servant of Enterprise Ireland by reason of or arising out of the carrying out of research, investigation, test or analysis or the publication of
the results thereof in the name of Enterprise Ireland. 6. Enterprise Ireland will not release any information received from or provided to the client in relation to this report except as may be required by law, including the Freedom of Information Act 1997, or as specified by the client. 7. This contract is governed by the laws of Ireland whose courts
shall have exclusive jurisdiction.
Test report relates only to the sample(s) tested
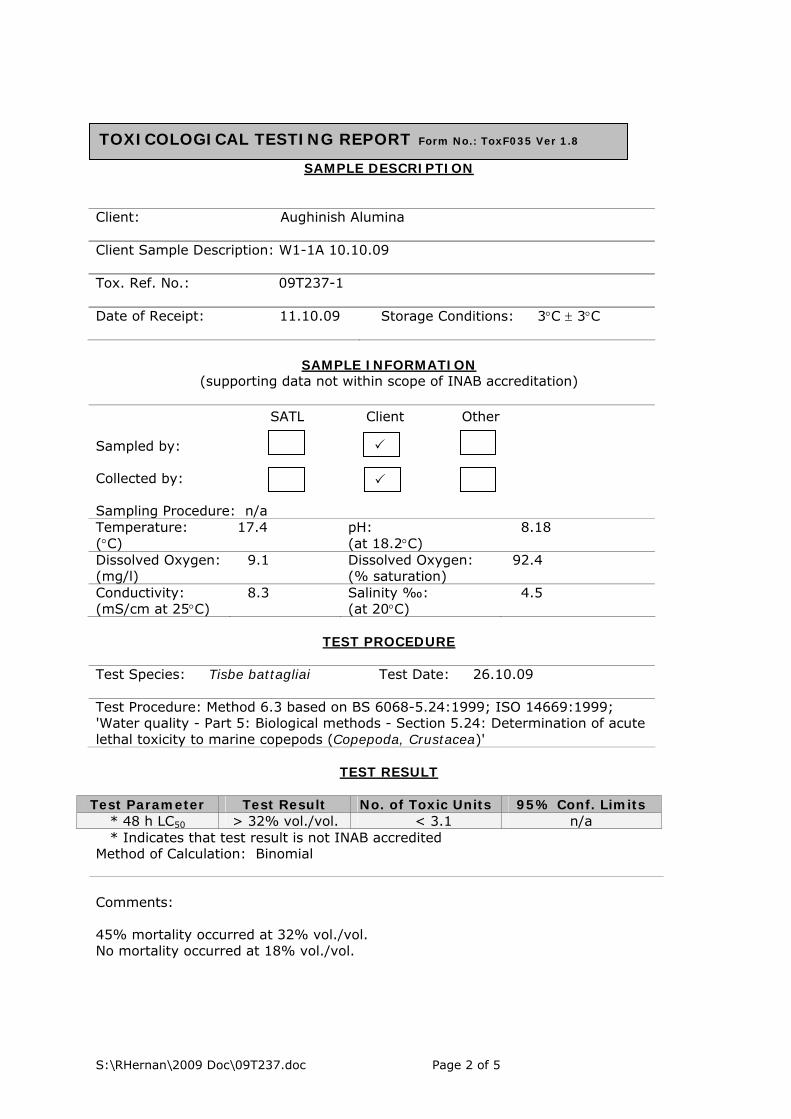
S:\RHernan\2009 Doc\09T237.doc Page 2 of 5
TOXICOLOGICAL TESTING REPORT Form No.: ToxF035 Ver 1.8
SAMPLE DESCRIPTION Client: Aughinish Alumina Client Sample Description: W1-1A 10.10.09 Tox. Ref. No.: 09T237-1 Date of Receipt: 11.10.09 Storage Conditions: 3°C ± 3°C
SAMPLE INFORMATION (supporting data not within scope of INAB accreditation)
SATL Client Other
Sampled by: Collected by: Sampling Procedure: n/a Temperature: (°C)
17.4 pH: (at 18.2°C)
8.18
Dissolved Oxygen: (mg/l)
9.1 Dissolved Oxygen: (% saturation)
92.4
Conductivity: (mS/cm at 25°C)
8.3 Salinity ‰: (at 20°C)
4.5
TEST PROCEDURE
Test Species: Tisbe battagliai
Test Date: 26.10.09
Test Procedure: Method 6.3 based on BS 6068-5.24:1999; ISO 14669:1999; 'Water quality - Part 5: Biological methods - Section 5.24: Determination of acute lethal toxicity to marine copepods (Copepoda, Crustacea)'
TEST RESULT
Test Parameter Test Result No. of Toxic Units 95% Conf. Limits
* 48 h LC50 > 32% vol./vol. < 3.1 n/a * Indicates that test result is not INAB accredited Method of Calculation: Binomial Comments: 45% mortality occurred at 32% vol./vol. No mortality occurred at 18% vol./vol.

S:\RHernan\2009 Doc\09T237.doc Page 3 of 5
TOXICOLOGICAL TESTING REPORT Form No.: ToxF035 Ver 1.8
SAMPLE DESCRIPTION Client: Aughinish Alumina Client Sample Description: W1-1A 10.10.09 Tox. Ref. No.: 05T237-1 Date of Receipt: 11.10.09 Storage Conditions: 3°C ± 3°C
SAMPLE INFORMATION (supporting data not within scope of INAB accreditation)
SATL Client Other
Sampled by: Collected by: Sampling Procedure: n/a Temperature: (°C)
17.4 pH: (at 18.2°C)
8.18
Dissolved Oxygen: (mg/l)
9.1 Dissolved Oxygen: (% saturation)
92.4
Conductivity: (mS/cm at 25°C)
8.3 Salinity ‰: (at 20°C)
4.5
TEST PROCEDURE
Test Species: Vibrio fischeri
Test Date: 26.10.09
Test Procedure: Method 6.2 based on BS EN ISO 11348-3:1999; 'Water quality - Determination of the inhibitory effect of water samples on the light emission of Vibrio fischeri (Luminescent bacteria test) - Part 3: Method using freeze-dried bacteria'
TEST RESULT
Test Parameter Test Result No. of Toxic Units 95% Conf. Limits
5 min EC50 > 45% vol./vol. < 2.2 n/a 15 min EC50 > 45% vol./vol. < 2.2 n/a
Method of Calculation: n/a Comments: No light inhibition occurred at 45% vol./vol. compared to the control

S:\RHernan\2009 Doc\09T237.doc Page 4 of 5
TOXICOLOGICAL TESTING REPORT Form No.: ToxF035 Ver 1.8
SAMPLE DESCRIPTION Client: Aughinish Alumina Client Sample Description: W1-1B 10.10.09 Tox. Ref. No.: 09T237-2 Date of Receipt: 11.10.09 Storage Conditions: 3°C ± 3°C
SAMPLE INFORMATION (supporting data not within scope of INAB accreditation)
SATL Client Other
Sampled by: Collected by: Sampling Procedure: n/a Temperature: (°C)
17.6 pH: (at 18.6°C)
8.12
Dissolved Oxygen: (mg/l)
8.5 Dissolved Oxygen: (% saturation)
82.7
Conductivity: (mS/cm at 25°C)
7.6 Salinity ‰: (at 20°C)
4.8
TEST PROCEDURE
Test Species: Tisbe battagliai
Test Date: 26.10.09
Test Procedure: Method 6.3 based on BS 6068-5.24:1999; ISO 14669:1999; 'Water quality - Part 5: Biological methods - Section 5.24: Determination of acute lethal toxicity to marine copepods (Copepoda, Crustacea)'
TEST RESULT
Test Parameter Test Result No. of Toxic Units 95% Conf. Limits
* 48 h LC50 32% vol./vol. 3.2 n/a * Indicates that test result is not INAB accredited Method of Calculation: Binomial Comments: 45% mortality occurred at 32% vol./vol. No mortality occurred at 18% vol./vol.

S:\RHernan\2009 Doc\09T237.doc Page 5 of 5
TOXICOLOGICAL TESTING REPORT Form No.: ToxF035 Ver 1.8
SAMPLE DESCRIPTION Client: Aughinish Alumina Client Sample Description: W1-1B 10.10.09 Tox. Ref. No.: 09T237-2 Date of Receipt: 11.10.09 Storage Conditions: 3°C ± 3°C
SAMPLE INFORMATION (supporting data not within scope of INAB accreditation)
SATL Client Other
Sampled by: Collected by: Sampling Procedure: n/a Temperature: (°C)
17.4 pH: (at 18.6°C)
8.12
Dissolved Oxygen: (mg/l)
8.5 Dissolved Oxygen: (% saturation)
82.7
Conductivity: (mS/cm at 25°C)
7.6 Salinity ‰: (at 20°C)
4.8
TEST PROCEDURE
Test Species: Vibrio fischeri
Test Date: 26.10.09
Test Procedure: Method 6.2 based on BS EN ISO 11348-3:1999; 'Water quality - Determination of the inhibitory effect of water samples on the light emission of Vibrio fischeri (Luminescent bacteria test) - Part 3: Method using freeze-dried bacteria'
TEST RESULT
Test Parameter Test Result No. of Toxic Units 95% Conf. Limits
5 min EC50 > 45% vol./vol. < 2.2 n/a 15 min EC50 > 45% vol./vol. < 2.2 n/a
Method of Calculation: n/a Comments: No light inhibition occurred at 45% vol./vol. compared to the control

Aughinish Alumina Ltd. March 2010 AER 2009
Attachment 2 VOC Screening Report

Aughinish Alumina Ltd. March 2010 AER 2009
This page is intentionally blank

Customer Name Trevor Montgomery Lab Report Ref. No. 3120/306/02
Company Aughinish Alumina Ltd Date of Receipt 2/04/2009
Address Auginish Island Date Testing 1/04/2009
Askeaton Co Limerick Received or Collected Delivered by Customer
Ireland Condition on Receipt Acceptable
Customer PO 2665419 Date of Report 17/04/2009
CERTIFICATE OF ANALYSIS
Lab Ref 3120/306/02 Client Ref W1-1A Sample Type Water
Test Parameter SOP Analytical Technique
Result Units
US EPA Method 524.2 154 GC-MS 1 <1 μg/L Ethanol 154 GC-MS 1 <1 μg/L
Acaetonitrile 154 GC-MS 1 <1 μg/L IPA 154 GC-MS 1 <1 μg/L Methanol 154 GC-MS 1 <1 μg/L Acetone 154 GC-MS 1 <1 μg/L MEK 154 GC-MS 1 <1 μg/L
Date: 17/04/2009
Katherine McQuillan -Deputy Technical Manager
* INAB Accredited Test
Results shall not be reproduced, except in full, without the approval of EURO environmental services Results contained in this report
relate only to the samples tested Results which exceed the Parametric Value Limit are highlighted for the sample tested Page 1 of 1
Unit 35, Boyne Business Park, Drogheda, Co. Louth Ireland
Tel: +353 41 9845440
Fax: +353 41 9846171
Web: www.euroenv.ie email: [email protected]
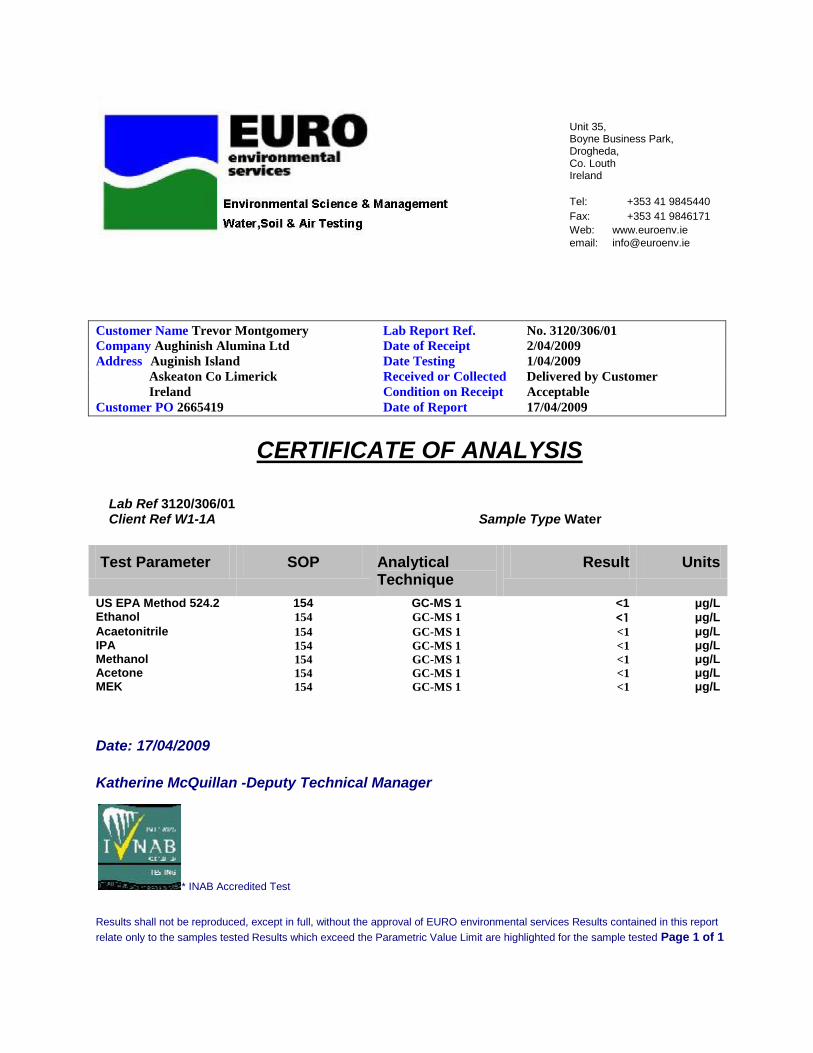
Customer Name Trevor Montgomery Lab Report Ref. No. 3120/306/01
Company Aughinish Alumina Ltd Date of Receipt 2/04/2009
Address Auginish Island Date Testing 1/04/2009
Askeaton Co Limerick Received or Collected Delivered by Customer
Ireland Condition on Receipt Acceptable
Customer PO 2665419 Date of Report 17/04/2009
CERTIFICATE OF ANALYSIS
Lab Ref 3120/306/01 Client Ref W1-1A Sample Type Water
Test Parameter SOP Analytical Technique
Result Units
US EPA Method 524.2 154 GC-MS 1 <1 μg/L Ethanol 154 GC-MS 1 <1 μg/L
Acaetonitrile 154 GC-MS 1 <1 μg/L IPA 154 GC-MS 1 <1 μg/L Methanol 154 GC-MS 1 <1 μg/L Acetone 154 GC-MS 1 <1 μg/L MEK 154 GC-MS 1 <1 μg/L
Date: 17/04/2009
Katherine McQuillan -Deputy Technical Manager
* INAB Accredited Test
Results shall not be reproduced, except in full, without the approval of EURO environmental services Results contained in this report
relate only to the samples tested Results which exceed the Parametric Value Limit are highlighted for the sample tested Page 1 of 1
Unit 35, Boyne Business Park, Drogheda, Co. Louth Ireland
Tel: +353 41 9845440
Fax: +353 41 9846171
Web: www.euroenv.ie email: [email protected]

Customer Name Trevor Montgomery Lab Report Ref. No. 3120/335/01
Company Aughinish Alumina Ltd Date of Receipt 7/10/2009
Address Auginish Island Date Testing 6/10/2009
Askeaton Co Limerick Received or Collected Delivered by Customer
Ireland Condition on Receipt Acceptable
Customer PO 2665419 Date of Report 22/10/2009
CERTIFICATE OF ANALYSIS
Lab Ref 3120/335/01 Client Ref W1-1A Sample Type Water
Test Parameter SOP Analytical Technique
Result Units
US EPA Method 524.2 154 GC-MS 1 <1 μg/L Ethanol 154 GC-MS 1 <1 μg/L
Acaetonitrile 154 GC-MS 1 <1 μg/L IPA 154 GC-MS 1 <1 μg/L Methanol 154 GC-MS 1 <1 μg/L Acetone 154 GC-MS 1 <1 μg/L MEK 154 GC-MS 1 <1 μg/L
Date: 22/10/2009
Katherine McQuillan -Deputy Technical Manager
* INAB Accredited Test
Results shall not be reproduced, except in full, without the approval of EURO environmental services Results contained in this report
relate only to the samples tested Results which exceed the Parametric Value Limit are highlighted for the sample tested Page 1 of 1
Unit 35, Boyne Business Park, Drogheda, Co. Louth Ireland
Tel: +353 41 9845440
Fax: +353 41 9846171
Web: www.euroenv.ie email: [email protected]

Customer Name Trevor Montgomery Lab Report Ref. No. 3120/335/02
Company Aughinish Alumina Ltd Date of Receipt 7/10/2009
Address Auginish Island Date Testing 6/10/2009
Askeaton Co Limerick Received or Collected Delivered by Customer
Ireland Condition on Receipt Acceptable
Customer PO 2665419 Date of Report 22/10/2009
CERTIFICATE OF ANALYSIS
Lab Ref 3120/335/02 Client Ref W1-1B Sample Type Water
Test Parameter SOP Analytical Technique
Result Units
US EPA Method 524.2 154 GC-MS 1 <1 μg/L Ethanol 154 GC-MS 1 <1 μg/L
Acaetonitrile 154 GC-MS 1 <1 μg/L IPA 154 GC-MS 1 <1 μg/L Methanol 154 GC-MS 1 <1 μg/L Acetone 154 GC-MS 1 <1 μg/L MEK 154 GC-MS 1 <1 μg/L
Date: 22/10/2009
Katherine McQuillan -Deputy Technical Manager
* INAB Accredited Test
Results shall not be reproduced, except in full, without the approval of EURO environmental services Results contained in this report
relate only to the samples tested Results which exceed the Parametric Value Limit are highlighted for the sample tested Page 1 of 1
Unit 35, Boyne Business Park, Drogheda, Co. Louth Ireland
Tel: +353 41 9845440
Fax: +353 41 9846171
Web: www.euroenv.ie email: [email protected]

Aughinish Alumina Ltd. March 2010 AER 2009
Attachment 3 Results of Waste Analysis

Aughinish Alumina Ltd. March 2010 AER 2009
This page is intentionally blank
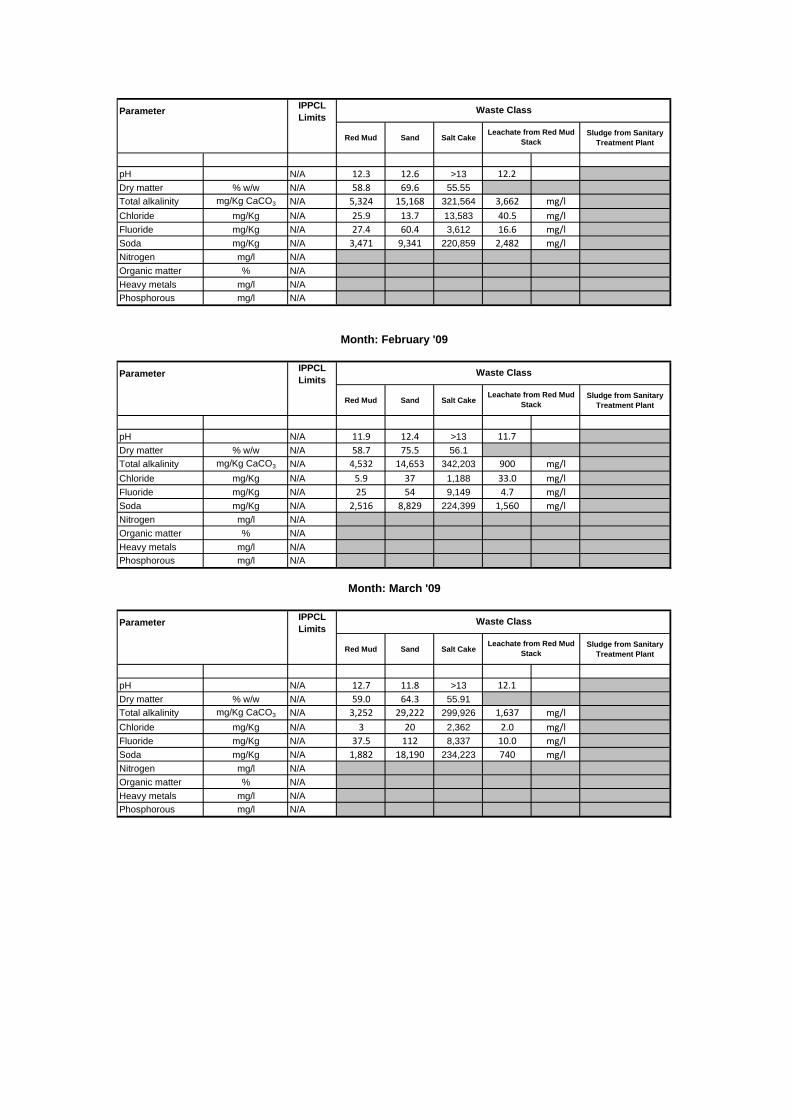
ParameterIPPCL
Limits
Red Mud Sand Salt CakeSludge from Sanitary
Treatment Plant
pH N/A 12.3 12.6 >13 12.2
Dry matter % w/w N/A 58.8 69.6 55.55
Total alkalinity mg/Kg CaCO3 N/A 5,324 15,168 321,564 3,662 mg/l
Chloride mg/Kg N/A 25.9 13.7 13,583 40.5 mg/l
Fluoride mg/Kg N/A 27.4 60.4 3,612 16.6 mg/l
Soda mg/Kg N/A 3,471 9,341 220,859 2,482 mg/l
Nitrogen mg/l N/A
Organic matter % N/A
Heavy metals mg/l N/A
Phosphorous mg/l N/A
ParameterIPPCL
Limits
Red Mud Sand Salt CakeSludge from Sanitary
Treatment Plant
pH N/A 11.9 12.4 >13 11.7
Dry matter % w/w N/A 58.7 75.5 56.1
Total alkalinity mg/Kg CaCO3 N/A 4,532 14,653 342,203 900 mg/l
Chloride mg/Kg N/A 5.9 37 1,188 33.0 mg/l
Fluoride mg/Kg N/A 25 54 9,149 4.7 mg/l
Soda mg/Kg N/A 2,516 8,829 224,399 1,560 mg/l
Nitrogen mg/l N/A
Organic matter % N/A
Heavy metals mg/l N/A
Phosphorous mg/l N/A
ParameterIPPCL
Limits
Red Mud Sand Salt CakeSludge from Sanitary
Treatment Plant
pH N/A 12.7 11.8 >13 12.1
Dry matter % w/w N/A 59.0 64.3 55.91
Total alkalinity mg/Kg CaCO3 N/A 3,252 29,222 299,926 1,637 mg/l
Chloride mg/Kg N/A 3 20 2,362 2.0 mg/l
Fluoride mg/Kg N/A 37.5 112 8,337 10.0 mg/l
Soda mg/Kg N/A 1,882 18,190 234,223 740 mg/l
Nitrogen mg/l N/A
Organic matter % N/A
Heavy metals mg/l N/A
Phosphorous mg/l N/A
Month: March '09
Waste Class
Leachate from Red Mud
Stack
Waste Class
Leachate from Red Mud
Stack
Month: February '09
Waste Class
Leachate from Red Mud
Stack
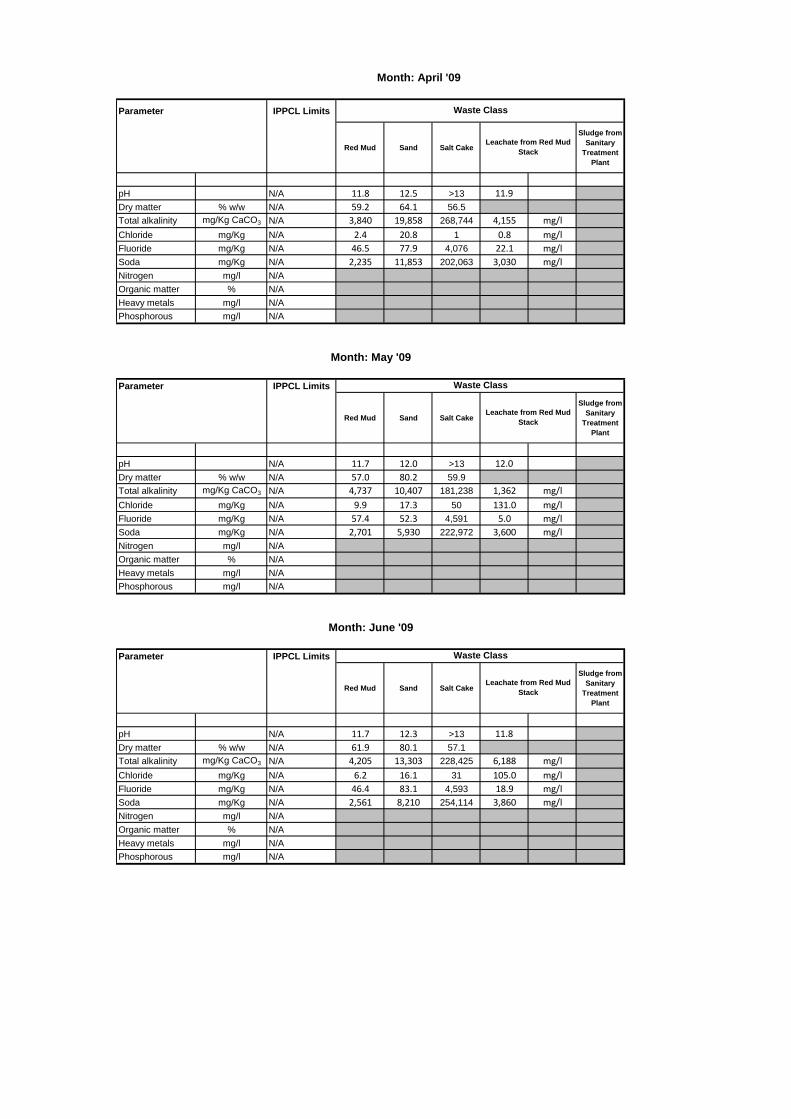
Parameter IPPCL Limits
Red Mud Sand Salt Cake
Sludge from
Sanitary
Treatment
Plant
pH N/A 11.8 12.5 >13 11.9
Dry matter % w/w N/A 59.2 64.1 56.5
Total alkalinity mg/Kg CaCO3 N/A 3,840 19,858 268,744 4,155 mg/l
Chloride mg/Kg N/A 2.4 20.8 1 0.8 mg/l
Fluoride mg/Kg N/A 46.5 77.9 4,076 22.1 mg/l
Soda mg/Kg N/A 2,235 11,853 202,063 3,030 mg/l
Nitrogen mg/l N/A
Organic matter % N/A
Heavy metals mg/l N/A
Phosphorous mg/l N/A
Parameter IPPCL Limits
Red Mud Sand Salt Cake
Sludge from
Sanitary
Treatment
Plant
pH N/A 11.7 12.0 >13 12.0
Dry matter % w/w N/A 57.0 80.2 59.9
Total alkalinity mg/Kg CaCO3 N/A 4,737 10,407 181,238 1,362 mg/l
Chloride mg/Kg N/A 9.9 17.3 50 131.0 mg/l
Fluoride mg/Kg N/A 57.4 52.3 4,591 5.0 mg/l
Soda mg/Kg N/A 2,701 5,930 222,972 3,600 mg/l
Nitrogen mg/l N/A
Organic matter % N/A
Heavy metals mg/l N/A
Phosphorous mg/l N/A
Parameter IPPCL Limits
Red Mud Sand Salt Cake
Sludge from
Sanitary
Treatment
Plant
pH N/A 11.7 12.3 >13 11.8
Dry matter % w/w N/A 61.9 80.1 57.1
Total alkalinity mg/Kg CaCO3 N/A 4,205 13,303 228,425 6,188 mg/l
Chloride mg/Kg N/A 6.2 16.1 31 105.0 mg/l
Fluoride mg/Kg N/A 46.4 83.1 4,593 18.9 mg/l
Soda mg/Kg N/A 2,561 8,210 254,114 3,860 mg/l
Nitrogen mg/l N/A
Organic matter % N/A
Heavy metals mg/l N/A
Phosphorous mg/l N/A
Month: June '09
Waste Class
Leachate from Red Mud
Stack
Month: April '09
Waste Class
Leachate from Red Mud
Stack
Month: May '09
Waste Class
Leachate from Red Mud
Stack

ParameterIPPCL
Limits
Red Mud Sand Salt Cake
Sludge from
Sanitary
Treatment
Plant
pH N/A 12.1 11.9 13.2 12.4
Dry matter % w/w N/A 62.1 79.9 56.7
Total alkalinity mg/Kg CaCO3 N/A 8,241 5,104 309,432 693 mg/l
Chloride mg/Kg N/A 6.8 3.9 71 86.1 mg/l
Fluoride mg/Kg N/A 55.9 53.3 1,328 45.6 mg/l
Soda mg/Kg N/A 5,167 3,113 219,410 5,810 mg/l
Nitrogen mg/l N/A
Organic matter % N/A
Heavy metals mg/l N/A
Phosphorous mg/l N/A
ParameterIPPCL
Limits
Red Mud Sand Salt Cake
Sludge from
Sanitary
Treatment
Plant
pH N/A 13.0 11.9
Dry matter % w/w N/A 62.1 79.3 58.5
Total alkalinity mg/Kg CaCO3 N/A 281,261 mg/l
Chloride mg/Kg N/A 6 mg/l
Fluoride mg/Kg N/A 2,143 mg/l
Soda mg/Kg N/A 218,461 2,240 mg/l
Nitrogen mg/l N/A
Organic matter % N/A
Heavy metals mg/l N/A
Phosphorous mg/l N/A
ParameterIPPCL
Limits
Red Mud Sand Salt Cake
Sludge from
Sanitary
Treatment
Plant
pH N/A 13.0 12.4
Dry matter % w/w N/A 61.3 80.1 61.6
Total alkalinity mg/Kg CaCO3 N/A 7,186 10,987 248,646 3,257 mg/l
Chloride mg/Kg N/A 7.7 12.8 8 78.1 mg/l
Fluoride mg/Kg N/A 82.8 57.7 1,366 45.0 mg/l
Soda mg/Kg N/A 5,953 8,970 286,631 4,100 mg/l
Nitrogen mg/l N/A
Organic matter % N/A
Heavy metals mg/l N/A
Phosphorous mg/l N/A
Month: September '09
Waste Class
Leachate from Red Mud
Stack
Month: July '09
Waste Class
Leachate from Red Mud
Stack
Month: August '09
Waste Class
Leachate from Red Mud
Stack

ParameterIPPCL
Limits
Red Mud Sand Salt Cake
Sludge from
Sanitary
Treatment
Plant
pH N/A 11.9 12.0 13.0 12.4
Dry matter % w/w N/A 59.9 79.7 62.5
Total alkalinity mg/Kg CaCO3 N/A 12,015 12,564 341,765 6,625 mg/l
Chloride mg/Kg N/A 20.4 14.3 2,649 1.7 mg/l
Fluoride mg/Kg N/A 63.8 57.7 2,014 8.7 mg/l
Soda mg/Kg N/A 8,141 7,995 259,991 4,660 mg/l
Nitrogen mg/l N/A
Organic matter % N/A
Heavy metals mg/l N/A
Phosphorous mg/l N/A
ParameterIPPCL
Limits
Red Mud Sand Salt Cake
Sludge from
Sanitary
Treatment
Plant
pH N/A 11.8 12.0 13.2 11.1
Dry matter % w/w N/A 59.7 80.2 56.5
Total alkalinity mg/Kg CaCO3 N/A 7,712 8,807 303,828 2,681 mg/l
Chloride mg/Kg N/A 3.6 3.9 235 1.2 mg/l
Fluoride mg/Kg N/A 57.6 48.1 1,564 24.2 mg/l
Soda mg/Kg N/A 4,744 5,700 206,999 2,550 mg/l
Nitrogen mg/l N/A
Organic matter % N/A
Heavy metals mg/l N/A
Phosphorous mg/l N/A
ParameterIPPCL
Limits
Red Mud Sand Salt Cake
Sludge from
Sanitary
Treatment
Plant
pH N/A 12.1 12.4 >13 11.8
Dry matter % w/w N/A 59.2 79.8 56.2
Total alkalinity mg/Kg CaCO3 N/A 8,097 1,731 314,292 2,983 mg/l
Chloride mg/Kg N/A 15.4 47.3 2 36.6 mg/l
Fluoride mg/Kg N/A 51.6 71.7 40 21.1 mg/l
Soda mg/Kg N/A 5,148 10,620 220,542 1,940 mg/l
Nitrogen mg/l N/A
Organic matter % N/A
Heavy metals mg/l N/A
Phosphorous mg/l N/A
Month: December '09
Waste Class
Leachate from Red Mud
Stack
Month: October '09
Waste Class
Leachate from Red Mud
Stack
Month: November '09
Waste Class
Leachate from Red Mud
Stack

Aughinish Alumina Ltd. March 2010 AER 2009
Attachment 4
Environmental Management Programme

Aughinish Alumina Ltd. March 2010 AER 2009
This page is intentionally blank
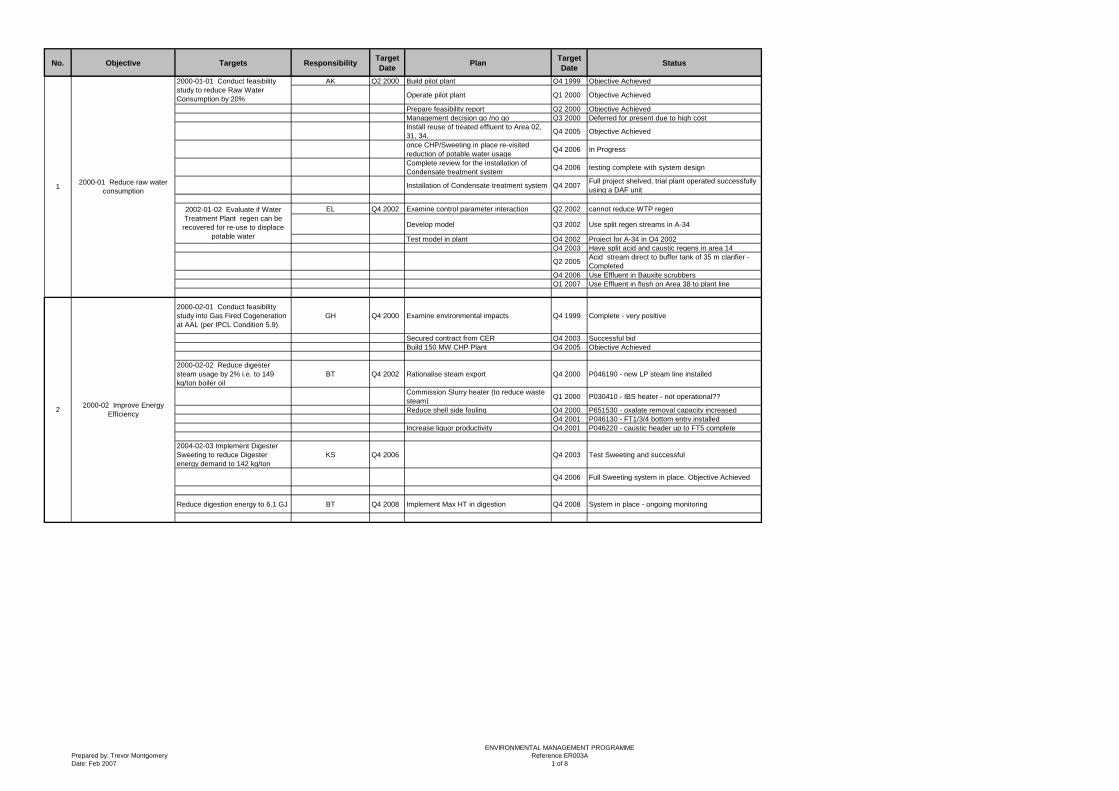
No. Objective Targets ResponsibilityTarget
DatePlan
Target
DateStatus
AK Q2 2000 Build pilot plant Q4 1999 Objective Achieved
Operate pilot plant Q1 2000 Objective Achieved
Prepare feasibility report Q2 2000 Objective Achieved
Management decision go /no go Q3 2000 Deferred for present due to high cost
Install reuse of treated effluent to Area 02,
31, 34,Q4 2005 Objective Achieved
once CHP/Sweeting in place re-visited
reduction of potable water usage Q4 2006 In Progress
Complete review for the installation of
Condensate treatment systemQ4 2006 testing complete with system design
Installation of Condensate treatment system Q4 2007Full project shelved, trial plant operated successfully
using a DAF unit
EL Q4 2002 Examine control parameter interaction Q2 2002 cannot reduce WTP regen
Develop model Q3 2002 Use split regen streams in A-34
Test model in plant Q4 2002 Project for A-34 in Q4 2002
Q4 2003 Have split acid and caustic regens in area 14
Q2 2005Acid stream direct to buffer tank of 35 m clarifier -
Completed
Q4 2006 Use Effluent in Bauxite scrubbers
Q1 2007 Use Effluent in flush on Area 38 to plant line
2000-02-01 Conduct feasibility
study into Gas Fired Cogeneration
at AAL (per IPCL Condition 5.9)
GH Q4 2000 Examine environmental impacts Q4 1999 Complete - very positive
Secured contract from CER Q4 2003 Successful bid
Build 150 MW CHP Plant Q4 2005 Objective Achieved
2000-02-02 Reduce digester
steam usage by 2% i.e. to 149
kg/ton boiler oil
BT Q4 2002 Rationalise steam export Q4 2000 P046190 - new LP steam line installed
Commission Slurry heater (to reduce waste
steam)Q1 2000 P030410 - IBS heater - not operational??
Reduce shell side fouling Q4 2000 P651530 - oxalate removal capacity increased
Q4 2001 P046130 - FT1/3/4 bottom entry installed
Increase liquor productivity Q4 2001 P046220 - caustic header up to FT5 complete
2004-02-03 Implement Digester
Sweeting to reduce Digester
energy demand to 142 kg/ton
KS Q4 2006 Q4 2003 Test Sweeting and successful
Q4 2006 Full Sweeting system in place. Objective Achieved
Reduce digestion energy to 6.1 GJ BT Q4 2008 Implement Max HT in digestion Q4 2008 System in place - ongoing monitoring
2000-01-01 Conduct feasibility
study to reduce Raw Water
Consumption by 20%
2002-01-02 Evaluate if Water
Treatment Plant regen can be
recovered for re-use to displace
potable water
12000-01 Reduce raw water
consumption
22000-02 Improve Energy
Efficiency
Prepared by: Trevor Montgomery
Date: Feb 2007
ENVIRONMENTAL MANAGEMENT PROGRAMME
Reference ER003A
1 of 8
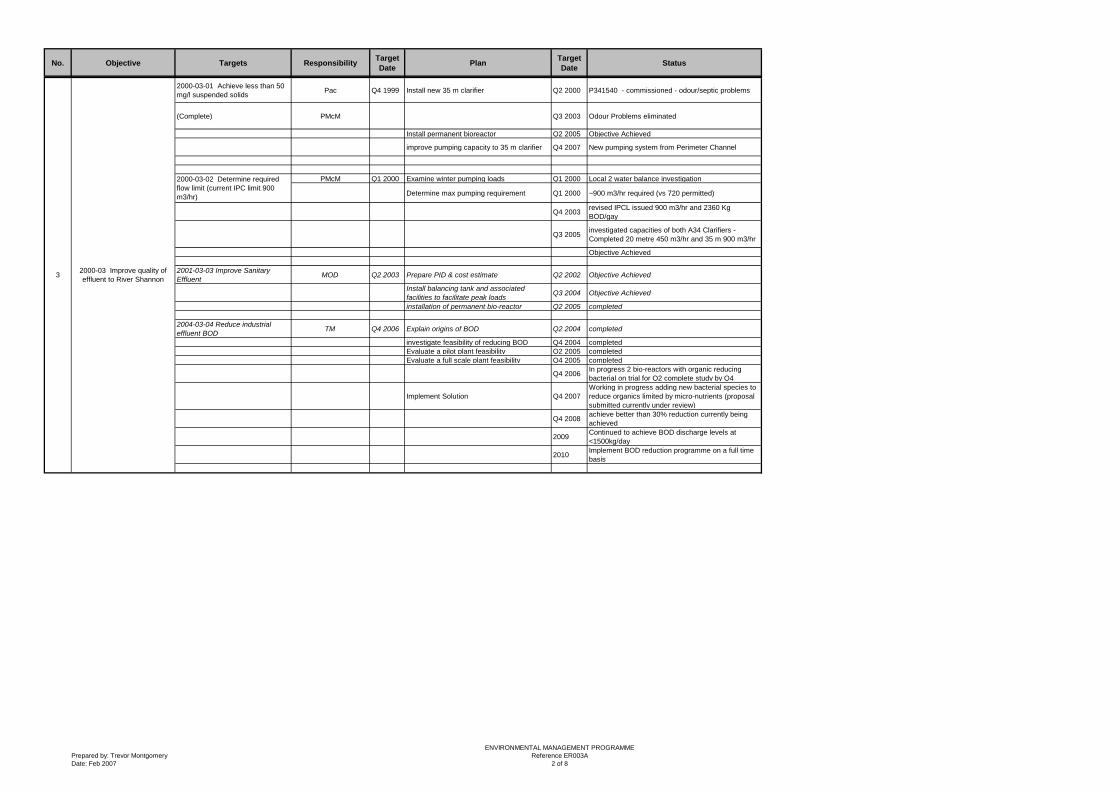
No. Objective Targets ResponsibilityTarget
DatePlan
Target
DateStatus
2000-01-01 Conduct feasibility
study to reduce Raw Water
Consumption by 20%
12000-01 Reduce raw water
consumption
2000-03-01 Achieve less than 50
mg/l suspended solidsPac Q4 1999 Install new 35 m clarifier Q2 2000 P341540 - commissioned - odour/septic problems
(Complete) PMcM Q3 2003 Odour Problems eliminated
Install permanent bioreactor Q2 2005 Objective Achieved
improve pumping capacity to 35 m clarifier Q4 2007 New pumping system from Perimeter Channel
PMcM Q1 2000 Examine winter pumping loads Q1 2000 Local 2 water balance investigation
Determine max pumping requirement Q1 2000 ~900 m3/hr required (vs 720 permitted)
Q4 2003revised IPCL issued 900 m3/hr and 2360 Kg
BOD/gay
Q3 2005investigated capacities of both A34 Clarifiers -
Completed 20 metre 450 m3/hr and 35 m 900 m3/hr
Objective Achieved
2001-03-03 Improve Sanitary
EffluentMOD Q2 2003 Prepare PID & cost estimate Q2 2002 Objective Achieved
Install balancing tank and associated
facilities to facilitate peak loadsQ3 2004 Objective Achieved
installation of permanent bio-reactor Q2 2005 completed
2004-03-04 Reduce industrial
effluent BODTM Q4 2006 Explain origins of BOD Q2 2004 completed
investigate feasibility of reducing BOD Q4 2004 completed
Evaluate a pilot plant feasibility Q2 2005 completed
Evaluate a full scale plant feasibility Q4 2005 completed
Q4 2006In progress 2 bio-reactors with organic reducing
bacterial on trial for Q2 complete study by Q4
Implement Solution Q4 2007
Working in progress adding new bacterial species to
reduce organics limited by micro-nutrients (proposal
submitted currently under review)
Q4 2008achieve better than 30% reduction currently being
achieved
2009Continued to achieve BOD discharge levels at
<1500kg/day
2010Implement BOD reduction programme on a full time
basis
2000-03-02 Determine required
flow limit (current IPC limit 900
m3/hr)
2000-03 Improve quality of
effluent to River Shannon3
Prepared by: Trevor Montgomery
Date: Feb 2007
ENVIRONMENTAL MANAGEMENT PROGRAMME
Reference ER003A
2 of 8
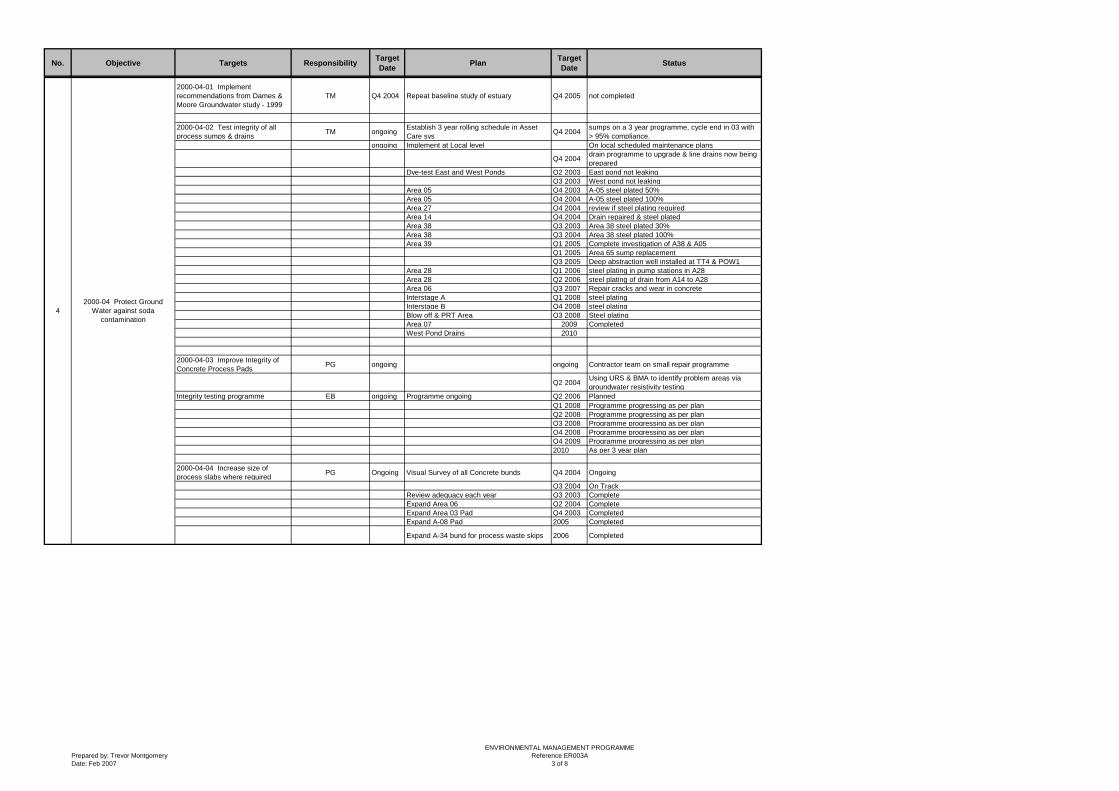
No. Objective Targets ResponsibilityTarget
DatePlan
Target
DateStatus
2000-01-01 Conduct feasibility
study to reduce Raw Water
Consumption by 20%
12000-01 Reduce raw water
consumption
2000-04-01 Implement
recommendations from Dames &
Moore Groundwater study - 1999
TM Q4 2004 Repeat baseline study of estuary Q4 2005 not completed
2000-04-02 Test integrity of all
process sumps & drainsTM ongoing
Establish 3 year rolling schedule in Asset
Care sysQ4 2004
sumps on a 3 year programme, cycle end in 03 with
> 95% compliance.
ongoing Implement at Local level On local scheduled maintenance plans
Q4 2004drain programme to upgrade & line drains now being
prepared
Dye-test East and West Ponds Q2 2003 East pond not leaking
Q3 2003 West pond not leaking
Area 05 Q4 2003 A-05 steel plated 50%
Area 05 Q4 2004 A-05 steel plated 100%
Area 27 Q4 2004 review if steel plating required
Area 14 Q4 2004 Drain repaired & steel plated
Area 38 Q3 2003 Area 38 steel plated 30%
Area 38 Q3 2004 Area 38 steel plated 100%
Area 39 Q1 2005 Complete investigation of A38 & A05
Q1 2005 Area 65 sump replacement
Q3 2005 Deep abstraction well installed at TT4 & POW1
Area 28 Q1 2006 steel plating in pump stations in A28
Area 28 Q2 2006 steel plating of drain from A14 to A28
Area 06 Q3 2007 Repair cracks and wear in concrete
Interstage A Q1 2008 steel plating
Interstage B Q4 2008 steel plating
Blow off & PRT Area Q3 2008 Steel plating
Area 07 2009 Completed
West Pond Drains 2010
2000-04-03 Improve Integrity of
Concrete Process Pads PG ongoing ongoing Contractor team on small repair programme
Q2 2004Using URS & BMA to identify problem areas via
groundwater resistivity testing
Integrity testing programme EB ongoing Programme ongoing Q2 2006 Planned
Q1 2008 Programme progressing as per plan
Q2 2008 Programme progressing as per plan
Q3 2008 Programme progressing as per plan
Q4 2008 Programme progressing as per plan
Q4 2009 Programme progressing as per plan
2010 As per 3 year plan
2000-04-04 Increase size of
process slabs where requiredPG Ongoing Visual Survey of all Concrete bunds Q4 2004 Ongoing
Q3 2004 On Track
Review adequacy each year Q3 2003 Complete
Expand Area 06 Q2 2004 Complete
Expand Area 03 Pad Q4 2003 Completed
Expand A-08 Pad 2005 Completed
Expand A-34 bund for process waste skips 2006 Completed
4
2000-04 Protect Ground
Water against soda
contamination
Prepared by: Trevor Montgomery
Date: Feb 2007
ENVIRONMENTAL MANAGEMENT PROGRAMME
Reference ER003A
3 of 8

No. Objective Targets ResponsibilityTarget
DatePlan
Target
DateStatus
2000-01-01 Conduct feasibility
study to reduce Raw Water
Consumption by 20%
12000-01 Reduce raw water
consumption
2000-04-05 Assess the Integrity of
certifiable Bunding StructuresTH ongoing Q2 2008
All raw material bunds tested except A-23 HFO
tanks. Will submit a proposal re: Area 23 in 2008
2008 Proposal on A23 completed
On 3 year cycle 2009 Q2 2009 Repairs to A23 bund completed
2000-04-07 Ensure that
underground tanks are not leaking
(per IPCL condition 9.3.5)
TM Ongoing Decommission two diesel tanks Q4 2004Emptied underground white diesel tank for temporary
above ground tank
Q2 2005Replace White & green diesel tank with above
ground tanks
Q2 2008 develop proposal on Petrol tank decom
2000-04-08 Test & inspect the
underground foul/sewer pipes EB ongoing Examine 50% of system by camera Q2 3006
Complete survey of all sewers and underground
pipes and repair all defects
EB Q4 2006 100 examination completed Q4 2006 survey showed repairs required
Q3 2007 repairs to follow inspection
Q1 2008 Repair of sewer system
Q2 2008 Repairs completed
2000-04-09 Remediate leak from
SWP using abstraction WellsTH Q4 2006 Eliminate Leak at OW1 / OW2 Q4 2004 submit proposal to agency
Q4 2006 complete solution
Q8 2008 complete recovery of groundwater at OW 1 &2
2006-04-09 Extra groundwater
recovery wells TM Q2 2006
Well at West Pond, East Pond and Area
48/50Q4 2007 Planned
TH Q4 2008
Golders reviewing all Groundwater data and
best way forward for groundwater protection
programme
Q4 2008implement revised groundwater protection
programme
2002-05-03 Develop an automatic
system to control NOxMF Q4 2003 Develop combustion control model Q3 2003 New low Nox burner tips in place
and Opacity on the boilers Q4 2003Automatic excess O2 control with CO feedback trim
for opacity & Nox control completed
MO'D Q3 2006Develop proposal for NOx reduction to 450
mg/m3 Q3 2006 In progress
AG Q4 2007 Implement Nox reduction programme Q2 2008 In progress
Implement Nox reduction programme 2009 Programme to be expanded
2002-05-04 Prevent mud Stack
dustingD.McE Q4 2002 Install sprinkler network Q4 2003 completed
Q4 2004 Install new pump and controls Q1 2005 Completed
2005-05-05 Commission CHP JR Q2 2005 Implementation & evaluation Q2 2006 In Progress
2005-05-06 Implement
Modifications to CalcinerTO'B Q2 2005 Calciner 3 - reduce particulates emissions Q2 2005 Complete
TO'B Q2 2006 Calciner 2 - reduce particulates emissions Q2 2006 Complete
TO'B Q3 2006 humidity control on ESP for dust control Q" 2006 Complete
2006-05-07 Inner Berth Loader -
spillage reductionJH Q3 2006 Improve dust collection system Q3 2006 Complete
2006-05-07 Agreement on
proposed NERPLF Q3 2006 Need agreement on NERP from DOE & EU Q2 2006 Complete
monitoring & reporting of
emissions versus NERP limitsEB Q1 2009 NERP spredsheet developed Q2 2009 Complete
4
(cont)
5
2000-04 Protect Ground
Water against soda
contamination
2000-05 Improve air quality
Prepared by: Trevor Montgomery
Date: Feb 2007
ENVIRONMENTAL MANAGEMENT PROGRAMME
Reference ER003A
4 of 8
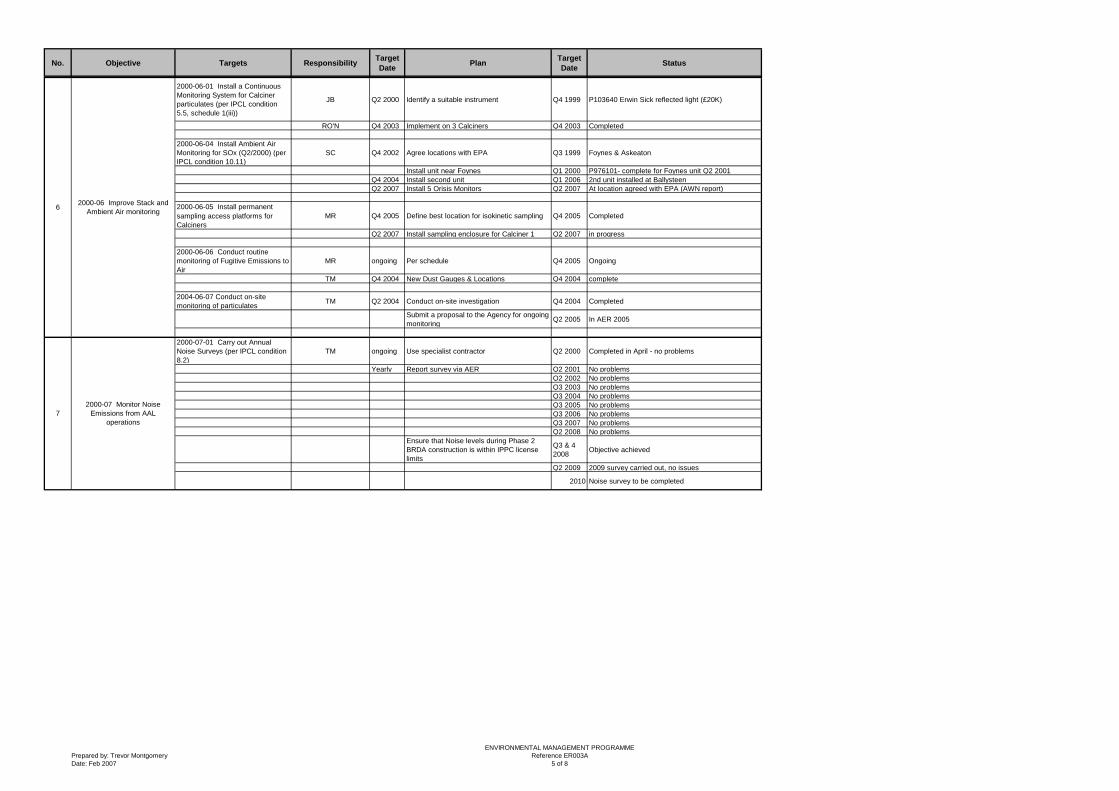
No. Objective Targets ResponsibilityTarget
DatePlan
Target
DateStatus
2000-01-01 Conduct feasibility
study to reduce Raw Water
Consumption by 20%
12000-01 Reduce raw water
consumption
2000-06-01 Install a Continuous
Monitoring System for Calciner
particulates (per IPCL condition
5.5, schedule 1(iii))
JB Q2 2000 Identify a suitable instrument Q4 1999 P103640 Erwin Sick reflected light (£20K)
RO'N Q4 2003 Implement on 3 Calciners Q4 2003 Completed
2000-06-04 Install Ambient Air
Monitoring for SOx (Q2/2000) (per
IPCL condition 10.11)
SC Q4 2002 Agree locations with EPA Q3 1999 Foynes & Askeaton
Install unit near Foynes Q1 2000 P976101- complete for Foynes unit Q2 2001
Q4 2004 Install second unit Q1 2006 2nd unit installed at Ballysteen
Q2 2007 Install 5 Orisis Monitors Q2 2007 At location agreed with EPA (AWN report)
2000-06-05 Install permanent
sampling access platforms for
Calciners
MR Q4 2005 Define best location for isokinetic sampling Q4 2005 Completed
Q2 2007 Install sampling enclosure for Calciner 1 Q2 2007 in progress
2000-06-06 Conduct routine
monitoring of Fugitive Emissions to
Air
MR ongoing Per schedule Q4 2005 Ongoing
TM Q4 2004 New Dust Gauges & Locations Q4 2004 complete
2004-06-07 Conduct on-site
monitoring of particulatesTM Q2 2004 Conduct on-site investigation Q4 2004 Completed
Submit a proposal to the Agency for ongoing
monitoringQ2 2005 In AER 2005
2000-07-01 Carry out Annual
Noise Surveys (per IPCL condition
8.2)
TM ongoing Use specialist contractor Q2 2000 Completed in April - no problems
Yearly Report survey via AER Q2 2001 No problems
Q2 2002 No problems
Q3 2003 No problems
Q3 2004 No problems
Q3 2005 No problems
Q3 2006 No problems
Q3 2007 No problems
Q2 2008 No problems
Ensure that Noise levels during Phase 2
BRDA construction is within IPPC license
limits
Q3 & 4
2008Objective achieved
Q2 2009 2009 survey carried out, no issues
2010 Noise survey to be completed
2000-06 Improve Stack and
Ambient Air monitoring6
7
2000-07 Monitor Noise
Emissions from AAL
operations
Prepared by: Trevor Montgomery
Date: Feb 2007
ENVIRONMENTAL MANAGEMENT PROGRAMME
Reference ER003A
5 of 8

No. Objective Targets ResponsibilityTarget
DatePlan
Target
DateStatus
2000-01-01 Conduct feasibility
study to reduce Raw Water
Consumption by 20%
12000-01 Reduce raw water
consumption
2000-08-01 Investigate Options
for Waste Recycling &
Minimisation (per IPCL condition
2.1)
LF Q4 2001 Monitor Alcan investigation into red mud Q4 2004AAL participating with Aluminium Industry in options
for red mud utilisation
TH Q1 2005 Revised Landfill Conditioning Plan Q3 2005 Objective achieved
2000-08-02 Investigate properties
of red mudLF ongoing develop database of reference material ongoing Part of Closure plan work
LF/MF 2009Develop knowledge on Neutralisation of Red
Mud2009
Programme of work underway with University of
Limerick
EL/TH 2009 Develop system to neutralise Red Mud Q4 2008 Pilot plant to assessment to try neutralisation
Q4 2009 implement full scale plant
2002-08-03 Install dust control
systemTH ongoing Develop long-term plan Q3 2004
New Organisation structure in place to manage
stack operations
Implement extensive sprinkler network Q3 2003 Objective achieved
Improve water supply to sprinklers Q3 2003 Objective achieved
2006-08-04 Demonstrate closure
plan & model itMMcG ongoing Review all available reports Q2 2006 Planned
MMcG Q2 2006 Visit Burntisland in Scotland Q3 2006 completed
TH/TM Q2 2006 Planning Permission for BRDA extension Q2 2006 planning received by TH- appealed to ABP
EL/TH 2011Implementation of recommendations of
Golders Associates Report2009 Risk reduction assessment to be completed
LF/RC 2012Revegetation of BRDA as per Residual
Solutions Report2009 Grassing of trial cell to be completed
2000-09-02 Improve Plant Visual
Appearance BMcG ongoing Develop a 5 year landscaping plan Q4 2006
ongoing - greening of plant underway and
landscaping design from BSM.
TM Q4 2003 Choke vents & route to BO pots Q4 2003 1st phase in 2002
2002-09-03 Reduce digestion
plumeQ4 2006 Implement Sweeting Q4 2006 Objective achieved
Q4 2008 Implement HT Max Q4 2008 In progress
2009 Project continuing
2000-10-01 Maintain High Level of
Emergency Preparedness JJ Ongoing Revisit Emergency Standard Q2 2000 Complete
Modify procedures to ISO14001 standard Q2 2000 Procedures in electronic format & up-to-date
Conduct Local exercises yearly Q2 2006 Planned
Revise Emergency Response plan Q2 2008 Planned
2000-10-02 Prepare an
'Emergency response trailer for
spillages'
ED Q2 2002 Equip for oil spillage rapid response Q3 2003Plant unit in place - jetty in 2003. New supplies will
be added as required
Ongoing test use of procedures &
equipmentQ4 2004 completed
TM Q1 2007Completed Emergency response area with
necessary markings and equipmentQ1 2007 underway
EB Q3 2008 Conduct emergency response exercises Q3 2008 Planned in 3 locals
Q4 2008 3 exercises completed
8
2000-08 Reduce waste
disposal to landfill, operate the
on-site landfill to best practice
92000-09 Improve Visual
Appearance of AAL
102000-10 Establish Effective
Emergency preparedness
Prepared by: Trevor Montgomery
Date: Feb 2007
ENVIRONMENTAL MANAGEMENT PROGRAMME
Reference ER003A
6 of 8

No. Objective Targets ResponsibilityTarget
DatePlan
Target
DateStatus
2000-01-01 Conduct feasibility
study to reduce Raw Water
Consumption by 20%
12000-01 Reduce raw water
consumption
2000-11-03 Improve maintenance
managementLF Q3 2001
Review 'Environmental instruments &
equipment' per local Annually Completed by G.O'F
Define required reports Q1 2001 Completed
Modify system to install all environmental
instruments in Asset careQ3 2004 Completed
Q1 2007Review all ISO Environmental Instruments
to ensure calibration frequency correctQ1 2007 Completed
Q1 2008Review all ISO Environmental Instruments
to ensure calibration frequency correctQ1 2008 underway
2000-11-05 Bird Sanctuary &
Related lands Management PlanNK Q1 2001 Develop Bird Sanctuary Plan Q4 2000 1st pass complete
Q3 2006 review plan
LF ongoing Demonstrate that
2000-12-01 Update Site Closure
Plan technically & financially (per
IPCL condition 13.2.1)
- mud stack dusting stops within 5 years Q4 2000 Consultant commissioned (Enviroplan)
- stack run-off pH < 9.0 within 5 years Q4 2000 Consultant's 1st report received
Q1 2005 closure plan currently under revision
Q2 2006trial area to be constructed, filled with red and
restoration started
Q3 2006 review work to date and report to the agency
Q2 2007As part of the BRDA phase 2 - complete review of all
closure techniques underway
Q4 2007Completion of Mick McGrath PhD on determine
leachate and pH quality from the BRDA
2000- 12-02 Update the Liabilities
Risk Assessment technically &
financially (per IPCL 14.3.1)
LF ongoing Status letter to the EPA Q4 2000 Complete - to be repeated annually
2000-12-03 Prepare landfill status
reportTH ongoing Use the standard report template yearly Planned for Q4 (for AER)
2006-12-04 Department Re-
organisation TM on-going
Devolvement of filing system for envn
documentationQ2 2006 In progress
TM Q2 2007 re-organising department Q2 2006 Completed
Training for environmental Technologists
(Post Graduate Diploma, MCerts, Auditing) Ongoing In progress
2000-13-01 Implement
Environmental Training Plans for
AAL Employees and Contractors
(per IPCL condition 2.7)
TM Q4 2000 Prepare & deliver IPCL awareness module Q1 2000 Complete
Prepare & deliver ISO14001 module Q2 2000 Complete
Update Environmental part of AAL contracts Q2 2000 Environmental regulations issued to Contractors
Environmental regs also included in H&S plans
Contractor hand-book being updated
Prepare/deliver module on groundwater Q1 2002 Delivered in Q1 2002
Q2 2004 Present AER as a Monthly meeting Q2 2004 Objective achieved
Q3 2005 Present AER & two other topics Q2 2005 Objective achieved
Q3 2006 Present AER & two other topics Q3 2006 Objective achieved
Q1 2007 Present AER & two other topics Q3 2006 Objective achieved
Q1 2007 Presentation to facilitators and coordinators Q1 2007 Objective achieved
Q2 2008 Presentation to facilitators and coordinators Q2 2008 Objective achieved
Q2 2009 Presentation to facilitators and coordinators Q2 2009 Objective achieved
Q2 2010 Planned
112000-11 Establish an EMS
(per IPCL condition 2.1)
2000-12 Conduct AER driven
reviews12
Prepared by: Trevor Montgomery
Date: Feb 2007
ENVIRONMENTAL MANAGEMENT PROGRAMME
Reference ER003A
7 of 8
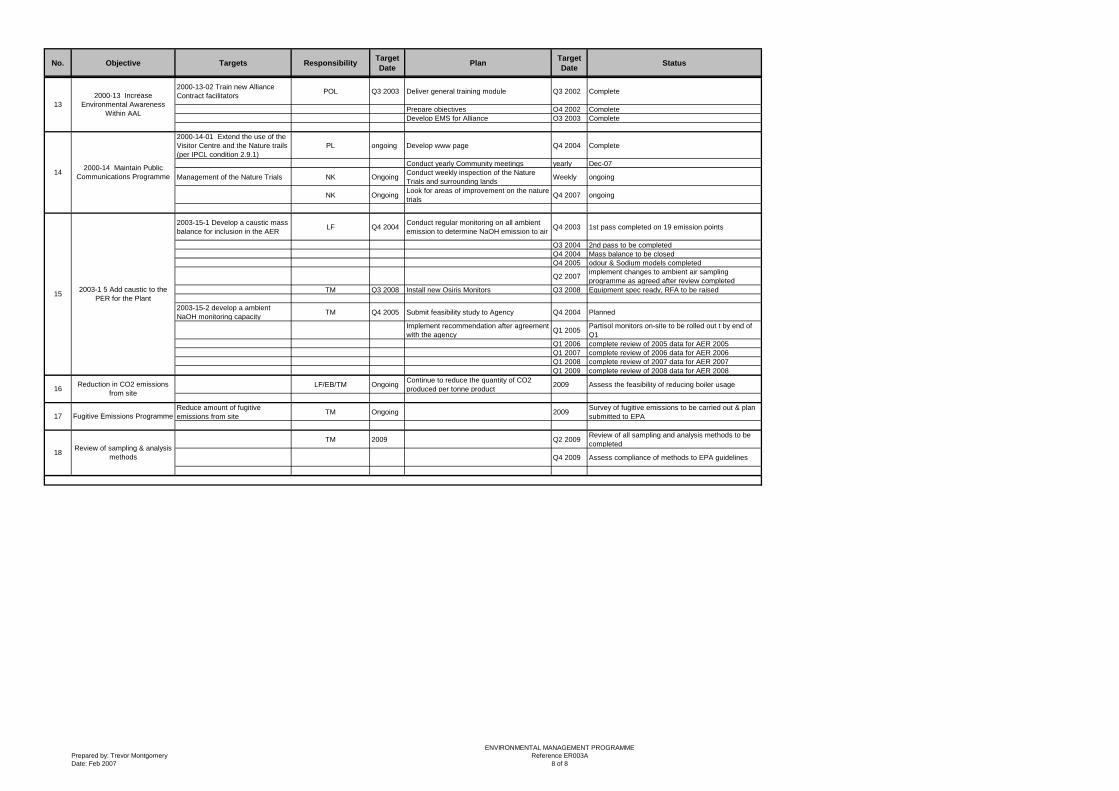
No. Objective Targets ResponsibilityTarget
DatePlan
Target
DateStatus
2000-01-01 Conduct feasibility
study to reduce Raw Water
Consumption by 20%
12000-01 Reduce raw water
consumption
2000-13-02 Train new Alliance
Contract facilitatorsPOL Q3 2003 Deliver general training module Q3 2002 Complete
Prepare objectives Q4 2002 Complete
Develop EMS for Alliance Q3 2003 Complete
2000-14-01 Extend the use of the
Visitor Centre and the Nature trails
(per IPCL condition 2.9.1)
PL ongoing Develop www page Q4 2004 Complete
Conduct yearly Community meetings yearly Dec-07
Management of the Nature Trials NK OngoingConduct weekly inspection of the Nature
Trials and surrounding landsWeekly ongoing
NK OngoingLook for areas of improvement on the nature
trials Q4 2007 ongoing
2003-15-1 Develop a caustic mass
balance for inclusion in the AERLF Q4 2004
Conduct regular monitoring on all ambient
emission to determine NaOH emission to airQ4 2003 1st pass completed on 19 emission points
Q3 2004 2nd pass to be completed
Q4 2004 Mass balance to be closed
Q4 2005 odour & Sodium models completed
Q2 2007implement changes to ambient air sampling
programme as agreed after review completed
TM Q3 2008 Install new Osiris Monitors Q3 2008 Equipment spec ready, RFA to be raised
2003-15-2 develop a ambient
NaOH monitoring capacityTM Q4 2005 Submit feasibility study to Agency Q4 2004 Planned
Implement recommendation after agreement
with the agencyQ1 2005
Partisol monitors on-site to be rolled out t by end of
Q1
Q1 2006 complete review of 2005 data for AER 2005
Q1 2007 complete review of 2006 data for AER 2006
Q1 2008 complete review of 2007 data for AER 2007
Q1 2009 complete review of 2008 data for AER 2008
LF/EB/TM OngoingContinue to reduce the quantity of CO2
produced per tonne product2009 Assess the feasibility of reducing boiler usage
Reduce amount of fugitive
emissions from siteTM Ongoing 2009
Survey of fugitive emissions to be carried out & plan
submitted to EPA
TM 2009 Q2 2009Review of all sampling and analysis methods to be
completed
Q4 2009 Assess compliance of methods to EPA guidelines
13
2000-13 Increase
Environmental Awareness
Within AAL
142000-14 Maintain Public
Communications Programme
18Review of sampling & analysis
methods
152003-1 5 Add caustic to the
PER for the Plant
16Reduction in CO2 emissions
from site
17 Fugitive Emissions Programme
Prepared by: Trevor Montgomery
Date: Feb 2007
ENVIRONMENTAL MANAGEMENT PROGRAMME
Reference ER003A
8 of 8

Aughinish Alumina Ltd. March 2010 AER 2009
Attachment 5 Noise Survey Report

Aughinish Alumina Ltd. March 2010 AER 2009
This page is intentionally blank
RUSAL Aughinish Ltd Annual IPPC License Noise Survey Report for RUSAL Aughinish, Aughinish Island, Askeaton, Co. Limerick December 2009 Trevor Montgomery RUSAL Aughinish Aughinish Island Askeaton Co. Limerick T: 061 604000 F: 061 604091

RUSAL Aughinish
Noise Survey
December 2009
Contents
Contents ..................................................................................................................................... 2 1.0 Introduction ...................................................................................................................... 3 2.0 Survey Details and Measured Noise levels ...................................................................... 4
2.1 Choice of Measurement Locations ............................................................................... 4 2.2 Survey Periods ............................................................................................................. 5 2.3 Personnel and Instrumentation ..................................................................................... 5 2.4 Procedure .................................................................................................................... 5 2.5 Measurement Parameters ............................................................................................ 6
3.0 Receiving Environment .................................................................................................... 7 3.1 General Description...................................................................................................... 7
4.0 Survey Results and Discussion ........................................................................................ 8 4.1 Noise Sensitive Location Monitoring ............................................................................. 8
4.1.1 Position NLS 1 ...................................................................................................... 8 4.1.2 Position NLS 2 ...................................................................................................... 8 4.1.3 Position NLS 3 ...................................................................................................... 9 4.1.4 Position NLS 4 ...................................................................................................... 9 4.1.5 Position NLS 5 ...................................................................................................... 9
4.2 Boundary Location Monitoring .................................................................................... 10 4.2.1 Position BL 1 ....................................................................................................... 10 4.2.2 Position BL 2 ....................................................................................................... 10 4.2.3 Position BL 3 ....................................................................................................... 10 4.2.4 Position BL 4 ....................................................................................................... 11 4.2.5 Position BL 5 ....................................................................................................... 11 4.2.6 Position BL 6 ....................................................................................................... 11 4.2.7 Position BL 7 ....................................................................................................... 12
5.0 Conclusion ..................................................................................................................... 13 5.1 Sources and Emissions .............................................................................................. 13 5.2 Noise Impact .............................................................................................................. 14
6.0 References .................................................................................................................... 16 7.0 Tables ............................................................................................................................ 17 8.0 Figures .......................................................................................................................... 19 9.0 Aughinish Weather Data ..................................................................................................... 20
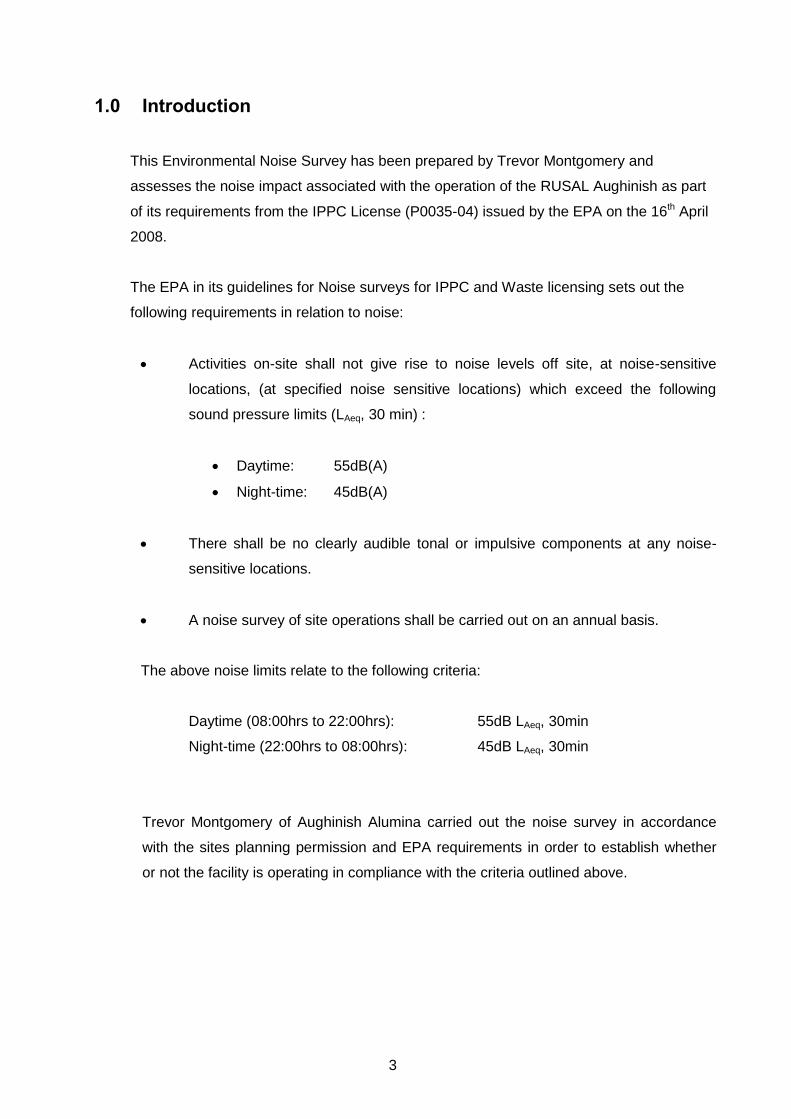
3
1.0 Introduction
This Environmental Noise Survey has been prepared by Trevor Montgomery and
assesses the noise impact associated with the operation of the RUSAL Aughinish as part
of its requirements from the IPPC License (P0035-04) issued by the EPA on the 16th April
2008.
The EPA in its guidelines for Noise surveys for IPPC and Waste licensing sets out the
following requirements in relation to noise:
Activities on-site shall not give rise to noise levels off site, at noise-sensitive
locations, (at specified noise sensitive locations) which exceed the following
sound pressure limits (LAeq, 30 min) :
Daytime: 55dB(A)
Night-time: 45dB(A)
There shall be no clearly audible tonal or impulsive components at any noise-
sensitive locations.
A noise survey of site operations shall be carried out on an annual basis.
The above noise limits relate to the following criteria:
Daytime (08:00hrs to 22:00hrs): 55dB LAeq, 30min
Night-time (22:00hrs to 08:00hrs): 45dB LAeq, 30min
Trevor Montgomery of Aughinish Alumina carried out the noise survey in accordance
with the sites planning permission and EPA requirements in order to establish whether
or not the facility is operating in compliance with the criteria outlined above.

4
2.0 Survey Details and Measured Noise levels
An environmental noise survey was conducted in order to quantify the existing noise
environment. The survey was conducted generally in accordance with ISO 1996: 1982:
Acoustics – Description and measurement of environmental noise and the Environmental
Protection Agency document entitled, Environmental Noise Survey Guidance Document.
Specific details are set out below.
2.1 Choice of Measurement Locations Whilst the planning permission criteria relate to noise levels at noise sensitive locations
and specific noise source or defined areas with the plant. The four boundary locations
(NSL 1 to NSL 4) are shown on Figure 1.1. These locations are described below.
Position B1 is at the north-west corner of the jetty where ships are unloaded. Position B2 is at the bend in the fencing to the north-east of the cooling towers to the east of the site. Position B3 is on the north side of the main access road into the site. Position B4 is on the east side of the main access road into the site, in the vicinity to the cattle grates. Position B5 is in the north western corner of the site. Position B6 is to the side of the access road towards to south-west of the main plant area. Position B7 is in the south western corner of the site. Position NSL1 is at the dwelling to the east side of Poulawela Creek. The dwelling is disused at present. Position NSL2 is in the vicinity of a residential dwelling located beyond the south eastern boundary of the site. Position NSL3 is at the Oorla dwelling to the south of the site. Position NSL4 is at the eastern end of Foynes Port, to the west-south-west of the site. Position NSL5 is in the vicinity of a residential dwelling located along the main access road, beyond the southern boundary of the site.

5
2.2 Survey Periods
Measurements were conducted over the course of two survey periods as follows:
Daytime 09:34 hrs to 14:50 hrs on 23/12/2009;
Night-time 22:24 hrs to 03:05 hrs on the 23/12/2009 and 24/12/2009.
During all of the survey periods noted above, the facility was in normal operation.
The weather during the daytime survey was mild (nominally 2 to -0.5°C) and calm (less
than 4 ms-1). During the night-time it remained calm with occasional light breeze and the
temperature dropped to around 0°C, conditions remained dry throughout both periods.
2.3 Personnel and Instrumentation
Trevor Montgomery conducted the noise level measurements during both survey periods.
The measurements were performed using a Cirrus Research 831B Type 1 Data Logging
Sound Level Meter. Before and after the survey the measurement apparatus was check
calibrated using a Cirrus Research: 515 Type 1 Acoustic Calibrator
2.4 Procedure
Boundary measurements (BL) were conducted on a cyclical basis. Sample periods were
15 minutes during both the daytime and night-time surveys. The results were saved to the
instrument memory for later analysis where appropriate. Survey personnel noted all
primary noise sources contributing to noise build-up.
Noise Sensitive Location (NSL) measurements were conducted on a cyclical basis.
Sample periods were 30 minutes during both the daytime and night-time surveys. The
results were saved to the instrument memory for later analysis where appropriate. Survey
personnel noted all primary noise sources contributing to noise build-up.
Manned measurements were conducted external to the site at all locations marked as the
closest noise sensitive locations to the RUSAL Aughinish site (Locations NSL 1 to NSL 5).
Measurements were conducted on a cyclical basis with sample periods of 30 minutes. The
survey results were noted onto a Survey Record Sheet immediately following each
sample, and were also saved to the instrument memory for later analysis where

6
appropriate. Survey personnel noted the primary noise sources contributing to noise build-
up during the noise survey.
2.5 Measurement Parameters
The boundary survey results are presented in terms of the following five parameters:
LAeq is the equivalent continuous sound level. It is a type of average and is
used to describe a fluctuating noise in terms of a single noise level over
the sample period.
LAmax is the instantaneous maximum sound level measured during the sample
period.
LAmin is the instantaneous minimum sound level measured during the sample
period.
LA10 is the sound level that is exceeded for 10% of the sample period. It is
typically used as a descriptor for traffic noise.
LA90 is the sound level that is exceeded for 90% of the sample period. It is
typically used as a descriptor for background noise.
The “A” suffix denotes the fact that the sound levels have been “A-
weighted” in order to account for the non-linear nature of human hearing.
All sound levels in this report are expressed in terms of decibels (dB)
relative to 2x10⁻⁵ Pa.
The specific noise level is the component of the ambient noise that can be attributed to the
specific source, which is the RUSAL Aughinish site in this case. At the majority of the
survey locations, there was some extraneous noise from sources other than the RUSAL
Aughinish, i.e. traffic noise. It was also noted that noise emissions from the RUSAL
Aughinish site were relatively constant. The Environmental Protection Agency document
entitled, Environmental Noise Survey Guidance Document (2003) states the following:
“For some noise surveys, the LA90 index may be used to give a good indication of the
actual noise output from the site, where the noise emissions on site are relatively steady”

7
In this assessment, we have adopted the LA90 parameter as being representative of noise
emissions from the RUSAL Aughinish.
3.0 Receiving Environment
3.1 General Description
RUSAL Aughinish operates the alumina refinery plant situated on Aughinish Island near
Askeaton, Co. Limerick. RUSAL Aughinish extracts alumina, i.e. aluminium oxide, from
imported bauxite raw material and exports the alumina to various smelters in Britain and
Continental Europe. Residues from the extraction process are directed to a residue
disposal area termed the Bauxite Residue Disposal Area (BRDA).

8
4.0 Survey Results and Discussion
The results for all Noise Sensitive Location (NSL’) are outline in Table 1(a) and 1(b).
4.1 Noise Sensitive Location Monitoring
4.1.1 Position NLS 1
The day time survey was influence by noise from the eastern side of the Alumina Plant
and bird song. The fans from the cooling towers are the main noise sources with a LAeq of
49.2 dB(A). The LA90 of 48.2 dB(A) highlights the impact of cooling tower fans as a
steady noise source.
The night time survey had a LAeq of 45.3 dB(A) with a LA90 of 44.6 dB(A). There were no
vehicle movements during this time. Weather conditions were calm with no animal or
human movements. The alumina plant is the dominant noise source with particular impact
of the cooling towers.
No tonal component was determined.
4.1.2 Position NLS 2 At this location the noise was influenced by road and vehicle noise and bird song and the
location to the south of RUSAL Aughinish. The day time survey results were LAeq of 53.1
dB(A) and LA90 of 47.1 dB(A) (Graph 3). The main noise source was the movement of
vehicles along the road and the road to Aughinish.
The night time survey had a LAeq of 41.0 dB(A) with a LA90 of 36.7 dB(A). The noise level
was low with the RUSAL Aughinish plant not auditable during the survey.
No tonal component was determined.

9
4.1.3 Position NLS 3 This location is to the south of the facility along the main road into the RUSAL Aughinish
facility and is the nearest residential receptor and is a good indication of the noise levels
from the site. The noise sources are mainly and traffic movements to the facility and bird
song were auditable. The day time survey results were LAeq of 53.2 dB(A) and LA90 of 46.7
dB(A)
The night time survey had a LAeq of 44.3 dB(A) and a LA90 of 41.2 dB(A). The main noise
source was the vehicles travelling into and out of RUSAL Aughinish and road noise from
the N69.
No tonal component was determined
4.1.4 Position NLS 4
The location is on the south west of the facility along the local road between the N69 and
the river Shannon. The noise level during the day was primarily vehicle noise and facility
was just auditable in addition secondary noise sources were a dog braking, and bird song.
The day time survey results were LAeq of 48.2 dB(A) and LA90 of 42.5 dB(A).
The night time survey had a LAeq of 39.5 dB(A) and a LA90 of 37.8 dB(A). There were no
distinct noise sources during the survey but distant vehicles along the N69 were auditable
but had very little effect on the noise level in the general area.
No tonal component was determined
4.1.5 Position NLS 5
The location is on the west of the facility along the new road into Foynes Port. The noise
level during the day was primarily vehicle noise and a secondary noise source was bird
song. The day time survey results were LAeq of 55.1 dB(A) and LA90 of 52.4 dB(A).
The night time survey had a LAeq of 43.8 dB(A) and a LA90 of 41.6 dB(A). There were no
distinct noise sources during the survey but a distant vehicles operating in the port were
auditable.
No tonal component was determined

10
4.2 Boundary Location Monitoring
4.2.1 Position BL 1
The day time survey was influence by noise from ship unloading and loading and vehicle
movements to and from the jetty also impacted. The unloading of bauxite was the main
noise sources with a LAeq of 61.7 dB(A) and the LA90 of 58.1 dB(A)
The night time survey had a LAeq of 59.4 dB(A) with a LA90 of 58.6 dB(A). There were no
vehicle movements during this time. Weather conditions were calm with the major noise
source was the unloading of bauxite.
4.2.2 Position BL 2
The day time survey was influence by noise from the fans on top of the silos, the
calcinations area and traffic movements on-site. The silo fans was the main noise source
with a LAeq of 56.3 dB(A) and the LA90 of 54.5 dB(A)
The night time survey had a LAeq of 55.3 dB(A) with a LA90 of 54.2 dB(A). There were no
vehicle movements during this time. Weather conditions were calm with the major noise
source was the silo fans.
4.2.3 Position BL 3
The day time survey was influence by noise from vehicles entering and exiting the site and
aircraft passing overhead. The vehicular noise was the main noise source with a LAeq of
57.4 dB(A) and the LA90 of 55.1 dB(A). The plant was just auditable when other noise
sources reduced
The night time survey had a LAeq of 45.6 dB(A) with a LA90 of 44.7 dB(A). There were
no vehicle movements during this time. Weather conditions were calm with the major
noise source the Alumina plant.
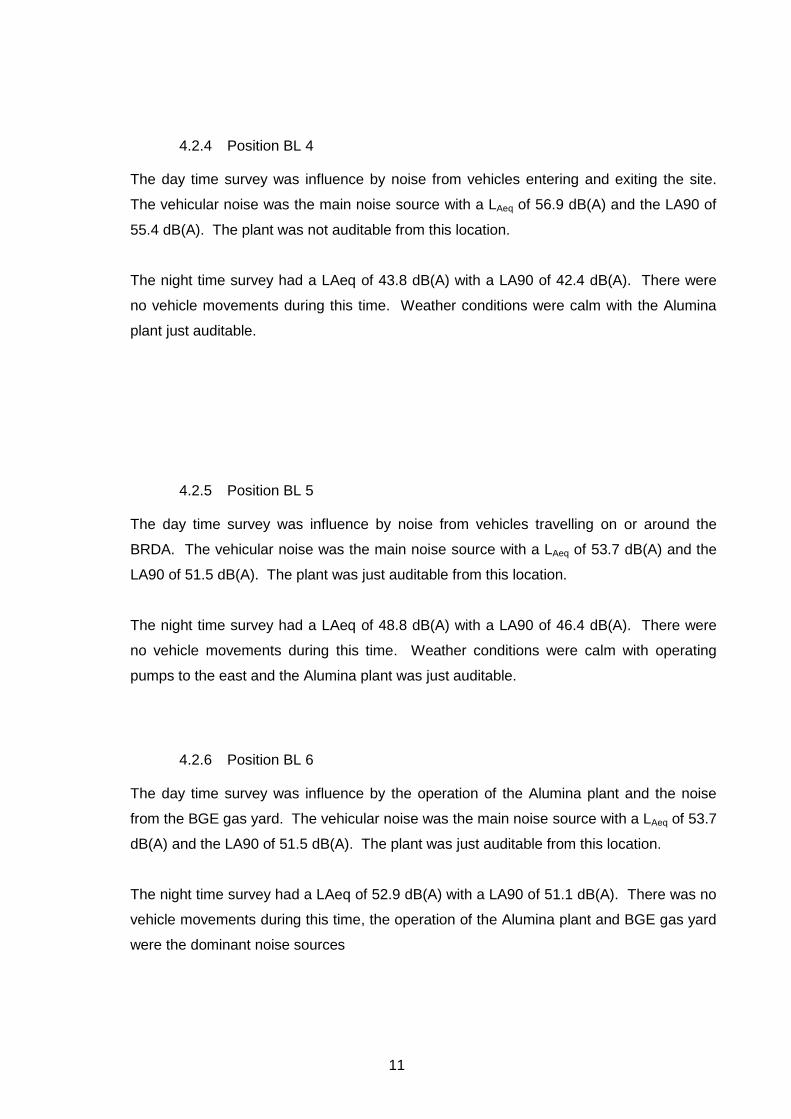
11
4.2.4 Position BL 4
The day time survey was influence by noise from vehicles entering and exiting the site.
The vehicular noise was the main noise source with a LAeq of 56.9 dB(A) and the LA90 of
55.4 dB(A). The plant was not auditable from this location.
The night time survey had a LAeq of 43.8 dB(A) with a LA90 of 42.4 dB(A). There were
no vehicle movements during this time. Weather conditions were calm with the Alumina
plant just auditable.
4.2.5 Position BL 5
The day time survey was influence by noise from vehicles travelling on or around the
BRDA. The vehicular noise was the main noise source with a LAeq of 53.7 dB(A) and the
LA90 of 51.5 dB(A). The plant was just auditable from this location.
The night time survey had a LAeq of 48.8 dB(A) with a LA90 of 46.4 dB(A). There were
no vehicle movements during this time. Weather conditions were calm with operating
pumps to the east and the Alumina plant was just auditable.
4.2.6 Position BL 6
The day time survey was influence by the operation of the Alumina plant and the noise
from the BGE gas yard. The vehicular noise was the main noise source with a LAeq of 53.7
dB(A) and the LA90 of 51.5 dB(A). The plant was just auditable from this location.
The night time survey had a LAeq of 52.9 dB(A) with a LA90 of 51.1 dB(A). There was no
vehicle movements during this time, the operation of the Alumina plant and BGE gas yard
were the dominant noise sources

12
4.2.7 Position BL 7
The day time survey was influence by the operation of the mobile pumps along the south
perimeter channel and vehicular noise along the east ridge was a secondary source with a
LAeq of 59.1 dB(A) and the LA90 of 56.3 dB(A). The plant was not auditable from this
location.
The night time survey had a LAeq of 39.5 dB(A) with a LA90 of 37.6 dB(A). There were
no vehicle movements during this time and the mobile pumps were switched off. The
Alumina plant was not auditable.

13
5.0 Conclusion
5.1 Sources and Emissions
The site operates continuously all year long, apart from maintenance shutdowns and other
holidays. Delivery of raw materials by road, operation of the alumina plant and shipping
waste products to the on-site landfill are the main noise sources. Road traffic to and from
the site is considered a noise source in terms of the overall traffic flow and pattern in the
area.
The character of each noise source has been stated as broadband, tonal or impulsive as
assessed at the measurement distance. It should be noted that an assessment of tonality
or impulsivity at source does not necessarily mean that this character is audible at the
boundary of the plant or at nearby residences.
The measurement locations are shown in Section 9.0 of this report. The results for each
location are shown in Table 1(a) and 1(b). The results include A-weighted and un-
weighted octave band levels sound pressure levels for all Locations, with comments as
appropriate. The measurements were generally short LAeq measurements. Some
measurements of Lmax levels are noted in the Table. Note that the “Fast” Time Weighting
was used for Lmax measurements.
Weather conditions can have both positive and negative effects on sound propagation. A
positive wind vector or a temperature inversion can give an increase in noise level at a
distance from a source. A negative wind vector can reduce the received noise levels.
These effects tend to become more significant at relatively long distances from the noise
source. When wind speeds rise above about ten knots (five metres per second), locally
generated wind noise (through trees, etc.) can have a significant masking effect, often
rendering a low level noise source inaudible.
Noise measurements were confined to periods when weather conditions on and around
the RUSAL Aughinish site were judged to have little significant effect on noise propagation
during the survey. As a check on the wind speed and direction at the times of the
measurements, wind data from the RUSAL Aughinish weather station was obtained was
checked. The wind speed and direction were averaged from the one minute wind data for
the measurement period in question and this data is included in Section 10 of this report.

14
Where plant noise is steady and audible during operation, but there are extraneous noise
sources such as road traffic, birds or intermittent local activities, LA90 usually gives a good
approximation of the relatively constant plant noise level. Where the RUSAL Aughinish
facility, etc is stated as clearly audible or the dominant background source, plant noise
may be taken as approximately equal to LA90.
5.2 Noise Impact
The RUSAL Aughinish noise levels are dominated by the operation of the Alumina Plant
and Road Traffic to and from the site. The facility noise levels are just auditable at NSL 1
to 4 but the noise levels are not likely to result in a noise complaint.
The RUSAL Aughinish site does not generate significant noise levels and the noise
auditable on site consists of:
Road Noise from the Adjacent Local Road.
Site Traffic movements.
Noise from site operations, pumps, fans, plant noise etc
The range 35 to 45 dB(A), is suggested by the EPA (Guidance Notes for Noise in relation
to Scheduled Activities), as the range of target levels appropriate to avoid disturbance at
night outside houses. An important aspect of acceptability is the absence of significant
tones or impulses.
The results of the noise survey indicate that there is no significant impact on noise
sensitive locations outside the boundary. The plant may be audible at times at NSL 1 to 4,
but however, the RUSAL Aughinish facility noise levels are unlikely to give rise to any
disturbance to generate complaints or nuisance.
The EPA guidelines of 55 dB(A) LAeq (day time) and 45 dB(A) LAeq (night), would be more
applicable were the LA90 for all NSL’s for the daytime are shown below and all would meet
the EPA guidelines.
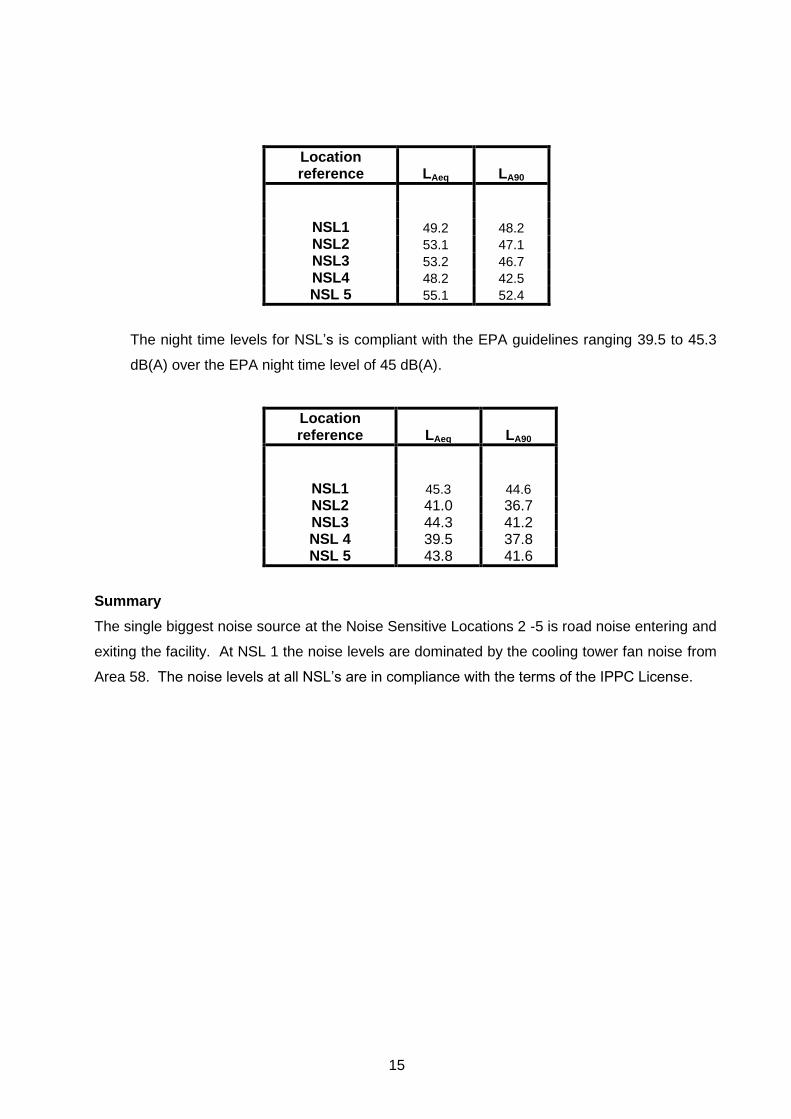
15
Location reference
LAeq
LA90
NSL1 49.2 48.2
NSL2 53.1 47.1
NSL3 53.2 46.7
NSL4 48.2 42.5
NSL 5 55.1 52.4
The night time levels for NSL’s is compliant with the EPA guidelines ranging 39.5 to 45.3
dB(A) over the EPA night time level of 45 dB(A).
Location reference
LAeq
LA90
NSL1 45.3 44.6
NSL2 41.0 36.7 NSL3 44.3 41.2 NSL 4 39.5 37.8 NSL 5 43.8 41.6
Summary
The single biggest noise source at the Noise Sensitive Locations 2 -5 is road noise entering and
exiting the facility. At NSL 1 the noise levels are dominated by the cooling tower fan noise from
Area 58. The noise levels at all NSL’s are in compliance with the terms of the IPPC License.

16
6.0 References
British Standard BS 5228 (1992): Noise control on construction and open sites
Part 4 Code of practice for noise and vibration control during piling.
BS5228: Noise control on construction and open sites.
1509613: Acoustics - Attenuation of sound outdoors, Part 2: General method of
calculation, 1996.
IS0 1996: Acoustics - Description and measurement of environmental noise: 1982.
EPA 1995 Guidance Note for Noise in Relation to Scheduled Activities, 1995
EPA 2003, Environmental Noise Survey, Guidance Documents

17
7.0 Tables
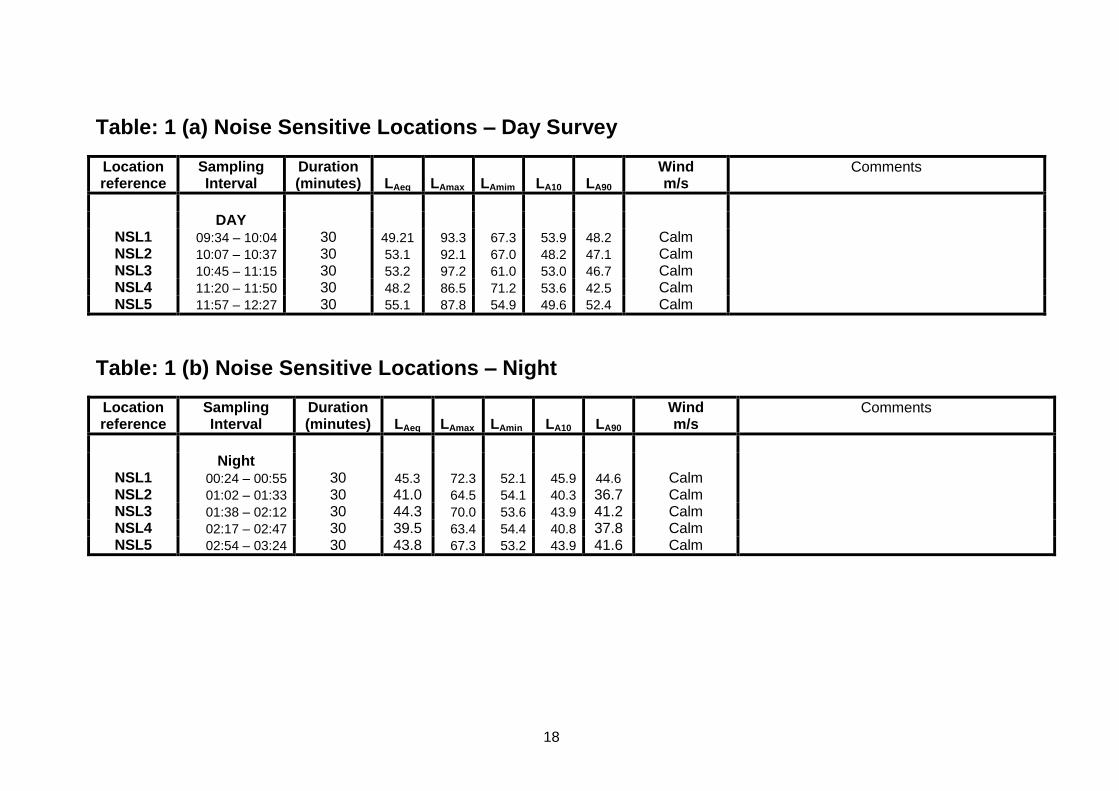
18
Table: 1 (a) Noise Sensitive Locations – Day Survey
Location reference
Sampling Interval
Duration (minutes)
LAeq
LAmax
LAmim
LA10
LA90 Wind m/s
Comments
DAY
NSL1 09:34 – 10:04 30 49.21 93.3 67.3 53.9 48.2 Calm NSL2 10:07 – 10:37 30 53.1 92.1 67.0 48.2 47.1 Calm NSL3 10:45 – 11:15 30 53.2 97.2 61.0 53.0 46.7 Calm NSL4 11:20 – 11:50 30 48.2 86.5 71.2 53.6 42.5 Calm NSL5 11:57 – 12:27 30 55.1 87.8 54.9 49.6 52.4 Calm
Table: 1 (b) Noise Sensitive Locations – Night
Location reference
Sampling Interval
Duration (minutes)
LAeq
LAmax
LAmin
LA10
LA90 Wind m/s
Comments
Night
NSL1 00:24 – 00:55 30 45.3 72.3 52.1 45.9 44.6 Calm NSL2 01:02 – 01:33 30 41.0 64.5 54.1 40.3 36.7 Calm NSL3 01:38 – 02:12 30 44.3 70.0 53.6 43.9 41.2 Calm NSL4 02:17 – 02:47 30 39.5 63.4 54.4 40.8 37.8 Calm NSL5 02:54 – 03:24 30 43.8 67.3 53.2 43.9 41.6 Calm

19
8.0 Figures
NSL 4
NSL 2
NSL 1
NSL 5
B 1
B 2
B 3
B 4
Figure 1 Noise Monitoring Locations
B 6
Legend
Noise Sensitive Monitoring Location
Boundary Monitoring Point Location
B 5
Aughinish Alumina
B 7
NSL 3

20
9.0 Aughinish Weather Data
Temperature 23/12/2009 – 25/12/2009

21
Wind Speed 23/12/2009 – 25/12/.2009

22
Wind Direction 23/12/2009 – 25/12/2009

Aughinish Alumina Ltd. March 2010 AER 2009
Attachment 6 Ballysteen & Foynes SO2 Graphs
Ballysteen, Alumina Plant & Foynes PM10 Graphs Ballysteen, Alumina Plant & Foynes Sodium Graphs

This page is intentionally blank

Note:
45-90° wind direction accounts for only 9% of the above entries, that required for AAL emissions to be carried in the direction of Foynes station.
0-10mg/m3 is considered a typical countryside SO2 level.
0
1
2
3
4
5
6
7
8
9
Direction0
1020
30
40
50
60
70
80
90
100
110
120
130
140150
160170
180190
200
210
220
230
240
250
260
270
280
290
300
310
320330
340
Percentage Entries >0.1mg/m3 using Ballysteen Continuous SO2 data from 1ts Jan -31st December 09. (based upon 8002 data points from 8786 hourly mean SO2 and
wind direction data )
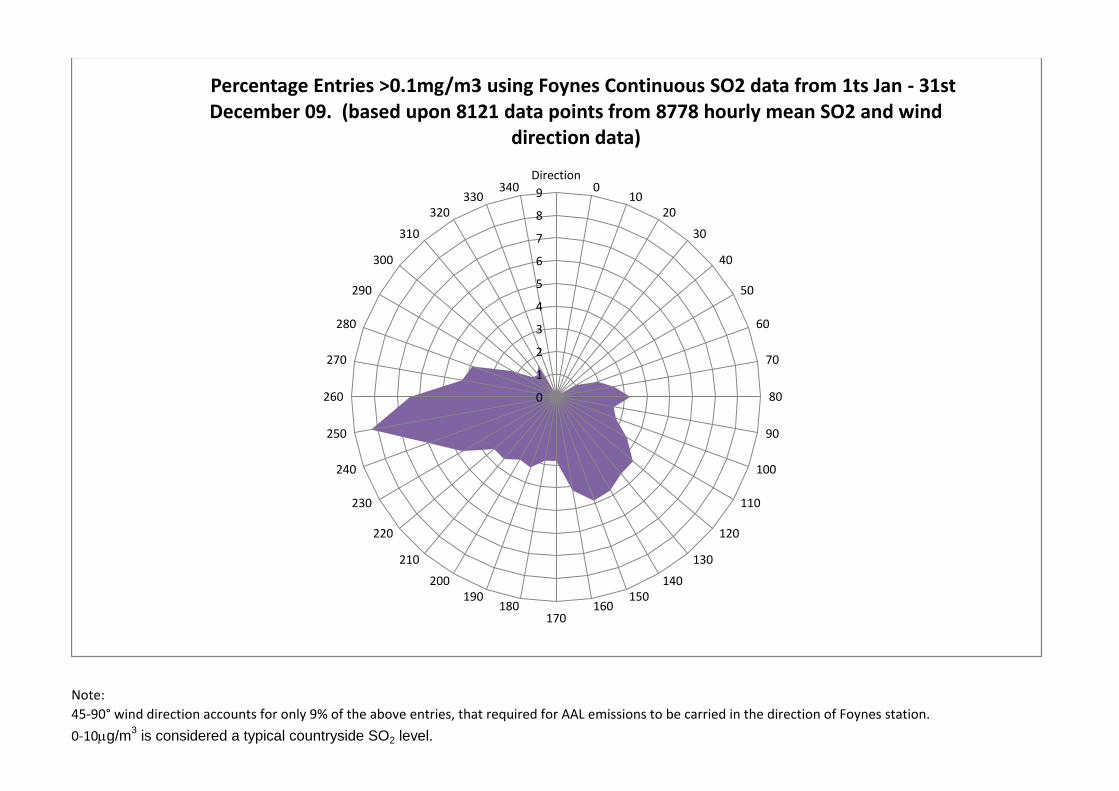
Note:
45-90° wind direction accounts for only 9% of the above entries, that required for AAL emissions to be carried in the direction of Foynes station.
0-10mg/m3 is considered a typical countryside SO2 level.
0
1
2
3
4
5
6
7
8
9
Direction0
1020
30
40
50
60
70
80
90
100
110
120
130
140150
160170
180190
200
210
220
230
240
250
260
270
280
290
300
310
320330
340
Percentage Entries >0.1mg/m3 using Foynes Continuous SO2 data from 1ts Jan - 31st December 09. (based upon 8121 data points from 8778 hourly mean SO2 and wind
direction data)
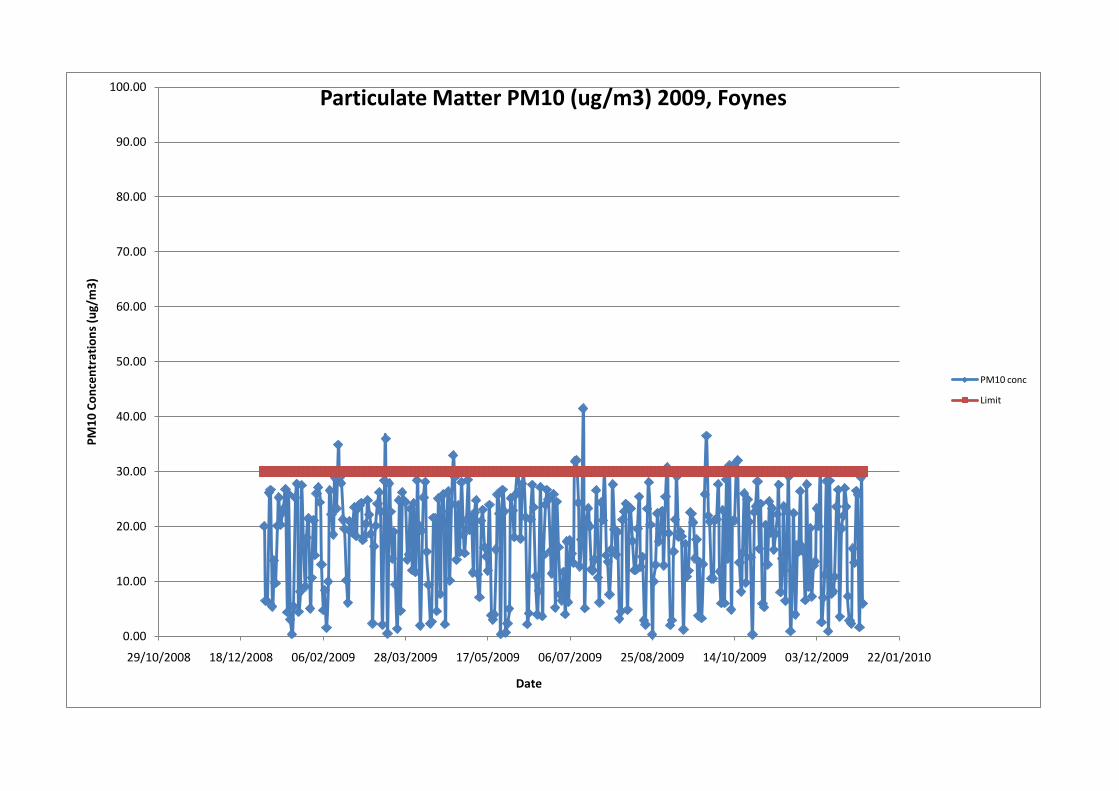
0.00
10.00
20.00
30.00
40.00
50.00
60.00
70.00
80.00
90.00
100.00
29/10/2008 18/12/2008 06/02/2009 28/03/2009 17/05/2009 06/07/2009 25/08/2009 14/10/2009 03/12/2009 22/01/2010
PM
10
Co
nce
ntr
atio
ns
(ug/
m3
)
Date
Particulate Matter PM10 (ug/m3) 2009, Foynes
PM10 conc
Limit

0.00
50.00
100.00
150.00
200.00
250.00
29/10/2008 18/12/2008 06/02/2009 28/03/2009 17/05/2009 06/07/2009 25/08/2009 14/10/2009 03/12/2009 22/01/2010
NA
Co
nc
(ug/
m3
)
Date
Sodium (ug/m3) 2009, Foynes
Sodium Conc
Limit

0.00
10.00
20.00
30.00
40.00
50.00
60.00
29/10/2008 18/12/2008 06/02/2009 28/03/2009 17/05/2009 06/07/2009 25/08/2009 14/10/2009 03/12/2009 22/01/2010
PM
10
Co
nc
(ug/
m3
)
Date
Particulate Matter PM10 (ug/m3) 2009, North East of Alumina Plant
PM10 Conc
Limit
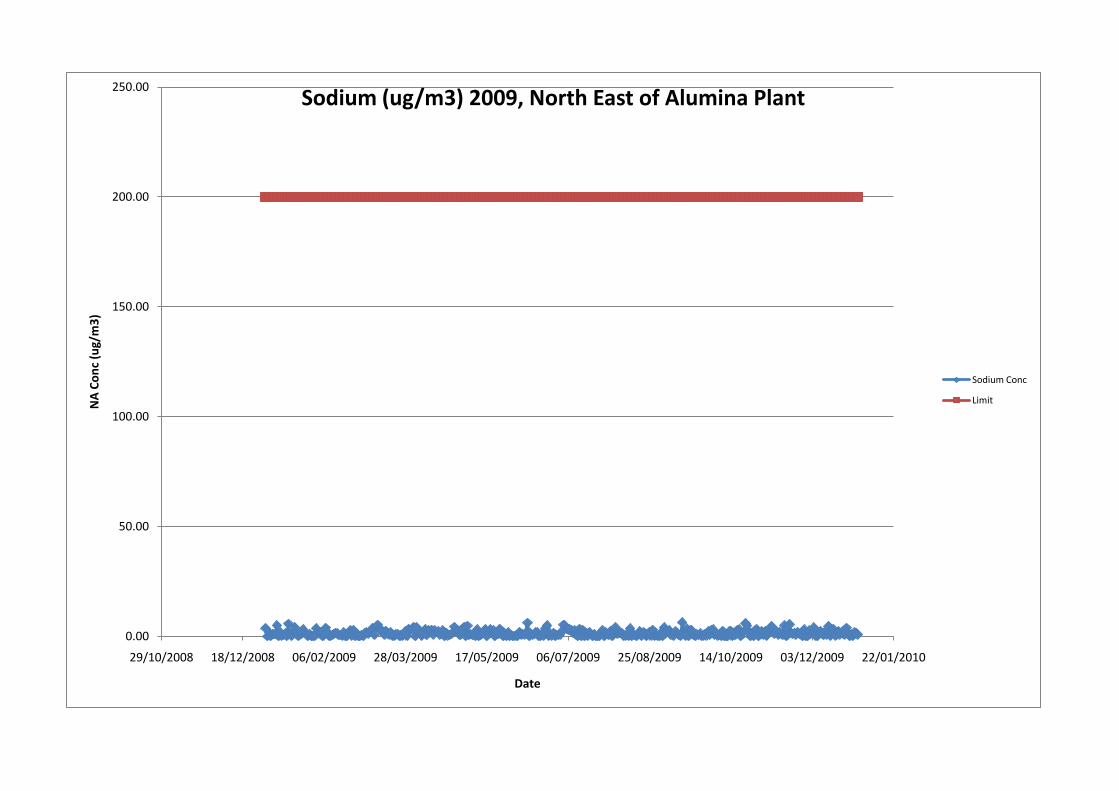
0.00
50.00
100.00
150.00
200.00
250.00
29/10/2008 18/12/2008 06/02/2009 28/03/2009 17/05/2009 06/07/2009 25/08/2009 14/10/2009 03/12/2009 22/01/2010
NA
Co
nc
(ug/
m3
)
Date
Sodium (ug/m3) 2009, North East of Alumina Plant
Sodium Conc
Limit

0.00
50.00
100.00
150.00
200.00
250.00
29/10/2008 18/12/2008 06/02/2009 28/03/2009 17/05/2009 06/07/2009 25/08/2009 14/10/2009 03/12/2009 22/01/2010
NA
Co
nc
(ug/
m3
)
Date
Sodium (ug/m3) 2009, Ballysteen
Sodium Conc
Limit
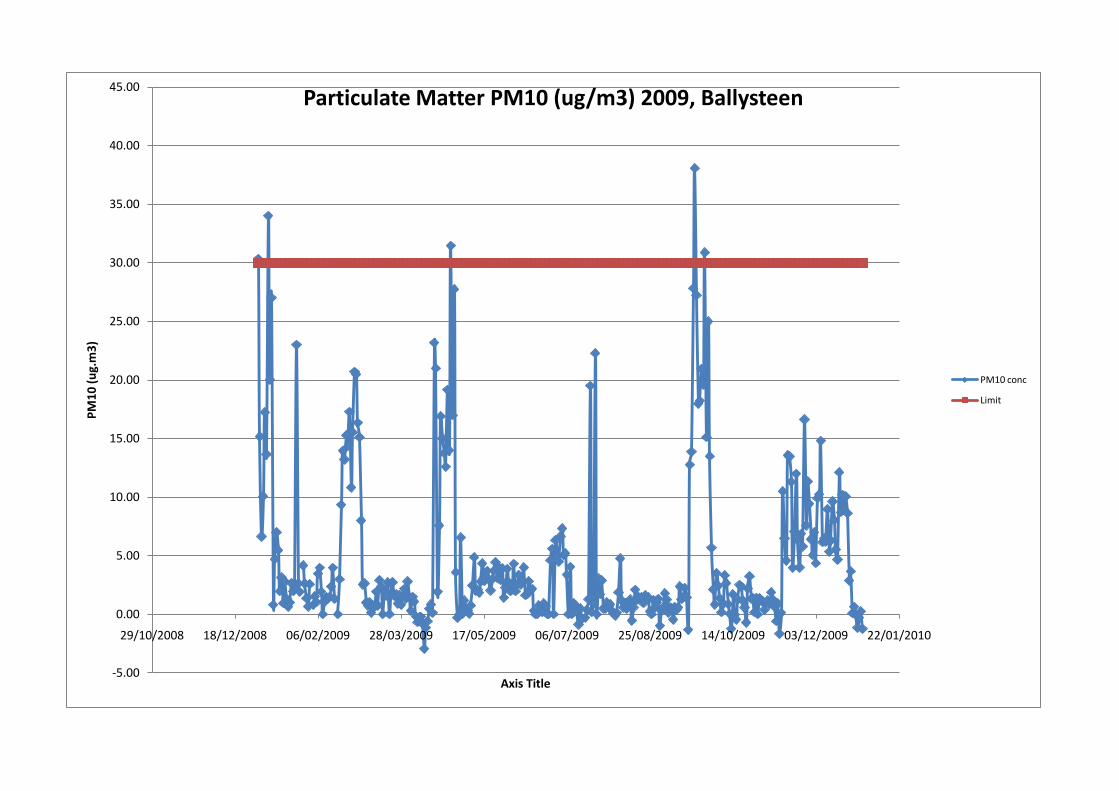
-5.00
0.00
5.00
10.00
15.00
20.00
25.00
30.00
35.00
40.00
45.00
29/10/2008 18/12/2008 06/02/2009 28/03/2009 17/05/2009 06/07/2009 25/08/2009 14/10/2009 03/12/2009 22/01/2010
PM
10
(u
g.m
3)
Axis Title
Particulate Matter PM10 (ug/m3) 2009, Ballysteen
PM10 conc
Limit

Aughinish Alumina Ltd. March 2010 AER 2009
Attachment 7 Graphs trending pH and
Soda for the Estuarine Streams

This page is intentionally blank

Estuary Streams (ES's) Profiles
3
5
7
9
11
13
pH
ES 1 (West of Area 28 / West Pond) Local 2 Returned to Area 34
0
2
4
6
8
10
Na2O
gp
l
ES 1
3
5
7
9
11
13
pH
ES 2 (East of Area 58) Local 3
0.0
2.0
4.0
6.0
8.0
10.0
Na2O
gp
l
ES 2 (Saline)
3
5
7
9
11
13
pH
ES 3 (East of East Pond) Local 3
0
2
4
6
8
Na2O
gp
l
ES 3 (Saline)
3.0
5.0
7.0
9.0
11.0
13.0
pH
ES 5 (East of A 09) Local 5
0
2
4
6
8
Na2O
gp
l
ES 5
3
5
7
9
11
13
pH
ES 6 (North West of Area 58) Local 3
0.00
2.00
4.00
6.00
8.00
Na2O
gp
l
ES 6
3.0
5.0
7.0
9.0
11.0
13.0
pH
ES 7/12 (East of Area 06) Local 3 Returned to E. Pond
0
2
4
6
8
Na2O
gp
l
ES 7/12 Returned to E. Pond

Estuary Streams (ES's) Profiles
3
5
7
9
11
13
pH
ES 9 (West of Crusher area) Local 4
0
2
4
6
8
Na2O
gp
l
ES 9 (Saline)
3.0
5.0
7.0
9.0
11.0
13.0
pH
ES 8 (Jetty approach road) Local 4
0
2
4
6
8
Na2O
gp
l
ES 8 (Saline)
3
5
7
9
11
13
pH
ES 10 (East of ESB Sub Station) Local 3
0
2
4
6
8
Na2O
gp
lES 10
3
5
7
9
11
13
pH
ES 11 (North West of Area 58) Local 3
0
2
4
6
8
Na2O
gp
l
ES 11
3
5
7
9
11
13
pH
ES 13 (West of Bauxite Shed) Local 4
0
2
4
6
8
Na2O
gp
l
ES 13
3
5
7
9
11
13
pH
ES 14 (West of Twr. 4/5) Local 4
0
2
4
6
8
10
Na2O
gp
l
ES 14
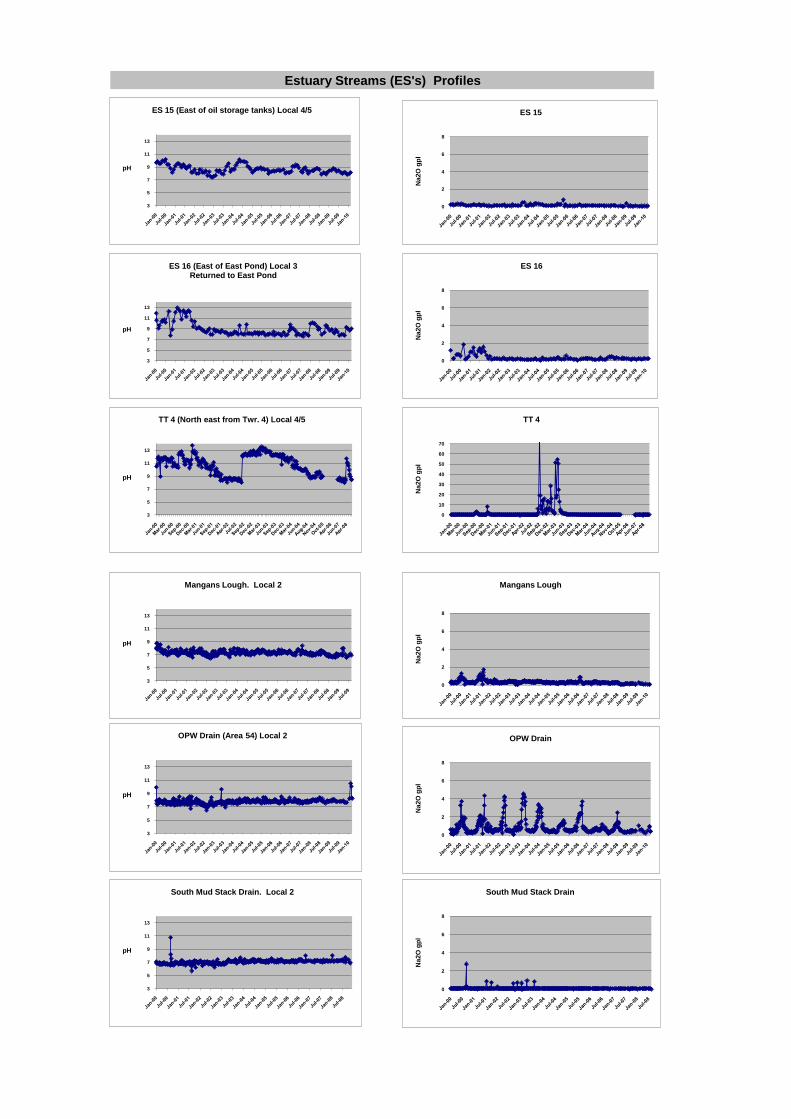
Estuary Streams (ES's) Profiles
3
5
7
9
11
13
pH
ES 15 (East of oil storage tanks) Local 4/5
0
2
4
6
8
Na2O
gp
l
ES 15
3
5
7
9
11
13
pH
ES 16 (East of East Pond) Local 3Returned to East Pond
0
2
4
6
8
Na2O
gp
l
ES 16
3
5
7
9
11
13
pH
TT 4 (North east from Twr. 4) Local 4/5
0
10
20
30
40
50
60
70
Na2O
gp
lTT 4
3
5
7
9
11
13
pH
Mangans Lough. Local 2
0
2
4
6
8
Na
2O
gp
l
Mangans Lough
3
5
7
9
11
13
pH
OPW Drain (Area 54) Local 2
0
2
4
6
8
Na2O
gp
l
OPW Drain
3
5
7
9
11
13
pH
South Mud Stack Drain. Local 2
0
2
4
6
8
Na2O
gp
l
South Mud Stack Drain

Estuary Streams (ES's) Profiles
3
5
7
9
11
13
pH
Turlough. Local 2
0
2
4
6
8
Na2O
gp
l
Turlough
3
5
7
9
11
13
pH
Storm Water Pond. Local 2
0
2
4
6
8
10
12
Na2O
gp
l
Storm Water Pond
3
5
7
9
11
13
pH
BRDA Perimeter Channel
0
2
4
6
8
10
12
Na2O
gp
lBRDA Perimeter Channel

Aughinish Alumina Ltd. March 2010 AER 2009
Attachment 8 Programme for Closure
Planning & Re-vegetation of BRDA

This page is intentionally blank

Review of Revegetation Work Conducted on Bauxite Residue Generated at the Aughinish Alumina Ltd. Refinery
February 2009
Review of Revegetation Work Conducted on Bauxite
Residue Generated at the Aughinish Alumina Ltd. Refinery
1996 – 2009
Dr Ronan Courtney
Dept of Life Sciences
University of Limerick
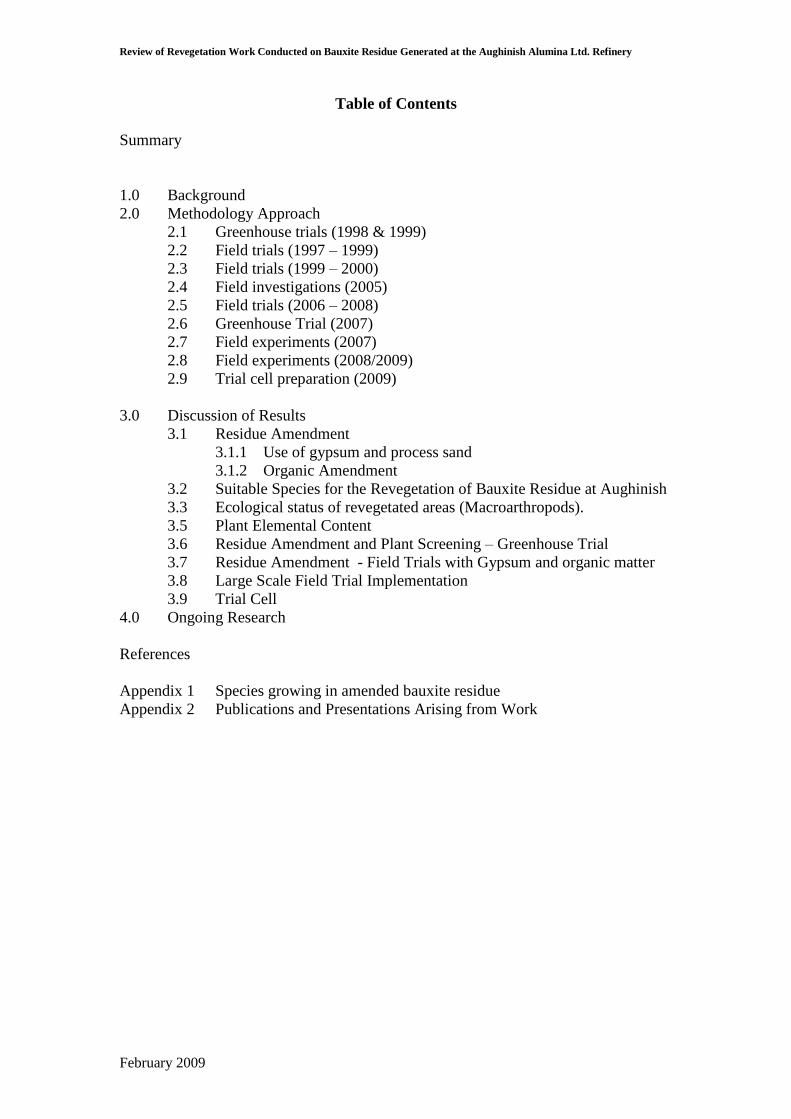
Review of Revegetation Work Conducted on Bauxite Residue Generated at the Aughinish Alumina Ltd. Refinery
February 2009
Table of Contents
Summary
1.0 Background
2.0 Methodology Approach
2.1 Greenhouse trials (1998 & 1999)
2.2 Field trials (1997 – 1999)
2.3 Field trials (1999 – 2000)
2.4 Field investigations (2005)
2.5 Field trials (2006 – 2008)
2.6 Greenhouse Trial (2007)
2.7 Field experiments (2007)
2.8 Field experiments (2008/2009)
2.9 Trial cell preparation (2009)
3.0 Discussion of Results
3.1 Residue Amendment
3.1.1 Use of gypsum and process sand
3.1.2 Organic Amendment
3.2 Suitable Species for the Revegetation of Bauxite Residue at Aughinish
3.3 Ecological status of revegetated areas (Macroarthropods).
3.5 Plant Elemental Content
3.6 Residue Amendment and Plant Screening – Greenhouse Trial
3.7 Residue Amendment - Field Trials with Gypsum and organic matter
3.8 Large Scale Field Trial Implementation
3.9 Trial Cell
4.0 Ongoing Research
References
Appendix 1 Species growing in amended bauxite residue
Appendix 2 Publications and Presentations Arising from Work

Review of Revegetation Work Conducted on Bauxite Residue Generated at the Aughinish Alumina Ltd. Refinery
February 2009
Summary
The Aughinish Alumina Ltd. Refinery produces approximately 1.05 Mt of bauxite
residue per annum. This residue is stored in a 105 ha site adjacent to the refinery.
The establishment of a sustaining vegetation cover is the preferred method for post-
closure management of residue storage area to control erosion and dusting of the
residue and improve its aesthetic impact.
Although revegetation of bauxite residue has been demonstrated elsewhere it is
recognised that the process is not straightforward. A research programme was
initiated at AAL in 1996 develop methods to develop a system whereby indigenous
vegetation can be successfully established on the residue. Following a series of
greenhouse screening exercises a series of field trials were established directly on the
residue in 1997 and 1999. Performance monitoring and establishing of further field
trials has continued.
Conditions stipulated in the Integrated Pollution Prevention Control Licence (P0035-
04) issued to Aughinish state that revegetation work be continued on the BRDA and
findings reported in the Annual Environmental Report (AER) and sustainability issues
of the revegetation system be determined (Condition 8.3.14). Provision of a dedicated
research trial cell for demonstration of the proposed closure technique for the residue
a licence condition (Condition 8.3.19).
Methodologies for optimising plant establishment on the bauxite residue are now well
developed and are summarised;
Chemical and physical limitations of the refinery residues must be addressed
prior to revegetation
Process sand, gypsum and organic matter are essential components of the
revegetation prescription
Several indigenous species are capable of growing in amended bauxite residue
Effective amendment of the residue results in lower plant content of Na, Fe
and Al
Nutrient cycling in the residue is seen a critical parameter to demonstrate that
the vegetation cover is self-sustaining cover
A dedicated research trial cell has now been constructed, filled with fresh bauxite
residue and undergone amendment. Revegetation of a selected area (0.3 ha) was
undertaken in September 2009. As per Licence P0035-04 conditions, a programme is
in place to monitor the revegetated area. Key research areas within this trial area will
determine;
Vegetation establishment, survival and succession
Vegetation productivity, sustained growth and structure development;
Fauna colonisation and habitat development;
Ecosystem processes such as soil development and nutrient cycling,
Colonisation of specific fauna groups that are involved in these processes
Microbiological studies e.g. colonisation by mycorrhizal fungi and
microbial biomass

Review of Revegetation Work Conducted on Bauxite Residue Generated at the Aughinish Alumina Ltd. Refinery
February 2009
1.0 Background
Alumina is extracted from bauxite ore with sodium hydroxide under high temperature
and pressure (Bayer process). The waste remaining after alumina extraction is termed
bauxite residue and consists mainly of iron-, aluminium-, and titanium-oxides, as well
as reactive silica (clay minerals) that forms a sodium alumino-silicate, also termed
desilication product (DSP).
An estimated 70 million metric dry tons of residue is produced globally per year and
is disposed on land in large residue disposal areas (tailings dams), either as wet slurry
or de-watered and dry-stacked.
Several uses for bauxite refinery residue have been investigated. However, quantities
of residue currently produced vastly exceed demand, requiring that refinery disposal
areas be revegetated when decommissioned to minimize environmental impact and
improve visual amenity.
Although plant establishment is seen as a desirable means to achieve landscaping and
stabilizing of the residues it is not a straightforward process. Bauxite residue is
characterised by high pH (pH >10), high electrical conductivity (EC > 30 dS m-1),
and high exchangeable sodium percentage (>70%). Also, concentrations of plant
nutrients such as calcium, magnesium, manganese, and phosphorus are low and the
fine texture impedes penetration of plant roots. Consequently, the chemical and
physical limitations of the refinery residues must be addressed prior to revegetation if
the refinery residues are to form part of the plant growth medium.
The Aughinish Alumina Ltd. (AAL) refinery at Askeaton, Co. Limerick produces
approximately 1.05 Mt of bauxite residue per annum, which is pumped to and stored
in a bauxite residue disposal area (BRDA) of 104 ha.
Residues are separated at the clarification stage and can be differentiated into two
fractions, the fine ‘red mud’ and a coarser fraction ‘process sand’. At AAL red mud
is the principal fraction and accounts for ~ 95% of residue.
The mud fraction is dewatered by vacuum filtration to a solids concentration of 63
wt% before being slightly diluted and transported, by a 2km pipeline, to BRDA where
it is discharged and spread and allowed to consolidate and dry in layers. The
deposited mud is retained by a series of 2m high rockfill dykes underlain by
separation/filter layer of process sand.
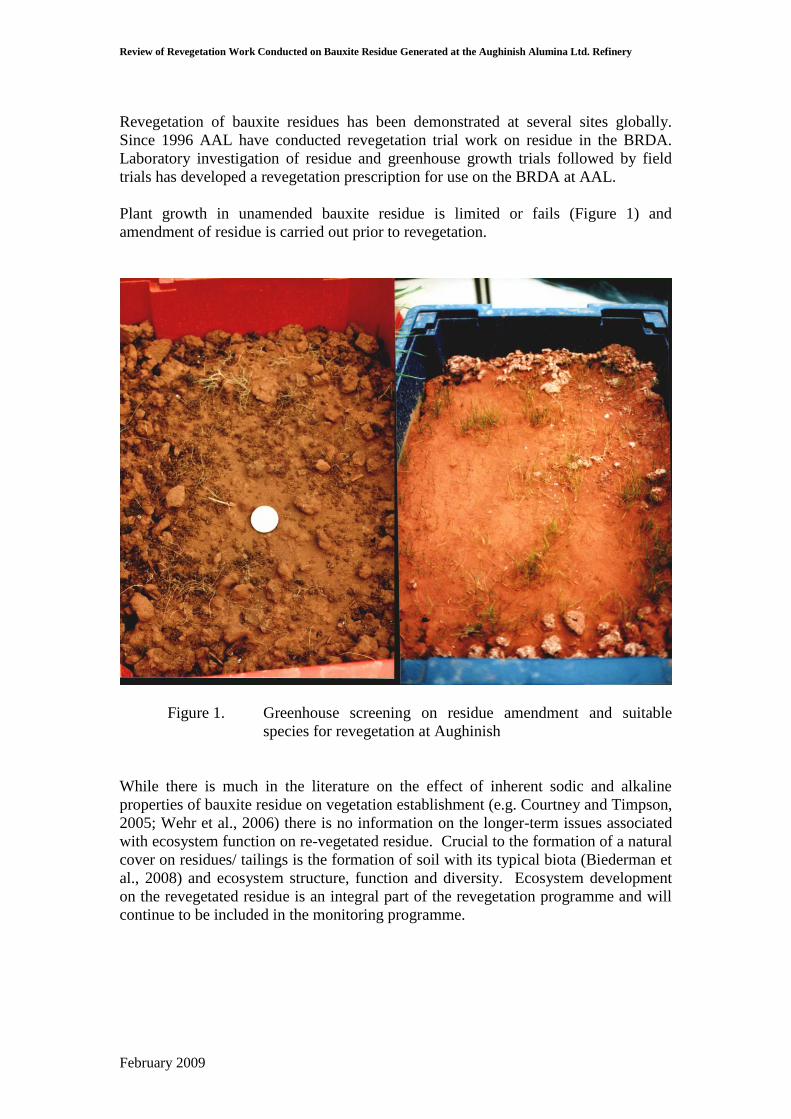
Review of Revegetation Work Conducted on Bauxite Residue Generated at the Aughinish Alumina Ltd. Refinery
February 2009
Revegetation of bauxite residues has been demonstrated at several sites globally.
Since 1996 AAL have conducted revegetation trial work on residue in the BRDA.
Laboratory investigation of residue and greenhouse growth trials followed by field
trials has developed a revegetation prescription for use on the BRDA at AAL.
Plant growth in unamended bauxite residue is limited or fails (Figure 1) and
amendment of residue is carried out prior to revegetation.
Figure 1. Greenhouse screening on residue amendment and suitable
species for revegetation at Aughinish
While there is much in the literature on the effect of inherent sodic and alkaline
properties of bauxite residue on vegetation establishment (e.g. Courtney and Timpson,
2005; Wehr et al., 2006) there is no information on the longer-term issues associated
with ecosystem function on re-vegetated residue. Crucial to the formation of a natural
cover on residues/ tailings is the formation of soil with its typical biota (Biederman et
al., 2008) and ecosystem structure, function and diversity. Ecosystem development
on the revegetated residue is an integral part of the revegetation programme and will
continue to be included in the monitoring programme.
Review of Revegetation Work Conducted on Bauxite Residue Generated at the Aughinish Alumina Ltd. Refinery
February 2009
2.0 Methodology Approach
A series of trials have been conducted on the residue produced at AAL both at
laboratory and field level to develop revegetation programme for the management of
residue in the BRDA.
The revegetation prescription used at AAL was developed following a series of
laboratory and greenhouse trials followed by application of the method in the field at
small scale level (2m2).
2.1 Greenhouse trials on bauxite residue and amended bauxite residue (1998 &
1999)
Study Areas
Residue physical and chemical properties.
Use of amendments on residue properties.
Screening of suitable species for revegetation.
2.2 Field trials, c. 210 m2
(1997 – 1999)
Study Areas
Methods for spreading and incorporation of amendments
Leaching and monitoring period
Application of organic amendments and incorporation into amended
residue
Seeding with selected species
2.3 Field trials, c. 250 m2 (1999 – 2000)
Study Areas
Effect of amendments on residue properties
Plant uptake in revegetated residue
2.4 Field investigations (2005)
Study Areas
Survey site areas 2.2 and 2.3.
Characterisation of residue in revegetated areas
Elemental content of vegetation in revegetated areas
Flora diversity of revegetated areas
Invertebrate activity in revegetated areas
Soil biota in revegetated bauxite residue
2.5 Field trials, c. 4,500 m2 (2006 – 2009)
Study Areas
Investigating variations of the procedure to optimise conditions for
preparing residue prior to seeding
Use of gypsum at 0, 40 and 90 t/ha
Use of organic amendment at 0, 60, 80 and 120 t/ha
Use of inorganic fertiliser (NPK and superphosphate) on plant growth

Review of Revegetation Work Conducted on Bauxite Residue Generated at the Aughinish Alumina Ltd. Refinery
February 2009
Seeding regime (seed composition and seeding rate)
Field experiments (2006) investigating suitability of described method
on recently deposited (fresh) residue at large scale level
2.6 Greenhouse trials (2007)
Study Areas
Seed germination and root growth bioassays for assessing properties of
Aughinish residue inhibitory to plant growth
2.7 Trial cell (0.6 ha) revegetation area (2007-ongoing)
The trial cell received bauxite residue during 2008 and amendment procedures
were carried out in 2008/2009. Revegetation occurred September 2009.
Currently the vegetation growth is within its first year.
Study Areas
Revegetation prescription is effective on recently deposited fresh residue
typical of a closure scenario
Performance monitoring of residue and vegetation properties for c. 5
years

Review of Revegetation Work Conducted on Bauxite Residue Generated at the Aughinish Alumina Ltd. Refinery
February 2009
3.0 Discussion of Results
3.1 Residue Amendment
3.1.1 Use of gypsum and process sand
Laboratory characterisation showed the residue to be
o alkaline (pH 9.7 – 10.9)
o sodic (exchangeable sodium percentage 62 – 86%)
o saline (electrical conductivity 0.5 – 2.6 mS/cm)
o high exchangeable aluminium (KCl extractable 20 –40 mg/kg)
Use of gypsum for amending bauxite residue has been frequently used. Examples of
worldwide revegetation programmes using gypsum is summarised in Table 1.
Table 1. Use of gypsum in bauxite residue revegetation
Refinery Gypsum Used Species Used Source
Kwinana (Alcoa)
Australia
Pinjarra (Alcoa)
Australia
Worsley
(Australia)
Kirkvine, Jamaica
Mobile, Alabama
Alcoa (USA)
0, 2, 5 & 8 % w/w
50 t/ha
80 & 160 t/ha
10, 20, 40
& 60 t/ha
40, 50 & 60 t/ha
Agropyron elongatum
Cynodon dactylon
Medicago sativa
Secale cereale
Lolium rigidum
Agropyron elongatum
Distichlis spicata
Wong and Ho, 1993
Gheradi&Rengel, 2003
Eastham et al., 2006
Worsley Alumina
Environmental Report,
1997
O’Callaghan, 1998
Bucher, 1985
Reductions in residue pH, Al, EC and ESP following use of gypsum have been
reported.
The coarse fraction of the residues presents fewer difficulties in establishing
vegetation because of the higher hydraulic conductivity, which increases leaching and
thereby reduces the salinity and alkalinity (Meecham and Bell, 1977). Wong and
Ho(1994) cited ‘the predominance of the fine fraction’ as a major constraint limiting
red mud reclamation efforts.
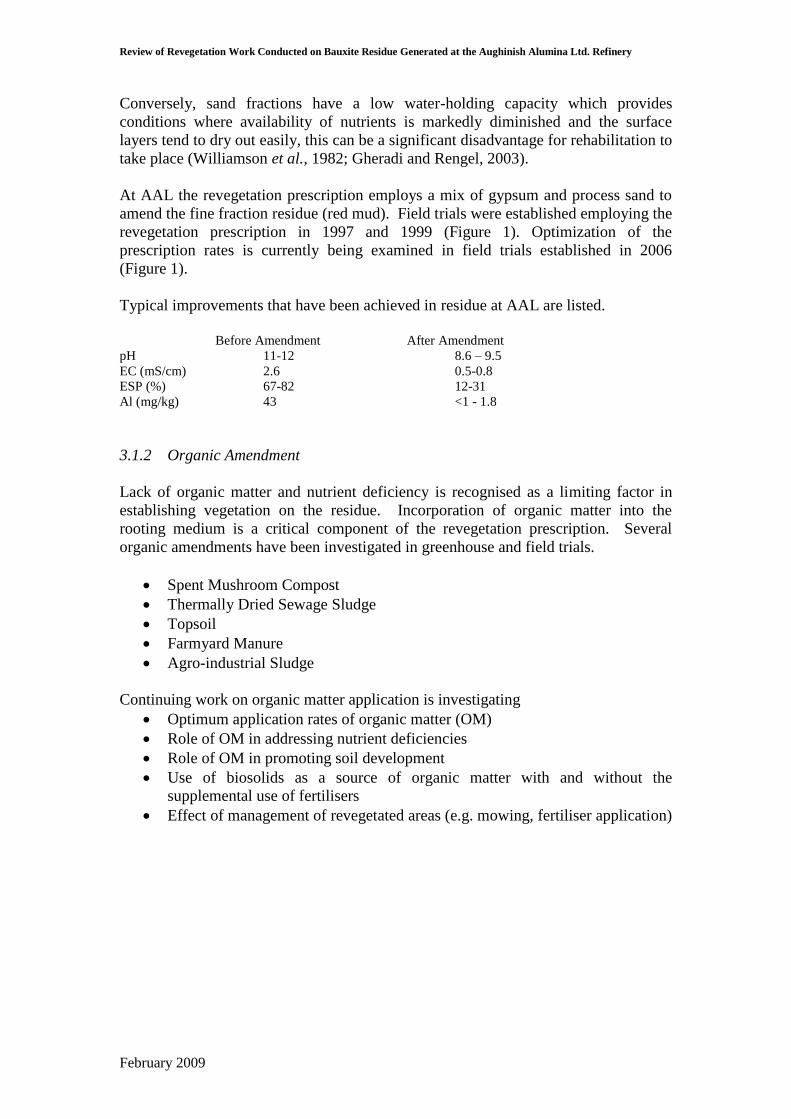
Review of Revegetation Work Conducted on Bauxite Residue Generated at the Aughinish Alumina Ltd. Refinery
February 2009
Conversely, sand fractions have a low water-holding capacity which provides
conditions where availability of nutrients is markedly diminished and the surface
layers tend to dry out easily, this can be a significant disadvantage for rehabilitation to
take place (Williamson et al., 1982; Gheradi and Rengel, 2003).
At AAL the revegetation prescription employs a mix of gypsum and process sand to
amend the fine fraction residue (red mud). Field trials were established employing the
revegetation prescription in 1997 and 1999 (Figure 1). Optimization of the
prescription rates is currently being examined in field trials established in 2006
(Figure 1).
Typical improvements that have been achieved in residue at AAL are listed.
Before Amendment After Amendment
pH 11-12 8.6 – 9.5
EC (mS/cm) 2.6 0.5-0.8
ESP (%) 67-82 12-31
Al (mg/kg) 43 <1 - 1.8
3.1.2 Organic Amendment
Lack of organic matter and nutrient deficiency is recognised as a limiting factor in
establishing vegetation on the residue. Incorporation of organic matter into the
rooting medium is a critical component of the revegetation prescription. Several
organic amendments have been investigated in greenhouse and field trials.
Spent Mushroom Compost
Thermally Dried Sewage Sludge
Topsoil
Farmyard Manure
Agro-industrial Sludge
Continuing work on organic matter application is investigating
Optimum application rates of organic matter (OM)
Role of OM in addressing nutrient deficiencies
Role of OM in promoting soil development
Use of biosolids as a source of organic matter with and without the
supplemental use of fertilisers
Effect of management of revegetated areas (e.g. mowing, fertiliser application)

Review of Revegetation Work Conducted on Bauxite Residue Generated at the Aughinish Alumina Ltd. Refinery
February 2009
Figure 2. Improving the physical and chemical properties of bauxite residue
prior to revegetation
Figure 3. Effects of different amendments on grass growth
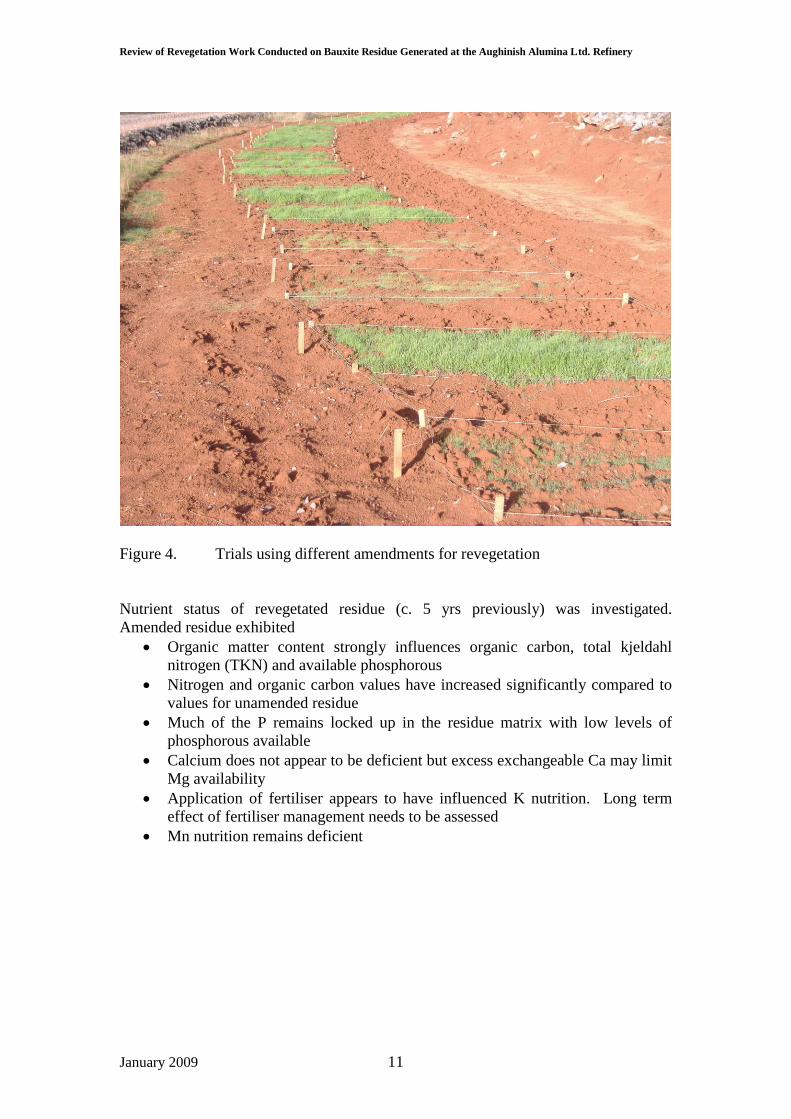
Review of Revegetation Work Conducted on Bauxite Residue Generated at the Aughinish Alumina Ltd. Refinery
January 2009 11
Figure 4. Trials using different amendments for revegetation
Nutrient status of revegetated residue (c. 5 yrs previously) was investigated.
Amended residue exhibited
Organic matter content strongly influences organic carbon, total kjeldahl
nitrogen (TKN) and available phosphorous
Nitrogen and organic carbon values have increased significantly compared to
values for unamended residue
Much of the P remains locked up in the residue matrix with low levels of
phosphorous available
Calcium does not appear to be deficient but excess exchangeable Ca may limit
Mg availability
Application of fertiliser appears to have influenced K nutrition. Long term
effect of fertiliser management needs to be assessed
Mn nutrition remains deficient

Review of Revegetation Work Conducted on Bauxite Residue Generated at the Aughinish Alumina Ltd. Refinery
January 2009 12
A concern with vegetation growing on bauxite residue is that excessive levels of Na
or elevated pH may reoccur due to flooding with process water or sodium release
from within desilication products (DSP) in the residue. Such conditions may cause
established vegetation to regress or die-back. Areas of the BRDA that had vegetation
were revegetated in 1997 and 1999 were sampled in 2005 to investigate chemical
properties of the residue. Properties are summarised below.
pH 8.02 – 8.14
EC (mS/cm) 0.28 – 0.52
Na (mg/kg) 305 – 432
Al (mg/kg) < 1
Residue in revegetated area is not exhibiting excessive pH, Al or ESP.

Review of Revegetation Work Conducted on Bauxite Residue Generated at the Aughinish Alumina Ltd. Refinery
January 2009 13
3.2 Suitable Species for the Revegetation of Bauxite Residue at Aughinish
A selection of grass species and cultivars were selected for screening trials in the
greenhouse. Choice of species and cultivars were determined by literature review of
species growing on similar residues and mine wastes, identification of volunteer
species on areas of the BRDA and commercial availability.
Findings of screening trials on residue and residue amended with gypsum and organic
matter are summarised.
Poor germination and initial seedling growth limited by both poor chemical
conditions and physical conditions in the residue
Physical and chemical amendment of residue is necessary before seeding
Amending with process sand and gypsum followed by a period of leaching
greatly improves germination and growth of tested species
Several indigenous species are capable of growing amended bauxite residue at
AAL (see below)
Organic matter alone is not a sufficient amendment if residue exhibits
excessive pH, ESP
Amendment with gypsum, process sand and organic matter produces optimum
growth in residue
Species capable of growing in amended bauxite residue at AAL.
Avena sativa Oats
Agrostis stolonifera Creeping Bent
Agrostis capillaris Common bent
Cynosurus cristatus Crested Dog’s Tail
Festuca ovina Sheep’s Fescue
Festuca rubra Red Fescue
Holcus lanatus Yorkshire Fog
Hordeum vulgare Barley
Triticum aestivum Wheat
Lolium perenne Perennial Ryegrass
Puccinellia distans Salt marsh grass
Rumex acetosa Common Sorrel
Rumex crispus Curled Dock
Trifolium pratense Red Clover
Trifolium repens White Clover
Composition of seed mixture will be affected by what is commercially available at
time of seeding. Colonisation by further species occurs on areas once vegetation is
established.
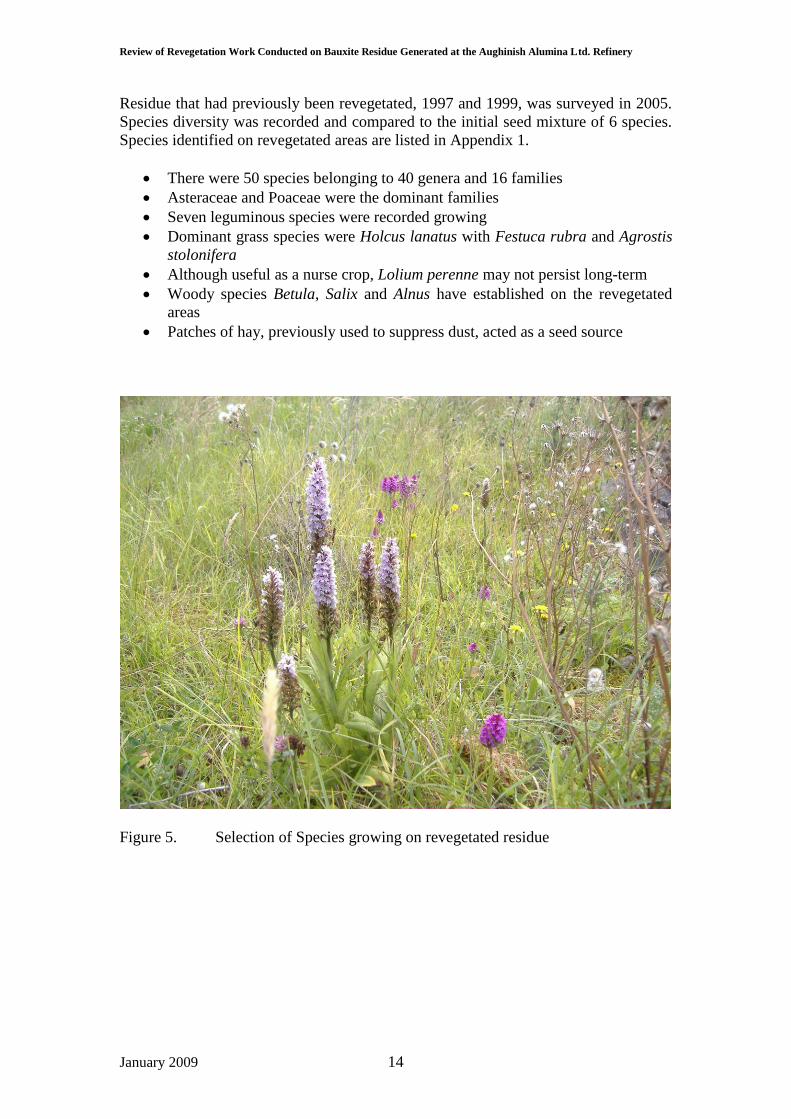
Review of Revegetation Work Conducted on Bauxite Residue Generated at the Aughinish Alumina Ltd. Refinery
January 2009 14
Residue that had previously been revegetated, 1997 and 1999, was surveyed in 2005.
Species diversity was recorded and compared to the initial seed mixture of 6 species.
Species identified on revegetated areas are listed in Appendix 1.
There were 50 species belonging to 40 genera and 16 families
Asteraceae and Poaceae were the dominant families
Seven leguminous species were recorded growing
Dominant grass species were Holcus lanatus with Festuca rubra and Agrostis
stolonifera
Although useful as a nurse crop, Lolium perenne may not persist long-term
Woody species Betula, Salix and Alnus have established on the revegetated
areas
Patches of hay, previously used to suppress dust, acted as a seed source
Figure 5. Selection of Species growing on revegetated residue

Review of Revegetation Work Conducted on Bauxite Residue Generated at the Aughinish Alumina Ltd. Refinery
January 2009 15
Figure 6. Vegetation established on residue with invertebrate activity
3.3 Ecological status of revegetated areas (Macroarthropods).
Ecosystem functions such as nutrient cycling are crucial components of revegetation
programmes for bauxite residues and other tailings. While vegetation establishment
on bauxite residue is well studied little is known on the development of the soil biota.
If the aim of rehabilitation is to create a self-sustaining ecosystem with all its
attributes, then the return of various components of the fauna is critical (Williams
1993).
Macro- arthropod assemblages were sampled (Pitfall traps) over the course of three
months (June-August) from revegetated bauxite residues and compared to a bare
residue site.
It is recognized that pitfall traps capture the most active ground-dwelling arthropods
(e.g. Carabidae, Staphylinidae), which may not always equate to the most abundant.
However, as the same sampling methodology was employed for all sites and sampling
locations, observations are valid.
Macro-arthropod diversity in revegetated residue areas are summarized; 4 classes, 10
orders, 24 families and 36 species.

Review of Revegetation Work Conducted on Bauxite Residue Generated at the Aughinish Alumina Ltd. Refinery
January 2009 16
Results from the available studies of restored sites indicate that invertebrate
herbivores favor habitats that have a higher diversity of plant species reinstated during
restoration. Although only five plant species were initially used in revegetation of the
bauxite residue, a wide variety has colonized the sites leading to greater plant
diversity (Section 3.2 ). The revegetated sites displayed similar floral composition and
should be able to support wide diversity in herbivorous and detritivorous macro-
athropods.
Many species found are obligatory predators and thus occupy a middle tropic level.
The presence of these species reflect and abundance of lower tropic level organisms.
Many species identified are known k-strategists, which reflect later phases in
succession
Revegetated bauxite residue can support a wide variety of arthropod groups; this is
reflected in the groups sampled in the study displaying different features such as
feeding and preference of different layers.
This is supported by diversity in plant composition and structure with improved
substrate conditions.
Species associated with advanced succession were identified and can be included in
future monitoring work on restoration success.
Figure 7. Example of invertebrate sampling on revegetated residue

Review of Revegetation Work Conducted on Bauxite Residue Generated at the Aughinish Alumina Ltd. Refinery
January 2009 17
3.4 Plant Elemental Content
Trials have demonstrated that addition of process sand and gypsum is effective in
lowering uptake of Na, Al and Fe in plants. Findings at AAL are in keeping with
those reported at other refineries. Long-term monitoring is necessary to evaluate
effect of low P and Mn in vegetation growing on amended bauxite residue.
Effect of gypsum and process sand on the growth of Trifolium pratense in amended
residue at AAL was evaluated in a series of field trials (1999). Findings are
summarized:
Trifolium pratense grown in gypsum-amended treatments had significantly
lower aluminium concentration than those in non-gypsum treatments and
levels are not considered excessive.
This trend was also found for plant iron concentration
Gypsum amendment produced lower Na concentration in herbage,
concentrations were markedly decreased with greater process sand addition
Higher manganese concentrations were observed for Trifolium grown in
treatments with gypsum addition.
Sodium levels in the substrate were not high enough to affect calcium in the
plant cells. Calcium levels were in the range deemed adequate for the growth
Marginal Mg, P and K deficiency was found
Mn nutrition may be a limiting factor in achieving long-term growth
Nitrogen nutrition is not adversely affected in organically amended residue
Performance of and elemental uptake for two grass species (Holcus lanatus and
Lolium perenne) was evaluated over a two-year growing period (2000 and 2001) on
amended residue. Findings are summarized:
Herbage Nutrient Analysis – Year 1
Herbage sodium concentrations were above the Irish national mean. However,
they were much lower than levels cited as high for L. perenne
Sodium toxicity is not considered an issue in the present study
Calcium levels were within the range typical for Irish grasses and not
considered deficient
Potassium and Magnesium are marginally deficient but are not considered to
be an inhibitory factor in vegetative growth for year one
Phosphorous nutrition is not limiting in the amended bauxite residue
Grass Mn values were less than the critical value and also lower than the Irish
mean values. Manganese deficiency may be a limiting factor in achieving
longterm growth of the native species on amended residue.
Nitrogen levels determined for the two grasses can be considered marginally
deficient. Even with organic amendment and inorganic fertiliser application,
nitrogen levels were low.
Incorporation of legumes in seeding mixture is recommended.

Review of Revegetation Work Conducted on Bauxite Residue Generated at the Aughinish Alumina Ltd. Refinery
January 2009 18
Herbage Nutrient Analysis – Year 2
Significantly lower biomass was recorded for the second years growth
Levels of sodium recorded were significantly lower than for the previous years
although levels are still high, the decrease in sodium content for all treatments
indicates that sodium uptake and toxicity in not a contributing factor for the
decrease in dry weight biomass recorded
Calcium, nitrogen and phosphorous herbage concentrations decreased and may
reflect a decrease in levels of available Ca, N and P in the amended residue
Magnesium levels decreased to below the critical threshold for deficiency
symptoms
Mn levels were significantly lower in herbage. Mn nutrition in amended
residue needs further investigation
Lower biomass production is attributed to nutrient deficiencies rather than
alkalinity or high ESP
Revegetation trials established on amended residue at AAL in 1999 were examined
again in 2005. Chemical composition of the two dominant species (Holcus lanatus
and Trifolium pratense) is summarised below,
Nitrogen levels in H. lanatus are close to Irish grassland mean values.
Trifolium pratense nitrogen is adequate
Foliar P is only marginally deficient; application of inorganic P fertiliser may
be effective in increasing foliar P concentrations. Role of organic matter in P
nutrition in the residue needs further investigation
Adequate levels of foliar Ca for both T. pratense and H. lanatus indicate that
Na soil concentrations are not affecting plant uptake
levels of T. pratense foliar K are adequate and levels for H. lanatus are greater
than average critical range for temperate grasses
gypsum amendment of residue can cause lower Mg concentration in plants
Mn is low and reflects the low levels of extractable Mn in the amended residue
Role of fertilizer application and gypsum amendment on plant composition
should be further investigated
Review of Revegetation Work Conducted on Bauxite Residue Generated at the Aughinish Alumina Ltd. Refinery
January 2009 19
3.5 Residue Amendment and Plant Screening – Greenhouse Trial
The major constraints and suitable plant species for revegetation of bauxite residues
will vary with each site. In order to further identify residue properties that are
inhibitory to seed germination and seedling development in Aughinish bauxite residue
and establish critical levels, a series of germination and root growth bioassays were
used on bauxite residue from Aughinish were performed
Unamended residue was characterized as having high pH (11.3), sodicity (ESP 92%),
and salinity (EC 14 mS cm-1
).
Gypsum amendment at rates of ≥45 t/ha reduced pH, soluble Al and ESP of the
residue and increased Ca and Mg content. High rate gypsum amendment of the
residue can result in a higher EC and further leaching may be required.
All test species failed to germinate in fresh residue that had not been amended or
leached. Amendment of the residue improved chemical properties and greatly
increased seedling performance in four test species.
Relative seed germination had significant negative correlations with residue pH, EC,
Na, Exchangeable sodium percentage (ESP).
Relative root growth had significant negative correlations with residue pH, EC, Al, Na
and ESP. Ca and Mg content of the amended residue were significantly correlated
with relative root growth. Ca content in gypsum-amended treatments had a growth
stimulating effect on plant growth. Germination index values of >80% in amended
residues indicated disappearance of phytotoxicity.
Lolium perenne and Trifolium pratense were identified as useful species for
revegetation of amended bauxite residue.
3.6 Residue Amendment - Field Trials with Gypsum and organic matter
In order to optimise the amendment procedure for revegetation at Aughinish, a field
experiment was conducted to evaluate the use of organic matter [spent mushroom
compost (SMC)[with gypsum as amendments for promoting vegetation cover on
bauxite residue. Residue was amended at varying rates of SMC (0, 60, 80 and 120
t/ha) and gypsum (0, 40 and 90 t/ha) and sown with Holcus lanatus. Following a one-
year growing period, residue properties and plant performance.

Review of Revegetation Work Conducted on Bauxite Residue Generated at the Aughinish Alumina Ltd. Refinery
January 2009 20
Treatment SMC (t/ha) Gypsum (t/ha) Biomass (kg/2m2)
1
2
3
4
5
6
7
8
9
10
11
12
0
0
0
60
60
60
80
80
80
120
120
120
0
40
90
0
40
90
0
40
90
0
40
90
0
0
0
1.8
2.6
2.8
3.6
3.7
4.2
3.8
4.9
4.9
Table 2. Residue treatments showing variation of organic and gypsum amendment
with first year biomass values
Figure 8. Vegetation growing in amended bauxite residue with organic amendment
(right) and without (left)
Physical Properties
The principal fraction of bauxite residue produced, fine fraction (red mud), consisted
mainly of silt (44%), clay (37%) and sand (19%). Fine fraction residue (red mud) has
a silt-clay-loam texture and lacked aggregation. Typical red mud gradings show up to
20-30% clay sized particles, with the majority of particles in the silt range.
Unless amended and vegetation established, the massive structure and lack of
aggregation of the residue is likely to pose erosion problems
Physical properties of the substrate were significantly affected by organic (SMC)
application rate to the residue. Results are shown below and are summarised as
follows;
SMC significantly reduced the bulk density and particle density of the residue
Organic carbon content increased with SMC application rates, with significant
increases for each application rate
pH was significantly reduced when amended with gypsum

Review of Revegetation Work Conducted on Bauxite Residue Generated at the Aughinish Alumina Ltd. Refinery
January 2009 21
SMC amendment without gypsum was also effective in lowering pH of
residue but only significantly at higher rates.
EC values significantly increased with increasing gypsum application rates
due to the formation of salts
Application of gypsum was the principal mechanism in reducing residue pH
and ESP
Gypsum application promoted flocculation of clay sized particles thereby
reducing clay dispersion in the residue (illustrated Figure 9).
Figure 9. Illustrating effect of gypsum in reducing clay particle dispersion in
bauxite residue (gypsum amended left, non-gypsum right).
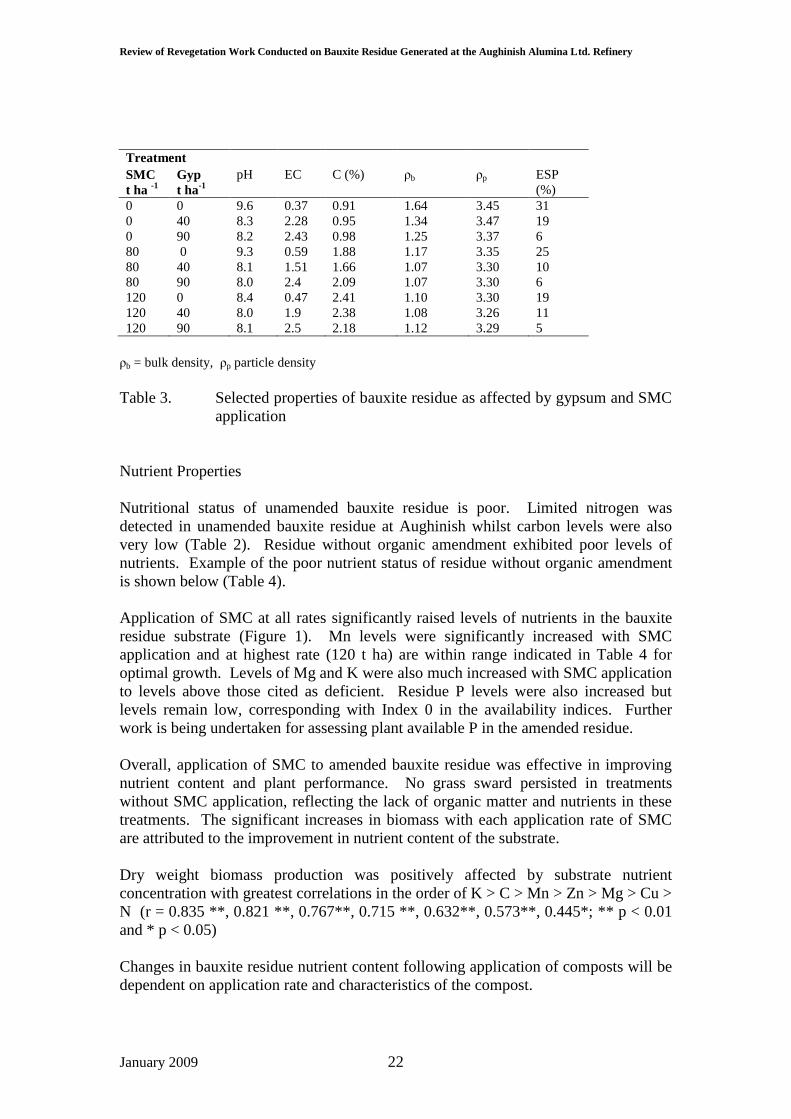
Review of Revegetation Work Conducted on Bauxite Residue Generated at the Aughinish Alumina Ltd. Refinery
January 2009 22
Treatment
SMC
t ha -1
Gyp
t ha-1
pH EC C (%) ρb ρp ESP
(%)
0
0
0
80
80
80
120
120
120
0
40
90
0
40
90
0
40
90
9.6
8.3
8.2
9.3
8.1
8.0
8.4
8.0
8.1
0.37
2.28
2.43
0.59
1.51
2.4
0.47
1.9
2.5
0.91
0.95
0.98
1.88
1.66
2.09
2.41
2.38
2.18
1.64
1.34
1.25
1.17
1.07
1.07
1.10
1.08
1.12
3.45
3.47
3.37
3.35
3.30
3.30
3.30
3.26
3.29
31
19
6
25
10
6
19
11
5
ρb = bulk density, ρp particle density
Table 3. Selected properties of bauxite residue as affected by gypsum and SMC
application
Nutrient Properties
Nutritional status of unamended bauxite residue is poor. Limited nitrogen was
detected in unamended bauxite residue at Aughinish whilst carbon levels were also
very low (Table 2). Residue without organic amendment exhibited poor levels of
nutrients. Example of the poor nutrient status of residue without organic amendment
is shown below (Table 4).
Application of SMC at all rates significantly raised levels of nutrients in the bauxite
residue substrate (Figure 1). Mn levels were significantly increased with SMC
application and at highest rate (120 t ha) are within range indicated in Table 4 for
optimal growth. Levels of Mg and K were also much increased with SMC application
to levels above those cited as deficient. Residue P levels were also increased but
levels remain low, corresponding with Index 0 in the availability indices. Further
work is being undertaken for assessing plant available P in the amended residue.
Overall, application of SMC to amended bauxite residue was effective in improving
nutrient content and plant performance. No grass sward persisted in treatments
without SMC application, reflecting the lack of organic matter and nutrients in these
treatments. The significant increases in biomass with each application rate of SMC
are attributed to the improvement in nutrient content of the substrate.
Dry weight biomass production was positively affected by substrate nutrient
concentration with greatest correlations in the order of K > C > Mn > Zn > Mg > Cu >
N (r = 0.835 **, 0.821 **, 0.767**, 0.715 **, 0.632**, 0.573**, 0.445*; ** p < 0.01
and * p < 0.05)
Changes in bauxite residue nutrient content following application of composts will be
dependent on application rate and characteristics of the compost.
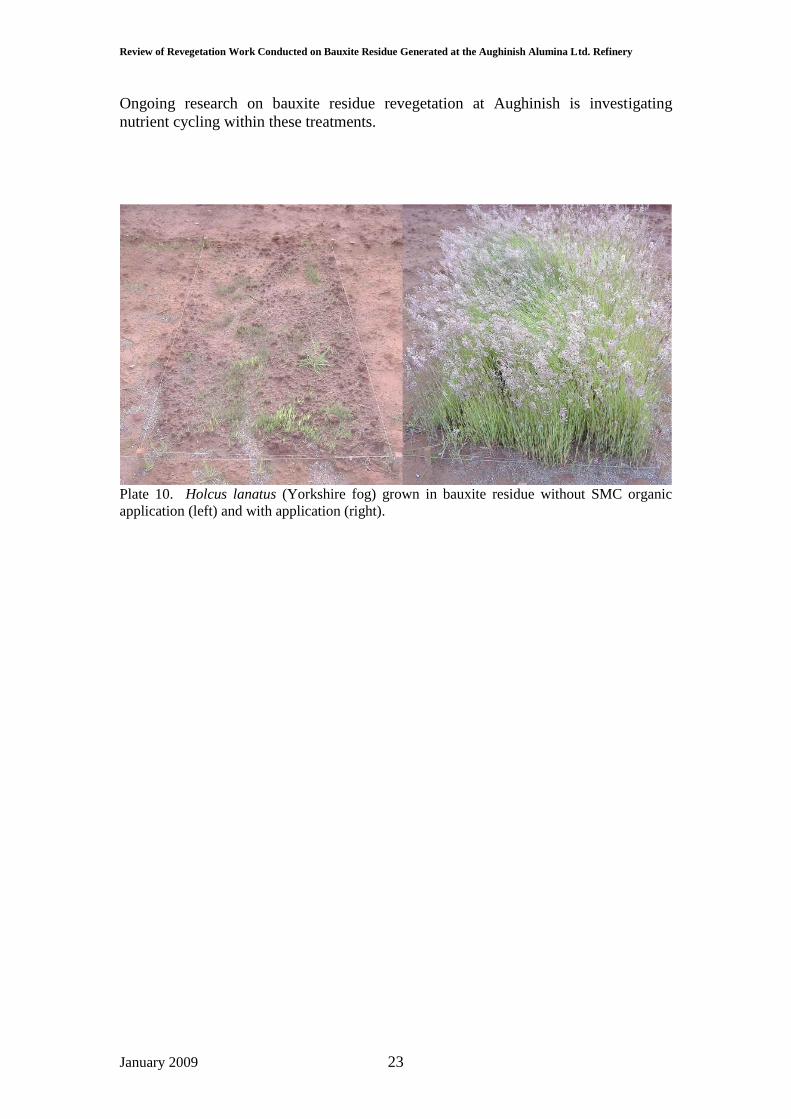
Review of Revegetation Work Conducted on Bauxite Residue Generated at the Aughinish Alumina Ltd. Refinery
January 2009 23
Ongoing research on bauxite residue revegetation at Aughinish is investigating
nutrient cycling within these treatments.
Plate 10. Holcus lanatus (Yorkshire fog) grown in bauxite residue without SMC organic
application (left) and with application (right).

Review of Revegetation Work Conducted on Bauxite Residue Generated at the Aughinish Alumina Ltd. Refinery
January 2009 24
Treatment g kg-1 mg kg
-1 c mol kg-1
SMC
(t/ha) Gypsum
(t/ha) N Mn Zn Cu K Mg
0
60
80
120
90
90
90
90
n.d0
0.50
0.71
1.10
0.3
1.13
1.46
1.9
0.28
1.24
1.56
2.3
0.24
0.40
0.43
0.60
0.10
0.25
0.28
0.48
0.07
0.15
0.18
0.22
Table 4. Effect of spent mushroom compost (SMC) application on bauxite
residue nutrient content
Beneficial Use
As part of Condition 8.3.14, beneficial uses of amended, revegetated residue is being
investigated. One recommendation was fodder cropping (Residues Solutions Report
(ref 220-1-001).
Preliminary field trials have assessed the potential for fodder crops to be grown on the
amended residue. These field trials involved taking a one-cut of fodder crop
(Trifolium repens cv. Huia) and determining the fodder quality. A range of values
are shown below.
Parameter Range
Dry Matter Content (%)
Total Crude protein (%)
MAD Fibre (%)
Digestibility (D value)
Metabolisable energy (MJ/kg)
Digestible crude protein (g/kg)
11.5 - 17.6
18.8 - 28.4
22.4 – 25
72 – 75
11.3 - 11.8
133 - 219
Compared to typical values determined for Irish fodder crops. Fodder quality from
amended residue is summarized. It has a very high crude protein content and a
reasonable digestibility. These results compare to excellent grass silage of 20-
30%DM, 15-16%crude protein and 75-79%DMD, good grass silage of 20-25%DM,
14%crude protein and 72-75%DMD, average grass silage of 20-25%DM, 11%crude
protein and 64-69%DMD, and to well-managed grazed grass of 11-18%DM, 16-
24%crude protein and 75-82%DMD.
Further potential beneficial land-uses are being pursued.

Review of Revegetation Work Conducted on Bauxite Residue Generated at the Aughinish Alumina Ltd. Refinery
January 2009 25
3.7 Large Scale Field Trial Implementation
Previous field trial work conducted on the bauxite residue at Aughinish has focused
on small level (2m2) plots. Amendment and management practices within these
smaller plots can be performed manually. However, transfer of this methodology to a
closure scenario will necessitate adaptation in areas such as amendment spreading and
incorporation. A series of large-scale trials (400 m2) were implemented in 2007 to
develop practices for residue amendment and seedbed preparation at large-scale level.
Figure 9 indicates some of the stages in residue amendment for seedbed preparation.
Findings from this work shows that the key stages in the revegetation programme can
be achieved at a large-scale level. These include the ability for the residue to support
movement of traffic. Methodologies have been developed for spreading large
volumes of amendment (chemical, physical and organic). A successful seedbed can
be established in the residue using conventional agronomic procedures.
Figure 10. Various stages of residue amendment at large scale level
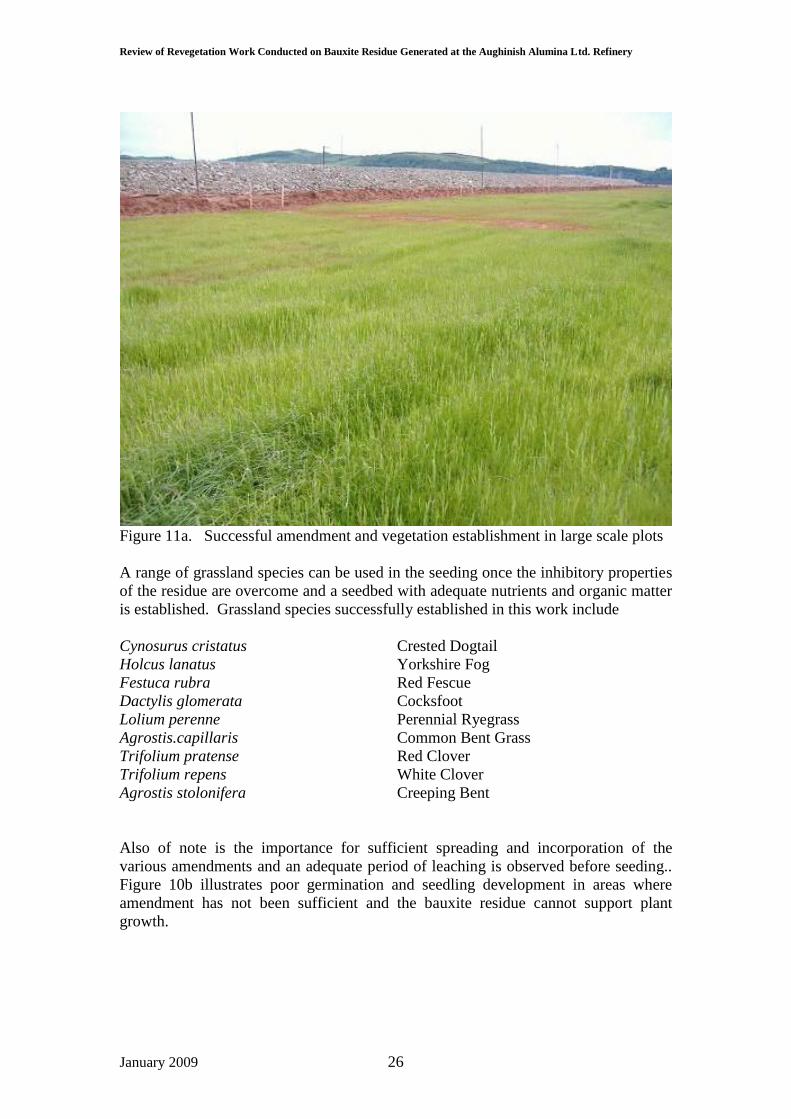
Review of Revegetation Work Conducted on Bauxite Residue Generated at the Aughinish Alumina Ltd. Refinery
January 2009 26
Figure 11a. Successful amendment and vegetation establishment in large scale plots
A range of grassland species can be used in the seeding once the inhibitory properties
of the residue are overcome and a seedbed with adequate nutrients and organic matter
is established. Grassland species successfully established in this work include
Cynosurus cristatus Crested Dogtail
Holcus lanatus Yorkshire Fog
Festuca rubra Red Fescue
Dactylis glomerata Cocksfoot
Lolium perenne Perennial Ryegrass
Agrostis.capillaris Common Bent Grass
Trifolium pratense Red Clover
Trifolium repens White Clover
Agrostis stolonifera Creeping Bent
Also of note is the importance for sufficient spreading and incorporation of the
various amendments and an adequate period of leaching is observed before seeding..
Figure 10b illustrates poor germination and seedling development in areas where
amendment has not been sufficient and the bauxite residue cannot support plant
growth.

Review of Revegetation Work Conducted on Bauxite Residue Generated at the Aughinish Alumina Ltd. Refinery
January 2009 27
Figure 11b. Different areas of residue from large scale amendment where sufficient
amendments were not applied

Review of Revegetation Work Conducted on Bauxite Residue Generated at the Aughinish Alumina Ltd. Refinery
January 2009 28
3.8 Trial Cell Construction and Revegetation
A large-scale (0.6 ha) dedicated research trial area has been created within the BRDA.
The cell is divided into two sections (Cell 1 and Cell 2*) each of approximately 0.3 ha.
Cell 1 received fresh bauxite residue in 2007/2008 and amendment commenced in
2008/2009. Amendment procedures used are those previously described.
The amended area was seeded in September 2009 with species that had previously
been trialled at small plot and large plot level. Species used for seeding were
previously identified (Section 3.7).
Figure 12a. Trial Cell 1 filled with fresh bauxite residue before commencing
amendment procedures
* Cell 2 is currently empty and it is envisaged that this cell will be receive ‘neutralised residue’.

Review of Revegetation Work Conducted on Bauxite Residue Generated at the Aughinish Alumina Ltd. Refinery
January 2009 29
Figure 12B. Amended bauxite residue in Trial Cell 1before seeding.
Figure 11c. Revegetated residue in Trial Cell (5 months after seeding).
Review of Revegetation Work Conducted on Bauxite Residue Generated at the Aughinish Alumina Ltd. Refinery
January 2009 30
4.0 Ongoing Research
A trial area of c. 0.3 ha was amended and seeded during 2009 (section 3.8). Grass
growth in currently within the first year. A programme is in place to bi-annually
sample and monitor the emerging plant/residue soil system and assess functioning
ability of this system. By achieving completion criteria as detailed it is proposed that
this system can be proven to be sustainable/ self-regulating.
Furthermore, areas previously revegetated will continue to be monitored and sampled
as part of the revegetation programme.
It is proposed that through delivery of ‘Completion criteria’ sustainability of the
vegetation cover system can be demonstrated. Key components of the monitoring
programme will contain;
Vegetation establishment, survival and succession
Vegetation productivity, sustained growth and structure development;
Fauna colonisation and habitat development;
Ecosystem processes such as soil development and nutrient cycling,
Colonisation of specific fauna groups that are involved in these processes
Microbiological studies e.g. colonisation by mycorrhizal fungi and
microbial biomass
Ecosystem recovery e.g. resilience of vegetation to disease or drought.
Review of Revegetation Work Conducted on Bauxite Residue Generated at the Aughinish Alumina Ltd. Refinery
January 2009 31
References
Bucher, M.A. (1985) The effects of gypsum and sewage sludge on plant growth and
nutrition on alkaline, saline, fine-textured bauxite residue, MSc Thesis, Duke
University, Durham, North Carolina
Eastham, J. and T. Morald (2006). "Effective Nutrient Sources for Plant Growth on
Bauxite Residue: II. Evaluating the Response to Inorganic Fertilizers." Water, Air, &
Soil Pollution 171(1 - 4): 315-331.
Gherardi, M. and Z. Rengal (2003) Deep bandling improves residual effectiveness of
manganese fertiliser for bauxite residue revegetation. Australian Journal of Soil
Research 41: 1273-1282.
O’Callaghan, B., McDaniel, S.C., Richards, D.M. and Reid, R.E. (1998) Development
of a topsoil-free vegetative cover on a former red mud disposal site, International
Workshop on Rehabilitation of Mined Bauxite Lands and Red Mud Disposal Areas,
September 28 – 2 October, Kingston, Jamaica
Williams, K. S. 1993. Use of terrestrial arthropods to evaluate restored riparian
woodlands. Restoration Ecology 1: 107–116.
Wong, J. W. C. and G. E. Ho (1993) Use of waste gypsum in the revegetation on red
mud deposits: A greenhouse study. Waste Management & Research 11: 249-256.
Worsley Alumina Environmental Report (1997) Development of a bauxite residue
disposal area rehabilitation prescription: Residue Preparation Trial 1994 - 1997

Review of Revegetation Work Conducted on Bauxite Residue Generated at the Aughinish Alumina Ltd. Refinery
January 2009 32
Appendix 1. Species identified growing in amended bauxite residue at AAL
(Families in bold)
Apiaceae /Umbelliferae Polygonaceae
Angelica sylvatica Rumex acetosa
Daucus carota Rumex crispus
Asteraceae/Compositae Ranunculaceae
Achillea millefolium Ranunculus acris
Centaurea nigra Ranuculus repens
Chrysanthemum leucanthemum Rubiaceae
Circium arvense Galium palustre
Cirsium vulgare Salicaceae
Hypochoeris radicata Salix sp.
Lapsana communis Urticanceae
Leontedon autumnales Urtica dioica
Leontodon hispidus
Leontodon taraxacoides
Senecio jacobea
Sonchus arvensis
Taraxacum sp.
Tussilago farfara
Betulaceae
Betula
Cyperaceae
Carex flacca
Caryophyllaceae
Cerastium fontanum
Fabaceae/ Leguminosae
Lathyrus pratensis
Lotus corniculatus
Medicago lupulina
Medicago nigra
Trifolium pratense
Trifolium repens
Vicia sepium
Gentianaceae
Blackstonia perfoliata
Hypericaceae(Clusiaceae)
Hypericum perforatum
Onagraceae
Epilobium angustifolium
Epilobium hirsutum
Epilobium parviflorum
Orchidaceae
Anacamptis morio
Dactyloriza fuchsii
Gymnadenia conopsea Poaceae
Agrostis stolonifera
Anthoxanthum odoratum
Arhenatherum elatius
Dactylis glomerata
Elymus repens
Festuca rubra
Holcus lanatus
Lolium perenne
Phleum pratense

Review of Revegetation Work Conducted on Bauxite Residue Generated at the Aughinish Alumina Ltd. Refinery
January 2009 33
Appendix 2. Peer Reviewed Publications and Presentations Arising from Work
Courtney, R.; Timpson, J. and Grennan, E. (2003) Growth of Trifolium pratense in
red mud amended with process sand, gypsum and thermally dried sewage sludge.
International Journal of Surface Mining, Reclamation and Environment, 17:4: 227-
233
Courtney, R. and Timpson (2005) Nutrient status of vegetation grown in alkaline
bauxite processing residue amended with gypsum and thermally dried sewage sludge -
A two-year field study. Plant and Soil, 266:1:187-194
Courtney, R. and Timpson (2005) Reclamation of fine fraction bauxite processing
residue (red mud) amended with coarse fraction residue and gypsum. Water, Air and
Soil Pollution, 164:1: 91-102
Courtney, R. and Mullen, G. (2009) Use of germination and seedling performance
bioassays for assessing revegetation strategies on bauxite residues. Water, Air and
Soil Pollution, 197: 15-22
Courtney, R., Mullen, G. and Harrington, T. (2009) An evaluation of revegetation
success on bauxite residue at the Aughinish Alumina refinery. Restoration Ecology,
17:3: 350-358
Courtney, R. Harrington, T and Jordan, S.N. (2009) Physico-Chemical Changes in
Bauxite Residue following application of Spent Mushroom Compost and Gypsum,
Land Degradation & Development, 20: 572-581
Courtney, R. and Hartney, T. (1998) The Development of a Rehabilitation System for
Waste Generated at Aughinish Alumina Refinery, International Workshop on
Rehabilitation of Mined Bauxite Lands and Red Mud Disposal Areas, September 28 –
2 October, Kingston, Jamaica
Courtney, R. (2006) Rehabilitation of red mud tailings produced at the Aughinish
Alumina Refinery, 9th international Seminar on Paste and Thickened Tailings,
Limerick, Republic of Ireland, 3 – 7 April 2006

Aughinish Alumina Ltd. March 2010 AER 2009
This page is intentionally blank

Aughinish Alumina Ltd. March 2010 AER 2009
Attachment 9 BRDA Operational Plan

This page is intentionally blank

Rusal Aughinish Ltd. Bauxite Residue Disposal Area (BRDA) Operational Plan (BRDA OP001)
Prepared by: P O‟Loughlin Date: 12.10.04
Approval Date:
L Fleming:
Reference No. BRDA Operational Plan
BRDA OP001
Issue 1
Revised by: P O‟Loughlin Date 17.01.05
E Lowe
Contents i
Rev. 02
RUSAL Aughinish IPPC License P0035-04
Bauxite Residue Disposal Area
Operational Manual
March 2009

Rusal Aughinish Ltd. Bauxite Residue Disposal Area (BRDA) Operational Plan (BRDA OP001)
Prepared by: P O‟Loughlin Date: 12.10.04
Approval Date:
L Fleming:
Reference No. BRDA Operational Plan
BRDA OP001
Issue 1
Revised by: P O‟Loughlin Date 17.01.05
E Lowe
Contents ii
Rev. 02
Bauxite Residue Disposal Area (BRDA)
Operational Manual
Contents
1.0 Introduction ................................................................................................. 1
1.1 Specific IPPCL Conditions ........................................................................... 1
2.0 Site Management and Responsibilities ..................................................... 5
3.0 Operational Principles ................................................................................ 8
4.0 Waste Analysis ........................................................................................... 9
4.1 Sources of Waste ........................................................................................ 9
4.2 Waste quantities .......................................................................................... 9
4.3 Physical properties .................................................................................... 10
4.4 Chemical Properties .................................................................................. 11
5.0 Waste Handling & Placement .................................................................. 13
6.0 Emergency Procedures ............................................................................ 15
7.0 Dust Control .............................................................................................. 16
7.1 Dusting Prevention and Response Measures ........................................... 16
8.0 Surface Water Management & Protection ............................................... 17
9.0 Groundwater Management and Protection ............................................. 18
10.0 Leachate Management and Disposal ...................................................... 19
11.0 Life Expectancy......................................................................................... 20
12.0 Development Programme ........................................................................ 21
13.0 Restoration ................................................................................................ 22
14.0 Aftercare Management ............................................................................. 25
15.0 Environmental Monitoring Programme ................................................... 26

Rusal Aughinish Ltd. Bauxite Residue Disposal Area (BRDA) Operational Plan (BRDA OP001)
Prepared by: P O‟Loughlin Date: 12.10.04
Approval Date:
L Fleming:
Reference No. BRDA Operational Plan
BRDA OP001
Issue 1
Revised by: P O‟Loughlin Date 17.01.05
E Lowe Contents iii
Rev. 02
Attachments
Attachment A Drawings

Rusal Aughinish Ltd. Bauxite Residue Disposal Area (BRDA) Operational Plan (BRDA OP001)
Prepared by: P O‟Loughlin Date: 12.10.04
Approval Date:
L Fleming:
Reference No. BRDA Operational Plan
BRDA OP001
Issue 1
Revised by: T Montgomery Date 1.03.09
E Lowe:
Page 1 of 25
Rev. 03
1.0 Introduction
The Bauxite Residue Disposal Area (BRDA) is a dedicated facility, owned, developed and operated by Rusal Aughinish Ltd as the landfill/tailings storage area for the permanent deposition of specific bauxite and process residues generated within the alumina extraction plant.
This Operational Plan includes all relevant data for the effective operation, monitoring long-term planning and aftercare of the mud stack. It is intended to demonstrate that the BRDA operations are in accordance with best management practices, the environmental policies of Rusal Aughinish Ltd and the existing IPPCL conditions.
1.1 Specific IPPCL Conditions
The development, management and placement of Bayer process residues within the bauxite residue disposal area is covered under Condition 8.3 of the IPPC licence as follows:

Rusal Aughinish Ltd. Bauxite Residue Disposal Area (BRDA) Operational Plan (BRDA OP001)
Prepared by: P O‟Loughlin Date: 12.10.04
Approval Date:
L Fleming:
Reference No. BRDA Operational Plan
BRDA OP001
Issue 1
Revised by: T Montgomery Date 1.03.09
E Lowe:
Page 2 of 25
Rev. 03

Rusal Aughinish Ltd. Bauxite Residue Disposal Area (BRDA) Operational Plan (BRDA OP001)
Prepared by: P O‟Loughlin Date: 12.10.04
Approval Date:
L Fleming:
Reference No. BRDA Operational Plan
BRDA OP001
Issue 1
Revised by: T Montgomery Date 1.03.09
E Lowe:
Page 3 of 25
Rev. 03
This Operational Plan has been structured in order to facilitate a clear presentation of relevant information as required by Condition 8.3.

Rusal Aughinish Ltd. Bauxite Residue Disposal Area (BRDA) Operational Plan (BRDA OP001)
Prepared by: P O‟Loughlin Date: 12.10.04
Approval Date:
L Fleming:
Reference No. BRDA Operational Plan BRDA OP001 Issue 1
Revised by: T Montgomery Date 1.03.09
D McEnery: Page 4 of 25 Rev. 03
.
Figure 1 Organisation Chart
Technical & Materials
Services Manager
Technical & Materials
Services ManagerCalcination, Port,
Utilities & Eng Manager
Calcination, Port,
Utilities & Eng Manager
Accounting StaffAccounting Staff
Financial Controller
(Company Secretary)
Financial Controller
(Company Secretary)
Local 3
Precipitation
Local 3
Precipitation
Local 4 PortLocal 4 Port
Local 5 Boilerhouse
& Calcination
Local 5 Boilerhouse
& Calcination
Engineering
(incl Alliance)
Engineering
(incl Alliance)
Workshops
Site Services
Workshops
Site Services
Vessel Turnaround &
Pump Maintenance
Vessel Turnaround &
Pump Maintenance
General ServicesGeneral Services
Plant Technology
/ Laboratory
Plant Technology
/ Laboratory
Information
Technology
Information
Technology
Materials SupplyMaterials Supply
CHPCHP
Modernisation
Manager
Modernisation
Manager
Managing DirectorManaging Director
BRDA Management
Contractor
(Murphy International Ltd.)
BRDA Management
Contractor
(Murphy International Ltd.)
Public AffairsPublic Affairs
Safety, Health
& Security
Safety, Health
& Security
HR and
Recruitment
HR and
Recruitment
Training &
Development
Training &
Development
HR, HSE & Public Affairs Manager
HR, HSE & Public Affairs Manager
EnvironmentEnvironment
Local 1
Digestion
Local 1
Digestion
Local 2
Filtration &
Mud Circuit
Local 2
Filtration &
Mud Circuit
Hydrate Plant
Manager
Hydrate Plant
ManagerTechnical & Materials
Services Manager
Technical & Materials
Services ManagerCalcination, Port,
Utilities & Eng Manager
Calcination, Port,
Utilities & Eng Manager
Accounting StaffAccounting Staff
Financial Controller
(Company Secretary)
Financial Controller
(Company Secretary)
Local 3
Precipitation
Local 3
Precipitation
Local 4 PortLocal 4 Port
Local 5 Boilerhouse
& Calcination
Local 5 Boilerhouse
& Calcination
Engineering
(incl Alliance)
Engineering
(incl Alliance)
Workshops
Site Services
Workshops
Site Services
Vessel Turnaround &
Pump Maintenance
Vessel Turnaround &
Pump Maintenance
General ServicesGeneral Services
Plant Technology
/ Laboratory
Plant Technology
/ Laboratory
Information
Technology
Information
Technology
Materials SupplyMaterials Supply
CHPCHP
Modernisation
Manager
Modernisation
Manager
Managing DirectorManaging Director
BRDA Management
Contractor
(Murphy International Ltd.)
BRDA Management
Contractor
(Murphy International Ltd.)
Public AffairsPublic Affairs
Safety, Health
& Security
Safety, Health
& Security
HR and
Recruitment
HR and
Recruitment
Training &
Development
Training &
Development
HR, HSE & Public Affairs Manager
HR, HSE & Public Affairs Manager
EnvironmentEnvironment
Local 1
Digestion
Local 1
Digestion
Local 2
Filtration &
Mud Circuit
Local 2
Filtration &
Mud Circuit
Hydrate Plant
Manager
Hydrate Plant
Manager

Rusal Aughinish Ltd. Bauxite Residue Disposal Area (BRDA) Operational Plan (BRDA OP001)
Prepared by: P O‟Loughlin Date: 12.10.04
Approval Date:
L Fleming:
Reference No. BRDA Operational Plan
BRDA OP001
Issue 1
Revised by: T Montgomery Date 1.03.09
E Lowe:
Page 5 of 25
Rev.03
2.0 Site Management and Responsibilities
The Hydrate Plant Manager has overall responsibility operation of the bauxite residue disposal area (BRDA). The BRDA is referred to as Area 54 (A54) and is within the functional area of Local 2 - Filtration and Mud Circuit. Local 2 is involved in the separation of bayer process residues (red mud, sand) from process liquor. The separated residues are placed in the BRDA, while process liquor is passed via filtration onto precipitation (Local 3). The Local 2 Co-ordinator has functional and administrative responsibility for the management of the bauxite residue disposal area. Placement of waste material within the mudstack is undertaken by Murphy International Ltd. under a Site Process Materials Management Contract. The Local 2 Operations Facilitator has overall responsibility for day-to-day operations. The Local 2 Operations Engineer has overall responsibility for technical developments in the residue production and effluent treatment operations. The Engineering Dept. Principal Engineer has functional responsibility for all technical developments within the BRDA area and advises the Operations Engineer. The BRDA Operations Contractor is responsible for all landfill operations and maintenance as per contract. All queries from members of the public are managed by the Public Affairs Manager. All liaison with and queries from the EPA are managed by the Environmental Co-ordinator The following describes the personnel and their roles associated with the BRDA area. Operation of the BRDA
The day-to-day operation of the BRDA is carried out under the Site Process Materials (SPM) Management Contract. Under this contract, Murphy International Ltd. (the Contractor) has responsibility for the following: o Collection, transport and placement of all process plant residues at the BRDA. o Maintenance and organization of red mud placement operations o Reporting of waste quantities deposited to the BRDA to Local 2. o Organisation and development of all landfill operations and maintenance, including
construction of internal access roads. o Organisation and implementation of all internal storage developments within the
mudstack, including perimeter rockfill construction. o Organisation, implementation and maintenance of environmental protection
measures

Rusal Aughinish Ltd. Bauxite Residue Disposal Area (BRDA) Operational Plan (BRDA OP001)
Prepared by: P O‟Loughlin Date: 12.10.04
Approval Date:
L Fleming:
Reference No. BRDA Operational Plan
BRDA OP001
Issue 1
Revised by: T Montgomery Date 1.03.09
E Lowe:
Page 6 of 25
Rev.03
The Process Operators (PO), working as a team with the Site Process Materials Management Contractor, are responsible for the day to day running of the BRDA area. Their responsibilities include: 1. Patrolling and liaising with Contractor on discharge points to be operated.
Assessing the vulnerability of dusting and liaising with contractor on appropriate measures to suppress it.
2. Priming the dust suppression sprinkler system with water when advised by the contractor.
3. Submitting job-tickets for any maintenance work required. 4. Participating in the formulation of longer-term strategies in conjunction with the
Local 2 Coordinator and his team.
The Local 2 Coordinator with support from the Central Engineering Dept manages the construction of rockfill embankments on the periphery of the mud-stacking areas.
Control of Mud Quality The Control Room Operator (CRO) is responsible for monitoring mud throughput and mud line pressure.
The Process Operator (PO) is responsible for sampling, field patrols, filter checks, pump checks, filter washing and mud line pressure control. The PO has responsibility for bringing on and off line filters, washing filter cloths and flushing of vents when washing (1A, 1B, 2A, 2B, 3A, 3B and 50A/50B).
The Process Engineer is responsible for monitoring and achieving all long-term trends and process targets.
Mud Washing The Control Room Operator (CRO) is responsible for, monitoring wash flow and filter speed.
The Process Operator (PO) is responsible for, sampling, field patrols, wash distribution and cloth repairs.
Management of runoff from the BRDA – (Water Management)
The Control Room Operator (CRO) is responsible for monitoring pond levels and stream distribution. The CRO records any non-compliance in the L2 Day Log and reports these to the Shift Plant Facilitator. (SPF). The SPF reports any non-compliances in the shiftlog.
The Process Operator (PO) is responsible for sampling, field valve set up and field patrols.
The Environment Coordinator is responsible for formal notification of the Environmental Protection Agency (EPA) as soon as practicable regarding IPPC licence non-compliances.

Rusal Aughinish Ltd. Bauxite Residue Disposal Area (BRDA) Operational Plan (BRDA OP001)
Prepared by: P O‟Loughlin Date: 12.10.04
Approval Date:
L Fleming:
Reference No. BRDA Operational Plan
BRDA OP001
Issue 1
Revised by: T Montgomery Date 1.03.09
E Lowe:
Page 7 of 25
Rev.03
Pond Clean Outs and Inspection
The Local 2 process engineer and facilitator are responsible for deciding when a clean out may commence and where the clean out sludge should be disposed of. The Environmental Engineer is responsible for reviewing clean out operations and to advise on environmental control measures as necessary.
The control room operator (CRO) is responsible for monitoring any condensate dumps to the West pond or its trenches. The process operator (PO) is responsible for monitoring the pump off of the liquid waste pond, during a normal clean out.
The Local 2 Environmental Facilitator is responsible for inspection of ponds.
The civil engineering department is responsible for monitoring any repairs to the pond liners or concrete.
Dust Emissions Control The SPM Contractor is responsible for ensuring that no dusting occurs on the mud stack and to take the necessary measures to prevent dusting. These measures include ensuring the BRDA is appropriately sprinklered to damp down potential fugitive dust emissions at all times. The responsibility for prevention of fugitive dust emissions includes maintenance, filling and operation of all mobile water sprayers and permanently installed sprinkler systems. The contractor maintains a watching brief for the meteorological conditions which favour dusting and is responsible for communicating this to the Equipment Facilitator on a daily basis. Emergency Response In the event of a dusting emergency, the Contractor is responsible for directly notifying the SPF and Local 2 CRO. Depending on the response required, the Contractor has responsibility for requesting assistance, organizing all dust suppression resources and ensuring that the Emergency Response procedure (SWM 2021) is implemented. Dusting is categorized a plant emergency. The plant emergency number (4444) is used to contact security at A79.

Rusal Aughinish Ltd. Bauxite Residue Disposal Area (BRDA) Operational Plan (BRDA OP001)
Prepared by: P O‟Loughlin Date: 12.10.04
Approval Date:
L Fleming:
Reference No. BRDA Operational Plan
BRDA OP001
Issue 1
Revised by: T Montgomery Date 1.03.09
E Lowe:
Page 8 of 25
Rev.03
3.0 Operational Principles The following summarises key the operating principles for the Bauxite Residue Disposal Area (BRDA):
1. The BRDA accepts only those residues described in the Licence. 2. The red mud is pumped to the BRDA at optimum solids and deposited in layers to
maximise maturing by drying and consolidation and to optimize overall storage capacity of the mud stack.
3. The approach to the placement of red mud is based on “field stacking”. Field
stacking involves the placement of mud in a thin layer over a short period of time at a series of locations. This technique allows the mud to mature rapidly, thereby allowing a higher stacking angle and easier movement on the surface by equipment.
4. Storage capacity is developed within the BRDA by construction of rockfill
embankments around the mud stack using the upstream terracing method where the underlying red mud supports the upper rockfill embankment.
5. The overall stability of the upstream rockfill core mud retention terraces around the
BRDA perimeter is determined by routine monitoring and assessment of the undrained shear strength of the red mud and underlying estuarine soil
6. The soda content of the red mud and other residues being deposited is minimised
to optimize soda recovery in the plant and to minimise environmental liabilities within the mud stack
7. The integrity of all HDPE geomembranes for environmental protection is
maintained. No mobile equipment is permitted direct contact with the geomembrane
8. The runoff and leachate is collected in the perimeter drain and pumped back to the
plant. 9. The surface water inventories in the perimeter drain and adjacent storm water
pond are minimised and pumping capacities are maximised as practicably as possible to ensure that there is sufficient operational freeboard for major rainfall events.
10. A water sprinkler Dust Suppression System is used over the entire red mud and
process sand surfaces to prevent dusting. 11. The downstream toe drains, external watercourses and groundwater observation
wells are routinely inspected to monitor for any migration of liquids from the mud stack.
12. All incidents, whether of an environmental or health and safety nature are reported
and investigated to ensure that any necessary remedial action is taken and to prevent any re-occurrence of the incident.

Rusal Aughinish Ltd. Bauxite Residue Disposal Area (BRDA) Operational Plan (BRDA OP001)
Prepared by: P O‟Loughlin Date: 12.10.04
Approval Date:
L Fleming:
Reference No. BRDA Operational Plan
BRDA OP001
Issue 1
Revised by: T Montgomery Date 1.03.09
E Lowe:
Page 9 of 25
Rev.03
4.0 Waste Analysis 4.1 Sources of Waste
All bauxite derived solid and sludge residues arising from alumina production at the plant are directed to the red mud stack in accordance with the licence. Almost all the solid residue material arises from the initial caustic digestion of the bauxite ore. After exiting the bauxite digesters, the residue is segregated into two fractions, the fine red mud fraction, representing 90% of the total and the coarse fraction, known as process sand, representing the other 10%. Together these represent about 97% of the total bauxite residue from the plant. The remaining proportion comprises salt cake, from a salting-out liquor purification process and other process wastes including scale, construction and demolition waste and sand. Table 1 below lists the waste types approved by the Agency for placement within the BRDA. Table 1 Approved Waste Types
The red mud is subject to counter-current washing to reduce the concentration of entrained caustic before being de-watered in a vacuum drum filter and pumped as slurry to the mud stack. The coarser “process sand” fraction is delivered to the storage area in dumper trucks. Salt cake, lime grits, refractory and scale that are trucked to the mud stack, are confined to specific areas within the existing mud stack. In addition sludge‟s from the process effluent treatment plant and from the other process ponds are deposited within the mud stack area.
4.2 Waste quantities
Waste analysis in 2003 is shown in Table 2 and accumulated waste quantities are shown on Table 3.
Waste Types o Red Mud o Process Sand o Salt Cake o Process Scale o Lime Grits o Pond Cleanout Sludge (LWP, SWP, North Pond, South Pond, East Pond, West
Pond) o Miscellaneous non hazardous refractory material o Building rubble (For roadway/embankment construction within mudstack) o Sludge from the Sanitary treatment plant (Emergency) o A34 effluent clarifier underflow sludge (Discontinued)

Rusal Aughinish Ltd. Bauxite Residue Disposal Area (BRDA) Operational Plan (BRDA OP001)
Prepared by: P O‟Loughlin Date: 12.10.04
Approval Date:
L Fleming:
Reference No. BRDA Operational Plan
BRDA OP001
Issue 1
Revised by: T Montgomery Date 1.03.09
E Lowe:
Page 10 of 25
Rev.03
Table 2 Waste Composition & Tonnage (2008)
Waste Stream EWC Code
Jan – Dec ’08 Total (t)
As % of total waste land filled
Fluestack Residues (dry)
16 11 04 110 0.01%
Lime Grits (wet) 01 03 99 7,509 0.61%
Process Waste (wet)
01 03 99 71,750 5.78%
Red Mud (dry) 01 03 09 1,148,738 92.59%
Salt Cake (wet) 01 03 07 12,558 1.01%
Total Waste 1,240,695 100%
Table 3 Accumulated Quantities Of Waste (1983 To Dec 2008)
Waste Stream EWC Code 1983 – Dec.’08 Total
(t)
As % of total waste landfilled
Effluent Sludge A34 Clarifier (dry) * 06 05 03 4,380 0.02%
Fluestack Residues (dry) 16 11 04 4,396 0.02%
Lime Grits (wet) 01 03 99 101,130 0.52%
Process Waste (wet) 01 03 99 1,843,390 9.83%
Red Mud (dry) 01 03 09 17,016,737 88.04%
Salt Cake (wet) 01 03 07 293,587 1.56%
Total Waste 19,263,651 100%
(Note1: The data for all residues for 1983 - 1997 other than red mud are estimated based on pro-rata tonnages for the period 1997 to 2000.
* Material no longer generated at plant. 4.3 Physical properties
The red mud residue is pumped from the mud separation area (Local 2) to the storage area as slurry with a solids content of between 55% and 60%. Once the mud has been discharged it begins to dry, with water being lost through surface evaporation and “bleeding” due to consolidating pressures. It has been found that after an average „maturing period‟ of 3 to 9 months for a mud layer of 0.3 to 0.6m thick a solids content of around 68% to 70% is achieved. Particle size analyses of red mud indicate that the material is largely silt size, with 90% of the particles smaller than 35 microns and 35% finer than 2 microns. The permeability of the mud is correspondingly very low and has been assessed to be in

Rusal Aughinish Ltd. Bauxite Residue Disposal Area (BRDA) Operational Plan (BRDA OP001)
Prepared by: P O‟Loughlin Date: 12.10.04
Approval Date:
L Fleming:
Reference No. BRDA Operational Plan
BRDA OP001
Issue 1
Revised by: T Montgomery Date 1.03.09
E Lowe:
Page 11 of 25
Rev.03
the range 1 x 10⁻⁸ to 1 x 10⁻⁹m/sec. The average specific gravity of the dry mud solids is 3.3.
The process sand is poorly graded medium sand having 90% and 10% of the particles smaller than 500 and 100 microns respectively. The permeability of the process sand is estimated to be about 1000 times greater than the permeability of the red mud.
Salt cake is deposited as a 70% solids cake.
4.4 Chemical Properties
The principal constituents of the red mud solids (expressed as the oxides) are iron oxide (Fe2O3), aluminium oxide (Al2O3) and titanium dioxide (TiO2).
The aqueous solution entrained within the red mud contains a small amount of residual dissolved caustic (sodium hydroxide) and alumina in spite of the repeated washing in the plant. It is this residual dissolved caustic that gives the red mud its elevated pH characteristics. Most of this caustic converts to sodium carbonate and sodium bicarbonate on the stack.
The salt cake consists of the organic degradation products from humates in the bauxite, including sodium carbonate, sodium sulphate and sodium oxalate. Results of monthly analysis of waste (as required by the IPPC licence) is tabulated on Table 4 over.
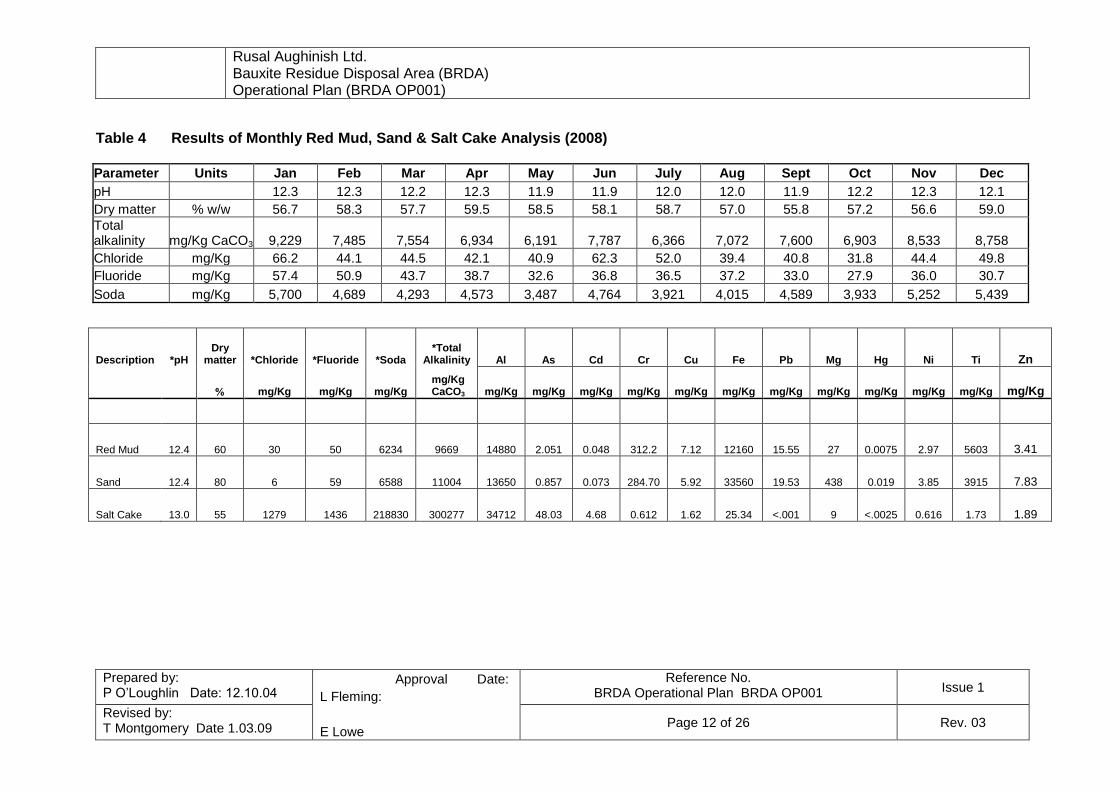
Rusal Aughinish Ltd. Bauxite Residue Disposal Area (BRDA) Operational Plan (BRDA OP001)
Prepared by: P O‟Loughlin Date: 12.10.04
Approval Date:
L Fleming:
Reference No. BRDA Operational Plan BRDA OP001 Issue 1
Revised by: T Montgomery Date 1.03.09
E Lowe Page 12 of 26 Rev. 03
Table 4 Results of Monthly Red Mud, Sand & Salt Cake Analysis (2008)
Parameter Units Jan Feb Mar Apr May Jun July Aug Sept Oct Nov Dec
pH 12.3 12.3 12.2 12.3 11.9 11.9 12.0 12.0 11.9 12.2 12.3 12.1
Dry matter % w/w 56.7 58.3 57.7 59.5 58.5 58.1 58.7 57.0 55.8 57.2 56.6 59.0
Total alkalinity mg/Kg CaCO3 9,229 7,485 7,554 6,934 6,191 7,787 6,366 7,072 7,600 6,903 8,533 8,758
Chloride mg/Kg 66.2 44.1 44.5 42.1 40.9 62.3 52.0 39.4 40.8 31.8 44.4 49.8
Fluoride mg/Kg 57.4 50.9 43.7 38.7 32.6 36.8 36.5 37.2 33.0 27.9 36.0 30.7
Soda mg/Kg 5,700 4,689 4,293 4,573 3,487 4,764 3,921 4,015 4,589 3,933 5,252 5,439
Description *pH Dry
matter *Chloride *Fluoride *Soda *Total
Alkalinity Al As Cd Cr Cu Fe Pb Mg Hg Ni Ti Zn
mg/Kg mg/Kg mg/Kg mg/Kg CaCO3 mg/Kg mg/Kg mg/Kg mg/Kg mg/Kg mg/Kg mg/Kg mg/Kg mg/Kg mg/Kg mg/Kg mg/Kg
Red Mud 12.4 60 30 50 6234 9669 14880 2.051 0.048 312.2 7.12 12160 15.55 27 0.0075 2.97 5603 3.41
Sand 12.4 80 6 59 6588 11004 13650 0.857 0.073 284.70 5.92 33560 19.53 438 0.019 3.85 3915 7.83
Salt Cake 13.0 55 1279 1436 218830 300277 34712 48.03 4.68 0.612 1.62 25.34 <.001 9 <.0025 0.616 1.73 1.89

Rusal Aughinish Ltd. Bauxite Residue Disposal Area (BRDA) Operational Plan (BRDA OP001)
Prepared by: P O‟Loughlin Date: 12.10.04
Approval Date:
L Fleming:
Reference No. BRDA Operational Plan
BRDA OP001
Issue 1
Revised by: T Montgomery Date 1.03.09
E Lowe
Page 13 of 26
Rev. 03
5.0 Waste Handling & Placement
The bauxite residue disposal area is a dedicated and engineered facility for the placement of specific process residues as detailed below Red mud The majority of red mud slurry is pumped from the Mud Filtration Building to the red mud disposal area at generally above 58% solids. A small proportion of red mud low solids slurry collected from the maintenance turnaround cleaning of the mud settling and washing tanks is trucked to the red mud stack area and deposited on the existing red mud surfaces from the process sand landfill areas within the red mud stack area. The method of placing mud o the BRDA is known as „Field stacking‟. This involves allowing mud to stand for a short period of time in one location to facilitate the maturing process. This necessitates the availability of a number of mud points for the incoming mud to be deposited. This process allows the mud to mature more quickly, which in turn enables the mud to be stacked at a higher angle in the longer term and also enables earlier trespass onto the stack surface.
The placement of red mud within the mudstack is controlled by procedure – SWM 2009 and SWM 2022. The plant Waste Management Manual (WM001) covers the placement of Red Mud (Section 4.3.2.9)
Process Sand: Process Sand is the quartsite fraction of the bauxite residue. This is washed as effectively as possible to remove all leachable soda and in particular to extract all leachable sodium aluminate which is potential product (SWM 2006). The process sand is trucked under contract to the mud stack from the process plant. The disposal of sand is specified under Section 4.3.1.8 of the plant Waste Management Manual (WM001). Salt cake The salt cake is produced in the liquor purification process called the Organics and Causticity Control plant. The liquor is purified through the precipitation of impurities that occur when the caustic liquor is concentrated. These impurities are removed as a filter cake, consisting principally of sodium compounds with carbonate, sulphate, oxalate, fluoride and chloride. The salt cake is deposited within a process sand bunded area on the interior red mud surfaces the mud stack. The disposal of salt cake is specified under Section 4.3.1.8 of the plant Waste Management Manual (WM001).
Lime Grits These are the insoluble clinker cores of the burnt limestone cobbles dissolved in the lime slaking plant within the process. These are trucked from the process plant by contract to the red mud stack area and are used as landfill road surfacing materials in the immediate area around the salt cake.

Rusal Aughinish Ltd. Bauxite Residue Disposal Area (BRDA) Operational Plan (BRDA OP001)
Prepared by: P O‟Loughlin Date: 12.10.04
Approval Date:
L Fleming:
Reference No. BRDA Operational Plan
BRDA OP001
Issue 1
Revised by: T Montgomery Date 1.03.09
E Lowe
Page 14 of 26
Rev. 03
The disposal of lime grits is covered under Section 4.3.2.6 of the plant Waste Management Manual (WM001)
Scale The process scale, which consists of hydrated sodium aluminium silicate sometimes combined with bauxite residues, removed from the interiors of process tanks, vessels and pipes during routine and turnaround maintenance activities in the process plant. All such scales are trucked by contract to the red mud stack area and deposited on the existing red mud surfaces from the process sand landfill areas with the red mud stack area. The disposal of scale is covered under Section 4.3.2.6 of the plant Waste Management Manual (WM001).
Transport and placement of wastes
The BRDA is operated under contract to Murphy International Ltd. who have overall responsibility to the collection, transportation, and placement of waste. The contract extends to maintenance and resourcing of all equipment, including vehicles, which operate within the BRDA, including environmental control equipment for dust suppression. All residues are either pumped or trucked in specified skips or dumpers to the BRDA area. All drivers are trained on checking that only wastes designated for disposal at the BRDA should be contained in the designated skips. If other waste streams are contained in the skips the skips will not be removed for disposal. Drivers are also trained on checking and handling of leachate which may arise. All trucked residues are transported onto the BRDA area on a network of internal access roads constructed to engineering standards. Trucked residues must be deposited on a layer of matured red mud. Process sand may be deposited directly onto red mud surfaces provided mechanical plant is confined to adjacent engineered designed and supervised access roads or the mobile plant is moving on a layer of compacted process sand. Relevant Standard Operational Procedures
In addition to the sections of the Site Materials Management Contract and the Waste Management Manual listed above, the following standard operating procedures deal with the operation of the BRDA –
Procedure Number Purpose
SWM 2006 Area 27A Operation
SWM 2009 Provide Stackable Mud and maintain mud removal capacity
SWM 2010 Mud Washing Operating Guidelines
SWM 2005 Wash Circuit Control
SWM 2022 Mud Stacking

Rusal Aughinish Ltd. Bauxite Residue Disposal Area (BRDA) Operational Plan (BRDA OP001)
Prepared by: P O‟Loughlin Date: 12.10.04
Approval Date:
L Fleming:
Reference No. BRDA Operational Plan
BRDA OP001
Issue 1
Revised by: T Montgomery Date 1.03.09
E Lowe
Page 15 of 26
Rev. 03
6.0 Emergency Procedures The management of emergencies at Rusal Aughinish Ltd is co-ordinated by a fully resourced and trained plant security team who are on site 24 hours per day, 365 days per annum. Owing to the organization for safety and emergency response centrally at the security gatehouse, the overall plant emergency response plan and procedure covers the activities at the mudstack. Environmental Emergency Response procedure (P007.075.001) details specific measures to be taken in the event of a significant environmental incident at the plant in addition to defining roles and responsibilities in an emergency.
The overall Rusal Aughinish Emergency Response Plan deals with emergency preparedness, planning, response and co-ordination in the case of significant emergencies or incidents at the plant. The defined categories of emergency include environmental emergencies and emergencies which may have to potential to lead to environmental damage. Dusting is classified as an emergency and is subject to a formulised emergency response procedure (SWM2021 - Dust Emission Control and Frost Procedures – Local 2). Under the SPM Contract, the Contractor has defined responsibilities in the event of dusting. These responsibilities extend from prevention to response through: o Review of meteorological conditions. o Preventative damping of mudstack. o Maintenance of equipment. o Operation of sprinklers, bowzers. o Resourcing emergency response. o Communication with Rusal Aughinish personnel in an emergency response. o Ensuring that SWM 2021 is followed.

Rusal Aughinish Ltd. Bauxite Residue Disposal Area (BRDA) Operational Plan (BRDA OP001)
Prepared by: P O‟Loughlin Date: 12.10.04
Approval Date:
L Fleming:
Reference No. BRDA Operational Plan
BRDA OP001
Issue 1
Revised by: T Montgomery Date 1.03.09
E Lowe
Page 16 of 26
Rev. 03
7.0 Dust Control
Historical evidence shows that incidents of fugitive dust generation occur under the effects of the following: o Wind speeds in excess of 5 m/sec. o Freezing or very warm temperatures o Dry air-conditions i.e. low humidity
The primary objective in management of placement operations at the BRDA is to prevent the formation of conditions where fugitive dust generation can occur.
7.1 Dusting Prevention and Response Measures
The following fugitive dusting prevention and response measures are implemented at the BRDA.
1. Minimise mud flat area exposed to dusting risk.
2. Keep mud flats in service as long as possible to limit areas of potential dusting.
3. Switch points regularly to cover drying mud with wet mud.
4. Maximise mud solids to the stack to get best stacking angle.
5. Switching mud points regularly to aid stacking angle lift.
6. Water spray sprinkler (Dust suppression sprinkler system) installed to 100%
coverage over red mud areas.
7. Five bowzer units are available to transport and discharge water from the Liquid Waste Pond (LWP).
8. RUSAL AUGHINISH Bowzers left at LWP outside of normal business hours and
where significant potential for dusting exists. If taken to be used elsewhere on site, must be returned cleaned to LWP and filled with water.
9. Open individual valves on sprinklers for approximately five minutes at a time and
rotate as required.
The procedure to be followed in the event of requiring dust suppression is SWM 2021.
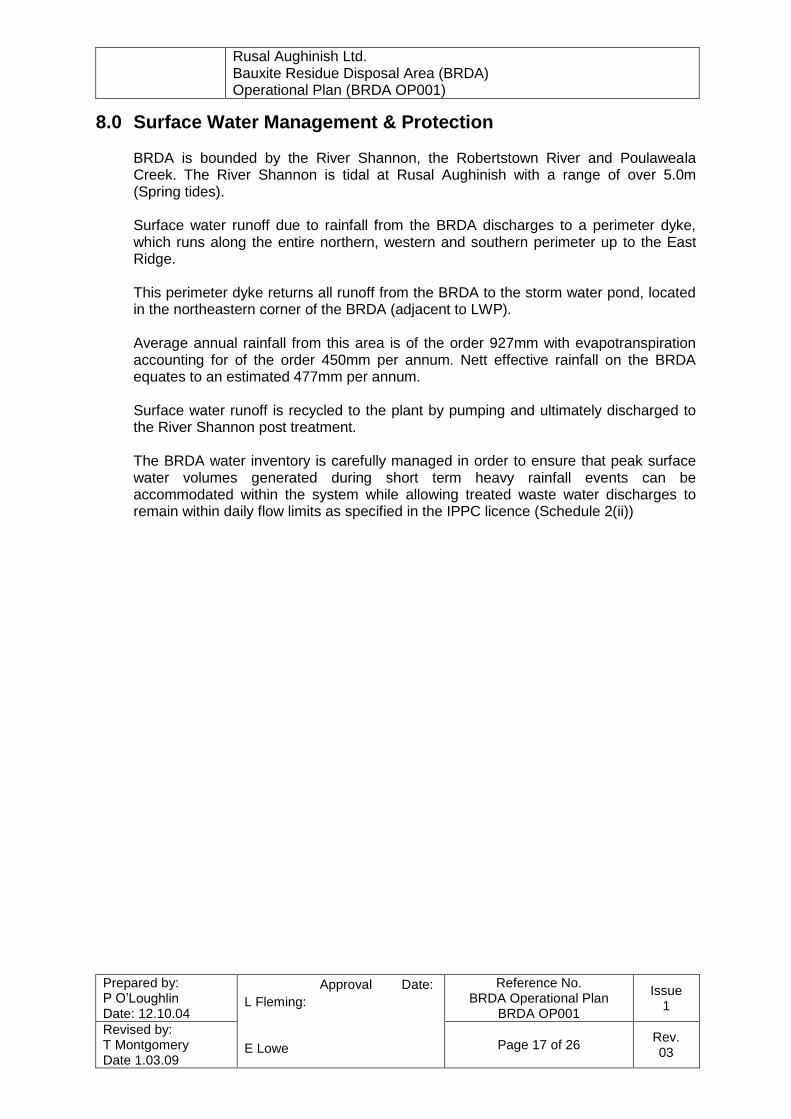
Rusal Aughinish Ltd. Bauxite Residue Disposal Area (BRDA) Operational Plan (BRDA OP001)
Prepared by: P O‟Loughlin Date: 12.10.04
Approval Date:
L Fleming:
Reference No. BRDA Operational Plan
BRDA OP001
Issue 1
Revised by: T Montgomery Date 1.03.09
E Lowe
Page 17 of 26
Rev. 03
8.0 Surface Water Management & Protection
BRDA is bounded by the River Shannon, the Robertstown River and Poulaweala Creek. The River Shannon is tidal at Rusal Aughinish with a range of over 5.0m (Spring tides). Surface water runoff due to rainfall from the BRDA discharges to a perimeter dyke, which runs along the entire northern, western and southern perimeter up to the East Ridge. This perimeter dyke returns all runoff from the BRDA to the storm water pond, located in the northeastern corner of the BRDA (adjacent to LWP). Average annual rainfall from this area is of the order 927mm with evapotranspiration accounting for of the order 450mm per annum. Nett effective rainfall on the BRDA equates to an estimated 477mm per annum. Surface water runoff is recycled to the plant by pumping and ultimately discharged to the River Shannon post treatment. The BRDA water inventory is carefully managed in order to ensure that peak surface water volumes generated during short term heavy rainfall events can be accommodated within the system while allowing treated waste water discharges to remain within daily flow limits as specified in the IPPC licence (Schedule 2(ii))

Rusal Aughinish Ltd. Bauxite Residue Disposal Area (BRDA) Operational Plan (BRDA OP001)
Prepared by: P O‟Loughlin Date: 12.10.04
Approval Date:
L Fleming:
Reference No. BRDA Operational Plan
BRDA OP001
Issue 1
Revised by: T Montgomery Date 1.03.09
E Lowe
Page 18 of 26
Rev. 03
9.0 Groundwater Management and Protection
Aughinish Island is hydrogeologically isolated from the mainland and can be regarded as an independent groundwater body.
Groundwater Seepage Controls The BRDA is underlain by two geologically dissimilar components. The northern part of the BRDA is generally underlain by low conductivity estuarine deposits, which are subject to saline intrusion (with the water table). The original plant BRDA was developed directly on this material. The southern BRDA is underlain by limestone bedrock. This section of the BRDA is sealed within 1.0mm and 2.0mm thick HDPE sheets, set out above variable subgrade mineral layers. Seepage control measures in the BRDA consist of the following.
The original northern part of the BRDA was developed over an extensive deposit of low hydraulic conductivity estuarine soil. In addition, the upstream slope of the Main Dike around the stack and the SWP was sealed with a composite liner consisting of a 750 mm thick compacted glacial till fill covered with a 2.0 mm thick HDPE liner anchored in the estuarine soil along the toe of the Main Dike. In addition, all areas along the toes of the Main Dikes where the estuarine soil thickness is less than 4.0 m (applies to the mud stack) or where glacial till or rock outcrop (applies to the SWP) was encountered, were sealed with 2mm thick smooth HDPE liner. All runoff reporting to the open drainage ditch is stored between the Main Dike and the Rockfill Starter Dike (RFSD).
The extended southern area is sealed with 1.0 and 2.0 mm thick smooth and double textured HDPE sheets. Beneath the HDPE sheets, the subgrade consists of a series of mineral varying from 300mm to 600mm thick depending the subgrade. Seepage/Leakage Control Systems The following seepage and leakage control systems are in place: (1) Collection and pumping back to the open perimeter drains all localised concentrated seepage sources around the north west corner of the original mud stack. (2) A leak collector toe drain along the entire length of the existing Main Dike, which forms the western edge of the extended mud stack. Leachate intercepted by the leak collector ditch is routed to a sealed concrete sump from where it is pumped out into the SWP or into the open drainage ditch.
Landfill Gas
There is no landfill gas generated by the placement of the in-organic bauxite residues.

Rusal Aughinish Ltd. Bauxite Residue Disposal Area (BRDA) Operational Plan (BRDA OP001)
Prepared by: P O‟Loughlin Date: 12.10.04
Approval Date:
L Fleming:
Reference No. BRDA Operational Plan
BRDA OP001
Issue 1
Revised by: T Montgomery Date 1.03.09
E Lowe
Page 19 of 26
Rev. 03
10.0 Leachate Management and Disposal
The BRDA does not generate leachate in the conventional sense of the term (as applied to waste disposal) due to: a) The bauxite process residues placed within the BRDA do not degrade and are
inorganic. b) The red mud on placement and maturation has hydraulic conductivity values of the
order of 1x10⁻⁹ m/sec. Accordingly, recharge and downward movement of liquid into the waste (through precipitation) does not occur.
Although there is no positive leachate collection system in place, washout our bleed water from the red mud is collected in the perimeter dyke and returned to the plant for treatment and licensed discharge.

Rusal Aughinish Ltd. Bauxite Residue Disposal Area (BRDA) Operational Plan (BRDA OP001)
Prepared by: P O‟Loughlin Date: 12.10.04
Approval Date:
L Fleming:
Reference No. BRDA Operational Plan
BRDA OP001
Issue 1
Revised by: T Montgomery Date 1.03.09
E Lowe
Page 20 of 26
Rev. 03
11.0 Life Expectancy
The life expectancy of the current Bauxite Residue Disposal Area is approximately 2009, based on current production levels and waste generation as tabulated below. This will be reviewed each year as part of the Annual Environmental Review.
Table 5 Determination of Remaining Capacity
Period MOM* Waste during period (t)
Accumulated waste (t)
Remaining capacity of BRDA (t)
‘83 to '00 R 9,952,703 9,952,703 9,762,404
2001 R 1,110,916 11,063,619 8,651,488
2002 R 1,111,886 12,175,505 7,539,602
2003 R 1,053,818 13,229,323 6,485,784
2004 R 1,077,940 14,307,263 5,407,844
2005 R 1,224,053 15,531,316 4,183,791
2006 R 1,270,270 16,801,586 2,913,520
2007 R 1,221,369 18,022,955 1,692,151
2008 R 1,240,695 19,263,651 451,455
2009 E 855,200 20,118,851 3,108,591**
2010 E 855,200 20,974,051 2,253,391
2011 E 855,200 21,829,251 1,398,191
2012 E 855,200 22,684,451 542,991
*Note: MOM – Method of Measurement; R = Recorded (Measured); E = Engineering Estimate **Note: Increased in capacity of BRDA with increase in height to 32 meters (going from Stage 7 perimeter lift to Stage 10 perimeter lift) following issue of IPPC P0035-04 in 2008.
The original design capacity of the extended BRDA is 23.2 mt, which, at current disposal rates, will be achieved by early 2013.
As the rate of placement is a direct function of production activity, the life expectancy of the BRDA will be reduced with increasing levels of production.

Rusal Aughinish Ltd. Bauxite Residue Disposal Area (BRDA) Operational Plan (BRDA OP001)
Prepared by: P O‟Loughlin Date: 12.10.04
Approval Date:
L Fleming:
Reference No. BRDA Operational Plan
BRDA OP001
Issue 1
Revised by: T Montgomery Date 1.03.09
E Lowe
Page 21 of 26
Rev. 03
12.0 Development Programme As the future of the RUSAL Rusal Aughinish production facility is dependant on available residue storage capacity it is planned to develop the Bauxite Residue Disposal Area to facilitate the continuation of the production process beyond 2013.
The Rusal Aughinish plant is currently involved in two major projects which will underwrite the continuity visibility of the activity into the future. These are:
Construction of 150MW gas fired CHP plant
Plant modernisation to increase production to 1.95mt per annum.
As part of plant modernisation, the company has commenced the development of an extend BRDA through the provision of an additional 78ha.
An application for a revised IPPC Licence will be made to the Agency in order to take account of the extended Bauxite Residue Disposal Area.
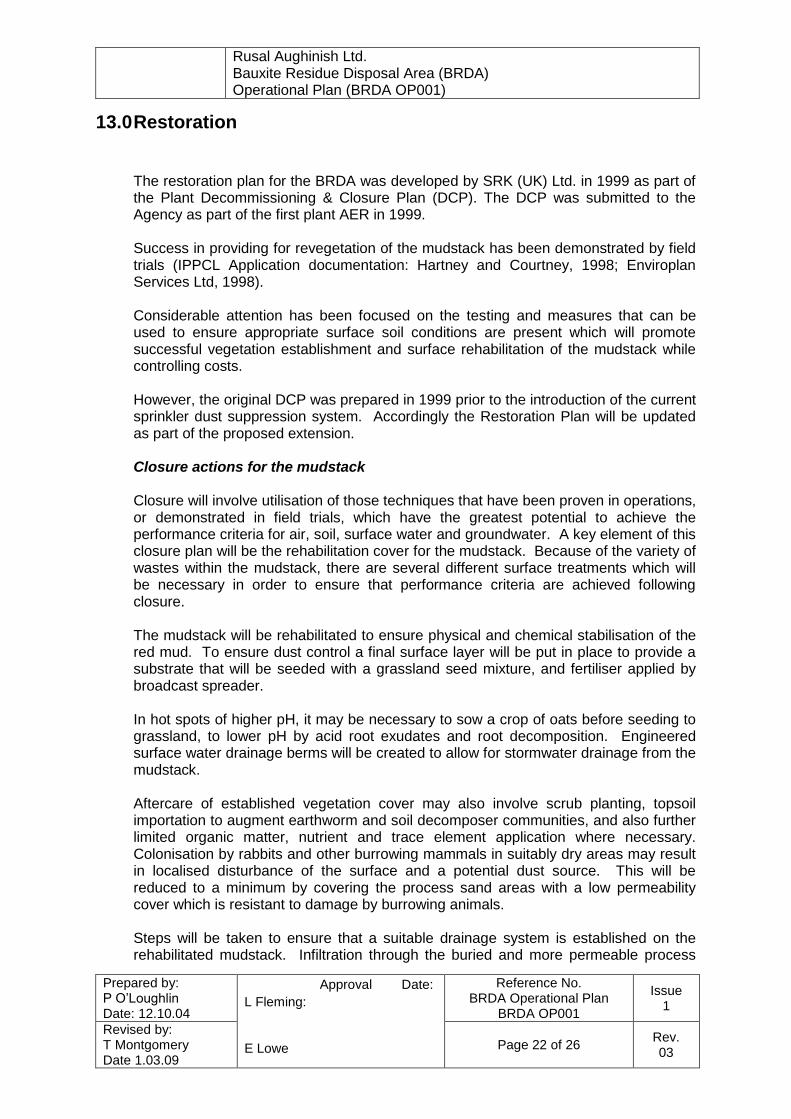
Rusal Aughinish Ltd. Bauxite Residue Disposal Area (BRDA) Operational Plan (BRDA OP001)
Prepared by: P O‟Loughlin Date: 12.10.04
Approval Date:
L Fleming:
Reference No. BRDA Operational Plan
BRDA OP001
Issue 1
Revised by: T Montgomery Date 1.03.09
E Lowe
Page 22 of 26
Rev. 03
13.0 Restoration
The restoration plan for the BRDA was developed by SRK (UK) Ltd. in 1999 as part of the Plant Decommissioning & Closure Plan (DCP). The DCP was submitted to the Agency as part of the first plant AER in 1999. Success in providing for revegetation of the mudstack has been demonstrated by field trials (IPPCL Application documentation: Hartney and Courtney, 1998; Enviroplan Services Ltd, 1998). Considerable attention has been focused on the testing and measures that can be used to ensure appropriate surface soil conditions are present which will promote successful vegetation establishment and surface rehabilitation of the mudstack while controlling costs. However, the original DCP was prepared in 1999 prior to the introduction of the current sprinkler dust suppression system. Accordingly the Restoration Plan will be updated as part of the proposed extension. Closure actions for the mudstack Closure will involve utilisation of those techniques that have been proven in operations, or demonstrated in field trials, which have the greatest potential to achieve the performance criteria for air, soil, surface water and groundwater. A key element of this closure plan will be the rehabilitation cover for the mudstack. Because of the variety of wastes within the mudstack, there are several different surface treatments which will be necessary in order to ensure that performance criteria are achieved following closure. The mudstack will be rehabilitated to ensure physical and chemical stabilisation of the red mud. To ensure dust control a final surface layer will be put in place to provide a substrate that will be seeded with a grassland seed mixture, and fertiliser applied by broadcast spreader. In hot spots of higher pH, it may be necessary to sow a crop of oats before seeding to grassland, to lower pH by acid root exudates and root decomposition. Engineered surface water drainage berms will be created to allow for stormwater drainage from the mudstack. Aftercare of established vegetation cover may also involve scrub planting, topsoil importation to augment earthworm and soil decomposer communities, and also further limited organic matter, nutrient and trace element application where necessary. Colonisation by rabbits and other burrowing mammals in suitably dry areas may result in localised disturbance of the surface and a potential dust source. This will be reduced to a minimum by covering the process sand areas with a low permeability cover which is resistant to damage by burrowing animals. Steps will be taken to ensure that a suitable drainage system is established on the rehabilitated mudstack. Infiltration through the buried and more permeable process

Rusal Aughinish Ltd. Bauxite Residue Disposal Area (BRDA) Operational Plan (BRDA OP001)
Prepared by: P O‟Loughlin Date: 12.10.04
Approval Date:
L Fleming:
Reference No. BRDA Operational Plan
BRDA OP001
Issue 1
Revised by: T Montgomery Date 1.03.09
E Lowe
Page 23 of 26
Rev. 03
wastes (salt cake, process sand, sludges, process solid wastes) will be minimised, by covering all such areas, and in particular the process sand haulway, with a low permeability synthetic cover. Surface disturbance by erosion will be reduced by the installation and long-term maintenance of a lined surface drainage system designed to intercept storm runoff and direct it to optimum discharge. The maintenance of efficient surface water drainage from the mudstack, avoiding as far as possible soil erosion into the peripheral drain, will contribute to the improvement of water quality after closure. With time, it is expected that rainwater flushing, and wet-dry cycles in the surface layers of the mudstack, will improve water quality so that runoff and seepage can be discharged without treatment. Interim Restoration As part of the extension of the BRDA, an interim restoration plan will be put in place to provide for intermediate cover of the embankment slopes as the height of the area is increased. This will be achieved in two phases as follows. Interim restoration will involve the stepping back of the seventh lift (Stage 7) into the BRDA to create a level area between Stage 6 and 7. The area from the embankment at the existing perimeter dike to the top of Stage 6 embankment will be filled and grassed (See Figure 1 below).
Figure 1 BRDA Cross Section showing pre and post interim restoration
Phases

Rusal Aughinish Ltd. Bauxite Residue Disposal Area (BRDA) Operational Plan (BRDA OP001)
Prepared by: P O‟Loughlin Date: 12.10.04
Approval Date:
L Fleming:
Reference No. BRDA Operational Plan
BRDA OP001
Issue 1
Revised by: T Montgomery Date 1.03.09
E Lowe
Page 24 of 26
Rev. 03
A series of drainage channels will be installed to traverse (perpendicularly) the grassed perimeter stages to provide for formalized surface water runoff from Stage 7 onwards to the main perimeter dike. As the BRDA is developed, the perimeter embankments between Stage 7 to 10 will be exposed pending completion of the restoration, which will involve grassing of the remaining perimeter embankments and the BRDA surface (Figure 2).
Figure 2 BRDA Cross Section showing post interim- and total-restoration
Phases
The detailed design and specification for implementation of Phase 1 and 2 of the extended BRDA restoration plan will be submitted to the Agency as part of the Application for Review of the IPPC Licence in 2005. This Plan will supercede the section of the original Decommissioning and Closure Plan (DCP) prepared in 1999.

Rusal Aughinish Ltd. Bauxite Residue Disposal Area (BRDA) Operational Plan (BRDA OP001)
Prepared by: P O‟Loughlin Date: 12.10.04
Approval Date:
L Fleming:
Reference No. BRDA Operational Plan
BRDA OP001
Issue 1
Revised by: T Montgomery Date 1.03.09
E Lowe
Page 25 of 26
Rev. 03
14.0 Aftercare Management Nature Conservation The existing Bird & Butterfly sanctuary is adjacent to the north side of the existing BRDA. The bird sanctuary management has been featured and reported on by organisations such as the Irish Wildbird Conservancy since it‟s development in 1981. Accordingly, there is an existing nature conservation focus in the vicinity of the BRDA. The ongoing management, and possible enhancement, of the existing bird sanctuary will be examined in the after use policy for the restored BRDA. Amenity Restoration
The eastern sides of the BRDA have a network of nature trails starting from the Rusal Aughinish Ltd sports centre complex. Joggers, walkers and sightseers use these amenity features. The ecological features viewed from these trails include some woodland, fernland, and the tidal Poulaweala Creek that includes a bird hide to observe the intertidal bird environment.

Rusal Aughinish Ltd. Bauxite Residue Disposal Area (BRDA) Operational Plan (BRDA OP001)
Prepared by: P O‟Loughlin Date: 12.10.04
Approval Date:
L Fleming:
Reference No. BRDA Operational Plan
BRDA OP001
Issue 1
Revised by: T Montgomery Date 1.03.09
E Lowe
Page 26 of 26
Rev. 03
15.0 Environmental Monitoring Programme RUSAL AUGHINISH undertake extensive monitoring of environmental quality (air, water, groundwater, dust and noise) in the vicinity of both the plant and Bauxite Residue Disposal Area (BRDA). This monitoring, which is undertaken by qualified and experienced Environmental Technicians is detailed in SWM0003_IPPCL Compliance Monitoring. SWM0003 deals with the BRDA specifically through measurement of: Table 6 Environmental Monitoring Environmental Media
Monitoring Location Analysis Undertaken
Frequency
Surface Water OPW Channel Mangans Lough South Drain
pH, Conductivity, Soda
Monthly
Groundwater BRDA Observation Wells (OW‟s) (19 No)
pH, Conductivity, Total Alkalinity, F, Cl, Cu, Ni, Pb, Hq, Zn, Cd, Co, Ca, Mg, Na, Ag, Al, Fe, SO4, T?s
Monthly
Air – Fugitive Dust 7 No. Gauges at perimeter of BRDA
Dust Deposition Monthly
Air – Noise North Shore (B5), East of East Ridge (B4)
Sound Pressure Level, LAEQ, LA10, LA90
Annually
Waste Red Mud, Sand, Salt Cake, Leachate
pH, Dry Matter, Alkalinity, Cl, F1, Soda
Monthly
In addition to the above, RUSAL AUGHINISH maintain a weather station between the plant and the BRDA for measurement of wind speed, direction and temperature. This data is fed back to the plant Process Information (PI) System. Recorded data is used for historical look back purposes and in incident investigation.
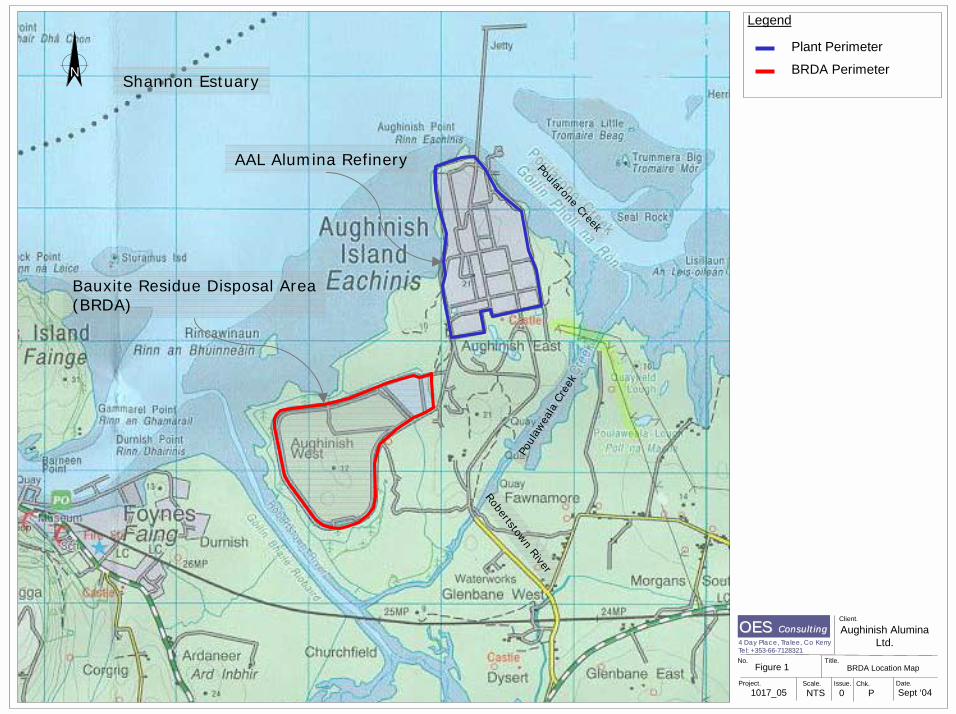
N
Bauxite Residue Disposal Area(BRDA)
Robertstown River
Poul
awea
la C
reek
Poularone Creek
Shannon Estuary
No.
Scale. Issue. Chk. Date.
Title.BRDA Location MapFigure 1
1017_05 NTS P0 Sept ‘04
Aughinish Alumina
Ltd.4 Day Place, 4 Day Place, TraleeTralee, Co Kerry, Co KerryTel: +353Tel: +353--6666--7128321 7128321
Project.
Client.
OES OES ConsultingConsulting
AAL Alumina Refinery
Legend
Plant Perimeter
BRDA Perimeter

N
Bauxite Residue Disposal Area(BRDA)
Robertstown River
Shannon Estuary
No.
Scale. Issue. Chk. Date.
Title.Plan of BRDAFigure 2
1017_05 NTS P0 Sept ‘04
Aughinish Alumina
Ltd.4 Day Place,4 Day Place, TraleeTralee, Co Kerry, Co KerryTel: +353Tel: +353--6666--7128321 7128321
Project.
Client.
OES OES ConsultingConsulting
Storm Water Pond
(SWP)
Liquid Waste
Pond (LWP)
Legend
BRDA Perimeter
(Active area)
Main Perimeter Dike
Access Roads

N
Bauxite Residue Disposal Area(BRDA)
Robertstown River
Shannon Estuary
No.
Scale. Issue. Chk. Date.
Title.Monitoring LocationsFigure 3
1017_05 NTS P0 Sept ‘04
Aughinish Alumina
Ltd.4 Day Place, Tralee, Co Kerry4 Day Place, Tralee, Co KerryTel: +353Tel: +353--6666--7128321 7128321
Project.
Client.
OES OES ConsultingConsulting
Storm Water Pond
(SWP)
Liquid Waste
Pond (LWP)
Legend
BRDA Perimeter
(Active area)
Main Perimeter Dike
Access Roads
Observation Well(s)
Deposition Gauge
DG 5OW 1,2, 20DG 6
DG 7
DG 8
OW 11,12,
22
OW9&10
OW7, 8, 23DG 9
DG 10
OW 18, 19
OW 16, 17 DG 11
OW 21
South BRDA
Drain
Note
OW13, 14, 15 to east of BRDA (off map)
DG 12, 13, 14 to east of BRDA (off map)

Aughinish Alumina Ltd. March 2010 AER 2009
Attachment 10 AER/PRTR Emissions Data Information

This page is intentionally blank

| PRTR# : P0035 | Facility Name : Aughinish Alumina Limited | Filename :
P0035_2009 PRTR.xls | Return Year : 2009 | 3013 13/04/2010 15:40
Version 1.1.10
REFERENCE YEAR 2009
1. FACILITY IDENTIFICATION
Parent Company Name Aughinish Alumina Limited
Facility Name Aughinish Alumina Limited
PRTR Identification Number P0035
Licence Number P0035-04
Waste or IPPC Classes of Activity
No. class_name
5.13(e)
non-metals, metal oxides or other inorganic compounds such as
calcium carbide, silicon, silicon carbide
11.1 ######################################################
2.1
The operation of combustion installations with a rated thermal input
equal to or greater than 50MW
Address 1 Aughinish Island
Address 2 Askeaton
Address 3 County Limerick
Address 4
Country Ireland
Coordinates of Location -9.05988 52.6247
River Basin District IEGBNISH
NACE Code 2442
Main Economic Activity Aluminium production
AER Returns Contact Name Eoin Brennan
AER Returns Contact Email Address [email protected]
AER Returns Contact Position Environmental Engineer
AER Returns Contact Telephone Number 061-604000 / 604437 (Direct)
AER Returns Contact Mobile Phone Number
AER Returns Contact Fax Number 061604074
Production Volume 0.0
Production Volume Units
Number of Installations 0
Number of Operating Hours in Year 0
Number of Employees 0
User Feedback/Comments
Web Address
2. PRTR CLASS ACTIVITIES
Activity Number Activity Name
4(b)(v)
Non-metals, metal oxides or other inorganic compounds such as
calcium carbide, silicon, silicon carbide
1(c) Thermal power stations and other combustion installations
5(d) Landfills
3. SOLVENTS REGULATIONS (S.I. No. 543 of 2002)
Is it applicable? No
Have you been granted an exemption ?
If applicable which activity class applies (as per
Schedule 2 of the regulations) ?
Is the reduction scheme compliance route being
used ?
AER Returns Worksheet
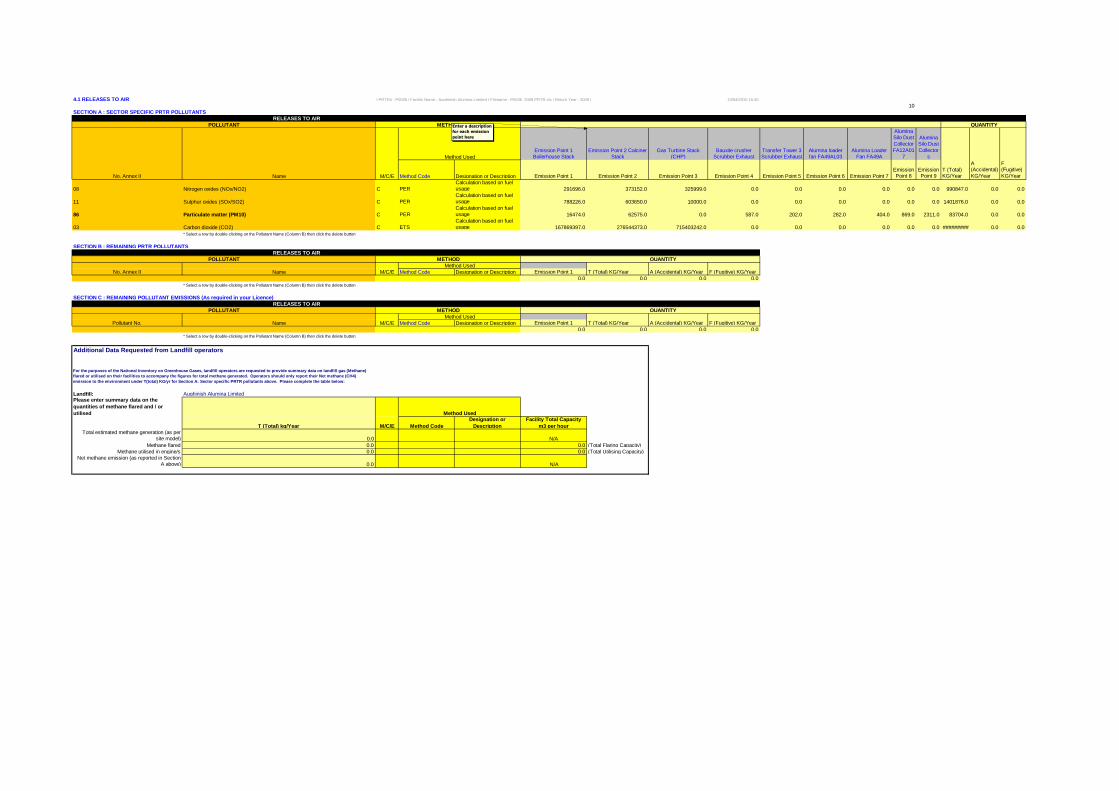
4.1 RELEASES TO AIR | PRTR# : P0035 | Facility Name : Aughinish Alumina Limited | Filename : P0035_2009 PRTR.xls | Return Year : 2009 | 13/04/2010 15:40
8 11 19 19 27 27 6 14 6 6 6 6 10
SECTION A : SECTOR SPECIFIC PRTR POLLUTANTS
QUANTITY
Emission Point 1
Boilerhouse Stack
Emission Point 2 Calciner
Stack
Gas Turbine Stack
(CHP)
Bauxite crusher
Scrubber Exhaust
Transfer Tower 3
Scrubber Exhaust
Alumina loader
fan FA49AL03
Alumina Loader
Fan FA49A
Alumina
Silo Dust
Collector
FA12A01
7
Alumina
Silo Dust
Collector
s
No. Annex II Name M/C/E Method Code Designation or Description Emission Point 1 Emission Point 2 Emission Point 3 Emission Point 4 Emission Point 5 Emission Point 6 Emission Point 7
Emission
Point 8
Emission
Point 9
T (Total)
KG/Year
A
(Accidental)
KG/Year
F
(Fugitive)
KG/Year
08 Nitrogen oxides (NOx/NO2) C PER
Calculation based on fuel
usage 291696.0 373152.0 325999.0 0.0 0.0 0.0 0.0 0.0 0.0 990847.0 0.0 0.0
11 Sulphur oxides (SOx/SO2) C PER
Calculation based on fuel
usage 788226.0 603650.0 10000.0 0.0 0.0 0.0 0.0 0.0 0.0 1401876.0 0.0 0.0
86 Particulate matter (PM10) C PER
Calculation based on fuel
usage 16474.0 62575.0 0.0 587.0 202.0 282.0 404.0 869.0 2311.0 83704.0 0.0 0.0
03 Carbon dioxide (CO2) C ETS
Calculation based on fuel
usage 167869397.0 276544373.0 715403242.0 0.0 0.0 0.0 0.0 0.0 0.0 ######### 0.0 0.0
* Select a row by double-clicking on the Pollutant Name (Column B) then click the delete button
SECTION B : REMAINING PRTR POLLUTANTS
QUANTITY
No. Annex II Name M/C/E Method Code Designation or Description Emission Point 1 T (Total) KG/Year A (Accidental) KG/Year F (Fugitive) KG/Year
0.0 0.0 0.0 0.0
* Select a row by double-clicking on the Pollutant Name (Column B) then click the delete button
SECTION C : REMAINING POLLUTANT EMISSIONS (As required in your Licence)
QUANTITY
Pollutant No. Name M/C/E Method Code Designation or Description Emission Point 1 T (Total) KG/Year A (Accidental) KG/Year F (Fugitive) KG/Year
0.0 0.0 0.0 0.0
* Select a row by double-clicking on the Pollutant Name (Column B) then click the delete button
Additional Data Requested from Landfill operators
Landfill: Aughinish Alumina LimitedPlease enter summary data on the
quantities of methane flared and / or
utilised
additional_pollutant_no T (Total) kg/Year M/C/E Method Code
Designation or
Description
Facility Total Capacity
m3 per hour
Total estimated methane generation (as per
site model) 0.0 N/A
Methane flared 0.0 0.0 (Total Flaring Capacity)
Methane utilised in engine/s 0.0 0.0 (Total Utilising Capacity)
Net methane emission (as reported in Section
A above) 0.0 N/A
RELEASES TO AIR
POLLUTANT METHOD
Method Used
POLLUTANT
RELEASES TO AIR
RELEASES TO AIR
METHOD
POLLUTANT METHOD
Method Used
For the purposes of the National Inventory on Greenhouse Gases, landfill operators are requested to provide summary data on landfill gas (Methane)
flared or utilised on their facilities to accompany the figures for total methane generated. Operators should only report their Net methane (CH4)
emission to the environment under T(total) KG/yr for Section A: Sector specific PRTR pollutants above. Please complete the table below:
Method Used
Method Used
Enter a description
for each emission
point here

4.2 RELEASES TO WATERS | PRTR# : P0035 | Facility Name : Aughinish Alumina Limited | Filename : P0035_2009 PRTR.xls | Return Year : 2009 | 13/04/2010 15:49
8 8 16 16 24 26 6 6 6 6 6 7
SECTION A : SECTOR SPECIFIC PRTR POLLUTANTS Data on ambient monitoring of storm/surface water or groundwater, conducted as part of your licence requirements, should NOT be submitted under AER / PRTR Reporting as this only concerns Releases from your facility
QUANTITY
No. Annex II Name M/C/E Method Code Designation or Description Emission Point 1 T (Total) KG/Year A (Accidental) KG/Year F (Fugitive) KG/Year
0.0 0.0 0.0 0.0
* Select a row by double-clicking on the Pollutant Name (Column B) then click the delete button
SECTION B : REMAINING PRTR POLLUTANTS
QUANTITY
No. Annex II Name M/C/E Method Code Designation or Description Emission Point 1 T (Total) KG/Year A (Accidental) KG/Year F (Fugitive) KG/Year
0.0 0.0 0.0 0.0
* Select a row by double-clicking on the Pollutant Name (Column B) then click the delete button
SECTION C : REMAINING POLLUTANT EMISSIONS (as required in your Licence)
QUANTITY
Pollutant No. Name M/C/E Method Code Designation or Description Emission Point 1 Emission Point 2 T (Total) KG/Year
A (Accidental)
KG/Year
F
(Fugitive)
KG/Year
303 BOD M Other
APHA SMEW & WW
5210B 323645.0 105.0 323750.0 0.0 0.0
314 Fats, Oils and Greases M Other
APHA SMEW & WW
5520D 13955.0 0.0 13955.0 0.0 0.0
240 Suspended Solids M PER
APHA SMEW & WW
2540D 34105.0 146.0 34251.0 0.0 0.0
* Select a row by double-clicking on the Pollutant Name (Column B) then click the delete button
RELEASES TO WATERS
Method Used
RELEASES TO WATERS
RELEASES TO WATERS
Method Used
POLLUTANT
Method Used
POLLUTANT
POLLUTANT
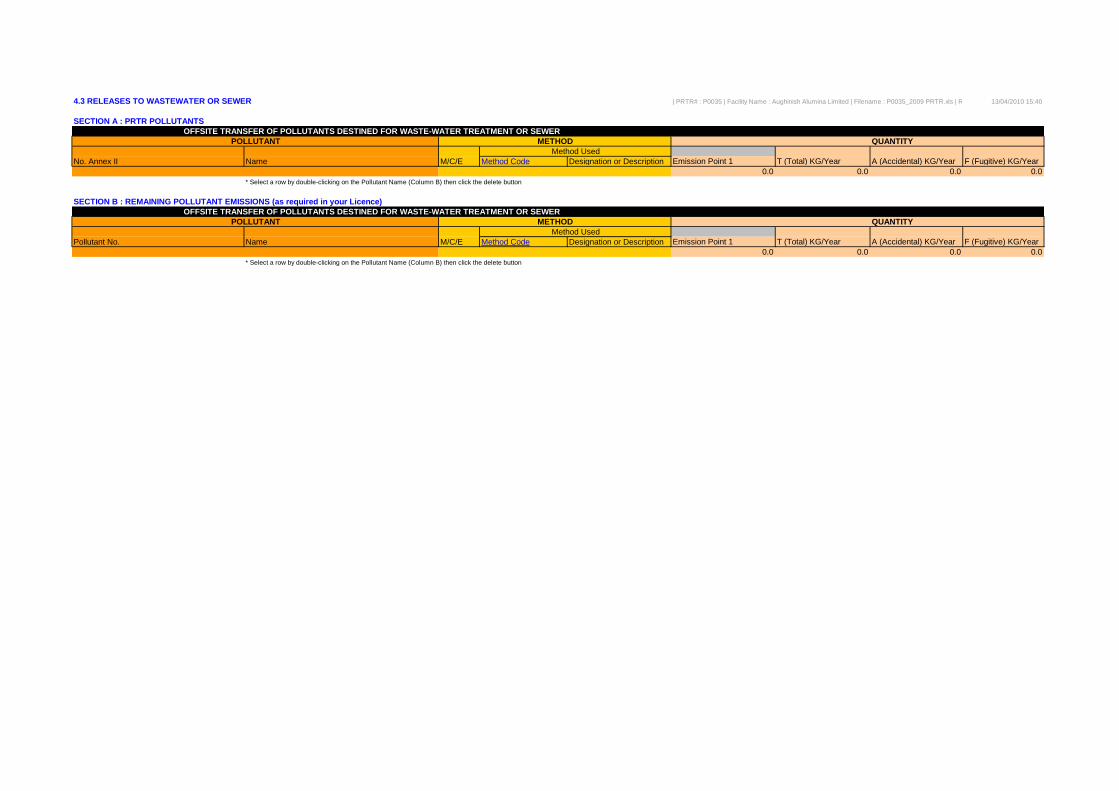
4.3 RELEASES TO WASTEWATER OR SEWER | PRTR# : P0035 | Facility Name : Aughinish Alumina Limited | Filename : P0035_2009 PRTR.xls | Return Year : 2009 |13/04/2010 15:40
8 8 16 16 6 6 6 6
SECTION A : PRTR POLLUTANTS
QUANTITY
No. Annex II Name M/C/E Method Code Designation or Description Emission Point 1 T (Total) KG/Year A (Accidental) KG/Year F (Fugitive) KG/Year
0.0 0.0 0.0 0.0
* Select a row by double-clicking on the Pollutant Name (Column B) then click the delete button
SECTION B : REMAINING POLLUTANT EMISSIONS (as required in your Licence)
QUANTITY
Pollutant No. Name M/C/E Method Code Designation or Description Emission Point 1 T (Total) KG/Year A (Accidental) KG/Year F (Fugitive) KG/Year
0.0 0.0 0.0 0.0
* Select a row by double-clicking on the Pollutant Name (Column B) then click the delete button
OFFSITE TRANSFER OF POLLUTANTS DESTINED FOR WASTE-WATER TREATMENT OR SEWER
OFFSITE TRANSFER OF POLLUTANTS DESTINED FOR WASTE-WATER TREATMENT OR SEWER
Method Used
Method Used
POLLUTANT METHOD
POLLUTANT METHOD

5. ONSITE TREATMENT & OFFSITE TRANSFERS OF WASTE | PRTR# : P0035 | Facility Name : Aughinish Alumina Limited | Filename : P0035_2009 PRTR.xls | Return Year : 2009 | 13/04/2010 15:40
5 29 26
Quantity
(Tonnes per
Year)
Haz Waste : Name and
Licence/Permit No of Next
Destination Facility Non
Haz Waste: Name and
Licence/Permit No of
Recover/Disposer
Haz Waste : Address of Next
Destination Facility
Non Haz Waste: Address of
Recover/Disposer
Name and License / Permit No. and
Address of Final Recoverer /
Disposer (HAZARDOUS WASTE
ONLY)
Actual Address of Final Destination
i.e. Final Recovery / Disposal Site
(HAZARDOUS WASTE ONLY)
Transfer Destination
European Waste
Code Hazardous Quantity T/Year Description of Waste
Waste
Treatment
Operation M/C/E Method Used
Location of
Treatment Name and Licence / Permit No. of Recoverer / Disposer / Broker Address of Recoverer / Disposer / Broker Name and Address of Final Destination i.e. Final Recovery / Disposal Site (HAZARDOUS WASTE ONLY) Licence / Permit No. of Final Destination i.e. Final Recovery / Disposal Site (HAZARDOUS WASTE ONLY)
To Other Countries 17 06 01 Yes 29.7 Insulation materials containing asbestos D1 M Weighed Abroad
Rilta Environmental Ltd
,W0192-03
Block 402 Grant's
Drive,Greenogue Business
Park,Rathcoole ,County
Dublin,Ireland
Buhck GMBH,EG0019
issued by
Entsorgungsfachbetreub,215
02 Weirshop,Sudring
38,21463
Wentorf,Wentorf,Germany
21502 Weirshop,Sudring
38,21463
Wentorf,Wentorf,Germany
Within the Country 16 06 01 Yes 1.0 Lead acid batteries R4 C Weighed Offsite in Ireland
Returnbatt Ltd,EPA Waste
Licence Reg No 105-1
Unit A Old Mill Ind Estate
,Old Milltown ,Kill,Co
Kildare.,Ireland
Returnbatt Ltd.,EPA Waste
Licence Reg No 105-1,Unit
A ,Old Mill Industrial
Estate,Old Milltown,Kill Co.
Kildare,Ireland
Unit A ,Old Mill Industrial
Estate,Old Milltown,Kill Co.
Kildare,Ireland
Within the Country 13 02 06 Yes 48.9 Waste Oil (heavy gear) R9 M Volume Calculation Offsite in Ireland
Atlas Environmental Ireland
Ltd.,EPA Waste Licence
Reg No 184-1
Clonminam Industrial
Estate,.,Portlaoise ,Co
Laois.,Ireland
Atlas Environmental Ireland
Ltd,EPA Waste Licence Reg
No 184-1,Clonminam
Industrial
Estate,.,Portlaoise,Co
Laois,Ireland
Clonminam Industrial
Estate,.,Portlaoise,Co
Laois,Ireland
Within the Country 20 01 21 Yes 0.16 Flourescent & Discharge Tubes R4 C Volume Calculation Offsite in Ireland
Irish Lamp Recycling
Ltd.,Kildare County Council
02/2000A
.,Kilkenny Road,Athy ,Co.
Kildare,Ireland
Irish Lamp Recycling Ltd.
,Kildare County Council
02/2000A,.,Kilkenny
Road,Athy ,Co
Kildare.,Ireland
.,Kilkenny Road,Athy ,Co
Kildare.,Ireland
Within the Country 16 07 08 Yes 3.8 Empty Oil Drums R4 C Weighed Offsite in Ireland
Atlas Environmental Ireland
Ltd.,EPA Waste Licence
Reg No 184-1
Clonminam Industrial
Estate,.,Portlaoise ,Co
Laois.,Ireland
Atlas Environmental Ireland
Ltd,EPA Waste Licence Reg
No 184-1,Clonminam
Industrial
Estate,.,Portlaoise,Co
Laois,Ireland
Clonminam Industrial
Estate,.,Portlaoise,Co
Laois,Ireland
Within the Country 01 03 07 Yes 15238.0 Salt cake (process residue) D1 C Volume Calculation Onsite in Ireland
Aughinish Alumina,IPPC
P0035-04
.,.,Askeaton,Co.
Limerick,Ireland
Aughinish Alumina,IPPC
P0035-04,.,.,Askeaton,Co.
Limerick,Ireland
.,.,Askeaton,Co.
Limerick,Ireland
Within the Country 20 03 01 No 120.38 Municiple Waste D1 M Weighed Offsite in Ireland
Veolia Environmental
Services,W0082.2
.,Dock Road,Limerick,Co.
Limerick,Ireland
Within the Country 01 03 99 No 4371.0 Lime Grits D1 C Volume Calculation Onsite in Ireland
Aughinish Alumina,IPPC
P0035-04
.,.,Askeaton,Co.
Limerick,Ireland
Within the Country 20 01 39 No 18.2 Plastic containers R11 C Volume Calculation Offsite in Ireland
Rilta Environmental Ltd
,W0192-03
Block 402 Grant's
Drive,Greenogue Business
Park,Rathcoole ,County
Dublin,Ireland
Within the Country 01 03 99 No 92398.0 Process Waste (Sand, Scale etc) D1 C Volume Calculation Onsite in Ireland
Aughinish Alumina,IPPC
P0035-04
.,.,Askeaton,Co.
Limerick,Ireland
Within the Country 01 03 99 No 882876.0 Red Mud D1 C Volume Calculation Onsite in Ireland
Aughinish Alumina,IPPC
P0035-04
.,.,Askeaton,Co.
Limerick,Ireland
Within the Country 10 01 99 No 110.0 Refractory D1 C Volume Calculation Onsite in Ireland
Aughinish Alumina,IPPC
P0035-04
.,.,Askeaton,Co.
Limerick,Ireland
Within the Country 19 08 05 No 455.0 Sanitary Effluent Sludge D1 C Volume Calculation Onsite in Ireland
Aughinish Alumina,IPPC
P0035-04
.,.,Askeaton,Co.
Limerick,Ireland
To Other Countries 17 04 07 No 326.9 Scrap Metal R4 M Weighed Abroad
Hegarty Metals
Recycling,Limerick County
Council WP05-04
Ballysimon
Road,.,Limerick,Co.
Limerick,Ireland
Within the Country 16 01 03 No 0.89 Tyres (used) R11 C Volume Calculation Offsite in Ireland R Quinn,WCP/LK/255/05b
.,.,Clarina,Co.
Limerick,Ireland
Within the Country 20 01 38 No 21.78 Wood (recycled) R3 M Weighed Offsite in Ireland
Veolia Environmental
Services,W0082.2
.,Dock Road,Limerick,Co.
Limerick,Ireland
Within the Country 20 01 38 No 14.6 Wood Landfilled D1 M Weighed Offsite in Ireland
Veolia Environmental
Services,W0082.2
.,Dock Road,Limerick,Co.
Limerick,Ireland
Within the Country 20 01 99 No 12.92 Used Hosing R11 M Weighed Offsite in Ireland
Veolia Environmental
Services,W0082.2
.,Dock Road,Limerick,Co.
Limerick,Ireland
Method Used

Within the Country 20 01 01 No 9.4 Cardboard R3 M Weighed Offsite in Ireland
Veolia Environmental
Services,W0082.2
.,Dock Road,Limerick,Co.
Limerick,Ireland
Within the Country 20 01 99 No 12.9 Used Belting R11 M Weighed Offsite in Ireland McNamara Enterprises Ltd,.
Clondrinagh Industrial
Park,Ennis
Road,Limerick,Co.
Limerick,Ireland
Within the Country 09 01 07 No 0.665 Xray Fixer Replinisher & film R4 C Volume Calculation Offsite in Ireland Silver Lining ,W0122-01
Unit 61 ,Cookstown
Industrial Estate ,Tallaght
,Dublin 24,Ireland
Within the Country 18 01 04 No 0.036 Clinical Waste D1 C Volume Calculation Offsite in Ireland Transafe,CW011
Unit 4A,Beach Court,
Kilcoole,Co. Wicklow,Ireland
Within the Country 20 01 38 No 2.8 Timber Reels (used) R11 C Weighed Offsite in Ireland Hegarty Hammond,.
.,Tipperary Rd
,Limerick,County
Limerick,Ireland
Within the Country 16 01 07 Yes 0.005 Oil Filters R9 C Weighed Offsite in Ireland
Atlas Environmental Ireland
Ltd.,EPA Waste Licence
Reg No 184-1
Clonminam Industrial
Estate,.,Portlaoise ,Co
Laois.,Ireland
Atlas Environmental Ireland
Ltd,EPA Waste Licence Reg
No 184-1,Clonminam
Industrial
Estate,.,Portlaoise,Co
Laois,Ireland
Clonminam Industrial
Estate,.,Portlaoise,Co
Laois,Ireland
* Select a row by double-clicking the Description of Waste then click the delete button


