Augmented sensitivity of anIR-absorption gas sensor employing a
metal hole array
Yoshiaki Nishijima,1,∗ Yuta Adachi,1 Lorenzo Rosa,2,3 andSaulius Juodkazis2,3,4
1Department of Electrical and Computer Engineering, Graduate School of Engineering,Yokohama National University, 79-5 Tokiwadai, Hodogaya-ku, Yokohama 240-8501, Japan
2Centre for Micro-Photonics, Faculty of Engineering and Industrial Sciences, SwinburneUniversity of Technology, Hawthorn, VIC 3122, Australia
3The Australian National Fabrication Facility - ANFF, Victoria node, Faculty of Engineeringand Industrial Sciences, Swinburne University of Technology, Hawthorn, VIC, 3122, Australia
Abstract: We demonstrate the use of plasmonic extraordinary transmis-sion at IR wavelengths for surface-enhanced infrared absorption (SEIRA)spectroscopy in gas sensing. Gas detection was performed through non-dispersive infrared (NDIR) absorption. The sensitivity of SF6 gas detectionis increased around ∼27 times with metal hole array (MHA) microstructuresplaced on the gas cell mirrors, as compared with non-structured mirrors;an absorption change of 2% per 100 ppm was obtained on a standardcommercial pyroelectric detector. Down-sizing of IR-sensors to a sub-1 mmgas cell width, delivering ∼ 40 nM (or 1 ppm) of SF6 sensitivity, can beforeseen with a simple source-detector setup.
References and links1. S. Kumar, J. Huang, J. R. Cushnir, P. Spanel, D. Smith, and G. B. Hanna, “Selected ion flow tube-MS analysis of
headspace vapor from gastric content for the diagnosis of gastro-exophageal cancer,” Anal. Chem. 84, 9550–9557(2012).
2. M. Ueda, N. Teshima, and T. Sakai, “Development of formaldehyde standard gas generator based on gravitationaldispensing-vaporization and its application to breath formaldehyde determination,” Bunseki Kagaku 57, 605–612(2008).
3. M. Zhang, H. C. Su, Y. Rheem, C. M. Hangarter, and N. V. Myung, “A rapid room-temperature NO2 sensor basedon tellurium-SWNT hybrid nanostructures,” J. Phys. Chem. C 116, 20067–20074 (2012).
4. J. Hodgkinson, R. Smith, W. O. Hob, J. R. Saffell, and R. Tatam, “A low cost, optically efficient carbon dioxidesensor based on nondispersive infra-red (NDIR) measurement at 4.2 mm,” Proc. SPIE 8439, 843919 (2012).
5. N. Ohta, K. Nomura, and I. Yagi, “Electrochemical modification of surface morphology of Au/Ti bilayer filmsdeposited on a Si prism for in situ surface-enhanced infrared absorption (SEIRA) spectroscopy,” Langmuir 26,18097–18104 (2010).
6. H. Miyatake, E. Hosono, M. Osawa, and T. Okada, “Surface-enhanced infrared absorption spectroscopy usingchemically deposited Pd thin film electrodes,” Chem. Phys. Lett. 428, 451–456 (2006).
7. H. Aouani, H. Sipova, M. Rahmani, M. Navarro-Cia, K. Hegnerova, J. Homola, M. Hong, and S. A. Maier,“Ultrasensitive broadband probing of molecular vibrational modes with multifrequency optical antennas,” ACSNano 1, 669–675 (2013).
8. Y. Nishijima, H. Nigorinuma, L. Rosa, and S. Juodkazis, “Selective enhancement of infrared absorption withmetal hole arrays,” Opt. Mater. Express 2, 1367–1377 (2012).
#187633 - $15.00 USD Received 25 Mar 2013; revised 26 May 2013; accepted 29 May 2013; published 13 Jun 2013(C) 2013 OSA 1 July 2013 | Vol. 3, No. 7 | DOI:10.1364/OME.3.000968 | OPTICAL MATERIALS EXPRESS 968
9. T. W. Ebbesen, H. J. Lezec, H. F. Ghaemi, T. Thio, and P. A. Wolff, “Extraordinary optical transmission throughsub-wavelength hole arrays,” Nature 351, 667–669 (1998).
10. C. Genet and T. W. Ebbesen, “Light in tiny holes,” Nature 445, 39–46 (2007).11. E. Popov, M. Neviere, S. Enoch, and R. Reinisc, “Theory of light transmission through subwavelength periodic
hole arrays,” Phys. Rev. B 62, 16100–16108 (2000).12. T. Rindzevicius, Y. Alaverdyan, A. Dahlin, F. Hook, D. S. Sutherland, and M. Kall, “Plasmonic sensing charac-
teristics of single nanometric holes,” Nano Lett. 5, 2335–2339 (2005).13. A. Degiron, H. J. Lezec, N. Yamamoto, and T. W. Ebbesen, “Optical transmission properties of a single sub-
wavelength aperture in a real metal,” Opt. Commun. 239, 61–66 (2004).14. H. Rigneault, J. Capoulade, J. Dintinger, J. Wegner, N. Bonod, E. Popov, T. W. Ebbesen, and P. F. Lenne, “En-
hancement of single-molecule fluorescence detection in subwavelength apertures,” Phys. Rev. Lett. 95, 117401(2005).
15. J. G. Rivas, C. Schotsch, P. H. Bolivar, and H. Kurz, “Enhanced transmission of THz radiation through subwave-length holes,” Phys. Rev. B 68, 201306 (2003).
16. P. Forster, V. Ramaswamy, P. Artaxo, T. Berntsen, R. Betts, D. W. Fahey, J. Haywood, J. Lean, D. C. Lowe, G.Myhre, J. Nganga, R. Prinn, G. Raga, M. Schltz, and R. Van Dorland, “Changes in atmospheric constituents andin radiative forcing,” in Climate Change 2007: The Physical Science Basis. Contribution of Working Group Ito the 4th Assessment Report of the Intergovernmental Panel on Climate Change (Cambridge University Press,2007).
17. T. Thio, H. F. Ghaemi, H. J. Lezec, P. A. Wolff, and T. W. Ebbesen, “Surface-plasmon-enhanced transmissionthrough hole arrays in Cr films,” J. Opt. Soc. Am. B 16, 1743–1748 (1999).
18. G. Gervinskas, D. Day, and S. Juodkazis, “High-precision interferometric monitoring of polymer swelling usinga simple optofluidic sensor,” Sens. Actuators B 159, 39–43 (2011).
19. M. L. Kurth and D. K. Gramotnev, “Nanofluidic delivery of molecules: integrated plasmonic sensing withnanoholes,” Microfluid. Nanofluid. 14, 743–751 (2013).
20. A. Chou, E. Jaatinen, R. Buividas, G. Seniutinas, S. Juodkazis, E. L. Izake, and P. M. Fredericks, ”SERS substratefor detection of explosives,” Nanoscale 4, 7419–7424 (2012).
1. Introduction
Gas detection is an important field of analytical chemistry, where high sensitivity and selectivityare sought after for qualitative and quantitative analysis. In the field of medical gas sensing fromexhalation, bio-markers of disease can be detected without any medical intervention [1, 2]. Incase of environmental sensing in landfills, detection of greenhouse effect gases, exhaust fumesfrom cars, monitoring of industrial processes, the gases concentration should be monitored con-tinuously in real time with 1 ppm precision or better [3]. The non-dispersive infrared (NDIR)absorption method is widely used for gas sensing, because of its simplicity and high sensitiv-ity [4]. NDIR is based on the single-wavelength detection of a molecular vibrational mode;however, because of the small extinction cross-sections of these modes, a long optical path (ina gas cell) is required, and sensors become relatively large or require optical folding of the lightpath. We have already demonstrated surface-enhanced infrared absorption (SEIRA [5–7]) withmetal hole array (MHA) micro-structures for azo-benzene sensing by spin-coating of the ana-lyte [8]. A strong absorption enhancement appeared on the transmission peaks, and the effectivemolecular absorption cross-section was increased approximately 10×, due to the electromag-netic field enhancement at the rim of the MHA holes in a spectrally narrow window of 10-20cm−1 bandpass. An even higher sensitivity would be expected in the case of gas sensing ona non-specific metal surface where chemosorption is not taking place. This was predicted bysimulations [8] showing that up to 40× enhancement exists inside the MHA holes at the Si-Ag interface, and constitutes the IR version of the extraordinary transmission demonstrated atvisible wavelengths [9–15].
In this study, we demonstrate the application of MHAs to gas sensing of a single-wavelengthsignature vibration mode. The SF6 gas, which has one of the most powerful green house effects,and is heavily used in Si processing including solar cells, was chosen for this study (its 100-yearimpact in terms of global warming potential, using CO2 as a reference, is 22800, as comparedwith methane at 25 and water at 298 [16]). The light source and detector are comparatively
#187633 - $15.00 USD Received 25 Mar 2013; revised 26 May 2013; accepted 29 May 2013; published 13 Jun 2013(C) 2013 OSA 1 July 2013 | Vol. 3, No. 7 | DOI:10.1364/OME.3.000968 | OPTICAL MATERIALS EXPRESS 969
inexpensive standard commercial devices already designed for SF6 monitoring; we use themtogether with our custom-designed gas cell, whose windows were made from Si plates carryingMHAs.
2. Experimental
The fabrication of the designed MHA, having nano-to-micro-sized holes with specific spatialarrangement, has been carried out via standard lithography and lift-off processing [8]. Thestructures were defined by standard contact photolithography using mask projection. A low-dopant silicon substrate (Global Top Chemical Co. Ltd.) with both side polished was coatedby COAT200 (Tokyo Ohka Kogyo Co. Ltd.) to obtain a hydrophobic surface. Then, a positivetype photo-resist (OFPR-500, Tokyo Ohka Kogyo Co. Ltd.) was spin-coated at 3000 rpm for60 s and prebaked at 90◦C for 90 s. The contact photomask exposure was implemented withUV light using a mask aligner (MA-10, MIKASA Co. Ltd.). A substrate area of 2×2 cm2 wasused for pattern fabrication, and the mask area was over 5×5 cm2; therefore, a homogeneouspattern was prepared on the whole substrate area. The series of hole diameter c and period acombinations are designed as (c, a) = (1.4, 2.9), (1.5, 3.1), (1.6, 3.3), (1.7, 3.5), (1.8, 3.7), (1.9,3.9), (2.1, 4.2), and (2.3, 4.6) μm, respectively. Due to the resolution of photomask preparation,we have a = 2c or slightly larger than 2c. After exposure, the samples were developed in 2.38%tetramethyl ammonium hydroxide (NMD-3, Tokyo Ohka Kogyo Co. Ltd.), dried, and coatedwith a 3 nm Ni adhesion layer followed by a 50 nm Ag layer using vapor deposition. Thefollowing lift-off step in acetone under ultrasonic bath conditions removed the resist togetherwith the excess metal, and finally the sample was washed in methanol.
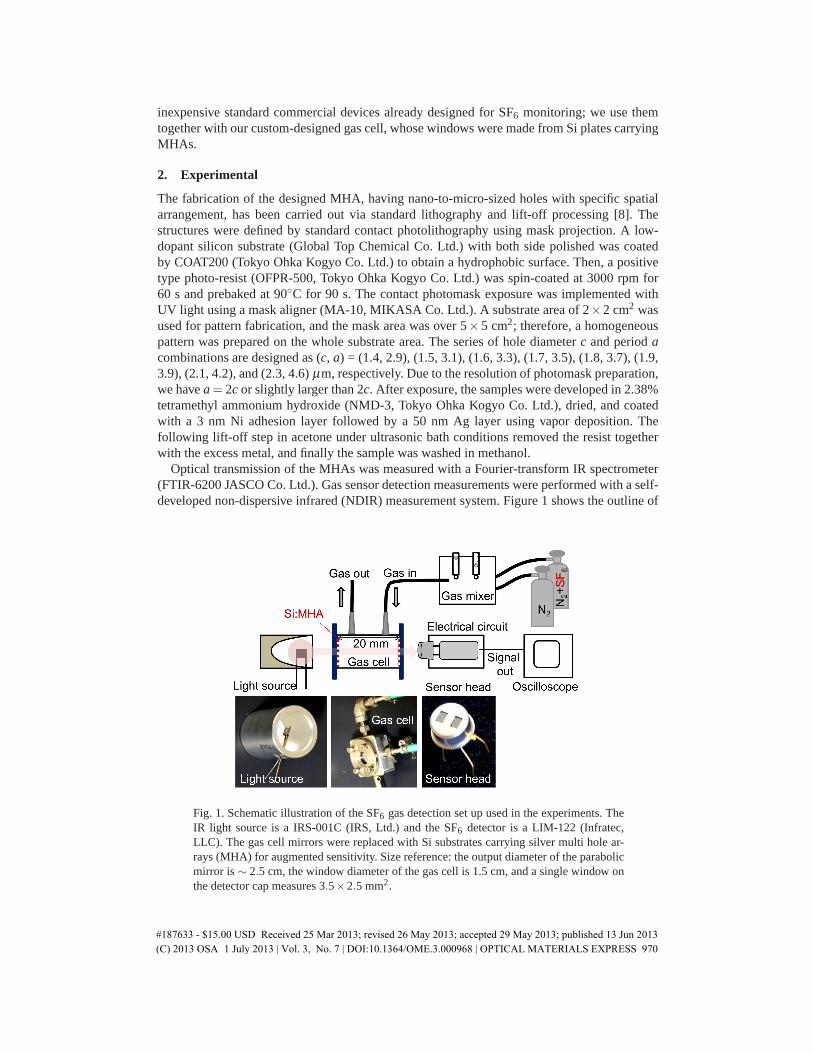
Optical transmission of the MHAs was measured with a Fourier-transform IR spectrometer(FTIR-6200 JASCO Co. Ltd.). Gas sensor detection measurements were performed with a self-developed non-dispersive infrared (NDIR) measurement system. Figure 1 shows the outline of
Fig. 1. Schematic illustration of the SF6 gas detection set up used in the experiments. TheIR light source is a IRS-001C (IRS, Ltd.) and the SF6 detector is a LIM-122 (Infratec,LLC). The gas cell mirrors were replaced with Si substrates carrying silver multi hole ar-rays (MHA) for augmented sensitivity. Size reference: the output diameter of the parabolicmirror is ∼ 2.5 cm, the window diameter of the gas cell is 1.5 cm, and a single window onthe detector cap measures 3.5×2.5 mm2.
#187633 - $15.00 USD Received 25 Mar 2013; revised 26 May 2013; accepted 29 May 2013; published 13 Jun 2013(C) 2013 OSA 1 July 2013 | Vol. 3, No. 7 | DOI:10.1364/OME.3.000968 | OPTICAL MATERIALS EXPRESS 970
Fig. 2. (a) Normalized optical transmission of the silver hexagonal MHAs with hole diame-ters / periods (c, a), measured right-to-left in μm: (1.4, 2.9), (1.5, 3.1), (1.6, 3.3), (1.7, 3.5),(1.8, 3.7), (1.9, 3.9), (2.1, 4.2), and (2.3, 4.6). The inset shows the optical micro-photographof the fabricated MHA with (c,a) = (1.6,3.3). (b) Plot of the peak wavelength as a func-tion of the period a. The arrows mark the MHA used for SF6 detection at 950 cm−1, whichis shown in the inset of the (a) panel.
the experimental setup. A filament-type infrared light source (IRS-001C, IRS Co.) was usedto deliver black-body-like emission with an applied voltage of 4.5 V. No special IR opticswas used; the IR emission was collected by a parabolic back-reflector with a ∼ 7◦ divergence,and then used to illuminate the 1.5 cm diameter gas cell window, whose output illuminated the3.5×2.5 mm2 filter window of the detector, having an active detecting area of 1.8×1 mm2. Theradiation was transmitted into the gas cell through two replaceable windows, which permittedto exchange the Si mirrors with Si:MHA mirrors. Then, a specific-designed pyroelectric sensor(LIM-122, Infratec Ltd.) was used for detection of the SF6 vibration bands, by monitoring twobands around the wavelengths of 8.26 μm (reference) and 10.6 μm or 943 cm−1 (signaturesignal for SF6). The gas concentration was controlled by a mixing system shown in Fig. 1.A concentration of 100 ppm of SF6 in N2 carrier gas was progressively diluted by pure N2
(99.99% purity), and the mixing ratio was controlled through a flow meter. The detector outputsignal was detected on an oscilloscope.
3. Simulations
The transmission and field enhancement properties of the gas cell realized with Si:MHA mirrorsat both ends have been simulated with a 3D finite-difference time-domain (3D-FDTD) modelimplemented with the Lumerical software from FDTD Solutions. Due to the complexity ofthe model, the simulations were performed on the swinSTAR supercomputer at SwinburneUniversity, featuring 16-core computational nodes with 64 GB memory each. The memoryfootprint of each simulation was around 100 GB and took from 1 to 3 hours running on a16-node cluster.
#187633 - $15.00 USD Received 25 Mar 2013; revised 26 May 2013; accepted 29 May 2013; published 13 Jun 2013(C) 2013 OSA 1 July 2013 | Vol. 3, No. 7 | DOI:10.1364/OME.3.000968 | OPTICAL MATERIALS EXPRESS 971
Fig. 3. (a) Transmission spectra of gas cell with two Si:MHA windows filled with air (trans-mission of single MHA was up to 40%). (b) SF6 gas absorption spectrum measured in a gascell filled with SF6. The inset shows the asymmetric stretching mode of the SF6 molecule;the corresponding band at 943 cm−1 is pointed at by an arrow in panel (b).
4. Results and Discussion
4.1. Transmission spectra of MHA
Figure 2 shows the optical characterization of the hexagonal-lattice MHA, which was fabri-cated in homogeneous uniform structures over a 2× 2 cm2 area. The transmission spectra ofhexagonal-lattice MHAs is similar to that of the square lattice, except for the fact that the hexag-onal pattern shows a single transmission peak. The absolute transmission value is larger thanthat of a square pattern by ∼ 40% for a 50 nm Ag thickness, as compared with ∼ 20 nm ofsquare-lattice thickness; hence, more mirrors can be lined up for increased selectivity, whileobtaining the same detection threshold. The transmission peak is red-shifted with increasingpattern period a, following a linear dependence (Fig. 2(b)). The peak wavelength of MHAtransmission is given by the following equation [17]:
λmax =
√3
2a
√i2 + i j+ j2
·√
ε1ε2
ε1 + ε2, (1)
where ε1,2 are the dielectric constants of the metal (e.g. ε1 = −2700+1400i for Ag at 10 μmwavelength) and the surrounding media (ε2 � 11.7+5×10⁻⁴i for Si), respectively; and i andj are the MHA diffraction orders in the two principal directions of the hexagonal lattice (x-direction and 60◦-angled direction, in this case). The transmission peak appearing in Fig. 2(a)is characterized as the (i= 1, j = 0), or (i= 0, j = 1) peak. The second-order peak (i= 1, j = 1)should appear at a 1/
√3 times shorter wavelength according to Eq. (1), however we could not
see it experimentally. This might be due to the weak strength of second-order diffractions.Experimental results (Fig. 2(b)) well agree with this equation. The vibrational mode of the
SF6 gas is well known, showing as a 10.6 μm (943 cm−1) band which can be assigned to theasymmetric stretching of the F-S-F covalent bond. Therefore, according to this relationshipbetween the periodicity and the peak transmission wavelength, we choose a period a = 3.3 μmfor the SEIRA gas sensor.
Figure 3 shows the transmission spectra of a gas cell with both mirrors carrying MHA pat-terns. The peak transmission obtained has an absolute value around 20%. The peak is centered
#187633 - $15.00 USD Received 25 Mar 2013; revised 26 May 2013; accepted 29 May 2013; published 13 Jun 2013(C) 2013 OSA 1 July 2013 | Vol. 3, No. 7 | DOI:10.1364/OME.3.000968 | OPTICAL MATERIALS EXPRESS 972
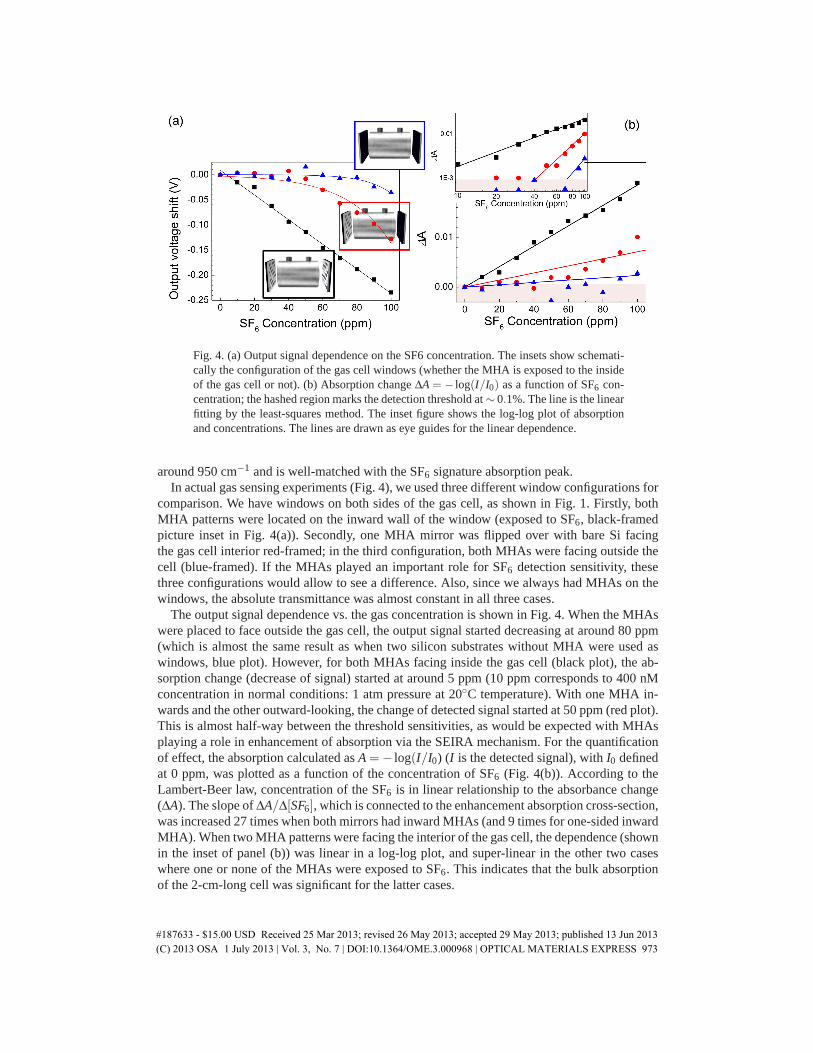
Fig. 4. (a) Output signal dependence on the SF6 concentration. The insets show schemati-cally the configuration of the gas cell windows (whether the MHA is exposed to the insideof the gas cell or not). (b) Absorption change ΔA = − log(I/I0) as a function of SF6 con-centration; the hashed region marks the detection threshold at ∼ 0.1%. The line is the linearfitting by the least-squares method. The inset figure shows the log-log plot of absorptionand concentrations. The lines are drawn as eye guides for the linear dependence.
around 950 cm−1 and is well-matched with the SF6 signature absorption peak.In actual gas sensing experiments (Fig. 4), we used three different window configurations for
comparison. We have windows on both sides of the gas cell, as shown in Fig. 1. Firstly, bothMHA patterns were located on the inward wall of the window (exposed to SF6, black-framedpicture inset in Fig. 4(a)). Secondly, one MHA mirror was flipped over with bare Si facingthe gas cell interior red-framed; in the third configuration, both MHAs were facing outside thecell (blue-framed). If the MHAs played an important role for SF6 detection sensitivity, thesethree configurations would allow to see a difference. Also, since we always had MHAs on thewindows, the absolute transmittance was almost constant in all three cases.
The output signal dependence vs. the gas concentration is shown in Fig. 4. When the MHAswere placed to face outside the gas cell, the output signal started decreasing at around 80 ppm(which is almost the same result as when two silicon substrates without MHA were used aswindows, blue plot). However, for both MHAs facing inside the gas cell (black plot), the ab-sorption change (decrease of signal) started at around 5 ppm (10 ppm corresponds to 400 nMconcentration in normal conditions: 1 atm pressure at 20◦C temperature). With one MHA in-wards and the other outward-looking, the change of detected signal started at 50 ppm (red plot).This is almost half-way between the threshold sensitivities, as would be expected with MHAsplaying a role in enhancement of absorption via the SEIRA mechanism. For the quantificationof effect, the absorption calculated as A =− log(I/I0) (I is the detected signal), with I0 definedat 0 ppm, was plotted as a function of the concentration of SF6 (Fig. 4(b)). According to theLambert-Beer law, concentration of the SF6 is in linear relationship to the absorbance change(ΔA). The slope of ΔA/Δ[SF6], which is connected to the enhancement absorption cross-section,was increased 27 times when both mirrors had inward MHAs (and 9 times for one-sided inwardMHA). When two MHA patterns were facing the interior of the gas cell, the dependence (shownin the inset of panel (b)) was linear in a log-log plot, and super-linear in the other two caseswhere one or none of the MHAs were exposed to SF6. This indicates that the bulk absorptionof the 2-cm-long cell was significant for the latter cases.
#187633 - $15.00 USD Received 25 Mar 2013; revised 26 May 2013; accepted 29 May 2013; published 13 Jun 2013(C) 2013 OSA 1 July 2013 | Vol. 3, No. 7 | DOI:10.1364/OME.3.000968 | OPTICAL MATERIALS EXPRESS 973
Gas sensing on the surface of MHA due to electromagnetic field enhancement is consistentwith our previous study [8]. The observed enhancement is due to the optical near-field effect onthe MHAs and the spacing between two MHAs substrates is not fully optimized. Only the SF6
molecules in close proximity of the MHA experience field enhancement due to plasmon reso-nance and extraordinary transmission. The field enhancement effective for SEIRA gas detectionwill be discussed the next section. Also, the transport efficiency of the target molecules to theenhancement field region is important for sensing stability and time cost. The mean free pathof molecules in air at atmospheric pressure can be estimated as l f = (
√2πna2
N)−1 = 60 nm
for the N2 molecule of size aN = 0.3 nm and density n = 2.69 × 1019 cm−3 at room tem-perature T = 300 K. The diffusion coefficient D = 1
3 l f vT = 10−5 m2/s, where vT � 0.5 km/sis the velocity of molecules in air at room temperature T = 300 K. The measurements werecarried out on a time interval tm = 5 min to obtain a reliable readout signal (about 10 s is re-quired to observe a change in the readout signal); hence, the diffusion length of the moleculesis Ld =
√Dtm = 55 mm, which is much longer than the gas cell length. Therefore, 5 minutes is
enough interval time for a 2 cm cell. By decreasing the spacing between the two windows, thetime for output stabilization is reduced, i.e. 10 mm spacing only requires 0.1 s.
SEIRA with MHAs has the potential to detect gases in thin gas cells since it is linked tooptical near-field enhancement. Use of the cavity effect could open new possibilities for minia-turization and will be investigated next. The detector used in this study has 100-200 nm wideIR-bandpass filter windows which can be substituted with MHAs and integrated into the gascell, reducing the overall setup costs. Optimization of gas cell thickness and introduction of alarger absorbing MHA surface are expected to further increase sensitivity into the 1-10 ppm(40-400 nM) range (see the changes introduced by one MHA window in Fig. 4(b)). Simplefocusing of IR light transmitted through the gas cell by a cylindrical lens onto the IR detectorshould yield extra sensitivity and lower detection threshold.
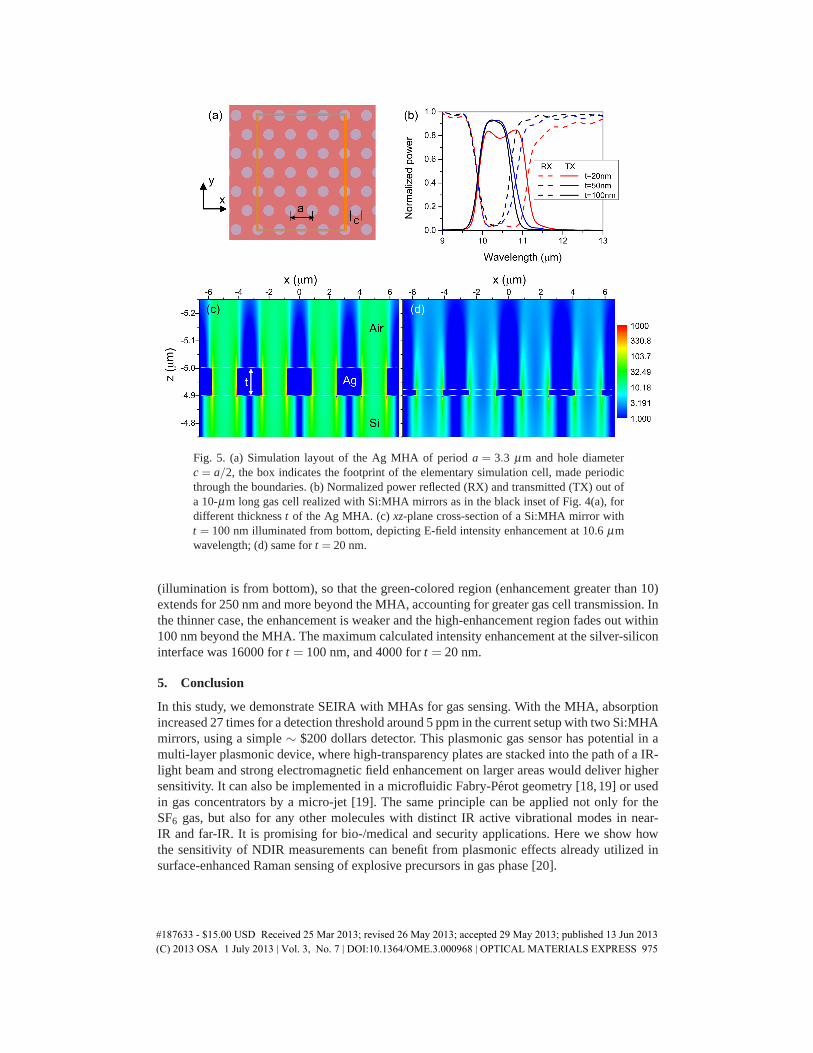
4.2. Numerical simulations of transmission of MHA
The transmission and field enhancement properties of the gas cell were simulated with 3D-FDTD. The mirrors were modeled as silicon slabs supporting a silver layer of thickness t inwhich the MHA of period a = 3.3 μm and hole diameter c = a/2 is realized, as shown inFig. 5(a). The refractive index spectra of the materials are fitted from the experimental valuesobtained in literature, by means of a built-in polynomial model. In order to reduce the com-putational demands, only a 13.2× 17.15 μm2 section of the mirror pair is modeled, as shownby the box in Fig. 5(a), and the distance between the mirrors is reduced to 10 μm. The x- andy-direction boundaries are closed by periodic boundary conditions (PBCs) to extend the latticeindefinitely. The cell is illuminated by a linearly x-polarized plane wave source with bandwidthextending from 9 to 13 μm wavelength, and the domain is closed in the z-direction by perfectly-matched layers (PMLs) to avoid reflections. The transmitted and reflected power are sampledby monitors at both domain ends, and the cell is tested for different values of thickness of theMHA layer t = 20,50,100 nm.
The results are shown in Fig. 5(b), where the power values are normalized to source power.It can be noticed that the thinner layer has a broader transmission bandwidth around 10 and11 μm, whose upper limit is reduced down to 10.7 μm by thickening the layer. Conversely,the average transmission increases from around 80% to 90%, much higher than the experimentdue to the smaller optical path of the simulated device and absence of the gas cell between themirrors. It is interesting to look at the local E-field intensity enhancement around the MHAholes at the characteristic wavelength of 10.6 μm, which is shown as the xz-plane cross-sectionin Fig. 5(c) for t = 100 nm and in Fig. 5(d) for t = 20 nm. In the thicker case, it can be seenthat there is sign of extraordinary transmission into the air from the silicon side of the array
#187633 - $15.00 USD Received 25 Mar 2013; revised 26 May 2013; accepted 29 May 2013; published 13 Jun 2013(C) 2013 OSA 1 July 2013 | Vol. 3, No. 7 | DOI:10.1364/OME.3.000968 | OPTICAL MATERIALS EXPRESS 974
Fig. 5. (a) Simulation layout of the Ag MHA of period a = 3.3 μm and hole diameterc = a/2, the box indicates the footprint of the elementary simulation cell, made periodicthrough the boundaries. (b) Normalized power reflected (RX) and transmitted (TX) out ofa 10-μm long gas cell realized with Si:MHA mirrors as in the black inset of Fig. 4(a), fordifferent thickness t of the Ag MHA. (c) xz-plane cross-section of a Si:MHA mirror witht = 100 nm illuminated from bottom, depicting E-field intensity enhancement at 10.6 μmwavelength; (d) same for t = 20 nm.
(illumination is from bottom), so that the green-colored region (enhancement greater than 10)extends for 250 nm and more beyond the MHA, accounting for greater gas cell transmission. Inthe thinner case, the enhancement is weaker and the high-enhancement region fades out within100 nm beyond the MHA. The maximum calculated intensity enhancement at the silver-siliconinterface was 16000 for t = 100 nm, and 4000 for t = 20 nm.
5. Conclusion
In this study, we demonstrate SEIRA with MHAs for gas sensing. With the MHA, absorptionincreased 27 times for a detection threshold around 5 ppm in the current setup with two Si:MHAmirrors, using a simple ∼ $200 dollars detector. This plasmonic gas sensor has potential in amulti-layer plasmonic device, where high-transparency plates are stacked into the path of a IR-light beam and strong electromagnetic field enhancement on larger areas would deliver highersensitivity. It can also be implemented in a microfluidic Fabry-Perot geometry [18, 19] or usedin gas concentrators by a micro-jet [19]. The same principle can be applied not only for theSF6 gas, but also for any other molecules with distinct IR active vibrational modes in near-IR and far-IR. It is promising for bio-/medical and security applications. Here we show howthe sensitivity of NDIR measurements can benefit from plasmonic effects already utilized insurface-enhanced Raman sensing of explosive precursors in gas phase [20].
#187633 - $15.00 USD Received 25 Mar 2013; revised 26 May 2013; accepted 29 May 2013; published 13 Jun 2013(C) 2013 OSA 1 July 2013 | Vol. 3, No. 7 | DOI:10.1364/OME.3.000968 | OPTICAL MATERIALS EXPRESS 975
Acknowledgments
The authors are grateful to Prof. T. Baba from Yokohama Nat. Univ. for fruitful discussionsand for granting access to the fabrication facilities. We thank Tokyo Ohka Kogyo Co. Ltd. forproviding the photoresist and surfactant used for fabrication, and the Instrumental AnalysisCenter (Yokohama Nat. Univ.) for the FTIR in fabrication of MHA. This work was financiallysupported by the Nippon Sheet Glass Foundation for Materials Science and Engineering (NSGFoundation), Research Foundation for opt-Science and Technology, and Amada Foundation. SJis grateful for support via the Australian Research Council DP130101205 Discovery project.Part of this work was performed on the swinSTAR supercomputer at Swinburne University ofTechnology.
#187633 - $15.00 USD Received 25 Mar 2013; revised 26 May 2013; accepted 29 May 2013; published 13 Jun 2013(C) 2013 OSA 1 July 2013 | Vol. 3, No. 7 | DOI:10.1364/OME.3.000968 | OPTICAL MATERIALS EXPRESS 976