Page 1
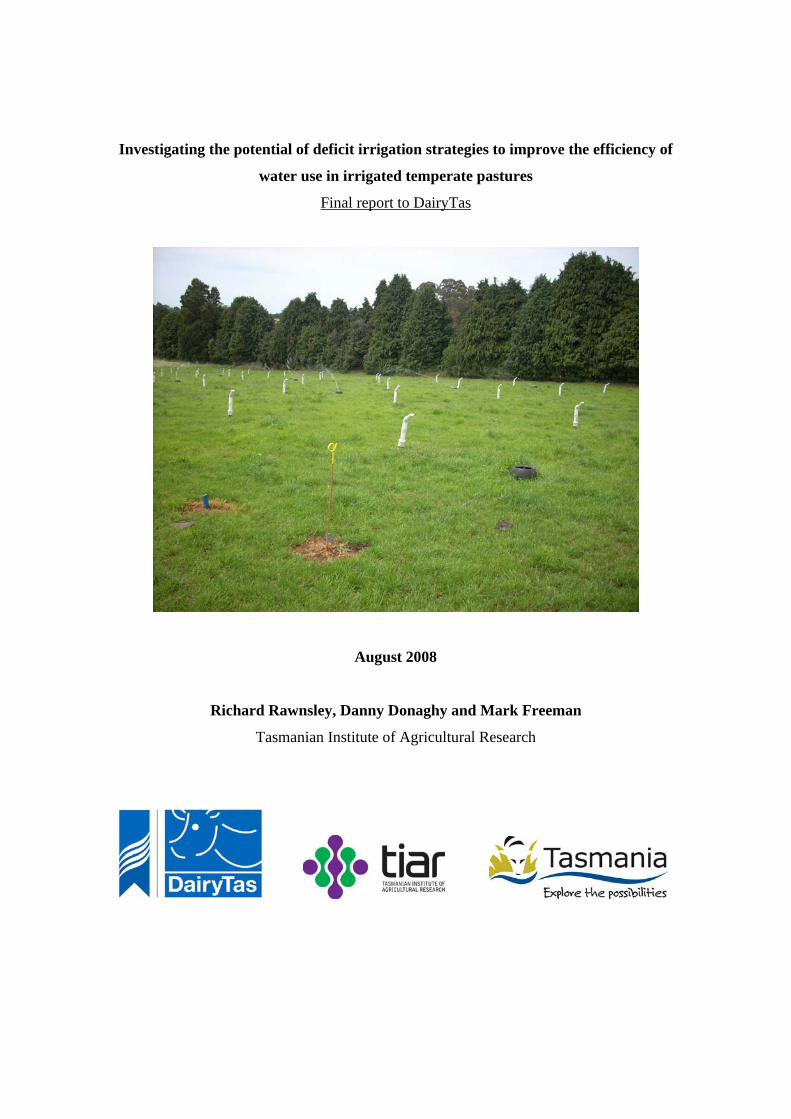
Investigating the potential of deficit irrigation strategies to improve the efficiency of
water use in irrigated temperate pastures
Final report to DairyTas
August 2008
Richard Rawnsley, Danny Donaghy and Mark Freeman
Tasmanian Institute of Agricultural Research
Page 2
Table of contents Executive summary............................................................................................................. 1
Pasture performance and water use efficiency ............................................................... 2
Modelling outcomes ........................................................................................................ 2
Communication of results ............................................................................................... 2
Other activities................................................................................................................ 3
Conclusion ...................................................................................................................... 3
Project team ........................................................................................................................ 3
Paper (1st draft) for Australian Journal of Agricultural Research....................................... 4
Abstract ........................................................................................................................... 5
Introduction..................................................................................................................... 6
Materials and methods.................................................................................................... 8
Results and discussion .................................................................................................. 13
Conclusion .................................................................................................................... 17
References ..................................................................................................................... 17
Appendix 1 – PowerPoint slides presented at field day.................................................... 32
Page 3
1
Executive summary This document is a final report to DairyTas for the project titled ‘Investigating the
potential of deficit irrigation strategies to improve the efficiency of water use in irrigated
temperate pastures’.
The research in this project was successfully completed according to the project schedule
outlined in the DairyTas small grant proposal. The principle aims of the project were to:
Monitor pasture performance and water use efficiency from different deficit
irrigation strategies.
To model the results of the study and extend outcomes to differing soil types and
regions by running model simulations for different dairy regions over a number of
years.
To communicate results of the study through presentations of the findings at field
days and in the Pasture PLU$ newsletter.
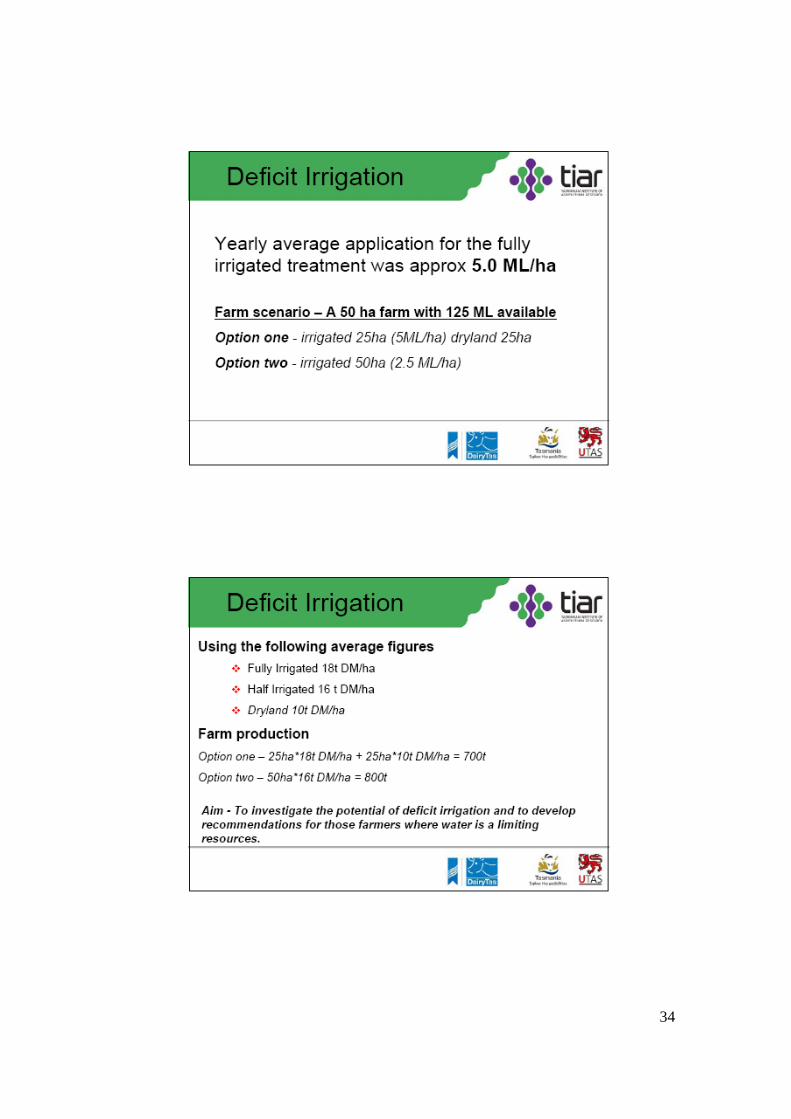
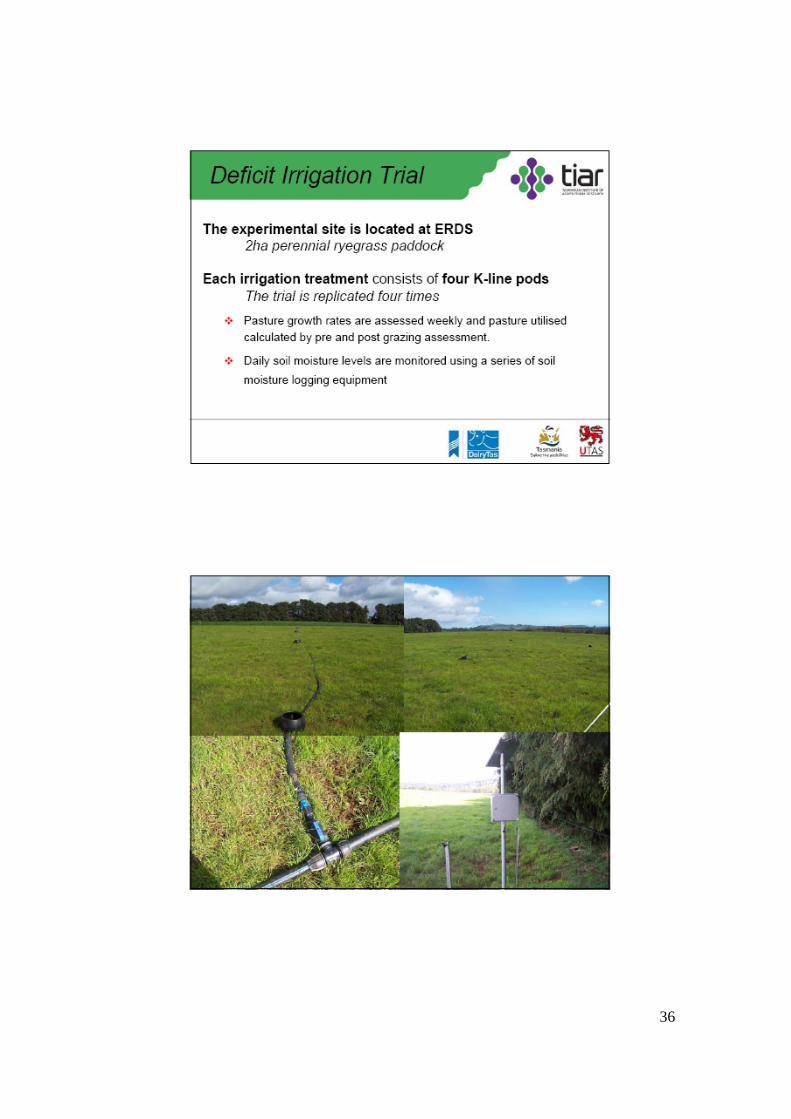
This project encompassed a 2.0 ha experimental site located at Elliott research and
demonstration station. The trial design was a randomized complete block design with
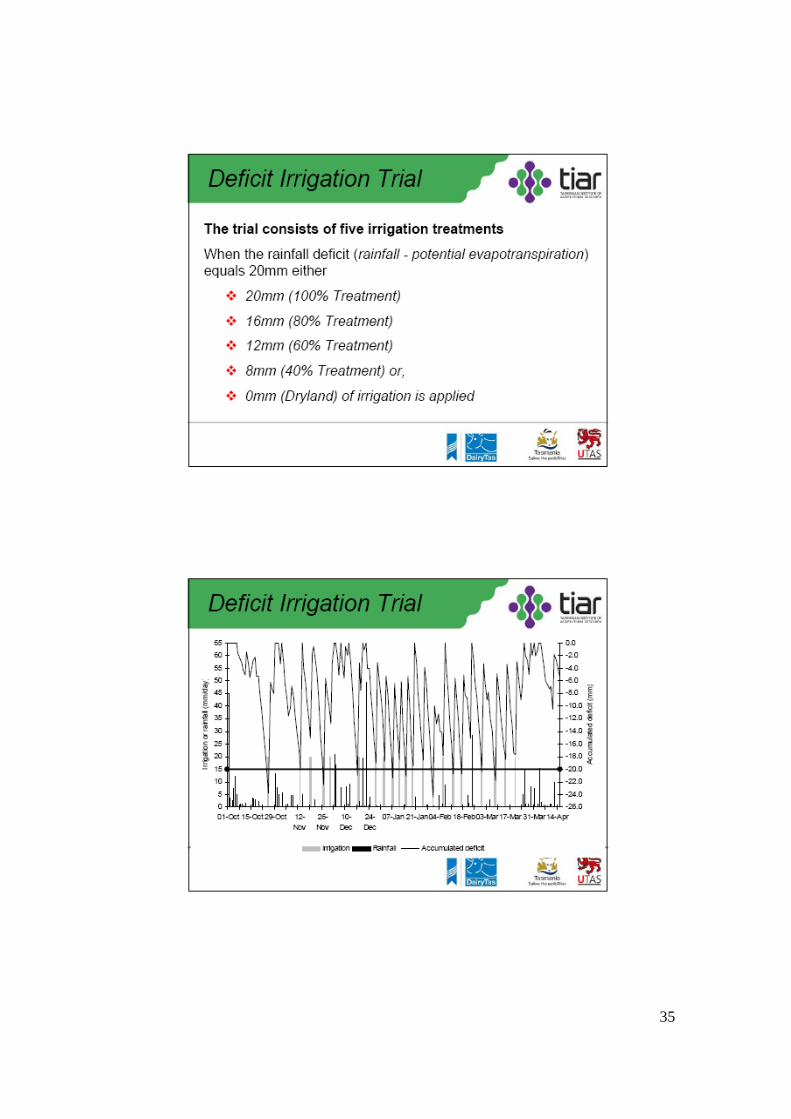
four replications. A rainfall deficit (rainfall – potential evapotranspiration) of 20 mm was
used to schedule irrigation at which point 20, 16, 12, 8 or 0 mm of irrigation water was
applied, referred to as treatments 100, 80, 60, 40 and 0%, respectively. The experimental
site was grazed by 60 Holstein Friesian heifers each time the 100% irrigation treatment
regrew between 2.5 and 3.0 leaves/tiller. The difference between pre- and post-grazing
pasture biomass estimates was used to calculate the amount of pasture utilised from each
grazing for each irrigation treatment. The marginal irrigation water use index (MIWUI)
was calculated as marginal production due to irrigation/irrigation water applied.
Page 4
2
Pasture performance and water use efficiency The cumulative pasture yield was 9.16, 8.92, 7.64, 6.89 and 3.74 t DM/ha for the 100, 80,
60, 40 and 0% irrigation treatments, respectively. The resulting MIWUI (marginal
production due to irrigation) was 1.29, 1.54, 1.55, and 1.87 t DM/ML, for 100, 80, 60 and
40% irrigation treatments, respectively. The study demonstrated that improvements in the
average response to irrigation across the Australian dairy industry of 1 t DM/ML can be
increased by 50 to 90% under a deficit irrigation approach. A deficit irrigation approach
maintains the pasture in a responsive state and makes more efficient use of any summer
rainfall events.
Modelling outcomes The results of this study were modelled through the biophysical model DairyMod and
pasture growth was simulated across all treatments based on summary statistics and
strong agreement between modelled and observed data. Results were then simulated
using forty years of climatic data (June 1967-July 2006) for five differing dairy regions of
Tasmania. The modelling work has shown that removal of edaphic limitations and
maximising pasture growth significantly improves the marginal irrigation response of
dairy pastures. When edaphic limitations are removed, a deficit irrigation approach
between 60 and 80% would result in an average MIWUI of 2.8 t DM/ML. This is a
considerable improvement above the industry average response and these findings are
viewed as being critical to improving the efficiency of irrigation water use within the
Tasmanian dairy industry.
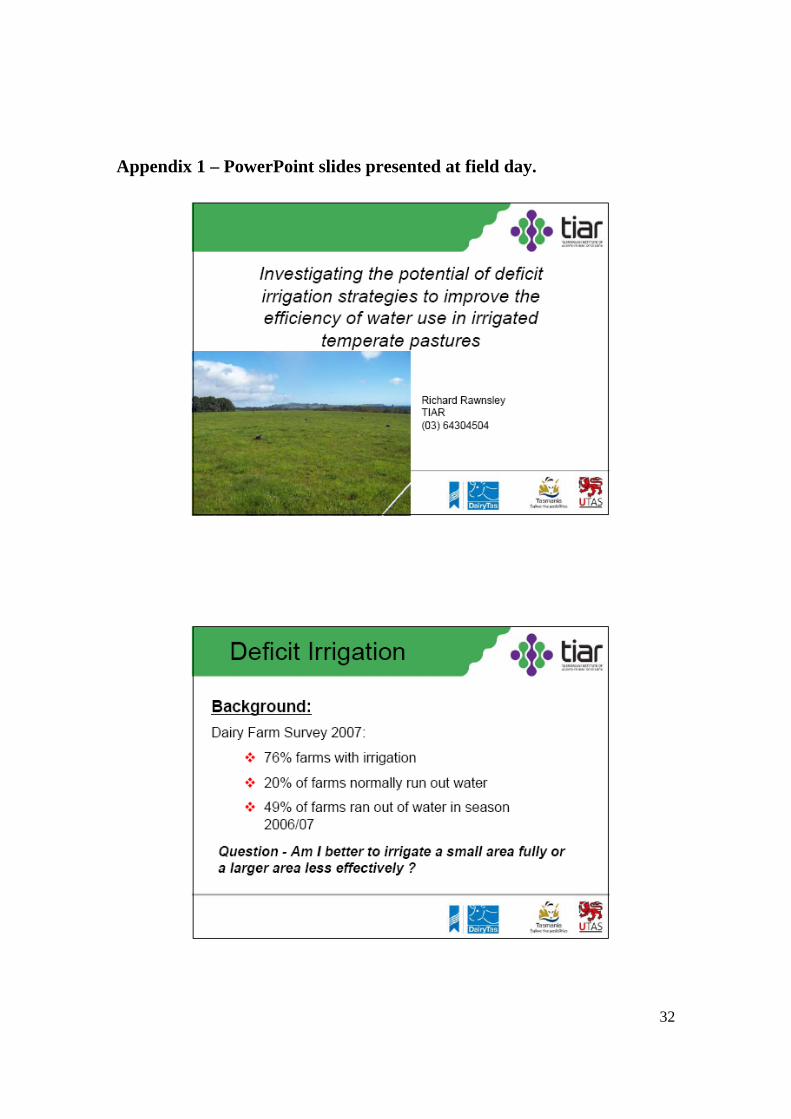
Communication of results Results of the study were communicated in issue 25 of the Pasture PLU$ newsletter
(February 2008). A field day was held on the 7th March 2008. The field day was well
attended by a total of 41 farmers and service providers. Slides from the field day
presentation are given in Appendix 1.
Page 5
3
Other activities The experimental site provided a medium for the research and demonstration of a number
of other activities. This included Janice Perry undertaking a School of Agricultural
Science Honours study entitled ‘Investigating the effect of deficit irrigation on perennial
ryegrass (Lolium Perenne) morphology and herbage quality’. Result from this Honours
study will be made available to DairyTas following completion in October, 2008. In
addition, the CSIRO Information and Communication Technologies centre demonstrated
and tested the use of their soil moisture sensor network and HydroTas demonstrated the
use of their Adjenti units.
Conclusion The observed experimental data and simulated results from the current study suggest that
the obtainable marginal water use index is much higher than the current industry standard
of 1 t DM/ML. This study has therefore shown that the opportunity exists for irrigated
pasture systems to better manage an increasingly scarce resource while still maintaining
economically feasible yields.
Project team The project supervisor and principal investigator was Richard Rawnsley. Mark Freeman
and Danny Donaghy were also investigators on the project. Technical support was
provided by Peter Chamberlain and Karen Christie. Lesley Irvine assisted in coordinating
grazing for the experimental site. .
Page 6
4
Paper (1st draft) for Australian Journal of Agricultural Research Deficit strategy increases marginal irrigation response
Potential of deficit irrigation to increase marginal irrigation response of perennial
ryegrass (Lolium perenne L.) on Tasmanian dairy farms.
R.P. RawnsleyA, B.R. CullenB, L.R. TurnerA, D.J. DonaghyA, M. FreemanA, K.M.
ChristieA
ATasmanian Institute of Agricultural Research, University of Tasmania, Burnie, Tas
BFaculty of Land and Food Resources, University of Melbourne, Vic
Keywords: Irrigation, dairy, pastures, modeling
Journal: Australian Journal of Agricultural Research
Keywords: Irrigation, dairy, pastures, modeling
Journal: Australian Journal of Agricultural Research
Page 7
5
Abstract To date, the aim of irrigation has been to maximise pasture yield by ensuring that plants
do not suffer water stress. Consequently, irrigation of pastures has often been applied
above the rate of plant water requirements, resulting in high inefficiencies. Deficit
irrigation is an approach to minimise these inefficiencies by scheduling irrigation events
when soil moisture reaches pre-determined levels, which minimises the amount of
irrigation water required to gain maximum pasture dry matter (DM) yields. Increasing
water use efficiency by implementing deficit irrigation is recognised as an approach that
could result in a competitive edge for the dairy industry as water resources become more
limiting. An irrigation experiment was undertaken in North West Tasmania, between
October 2007 and April 2008, examining the potential effect of deficit irrigation
treatments on pasture growth and water use efficiency. A rainfall deficit (rainfall –
potentials evapotranspiration) of 20 mm was used to schedule irrigation at which point 20,
16, 12, 8 or 0 mm of irrigation water was applied, referred to as treatments 100, 80, 60,
40 and 0%, respectively. The trial was a randomized complete block design with 4
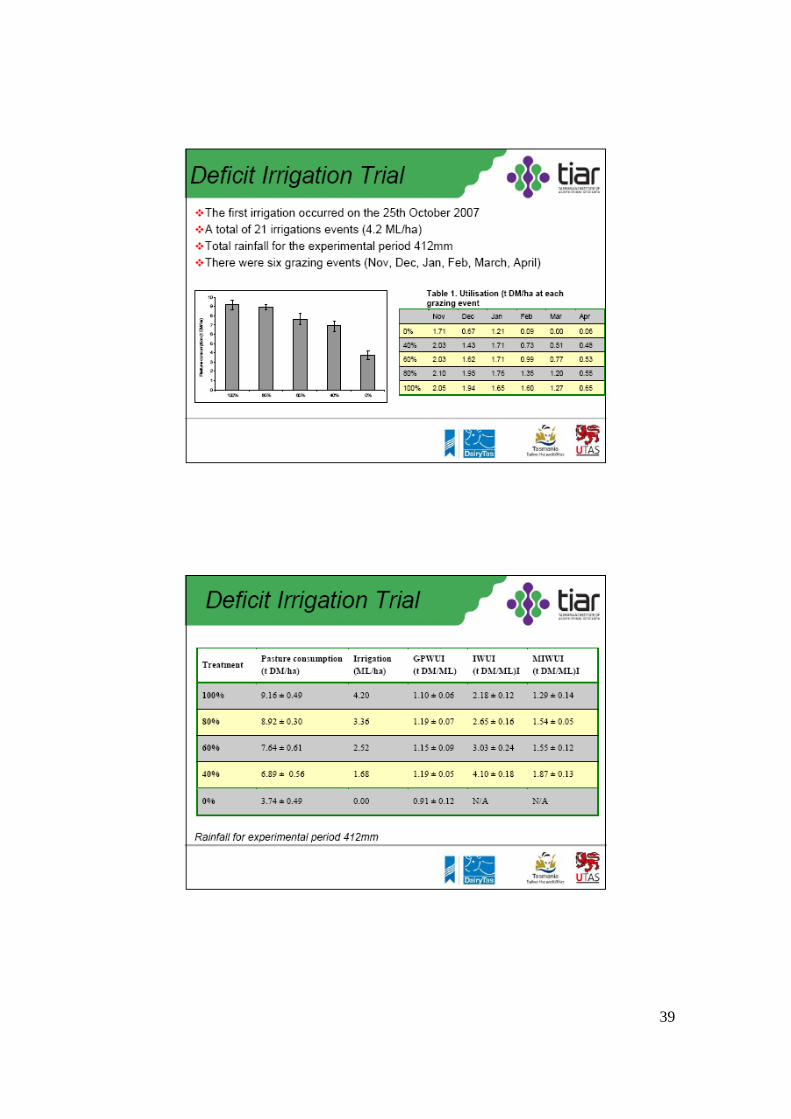
replications. There was 21 irrigation events, between October and Arpil. The
accumulative pasture yield was 9.16, 8.92, 7.64, 6.89 and 3.74 t DM/ha for the 100, 80,
60, 40 and 0% irrigation treatments, respectively. The resulting marginal irrigation water
use index (marginal production due to irrigation) was 1.29, 1.54, 1.55, and 1.87 t DM/ML,
for 100, 80, 60 and 40% irrigation treatments, respectively. The results of this study were
modeled through the biophysical model DairyMod and pasture growth was simulated
across all treatments based on summary statistics and strong agreement between modeled
and observed data. Results were then simulated using forty years of climatic data (June
Page 8
6
1967-July 2006) for 5 differing dairy regions of Tasmania. The observed experimental
data and simulated results from the current study suggest that the experimental marginal
water use index is a lot higher than the current industry standard of 1 t DM/ML. This
study has therefore shown that the opportunity exists for irrigated pastoral systems to
better manage an increasingly scarce resource and maintain economically feasible yields.
Introduction Nationally, the dairy industry is the second highest user of water, accounting for 19% of
the total water diverted for agricultural use (ABS, Water account 2004-05). Tasmanian
dairy farmers use approximately 85 GL of water on 19,700 ha with an average yearly
application amount of 4.3 ML/ha (ABS, Water account 2004-05). The efficient use of
irrigation water is viewed as being critical to the sustainability of the industry as there is a
heavy reliance on irrigation in the summer months to provide an adequate feed source to
maintain high levels of annual pasture production.
Perennial ryegrass (Lolium perenne L.) is the predominant pasture species used in
Australia to feed grazing dairy cows and according to Armstrong et al. (2000), such
pastures are relatively inefficient utilisers of available water; reliant on high levels of
moisture to maintain optimal growth rates and persistence. To date, the aim of irrigation
in the dairy industry has been to maximise the yield of perennial ryegrass pastures by
ensuring that plants do not suffer water stress. In practice, this has been achieved by
applying irrigation water above the rate of plant water requirements, to compensate for
any unevenness in the distribution and to ensure that the plants are never “under watered”.
Page 9
7
However, this has tended to result in high losses of irrigation water through drainage and
run off and a lower level of return of production per unit of water, with the industry
average of 1 t DM/ML often quoted as an average response (Rawnsley et al. 2007a).
However, significant improvements in irrigation responses have been shown through
avoiding over irrigating, improving scheduling, and using appropriate start-up times,
while maintaining adequate available moisture (Rawnsley et al. 2007b).
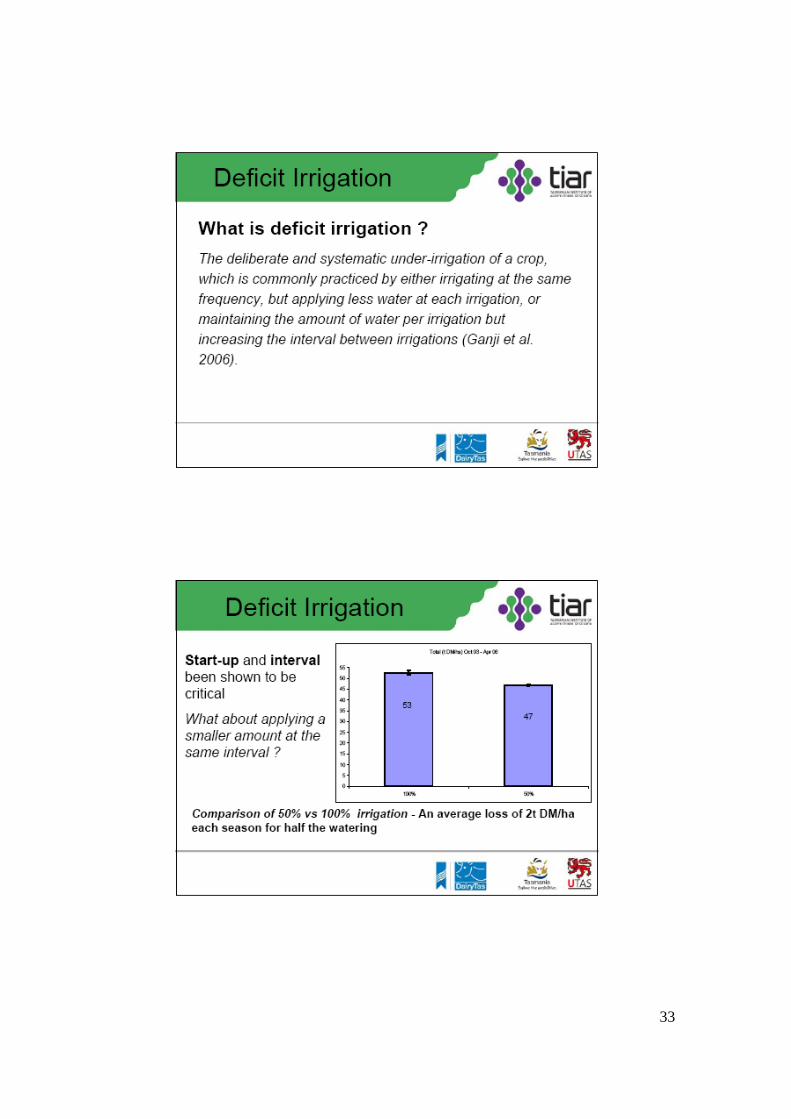
Deficit irrigation, the deliberate and systematic under-irrigation of crops, has been
suggested as one way to further increase water use efficiency from applied irrigation
water. It is commonly practiced by either irrigating at the same frequency, but applying
less water at each irrigation event, or maintaining the amount of water per irrigation but
increasing the interval between irrigations events (Ganji et al. 2006). Ward et al. (1998)
investigated both deficit irrigation approaches with only one treatment. This study found
that delaying the irrigation interval by 3 to 4 days or applying only 70% of irrigation
requirements reduced the water use efficiency of the pasture from 1.04 t DM/ha/ML for
the full irrigation treatment to 0.57 and 0.82 t DM/ha/ML, respectively. In contrast, a 3
year study by Donaghy et al. (2006) in North West Tasmania in which 50% of irrigation
requirements were applied, found that the water use efficiency of temperate pastures
increased from 1.72 t DM/ML/ha for the full irrigation treatment to 1.91 t DM/ML for the
50% treatment. The contrasting results of these studies highlight the effect of climate on
responses to irrigation. The objective of this study was to quantify the impacts of a deficit
irrigation approach in which the interval remained constant but proportional amounts of
irrigation were applied to pasture in a cool temperate climate. It also aimed to validate the
Page 10
8
irrigation response using the biophysical DairyMod (Johnson et al. 2003; Johnson et al.
2008) and extrapolate the results to different dairying regions across Tasmania.
Materials and methods Site and soil description
The experiment was undertaken at Elliott Research and Demonstration Station in North
West Tasmania (-41.08 S, 145.77 E, elevation 155.0 m) with a winter dominant rainfall
pattern and a mean annual rainfall of 1202mm. The 2.0 hectare experimental site was on
a deep clay loam ferrosol soil (red mesotrophic haplic ferrosol; Isbell 1996). The soil
fertility of the experimental site prior to commencing was as follows: Olsen phosphorus
(P) – 22.1 mg/kg, Colwell potassium (K) – 134 mg/kg, mono-calcium phosphate
extracted sulphur (S) – 60.7 mg/kg, pH (H20) – 6.2 and electrical conductivity – 0.11
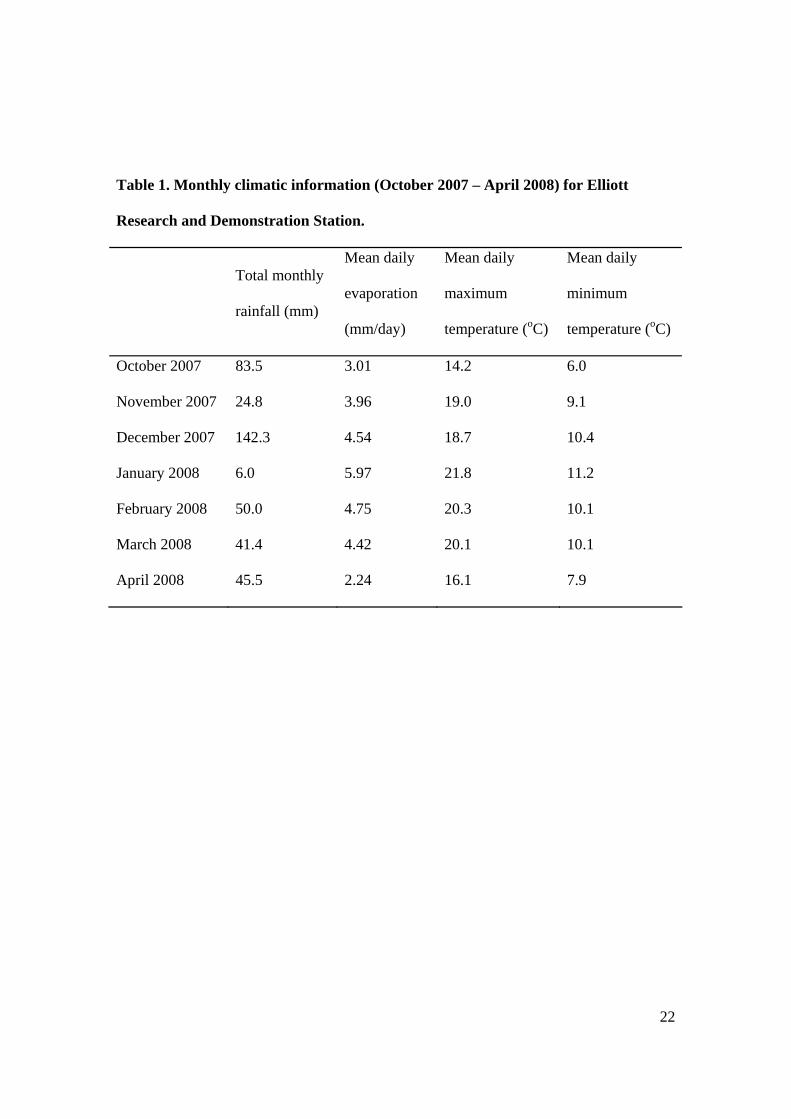
dS/m. Monthly rainfall, evaporation, and the mean monthly maximum and minimum
daily temperatures for the experimental period are given Table 1.
Insert Table 1 near here
The experimental site was an established perennial ryegrass (cv. Impact ) pasture, and
was sprayed with the Agritone® (a.i. MCPA, present as dimethylamine salt, 750g/L) in
August 2007 to elevate influences of broadleaf weeds. A basal dressing of diammonium
phosphate (18% nitrogen, 20% phosphorus, 1.5% sulphur) fertiliser was applied in
September. Nitrogen (N) fertiliser was reapplied to the experimental site, as urea (46% N)
as 46 kg N/ha on the 12th November 2007, 16th January 2008 and 15th February 2008.
Page 11
9
Experimental design
The experimental design consisted of 5 irrigated treatments arranged as a randomized
block design with 4 replications. Each treatment consisted of 4 K-line pods separated by
10m with controlled pressure at the inlet of each line maintained at 20 psi by a NelsonTM
high flow pressure limiting device. This resulted in a delivery rate of 4 mm/hr, with
distribution uniformity of >80% within a 3 m buffer in a perpendicular direction of each
line. The area of each experimental treatment per replication (from here on referred to as
experimental plots) was 180 m2 (30 m x 6 m).
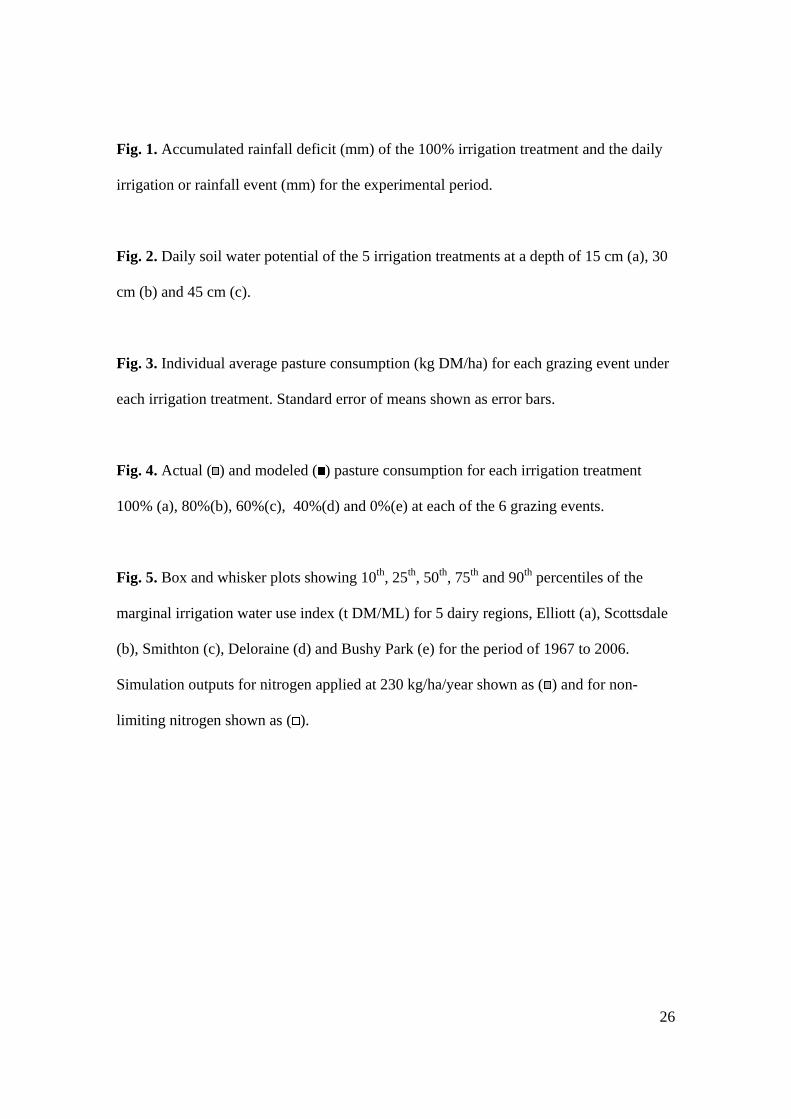
The 5 irrigation treatments were applications of 20 (100%), 16 (80%), 12 (60%), 8 (40%),
and 0 mm (0%) of irrigation at a rainfall deficit of 20 mm. The rainfall deficit was
calculated as the difference in rainfall minus potential evapotranspiration. The
evapotranspiration was estimated as 0.8 x daily “Class A” pan evaporation, which was
located at the experimental site. Each irrigation or rainfall event that brought the deficit
of the 100% treatment back to zero or above was classed as zero. Figure 1 displays the
irrigation scheduling interval for the experimental period for the 100% irrigation
treatment.
Insert Fig. 1 near here
Sampling
Page 12
10
The 2.0 ha experimental area was grazed by 60 Holstein Friesian heifers between the 2.5
and 3.0 leaf re-growth stage of the 100% irrigation treatment. A pre experimental
grazing was completed on the 4th October 2007, and a total of 6 grazings were undertaken
between October 2007 and April 2008. Pre grazing and post-grazing herbage mass
estimates were made prior to and following every grazing event using a calibrated rising
plate meter (Earle and McGowan 1979). The difference between the pre and post grazing
estimate was used to estimate amount of pasture utilised from each treatment. Between
40 and 50 rising plate meter height measurements were taken in all treatments and
calibration quadrates (0.25 m2) were cut to ground level with hand shears to allow for
conversion of meter reading to herbage mass.
Three water use indices as defined by (Purcell and Currey 2003) were used to compare
water use efficiency between irrigation treatments. The gross production water use index
(GPWUI) was calculated as the total product/total water applied, the irrigation water use
index (IWUI) was calculated as total product/irrigation water applied and the marginal
irrigation water use index (MIWUI) was calculated as marginal production due to
irrigation/irrigation water applied.
Soil moisture
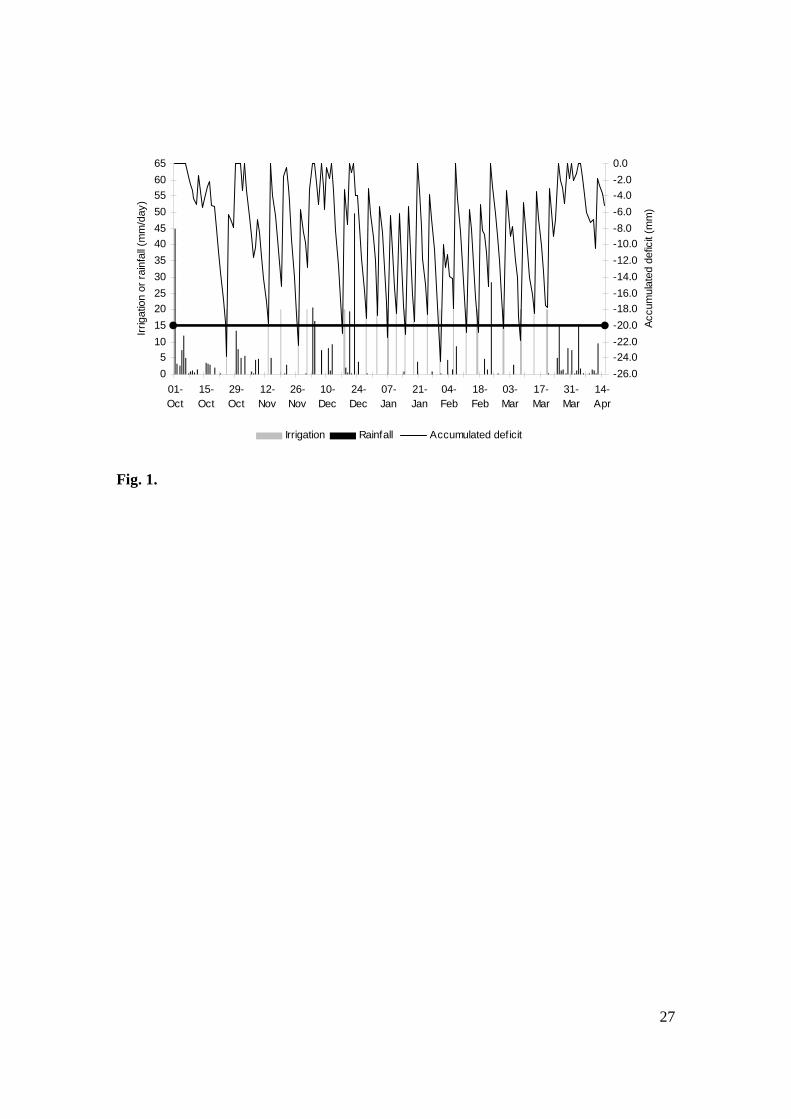
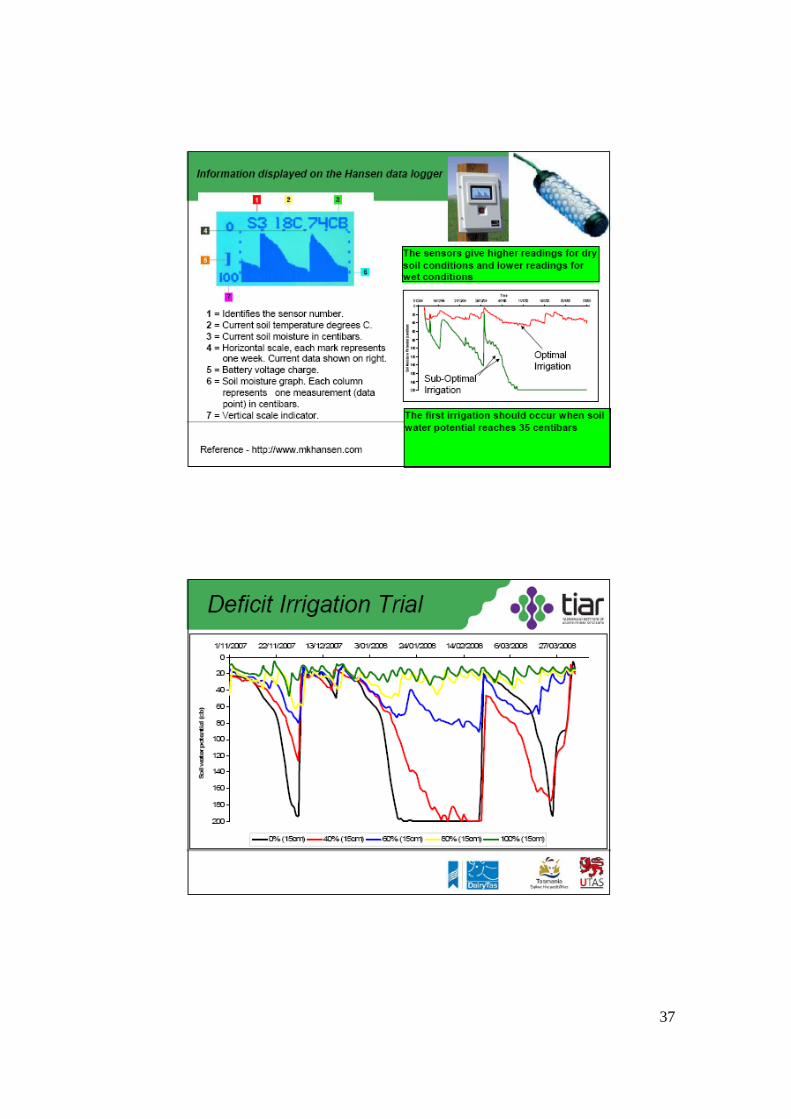
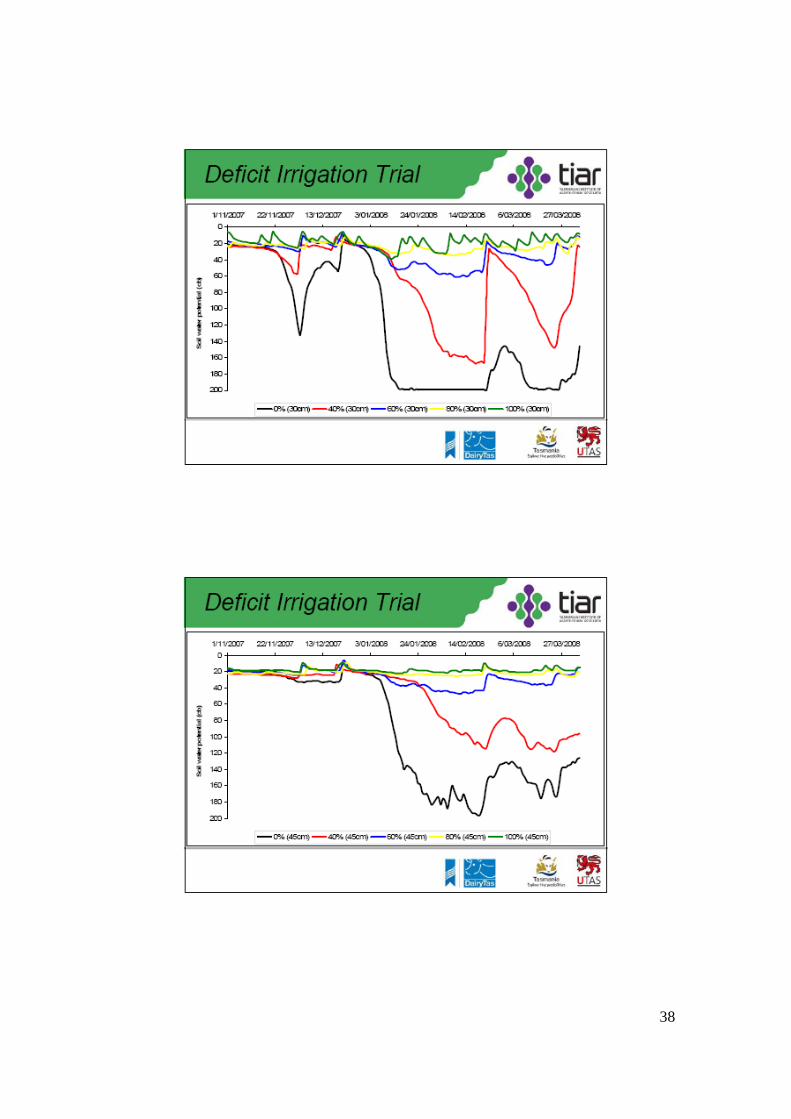
Daily soil water potential was monitored constantly using WatermarkTM soil sensors.
Three WatermarkTM soil sensors were placed at soil depths of 15, 30 and 45 cm within
each treatment for 1 replication. An AM400 Hansen data logger was used to
Page 13
11
automatically record readings every 4 hours from the 3 WatermarkTM soil sensors. Soil
moisture data is given in Figure 2.
Insert Fig. 2 near here
Statistical analysis
Statistical analyses were performed using the statistical package SPSS (Version 11.5,
SPSS Corporation, Illinois, USA), and least significant difference (LSD), as defined by
Steel and Torrie (1960). Amount of pasture consumed and WUE indices of each
irrigation treatment for the irrigation period were compared between treatments using an
ANOVA randomized block design.
Model validation and extrapolation
DairyMod, a mechanistic biophysical models developed for the Australian dairy industry
(Johnson et al. 2003; Johnson et al. 2008) was used to extrapolate the results of the
current study across years and 5 dairy regions of Tasmania. The model uses daily
weather information and comprises soil water, soil nutrient, pasture growth and animal
production modules. The model is sufficiently versatile to simulate the range of
environments represented by the pastoral regions of Australia (Johnson et al. 2008).
Validation of the model by Cullen et al. (2008) has shown strong agreement between
modeled and actual data across a number of pastoral systems in Australia and New
Zealand.
Page 14
12
The management parameters used for each site were identical to those applied to the
experimental site. The current study data was modeled using DairyMod with the
following parameters:
Pasture was cut to a residual of 1.5 t DM/ha and defoliation occurred at first day of each
month for the period of 1960 to September 2007. Actual dates of defoliation were used
for the period of October 2007 to April 2008. Nitrogen was applied at a rate of 230 kg
N/ha/year as 5 applications of 46 kg N/ha on the following dates: 18th September, 12th
November, 16th January, 15 February and 17th April. Irrigation was applied when a
rainfall deficit of 20 mm was reached and 0, 8, 12, 16 or 20 mm of irrigation was applied.
Modeled data for the current experimental period was validated against the experimental
data using a range of model evaluation statistics, based on the work of Tedeschi (2006).
These statistics were calculated separately for pasture utilised and irrigation responses
across all treatments. The statistics calculated were: Mean bias, the difference between
measured and simulated mean; r2, coefficient of determination; Mean Prediction Error
(MPE), a measure of general model efficiency expressed as % of mean (Bibby and
Toutenburg 1977); Model Efficiency (MEF), the proportion of variation explained by the
modeled value with a value of 1 indicating a perfect fit; Variance ratio (v), the amount of
variance in the measured and modeled data-sets with a value of 1 indicating the same
amount of variance; Bias correction factor (Cb), which indicates bias from the y=x line
with a value of 1 indicating no bias; and the concordance correlation coefficient (CCC)
which is a simultaneous measure of accuracy and precision with an ideal fit indicated by
a value of 1. Further details of these statistics are available in Tedeschi (2006).
Page 15
13
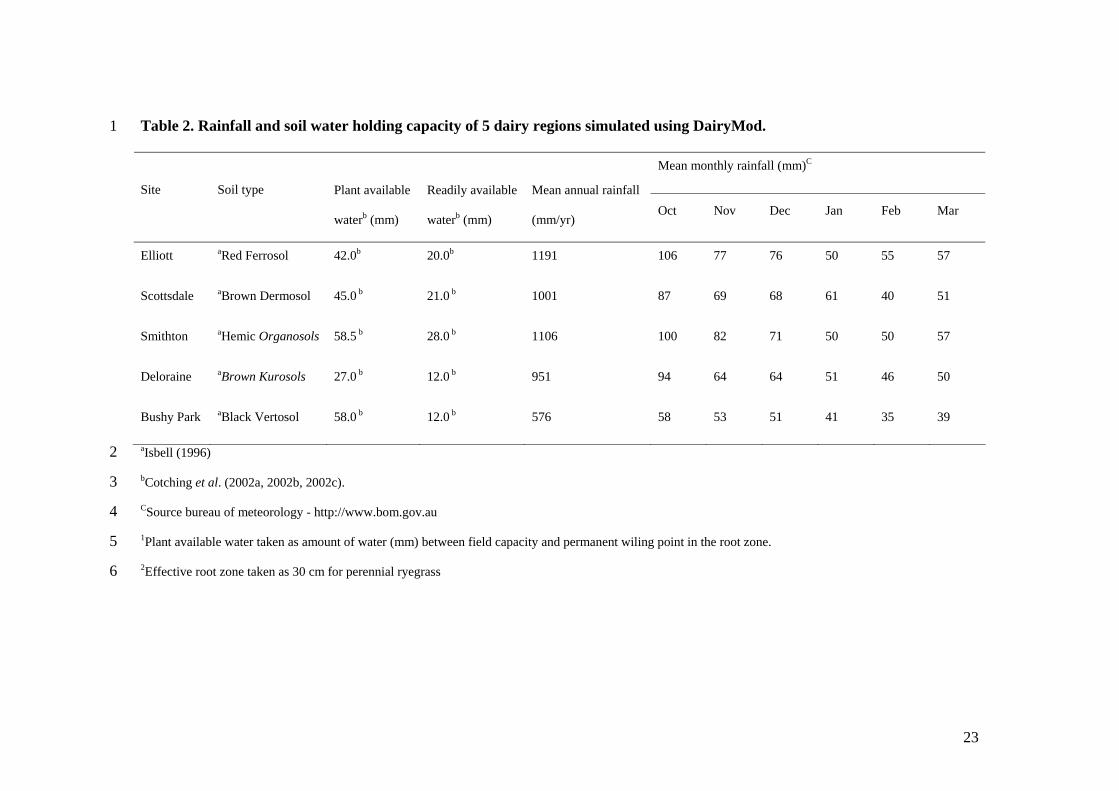
Following validation of the data from the experimental site, simulations for 5 dairy
regions in Tasmania (Table 2); were run for a 40 year period (1st July 1966 to 30th June
2007). Site specific climatic data and soil physical properties were used (Table 2). Daily
climate data for each site was obtained from the Bureau of Meteorology SILO database
(Jeffery et al. 2001).
Insert Table 2 near here
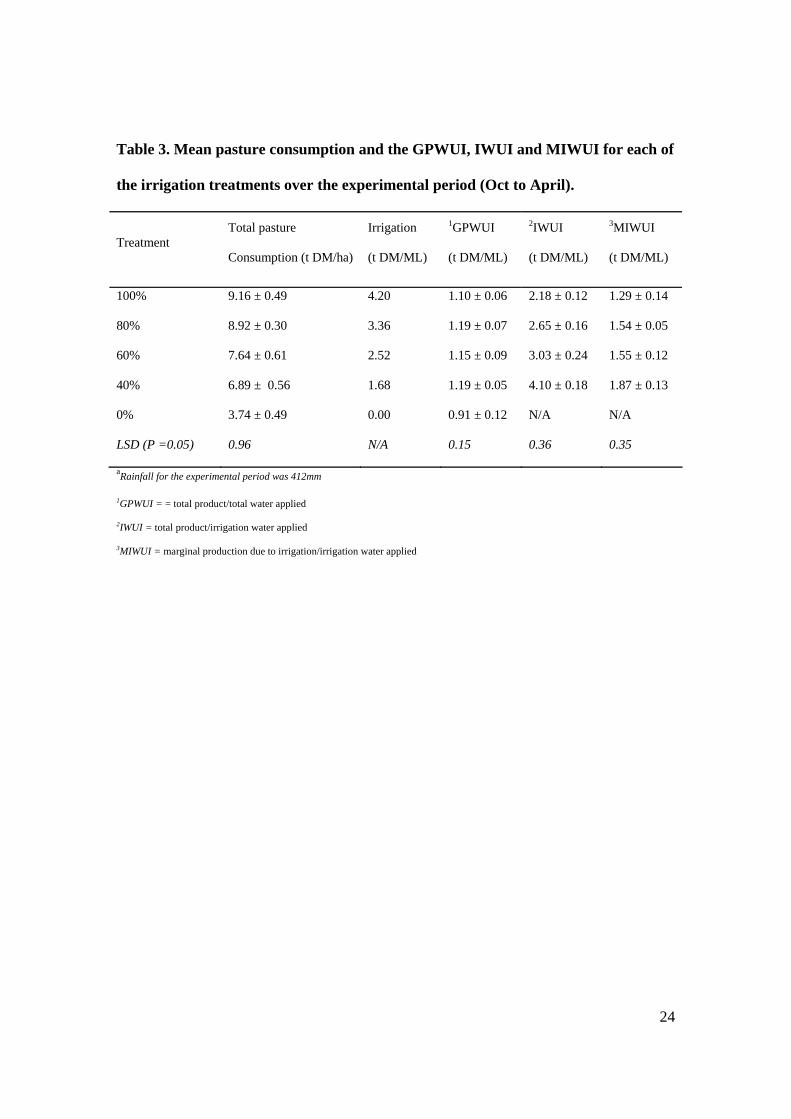
Results and discussion Pasture consumed and water use indices
Total pasture consumed for the experimental period (October to April) differed
significantly (P < 0.05) between irrigation treatments (Table 3). The 100 and 80%
irrigation treatments resulted in a mean pasture consumption of 9.16 and 8.92 t DM/ha,
respectively; significantly (P < 0.05) greater than all other treatments, but not
significantly (P > 0.05) different to each other. The mean pasture consumption for the 0%
irrigation treatment (3.74 tDM/ha) was significantly (P < 0.05) lower than for all other
irrigation treatments, as was the GPWUI (0.91 t DM/ML). The GPWUI of the remaining
irrigation treatments did not significantly differ (P > 0.05) from each other. The mean
GPWUI of the 40, 60, 80 and 100% irrigation treatments was 1.16 t DM/ML. This is
consistent with the recorded GPWUI of perennial ryegrass pasture in other regions of
Australia (Armstrong et al. 2000; Callow and Kenman, 2004; Lawson et al. 2007).
Page 16
14
The IWUI differed significantly (P < 0.05) between all irrigation treatments, with the
highest IWUI occurring for the 40% irrigation treatment (4.10 t DM/ML) and the lowest
occurring for the 100% irrigation treatment (2.18 t DM/ML). The IWUI is known to vary
considerably from year to year depending on seasonal rainfall, and is often higher in areas
with low irrigation requirements. The inverse relationship between irrigation amount and
IWUI was obvious in the current study, with a 20, 40 and 60% reduction in irrigation
from the 100% treatment resulting in a 22, 36% and 88% increase in the IWUI.
There were no significant (P > 0.05) differences in the MIWUI between the 100%, 80%
or 60% irrigation treatments. The 40% irrigation treatment had a significantly higher
MIWUI than the 100% irrigation treatment, but this was not significantly (P > 0.05)
different to the 80% or 60% irrigation treatment. Although there were few significant
differences in the MIWUI between irrigation treatments there was a significant (P < 0.05)
negative linear relationship between irrigation amount and MIWUI.
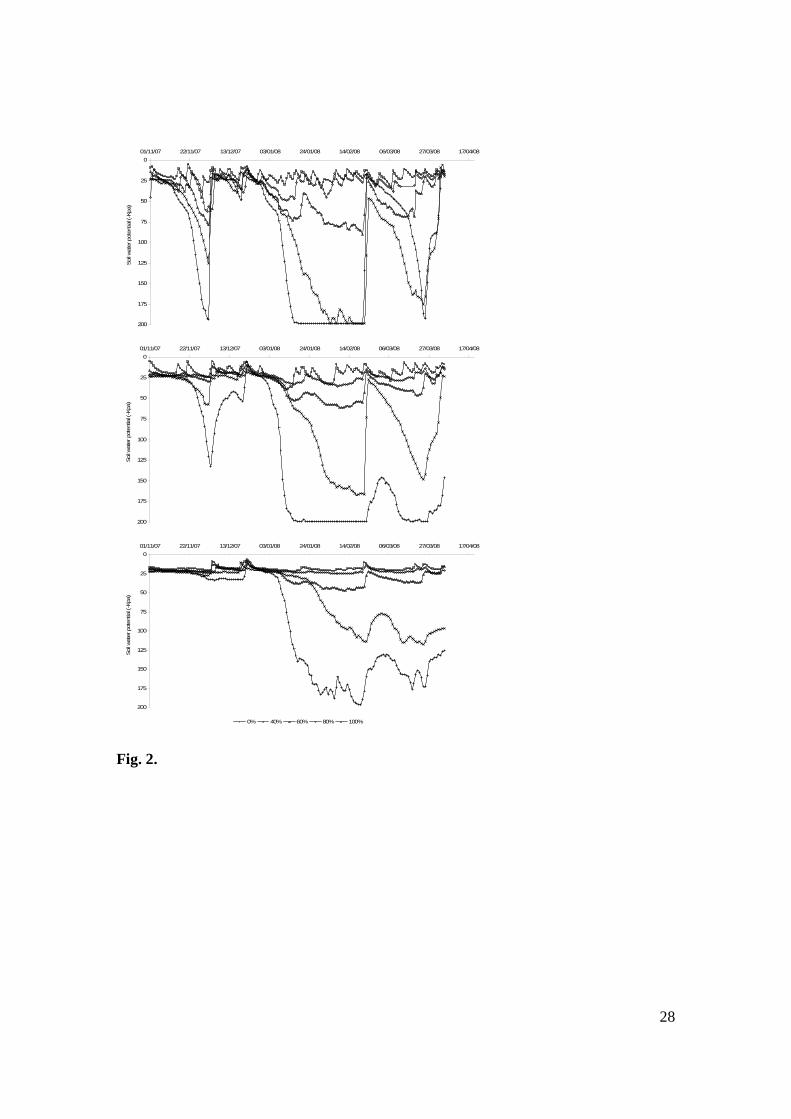
Individual average pasture consumption values for all grazing assessments under each
treatment are given in Figure 3. At each grazing assessment the 0% irrigation treatment
had significantly (P < 0.05) less pasture consumed that the irrigated treatments. However,
at grazing assessments in November, January and April there was no significant (P > 0.05)
difference in pasture consumed between the 40, 60, 80 and 100% irrigation treatments.
Irrigation treatment effects were more pronounced in the December, February and March
grazing events. For example, in the February grazing event, significantly more pasture (P
< 0.05) was consumed from the 100% irrigation treatment than the 80% irrigation
Page 17
15
treatment. Similarly, in the February and March grazing events, significantly more
pasture (P < 0.05) was consumed from the 60% irrigation treatment than the 40%
irrigation treatment.
Insert Fig. 3 near here
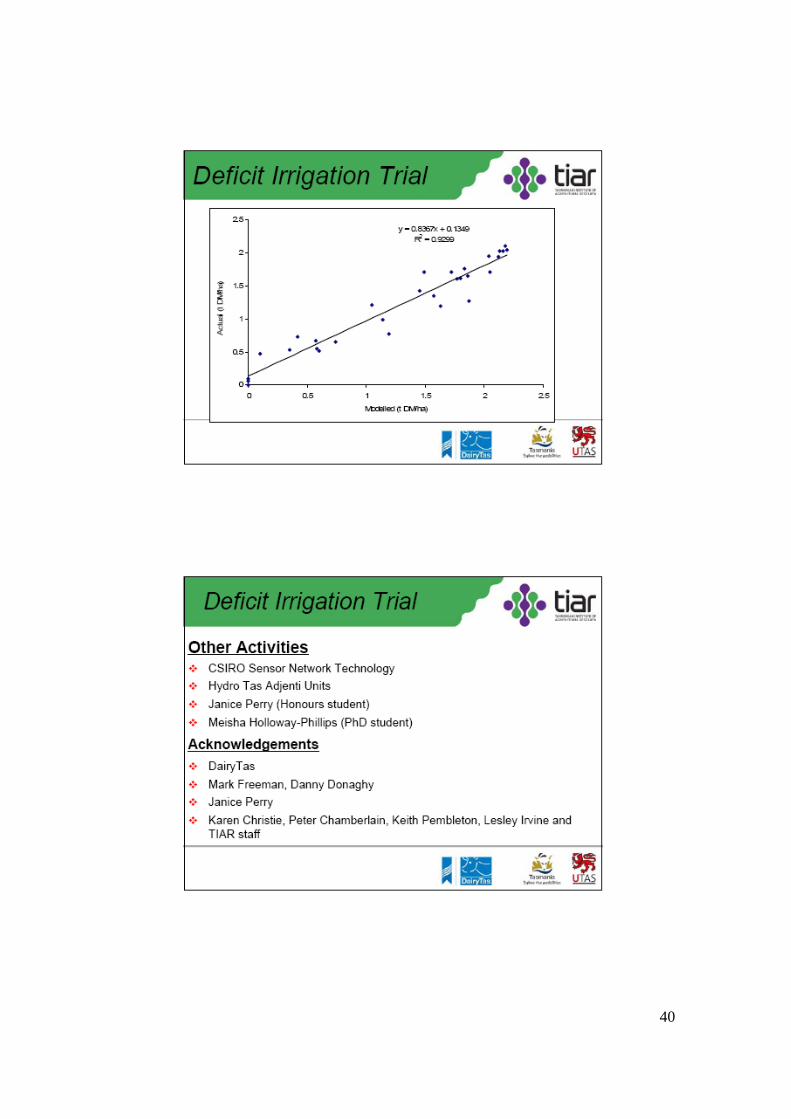
Model Testing
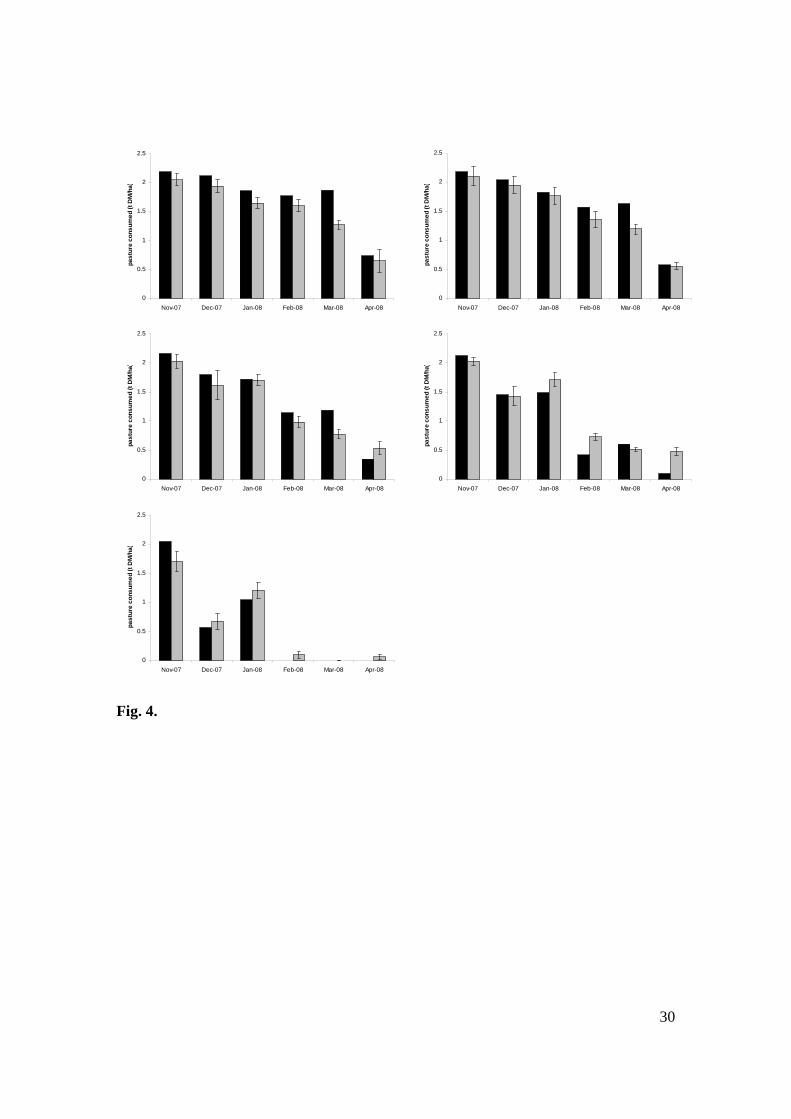
There was strong agreement between observed versus modeled pasture consumption data
for each of the 5 irrigation treatments across the 6 grazing events (Fig. 4).
Insert Fig. 4 near here
Summary statistics between the thirty observed data points and the modeled data
indicated that 93% of the variation can be accounted for by the model with a bias
correction factor of 0.99, indicating little bias between the 1:1 relationship (Table 4).
Insert Table 4 near here
Model simulations were run for the forty-year period between 1967 and 2006 using the
experimental simulation set up across the 5 dairy regions described in Table 2 (from here
on referred to as the experimental simulations). In addition, the simulations were repeated
using the same set-up, but allowing for N to be applied as needed to maintain adequate
plant available N (from here on referred to as non-limiting N simulations).
Page 18
16
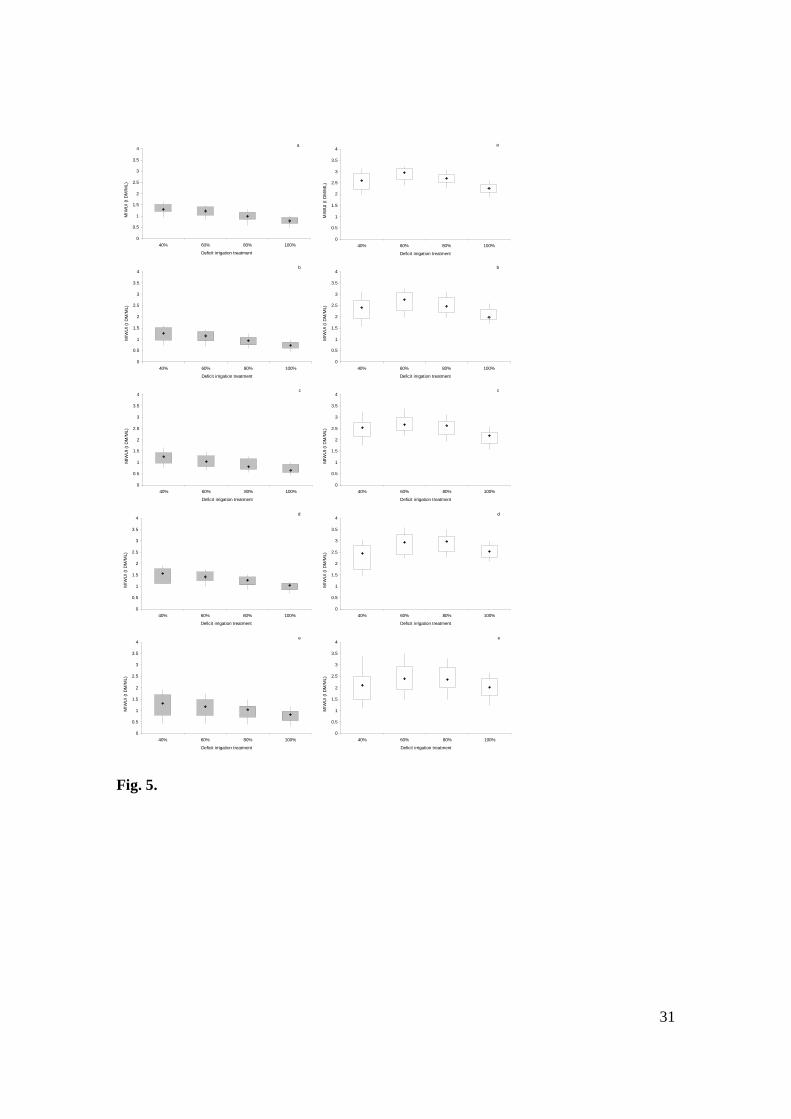
There were discernible differences in the median MIWUI across the 5 sites under both
simulation set ups (Figure 5) and substantially more year to year variation in the MIWUI
when a deficit irrigation strategy was applied. The highest median MIWUI for the
experimental study was achieved under a 40% irrigation treatment for each of the 5 sites.
This was supported by the experimental simulation, with MIWUI ranging from 1.24 t
DM/ML at Smithton to 1.56 t DM/ML at Deloraine, under the 40% irrigation treatment.
It appears that the 230 kg N/ha applied over the experimental period (in the experimental
study and simulations) limited pasture growth, as there was a substantial increase in
MIWUI when N was non-limiting. In the non-limiting N simulation, the effect of
irrigation treatments was also altered. At all 5 sites the median MIWUI was higher under
the 60% and 80% irrigation treatment than the 40% irrigation treatment, indicating that
when N is non-liming and pasture yield is maximised, a deficit approach that provides
between 60 and 80% of plant water requirements provides the highest MIWUI.
Insert Fig. 5 near here
This exercise has highlighted the importance of modeling experimental results as a 40%
deficit irrigation recommendation would not necessarily maximise the MIWUI response
for the 5 dairy regions examined. The results of this study indicated that when all other
edaphic limitations are removed, and N is therefore non-limiting, the MIWUI could be
significantly increased.
Page 19
17
Conclusion This study has shown that a deficit irrigation strategy in a cool temperate environment
can significantly improve the marginal irrigation response for perennial ryegrass-based
dairy pastures. The study has demonstrated that improvements in the average dairy
industry response of 1 t DM/ML can be increased by 50 to 90% under a deficit irrigation
approach. A deficit irrigation approach maintains the pasture in a responsive state and
makes the use of any summer rainfall events more efficient. In addition, modeling work
undertaken in the study has validated the findings and allowed for the extrapolation of
results across years, differing dairy regions and under differing management scenarios.
The modeling work has shown that removal of edaphic limitations (i.e. N) and maximised
pasture growth significantly improves the marginal irrigation response of dairy pasture.
When edaphic limitations are removed, a deficit irrigation approach between 60 and 80%
would result in a MIWUI of 2.8 t DM/ML for the dairy regions of Tasmania. This is a
considerable improvement above the industry average response and these findings are
viewed as being critical to improving the efficiency of irrigation water use` within the
Tasmanian dairy industry.
References Armstrong D, Knee J, Doyle P, Pritchard K, Gyles O (2000) Water use efficiency on
irrigated dairy farms in northern Victoria and southern New South Wales. Australian
Journal of Experimental Agriculture 40, 643-653.
Page 20
18
Australian Bureau of Statistic (ABS) (2006) Water Account Australia 2004-05, category
number 4610.0. The Australian Bureau of Statistics. (Commonwealth of Australia:
Canberra)
Bibby J, Toutenburg H (1977) ‘Prediction and improved estimation in linear models.’
(Wiley: Berlin)
Callow MN, Kenma SJ (2004) Evaluation of the water use efficiency of dairy production
using crops and pastures. In 'New directions for a diverse planet: Proceedings for the 4th
International Crop Science Congress'. Brisbane, Australia. (Ed. Tea Fischer). (The
Regional Institute Ltd).
Cotching WE, Cooper J, Sparrow LA, McCorkell BE, Rowley W (2002a) Effects of
agricultural management on dermosols in northern Tasmania. Australian Journal of Soil
Research 40, 65-79.
Cotching WE, Cooper J, Sparrow LA, McCorkell BE, Rowley W, Hawkins K (2002b)
Effects of agricultural management on vertosols in Tasmania. Australian Journal of Soil
Research 40, 1267-1286.
Cotching WE, Hawkins K, Sparrow LA, McCorkell BE, Rowley W (2002c) Crop yields
and soil properties on eroded slopes of red ferrosols in north-west Tasmania. Australian
Journal of Soil Research 40, 625-642.
Page 21
19
Cullen BR, Eckard RJ, Callow MN, Johnson IR, Chapman DF, Rawnsley RP, Garcia SC,
White T, Snow VO (2008) Simulating pasture growth rates in Australian and New
Zealand grazing systems. Australian Journal of Agricultural Research, 59. (Accepted).
Donaghy DJ, Rawnsley RP, Christie KM (2006) Development of a more relevant forage
base for the Tasmanian dairy industry, Final Report to Dairy Australia UT11478,
Tasmania.
Earle DF, McGowan AA (1979) Evaluation and calibration of an automated rising plate
meter for estimating dry matter yield of pasture. Australian Journal of Experimental
Agriculture and Animal Husbandry 19, 337–343.
Ganji A, Ponnambalam K, Khalili D, Karamouz M (2006) A new stochastic optimization
model for deficit irrigation. Irrigation Science 25, 63–73.
Isbell RF (1996) ‘Australian soil and land survey handbook: the Australian soil
classification.’ (CSIRO Publishing: Collingwood, Victoria)
Jeffrey SJ, Carter JO, Moodie KM, Beswick AR (2001) Using spatial interpolation to
construct a comprehensive archive of Australian climate data. Environmental Modelling
and Software 16, 309-330.
Page 22
20
Johnson IR, Chapman DF, Parsons AJ, Eckard RJ, Fulkerson WJ (2003) DairyMod: A
biophysical model of the Australian dairy system. In ‘Proceedings of the Australian
Farming Systems Conference’. Toowoomba, Australia.(www.afsa.asn.au/)
Johnson I R, Chapman DF, Snow VO, Eckard RJ, Parsons AJ, Lambert MG, Cullen BR
(2008) DairyMod and EcoMod: Biophysical pastoral simulation models for Australia and
New Zealand. Australia Journal of Experimental Agriculture 48, 621-631.
Lawson A, Greenwood K, Kelly K (2007) Future farming systems-dairy. Our rural
landscape 2.5. Final report. Kyabram, Department of Primary industries.
Purcell J, Currey A (2003) National program for sustainable irrigation. Gaining
acceptance of water use efficiency framework, terms and definitions. Final Report –Stage
2, NSW, Australia.
Rawnsley RP, Donaghy DJ, Carlson SM, Christie KM (2007a) Responses of Tasmanian
dairy pastures to irrigation. In ‘Proceedings of the Grasslands Society of Southern
Australia 48th Annual Conference’. pp. 90 (Grassland Society of Southern Australia Inc.
Murray Bridge, South Australia).
Rawnsley RP, Donaghy DJ, Stevens DR (2007b) What is limiting production and
consumption of perennial ryegrass in temperate dairy regions of Australia and New
Page 23
21
Zealand? In ‘Proceedings of the 3rd Dairy Science Symposium’. pp 256-276. (The
University of Melbourne: Victoria, Australia)
Steel RGD, Torrie JH (1960) ‘Principles and Procedures of Statistics.’ (McGraw-Hill
Book Company Inc.: New York)
Tedeschi LO (2006) Assessment of the adequacy of mathematical models. Agricultural
Systems 89, 225-247.
Ward G, Burch S, Jacobs J, Ryan M, McKenzie F, Rigby S (1998) Effects of sub-optimal
irrigation practices dairy pasture production in south west Victoria. In ‘Proceedings of the
9th Agronomy Conference’. pp254-257. (Charles Sturt University: Wagga Wagga, NSW).
Page 24
22
Table 1. Monthly climatic information (October 2007 – April 2008) for Elliott
Research and Demonstration Station.
Total monthly
rainfall (mm)
Mean daily
evaporation
(mm/day)
Mean daily
maximum
temperature (oC)
Mean daily
minimum
temperature (oC)
October 2007 83.5 3.01 14.2 6.0
November 2007 24.8 3.96 19.0 9.1
December 2007 142.3 4.54 18.7 10.4
January 2008 6.0 5.97 21.8 11.2
February 2008 50.0 4.75 20.3 10.1
March 2008 41.4 4.42 20.1 10.1
April 2008 45.5 2.24 16.1 7.9
Page 25
23
Table 2. Rainfall and soil water holding capacity of 5 dairy regions simulated using DairyMod. 1
Mean monthly rainfall (mm)C
Site Soil type
Plant available
waterb (mm)
Readily available
waterb (mm)
Mean annual rainfall
(mm/yr) Oct Nov Dec Jan Feb Mar
Elliott aRed Ferrosol 42.0b 20.0b 1191 106 77 76 50 55 57
Scottsdale aBrown Dermosol 45.0 b 21.0 b 1001 87 69 68 61 40 51
Smithton aHemic Organosols 58.5 b 28.0 b 1106 100 82 71 50 50 57
Deloraine aBrown Kurosols 27.0 b 12.0 b 951 94 64 64 51 46 50
Bushy Park aBlack Vertosol 58.0 b 12.0 b 576 58 53 51 41 35 39
aIsbell (1996) 2 bCotching et al. (2002a, 2002b, 2002c). 3 CSource bureau of meteorology - http://www.bom.gov.au 4 1Plant available water taken as amount of water (mm) between field capacity and permanent wiling point in the root zone. 5 2Effective root zone taken as 30 cm for perennial ryegrass 6
Page 26
24
Table 3. Mean pasture consumption and the GPWUI, IWUI and MIWUI for each of
the irrigation treatments over the experimental period (Oct to April).
Treatment Total pasture
Consumption (t DM/ha)
Irrigation
(t DM/ML)
1GPWUI
(t DM/ML)
2IWUI
(t DM/ML)
3MIWUI
(t DM/ML)
100% 9.16 ± 0.49 4.20 1.10 ± 0.06 2.18 ± 0.12 1.29 ± 0.14
80% 8.92 ± 0.30 3.36 1.19 ± 0.07 2.65 ± 0.16 1.54 ± 0.05
60% 7.64 ± 0.61 2.52 1.15 ± 0.09 3.03 ± 0.24 1.55 ± 0.12
40% 6.89 ± 0.56 1.68 1.19 ± 0.05 4.10 ± 0.18 1.87 ± 0.13
0% 3.74 ± 0.49 0.00 0.91 ± 0.12 N/A N/A
LSD (P =0.05) 0.96 N/A 0.15 0.36 0.35
aRainfall for the experimental period was 412mm
1GPWUI = = total product/total water applied
2IWUI = total product/irrigation water applied
3MIWUI = marginal production due to irrigation/irrigation water applied
Page 27
25
Table 4. Summary statistics indicating model performance for pasture consumption
for each irrigation treatment and grazing event.
Summary statistic
Measured mean 1.21
Simulated mean 1.29
Mean bias -0.08
r2 0.93
Mean prediction error 18.45%
Modeling efficiency 0.88
Variance ratio 0.87
Bias correction factor 0.99
Concordance correlation coefficient 0.95
Page 28
26
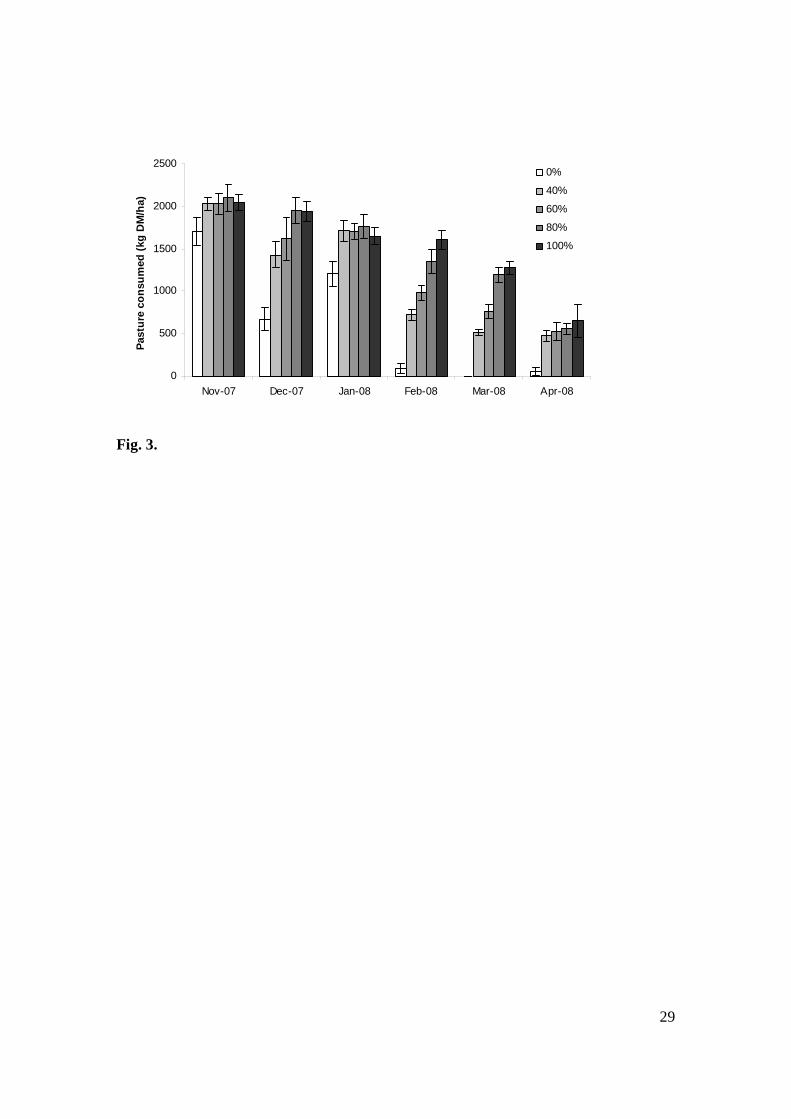
Fig. 1. Accumulated rainfall deficit (mm) of the 100% irrigation treatment and the daily
irrigation or rainfall event (mm) for the experimental period.
Fig. 2. Daily soil water potential of the 5 irrigation treatments at a depth of 15 cm (a), 30
cm (b) and 45 cm (c).
Fig. 3. Individual average pasture consumption (kg DM/ha) for each grazing event under
each irrigation treatment. Standard error of means shown as error bars.
Fig. 4. Actual ( ) and modeled ( ) pasture consumption for each irrigation treatment
100% (a), 80%(b), 60%(c), 40%(d) and 0%(e) at each of the 6 grazing events.
Fig. 5. Box and whisker plots showing 10th, 25th, 50th, 75th and 90th percentiles of the
marginal irrigation water use index (t DM/ML) for 5 dairy regions, Elliott (a), Scottsdale
(b), Smithton (c), Deloraine (d) and Bushy Park (e) for the period of 1967 to 2006.
Simulation outputs for nitrogen applied at 230 kg/ha/year shown as ( ) and for non-
limiting nitrogen shown as ( ).
Page 29
27
05
101520253035404550556065
01-Oct
15-Oct
29-Oct
12-Nov
26-Nov
10-Dec
24-Dec
07-Jan
21-Jan
04-Feb
18-Feb
03-Mar
17-Mar
31-Mar
14-Apr
Irrig
atio
n or
rain
fall (
mm
/day
)
-26.0-24.0-22.0-20.0-18.0-16.0-14.0-12.0-10.0-8.0-6.0-4.0-2.00.0
Accu
mul
ated
def
icit
(mm
)
Irrigation Rainfall Accumulated deficit
Fig. 1.
Page 30
28
0
25
50
75
100
125
150
175
200
01/11/07 22/11/07 13/12/07 03/01/08 24/01/08 14/02/08 06/03/08 27/03/08 17/04/08
Soil w
ater
pot
entia
l (-K
pa)
0
25
50
75
100
125
150
175
200
01/11/07 22/11/07 13/12/07 03/01/08 24/01/08 14/02/08 06/03/08 27/03/08 17/04/08
Soil w
ater
pot
entia
l (-K
pa)
0
25
50
75
100
125
150
175
200
01/11/07 22/11/07 13/12/07 03/01/08 24/01/08 14/02/08 06/03/08 27/03/08 17/04/08
Soil w
ater
pot
entia
l (-K
pa)
0% 40% 60% 80% 100%
Fig. 2.
Page 31
29
0
500
1000
1500
2000
2500
Nov-07 Dec-07 Jan-08 Feb-08 Mar-08 Apr-08
Past
ure
cons
umed
(kg
DM
/ha)
0%
40%
60%
80%
100%
Fig. 3.
Page 32
30
0
0.5
1
1.5
2
2.5
Nov-07 Dec-07 Jan-08 Feb-08 Mar-08 Apr-08
past
ure
cons
umed
(t D
M/h
a)
0
0.5
1
1.5
2
2.5
Nov-07 Dec-07 Jan-08 Feb-08 Mar-08 Apr-08
past
ure
cons
umed
(t D
M/h
a)
0
0.5
1
1.5
2
2.5
Nov-07 Dec-07 Jan-08 Feb-08 Mar-08 Apr-08
past
ure
cons
umed
(t D
M/h
a)
0
0.5
1
1.5
2
2.5
Nov-07 Dec-07 Jan-08 Feb-08 Mar-08 Apr-08
past
ure
cons
umed
(t D
M/h
a)
0
0.5
1
1.5
2
2.5
Nov-07 Dec-07 Jan-08 Feb-08 Mar-08 Apr-08
past
ure
cons
umed
(t D
M/h
a)
Fig. 4.
Page 33
31
0
0.5
1
1.5
2
2.5
3
3.5
4
40% 60% 80% 100%
Deficit irrigation treatment
MIW
UI (
t DM
/ML)
a
0
0.5
1
1.5
2
2.5
3
3.5
4
40% 60% 80% 100%
Deficit irrigation treatment
MIW
UI (
t DM
/ML)
a
0
0.5
1
1.5
2
2.5
3
3.5
4
40% 60% 80% 100%
Deficit irrigation treatment
MIW
UI (
t DM
/ML)
b
0
0.5
1
1.5
2
2.5
3
3.5
4
40% 60% 80% 100%
Deficit irrigation treatment
MIW
UI (
t DM
/ML)
b
0
0.5
1
1.5
2
2.5
3
3.5
4
40% 60% 80% 100%
Deficit irrigation treatment
MIW
UI (
t DM
/ML)
c
0
0.5
1
1.5
2
2.5
3
3.5
4
40% 60% 80% 100%
Deficit irrigation treatment
MIW
UI (
t DM
/ML)
c
0
0.5
1
1.5
2
2.5
3
3.5
4
40% 60% 80% 100%
Deficit irrigation treatment
MIW
UI (
t DM
/ML)
d
0
0.5
1
1.5
2
2.5
3
3.5
4
40% 60% 80% 100%
Deficit irrigation treatment
MIW
UI (
t DM
/ML)
d
0
0.5
1
1.5
2
2.5
3
3.5
4
40% 60% 80% 100%
Deficit irrigation treatment
MIW
UI (
t DM
/ML)
e
0
0.5
1
1.5
2
2.5
3
3.5
4
40% 60% 80% 100%
Deficit irrigation treatment
MIW
UI (
t DM
/ML)
e
Fig. 5.
Page 34
32
Appendix 1 – PowerPoint slides presented at field day.