15
Manhattan Beach Residential Real Estate Market Conditions August 2014
| Date post: | 17-Jul-2015 |
| Category: |
Real Estate |
| Upload: | hhc-south-bay-real-estate-agents |
| View: | 24 times |
| Download: | 0 times |

Table of
Contents
Key Statistics for August
Sales 2014 Residential Sales Stats Year-to-Year Total Sales by Map Area Median 2014 Median Sales Stats Year-to-Year Median Sales by Map Area Listings 2014 Active Listings by Map Area 2014 Total Active Listings vs. Total Sales Year-to-Year Active Listings by Map Area Inventory 2014 Months of Inventory by Map Area Year-to-Year Months of Inventory
Outlook for September
About Hady Chahine Contact Information

Key Statistics for August
Back to Table of Contents
= trending positive = trending positive
= trending negative = trending negative
Month-to-Month Comparison Jul 2014 Aug 2014 Delta (qty) Delta (%) Increase Decrease
Total Sales 36 39 3 8.3%
Median Sales Price 1,927,500 1,900,000 (27,500) -1.4%
Median Days to Sell 43 34 -9 -20.9%
Listings 78 76 -2 -2.6%
Sales/Listing Ratio 46.2% 51.3% 0.051 11.0%
Months of Inventory 2.2 2.0 -0.2 -9.1%
Monthly Comparison Year-to-Year Aug 2013 Aug 2014 Delta Delta Increase Decrease
Total Sales 40 39 -1 -2.5%
Median Sales Price 1,685,000 1,900,000 215,000 12.8%
Median Days to Sell 34 34 0 0.0%
Listings 83 76 -7 -8.4%
Months of Inventory 2.0 2.0 0 0.0%
Back to Table of Contents
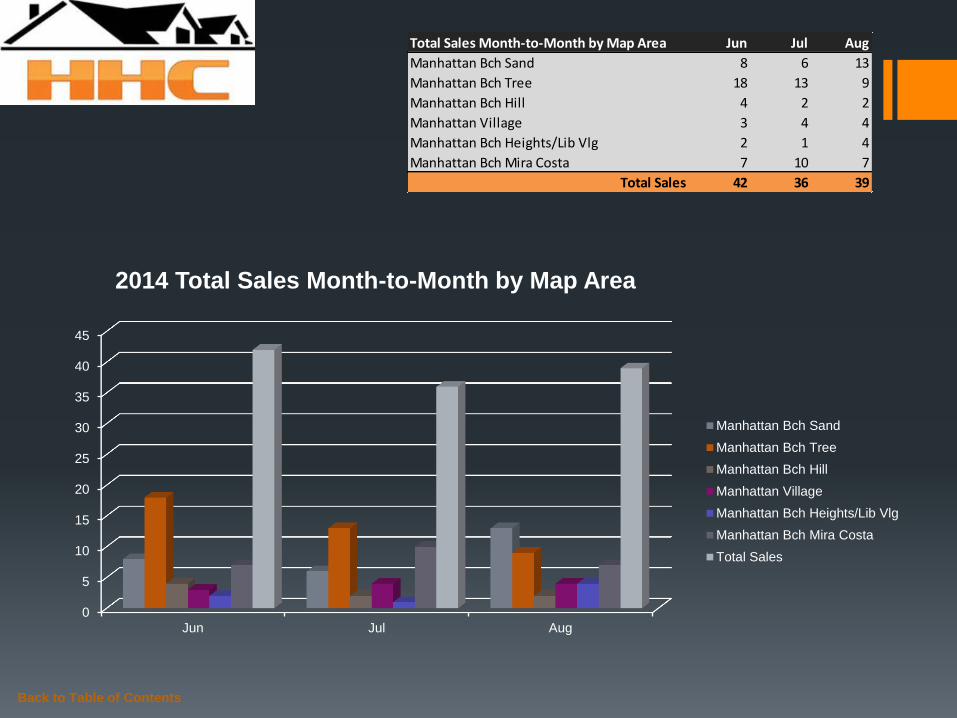
Total Sales Month-to-Month by Map Area Jun Jul Aug
Manhattan Bch Sand 8 6 13
Manhattan Bch Tree 18 13 9
Manhattan Bch Hill 4 2 2
Manhattan Village 3 4 4
Manhattan Bch Heights/Lib Vlg 2 1 4
Manhattan Bch Mira Costa 7 10 7
Total Sales 42 36 39
0
5
10
15
20
25
30
35
40
45
Jun Jul Aug
2014 Total Sales Month-to-Month by Map Area
Manhattan Bch Sand
Manhattan Bch Tree
Manhattan Bch Hill
Manhattan Village
Manhattan Bch Heights/Lib Vlg
Manhattan Bch Mira Costa
Total Sales

Back to Table of Contents
Total Sales Year-to-Year by Map Area 2012 2013 2014
Manhattan Bch Sand 8 7 13
Manhattan Bch Tree 19 16 9
Manhattan Bch Hill 3 5 2
Manhattan Village 0 1 4
Manhattan Bch Heights/Lib Vlg 3 4 4
Manhattan Bch Mira Costa 12 7 7
Total Sales 45 40 39
0
5
10
15
20
25
30
35
40
45
2012 2013 2014
Total Sales Year-to-Year by Map Area: August
Manhattan Bch Sand
Manhattan Bch Tree
Manhattan Bch Hill
Manhattan Village
Manhattan Bch Heights/Lib Vlg
Manhattan Bch Mira Costa
Total Sales
Back to Table of Contents
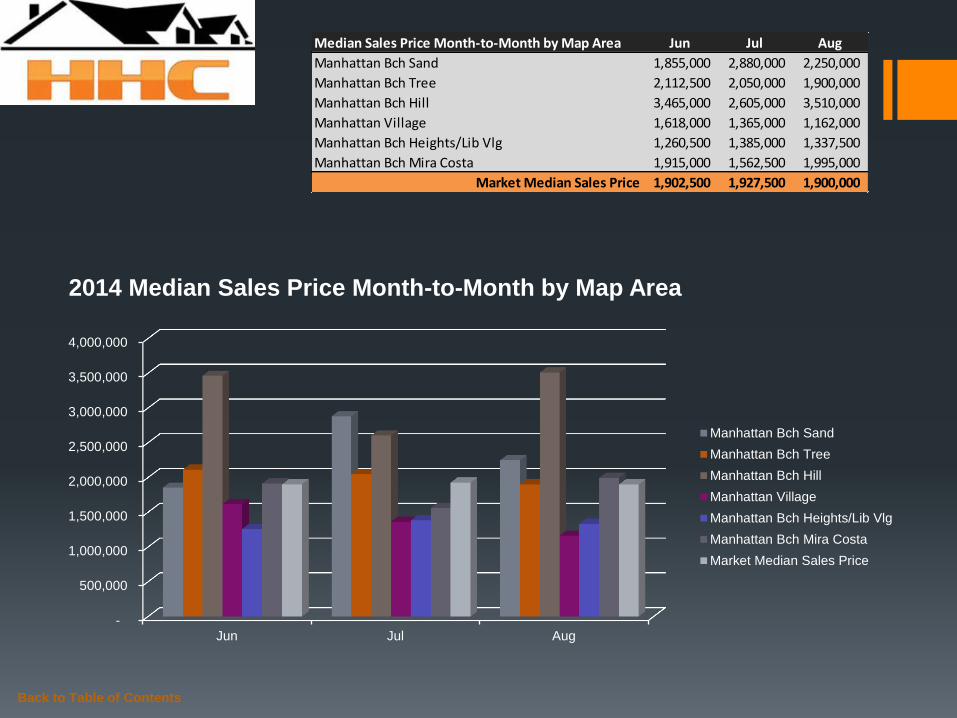
Median Sales Price Month-to-Month by Map Area Jun Jul Aug
Manhattan Bch Sand 1,855,000 2,880,000 2,250,000
Manhattan Bch Tree 2,112,500 2,050,000 1,900,000
Manhattan Bch Hill 3,465,000 2,605,000 3,510,000
Manhattan Village 1,618,000 1,365,000 1,162,000
Manhattan Bch Heights/Lib Vlg 1,260,500 1,385,000 1,337,500
Manhattan Bch Mira Costa 1,915,000 1,562,500 1,995,000
Market Median Sales Price 1,902,500 1,927,500 1,900,000
-
500,000
1,000,000
1,500,000
2,000,000
2,500,000
3,000,000
3,500,000
4,000,000
Jun Jul Aug
2014 Median Sales Price Month-to-Month by Map Area
Manhattan Bch Sand
Manhattan Bch Tree
Manhattan Bch Hill
Manhattan Village
Manhattan Bch Heights/Lib Vlg
Manhattan Bch Mira Costa
Market Median Sales Price
Back to Table of Contents
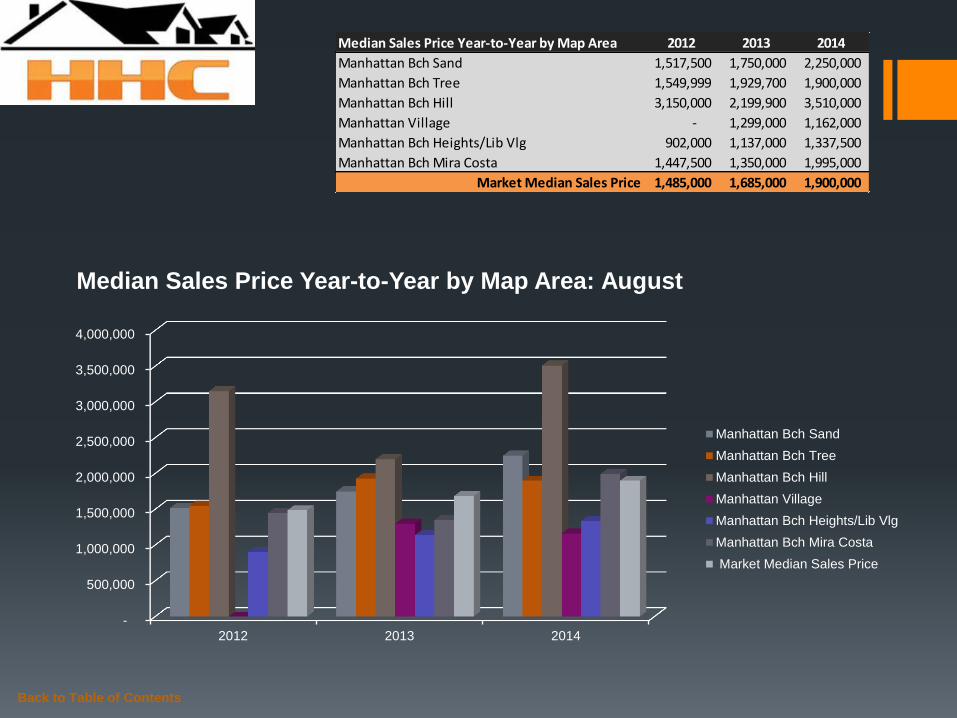
Median Sales Price Year-to-Year by Map Area 2012 2013 2014
Manhattan Bch Sand 1,517,500 1,750,000 2,250,000
Manhattan Bch Tree 1,549,999 1,929,700 1,900,000
Manhattan Bch Hill 3,150,000 2,199,900 3,510,000
Manhattan Village - 1,299,000 1,162,000
Manhattan Bch Heights/Lib Vlg 902,000 1,137,000 1,337,500
Manhattan Bch Mira Costa 1,447,500 1,350,000 1,995,000
Market Median Sales Price 1,485,000 1,685,000 1,900,000
-
500,000
1,000,000
1,500,000
2,000,000
2,500,000
3,000,000
3,500,000
4,000,000
2012 2013 2014
Median Sales Price Year-to-Year by Map Area: August
Manhattan Bch Sand
Manhattan Bch Tree
Manhattan Bch Hill
Manhattan Village
Manhattan Bch Heights/Lib Vlg
Manhattan Bch Mira Costa
Market Median Sales Price

Back to Table of Contents
Active Listings vs. Total Sales by Map Area Jan Feb Mar Apr May Jun Jul Aug Sep Oct Nov Dec
Manhattan Bch Sand 15 15 17 13 19 24 23 30
Manhattan Bch Tree 10 10 21 28 21 19 14 13
Manhattan Bch Hill 5 6 10 10 12 6 6 5
Manhattan Village - 2 5 7 7 9 8 6
Manhattan Bch Heights/Lib Vlg 7 9 7 10 2 6 5 4
Manhattan Bch Mira Costa 8 7 13 20 24 19 22 18
Total Active Listings 45 49 73 88 85 83 78 76
-
5
10
15
20
25
30
Jan Feb Mar Apr May Jun Jul Aug Sep Oct Nov Dec
2014 Active Listings by Map Area
Manhattan Bch Sand
Manhattan Bch Tree
Manhattan Bch Hill
Manhattan Village
Manhattan Bch Heights/Lib Vlg
Manhattan Bch Mira Costa
Back to Table of Contents
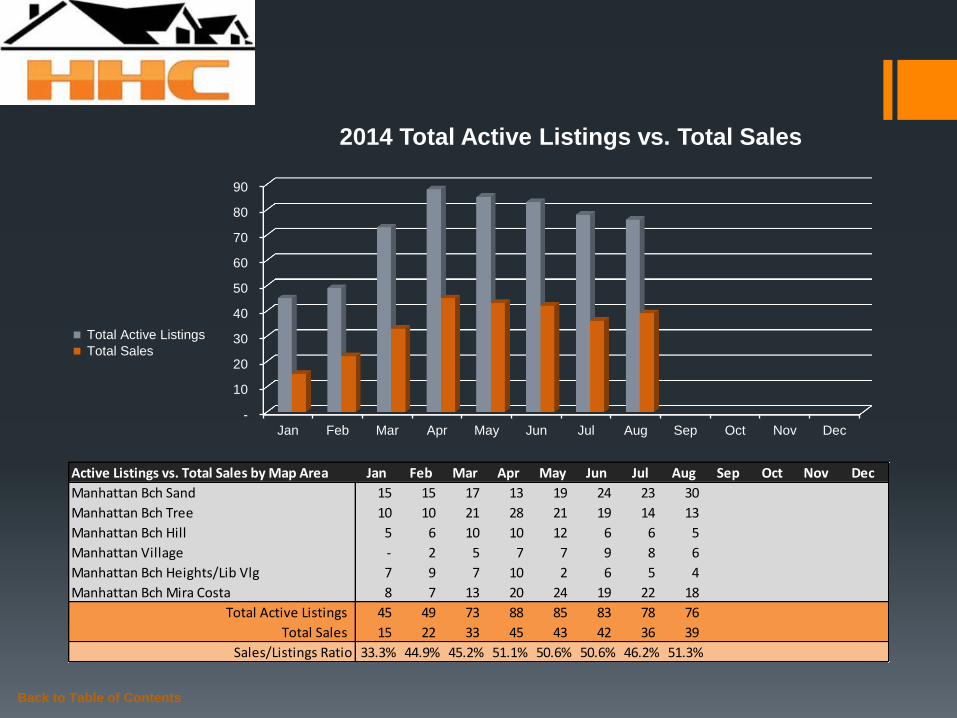
Active Listings vs. Total Sales by Map Area Jan Feb Mar Apr May Jun Jul Aug Sep Oct Nov Dec
Manhattan Bch Sand 15 15 17 13 19 24 23 30
Manhattan Bch Tree 10 10 21 28 21 19 14 13
Manhattan Bch Hill 5 6 10 10 12 6 6 5
Manhattan Village - 2 5 7 7 9 8 6
Manhattan Bch Heights/Lib Vlg 7 9 7 10 2 6 5 4
Manhattan Bch Mira Costa 8 7 13 20 24 19 22 18
Total Active Listings 45 49 73 88 85 83 78 76
Total Sales 15 22 33 45 43 42 36 39
Sales/Listings Ratio 33.3% 44.9% 45.2% 51.1% 50.6% 50.6% 46.2% 51.3%
-
10
20
30
40
50
60
70
80
90
Jan Feb Mar Apr May Jun Jul Aug Sep Oct Nov Dec
2014 Total Active Listings vs. Total Sales
Total Active Listings
Total Sales

Back to Table of Contents
Active Listings Year-to-Year by Map Area 2012 2013 2014
Manhattan Bch Sand 40 24 30
Manhattan Bch Tree 17 16 13
Manhattan Bch Hill 10 15 5
Manhattan Village 5 5 6
Manhattan Bch Heights/Lib Vlg 9 8 4
Manhattan Bch Mira Costa 27 15 18
Total Active Listings 108 83 76
0
20
40
60
80
100
120
2012 2013 2014
Active Listings Year-to-Year by Map Area: August
Manhattan Bch Sand
Manhattan Bch Tree
Manhattan Bch Hill
Manhattan Village
Manhattan Bch Heights/Lib Vlg
Manhattan Bch Mira Costa
Total Active Listings

Back to Table of Contents
Months of Inventory by Map Area Jan Feb Mar Apr May Jun Jul Aug Sep Oct Nov Dec
Manhattan Bch Sand 3.8 1.4 2.4 1.1 1.9 3.0 3.8 2.3
Manhattan Bch Tree 3.3 2.5 2.3 2.6 1.3 1.1 1.1 1.4
Manhattan Bch Hill 5.0 3.0 2.5 1.1 12.0 1.5 3.0 2.5
Manhattan Village - - 2.5 7.0 2.3 3.0 2.0 1.5
Manhattan Bch Heights/Lib Vlg 3.5 4.5 1.4 1.7 0.3 3.0 5.0 1.0
Manhattan Bch Mira Costa 2.7 2.3 2.2 3.3 4.0 2.7 2.2 2.6
-
2.0
4.0
6.0
8.0
10.0
12.0
Jan Feb Mar Apr May Jun Jul Aug Sep Oct Nov Dec
2014 Months of Inventory by Map Area
Manhattan Bch Sand
Manhattan Bch Tree
Manhattan Bch Hill
Manhattan Village
Manhattan Bch Heights/Lib Vlg
Manhattan Bch Mira Costa

Back to Table of Contents
Months of Inventory Year-to-Year Jan Feb Mar Apr May Jun Jul Aug Sep Oct Nov Dec
2012 6.8 6.1 2.4 2.6 2.8 2.9 3.0 2.4 4.1 3.2 2.1 1.9
2013 2.9 3.4 2.0 1.7 1.8 2.5 2.1 2.0 2.2 2.0 1.5 0.8
2014 3.0 2.2 2.2 2.0 2.0 2.0 2.2 2.0
-
1.0
2.0
3.0
4.0
5.0
6.0
7.0
Jan Feb Mar Apr May Jun Jul Aug Sep Oct Nov Dec
Months of Inventory Year-to-Year
2012
2013
2014
Outlook for September
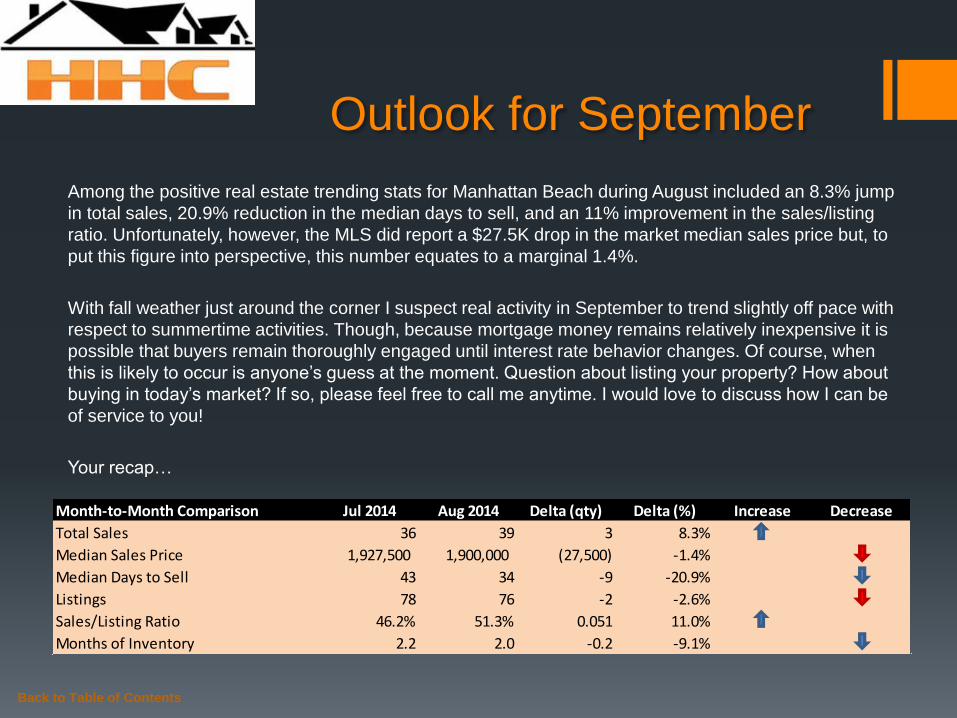
Among the positive real estate trending stats for Manhattan Beach during August included an 8.3% jump
in total sales, 20.9% reduction in the median days to sell, and an 11% improvement in the sales/listing
ratio. Unfortunately, however, the MLS did report a $27.5K drop in the market median sales price but, to
put this figure into perspective, this number equates to a marginal 1.4%.
With fall weather just around the corner I suspect real activity in September to trend slightly off pace with
respect to summertime activities. Though, because mortgage money remains relatively inexpensive it is
possible that buyers remain thoroughly engaged until interest rate behavior changes. Of course, when
this is likely to occur is anyone’s guess at the moment. Question about listing your property? How about
buying in today’s market? If so, please feel free to call me anytime. I would love to discuss how I can be
of service to you!
Your recap…
Back to Table of Contents
Month-to-Month Comparison Jul 2014 Aug 2014 Delta (qty) Delta (%) Increase Decrease
Total Sales 36 39 3 8.3%
Median Sales Price 1,927,500 1,900,000 (27,500) -1.4%
Median Days to Sell 43 34 -9 -20.9%
Listings 78 76 -2 -2.6%
Sales/Listing Ratio 46.2% 51.3% 0.051 11.0%
Months of Inventory 2.2 2.0 -0.2 -9.1%
Serving South Bay Home Buyers and Sellers Since 2001
RE/MAX Top 4 Team in California – 2012
RE/MAX 100% Club - 2011
Shorewood Realtors Top 5% in Overall Sales 2001-2006, 2008-2010
Back to Table of Contents
About
Hady Chahine…

The information being provided by CARETS (CLAW, CRISNet MLS, DAMLS, CRMLS, i-Tech MLS, and/or VCRDS) is for the visitor’s personal, non-commercial use and may not be used for
any purpose other than to identify prospective properties visitor may be interested in purchasing. Any information relating to a property referenced on this web site comes from the Internet
Data Exchange (IDX) program of CARETS. This web site may reference real estate listing(s) held by a brokerage firm other than the broker and/or agent who owns this web site. The accuracy
of all information, regardless of source, including but not limited to square footages and lot sizes, is deemed reliable but not guaranteed and should be personally verified through personal
inspection by and/or with the appropriate professionals.
Back to Table of Contents
Listings MLS BLOG Website


