45
CAPITAL POWER INVESTOR MEETINGS August 2015 Brian Vaasjo, President & CEO Tony Scozzafava, VP Taxation & Treasury
| Date post: | 14-Apr-2017 |
| Category: |
Documents |
| Upload: | capital-power |
| View: | 289 times |
| Download: | 2 times |

CAPITAL POWERINVESTOR MEETINGSAugust 2015
Brian Vaasjo, President & CEO
Tony Scozzafava, VP Taxation & Treasury

Capital Power overview
2
1) Based on MW owned capacity as of Jul 31/15; excludes Sundance PPA (371 MW).2) Subject to Board approval.3) Market capitalization as of July 31/15. Average daily trading volume on all stock exchanges for the 1-year period ended July 31/15.
Coal/SF47%
Gas35%
Wind18%
IPP with ownership interest in 17facilities in Canada and the UStotaling more than 3,200 MW(1)
Capital Power builds, owns andoperates power plants
Substantial growth in contractedoperating margins expected to significantlycover financial obligations and growingdividends in 2015 & beyond
Strong contracted cash flow basesupports annual dividend growth(2)
(recently announced a 7.4% increase to$1.46/share annualized effective Q3/15)
Well-positioned to weather bottom ofAlberta power market cycle with significant% of merchant cash flows hedged in thenear term
TSX (CPX); market cap of $2.2B(3);average daily trading 430K(3) shares

Capital Power’s value proposition
3
0 10 20 30 40 50 60
Genesee 2Genesee 1Genesee 3Keephills 3
RoxboroSouthport
JoffreIsland GenerationClover Bar Unit 1Clover Bar Unit 2Clover Bar Unit 3
Shepard Energy CentreKingsbridge I
K2 WindMacho Springs
Quality WindHalkirk
Port Dover & Nanticoke
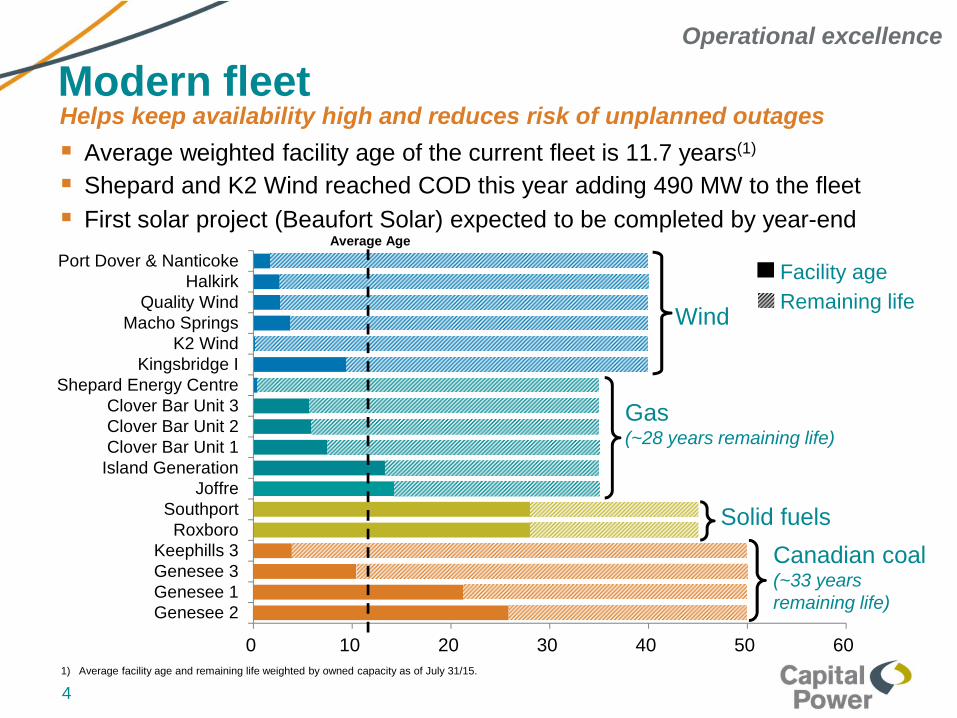
Modern fleetHelps keep availability high and reduces risk of unplanned outages
Average weighted facility age of the current fleet is 11.7 years(1)
Shepard and K2 Wind reached COD this year adding 490 MW to the fleet
First solar project (Beaufort Solar) expected to be completed by year-end
1) Average facility age and remaining life weighted by owned capacity as of July 31/15.
Facility age
Remaining life
Gas(~28 years remaining life)
Wind
Canadian coal(~33 yearsremaining life)
Solid fuels
Operational excellence
Average Age
4
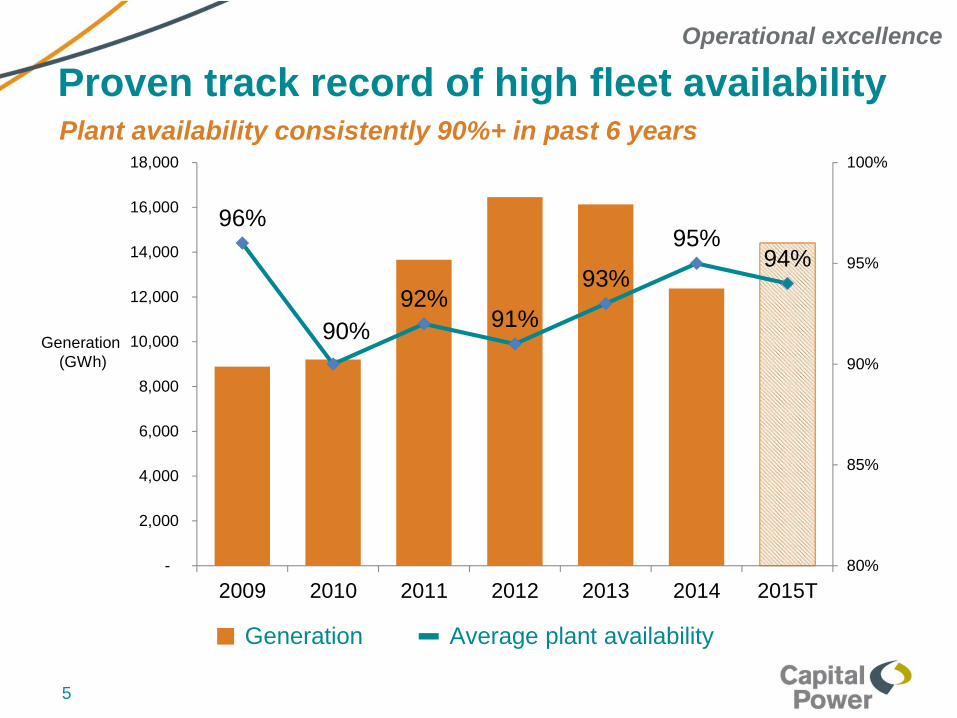
Proven track record of high fleet availabilityPlant availability consistently 90%+ in past 6 years
Generation(GWh)
Generation Average plant availability
96%
90%
92%91%
93%
95%94%
-
2,000
4,000
6,000
8,000
10,000
12,000
14,000
16,000
18,000
2009 2010 2011 2012 2013 2014 2015T
80%
85%
90%
95%
100%
Operational excellence
5

Excellent track record of development
Asset Capacity / fuel On-time On-budget In-Service
Genesee 3(1) (AB) 516 MW / coal + 2005
Kingsbridge 1 (ON) 40 MW / wind 2006
Clover Bar EnergyCentre (AB)
243 MW / gas + 2009
Keephills 3(1) (AB) 495 MW / coal - - 2011
Halkirk (AB) 150 MW / wind + 2012
Quality Wind (BC) 142 MW / wind + 2012
Port Dover &Nanticoke (ON)
105 MW / wind + 2013
Met expectations at full notice to proceed+ Better than expected- Worse than expected
Outstanding track record of completing 7 construction projects(supercritical coal, natural gas, wind) totaling 1,691 MW
Operational excellence
1) Joint venture with TransAlta Corporation; each party has a 50% ownership interest.
6

0
200
400
600
800
1000
1200
1400
1600
1800
Capital Power ENMAX TransAlta ATCO Other
Genesee 4&5 Renewables Thermal
Capital Power is the leading developer inthe AB market
Generation built in Alberta since 2004(1)
1) Includes Shepard Energy Centre and excludes generation for oilsand developments and coal-fired unit expansions.
(MW)
Proposed Genesee 4&5
Proposed Genesee 4&5
Operational excellence
7

Financial strength
Investment grade credit ratings
Debt-to-capital ratio remains belowlong-term target of 40% - 50%
Debt to total capitalization
33% 30%
0%
10%
20%
30%
40%
50%
2014 2015T
Long-term target 40% - 50%
Strong balance sheet and investment grade credit rating
Agency Ratings Outlook
S&P BBB- / P-3 Stable
DBRS BBB / Pfd-3 (low) Stable
Corporate Liquidity(1)
0.0
0.5
1.0
1.5
2.0
2.5
3.0
2014
1) December 31, 2014 forward-looking estimate.
Strong financial base
8

1) Metrics applicable to Capital Power L.P.2) Based on S&P’s weighted average ratings methodology.
Credit metrics(1)
Above DBRS financial criteria for current rating
EBITDA/Adj. Interest
0.0
1.0
2.0
3.0
4.0
5.0
6.0
2015T
Adj. Cash flow/Adj. Debt
0%
5%
10%
15%
20%
25%
30%
2015T
Within S&P financial criteria for investment grade ratingAdj. FFO/Adj. Debt(2)
0%
5%
10%
15%
20%
25%
2015T
Adj. Debt/Adj. EBITDA(2)
0.00.51.01.52.02.53.03.54.04.5
2015T
Capacity foradditional debt
Strong financial base
9

Continued strong cash flow generation
Cash flow expected to increase~8% in 2015
~40% of 2015 FFO isdiscretionary cash flow (DCF)
At the mid-point of guidancerange, generating ~$200M incash flow before growth capexto reinvest in the business atthe bottom of the Alberta powermarket cycle
Funds from operations (FFO)
1) 2015 FFO target represents the mid-point of $365 - $415M guidance range.2) Discretionary cash flow (DCF) is a non-GAAP financial measure. DCF = FFO - sustaining capex - total common and preferred share dividends and CPLP distributions.
$0
$50
$100
$150
$200
$250
$300
$350
$400
$450
2012 2013 2014 2015T
42%
21% 17%
40%
43%
31%
36%
33%($M)
19%
48%
33%
37%
(1)
Discretionary cash flow
Gross dividends (common & preferred shares)
Sustaining capex
(2)
Strong financial base
10

$0
$50
$100
$150
$200
$250
$300
$350
$400
2012 2013 2014 2015F 2016F 2017F
K2 Wind
Shepard
Macho Springs
PD&N
Halkirk
Quality Wind
Island Generation
North Carolina
Kingsbridge 1
Genesee 1&2
Improving contracted cash flow(1,2)
($M)
3 windprojects}
Shepard& K2Wind}
Substantial expansion in contracted operating margin from 2012 to 2016
11
1) Margins have been averaged over the periods except in the year of commissioning.2) Only includes contracted portions of Halkirk and Shepard plants.
Contracted cash flows

50%
60%
70%
80%
90%
100%
2013 2014 2015F 2016F 2017F
1) Based on existing plants plus committed development projects. Financial obligations include interest payments (including interest during construction), sustainingcapital expenditures and general & administration expenses.
2) Dividends include common and preferred dividends. Assumes consistent dividend growth in 2015-17 subject to Board approval.
12
Strong financial coverageContracted operating margin to
financial obligations(1) and dividends(2) With addition of Shepard
and K2 Wind in 2015,substantial expansion in ourcontracted operating margin
Annual dividend growth of10 cents in 2014 (7.9%) and2015 (7.4%) supported bygrowing contracted cashflows
Expect significant coverage(including assumption ofconsistent dividend growth)in 2015 and beyond
Well positioned for consistent dividend growth
Contracted cash flows

Dividend increase
Effective with Q3/15, quarterlydividend increased 7.4% to $0.365from $0.34 per share
Contracted cash flow base has grownsignificantly with the recent additionsof Shepard and K2 Wind in 2015
Dividend increase based onCompany’s confidence in its growingand sustainable cash flows from asolid base of contracted assets
(1) 2013 and 2014 annualized dividend based on year-end quarterly dividend amount.(2) Subject to Board approval.
A 10 cents per share increase (7.4%) to the annual dividend
Annualized dividendper common share(1)
$1.26
$1.36
$1.46
2013 Y/E 2014 Y/E EffectiveQ3/15
Well positioned to consistently increase the dividend(2)
while also investing in growth opportunities
13
Contracted cash flows

Capital allocation
Dividend
Growth
Growth
Opportunities
Repurchase
Potential
CapitalAllocation
(1) Growing contracted cash flow base supportsdividend growth
(2) Well positioned to fund or partially fundany new significant growth opportunities inthe near term with discretionary cash flow
(3) Active in debt reduction and share buybackabsent an acquisition or development project
Recently reduced debt by $75M Normal Course Issuer Bid (NCIB) approved in
Apr/15 to purchase up to 5M common sharesover a 1-year period (repurchased 1.6M sharesas of June 30/15)
Strong financial base
14

Oil & gas development drives load growth in Alberta
Alberta demand relative to oil prices
Alberta demand growing modestly in new oil price environment 2015 year-to-date load growth of 1.5% Long term fundamentals remain strong
AB power market upside
15
0
20
40
60
80
100
120
0.0%
1.0%
2.0%
3.0%
4.0%
5.0%
6.0%
Alberta Load Growth & West Texas Intermediate (1)
Alberta Internal Load Growth (Left) AIL Growth (12-Month Rolling Average) WTI (Right)
Oil Price ($/bbl)AIL Growth (%)
(1) Alberta Internal Load normalized for weatherSource: CPC, EIA

Expected coal unit retirements - CSTRetirements under the federal Capital Stock Turnover (CST) regulations
1) Capital Power holds the PPA (371 MW) for Sundance Units 5 & 6 until PPA expiry in 2020.2) Represents units that Capital Power has ownership in.
-
500
1,000
1,500
2,000
2,500
3,000
3,500
4,000
4,500
5,000
5,500
6,000
6,500
20
15
20
17
20
19
20
21
20
23
20
25
20
27
20
29
20
31
20
33
20
35
20
37
20
39
20
41
20
43
20
45
20
47
20
49
20
51
20
53
20
55
20
57
20
59
20
61
Alberta coal generation (MW)
Facility
GenerationCapacity
(MW)
End of Life(Final
Regulations)
Battle River 3 149 2019Sundance 1 288 2019H.R. Milner 144 2019Sundance 2 288 2019Battle River 4 155 2025Sundance 3 362 2026Sundance 4 406 2027Sundance 5(1) 406 2028Sundance 6(1) 401 2029Battle River 5 385 2029Keephills 1 387 2029Keephills 2 406 2029Sheerness 1 390 2036Genesee 2(2) 430 2039Sheerness 2 390 2040Genesee 1(2) 430 2044Genesee 3(2) 516 2055Keephills 3(2) 495 2061
AB power market upside
16
869 MWs by 2019
Additional 1,329 MWs by 2028
Additional 1,579 MWs by 2029

0
5
10
15
0
25
50
75
100
2006 2007 2008 2009 2010 2011 2012 2013 2014 2015 2016 2017 2018 2019 2020
($/GJ)($/MWh)
Alberta Energy Prices(1)
Power Gas
Alberta market forecastsAB power market upside
1) Forecasts represents the average forecast from three leading 3rd party consulting firms.
17

Changes to AB’s emissions regulations Specified Gas Emitters Regulation (SGER) in Alberta requires
facilities that emit 100,000 tonnes or more of greenhouse gases peryear to reduce emissions intensity by a specific target
Alberta Government announced on June 25 changes to SGER:
2015 2016 2017
Emissions intensity reduction 12% 15% 20%
Alberta “Tech Fund” compliance costs(per tonne)
$15 $20 $30
Between 2016-2020, Capital Power’s increase in compliance costswill be partly mitigated by higher wholesale power prices directlycaused by the new regulations
Company has a significant inventory of low-cost carbon offset creditsthat have been developed over the past 8 years, which are expectedto offset the balance of the compliance costs through 2020
Alberta outlook
18

Diverse generation fleet in AlbertaWell positioned to capture value in Alberta’s merchant market
1) Capital Power’s expected percentages reflect ownership interest and excludes Sundance PPA. Source: AESO
Expected AB power generation stack for 2015(1)
Clover Bar Energy Centre• Most responsive peaking facility in the AB market• Captures peak pricing, backstops position
Shepard Energy Centre• 50% JV interest in 800 MW natural gas combined cycle facility• 50% of Capital Power’s capacity under 20-year PPA• Most effective gas facility, with lowest heat rate
Joffre Cogen• 192 MW capacity from jointly-owned mid-merit natural gas
combined cycle facility
Genesee 1, 2, 3; Keephills 3• G1 & 2 provides 860 MW of low cost baseload coal under PPA
through 2020• G3 and K3 provides 516 MW of merchant capacity from jointly-
owned and operated plants. Cleanest coal units in Canada withthe longest average life remaining of 43 years.
Halkirk Wind• One of the largest wind farms in AB; provides Renewable
Energy Credits into California market under long term contract• Unique geographical location provides greater captured price
Wind
Hydro
Coal
GasCogen
Gas mid-merit
Gas peaking
Other
0%
10%
20%
30%
40%
50%
60%
70%
80%
90%
100%
4%
30%
34%
20%
11%
AB power market upside
19

AB commercial portfolio positionsAlberta portfolio hedged positions (% sold forward)
Well positioned to weather the bottom of the powermarket cycle with a significant % of merchant cash
flows hedged in the near-term
As of Jun 30/15 2016 2017
Percentage sold forward(1) 86% 25%
Average contracted prices(2) ($/MWh) High-$40 High-$50
1) Based on the Alberta baseload plants and the acquired Sundance PPA plus a portion of Joffre and the uncontracted portion of Shepard Energy Centre baseload.2) The forecast average contracted prices may differ significantly from the future average realized prices as the hedged and unhedged positions have a varying mix of
differently priced blocks of power.
AB power market upside
20

$0
$25
$50
$75
$100
$125
Q1 Q2 Q3 Q4 Q1 Q2 Q3 Q4 Q1 Q2 Q3 Q4 Q1 Q2 Q3 Q4 Q1 Q2 Q3 Q4 Q1 Q2
Average AB spot power price Capital Power captured AB price
Alberta power market trading Portfolio optimization activities focused on managing exposure to
commodity risks, reducing volatility and creating incremental value
Average realized power price has exceeded spot power prices
by 19% on average over the past 5.5 years
2010 2011 2012 2013
($/MWh)
2014
AB power market upside
21
2015

0%
20%
40%
60%
80%
100%
120%
140%
160%
180%
2013 2014 2015F 2016F 2017F
1) Merchant margin is calculated using $40/MWh and $70/MWh and is based on hedged position as at June 30, 2015.2) Based on existing plants plus committed development projects. Financial obligations include interest payments (including interest during construction), sustaining capital
expenditures and general & administration expenses.3) Dividends include common and preferred dividends. Assumes consistent dividend growth in 2015-17.
Contracted +merchant ($40/MWh)
Contracted +merchant ($70/MWh)
Contracted margin
22
Financial obligations & dividends significantlycovered by contracted cash flow
Operating margin(1) to financial obligations(2) and dividends(3)
AB power market upside
2015F $0/MWh
2016F $0/MWh
2017F $31/MWh
Minimum Alberta power pricerequired to cover financial
obligations and dividends(3)

Growth opportunities in Canada
Wind
Natural Gas
23
Growth
Natural gas and wind development sites

Genesee 4&5 Joint venture partners with ENMAX to develop, construct, own, and operate
the 1,060 MW natural gas-fired combined cycle facilities
8-year tolling agreement with ENMAX for 50% of CP’s share of the output
All major regulatory approvals received to proceed with construction;Capital Power will lead the construction project and be the operator
Executed agreements with Mitsubishi Hitachi forsupply and maintenance of the world’s mostadvanced J-Class natural gas turbine technologyin commercial operation in a two train 1-on-1configuration
Targeting 2019 commercial operations date forGenesee 4
Genesee 4&5 to be built onexisting Genesee site west of
Edmonton, AB
Growth
24
Total project capital cost is $1.4B excluding IDC andrefundable transmission system contributionpayments
Expected unlevered after-tax IRR of approximately11% and will be accretive to earnings and cash flow

1
Wind
Natural Gas
Solar
Growth opportunities in the U.S.Natural gas and renewable development sites
25
Growth
In Dec/14, completed the acquisition of Element Power US for~US$69M (includes US$52M of project financing)
Primary driver for the acquisition was to build a portfolio ofdevelopment projects in strategic locations in the U.S.
• 10 wind development sites
• 4 solar development sites, including Beaufort Solar that has a15 MW solar contract with Duke Energy Progress, Inc.
Includes Macho Springs, a 50 MW operating wind project in LunaCounty, New Mexico
• COD in Nov 2011
• 20-year PPA with Tucson Electric Power; 100% contractedthrough 2031
• Tax Equity and Term Loan with MetLife
Element Power USGrowth
26

Element Power US – strategic fit
Market Strategy Element Sites
SPP • Strong wind regime• Adjacent to
transmission build-out• Affordable land
positions• Low construction cost
• 200 MW wind project in Kansas
UpperMidwest
• Coal dependency• Strong wind regime• Affordable land
positions• Low construction cost
• 99 MW wind project in North Dakota• 100 MW wind project in North Dakota• 150 MW wind project in Illinois• 182 MW wind project in Ohio• 200 MW wind project in Iowa• 60 MW wind project in Michigan• 200 MW wind project in Wisconsin
SERC • Coal dependency• Large land positions in
agricultural areas
• 15 MW solar project in North Carolina• 2 x 29 MW solar projects in Georgia
Growth
27

Beaufort Solar Construction underway on the
15 MW solar project in NorthCarolina, U.S.
Fully contracted facility with a15-year PPA with Duke Energy
Commercial operations date(COD) targeted for Dec/15
Sale leaseback structure; sell totax equity investor at COD inexchange for lease payments
Capital Power’s first solar project
28
Growth

Financial outlook Average Alberta power price of $43/MWh in first half of 2015,
consistent with our original forecast assumption of $44/MWh
At the beginning of the year, Alberta baseload position for 2015 wassignificantly hedged in the mid-$50/MWh
No change to revised FFO guidance; expect 2015 FFO in the lowerend of $365M to $415M guidance range
Company’s financial strength is based on the foundation of strongcontracted cash flow which is not significantly impacted by changingAlberta power prices – remain confident in our credit rating anddividend growth outlook
Based on year-to-date results and expectations for balanceof the year, outlook has modestly improved
Outlook
29

2015 YTD performance versus annual targetsOperational and financial targets
94% 94%
80%
85%
90%
95%
100%
2015 YTD Target
Plant availability
$0
$100
$200
$300
$400
2015 YTD Target
Funds from operations($M)
$178
$0
$50
$100
$150
$200
2015 YTD Target
Plant operating &maintenance expenses
($M)
$92
$0
$25
$50
$75
$100
2015 YTD Target
$35
Sustaining capex($M)
$65
$180 - $200 $365 - $415
On-track to meet 2015 targets
Outlook
30

Why invest in Capital Power
31
• Excellent assets in good markets with solid operatingperformance
• On-going improvements to operating cost base, fleetavailability and risks
Operationalexcellence
• Substantial growth in contracted operating marginsexpected to significantly cover financial obligations andgrowing dividends in 2015 and beyond
• Supports consistent annual dividend growth(1)
Contracted cashflows
• Own the best fleet in the best merchant power market inNorth America
• Well positioned to weather the bottom of the power marketcycle; significant % of merchant cash flows hedged in thenear-term
Alberta powermarket upside
• Genesee 4&5 best positioned to be the next large naturalgas-fired generation project to be built in Alberta
• Strong pipeline of contracted growth opportunities in NorthAmerica
Growth
Strong contracted cash flow growth supports annual dividend growth
Summary
1) Subject to Board approval.

Alberta power market Competitive wholesale and retail energy market
Installed generation capacity of 16 GW
Entire province is a single zone where power prices are determinedby the bid price of the incremental power generator – no capacitymarket
Well functioning and stable market design
Alberta continues to experience moderate load growth
Legislated retirement dates for coal fired plants
Approximately 600 MW of generation projects under constructionthat are expected to connect to the grid by end of 2015(1)
1) AESO Long Term Adequacy Metrics, May 2015
Appendix
32

Alberta generation and load mix
Generation mix outlook in 2034(2)Current installed generation(1)
(MW and % of installed capacity)
1) Source: AESO 2014 Market Statistics2) Source: AESO 2014 Long Term Outlook
Appendix
Coal2,509 MW
10%
Cogen6,737 MW
27%
Gas-Fired11,270 MW
45%
Hydro894 MW
4%
Wind2,679 MW
11%
Biomass/Other864 MW
3%
Coal6,27139%
Cogen4,48328%
Gas-Fired2,66016%
Hydro8946%
Wind1,4349%
Biomass/Other409 3%
33
Gas-fired and Cogen account for 44% of current generation, which isexpected to increase to 72% in the next two decades primarily from the
retirement of coal-fired units

Alberta demand by end use
2013 Demand by end use(1)
1) Source: AESO 2014 Long Term Outlook (May 2014)
Appendix
2034 Demand by end use(1)
Industrial45%
Oilsands19%
Residential13%
Commercial20%
Farm3%
Industrial40%
Oilsands29%
Residential11%
Commercial19%
Farm1%
34
Demand from Industrial and Oilsands account for 64% of current demand,that is expected to grow to 69% in 2034
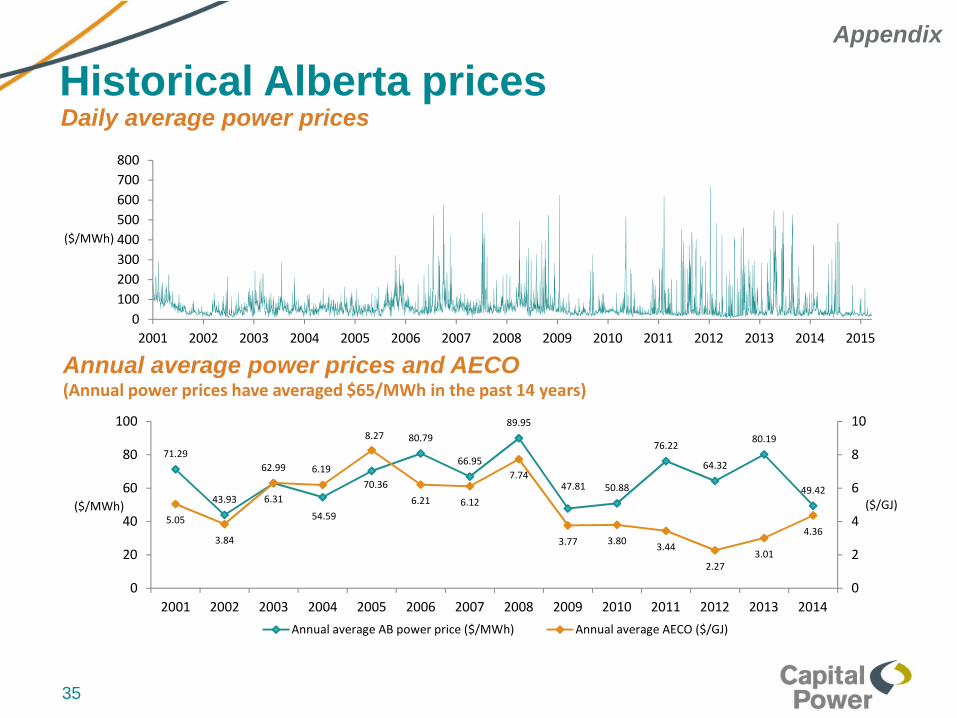
Historical Alberta pricesDaily average power prices
Annual average power prices and AECO(Annual power prices have averaged $65/MWh in the past 14 years)
Appendix
71.29
43.93
62.99
54.59
70.36
80.79
66.95
89.95
47.81 50.88
76.22
64.32
80.19
49.42
5.05
3.84
6.31
6.19
8.27
6.21 6.12
7.74
3.77 3.803.44
2.273.01
4.36
0
2
4
6
8
10
0
20
40
60
80
100
2001 2002 2003 2004 2005 2006 2007 2008 2009 2010 2011 2012 2013 2014
($/GJ)($/MWh)
Annual average AB power price ($/MWh) Annual average AECO ($/GJ)
0
100
200
300
400
500
600
700
800
2001 2002 2003 2004 2005 2006 2007 2008 2009 2010 2011 2012 2013 2014 2015
($/MWh)
35

Alberta market designStable market design has signalled the addition of 7 GW of new generation
Appendix
36
1) Source: AESO
0%
5%
10%
15%
20%
25%
30%
35%
40%
45%
0
200
400
600
800
1000
1200
1400
1600
2001 2002 2003 2004 2005 2006 2007 2008 2009 2010 2011 2012 2013 2014 2015E
ReserveMargin
Capacity(MW)
New Capacity AESO Reserve Margin
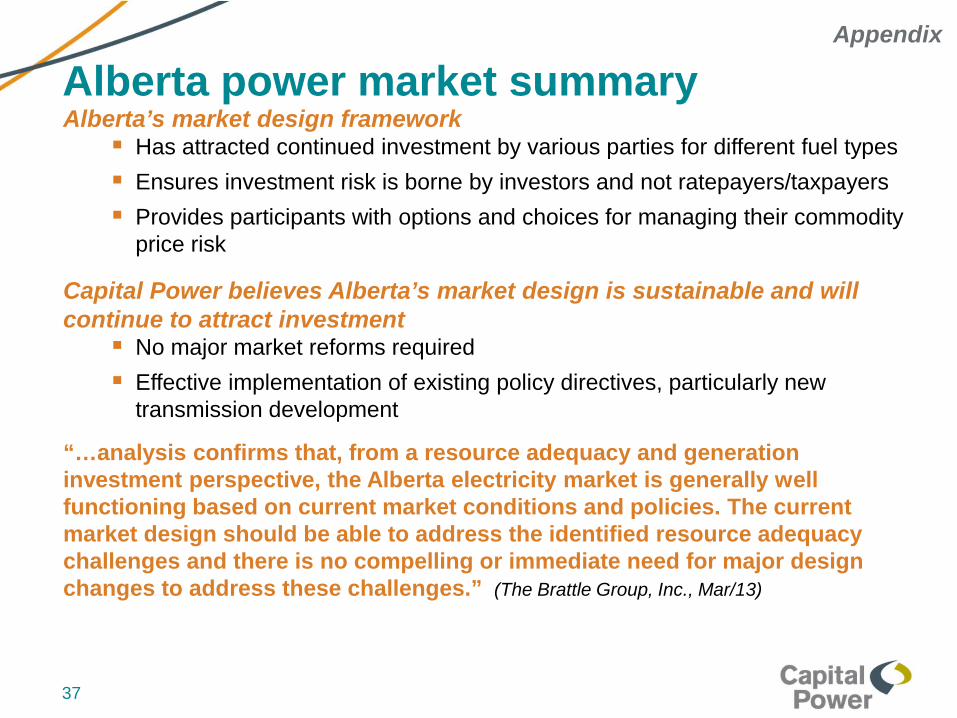
Alberta power market summaryAlberta’s market design framework Has attracted continued investment by various parties for different fuel types
Ensures investment risk is borne by investors and not ratepayers/taxpayers
Provides participants with options and choices for managing their commodityprice risk
Capital Power believes Alberta’s market design is sustainable and willcontinue to attract investment No major market reforms required
Effective implementation of existing policy directives, particularly newtransmission development
“…analysis confirms that, from a resource adequacy and generationinvestment perspective, the Alberta electricity market is generally wellfunctioning based on current market conditions and policies. The currentmarket design should be able to address the identified resource adequacychallenges and there is no compelling or immediate need for major designchanges to address these challenges.” (The Brattle Group, Inc., Mar/13)
Appendix
37

Capital Stock Turnover (CST)(CO2)
Clean Air Strategic Alliance(CASA) (NOx and SO2)
Limits unscrubbed coal-fired plantlife to 45-50 years
Unit Commercial Operation Date(COD) year• End of Life COD prior to 1975 = earlier
of 50 years or 2019• COD in or after 1975 but before 1986 =
earlier of 50 years or 2029• COD in or after 1986 = 50 year life or
end of PPA
All Capital Power coal assets given50 year-life
Keephills 2 and Keephills 1 onlyreceived 45, 46 year-life
Compliance through meetingphysical BATEA(1) or use of credits tofinancially comply 41st to 50th years
BATEA limit• SO2 = 0.65 kg/MWh• NOx = 0.47 kg/MWh
Credits must be sourced from samesector
Current emission levels from sub-critical units• SO2 = 1.7 to 6.8 kg/MWh• NOx = 1.6 to 2.5 kg/MWh
CST and CASA framework
Appendix
1) BATEA: Best available technology economically achievable
38
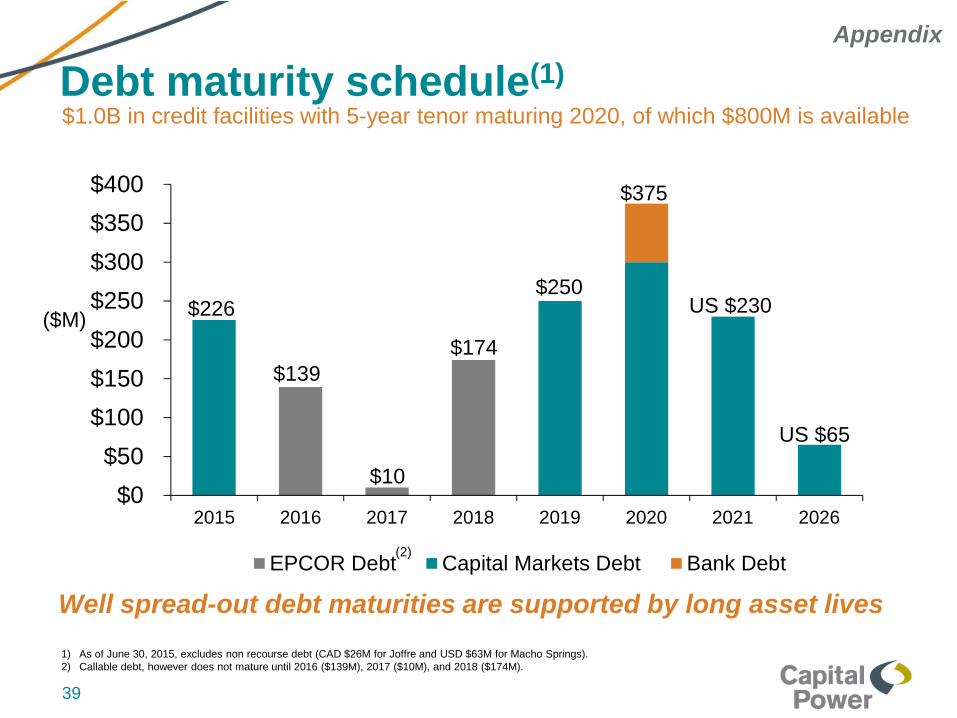
$226 US $230
$139
$10
$174
$250
$375
$0
$50
$100
$150
$200
$250
$300
$350
$400
2015 2016 2017 2018 2019 2020 2021 2026
EPCOR Debt Capital Markets Debt Bank Debt
US $65
Debt maturity schedule(1)
($M)
1) As of June 30, 2015, excludes non recourse debt (CAD $26M for Joffre and USD $63M for Macho Springs).2) Callable debt, however does not mature until 2016 ($139M), 2017 ($10M), and 2018 ($174M).
$1.0B in credit facilities with 5-year tenor maturing 2020, of which $800M is available
Well spread-out debt maturities are supported by long asset lives
(2)
Appendix
39

Summary of assets
Genesee1
Genesee2
Genesee3
Keephills3 Joffre
Clover BarEnergyCentre
CloverBar
Landfill Halkirk
ShepardEnergyCentre
Alberta Contracted Alberta Commercial
Capacity 430 MW 430 MW 516 MW 516 MW 480 MW 243 MW 5 MW 150 MW 800 MW
% owned /operated
100 / 100 100 / 100 50 / 100 50 / 0 40 / 0 100 / 100 100 / 100 100 / 100 50% / 0%
Location Warburg Warburg Warburg Wabamun Joffre Edmonton Edmonton Halkirk Calgary
Fuel &equipment
Coal (50%ownership ofcoal mine)
Coal (50%ownership ofcoal mine)
Coal (50%ownership ofcoal mine)
Coal Naturalgas
Natural gas(Two 100 MW GELMS100 turbines;43 MW GELM6000)
Landfillgas
Vestas windturbines
Natural gas
CommercialOperations
1994 1989 2005 2011 2000 Unit 1 in2008; units2&3 in 2009
2005 2012 2015
PPA Expiry 2020 2020 Merchant Merchant Merchant Merchant Merchant ~40% - 45%of totalrevenuesfrom 20-yearREC saleagreement /Merchant
20-yeartollingagreement on50% ofCapitalPower’soutput
Appendix
40

Summary of assetsKingsbridge
1
IslandGeneration
QualityWind
Port Dover& Nanticoke K2 Wind Roxboro Southport
MachoSprings
Ontario & British Columbia Contracted U.S. Contracted
Capacity 40 MW 275 MW 142 MW 105 MW 270 MW 46 MW 88 MW 50 MW
% owned /operated
100 / 100 100 / 100 100 / 100 100 / 100 33.3%owned
100 / 100 100 / 100 100 / 100
Location Goderich,Ontario
CampbellRiver, BC
NearTumblerRidge, BC
Located inthe countiesof NorfolkandHaldimand,Ontario
Ashfield-Colborne-Wawanosh,Ontario
Roxboro,NorthCarolina
Southport,NorthCarolina
LunaCounty,NewMexico
Fuel &equipment
Vestaswindturbines
Natural gas(AlstomGT24B gasturbine &Alstom steamturbine)
Vestaswindturbines
Vestas windturbines
Siemenswindturbines
Mixture ofwoodresiduals,tire-derivedfuel andcoal
Mixture ofwoodresiduals,tire-derivedfuel andcoal
Vestaswindturbines
CommercialOperations
2006,2001
2002 2012 2013 2015 1987 1987 2011
PPA Expiry 2026 /2027
2022 2037 2033 2035 2021 2021 2031
Appendix
41
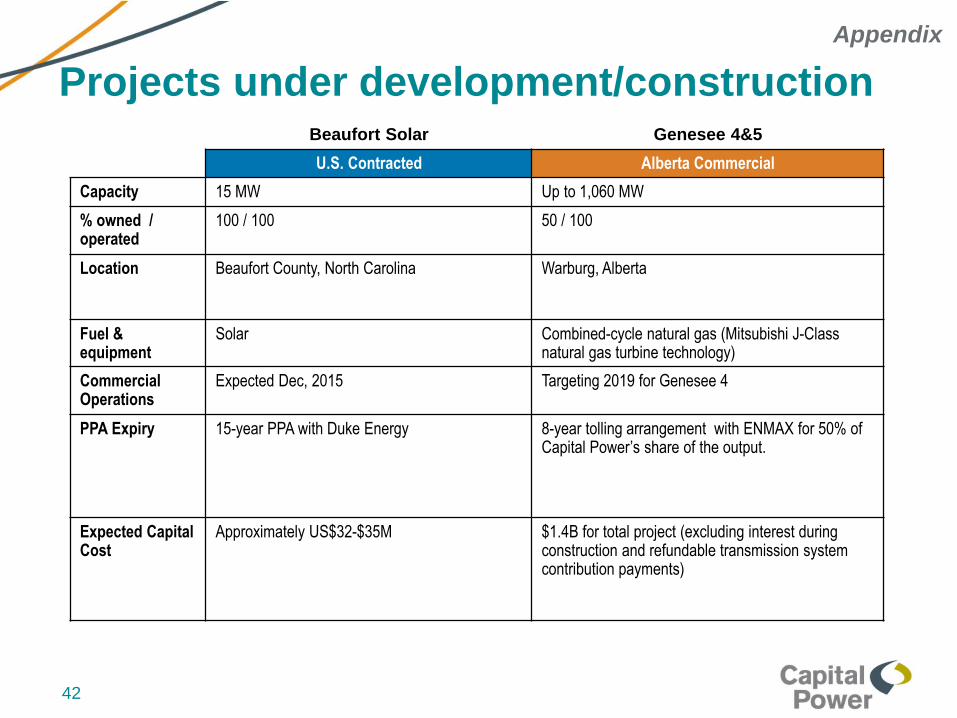
Beaufort Solar Genesee 4&5
U.S. Contracted Alberta Commercial
Capacity 15 MW Up to 1,060 MW
% owned /operated
100 / 100 50 / 100
Location Beaufort County, North Carolina Warburg, Alberta
Fuel &equipment
Solar Combined-cycle natural gas (Mitsubishi J-Classnatural gas turbine technology)
CommercialOperations
Expected Dec, 2015 Targeting 2019 for Genesee 4
PPA Expiry 15-year PPA with Duke Energy 8-year tolling arrangement with ENMAX for 50% ofCapital Power’s share of the output.
Expected CapitalCost
Approximately US$32-$35M $1.4B for total project (excluding interest duringconstruction and refundable transmission systemcontribution payments)
Projects under development/construction
Appendix
42

The Company uses (i) earnings before finance expense, income tax expense,depreciation and amortization, impairments, foreign exchange gains or losses, and gainson disposals (adjusted EBITDA), (ii) funds from operations (FFO), (iii) normalizedearnings attributable to common shareholders, and (iv) normalized earnings per share asfinancial performance measures.
These terms are not defined financial measures according to GAAP and do not havestandardized meanings prescribed by GAAP and, therefore, are unlikely to becomparable to similar measures used by other enterprises. These measures should notbe considered alternatives to net income, net income attributable to shareholders of theCompany, net cash flows from operating activities or other measures of financialperformance calculated in accordance with GAAP. Rather, these measures are providedto complement GAAP measures in the analysis of the Company’s results of operationsfrom management’s perspective.
Reconciliations of these Non-GAAP financial measures are contained in the Company’sManagement’s Discussion and Analysis prepared as of July 24, 2015 for the quarterended June 30, 2015, which is available under the Company’s profile on SEDAR atSEDAR.com and on the Company’s website at capitalpower.com.
Non-GAAP financial measures
43

Forward-looking information or statements included in this presentation are provided to inform the Company’s shareholders and potential investors aboutmanagement’s assessment of Capital Power’s future plans and operations. This information may not be appropriate for other purposes. The forward-lookinginformation in this presentation is generally identified by words such as will, anticipate, believe, plan, intend, target, and expect or similar words that suggest futureoutcomes.
Material forward-looking information includes expectations regarding:• future revenues, expenses, earnings and funds from operations,• the future pricing of electricity and market fundamentals in existing and target markets,• the Company’s future cash requirements including interest and principal repayments, capital expenditures, dividends and distributions,• the Company’s sources of funding, adequacy and availability of committed bank credit facilities and future borrowings,• future growth and emerging opportunities in the Company’s target markets including the focus on certain technologies,• the timing of, funding of, and costs for existing, planned and potential development projects and acquisitions• plant availability and planned outages,• capital expenditures for plant maintenance and other, and,• future income taxes payable.
These statements are based on certain assumptions and analyses made by the Company in light of its experience and perception of historical trends, currentconditions, expected future developments, and other factors it believes are appropriate. The material factors and assumptions used to develop these forward-lookingstatements relate to:• electricity and other energy prices,• performance,• business prospects and opportunities including expected growth and capital projects,• status of and impact of policy, legislation and regulations,• effective tax rates, and• other matters discussed under the Performance Overview and Outlook and Targets for 2015 sections in the Company’s Q2/15 MD&A.
Whether actual results, performance or achievements will conform to the Company’s expectations and predictions is subject to a number of known and unknownrisks and uncertainties which could cause actual results and experience to differ materially from the Company’s expectations. Such material risks and uncertaintiesare:• changes in electricity prices in markets in which the Company operates,• changes in energy commodity market prices and use of derivatives,• regulatory and political environments including changes to environmental, financial reporting and tax legislation,• power plant availability and performance including maintenance of equipment,• ability to fund current and future capital and working capital needs,• acquisitions and developments including timing and costs of regulatory approvals and construction,• changes in market prices and availability of fuel, and• changes in general economic and competitive conditions.
See Risks and Risk Management in the Q2/15 MD&A for further discussion of these and other risks. Readers are cautioned not to place undue reliance on any suchforward-looking statements, which speak only as of the date made. The Company does not undertake or accept any obligation or undertaking to release publicly anyupdates or revisions to any forward-looking statements to reflect any change in the Company’s expectations or any change in events, conditions or circumstances onwhich any such statement is based, except as required by law.
Forward-looking information
44
Investor Relations Contact
Randy Mah
Senior Manager
(780) 392-5305
10423 – 101 Street NW
10th Floor
Edmonton, Alberta
Canada, T5H 0E9
www.capitalpower.com


