Page 1
August 2016 Quick Facts
23456789
1011121314
City of Boston OverviewRegional Map
Median Sales PriceHousing Affordability IndexInventory of Homes for SaleMonths Supply of InventoryDays on Market Until SalePercent of Original List Price Received
Monthly Indicators
Closed sales began to cool for much of the country last month, and conventional wisdom indicates that year-over-year declines are going to be present for the remainder of the year, given the low inventory situation in most markets. Demand is certainly present and has created competitive situations that have kept prices up. Rental prices are also up, which may lure more toward homeownership.
Closed Sales decreased 0.4 percent for Single-Family homes and 4.1 percent for Condominium homes. Pending Sales increased 5.5 percent for Single-Family homes and 11.3 percent for Condominium homes. Inventory decreased 28.1 percent for Single-Family homes and 24.9 percent for Condominium homes.
The Median Sales Price was up 8.7 percent to $575,000 for Single-Family homes and 9.4 percent to $499,000 for Condominium homes. Days on Market increased 3.7 percent for Single-Family homes but decreased 8.9 percent for Condominium homes. Months Supply of Inventory decreased 31.3 percent for Single-Family homes and 28.6 percent for Condominium homes.
As inventory continues to drop, the contradictions of today's market are evident. Sellers should feel confident enough to list homes at fair prices and receive meaningful offers in a healthy residential real estate and overall economic environment. However, there may be lingering worry over the availability of move-in ready homes to replace what was sold. On a brighter note, building permits are trending upward. That news should be weighed against the fact that the highest level of activity is in multifamily rentals.
Data is refreshed regularly to capture changes in market activity so figures shown may be different than previously reported. Current as of September 16, 2016. All data from MLS Property Information Network, Inc. Provided by the Greater Boston Association of REALTORS® and the Massachusetts Association of REALTORS®. Report © 2016 ShowingTime.
Single-Family Home Market Overview
- 1.9% - 0.4% - 4.1%
This is a research tool provided by the Greater Boston Association of REALTORS®. Percent changes are calculated using rounded figures.
Condominium Market Overview
Year-Over-Year (YoY) Change in Closed Sales
All Properties
Year-Over-Year (YoY) Change in Closed Sales
Single-Family Only
Year-Over-Year (YoY) Change in Closed Sales
Condominium Only
Closed Sales
Pending SalesNew Listings
Page 2
Single-Family Home Market Overview
Historical Sparkbars 8-2015 8-2016 PercentChange YTD 2015 YTD 2016 Percent
Change
- 1.3%1,331 1,208 - 9.2% 13,207 13,038
Current as of September 16, 2016. All data from MLS Property Information Network, Inc. Provided by the Greater Boston Association of REALTORS® and the Massachusetts Association of REALTORS®. Report © 2016 ShowingTime. | 2
+ 0.2%
Pending Sales 1,122 1,184 + 5.5% 9,941 10,345 + 4.1%
Pct. of Orig. List Price Received 98.5% 98.6% + 0.1% 98.4% 98.6%
New Listings
--
Days on Market Until Sale 54 56 + 3.7% 62 61 - 1.6%
Months Supply of Inventory 3.2 2.2 - 31.3% -- --
0.0%
Inventory of Homes for Sale 3,593 2,585 - 28.1% -- -- --
Housing Affordability Index 80 77 - 3.8% 81 81
9,630 + 4.3%
Median Sales Price $528,900 $575,000 + 8.7% $526,000 $549,000 + 4.4%
9,236
Key market metrics for the current month and year-to-date figures for Single-Family Homes Only.
Closed Sales 1,710 1,704 - 0.4%
Key Metrics
Aug 2014 Feb 2015 Aug 2015 Feb 2016 Aug 2016
Aug 2014 Feb 2015 Aug 2015 Feb 2016 Aug 2016
Aug 2014 Feb 2015 Aug 2015 Feb 2016 Aug 2016
Aug 2014 Feb 2015 Aug 2015 Feb 2016 Aug 2016
Aug 2014 Feb 2015 Aug 2015 Feb 2016 Aug 2016
Aug 2014 Feb 2015 Aug 2015 Feb 2016 Aug 2016
Aug 2014 Feb 2015 Aug 2015 Feb 2016 Aug 2016
Aug 2014 Feb 2015 Aug 2015 Feb 2016 Aug 2016
Aug 2014 Feb 2015 Aug 2015 Feb 2016 Aug 2016
Page 3
Condominium Market Overview
Historical Sparkbars 8-2015 8-2016 PercentChange YTD 2015 YTD 2016 Percent
Change
Key market metrics for the current month and year-to-date figures for Condominium Properties Only.
Closed Sales 1,251 1,200
Median Sales Price $456,000 $499,000
Inventory of Homes for Sale 1,811 1,360
Days on Market Until Sale 45 41
Housing Affordability Index 93
- 4.1%
Key Metrics
7,548 + 5.1%7,181
89 - 4.3% 94 91 - 3.2%
+ 9.4% $451,850 $485,000 + 7.3%
--
-- --
- 24.9% -- --
Months Supply of Inventory 2.1 1.5 - 28.6% --
- 8.9% 48
+ 0.8%
Pct. of Orig. List Price Received 100.6% 100.8% + 0.2% 100.4%
- 2.1%
100.7% + 0.3%
47
Current as of September 16, 2016. All data from MLS Property Information Network, Inc. Provided by the Greater Boston Association of REALTORS® and the Massachusetts Association of REALTORS®. Report © 2016 ShowingTime. | 3
+ 4.5%Pending Sales 815 907 + 11.3% 7,848 8,205
New Listings 936 955 + 2.0% 9,610 9,689
Aug 2014 Feb 2015 Aug 2015 Feb 2016 Aug 2016
Aug 2014 Feb 2015 Aug 2015 Feb 2016 Aug 2016
Aug 2014 Feb 2015 Aug 2015 Feb 2016 Aug 2016
Aug 2014 Feb 2015 Aug 2015 Feb 2016 Aug 2016
Aug 2014 Feb 2015 Aug 2015 Feb 2016 Aug 2016
Aug 2014 Feb 2015 Aug 2015 Feb 2016 Aug 2016
Aug 2014 Feb 2015 Aug 2015 Feb 2016 Aug 2016
Aug 2014 Feb 2015 Aug 2015 Feb 2016 Aug 2016
Aug 2014 Feb 2015 Aug 2015 Feb 2016 Aug 2016
Page 4
Closed Sales
Closed Sales Single-FamilyYear-Over-Year
Change CondominiumYear-Over-Year
Change
Sep-2015 1,218 +17.5% 942 +7.2%
Oct-2015 1,120 +8.3% 831 -4.8%
Nov-2015 1,007 +7.4% 775 +16.7%
Dec-2015 1,249 +11.1% 912 +8.1%
Jan-2016 843 +17.7% 604 +24.5%
Feb-2016 588 +10.7% 473 +4.6%
Mar-2016 779 +13.9% 756 +30.6%
Apr-2016 929 +21.9% 827 +19.9%
May-2016 1,249 +17.8% 1,120 +16.9%
Jun-2016 1,936 +3.5% 1,411 +1.6%
Jul-2016 1,602 -15.8% 1,157 -16.0%
Aug-2016 1,704 -0.4% 1,200 -4.1%
12-Month Avg 1,185 +6.4% 917 +5.4%
Historical Closed Sales by Month
Current as of September 16, 2016. All data from MLS Property Information Network, Inc. Provided by the Greater Boston Association of REALTORS® and the Massachusetts Association of REALTORS®. Report © 2016 ShowingTime. | 4
A count of the actual sales that closed in a given month.
1,534
1,162
1,710
1,251
1,704
1,200
Single-Family Condominium
August
0
500
1,000
1,500
2,000
2,500
1-2003 1-2004 1-2005 1-2006 1-2007 1-2008 1-2009 1-2010 1-2011 1-2012 1-2013 1-2014 1-2015 1-2016
Single-Family Condominium
8,816
7,372
9,236
7,181
9,630
7,548
Single-Family Condominium
Year to Date
2014 2015 2016
- 4.1%+ 7.7%- 0.4%+ 11.5% - 2.6%+ 4.3%+ 4.8% + 5.1%
2014 2015 2016 2014 2015 2016 2014 2015 2016
- 10.3% - 6.9% - 4.1%- 14.0%
Page 5
Median Sales Price
Median Sales Price Single-FamilyYear-Over-Year
Change CondominiumYear-Over-Year
Change
Sep-2015 $491,700 +7.1% $425,450 +3.4%
Oct-2015 $475,000 +0.5% $455,000 +15.2%
Nov-2015 $517,000 +6.4% $450,455 +7.3%
Dec-2015 $500,001 +5.3% $443,750 +5.2%
Jan-2016 $490,000 +1.0% $443,250 -1.3%
Feb-2016 $518,750 +10.4% $449,000 +7.0%
Mar-2016 $472,500 +0.6% $478,750 +5.2%
Apr-2016 $530,000 +3.5% $480,456 +10.2%
May-2016 $530,250 +2.0% $482,500 +4.0%
Jun-2016 $585,000 +4.5% $505,000 +9.8%
Jul-2016 $575,000 +4.5% $495,000 +7.6%
Aug-2016 $575,000 +8.7% $499,000 +9.4%
12-Month Avg* $521,683 +3.9% $467,301 +7.8%
Historical Median Sales Price by Month
* Median Sales Price for all properties from September 2015 through August 2016. This is not the average of the individual figures above.
Current as of September 16, 2016. All data from MLS Property Information Network, Inc. Provided by the Greater Boston Association of REALTORS® and the Massachusetts Association of REALTORS®. Report © 2016 ShowingTime. | 5
Point at which half of the sales sold for more and half sold for less, not accounting for seller concessions, in a given month.
$515,000
$418,000
$528,900
$456,000
$575,000
$499,000
Single-Family Condominium
August
$200,000
$300,000
$400,000
$500,000
$600,000
$700,000
1-2003 1-2004 1-2005 1-2006 1-2007 1-2008 1-2009 1-2010 1-2011 1-2012 1-2013 1-2014 1-2015 1-2016
Single-Family Condominium
$501,000
$415,000
$526,000
$451,850
$549,000
$485,000
Single-Family Condominium
Year to Date
2014 2015 2016
+ 9.4%+ 9.1%+ 8.7%+ 2.7% + 8.9%+ 4.4%+ 5.0% + 7.3%
2014 2015 2016 2014 2015 2016 2014 2015 2016
+ 6.2% + 7.7% + 6.4%+ 4.0%
Page 6
Housing Affordability Index
Affordability Index Single-FamilyYear-Over-Year
Change CondominiumYear-Over-Year
Change
Sep-2015 87 0.0% 101 +4.1%
Oct-2015 90 +4.7% 94 -8.7%
Nov-2015 82 -2.4% 94 -3.1%
Dec-2015 85 -2.3% 96 -1.0%
Jan-2016 86 -3.4% 95 -2.1%
Feb-2016 84 -8.7% 97 -6.7%
Mar-2016 92 +1.1% 91 -3.2%
Apr-2016 82 -3.5% 91 -8.1%
May-2016 82 -2.4% 90 -4.3%
Jun-2016 76 0.0% 88 -5.4%
Jul-2016 77 +1.3% 89 -2.2%
Aug-2016 77 -3.8% 89 -4.3%
12-Month Avg 83 -2.1% 93 -3.7%
Historical Housing Affordability Index by Month
Current as of September 16, 2016. All data from MLS Property Information Network, Inc. Provided by the Greater Boston Association of REALTORS® and the Massachusetts Association of REALTORS®. Report © 2016 ShowingTime. | 6
This index measures housing affordability for the region. For example, an index of 120 means the median household income is 120% of what is necessary to qualify for the median-priced home under prevailing interest rates. A higher number means greater affordability.
78
97
80
93
77
89
Single-Family Condominium
August
40
60
80
100
120
140
1-2003 1-2004 1-2005 1-2006 1-2007 1-2008 1-2009 1-2010 1-2011 1-2012 1-2013 1-2014 1-2015 1-2016
Single-Family Condominium
81
97
81
94
8191
Single-Family Condominium
Year to Date
2014 2015 2016
- 4.3%- 4.1%- 3.8%+ 2.6% - 3.1%0.0%0.0% - 3.2%
2014 2015 2016 2014 2015 2016 2014 2015 2016
- 1.3% - 2.4% - 2.0%+ 1.0%
Page 7
Inventory of Homes for Sale
Homes for Sale Single-FamilyYear-Over-Year
Change CondominiumYear-Over-Year
Change
Sep-2015 3,907 +1.7% 2,108 +11.1%
Oct-2015 3,758 +0.9% 2,048 +6.2%
Nov-2015 3,135 +2.6% 1,813 +12.4%
Dec-2015 2,378 -0.8% 1,386 +11.1%
Jan-2016 2,311 +2.2% 1,382 +8.6%
Feb-2016 2,330 +13.5% 1,374 +12.7%
Mar-2016 2,835 +25.9% 1,629 +19.1%
Apr-2016 3,153 +5.5% 1,657 -3.7%
May-2016 3,159 -10.7% 1,631 -15.8%
Jun-2016 3,248 -12.2% 1,631 -15.7%
Jul-2016 3,003 -19.0% 1,585 -16.3%
Aug-2016 2,585 -28.1% 1,360 -24.9%
12-Month Avg 2,984 -3.5% 1,634 -1.2%
Historical Inventory of Homes for Sale by Month
Current as of September 16, 2016. All data from MLS Property Information Network, Inc. Provided by the Greater Boston Association of REALTORS® and the Massachusetts Association of REALTORS®. Report © 2016 ShowingTime. | 7
The number of properties available for sale in active status at the end of a given month.
3,533
1,732
3,593
1,811
2,585
1,360
Single-Family Condominium
August
0
2,000
4,000
6,000
8,000
10,000
1-2003 1-2004 1-2005 1-2006 1-2007 1-2008 1-2009 1-2010 1-2011 1-2012 1-2013 1-2014 1-2015 1-2016
Single-Family Condominium
2014 2015 2016
- 24.9%+ 4.6%- 28.1%+ 1.7%2014 2015 2016
+ 7.1% - 11.3%
Page 8
Months Supply of Inventory
Months Supply Single-FamilyYear-Over-Year
Change CondominiumYear-Over-Year
Change
Sep-2015 3.5 0.0% 2.4 +14.3%
Oct-2015 3.3 -5.7% 2.3 +4.5%
Nov-2015 2.7 -3.6% 2.1 +16.7%
Dec-2015 2.1 -4.5% 1.6 +14.3%
Jan-2016 2.0 -4.8% 1.5 +7.1%
Feb-2016 2.0 +5.3% 1.5 +7.1%
Mar-2016 2.4 +14.3% 1.8 +12.5%
Apr-2016 2.7 -3.6% 1.8 -10.0%
May-2016 2.6 -21.2% 1.7 -26.1%
Jun-2016 2.7 -20.6% 1.7 -26.1%
Jul-2016 2.5 -26.5% 1.7 -22.7%
Aug-2016 2.2 -31.3% 1.5 -28.6%
12-Month Avg* 2.6 -10.4% 1.8 -4.8%
Historical Months Supply of Inventory by Month
* Months Supply for all properties from September 2015 through August 2016. This is not the average of the individual figures above.
Current as of September 16, 2016. All data from MLS Property Information Network, Inc. Provided by the Greater Boston Association of REALTORS® and the Massachusetts Association of REALTORS®. Report © 2016 ShowingTime. | 8
The inventory of homes for sale at the end of a given month, divided by the average monthly closed sales from the last 12 months.
3.2
1.9
3.2
2.12.2
1.5
Single-Family Condominium
August
0.0
2.0
4.0
6.0
8.0
10.0
1-2004 1-2005 1-2006 1-2007 1-2008 1-2009 1-2010 1-2011 1-2012 1-2013 1-2014 1-2015 1-2016
Single-Family Condominium
2014 2015 2016
- 28.6%+ 10.5%- 31.3%0.0%2014 2015 2016
+ 6.7% - 13.6%
Page 9
Days on Market Until Sale
Days on Market Single-FamilyYear-Over-Year
Change CondominiumYear-Over-Year
Change
Sep-2015 57 -6.6% 50 -2.0%
Oct-2015 64 +4.9% 50 0.0%
Nov-2015 61 -7.6% 56 +5.7%
Dec-2015 70 +1.4% 52 -5.5%
Jan-2016 74 -11.9% 58 -1.7%
Feb-2016 91 -3.2% 64 -13.5%
Mar-2016 80 -13.0% 60 -9.1%
Apr-2016 70 -10.3% 48 -18.6%
May-2016 58 -1.7% 46 +2.2%
Jun-2016 49 -5.8% 41 +5.1%
Jul-2016 51 +4.1% 40 0.0%
Aug-2016 56 +3.7% 41 -8.9%
12-Month Avg* 65 -2.1% 51 -2.0%
Historical Days on Market Until Sale by Month
* Days on Market for all properties from September 2015 through August 2016. This is not the average of the individual figures above.
Current as of September 16, 2016. All data from MLS Property Information Network, Inc. Provided by the Greater Boston Association of REALTORS® and the Massachusetts Association of REALTORS®. Report © 2016 ShowingTime. | 9
Average number of days between when a property is listed and when an offer is accepted in a given month.
51 5054
45
56
41
Single-Family Condominium
August
20
40
60
80
100
120
140
1-2003 1-2004 1-2005 1-2006 1-2007 1-2008 1-2009 1-2010 1-2011 1-2012 1-2013 1-2014 1-2015 1-2016
Single-Family Condominium
5854
62
48
61
47
Single-Family Condominium
Year to Date
2014 2015 2016
- 8.9%- 10.0%+ 3.7%+ 5.9% - 11.1%- 1.6%+ 6.9% - 2.1%
2014 2015 2016 2014 2015 2016 2014 2015 2016
+ 15.9% - 6.5% + 1.9%+ 25.0%
Page 10
Percent of Original List Price Received
Pct. of Orig. List Price Received Single-Family
Year-Over-YearChange Condominium
Year-Over-YearChange
Sep-2015 97.7% +0.8% 99.5% +0.4%
Oct-2015 96.7% 0.0% 99.7% +1.2%
Nov-2015 97.4% +0.8% 99.3% +1.2%
Dec-2015 96.1% +0.5% 98.3% +0.4%
Jan-2016 95.8% -0.1% 97.9% +0.1%
Feb-2016 95.7% +0.5% 98.1% -0.1%
Mar-2016 97.7% +1.2% 99.7% +1.0%
Apr-2016 98.4% +1.0% 101.1% +0.5%
May-2016 99.3% +0.2% 101.4% +0.5%
Jun-2016 99.8% +0.1% 101.7% +0.1%
Jul-2016 99.6% +0.1% 101.5% +0.4%
Aug-2016 98.6% +0.1% 100.8% +0.2%
12-Month Avg* 97.7% +0.3% 99.9% +0.4%
Historical Percent of Original List Price Received by Month
* Pct. of Orig. List Price Received for all properties from September 2015 through August 2016. This is not the average of the individual figures above.
Current as of September 16, 2016. All data from MLS Property Information Network, Inc. Provided by the Greater Boston Association of REALTORS® and the Massachusetts Association of REALTORS®. Report © 2016 ShowingTime. | 10
Percentage found when dividing a property’s sales price by its original list price, then taking the average for all properties soldin a given month, not accounting for seller concessions.
98.2% 100.0%98.5% 100.6%98.6% 100.8%
Single-Family Condominium
August
87.5%
90.0%
92.5%
95.0%
97.5%
100.0%
102.5%
1-2003 1-2004 1-2005 1-2006 1-2007 1-2008 1-2009 1-2010 1-2011 1-2012 1-2013 1-2014 1-2015 1-2016
Single-Family Condominium
98.1% 99.7%98.4% 100.4%98.6% 100.7%
Single-Family Condominium
Year to Date
2014 2015 2016
+ 0.2%+ 0.6%+ 0.1%+ 0.3% + 0.7%+ 0.2%+ 0.3% + 0.3%
2014 2015 2016 2014 2015 2016 2014 2015 2016
+ 0.3% + 0.9% + 0.9%+ 0.5%
Page 11
Pending Sales
Pending Sales Single-FamilyYear-Over-Year
Change CondominiumYear-Over-Year
Change
Sep-2015 1,214 +17.4% 860 +0.1%
Oct-2015 1,258 +8.2% 954 +14.1%
Nov-2015 950 +6.1% 722 +10.2%
Dec-2015 659 +11.9% 519 +12.1%
Jan-2016 685 -3.0% 648 +18.2%
Feb-2016 888 +40.5% 825 +45.5%
Mar-2016 1,435 +29.9% 1,130 +13.3%
Apr-2016 1,589 +2.8% 1,305 +2.4%
May-2016 1,781 +1.2% 1,301 +0.3%
Jun-2016 1,622 -9.3% 1,199 -13.5%
Jul-2016 1,161 -9.4% 890 -7.7%
Aug-2016 1,184 +5.5% 907 +11.3%
12-Month Avg 1,202 +5.9% 938 +5.6%
Historical Pending Sales by Month
A count of the properties in UAG status between the first and last day in a given month, regardless of current status (based on Off Market Date).
Current as of September 16, 2016. All data from MLS Property Information Network, Inc. Provided by the Greater Boston Association of REALTORS® and the Massachusetts Association of REALTORS®. Report © 2016 ShowingTime. | 11
973
729
1,122
815
1,184
907
Single-Family Condominium
August
250
500
750
1,000
1,250
1,500
1,750
2,000
1-2003 1-2004 1-2005 1-2006 1-2007 1-2008 1-2009 1-2010 1-2011 1-2012 1-2013 1-2014 1-2015 1-2016
Single-Family Condominium
9,357
7,745
9,941
7,848
10,345
8,205
Single-Family Condominium
Year to Date
2014 2015 2016
+ 11.3%+ 11.8%+ 5.5%+ 15.3% + 1.3%+ 4.1%+ 6.2% + 4.5%
2014 2015 2016 2014 2015 2016 2014 2015 2016
- 10.2% - 8.2% - 7.0%- 10.7%
Page 12
New Listings
New Listings Single-FamilyYear-Over-Year
Change CondominiumYear-Over-Year
Change
Sep-2015 1,954 +8.3% 1,439 +12.7%
Oct-2015 1,525 +3.1% 1,153 +3.5%
Nov-2015 875 +17.8% 762 +26.4%
Dec-2015 553 +10.4% 463 +16.0%
Jan-2016 903 +7.4% 805 +13.5%
Feb-2016 1,126 +76.8% 938 +50.6%
Mar-2016 2,170 +45.2% 1,543 +22.1%
Apr-2016 2,122 -14.2% 1,471 -15.1%
May-2016 2,070 -18.2% 1,436 -13.6%
Jun-2016 2,121 -6.6% 1,436 -8.4%
Jul-2016 1,318 -19.1% 1,105 -1.1%
Aug-2016 1,208 -9.2% 955 +2.0%
12-Month Avg 1,495 +1.2% 1,126 +3.9%
Historical New Listings by Month
Current as of September 16, 2016. All data from MLS Property Information Network, Inc. Provided by the Greater Boston Association of REALTORS® and the Massachusetts Association of REALTORS®. Report © 2016 ShowingTime. | 12
A count of the properties that have been newly listed on the market in a given month.
1,191
791
1,331
936
1,208
955
Single-Family Condominium
August
0
1,000
2,000
3,000
4,000
1-2003 1-2004 1-2005 1-2006 1-2007 1-2008 1-2009 1-2010 1-2011 1-2012 1-2013 1-2014 1-2015 1-2016
Single-Family Condominium
12,847
9,384
13,207
9,610
13,038
9,689
Single-Family Condominium
Year to Date
2014 2015 2016
+ 2.0%+ 18.3%- 9.2%+ 11.8% + 2.4%- 1.3%+ 2.8% + 0.8%
2014 2015 2016 2014 2015 2016 2014 2015 2016
- 7.0% - 0.9% - 7.2%- 15.3%
Page 13
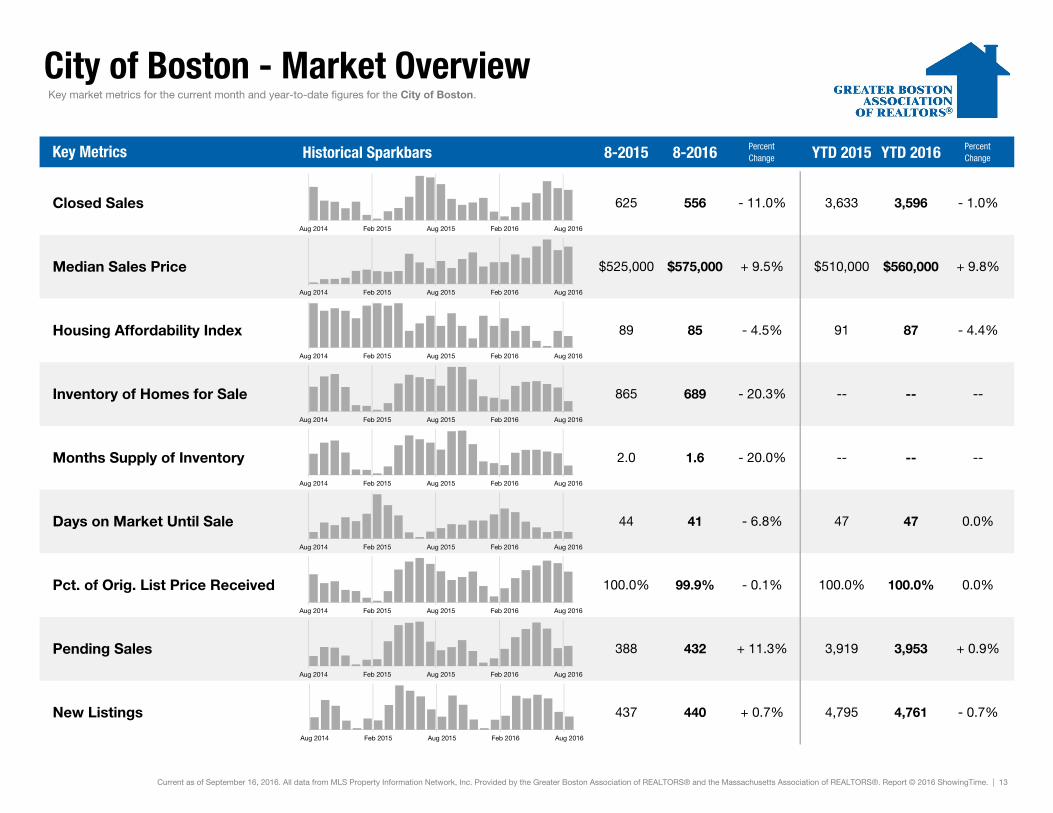
City of Boston - Market Overview
Historical Sparkbars 8-2015 8-2016 PercentChange YTD 2015 YTD 2016 Percent
Change
Key market metrics for the current month and year-to-date figures for the City of Boston.
Closed Sales 625 556 - 11.0%
Key Metrics
3,596 - 1.0%
Median Sales Price $525,000 $575,000 + 9.5% $510,000 $560,000 + 9.8%
3,633
Housing Affordability Index 89 85 - 4.5% 91 87 - 4.4%
----
Months Supply of Inventory 2.0 1.6 - 20.0% --
Inventory of Homes for Sale 865 689 - 20.3% --
47 47
-- --
+ 11.3% 3,919
0.0%
Pct. of Orig. List Price Received 100.0% 99.9% - 0.1% 100.0% 100.0% 0.0%
Days on Market Until Sale 44 41 - 6.8%
Current as of September 16, 2016. All data from MLS Property Information Network, Inc. Provided by the Greater Boston Association of REALTORS® and the Massachusetts Association of REALTORS®. Report © 2016 ShowingTime. | 13
+ 0.9%
4,761 - 0.7%
3,953
New Listings 437 440 + 0.7% 4,795
Pending Sales 388 432
Aug 2014 Feb 2015 Aug 2015 Feb 2016 Aug 2016
Aug 2014 Feb 2015 Aug 2015 Feb 2016 Aug 2016
Aug 2014 Feb 2015 Aug 2015 Feb 2016 Aug 2016
Aug 2014 Feb 2015 Aug 2015 Feb 2016 Aug 2016
Aug 2014 Feb 2015 Aug 2015 Feb 2016 Aug 2016
Aug 2014 Feb 2015 Aug 2015 Feb 2016 Aug 2016
Aug 2014 Feb 2015 Aug 2015 Feb 2016 Aug 2016
Aug 2014 Feb 2015 Aug 2015 Feb 2016 Aug 2016
Aug 2014 Feb 2015 Aug 2015 Feb 2016 Aug 2016
Page 14
Regional Map
Central Middlesex Region Metro West RegionActon AshlandBedford DoverBoxboro FraminghamConcord HollistonHudson HopkintonLexington MedfieldLincoln MedwayMaynard MillisStow NatickSudbury NeedhamWayland SherbornWeston Wellesley
Eastern Middlesex Region Southern Norfolk RegionBurlington AvonMalden BellinghamMedford CantonMelrose FoxboroNorth Reading FranklinReading MansfieldStoneham NorfolkWakefield NorwoodWilmington RandolphWinchester SharonWoburn Stoughton
WalpoleMetro Boston Region WestwoodArlington WrenthamBelmontBostonBrooklineCambridgeChelseaDedhamEverettMiltonNewtonRevereSomervilleWalthamWatertownWinthrop
A map of the the 64 areas and 5 regions that make up "Greater Boston."
Greater Boston Association of REALTORS® Regional Map
Communities by Region
Current as of September 16, 2016. All data from MLS Property Information Network, Inc. Provided by the Greater Boston Association of REALTORS® and the Massachusetts Association of REALTORS®. Report © 2016 ShowingTime. | 14