6.3 HARDENING BY FORMATION OF MARTENSITE 6.3.1 A USTENITIZING Austenitizing is the first operation in many of the most important heat treatment processes (hardening, carburizing, normalizing) on which the properties of heat-treated parts depend. Let us assume the bulk heat treatment of real batches of workpieces and consider the metallurgical and technological aspects of austenitizing. 6.3.1.1 Metallurgical Aspects of Austenitizing The way austenite is formed when a certain steel is heated depends very much on the steel’s starting microstructure. Let us take as an example an unalloyed eutectoid steel with 0.8% C and follow the process of its austenitization using the schemes shown in Figure 6.90. At room temperature the cementite (Fe 3 C) plates of the pearlite are in direct contact with ferrite ( a-Fe, see Figure 6.90a). The carbon atoms from cementite have a tendency to diffuse into the ferrite lattice. The higher the temperature, the greater this tendency is. Upon heating, on reaching the A c1 temperature (7238C (13338F)), the transformation of ferrite into austenite (g-Fe) (b) (a) FIGURE 6.88 Development of coarse-grained structure during recrystallization of soft iron. (a) Micro- structure before cold working and (b) microstructure after cold working with very low degree of deform- ation (10%) and subsequent recrystallization annealing at 7008C. Magnification 500. (From G. Spur and T. Sto ¨ferle (Eds.), Handbuch der Fertigungstechnik, Vol. 4/2, Wa ¨rmebehandeln, Carl Hanser, Munich, 1987.) Grain size Degree of deformation at cold working, % 0 10 20 30 40 50 60 70 80 90 100 FIGURE 6.89 Grain growth in the range of the critical degree of deformation (at 10%) for a steel with 0.06% C. Recrystallization temperature, 7008C. (From G. Spur and T. Sto ¨ferle (Eds.), Handbuch der Fertigungstechnik, Vol. 4/2, Wa ¨rmebehandeln, Carl Hanser, Munich, 1987.) ß 2006 by Taylor & Francis Group, LLC.
Transcript
6.3 HARDENING BY FORMATION OF MARTENSITE
6.3.1 A USTENITIZING
Austenitizing is the first operation in many of the most important heat treatment processes
(hardening, carburizing, normalizing) on which the properties of heat-treated parts depend.
Let us assume the bulk heat treatment of real batches of workpieces and consider the
metallurgical and technological aspects of austenitizing.
6.3.1 .1 Meta llurgi cal Aspec ts of Austeni tizing
The way austenite is formed when a certain steel is heated depends very much on the steel’s
starting microstructure. Let us take as an example an unalloyed eutectoid steel with 0.8% C
and follow the process of its austenitization using the schemes shown in Figure 6.90. At room
temperature the cementite (Fe3C) plates of the pearlite are in direct contact with ferrite ( a-Fe,
see Figure 6.90a). The carbon atoms from cementite have a tendency to diffuse into the ferrite
lattice. The higher the temperature, the greater this tendency is. Upon heating, on reaching
the Ac1 temperature (7238C (13338F)), the transformation of ferrite into austenite (g-Fe)
(b)(a)
FIGURE 6.88 Development of coarse-grained structure during recrystallization of soft iron. (a) Micro-
structure before cold working and (b) microstructure after cold working with very low degree of deform-
ation (10%) and subsequent recrystallization annealing at 7008C. Magnification 500�. (From G. Spur and
T. Stoferle (Eds.), Handbuch der Fertigungstechnik, Vol. 4/2, Warmebehandeln, Carl Hanser, Munich,
1987.)
Gra
in s
ize
Degree of deformation at cold working, %
0 10 20 30 40 50 60 70 80 90 100
FIGURE 6.89 Grain growth in the range of the critical degree of deformation (at 10%) for a steel with
0.06% C. Recrystallization temperature, 7008C. (From G. Spur and T. Stoferle (Eds.), Handbuch der
Fertigungstechnik, Vol. 4/2, Warmebehandeln, Carl Hanser, Munich, 1987.)
ß 2006 by Taylor & Francis Group, LLC.
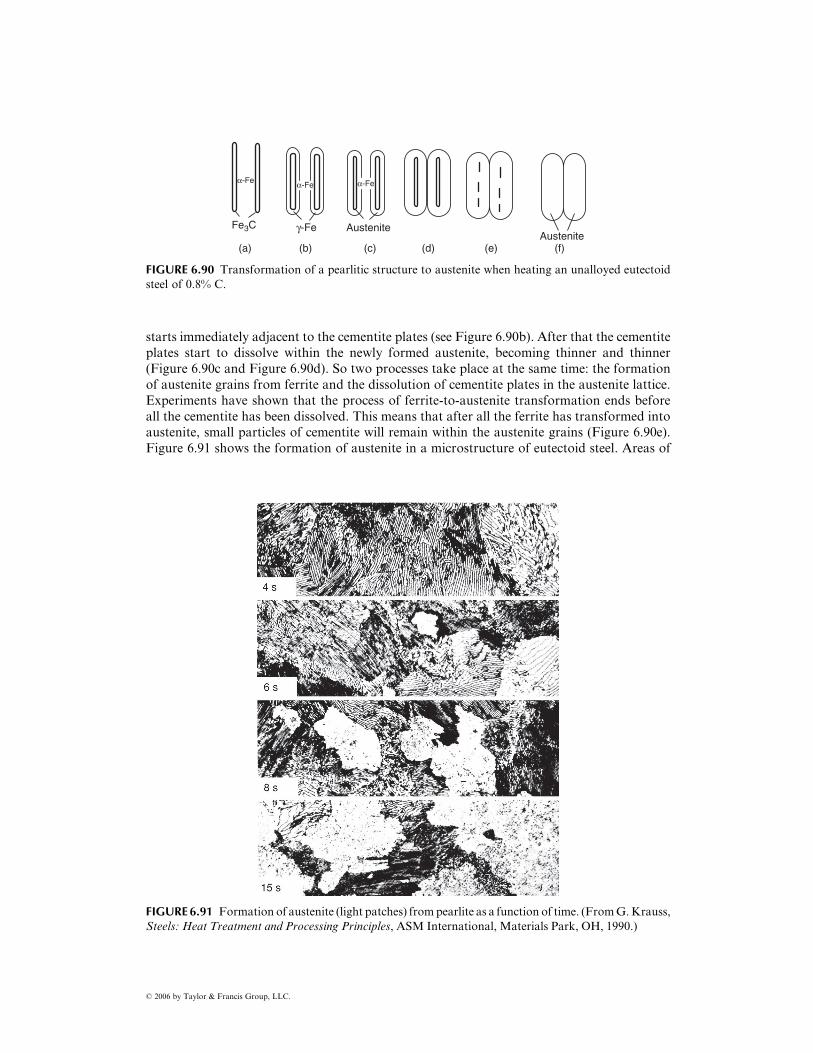
starts immediately adjacent to the cementite plates (see Figure 6.90b). After that the cementite
plates start to dissolve within the newly formed austenite, becoming thinner and thinner
(Figure 6.90c and Figure 6.90d). So two processes take place at the same time: the formation
of austenite grains from ferrite and the dissolution of cementite plates in the austenite lattice.
Experiments have shown that the process of ferrite-to-austenite transformation ends before
all the cementite has been dissolved. This means that after all the ferrite has transformed into
austenite, small particles of cementite will remain within the austenite grains (Figure 6.90e).
Figure 6.91 shows the formation of austenite in a microstructure of eutectoid steel. Areas of
Fe3C γ-Fe
α-Feα-Fe α-Fe
(a) (b) (c) (d) (e) (f)
AusteniteAustenite
FIGURE 6.90 Transformation of a pearlitic structure to austenite when heating an unalloyed eutectoid
steel of 0.8% C.
FIGURE 6.91 Formation of austenite (light patches) from pearlite as a function of time. (From G. Krauss,
Steels: Heat Treatment and Processing Principles, ASM International, Materials Park, OH, 1990.)
ß 2006 by Taylor & Francis Group, LLC.
austenite formation are visible as white patches within the lamellar pearlitic structure. Some of
the cementite persists in the form of spheroidized particles (the small dark spots in the
white areas). They dissolve only with longer holding times at temperature. Once these cementite
particles completely dissolve, the structure consists of only one phase—austenite (see Figure
6.90f). In this state, however, there are still differences in carbon concentration among particu-
lar austenite grains. In spots where cementite plates were previously to be found, the carbon
concentration is high, while in other spots far from cementite plates it is low.
Equalizing of the carbon concentration proceeds gradually by diffusion, resulting in a
homogeneous austenite structure at the end of this process. The holding time at austenitizing
temperature necessary for this process is called the homogenization time. During pearlite–
austenite transformation, several austenite grains are formed from one pearlite grain, i.e., the
newly formed austenite is fine-grained.
Nucleation sites for austenite formation depend on the starting microstructure as
shown in Figure 6.92. In ferrite the nucleation sites are situated primarily at grain bound-
aries. In spheroidized structures nucleation starts on carbide particles, whereas in pearlitic
structures it starts primarily at the intersection of pearlite colonies but also at cementite
lamellae.
6.3.1 .1.1 Kinet ics of Transf ormatio n during Aus tenitizin gFigure 6.93 shows the volume percent of austenite formed from pearlite in eutectoid steel as a
function of time at a constant austenitizing temperature. From the beginning of austenitization
(a) (b) (c)
a1
22
2
1
1
3
Austenite
Carbide
3a2
a3
a3
a2 a2a1a1
FIGURE 6.92 Nucleation sites for austenite formation in microstructures of (a) ferrite; (b) spheroidite;
(c) pearlite. (From G. Krauss, Steels: Heat Treatment and Processing Principles, ASM International,
Materials Park, OH, 1990.)
100
75
50
25
00 5
Volu
me o
f au
ste
nite
, %
10
Time, s
15 20 25 30
FIGURE 6.93 Volume percent austenite formed from pearlite in eutectoid steel as a function of time at a
constant austenitizing temperature. (From G. Krauss, Steels: Heat Treatment and Processing Principles,
ASM International, Materials Park, OH, 1990.)
ß 2006 by Taylor & Francis Group, LLC.
a certain incubation time is necessary to form the first nuclei, and then the process proceeds at a
more rapid rate as more nuclei develop and grow. At higher temperatures the diffusion rate
increases and austenite forms more rapidly, as shown in Figure 6.94.
The duration of austenitizing process depends on the austenitizing temperature and the
steel composition. The influence of time at austenitization can best be explained by the
diagrammatic illustrations shown in Figure 6.95. From Figure 6.95a and Figure 6.95b,
which apply to eutectoid carbon steel of 0.8% C, one can see that if an austenitizing
temperature of 7308C (13468F) is maintained (after a rapid heating to this temperature), the
transformation will start in about 30 s. If instead an austenitizing temperature of 7508C
(13828F) is chosen, the transformation will begin in 10 s, and if a temperature of 8108C
(14908F) is selected, in about 1 s. The transformation of pearlite to austenite and cementite is
in this case completed in about 6 s. If the steel is to be fully austenitic (all carbides dissolved,
hatched area), it must be held at this temperature for about 2 h (7 � 103 s).
Figure 6.95c and Figure 6.95d apply to a hypoeutectoid plain carbon steel of 0.45% C.
They show that in this case at an austenitizing temperature of 8108C (14908F) the transform-
ation from pearlite to austenite starts in about 1 s. In about 5 s the pearlite has been
transformed and the structure consists of ferrite, austenite, and cementite. About 1 min
later the carbon has diffused to the ferrite, which has thereby been transformed to austenite.
Residual particles of cementite remain, however, and it takes about 5 h at this temperature to
dissolve them completely.
Figure 6.95e and Figure 6.95f apply to a hypereutectoid steel containing 1.2% C. If this
steel is austenitized at 8108C (14908F), the pearlite starts to transform in about 2 s, and in
about 5 s the structure consists only of austenite and cementite. It is not possible for the
cementite to be completely dissolved at this temperature. To achieve complete solution of the
cementite, the temperature must be increased above Acm, in this case to at least 8608C
(15808F).
The holding time at austenitizing (hardening) temperature depends on the desired degree
of carbide dissolution and acceptable grain size, taking into account that the grain growth
increases with higher austenitizing temperatures and longer holding times. Since the amount
of carbide is different for different types of steel, the holding time (from the metallurgical
point of view) depends on the grade of steel. However, carbide dissolution and the holding
time are dependent not only on the austenitizing temperature but also the rate of heating to
7518C
100
Au
ste
nite
, %
Time, s
80
60
40
20
01 10 100 1000
7308C
FIGURE 6.94 Effect of austenitizing temperature on the rate of austenite formation from pearlite in a
eutectoid steel. (From G. Krauss, Steels: Heat Treatment and Processing Principles, ASM International,
Materials Park, OH, 1990.)
ß 2006 by Taylor & Francis Group, LLC.
this temperature. Varying the rate of heating to this temperature will have an effect on the rate
of transformation and dissolution of the constituents.
The influence of the role of heating (and correspondingly of the holding time) on carbide
dissolution, grain growth, and hardness after hardening for various grades of steel has been
studied in detail and published in Refs. [18,19]. These time–temperature–austenitizing dia-
grams (Zeit-Temperatur-Austenitisierung Schaubilder in German) have been produced either as
isothermal diagrams (the steel specimens were heated rapidly at the rate of 1308C/s (2668F/s)
to the temperature in question and held there for a certain predetermined time) or as continuous
heating diagrams (the steel specimens were heated continuously at different heating rates).
A
8C900
600
50010−1 1
P
(b)
10 102 103 104 105 s
10−1 1 10 102 103 104 105 s
0
(a)
(c) (d)
10–1 1 10 102 103 104 105 s
(f)
0.2 0.4 0.6 0.8 1.0 1.2 % C
0 0.2 0.4 0.5 0.8 1.0 1.2 % C
(e) 0 0.2 0.4 0.5 0.8 1.0 1.2 % C
700
8C
900
Temperature
Temperature
A3
A1
Acm
Acm
A3
A3
A1
A1
800
600
500
700
8C
900
800
600
500
700
Temperature8C
900
800
600
500
700
A + C
A +P
800
8C
900
600
500
700
800
8C900
600
500
700
800
A + C
F + P
A + C
P + C
F+P+A
A+
P + C
F+A +C
A
Acm
A
FIGURE 6.95 Structural transformations during austenitizing steels containing (a, b) 0.8% C; (c, d)
0.45% C; (e, f) 1.2% C. A, austenite; C, cementite; F, ferrite; P, pearlite. (From K.E. Thelning, Steel and
Its Heat Treatment, 2nd ed., Butterworths, London, 1984.)
ß 2006 by Taylor & Francis Group, LLC.
Consequently, isothermal diagrams may be read only along the isotherms, and the continuous
heating diagrams may be read only along the heating rate lines.
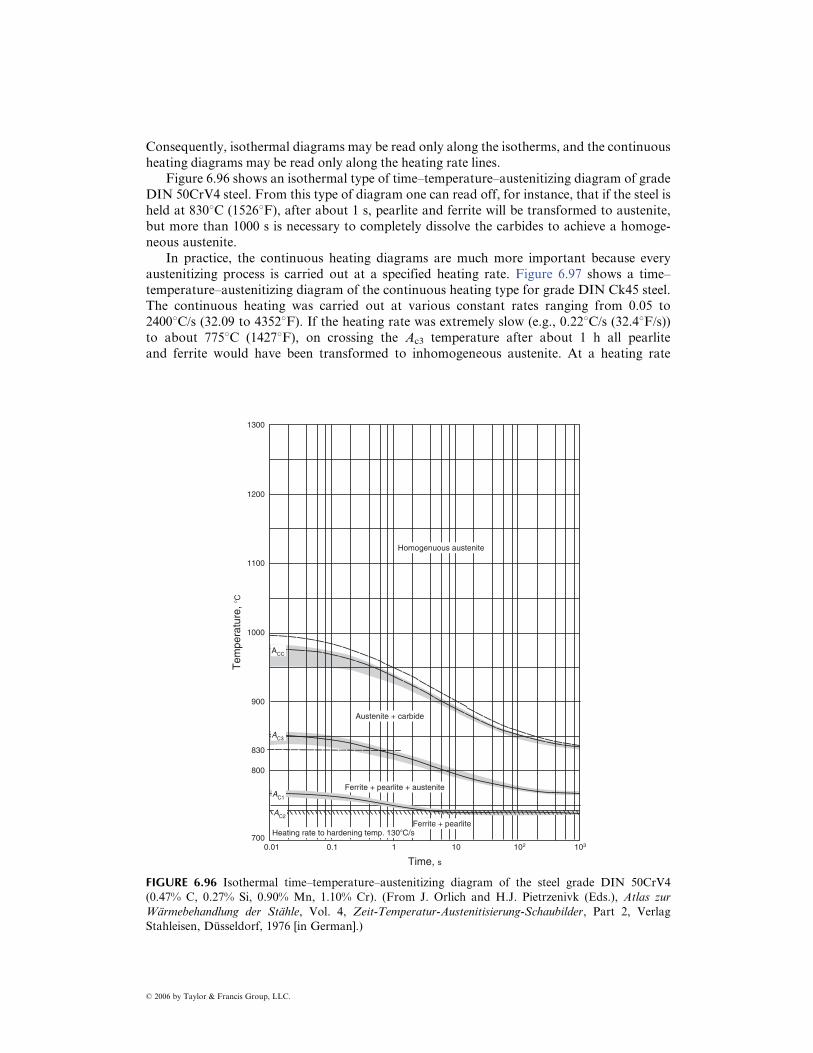
Figure 6.96 shows an isothermal type of time–temperature–austenitizing diagram of grade
DIN 50CrV4 steel. From this type of diagram one can read off, for instance, that if the steel is
held at 830 8C (1526 8F), after about 1 s, pearlite and ferrite will be transformed to austenite,
but more than 1000 s is necessary to completely dissolve the carbides to achieve a homoge-
neous austenite.
In practice, the continuous heating diagrams are much more important because every
austenitizing process is carried out at a specified heating rate. Figure 6.97 shows a time–
temperature–austenitizing diagram of the continuous heating type for grade DIN Ck45 steel.
The continuous heating was carried out at various constant rates ranging from 0.05 to
24008C/s (32.09 to 43528F). If the heating rate was extremely slow (e.g., 0.228C/s (32.48F/s))
to about 7758C (14278F), on crossing the Ac3 temperature after about 1 h all pearlite
and ferrite would have been transformed to inhomogeneous austenite. At a heating rate
1300
1200
1100
1000
900
800
830
7000.01 0.1 1 10
Time, s
Tem
pera
ture
, 8C
102 103
Austenite + carbide
Ferrite + pearlite + austenite
Ferrite + pearliteHeating rate to hardening temp. 1308C/s
ACC
AC3
Homogenuous austenite
AC2
AC1
FIGURE 6.96 Isothermal time–temperature–austenitizing diagram of the steel grade DIN 50CrV4
(0.47% C, 0.27% Si, 0.90% Mn, 1.10% Cr). (From J. Orlich and H.J. Pietrzenivk (Eds.), Atlas zur
Warmebehandlung der Stahle, Vol. 4, Zeit-Temperatur-Austenitisierung-Schaubilder, Part 2, Verlag
Stahleisen, Dusseldorf, 1976 [in German].)
ß 2006 by Taylor & Francis Group, LLC.
of 108C/s (508F/s) the pearlite and ferrite would have been transformed to inhomogeneous
austenite after crossing the Ac3 temperature at about 8008C (14728F) after only 80 s.
A remarkable feature of such diagrams is that they show precisely the increase of Ac1 and
Ac3 transformation temperatures with increasing heating rates. This is especially important
when short-time heating processes like induction hardening or laser beam hardening, with
heating rates ranging to about 10008C/s (18328F/s), are applied for surface hardening. In such
a case this diagram should be consulted to determine the required austenitizing temperature,
which is much higher than in conventional hardening of the same grade of steel. For the steel
in question, for example, the conventional hardening temperature would be in the range of
830–8508C (1526–15628F), but for induction or laser beam hardening processes the hardening
temperatures required are between 950 and 10008C (1742 and 18328F). When heating at a rate
of 10008C/s (18328F/s) to the austenitizing temperature of 10008C (18328F), only 1 s is
necessary, and the above-mentioned short heating time processes operate in approximately
this time range. As Figure 6.97 shows, much higher temperatures are necessary to achieve the
Heating rate, 8C/s
2400
1300
1200
1100
1000
900A
c3
Ac1
Ac2
800
70010−1 1 10
Time, s
Tem
pera
ture
, 8C
102 103 104 105
1000 300 100 30 10 3 1 0.22 0.05
Austenite
Ferrite + pearlite
Inhomogeneous
austenite
Homogeneous austenite
Ferrite + pearlite
FIGURE 6.97 Time–temperature–austenitizing diagram for continuous heating of the steel grade DIN
Ck45 (0.49% C, 0.26% Si, 0.74% Mn). (From J. Orlich, A. Rose, and P. Wiest (Eds.), Atlas zur
Warmebehandlung der Stahle, Vol. 3, Zeit-Temperatur-Austenitisierung-Schaubilder, Verlag Stahleisen,
Dusseldorf, 1973 [in German].)
ß 2006 by Taylor & Francis Group, LLC.
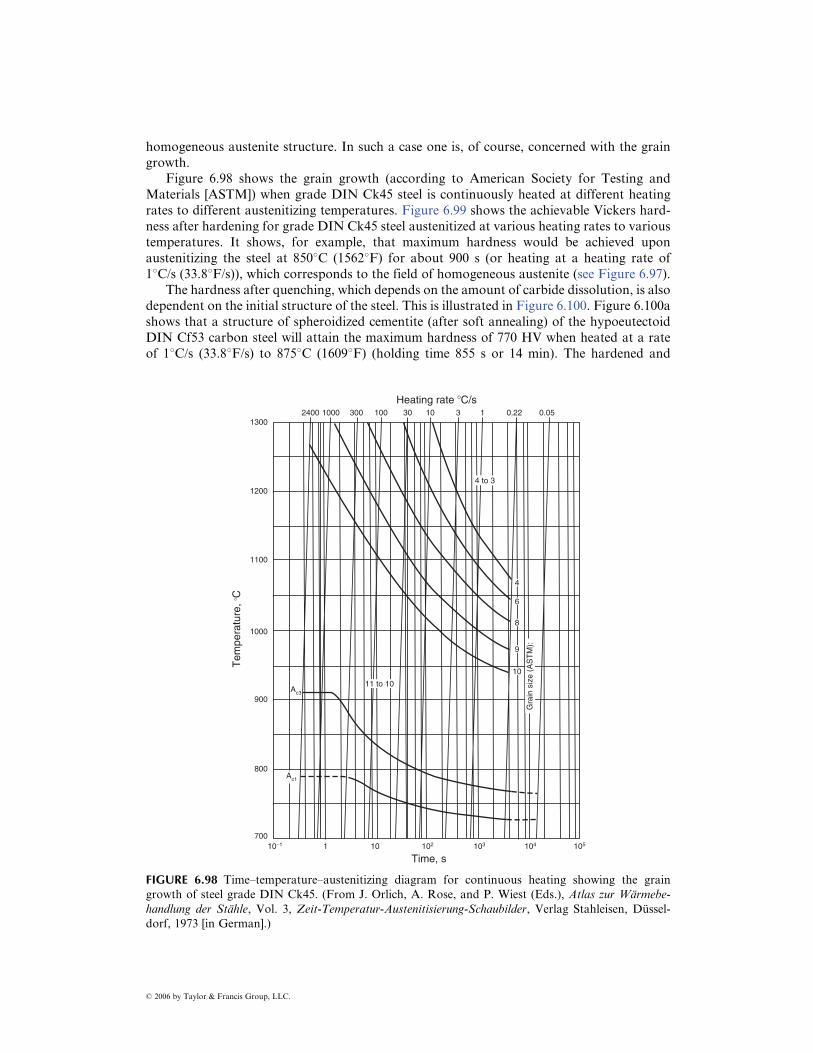
homogeneous austenite structure. In such a case one is, of course, concerned with the grain
growth.
Figure 6.98 shows the grain growth (according to American Society for Testing and
Materials [ASTM]) when grade DIN Ck45 steel is continuously heated at different heating
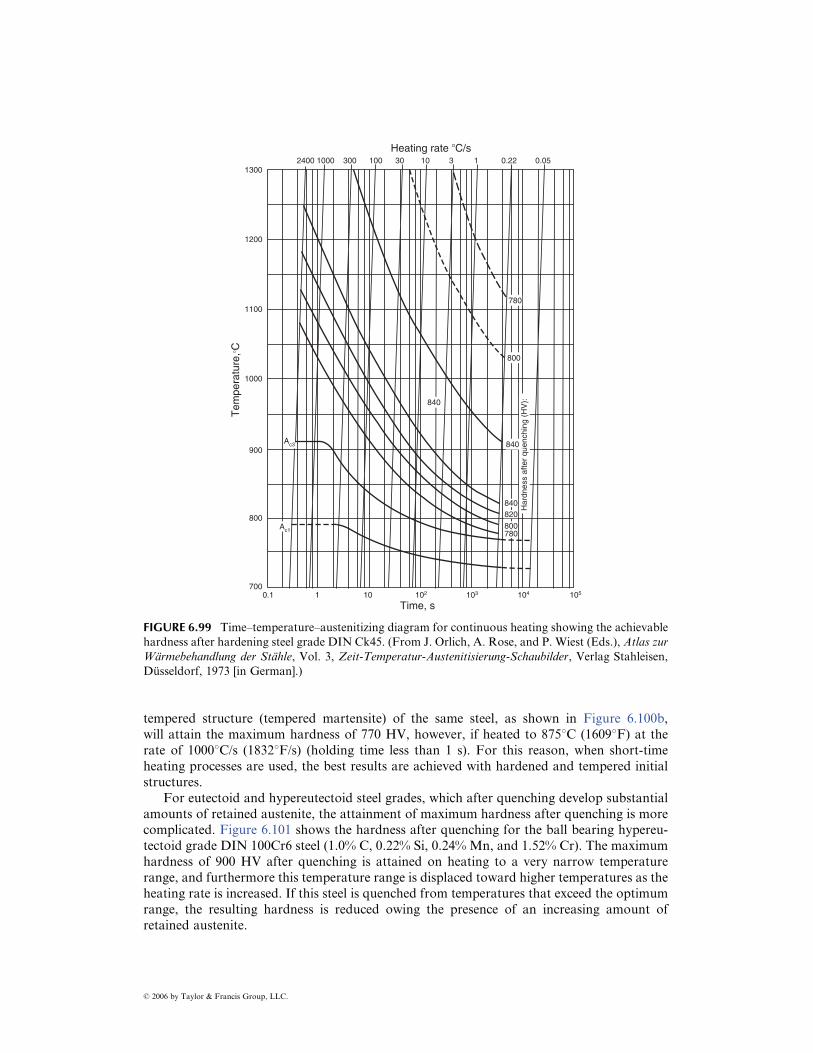
rates to different austenitizing temperatures. Figure 6.99 shows the achievable Vickers hard-
ness after hardening for grade DIN Ck45 steel austenitized at various heating rates to various
temperatures. It shows, for example, that maximum hardness would be achieved upon
austenitizing the steel at 850 8C (1562 8F) for about 900 s (or heating at a heating rate of
18C/s (33.88F/s)), which corresponds to the field of homogeneous austenite (see Figure 6.97).
The hardness after quenching, which depends on the amount of carbide dissolution, is also
dependent on the initial structure of the steel. This is illustrated in Figure 6.100. Figure 6.100a
shows that a structure of spheroidized cementite (after soft annealing) of the hypoeutectoid
DIN Cf53 carbon steel will attain the maximum hardness of 770 HV when heated at a rate
of 18C/s (33.88F/s) to 8758C (16098F) (holding time 855 s or 14 min). The hardened and
Heating rate 8C/s
Tem
pera
ture
, 8C
24001300
1200
1100
1000
900
800
700
10−1 1 10
Time, s
103102 104 105
1000 300 100 30 10 3 1 0.22
Ac3
Ac1
0.05
11 to 10
4 to 3
4
6
8
9
10
Gra
in s
ize (
AS
TM
):
FIGURE 6.98 Time–temperature–austenitizing diagram for continuous heating showing the grain
growth of steel grade DIN Ck45. (From J. Orlich, A. Rose, and P. Wiest (Eds.), Atlas zur Warmebe-
handlung der Stahle, Vol. 3, Zeit-Temperatur-Austenitisierung-Schaubilder, Verlag Stahleisen, Dussel-
dorf, 1973 [in German].)
ß 2006 by Taylor & Francis Group, LLC.
tempered structure (tempered martensite) of the same steel, as shown in Figure 6.100b,
will attain the maximum hardness of 770 HV, however, if heated to 875 8C (1609 8F) at the
rate of 1000 8C/s (1832 8F/s) (holding time less than 1 s). For this reason, when short-time
heating processes are used, the best results are achieved with hardened and tempered initial
structures.
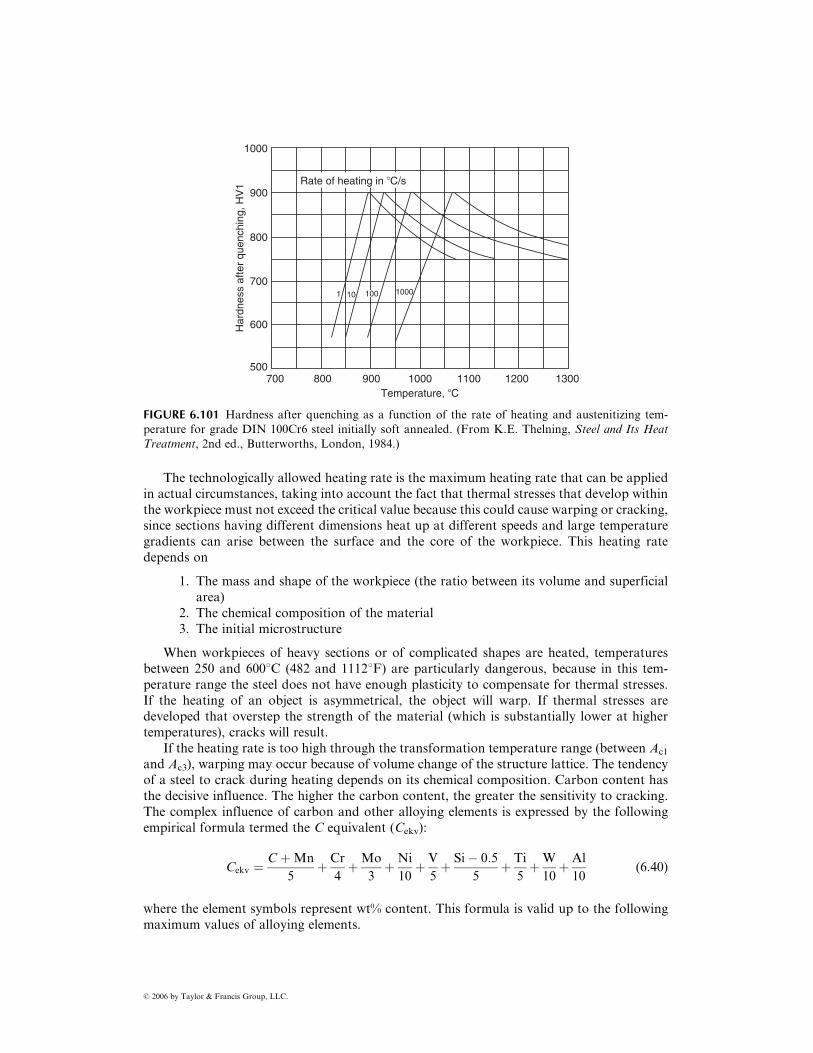
For eutectoid and hypereutectoid steel grades, which after quenching develop substantial
amounts of retained austenite, the attainment of maximum hardness after quenching is more
complicated. Figure 6.101 shows the hardness after quenching for the ball bearing hypereu-
tectoid grade DIN 100Cr6 steel (1.0% C, 0.22% Si, 0.24% Mn, and 1.52% Cr). The maximum
hardness of 900 HV after quenching is attained on heating to a very narrow temperature
range, and furthermore this temperature range is displaced toward higher temperatures as the
heating rate is increased. If this steel is quenched from temperatures that exceed the optimum
range, the resulting hardness is reduced owing the presence of an increasing amount of
retained austenite.
Heating rate 8C/s
Tem
pera
ture
,8C
24001300
1200
1100
1000
900
800
7000.1 1 10 102 103 104 105
Time, s
1000 300 100 30 10 3 1 0.22 0.05
780
Ac1
Ac3
840
840
820
800780
840
800
Hard
ness a
fter
quenchin
g (
HV
):
FIGURE 6.99 Time–temperature–austenitizing diagram for continuous heating showing the achievable
hardness after hardening steel grade DIN Ck45. (From J. Orlich, A. Rose, and P. Wiest (Eds.), Atlas zur
Warmebehandlung der Stahle, Vol. 3, Zeit-Temperatur-Austenitisierung-Schaubilder, Verlag Stahleisen,
Dusseldorf, 1973 [in German].)
ß 2006 by Taylor & Francis Group, LLC.
For plain carbon and low-alloy structural steels, which contain easily dissolved carbides, a
holding time of 5–15 min after they have reached the hardening temperature is quite enough
to make certain that there has been sufficient carbide dissolution. For medium-alloy struc-
tural steels this holding time is about 15–25 min. For low-alloy tool steels, it is between 10 and
30 min; and for high-alloy Cr steels, between 10 min and 1 h.
6.3.1.2 Technological Aspects of Austenitizing
In heating metallic objects to their austenitizing (hardening) temperature, there are two kinds
of heating rates to be distinguished: those that are technically possible and those that are
technologically allowed.
The technically possible heating rate is the heating rate the heating equipment could
realize in actual use. It depends on
1. The installed heating capacity of the equipment
2. The heat transfer medium (gas, liquid, vacuum)
3. The temperature difference between the heat source and the surface of the heated
objects (workpieces put in a hot or cold furnace)
4. The mass and shape of the workpiece (the ratio between its volume and superficial
area)
5. The number of workpieces in a batch and their loading arrangement
Ha
rdn
ess a
fte
r q
ue
nch
ing
, H
V1 900
800
700
600700 800 900 1000
Temperature, 8C
1100 1200 1300
1
1000
900
800
700
600700 800 900 1000 1100 1200 1300
100101
Rate of heating in 8C/s
Rate of heating in 8C/s
Temperature, 8C
Hard
ness a
fter
quenchin
g,
HV
1
1000100
10
(a)
(b)
FIGURE 6.100 Hardness after quenching as a function of the rate of heating and austenitizing tem-
perature for grade DIN Cf53 steel (hypoeutectoid carbon steel) (a) for soft-annealed condition and (b)
for hardened and tempered condition. (From K.E. Thelning, Steel and Its Heat Treatment, 2nd ed.,
Butterworths, London, 1984.)
ß 2006 by Taylor & Francis Group, LLC.
The technologically allowed heating rate is the maximum heating rate that can be applied
in actual circumstances, taking into account the fact that thermal stresses that develop within
the workpiece must not exceed the critical value because this could cause warping or cracking,
since sections having different dimensions heat up at different speeds and large temperature
gradients can arise between the surface and the core of the workpiece. This heating rate
depends on
1. The mass and shape of the workpiece (the ratio between its volume and superficial
area)
2. The chemical composition of the material
3. The initial microstructure
When workpieces of heavy sections or of complicated shapes are heated, temperatures
between 250 and 6008C (482 and 11128F) are particularly dangerous, because in this tem-
perature range the steel does not have enough plasticity to compensate for thermal stresses.
If the heating of an object is asymmetrical, the object will warp. If thermal stresses are
developed that overstep the strength of the material (which is substantially lower at higher
temperatures), cracks will result.
If the heating rate is too high through the transformation temperature range (between Ac1
and Ac3), warping may occur because of volume change of the structure lattice. The tendency
of a steel to crack during heating depends on its chemical composition. Carbon content has
the decisive influence. The higher the carbon content, the greater the sensitivity to cracking.
The complex influence of carbon and other alloying elements is expressed by the following
empirical formula termed the C equivalent (Cekv):
Cekv ¼C þ Mn
5þ
Cr
4þ
Mo
3þ
Ni
10þ
V
5þ
Si ÿ 0:5
5þ
Ti
5þ
W
10þ
Al
10(6:40)
where the element symbols represent wt% content. This formula is valid up to the following
maximum values of alloying elements.
Temperature, 8C
Hard
ness a
fter
quenchin
g, H
V1
1 10 1000
1000
900
800
700
600
500700 800 900 1000 1100 1200 1300
Rate of heating in 8C/s
100
FIGURE 6.101 Hardness after quenching as a function of the rate of heating and austenitizing tem-
perature for grade DIN 100Cr6 steel initially soft annealed. (From K.E. Thelning, Steel and Its Heat
Treatment, 2nd ed., Butterworths, London, 1984.)
ß 2006 by Taylor & Francis Group, LLC.
The values of the alloying elements actually present are put into the formula in wt%. If
the amount of an alloying element exceeds the limit given above, then the indicated maximum
value should be put into the formula.
The higher the calculated Cekv value, the greater the sensitivity of the steel to cracking. For
instance,
Cekv � 0.4: The steel is not sensitive to cracking (it may be heated quite rapidly).
Cekv ¼ 0.4–0.7: The steel is medium sensitive to cracking.
Cekv � 0.7: The steel is very sensitive to cracking (when heating up a preheating
operation should be included).
The initial microstructure also has some influence on the technologically allowed heating
rate. A steel with a homogeneous microstructure of low hardness may be heated more rapidly
than a steel of high hardness with inhomogeneous microstructure.
The thermal gradients and consequently the thermal stresses developed when heating to
austenitizing temperature can usually be diminished by preheating the workpiece to tempera-
ture lying close below the transformation temperature Ac1 and holding it there until
temperature equalizes throughout the cross section.
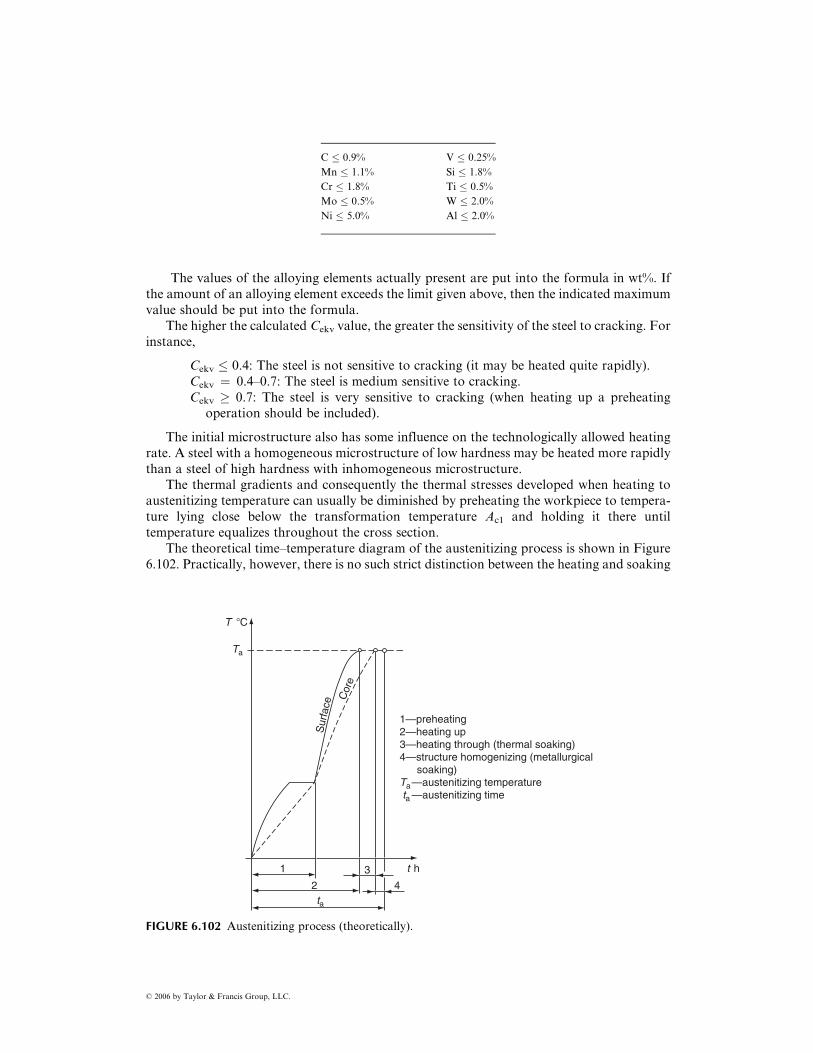
The theoretical time–temperature diagram of the austenitizing process is shown in Figure
6.102. Practically, however, there is no such strict distinction between the heating and soaking
C � 0.9% V � 0.25%
Mn � 1.1% Si � 1.8%
Cr � 1.8% Ti � 0.5%
Mo � 0.5% W � 2.0%
Ni � 5.0% Al � 2.0%
1—preheating 2—heating up3—heating through (thermal soaking)4—structure homogenizing (metallurgical soaking)Ta—austenitizing temperature ta —austenitizing time
Ta
1
2
3
4
T 8C
ta
t h
Surf
ace Core
FIGURE 6.102 Austenitizing process (theoretically).
ß 2006 by Taylor & Francis Group, LLC.
times. Contrary to the generally widespread belief that the surface of the steel reaches the
preset temperature considerably earlier than the center, the closer the temperature of the steel
approaches the preset temperature, the smaller the temperature difference between surface
and core, as shown in Figure 6.103. It can therefore be assumed that when the surface has
reached the preset temperature, part of the soaking time (depending on the cross-sectional
size) has already been accomplished. Certainly, one has to be aware of the corner effect—
corners, sharp edges, and thin sections reach the preset temperature much earlier than the
core of the workpiece.
The most important parameters of every austenitizing process are:
1. The austenitizing temperature
2. The heat-up and soak time at austenitizing temperature
For each grade of steel there is an optimum austenitizing (hardening) temperature
range. This temperature range is chosen so as to give maximum hardness after quenching
and maintain a fine-grained microstructure. It can be determined experimentally as shown
in Figure 6.104 and Figure 6.105. From Figure 6.104 it is clear that the lowest possible
hardening temperature for the steel in question is 850 8C (1562 8F). A lower hardening
temperature would result in the formation of bainite and even pearlite with inadequate
hardness.
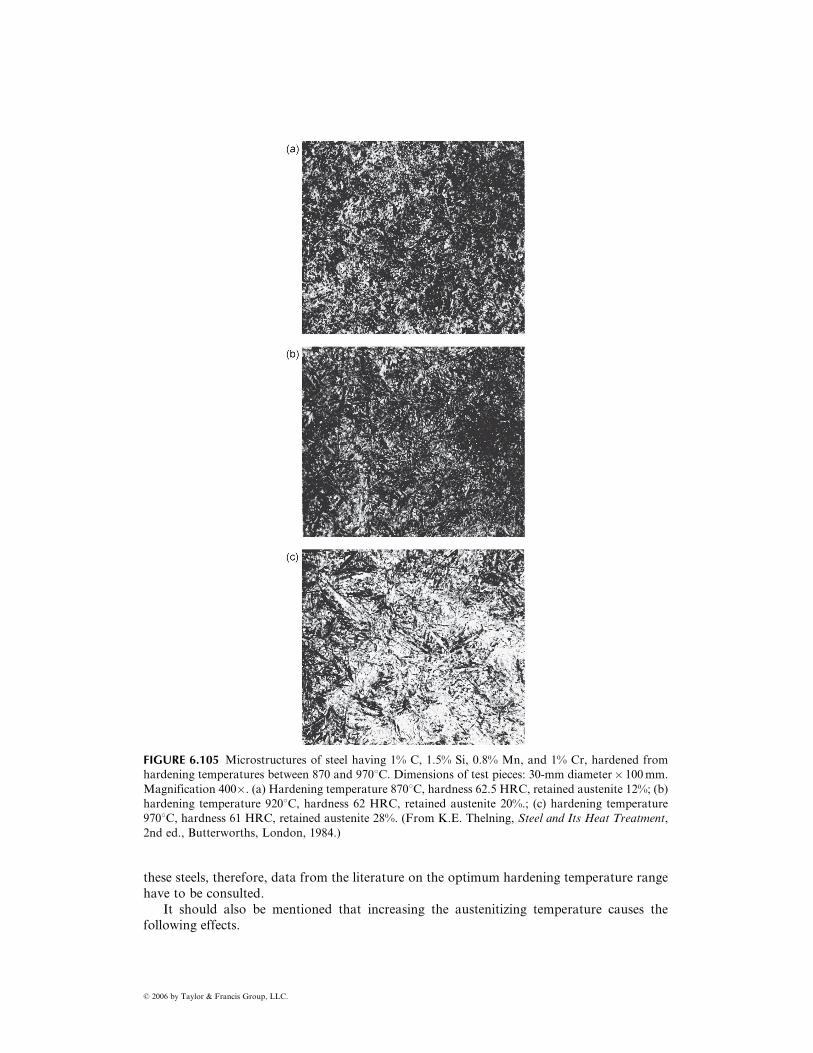
When the hardening temperature is increased (see Figure 6.105), the grain size and
the amount of retained austenite increase. At 920 and 970 8C (1688 and 1778 8F) the retained
austenite may be discerned as light angular areas. On the basis of these experiments,
the optimum hardening temperature range for the steel in question has been fixed at 850–
880 8C (1562–1616 8F). The optimum hardening temperature range for unalloyed steels can be
determined from the iron–carbon equilibrium diagram according to the carbon content
of the steel. This range is 30–50 8C (86–1228F) above the Ac3 temperature for hypoeutectoid
steels and 30–50 8C (86–1228F) above Ac1 for hypereutectoid steels, as shown in Figure 6.106.
Because the curve S–E in this diagram denotes also the maximum solubility of carbon
∅1 × 4 in. I ∅ 25 × 100 mm
∅2 × 7 in. II ∅ 50 × 175 mm
∅4 × 8 in. III ∅ 100 × 200 mm
I II
III
Temperature
min
10001832
1652
1472
1292
1112
932
752
572
392
212
32
800
900
700
600
500
400
300
200
100
0
0 2 4 86 10 12 14 16 18 20 22 24 26 28
Heating-up time
8F 8C
FIGURE 6.103 Time–temperature curves for steel bars of different diameters heated in a salt bath at
10008C. Full line, measured temperature at surface; dashed line, measured temperature at center. (From
K.E. Thelning, Steel and Its Heat Treatment, 2nd ed., Butterworths, London, 1984.)
ß 2006 by Taylor & Francis Group, LLC.
in austenite, it is clear that the higher the austenitizing (hardening) temperature, the
more carbon can be dissolved in austenite. For alloyed steels the optimum austenitizing
(hardening) temperature range depends on the chemical composition, because different
alloying elements shift the A1 temperature to either higher or lower temperatures. For
FIGURE 6.104 Microstructures of a steel having 1% C, 1.5% Si, 0.8% Mn, and 1% Cr, hardened from
hardening temperatures between 800 and 8508C. Dimensions of test pieces: 30-mm diameter� 100 mm.
Magnification 400�. (a) Hardening temperature 8008C, hardness 55 HRC; (b) hardening temperature
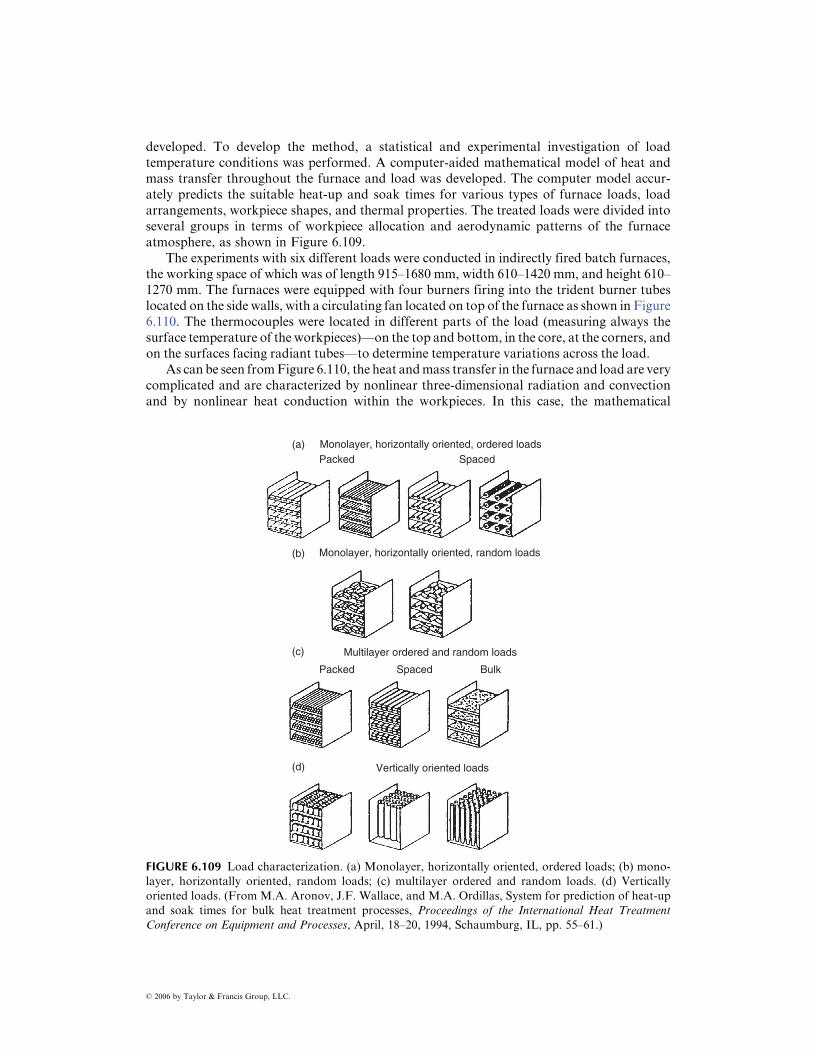
layer, horizontally oriented, random loads; (c) multilayer ordered and random loads. (d) Vertically
oriented loads. (From M.A. Aronov, J.F. Wallace, and M.A. Ordillas, System for prediction of heat-up
and soak times for bulk heat treatment processes, Proceedings of the International Heat Treatment
Conference on Equipment and Processes, April, 18–20, 1994, Schaumburg, IL, pp. 55–61.)
ß 2006 by Taylor & Francis Group, LLC.
model to describe the heat and mass exchange is a system of integral and differential nonlinear
equations. The input parameters to the computer program were as follows:
Geometrical data of the furnace and load: Furnace working space dimensions,
radiant tube diameter and layout in the furnace, dimensions of the baskets, number
of trays in the basket, workpiece characteristic size
Type of load (according to load characterization, see Figure 6.109)
Type of steel (carbon, alloyed, high-alloy)
Load thermal properties
Load and furnace emissivities
Temperature conditions (initial furnace and load temperature)
Fan characteristic curve parameters
Composition of protective atmosphere
As an example, maximum and minimum steel part temperatures for a test (heating of
shafts) together with the calculated data are shown in Figure 6.111. The experimental data
show that the temperature curve of the load thermocouple usually reaches the set furnace
temperature well within the soak time requirements. The experimentally determined soak
time is seen to be considerably shorter than the soak time defined by the heat treater. It was
found that the discrepancy between soak times determined from the test data and calculations
does not exceed 8%, which is acceptable for workshop practice.
The developed computer model was used for simulation of temperature conditions for
different load configurations, and a generalized formula and set of graphs were developed.
The generalized equation for the soak time determination is
ts ¼ tsb k (6:43)
where ts is the calculated soak time, min; tsb is soak time for baseline temperature conditions,
min; and k is a correction factor for the type of steel.
The basic soak time ( tsb) is obtained from graphs derived from the computer simulation.
Such a graph for packed loads is shown in Figure 6.112. Other load shapes and configurations
Radianttubes
Radiation from the radiant tubesConvection from the radiant tubesRadiation from the walls Convection from the walls Convection from the furnace gasesRadiation between partsConduction through the partsLoad
qwr
qpc
qtr
qtc
qwr
qwc
qgc
qpr
qpc
qgc
qpr
qtc
qtr
qwc
Roof fan
FIGURE 6.110 Heat transfer in the used furnace and load. (From M.A. Aronov, J.F. Wallace, and
M.A. Ordillas, System for prediction of heat-up and soak times for bulk heat treatment processes,
Proceedings of the International Heat Treatment Conference on Equipment and Processes, April, 18–20,
1994, Schaumburg, IL, pp. 55–61.)
ß 2006 by Taylor & Francis Group, LLC.
require different graphs. The correction factor k depends on the type of steel. The generalized
equation (Equation 6.43) for the heat-up and soak time determination was set into a user-
friendly computer package that incorporates charts for the calculation. This resulted in a
straightforward way of determining the soak time without the use of charts while allowing for
a quick and accurate soak time calculation.
6.3.2 QUENCHING INTENSITY MEASUREMENT AND E VALUATION B ASED ON HEAT F LUX DENSITY
In designing the method for practical measurement, recording, and evaluation of the quench-
ing and cooling intensity in workshop conditions, in contrast to the Grossmann H value
concept, which expresses quenching intensity by a single number, the main idea of Liscic was
to express the quenching intensity by continuous change of relevant thermodynamic functions
during the whole quenching process. Instead of recording only one cooling curve (as in
laboratory-designed tests) in the center of a small (usually 1/2 in.) cylindrical specimen, the
900
Tem
pera
ture
, 8C
800
700
600
500
400
3000 15 30 45 60 75 90
Time, min
Furnace temp. + Load max. exper. Load min. exper.Load max. calcul. Load min. calcul.
105 120 135
FIGURE 6.111 Computer simulation for heating of shafts. (From M.A. Aronov, J.F. Wallace, and
M.A. Ordillas, System for prediction of heat-up and soak times for bulk heat treatment processes,
Proceedings of the International Heat Treatment Conference on Equipment and Processes, April, 18–20,
1994, Schaumburg, IL, pp. 55–61.)
N = 3 N = 2
N = 4
N = 1
N = Number
of trays
N > 4
300
Load characteristic size, in.
So
ak tim
e (
t sb),
min
250
200
150
100
50
00 0.5 1 1.5 2 32.5 3.5 4 4.5 5 5.5 6 6.5 7
FIGURE 6.112 Thermal soak time for a packed load. (From M.A. Aronov, J.F. Wallace, and M.A.
Ordillas, System for prediction of heat-up and soak times for bulk heat treatment processes, Proceedings
of the International Heat Treatment Conference on Equipment and Processes, April, 18–20, 1994,