Please refer to the important disclosures and analyst certification on inside back cover of this document, or on our website www.macquarie.com/disclosures. AUSTRALIA 4 December 2012 Macquarie Securities (Australia) Limited Emerging Leaders Wrap Expanding the universe This month two stocks were added to our Emerging Leader coverage universe. M2 Telecommunications (MTU, Outperform, $3.21 PT) We expect the stock to outperform on a short-term view as Primus acquisition synergies drive reasonable earnings growth (+20% EPS growth in FY13). The company has targeted significant synergy potential in combining the two companies (~$5m pa over the next three years or total ~$15m) in terms of enhanced buying leverage with suppliers, cost base rationalisation and moving customers on-net which attracts a higher gross margin. The stock is also attractive on a free cashflow yield basis (9%-11% FY13/FY14). Longer term we believe continued outperformance will be reliant on M2's ability to demonstrate more meaningful organic growth than it has delivered previously or alternatively continue to pursue acquisitions to drive future earnings. Our preference in the junior telco space is Amcom (AMM), given the stronger organic growth profile and more favourable market structure. SCA Property Group (SCP, Underperform, $1.40 PT) SCP is a relatively defensive proposition backed by a strong covenant with ~61% of gross income derived from Woolworths‟ entities. Despite some concerns around growth with anchor leases unlikely to breach turnover rent thresholds for at least the next four years, SCA is a fairly low-risk proposition centred on convenience retail. Our NAV valuation of $1.37-1.40 assumes 10-20bps of cap rate expansion given Woolworths were unable to sell 20 of the portfolio assets in the direct market having first announced intentions to reduce the amount of property on balance sheet in September 2010. We have completed a detailed analysis on the success of this divestment program in the report. Despite several levers available to the group to ensure stable DPS growth including corporate cost out, a structural vacancy allowance and the ability to increase the dividend payout ratio, we forecast a flat FCF on a three-year CAGR basis reflecting the roll off of rent guarantees and tenant incentives. On this basis, we prefer other stocks in the sector such as CQR and initiate on SCP with an Underperform recommendation. ELG model portfolio performance Our model portfolio finished up 0.14% in November compared to the Small Ordinaries Accumulation Index, which was down 2.43%. Best performers this month included Independence (14.5%), Horizon (14.15) and Corporate Travel Management (12.3%). The portfolio‟s performance this month has been impacted by positions in NRW (-35.4%), Azimuth (-23%), Alacer (-18.5%) and Panoramic (-16%). This month we have removed Discovery Metals, given our view there is low risk of the Cathay Fortune bid being bettered combined with completion risks associated with the hostile DML Board response. We have added Henderson Group given its discount valuation and market leverage. In view of the impact of net flows on margin, we believe there is scope for a positive margin outlook on despite the headwinds the rest of the sector will see on retail margins in 2013 and onwards.
Transcript
Please refer to the important disclosures and analyst certification on inside back cover of this document, or on our website www.macquarie.com/disclosures.
AUSTRALIA
4 December 2012 Macquarie Securities (Australia) Limited
Emerging Leaders Wrap Expanding the universe This month two stocks were added to our Emerging Leader coverage universe.
M2 Telecommunications (MTU, Outperform, $3.21 PT) We expect the stock to
outperform on a short-term view as Primus acquisition synergies drive
reasonable earnings growth (+20% EPS growth in FY13). The company has
targeted significant synergy potential in combining the two companies (~$5m pa
over the next three years or total ~$15m) in terms of enhanced buying leverage
with suppliers, cost base rationalisation and moving customers on-net which
attracts a higher gross margin. The stock is also attractive on a free cashflow
yield basis (9%-11% FY13/FY14). Longer term we believe continued
outperformance will be reliant on M2's ability to demonstrate more meaningful
organic growth than it has delivered previously or alternatively continue to
pursue acquisitions to drive future earnings. Our preference in the junior telco
space is Amcom (AMM), given the stronger organic growth profile and more
favourable market structure.
SCA Property Group (SCP, Underperform, $1.40 PT) SCP is a relatively
defensive proposition backed by a strong covenant with ~61% of gross income
derived from Woolworths‟ entities. Despite some concerns around growth with
anchor leases unlikely to breach turnover rent thresholds for at least the next
four years, SCA is a fairly low-risk proposition centred on convenience retail.
Our NAV valuation of $1.37-1.40 assumes 10-20bps of cap rate expansion given
Woolworths were unable to sell 20 of the portfolio assets in the direct market
having first announced intentions to reduce the amount of property on balance
sheet in September 2010. We have completed a detailed analysis on the
success of this divestment program in the report.
Despite several levers available to the group to ensure stable DPS growth
including corporate cost out, a structural vacancy allowance and the ability to
increase the dividend payout ratio, we forecast a flat FCF on a three-year CAGR
basis reflecting the roll off of rent guarantees and tenant incentives. On this
basis, we prefer other stocks in the sector such as CQR and initiate on SCP with
an Underperform recommendation.
ELG model portfolio performance
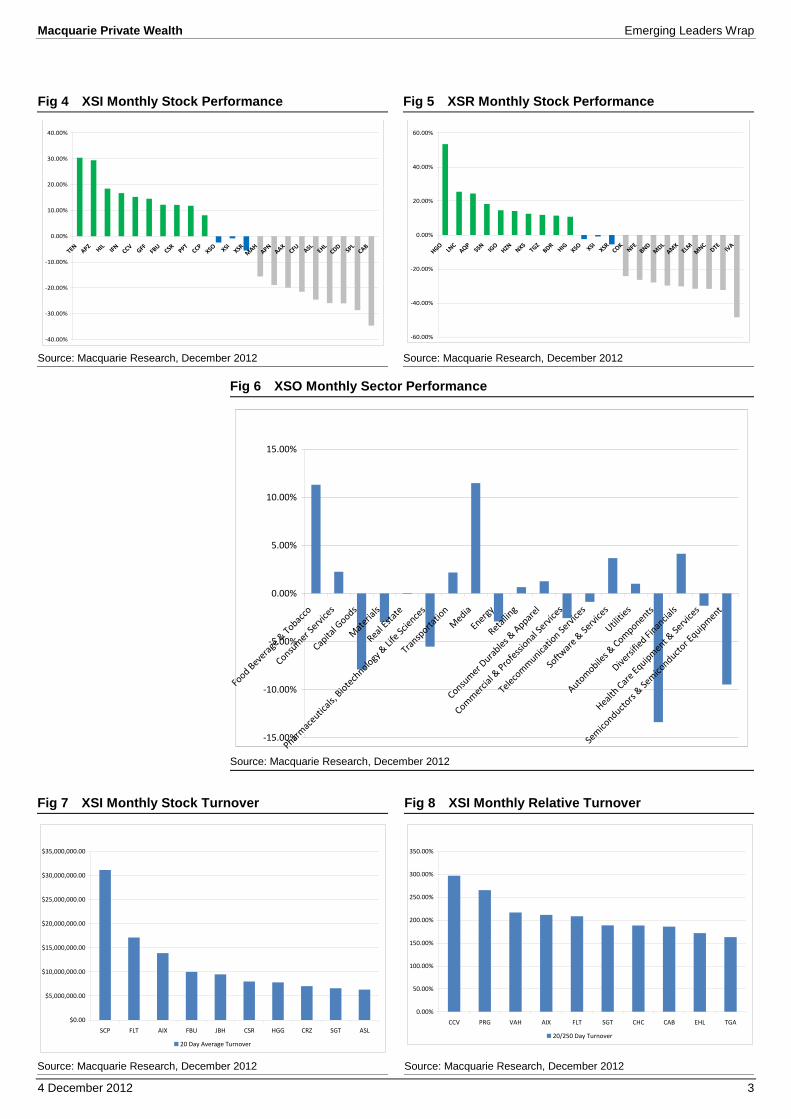
Our model portfolio finished up 0.14% in November compared to the Small
Ordinaries Accumulation Index, which was down 2.43%. Best performers this
month included Independence (14.5%), Horizon (14.15) and Corporate Travel
Management (12.3%). The portfolio‟s performance this month has been
impacted by positions in NRW (-35.4%), Azimuth (-23%), Alacer (-18.5%) and
Panoramic (-16%).
This month we have removed Discovery Metals, given our view there is low risk
of the Cathay Fortune bid being bettered combined with completion risks
associated with the hostile DML Board response. We have added Henderson
Group given its discount valuation and market leverage. In view of the impact of
net flows on margin, we believe there is scope for a positive margin outlook on
despite the headwinds the rest of the sector will see on retail margins in 2013
and onwards.
Macquarie Private Wealth Emerging Leaders Wrap
4 December 2012 2
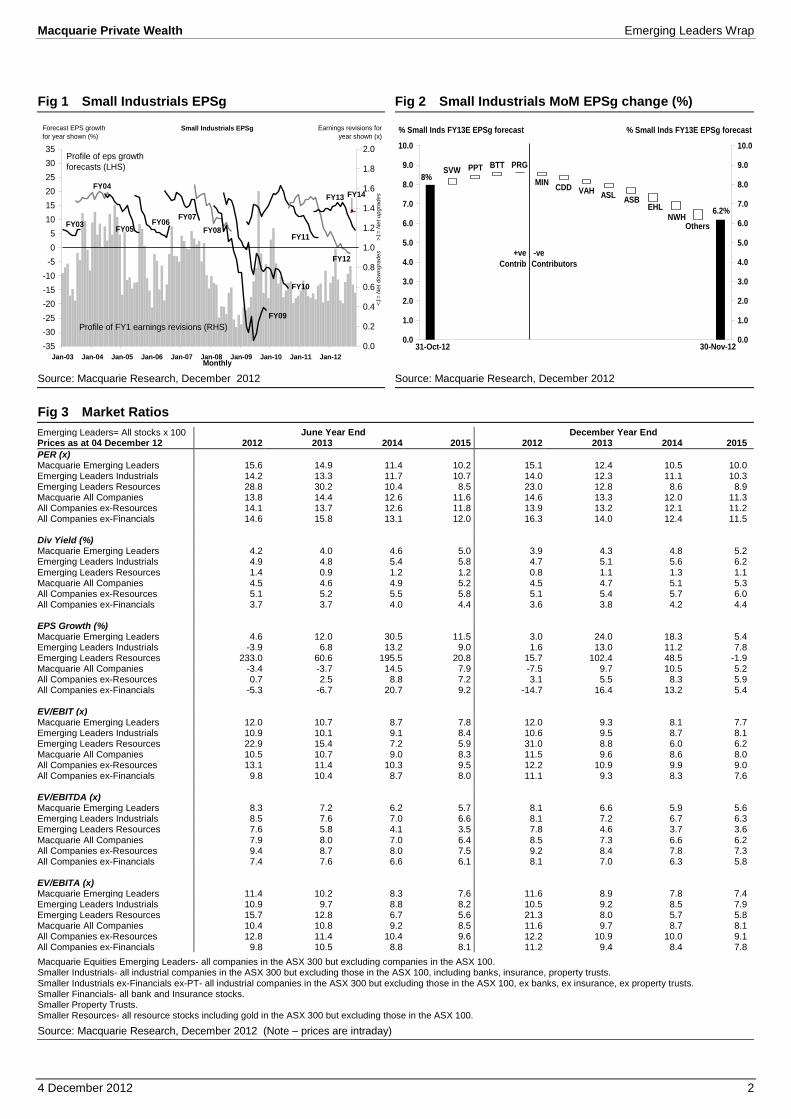
Fig 1 Small Industrials EPSg Fig 2 Small Industrials MoM EPSg change (%)
Source: Macquarie Research, December 2012 Source: Macquarie Research, December 2012
Fig 3 Market Ratios
Emerging Leaders= All stocks x 100 June Year End December Year End Prices as at 04 December 12 2012 2013 2014 2015 2012 2013 2014 2015
Macquarie Equities Emerging Leaders- all companies in the ASX 300 but excluding companies in the ASX 100. Smaller Industrials- all industrial companies in the ASX 300 but excluding those in the ASX 100, including banks, insurance, property trusts. Smaller Industrials ex-Financials ex-PT- all industrial companies in the ASX 300 but excluding those in the ASX 100, ex banks, ex insurance, ex property trusts. Smaller Financials- all bank and Insurance stocks. Smaller Property Trusts. Smaller Resources- all resource stocks including gold in the ASX 300 but excluding those in the ASX 100.
Source: Macquarie Research, December 2012 (Note – prices are intraday)
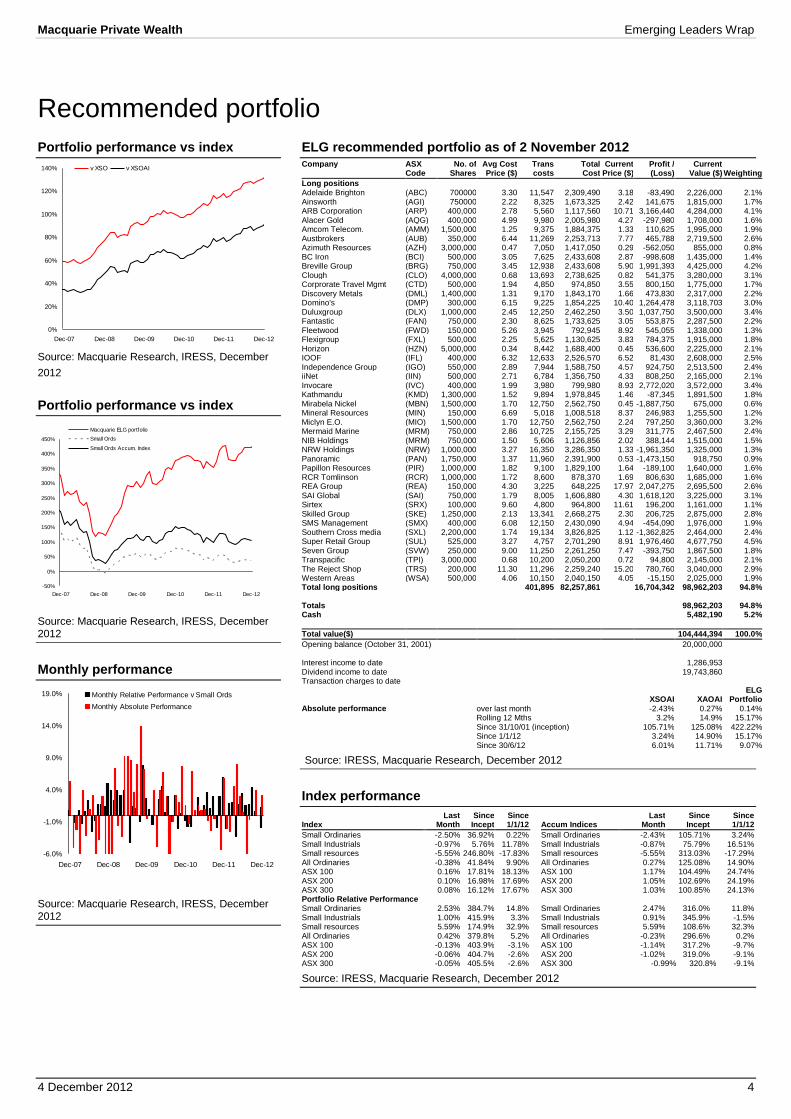
Interest income to date 1,286,953 Dividend income to date 19,743,860 Transaction charges to date
XSOAI XAOAI
ELG Portfolio
Absolute performance over last month -2.43% 0.27% 0.14% Rolling 12 Mths 3.2% 14.9% 15.17% Since 31/10/01 (inception) 105.71% 125.08% 422.22% Since 1/1/12 3.24% 14.90% 15.17% Since 30/6/12 6.01% 11.71% 9.07%
Source: IRESS, Macquarie Research, December 2012
Index performance
Index Last
Month Since
Incept Since 1/1/12 Accum Indices
Last Month
Since Incept
Since 1/1/12
Small Ordinaries -2.50% 36.92% 0.22% Small Ordinaries -2.43% 105.71% 3.24% Small Industrials -0.97% 5.76% 11.78% Small Industrials -0.87% 75.79% 16.51% Small resources -5.55% 246.80% -17.83% Small resources -5.55% 313.03% -17.29% All Ordinaries -0.38% 41.84% 9.90% All Ordinaries 0.27% 125.08% 14.90% ASX 100 0.16% 17.81% 18.13% ASX 100 1.17% 104.49% 24.74% ASX 200 0.10% 16.98% 17.69% ASX 200 1.05% 102.69% 24.19% ASX 300 0.08% 16.12% 17.67% ASX 300 1.03% 100.85% 24.13% Portfolio Relative Performance Small Ordinaries 2.53% 384.7% 14.8% Small Ordinaries 2.47% 316.0% 11.8% Small Industrials 1.00% 415.9% 3.3% Small Industrials 0.91% 345.9% -1.5% Small resources 5.59% 174.9% 32.9% Small resources 5.59% 108.6% 32.3% All Ordinaries 0.42% 379.8% 5.2% All Ordinaries -0.23% 296.6% 0.2% ASX 100 -0.13% 403.9% -3.1% ASX 100 -1.14% 317.2% -9.7% ASX 200 -0.06% 404.7% -2.6% ASX 200 -1.02% 319.0% -9.1% ASX 300 -0.05% 405.5% -2.6% ASX 300 -0.99% 320.8% -9.1%
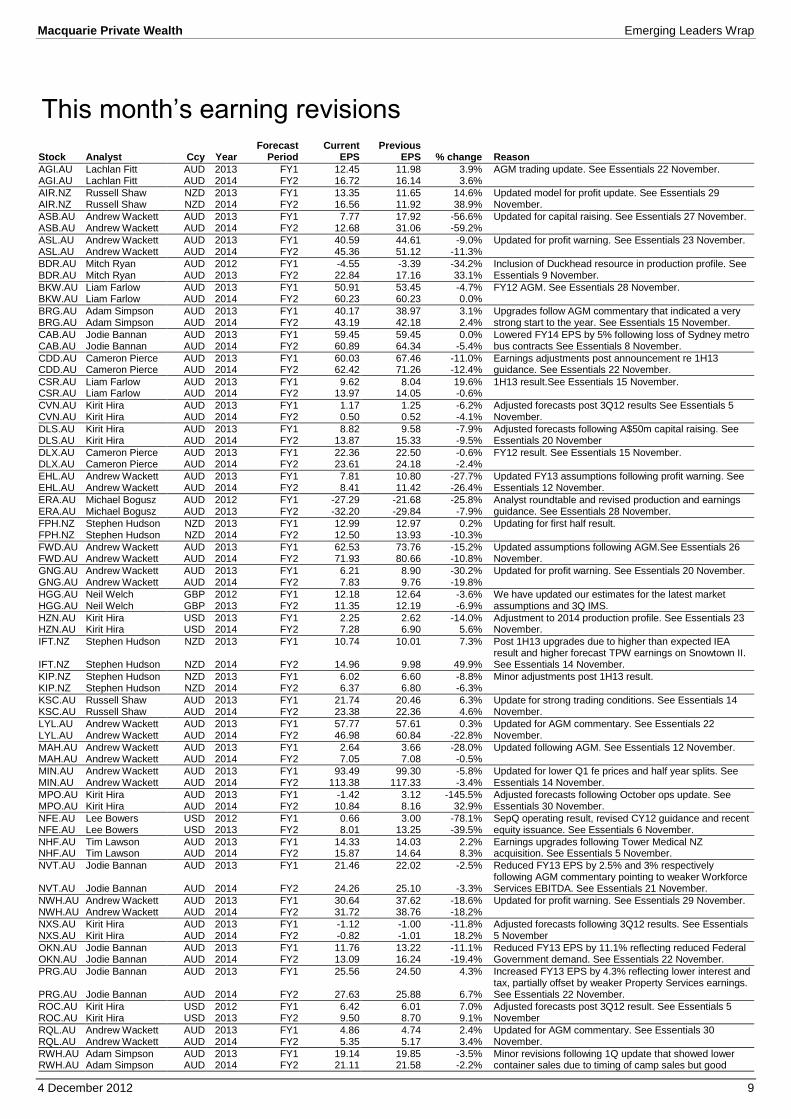
AIR.NZ Russell Shaw NZD 2013 FY1 13.35 11.65 14.6% Updated model for profit update. See Essentials 29 November. AIR.NZ Russell Shaw NZD 2014 FY2 16.56 11.92 38.9%
ASB.AU Andrew Wackett AUD 2013 FY1 7.77 17.92 -56.6% Updated for capital raising. See Essentials 27 November. ASB.AU Andrew Wackett AUD 2014 FY2 12.68 31.06 -59.2%
ASL.AU Andrew Wackett AUD 2013 FY1 40.59 44.61 -9.0% Updated for profit warning. See Essentials 23 November. ASL.AU Andrew Wackett AUD 2014 FY2 45.36 51.12 -11.3%
BDR.AU Mitch Ryan AUD 2012 FY1 -4.55 -3.39 -34.2% Inclusion of Duckhead resource in production profile. See Essentials 9 November. BDR.AU Mitch Ryan AUD 2013 FY2 22.84 17.16 33.1%
BRG.AU Adam Simpson AUD 2013 FY1 40.17 38.97 3.1% Upgrades follow AGM commentary that indicated a very strong start to the year. See Essentials 15 November. BRG.AU Adam Simpson AUD 2014 FY2 43.19 42.18 2.4%
CAB.AU Jodie Bannan AUD 2013 FY1 59.45 59.45 0.0% Lowered FY14 EPS by 5% following loss of Sydney metro bus contracts See Essentials 8 November. CAB.AU Jodie Bannan AUD 2014 FY2 60.89 64.34 -5.4%
CDD.AU Cameron Pierce AUD 2013 FY1 60.03 67.46 -11.0% Earnings adjustments post announcement re 1H13 guidance. See Essentials 22 November. CDD.AU Cameron Pierce AUD 2014 FY2 62.42 71.26 -12.4%
EHL.AU Andrew Wackett AUD 2013 FY1 7.81 10.80 -27.7% Updated FY13 assumptions following profit warning. See Essentials 12 November. EHL.AU Andrew Wackett AUD 2014 FY2 8.41 11.42 -26.4%
ERA.AU Michael Bogusz AUD 2012 FY1 -27.29 -21.68 -25.8% Analyst roundtable and revised production and earnings guidance. See Essentials 28 November. ERA.AU Michael Bogusz AUD 2013 FY2 -32.20 -29.84 -7.9%
FPH.NZ Stephen Hudson NZD 2013 FY1 12.99 12.97 0.2% Updating for first half result. FPH.NZ Stephen Hudson NZD 2014 FY2 12.50 13.93 -10.3%
FWD.AU Andrew Wackett AUD 2013 FY1 62.53 73.76 -15.2% Updated assumptions following AGM.See Essentials 26 November. FWD.AU Andrew Wackett AUD 2014 FY2 71.93 80.66 -10.8%
GNG.AU Andrew Wackett AUD 2013 FY1 6.21 8.90 -30.2% Updated for profit warning. See Essentials 20 November. GNG.AU Andrew Wackett AUD 2014 FY2 7.83 9.76 -19.8%
HGG.AU Neil Welch GBP 2012 FY1 12.18 12.64 -3.6% We have updated our estimates for the latest market assumptions and 3Q IMS. HGG.AU Neil Welch GBP 2013 FY2 11.35 12.19 -6.9%
HZN.AU Kirit Hira USD 2013 FY1 2.25 2.62 -14.0% Adjustment to 2014 production profile. See Essentials 23 November. HZN.AU Kirit Hira USD 2014 FY2 7.28 6.90 5.6%
IFT.NZ Stephen Hudson NZD 2013 FY1 10.74 10.01 7.3% Post 1H13 upgrades due to higher than expected IEA result and higher forecast TPW earnings on Snowtown II. See Essentials 14 November. IFT.NZ Stephen Hudson NZD 2014 FY2 14.96 9.98 49.9%
KIP.NZ Stephen Hudson NZD 2013 FY1 6.02 6.60 -8.8% Minor adjustments post 1H13 result. KIP.NZ Stephen Hudson NZD 2014 FY2 6.37 6.80 -6.3%
KSC.AU Russell Shaw AUD 2013 FY1 21.74 20.46 6.3% Update for strong trading conditions. See Essentials 14 November. KSC.AU Russell Shaw AUD 2014 FY2 23.38 22.36 4.6%
LYL.AU Andrew Wackett AUD 2013 FY1 57.77 57.61 0.3% Updated for AGM commentary. See Essentials 22 November. LYL.AU Andrew Wackett AUD 2014 FY2 46.98 60.84 -22.8%
MAH.AU Andrew Wackett AUD 2013 FY1 2.64 3.66 -28.0% Updated following AGM. See Essentials 12 November. MAH.AU Andrew Wackett AUD 2014 FY2 7.05 7.08 -0.5%
MIN.AU Andrew Wackett AUD 2013 FY1 93.49 99.30 -5.8% Updated for lower Q1 fe prices and half year splits. See Essentials 14 November. MIN.AU Andrew Wackett AUD 2014 FY2 113.38 117.33 -3.4%
MPO.AU Kirit Hira AUD 2013 FY1 -1.42 3.12 -145.5% Adjusted forecasts following October ops update. See Essentials 30 November. MPO.AU Kirit Hira AUD 2014 FY2 10.84 8.16 32.9%
NFE.AU Lee Bowers USD 2012 FY1 0.66 3.00 -78.1% SepQ operating result, revised CY12 guidance and recent equity issuance. See Essentials 6 November. NFE.AU Lee Bowers USD 2013 FY2 8.01 13.25 -39.5%
NHF.AU Tim Lawson AUD 2013 FY1 14.33 14.03 2.2% Earnings upgrades following Tower Medical NZ acquisition. See Essentials 5 November. NHF.AU Tim Lawson AUD 2014 FY2 15.87 14.64 8.3%
NVT.AU Jodie Bannan AUD 2013 FY1 21.46 22.02 -2.5% Reduced FY13 EPS by 2.5% and 3% respectively following AGM commentary pointing to weaker Workforce Services EBITDA. See Essentials 21 November. NVT.AU Jodie Bannan AUD 2014 FY2 24.26 25.10 -3.3%
NWH.AU Andrew Wackett AUD 2013 FY1 30.64 37.62 -18.6% Updated for profit warning. See Essentials 29 November. NWH.AU Andrew Wackett AUD 2014 FY2 31.72 38.76 -18.2%
NXS.AU Kirit Hira AUD 2013 FY1 -1.12 -1.00 -11.8% Adjusted forecasts following 3Q12 results. See Essentials 5 November NXS.AU Kirit Hira AUD 2014 FY2 -0.82 -1.01 18.2%
OKN.AU Jodie Bannan AUD 2013 FY1 11.76 13.22 -11.1% Reduced FY13 EPS by 11.1% reflecting reduced Federal Government demand. See Essentials 22 November. OKN.AU Jodie Bannan AUD 2014 FY2 13.09 16.24 -19.4%
PRG.AU Jodie Bannan AUD 2013 FY1 25.56 24.50 4.3% Increased FY13 EPS by 4.3% reflecting lower interest and tax, partially offset by weaker Property Services earnings. See Essentials 22 November. PRG.AU Jodie Bannan AUD 2014 FY2 27.63 25.88 6.7%
ROC.AU Kirit Hira USD 2012 FY1 6.42 6.01 7.0% Adjusted forecasts post 3Q12 result. See Essentials 5 November ROC.AU Kirit Hira USD 2013 FY2 9.50 8.70 9.1%
RQL.AU Andrew Wackett AUD 2013 FY1 4.86 4.74 2.4% Updated for AGM commentary. See Essentials 30 November. RQL.AU Andrew Wackett AUD 2014 FY2 5.35 5.17 3.4%
RWH.AU Adam Simpson AUD 2013 FY1 19.14 19.85 -3.5% Minor revisions following 1Q update that showed lower container sales due to timing of camp sales but good RWH.AU Adam Simpson AUD 2014 FY2 21.11 21.58 -2.2%
Macquarie Private Wealth Emerging Leaders Wrap
4 December 2012 10
Stock Analyst Ccy Year Forecast
Period Current
EPS Previous
EPS % change Reason
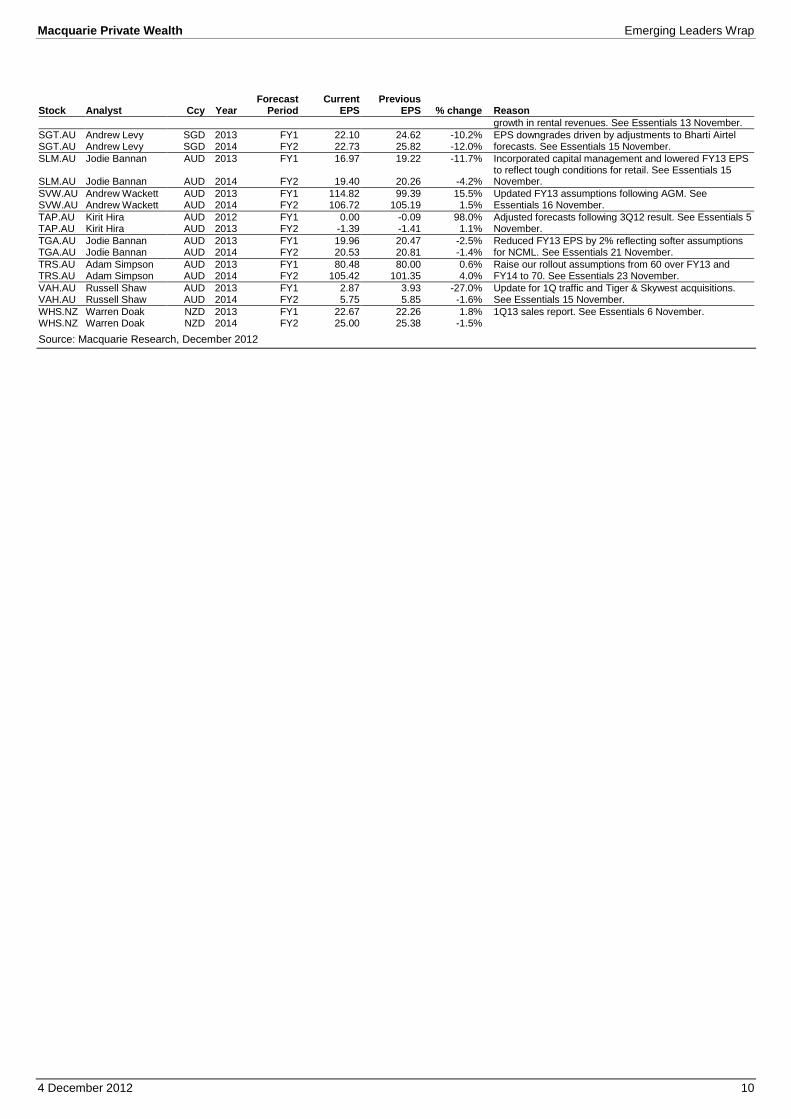
growth in rental revenues. See Essentials 13 November.
SGT.AU Andrew Levy SGD 2013 FY1 22.10 24.62 -10.2% EPS downgrades driven by adjustments to Bharti Airtel forecasts. See Essentials 15 November. SGT.AU Andrew Levy SGD 2014 FY2 22.73 25.82 -12.0%
SLM.AU Jodie Bannan AUD 2013 FY1 16.97 19.22 -11.7% Incorporated capital management and lowered FY13 EPS to reflect tough conditions for retail. See Essentials 15 November. SLM.AU Jodie Bannan AUD 2014 FY2 19.40 20.26 -4.2%
SVW.AU Andrew Wackett AUD 2013 FY1 114.82 99.39 15.5% Updated FY13 assumptions following AGM. See Essentials 16 November. SVW.AU Andrew Wackett AUD 2014 FY2 106.72 105.19 1.5%
TRS.AU Adam Simpson AUD 2013 FY1 80.48 80.00 0.6% Raise our rollout assumptions from 60 over FY13 and FY14 to 70. See Essentials 23 November. TRS.AU Adam Simpson AUD 2014 FY2 105.42 101.35 4.0%
VAH.AU Russell Shaw AUD 2013 FY1 2.87 3.93 -27.0% Update for 1Q traffic and Tiger & Skywest acquisitions. See Essentials 15 November. VAH.AU Russell Shaw AUD 2014 FY2 5.75 5.85 -1.6%
Recommendation changes Stock Analyst Current Rec Previous Rec Change Reason
FWD.AU Andrew Wackett Neutral Outperform Downgrade
Downgrade to Neutral. Fleetwood has a sound balance sheet, exposure to long-term growth industries (Retirement, Recreation and Resources) and a solid dividend yield. See Essentials 26 November.
HGG.AU Neil Welch Outperform Neutral Upgrade
We have upgraded our rating to Outperform reflecting the leverage to European asset re-rating, the stocks discounted earnings rating and premium yield.
VAH.AU Russell Shaw Underperform Neutral Downgrade
Downgrade to Underperform. Although we like the strategic rationale for acquiring Skywest and Tiger, we see earnings risks to the downside with weak demand and rising costs, and it should take time to turn Tiger around. See Essentials 15 November.
Source: Macquarie Research, December 2012
Macquarie Private Wealth Emerging Leaders Wrap
4 December 2012 12
Emerging Leaders articles published in November: Click the link to access web version article:
Kingsgate Consolidated September qtr proves tough
Drillsearch Energy Wet gas pilot production interrupted
Transpacific Industries Volumes drop off
REA Group Option value
Resource Generation Boxes ticked…time to execute
Transfield Services Guidance confirmed but risk remains
Macmahon Holdings Wins big at FMG
Perpetual Target in sight
GUD Holdings Sunbeam off the boil
BT Investment Management Full year with Hambro
Independence Group NL Another belter at Long
NIB Holdings Tower Heist
Northern Iron No bid
Cabcharge Australia Dodging bullets
Domino's Pizza Enterprises Confirms delivery
Beadell Resources Duckhead fits the bill
Agrium Some of the shine rubs off
Macmahon Holdings AGM confirms new strategy
Emeco Cuts
NIB Holdings Hips, hearts, knees and toes
Perseus Mining Time for a re-rate
Paladin Energy Kayelekera impaired… again
Royal Wolf Solid start
DuluxGroup Delivers in a down market
Salmat Capital returned post BPO sale
Breville Group Good start
Seven Group Holdings AGM optimism
Shopping Centres Australasia (SCA) Juicy yield but mind the SCAffolding
Drillsearch Energy Bauer continues to grow
Automotive Holdings Group Solid start
Arrium Tonnage on track
Mineral Resources Changes at the top
GR Engineering Services Cuts FY13
Drillsearch Energy Raising capital to restore the cushion
Navitas Total enrolments turn positive
Thorn Group Lacking growth options in FY13
Lycopodium FY13 OK, 14 looking softer
Programmed Maintenance Banking on a stronger 2H
Cardno Margin peaking
Oakton Federal Government tightens the belt
Ainsworth Game Technology Reels spinning in the right direction
Aspen Group Simplifying
Macquarie Private Wealth Emerging Leaders Wrap
4 December 2012 13
Emerging Leaders articles published in November (cont): Click the link to access web version article:
Lynas Corporation Ship it in
Cabcharge Australia Black and White
Mineral Resources 1.5mt shipped in Q1
Mermaid Marine Solid start
Ausdrill Softness bites
Horizon Oil Managing its exposure in PNG
The Reject Shop Rapidly taking share
Air New Zealand Lord of the wings
Fleetwood Corporation Tough half
ERM Power Oakey outlook tougher, retail still strong
Technology One Double digit growth despite the macro
Austal Raises
Brickworks Waiting for rate cuts to impact
Charter Hall Retail REIT „10…it‟s the magic number‟
Energy Resources of Australia End of an era
Clough More PNG LNG work
Transfield Services Targeting growth in oil & gas
Peet Green shoots
NRW Holdings Revenue solid, margins not
Molopo Energy Still on the learning curve
Resource Equipment Pre tax profit up over 30% to October
Macquarie Private Wealth Emerging Leaders Wrap
4 December 2012 14
Important disclosures:
Recommendation definitions
Macquarie - Australia/New Zealand Outperform – return >3% in excess of benchmark return Neutral – return within 3% of benchmark return Underperform – return >3% below benchmark return Benchmark return is determined by long term nominal GDP growth plus 12 month forward market dividend yield
Macquarie First South - South Africa Outperform – expected return >+10% Neutral – expected return from -10% to +10% Underperform – expected return <-10%
Macquarie - Canada Outperform – return >5% in excess of benchmark return Neutral – return within 5% of benchmark return Underperform – return >5% below benchmark return
Macquarie - USA Outperform (Buy) – return >5% in excess of Russell 3000 index return Neutral (Hold) – return within 5% of Russell 3000 index return Underperform (Sell)– return >5% below Russell 3000 index return
Volatility index definition*
This is calculated from the volatility of historical price movements. Very high–highest risk – Stock should be expected to move up or down 60–100% in a year – investors should be aware this stock is highly speculative. High – stock should be expected to move up or down at least 40–60% in a year – investors should be aware this stock could be speculative. Medium – stock should be expected to move up or down at least 30–40% in a year. Low–medium – stock should be expected to move up or down at least 25–30% in a year. Low – stock should be expected to move up or down at least 15–25% in a year. * Applicable to Australian/NZ/Canada stocks only
Recommendations – 12 months Note: Quant recommendations may differ from Fundamental Analyst recommendations
Financial definitions
All "Adjusted" data items have had the following adjustments made: Added back: goodwill amortisation, provision for catastrophe reserves, IFRS derivatives & hedging, IFRS impairments & IFRS interest expense Excluded: non recurring items, asset revals, property revals, appraisal value uplift, preference dividends & minority interests EPS = adjusted net profit / efpowa* ROA = adjusted ebit / average total assets ROA Banks/Insurance = adjusted net profit /average total assets ROE = adjusted net profit / average shareholders funds Gross cashflow = adjusted net profit + depreciation *equivalent fully paid ordinary weighted average number of shares All Reported numbers for Australian/NZ listed stocks are modelled under IFRS (International Financial Reporting Standards).
Recommendation proportions – For quarter ending 30 Sept 2012
AU/NZ Asia RSA USA CA EUR
Outperform 50.00% 56.85% 61.54% 41.38% 63.19% 44.15% (for US coverage by MCUSA, 7.35% of stocks covered are investment banking clients)
Neutral 36.62% 25.14% 27.69% 52.13% 30.77% 30.57% (for US coverage by MCUSA, 9.31% of stocks covered are investment banking clients)
Underperform 13.38% 18.02% 10.77% 6.49% 6.04% 25.28% (for US coverage by MCUSA, 0.00% of stocks covered are investment banking clients)
Company Specific Disclosures: Macquarie and its affiliates collectively and beneficially own or control 1% or more of any class of Ausdrill Limited's equity securities. Macquarie and its affiliates collectively and beneficially own or control 1% or more of any class of NRW Holdings Limited's equity securities. Important disclosure information regarding the subject companies covered in this report is available at www.macquarie.com/disclosures.
Analyst Certification: The views expressed in this research reflect the personal views of the analyst(s) about the subject securities or issuers and no part of the compensation of the analyst(s) was, is, or will be directly or indirectly related to the inclusion of specific recommendations or views in this research. The analyst principally responsible for the preparation of this research receives compensation based on overall revenues of Macquarie Group Ltd (ABN 94 122 169 279, AFSL No. 318062) (“MGL”) and its related entities (the “Macquarie Group”) and has taken reasonable care to achieve and maintain independence and objectivity in making any recommendations. General Disclosure: This research has been issued by Macquarie Securities (Australia) Limited (ABN 58 002 832 126, AFSL No. 238947) a Participant of the Australian Securities Exchange (ASX) and Chi-X Australia Pty Limited. This research is distributed in Australia by Macquarie Equities Limited (ABN 41 002 574 923, AFSL No. 237504) ("MEL"), a Participant of the ASX, and in New Zealand by Macquarie Equities New Zealand Limited (“MENZ”) an NZX Firm. Macquarie Private Wealth‟s services in New Zealand are provided by MENZ. Macquarie Bank Limited (ABN 46 008 583 542, AFSL No. 237502) (“MBL”) is a company incorporated in Australia and authorised under the Banking Act 1959 (Australia) to conduct banking business in Australia. None of MBL, MGL or MENZ is registered as a bank in New Zealand by the Reserve Bank of New Zealand under the Reserve Bank of New Zealand Act 1989. Any MGL subsidiary noted in this research, apart from MBL, is not an authorised deposit-taking institution for the purposes of the Banking Act 1959 (Australia) and that subsidiary‟s obligations do not represent deposits or other liabilities of MBL. MBL does not guarantee or otherwise provide assurance in respect of the obligations of that subsidiary, unless noted otherwise. This research is general advice and does not take account of your objectives, financial situation or needs. Before acting on this general advice, you should consider the appropriateness of the advice having regard to your situation. We recommend you obtain financial, legal and taxation advice before making any financial investment decision. This research has been prepared for the use of the clients of the Macquarie Group and must not be copied, either in whole or in part, or distributed to any other person. If you are not the intended recipient, you must not use or disclose this research in any way. If you received it in error, please tell us immediately by return e-mail and delete the document. We do not guarantee the integrity of any e-mails or attached files and are not responsible for any changes made to them by any other person. Nothing in this research shall be construed as a solicitation to buy or sell any security or product, or to engage in or refrain from engaging in any transaction. This research is based on information obtained from sources believed to be reliable, but the Macquarie Group does not make any representation or warranty that it is accurate, complete or up to date. We accept no obligation to correct or update the information or opinions in it. Opinions expressed are subject to change without notice. The Macquarie Group accepts no liability whatsoever for any direct, indirect, consequential or other loss arising from any use of this research and/or further communication in relation to this research. The Macquarie Group produces a variety of research products, recommendations contained in one type of research product may differ from recommendations contained in other types of research. The Macquarie Group has established and implemented a conflicts policy at group level, which may be revised and updated from time to time, pursuant to regulatory requirements; which sets out how we must seek to identify and manage all material conflicts of interest. The Macquarie Group, its officers and employees may have conflicting roles in the financial products referred to in this research and, as such, may effect transactions which are not consistent with the recommendations (if any) in this research. The Macquarie Group may receive fees, brokerage or commissions for acting in those capacities and the reader should assume that this is the case. The Macquarie Group„s employees or officers may provide oral or written opinions to its clients which are contrary to the opinions expressed in this research. Important disclosure information regarding the subject companies covered in this report is available at www.macquarie.com/disclosures.