Australia South Asia Research Centre together with The Research School of Pacific & Asian Studies & The National Institute of Economics and Business Australian National University present 10 Years of ASARC an International Conference Complementarity of Trade and FDI Liberalization in Industrial Growth: Lessons from Sri Lanka Prema-chandra Athukorala Australian National University and Sisira Jayasuriya University of Melbourne Common Room, University House The Australian National University Canberra Australia 27 & 28 April 2004
Transcript
Australia South Asia Research Centre together with
The Research School of Pacific & Asian Studies &
The National Institute of Economics and Business Australian National University
present
10 Years of ASARC
an International Conference
Complementarity of Trade and FDI Liberalization in Industrial Growth: Lessons from Sri Lanka
Prema-chandra Athukorala
Australian National University
and
Sisira Jayasuriya
University of Melbourne
Common Room, University House The Australian National University
Canberra Australia
27 & 28 April 2004
1
Complementarity of Trade and FDI Liberalization in Industrial Growth: Lessons from Sri Lanka
Abstract: This paper examines industrialisation experience in Sri Lanka following the market-oriented policy reforms initiated in 1977, with emphasis on the complementarity of trade and foreign direct investment (FDI) policies in shaping the reform outcome. It is found that the reforms helped to transform a primary product exporting economy into one in which manufactures dominate exports. Improved performance of domestic manufacturing through greater export orientation saw improvement in output and total factor productivity growth, and employment generation. The Sri Lankan experience highlights the complementary role of investment liberalisation for exploiting the potential gains from trade liberalisation. This industrialisation outcome is particularly impressive given that it occurred during a period of persistent civil strife and macroeconomic instability.
1. Introduction
With India breaking out from the “Hindu rate of growth’ following the implementation of major policy reforms, the overall developmental outcome in Sri Lanka – the pioneer of policy liberalization in South Asia – has thrown into sharper relief. After a promising start, both in the immediate aftermath of the 1977 liberalisation and then again after the ‘second wave of liberalisation’ in 1991/92, economic performance in Sri Lanka has fallen well below expectations, though the economy has now become the most open economy in South Asia.1 There is a palpable sense of mass dissatisfaction and disillusionment with political leadership across the whole political spectrum, and the country veers from one major political and constitutional crisis to another.2 As Sri Lanka’s dream of emulating the East Asian tigers – the stated goal of successive post-1977 governments – has receded, concerns and questions about the efficacy and impact of policy reforms have re-emerged. In particular, the merits of trade liberalisation as a means of achieving industrial growth and employment generation are being called into question. The political climate has become more receptive to calls for more ‘nationalistic’ and protectionist policies with the growth of popular disenchantment with the mainstream political parties, both of which have (despite occasional backsliding) implemented progressive trade liberalisation. Though major domestic and international constraints make it unlikely that there will be a sharp reversal of policies to embrace more closed-door policies appears unlikely, a backlash against liberalisation can not only make further progress in this direction more problematic but, more importantly, lead to misleading policy prescriptions that can perpetuate and aggravate current problems. 1 See for example, World Bank (2000:1) that praised Sri Lanka’s ‘good macroeconomic management and progress in trade liberalization, privatisation, and financial sector reform’. In 2001 the country experienced the first episode of negative growth since the 1930s and, given a chronic fiscal deficit problem, the sustainability of subsequent recovery remains quite fragile. 2 One indicator of the dissatisfaction with the political establishment is the increase in support for the Janata Vimukthi Peramuna (Peoples’ Liberation Front – JVP) that espouses a mix of economic nationalist rhetoric and Sinhala nationalism, which has become a major partner in the current coalition government. The JVP emerged in the late 1960s as a Maoist influenced Sinhala rural youth based movement. It led two unsuccessful armed youth uprisings in 1971 and 1989 but has been operating as a legal political party since the mid-1990s.
ASARC Working Paper 2004-10
2
In this context, understanding the causes of Sri Lanka’s developmental failure, at least in terms of its inability to match expectations, through a systematic, in-depth assessment of past policies and strategies is certainly both necessary and welcome. Because it has experimented with a wide variety of policy regimes – from open, ‘non-interventionist’, free market policies (up to 1959/60) through dirigiste import substitution industrialisation (ISI) (1960-1977) to export oriented liberalisation (post-1977) - Sri Lanka is an almost ideal case study for analysis of the determinants of economic growth. Its initial conditions were probably unsurpassed in any other developing country in Asia in terms of various growth-promoting factors which are now widely accepted in the growth literature. Many analysts (such as Wriggins 1960) described newly-independent Sri Lanka as a country with a vibrant, multi-party and multi-ethnic political system, a free press, a strong trade union movement and political institutions, honed by more than a century of British tutelage in which it had learnt to accommodate social divisions and communal differences.3 There was an efficient, ‘clean’ public service and a well-functioning legal system. Property rights were well established and enforceable. While lacking significant natural resources (minerals, oil etc), it had thriving agricultural export industries, good commercial networks with international linkages, and enjoyed a favourable and strategic geographical location on the transport route between Europe and Asia/Oceania, with long established modern port facilities in Colombo – the capital and commercial hub of the country. A well-developed network of roads, railways and communications facilities complemented the strategic assets linking the country to foreign markets.
In this paper, we examine the Sri Lankan experience with economic liberalisation reforms, focusing on the process of industrialisation, rather than on economic growth in general. In particular, we focus on the policy influences on manufacturing industry performance, with particular attention to the impact of trade and investment liberalisation, highlighting the synergistic interaction between the two and drawing out the implications for broader economic growth. The significance of this interaction effect suggests that downplaying the importance of trade and investment opening up may be very costly.4 The nature and importance of such interactions are of course central concerns in the current growth literature. Given the limited scope of this paper, we do not attempt here to address the broader task of analysing the overall growth performance. However, this is part of our broader research agenda to assess the overall growth experience of Sri Lanka taking into account the interaction of economic policies (those associated with economic liberalisation per se as well as many others implemented as part of the overall government policy packages) with institutions and both domestic and external exogenous developments.
The structure of the paper is as follows. Section 2 briefly chronicles the industrial policy
in Sri Lanka since independence, followed by a discussion on the key elements of trade and investment policy reforms initiated in 1977. Section 3 examines the industrialization experience since 1977 from a historical perspective, placing emphasis on aspects such as patterns of industrial growth, export orientation, factor productivity growth and employment generation. Section 4 analyses of the response of foreign direct investors to the significant trade-cum-investment liberalisation reforms and the pivotal role they played in the process of export-oriented industrialisation. The final section summarises the main findings.
3 Sri Lanka has a majority Sinhalese population (>70 per cent), with two major minority groups, Tamils (about 20 per cent ) and Moors (about 7 per cent). Sinhalese are mostly Buddhists, Tamils, Hindus and Moors, Muslims. Significant minorities within both Sinhalese and Tamil communities are Christians. 4 Rodrick (2003), for example asserts that ‘trade – or, more specifically, government policies toward trade – does not play nearly as important a role as the institutional setting.
ASARC Working Paper 2004-10
3
2 The Policy Context
During the first decade after independence in 1948, Sri Lanka (commonly called Ceylon until 1972) continued to remain an open trading nation with only relatively minor trade or exchange rate restrictions and liberal domestic policies.5 From the late 1950s, a combination of change in political leadership and balance of payments difficulties led to the adoption of a state-led import-substitution development strategy. Trade restrictions, which were initially introduced in response to growing balance of payments difficulties (rather than as part of an ideological commitment to import substitution industrialisation), became transformed into key instruments for directing private sector production activities in line with (perceived) national priorities. Following a hesitant and mild liberalization attempt during 1968-70, the period from 1970 to 1977 saw further government intervention in the economy under the guise of creating a ‘socialist society’. Significant and ever increasing segments of trade, industry, agriculture and banking were owned and managed by state-owned enterprises (SOEs). In fact, in her attempts to expand and consolidate the role of the state in the economy (and consequently to marginalise the private sector), Sri Lanka went far beyond neighbouring India. In an environment in which import licensing was pervasive but licenses were scarce, and imported inputs were a critical determinant of the level of output of industrial firms, government officials held power of profit and loss over domestic import-substituting producers. By the mid-1970s the Sri Lankan economy was one of the most inward-oriented and regulated economies outside the communist block, characterized by stringent trade and exchange controls and pervasive state interventions in all areas of economic activity.
The foreign investment policy continued to remain extremely liberal until the mid-1960s, permitting many MNEs set up affiliates within Sri Lanka to undertake the domestic production of items previously supplied from their overseas production centres. However, as the ISI strategy was reaching a crisis point by the mid-1960s, the view (which was widely-held among development economists at the time) that ‘import-substituting MNEs worsen countries' balance of payments’ (Little 1982: 185) began to dominate Sri Lanka's policy towards FDI.. This view resulted in a dualistic foreign investment policy characterised by stringent restrictions on import-substitution projects and favoured treatments for export-oriented ventures. A White Paper on the treatment of foreign investment issued in 1966 emphasised the important role that MNEs can play in the process of manufactured export expansion by providing easy access to foreign markets and bringing in experience and expertise in many complex facets of product development and international marketing. On these grounds, the White Paper introduced various tax concessions for export-oriented foreign ventures and relaxed foreign exchange restrictions on the remittance of dividends, interest and profit originating in such ventures. The government's commitment to the promotion of export-oriented foreign direct investment (EOFDI) was reaffirmed and further production and tax incentives were introduce by the Five-Year Plan, 1972-77 (Government of Sri Lanka 1972). However, this policy shift in favour of EOFDI occurred in an overall policy and political context which was highly unfavourable to private sector activities in general and to export production in particular. Reflecting the cumulative impact of stringent trade controls, high export taxes and the overvalued exchange rate, the overall incentive structure of the economy was characterised by a significant “anti-export bias” throughout this period (Athukorala and Rajapatirana, 2000). There was an import duty rebate scheme (designed to provide export-oriented manufacturers with access to global inputs at border prices) in operation from 1964. But because
5 Sri Lanka’s post-independence policy history has been well documented. See, for instance, Snodgrass (1996 and 1998), Lal and Rajapatirana (1989), Athukorala and Jayasuriya (1994), Athukorala and Rajapatirana (2000).
ASARC Working Paper 2004-10
4
of stringent performance requirements and bureaucratic red tape in operation, the scheme played virtually no role in removing the anti-export bias of the restrictive trade regime. Moreover, during the period from 1970 to 1977, widespread nationalisation measures and threats, coupled with various economic controls, effectively marginalised the private sector in the economy.
The policy makers in Sri Lanka, like their counterparts in other developing countries, expected import-substitution industrialisation to set the stage for self-sustained growth by reduce the heavy dependence of the economy on imports. The reality was quite different, however. While consumer goods imports were reduced substantially, this was achieved at the expense of increased reliance on imported capital goods and raw materials, resulting, contrary to expectation, in an even more rigid dependence on imports. Given these structural features, the growth dynamism of the newly established industrial sector tended to show a close functional relationship with the fortunes of the traditional export industries. Thus, unanticipated import curtailments brought about by foreign exchange scarcity turned out to be the main constraint on industrial expansion since the late 1960s. Moreover, the ‘inefficiency slipover effects” of state-owned enterprises (SOEs) involved in intermediate good production on private sector end-user industries were quite substantial, particularly since import compression policies were implemented with a distinct bias towards SOEs in the allocation of foreign exchange (Athukorala and Jayasuriya 1993, 100). In most smaller developing countries, rapid expansion of domestic industry continued until the “easy” import-substitution opportunities (i.e. meeting domestic demand in textiles, footwear, some food processing and other light labour intensive activities) were used up. It was only then that the cost of additional investment in new import substitution activities begun to rise and growth slowed down (Krueger 1992, 43-4). However, in Sri Lanka, a limit was set on the growth of industry by the balance of payments constraint well before the completion of the easy IS phase.
As a reaction to the dismal economic outcome of the inward-looking policy, Sri Lanka embarked on an extensive economic liberalization process in 1977, becoming the first country in the South Asian region to do so. The first round of reforms during 1977-79 included a significant trade reform: replacing quantitative restrictions on imports with tariffs and revising the tariff structure to achieve greater uniformity; reducing restrictions on foreign investment, with new incentives for export-oriented foreign investment under an attractive Free Trade Zone (FTZ) scheme; financial reform: adjusting interest rates to levels above the rate of inflation, opening the banking sector to foreign banks and freeing credit markets to determine interest rates; limits on public sector participation in the economy and a program for pivatisation of public enterprises, exchange rate realignment and incentives for nontraditional exports.
The reform process lost momentum in the early 1980s, first because of an unfortunate shift in policy priorities towards politically appealing investment projects, and subsequently due to the onset of the ethnic conflict (Athukorala and Jayasuriya, 1993, Ch. 5). There was, however, no retreat to the old control regime. In a decisive move to infuse momentum into the unfinished reform process, a significant ‘second wave’ liberalization package was implemented in the early 1990s. This included an ambitious privatization program, further tariff cuts and simplification of the tariff structure, removing exchange controls on current account transactions and several important changes to the foreign investment policy framework in line with the increased outward orientation of the economy.
After 17 years in government, the reformist United National Party (UNP) lost power at
the 1994 general elections to the Peoples’ Alliance (PA). Since then the political climate has become more volatile and receptive to calls for more ‘nationalistic’ and protectionist policies with the growth of popular disenchantment with the mainstream political parties. However,
ASARC Working Paper 2004-10
5
there has been the convergence in broad economic policies among the major political parties and groupings; maintaining greater openness to trade and FDI is now a bipartisan policy in Sri Lanka. This policy convergence, coupled with a palpable shift in development thinking in favour of greater outward orientation world over, a sharp reversal of policies to embrace more closed-door policies appears unlikely in the foreseeable future.
With this background we now discuss the key elements of the trade and foreign investment policy regimes in Sri Lanka as they have evolved since 1977.
(a) Trade Policy Trade policy reform was the key element of the economic liberalisation policy package introduced in 1977. In November 1977 quantitative import restrictions on imports, which were near universal, were supplanted by a revised system of tariff, retaining only 280 items under license. While many of the tariff changes involved a gazetted increase in the rate, tariffication typically involved a sharp reduction in the degree of protection provided previously by the stringent QR regime. Fine-tuning of tariff rates during the next ten years involved some selective tariff increases in response to demand by the domestic protectionist lobby. There were also some moderate revenue oriented across-the-board increases in import duty in some years. These setbacks notwithstanding, overall there was significant rationalisation of the tariff structure, both in terms of reducing variability of individual rates and the average level. As part of the ‘second-wave’ liberalisation reforms initiated in the late 1980s, import tariffs were further reduced with the aim of moving towards a three-band tariff structure involving rates of 10, 20 and 35 percent. In 1997 tariffs on textiles were abolished and tariffs on clothing imports were substantially reduced, with a view to facilitating further expansion of the booming garment industry. Trade liberalisation suffered some setback in because of additional fiscal pressures following the escalation of the civil war in the latter part of the 1990s and economic downturn during 2001 which infused a new lease of life to the domestic protectionist lobby. A 40 per cent across-the-board tariff surcharge (subsequently reduced to 20 per cent in 2001) was introduced in 2000. There were also many ad hoc duty exceptions and case-by-case adjustment of duties on many industrial imports which directly compete with domestic production. The tariff structure has also become more complex with the introduction of preferential tariffs under the South Asian Preferential Trading Agreement (SAPTA) and the India Sri Lanka Free Trade Agreement (ISLFTA). However, as we will see below, these changes have not resulted in a significant reversal in the trends of economic opening maintained over the past two decades.
Side by side with import liberalisation, export expansion was accorded high priority in the 1977 reform package. The new export development strategy had two key elements; an export processing zone (EPZ) which provided full export oriented firms with virtual free-trade status (to be discussed later in this section), and a wide raging export development scheme implemented by the newly established Sri Lanka Export Development Board (SLEDB) for non-EPZ firms. The SLEDB program included a duty rebate scheme, direct cash subsidies, manufacturing-in-bond, provision of equity and working capital to firms with export potential, and various measures aimed at product and market development, were introduced under the newly established. In 1980, the operation of the duty rebate scheme (originally introduced in 1964 but largely inactive because of various administrative rigidities) was transferred from the Ministry of Industries to SLEDB. The SLEDB completely reformulated the scheme an instituted a more flexible implementation procedure to cover all non-traditional exports using imported inputs. The coverage of the duty rebate scheme was expanded in 1982 to include sales to EPZs. Manufacturing-in-bonds for exporters importing material for re-export as part of a finished good, a cash grant scheme based on annual export increments, and concessionary credit
ASARC Working Paper 2004-10
6
for exporters were among the other SLEDB incentives. Over time, the use of the duty rebate scheme (and other arrangement for exempting exporters from duties on imported inputs) declined because of substantial reduction of tariffs on intermediate goods (including freeing of textiles imports from duty), and more importantly, the extension of EPZ privileges to export-oriented firms located outside EPZ.6 The latter policy initiative also set the stage for scaling down, and the subsequent elimination, of various financial incentives offered by the SLEDB to non-EPZ firms, limiting the role of the SLEDB only to providing some export facilitating services.
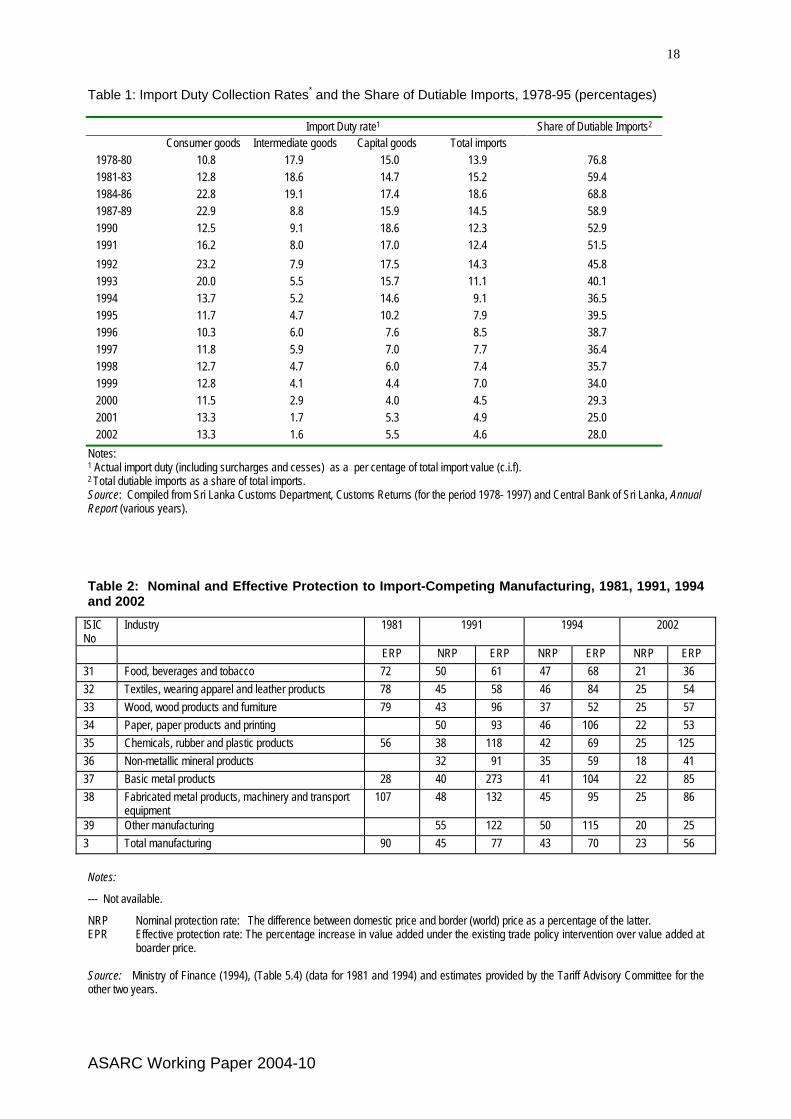
The effective duty rate on total imports (duty collection as a percentage of CIF import value) increased from about 14 per cent during 1978-80 to 18.6 per cent by the mid-1980s and then declined continuously over the ensuing years reaching 4.6 per cent by 2002 (Table 1). The share of dutiable imports in total imports ranged between 52-77 per cent during 1978-84, and declined continuously during the ensuing years. By the late 1990s, only 30 per cent of imports (in value terms) were subject to duties.7
Interestingly, the sharp reduction in the average import duty over the past one-and-a-half decades has come predominantly from reductions (or elimination) of tariffs on intermediate goods. During the post reforms period until about the mid 1980s, tariffs on intermediate goods were generally higher than those on final goods (consumer goods and investment goods). From then on, tariffs on intermediate goods have declined at a much faster rate compared to those on final goods. In the early 1990, consumer goods tariffs were on average about two times higher than tariffs on the intermediate goods. Given this pattern of tariff escalation, the effective protection for domestic manufacturing turned out to be much higher than the nominal tariff on final goods.
The available official estimates of effective rate of protection (ERP) for domestic market
oriented manufacturing are given in Table 2. According to these estimates, the effective rate of protection (ERP) for import-competing manufacturing has declined persistently over the past decade but still remained high (56 per cent) by 2002. There are no separate estimates of ERP for export-oriented production, which can be used in combination with ERP for domestic production, to assess the degree of export bias involved in the structure of protection.
However, as already noted, throughout the post-reform period, the trade regime in Sri
Lanka continued to provide export-producers with free access to intermediate inputs under the EPZ scheme and an all-encompassing duty rebate scheme for non-EPZ firms. In addition, EPZ firms benefited from a wide range of financial incentives (see Section 2(b)). Therefore, we can reasonably infer that the continuing high effective protection for domestic market oriented production may not have been a major deterrent to export expansion. The conventional view that an import tax is equivalent to a tax on export production (Lerner’s symmetry theorem) is based on the assumption that both export-producing and import-competing industries directly compete for the same resources which are fully employed. However, the process of manufacturing for export in Sri Lanka, as in the East Asian NIEs at the initial stage of export-led growth, primarily involved combining imported inputs with ‘surplus’ labour (mostly women workers who were not part of the traditional manufacturing labour force). Thus, export
6 Total duty rebate payment in 2003 was 240 million rupees (2 per cent of total value of manufactured exports), down from over a 2 billion (18 per cent) in the early 1990s. 7 The significant decline in the share of dutiable imports reflects the expansion of manufactured exports. Firms operating under EPZ provisions are eligible to import all inputs duty-free, and other firms producing for exports are provided duty-free access to imported inputs through the duty rebate scheme or the bonded warehouse facility.
ASARC Working Paper 2004-10
7
expansion could occur even though the policy regime – with high protection for import competing production – seemed to impart a pronounced anti-export bias by conventional criteria. (b) FDI Policy
Promotion of foreign investment, particularly in export-oriented manufacturing, has been a pivotal element of Sri Lanka’s market oriented policy reforms since 1977. The most important aspect of the new FDI policy was the setting up of the Greater Colombo Economic Commission (GCEC) in 1978 with wide-ranging power to establish and operate Export Processing Zones.8 The investment promotion policy package offered by the GCEC to EPZ investors included allowing complete foreign ownership of investment projects; a tax holiday for up to 10 years with complete tax exemption for remuneration of foreign personnel employed, royalties, and dividends of shareholders during that period; duty exemption for the importation of inputs and assistance with customs clearances; industrial services at subsidised rates and unlimited access to foreign-currency credit at interest rates prevailing in world financial markets. Access to foreign financing though FCBUs and other incentives. The international news media and the investment community rated the Sri Lankan EPZ incentives highly favourably. 9
As an important part of the DFI policy, steps were also taken to enter into Investment Protection Agreements and Double Taxation Relief Agreements with the major investing countries. A guarantee against nationalisation of foreign assets without compensation was provided under the Article 157 of the new Constitution of Sri Lanka adopted in 1978.
Until 1990, there was no major change in the policy towards non-FTZ foreign ventures. Majority local ownership continued to be the general rule for approving such projects. Even though more liberal ownership criteria (even up to 100 per cent foreign ownership) were applied in approving export-oriented firms, these firms were not eligible for the lucrative incentives offered to EPZ firms. As part of the second-wave liberalization, a new Investment Policy Statement announced in 1990 with several important changes to the foreign investment policy framework in line with the increased outward orientation of the economy. Activities of FIAC and GCEC were brought together under a new Board of Investment (BOI) in order to facilitate and speed up investment approval within a uniforeign fimsd policy framework applicable to both import-substituting and export-oriented investors. Restrictions on the ownership structures of joint-venture projects outside EPZs were abolished. EPZs privileges were extended to local investors who establish new export-oriented projects in all parts of the country were given free-trade status (in addition to the area demarcated EPZs) This provision, which was initially applicable only to investors who were prepared to implement their projects prior to 30 September 1991, was extended in February 1993 to local investors staring new export ventures as well as existing companies which set up production facilities outside the Western Province. Since then, this has become a permanent feature of the BOI approval procedure. 8 The first EPZ, at Katunakaye near the Colombo International Airport (henceforth KEPZ) was opened in 1978. The remarkable success of the KEPZ paved the way for setting up of a second EPZ in Biyagama (BEPZ) in 1982 and a third in Koggala (KGEPZ) in June 1991. 9 Asian Wall Street Journal (23 September 1980) reported the Managing Director of Lehman Brothers as saying, ‘I do not see what more an investor could want than Sri Lanka has to offer’. In a comparison of relative labour productivity (which combined both efficiency and wage cost) of Asian workers appeared in Business Asia( 2 June, 1978) , Sri Lanka (42) was placed ahead of the Philippines (41), Taiwan (34), Korea (21) and India (12), and only next to Singapore (47) (Business Asia, June 2, 1978). The Far Eastern Economic Review (23 October 1978) dubbed Sri Lanka ‘the new investment centre in Asia’.
ASARC Working Paper 2004-10
8
(c ) Accompanying Policies and the Investment Climate
It is evident from the foregoing discussion that the liberalisation reforms initiated in 1977 have resulted in a significant opening of the Sri Lankan economy. The reform process has been successful in virtually eliminating quantitative restrictions, reinforcing tariff as the main instruments for regulating import trade. Tariff levels have also come down over the years. Export producers were provided with duty free access to implored inputs from the very beginning of the reform process. Liberalisation of the foreign investment regime has gone in hand in hand with trade liberalisation. Before proceeding to assessing the impact of these significant reforms, it important to consider the other elements of the reform process which have a bearing on manufacturing performance. While there is no consensus on the timing and sequencing of these accompanying reforms, it is generally believed that the ability of a country to capture the full benefit of trade and investment liberalisation depends crucially on the concurrent liberalisation of domestic commodity, financial and labour markets, and maintaining macroeconomic stability (Krueger 1984, Michaely et al 1991).
The liberalisation reforms in Sri Lanka involved dismantling of various price controls and state trading monopolies. The proposed privatisation/rationalisation of state-owned manufacturing enterprises lost much of its rigour in the process of implementation for political economy reasons, but successfully implanted as part of the second-wave liberalisation. With the privatisation of SOEs a major impediment to trade liberalisation and a source of pressure policy reversal has been weakened. However, implementations of reforms in other areas fell well short of what was proposed in the original reform package. For instance, in the area of domestic financial sector reforms, the reforms never went beyond some limited opening of the banking sector to partial the entry of foreign banks and permitting domestic banks to operate foreign currency banking units. Proposals to reform labour legislation and the institutional mechanism for wage setting were abandoned in the face of strong resistance and legal challenges by the trade unions (Weerakoon 1996).
The 1997 reform package was formulated with due emphasis on the complementarity
between macroeconomic management and the trade liberalization outcome. Thus, trade liberalization was accompanied by a significant exchange rate reform. The dual exchange rate system, which had been in operation since 1968, was abolished and the new uniforeign fimsd rate was placed under a managed float. The exchange rate was planned to be adjusted daily to reflect changes in foreign exchange market conditions. The other elements of the macroeconomic policy mix included a significant interest rate reform and a number of measures to ensure fiscal prudence. The latter measures included attempts to reduce the budget deficit (which had been the major source of macroeconomic imbalance) through significant cuts in various consumer and producer subsidies, restraints on budgetary transfers to state owned enterprises (SOEs) and limits on inflationary financing of the budget deficit.
The policy commitment to sound macroeconomic management was short lived, however. Government policies soon resulted in the generation of inflationary pressures. The chief source of macroeconomic instability and pressure on the real exchange rate in the early post-reform period was a massive public sector investment program that included the Mahaweli scheme, a billion-dollar multipurpose irrigation project, a large public housing program and an urban development program (Athukorala and Jayasuriya 1993). The Central Bank intensiforeign fimsd its intervention in the foreign exchange market and eventually abandoned (in November 1982) the practice of determining the exchange rate daily. From the mid-1980s, the escalation of the civil war begun to hamper the government’s attempt to maintain macroeconomic stability. As the widening budget deficit became the major source of
ASARC Working Paper 2004-10
9
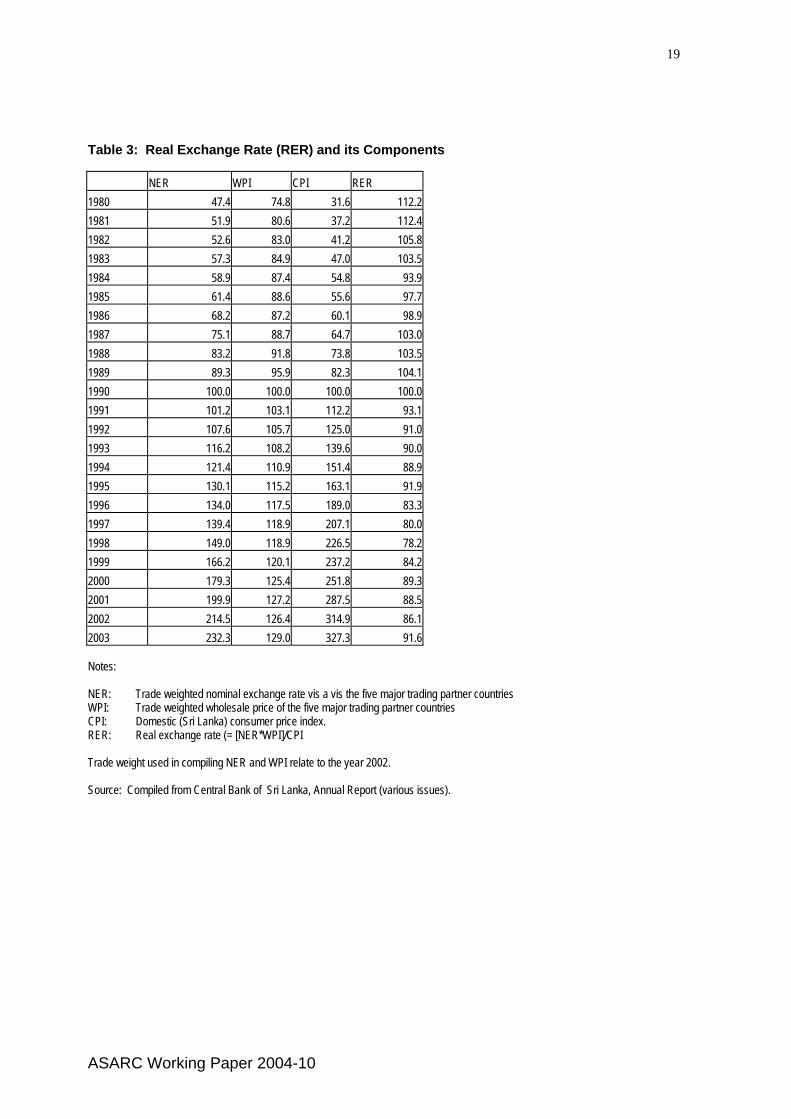
macroeconomic instability, the Central Bank naturally succumbed to using the nominal exchange rate as an ‘anchor’ for inflation control. Consequently, the significant real exchange rate depreciation achieved in the immediate aftermaths of the economic opening gradually dissipated in the ensuing years, with the exception of a short-lived improvement achieved through greater nominal exchange rate flexibility during 1990-94 (Table 3).
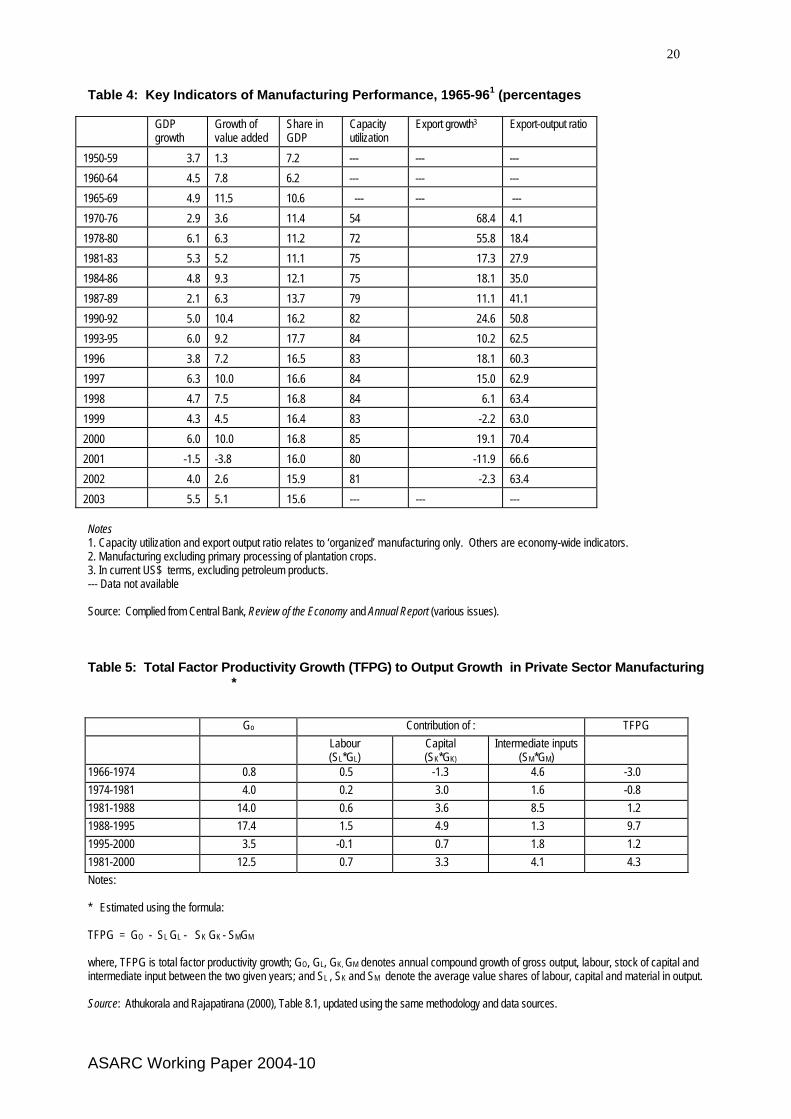
In sum, the preconditions required for benefiting from trade and investment liberalisation were missing during much of the post-reform period, except for two sub-periods, 1977-82 and 1990-94, with political stability needed for capturing the full benefits of economic liberalization was largely missing for much of the remainder of the post reform period. Thus, Sri Lanka provides us with an interesting case study to examine whether an outward-oriented policy regime could yield a superior industrialization outcome compared to a controlled regime, even in the absence of required complementary reforms and under severe strains of the war. 3. Manufacturing Performance (a) Growth trends At the time of independence in 1948, Sri Lanka was a prime example of an export economy dependent on a limited range of agricultural export commodities (Snodgrass 1996). The production patterns exhibited only limited changes during the import-substation era. The manufacturing share in GDP increased from 5.6 per cent in the early 1960s to 9 per cent by the end of the decade and was around 11 per cent by the time of 1977 policy reforms (Table 4).
The manufacturing sector entered a rapid growth phase following the 1977 reforms. However, the share of manufacturing in total GDP remained more or less unchanged around 11 per cent until the mid-1980s. This was mostly a reflection of the superior growth performance of non-tradable sectors– construction, transport, utilities, trade and other services sectors– propelled by the public sector investment boom. Since the late 1980s the pattern changed; in most years, manufacturing growth has surpassed that of other sectors. As a result, the manufacturing share in GDP increased from 10 per cent in the early 1980s to over 16 per cent by the mid-1990s. During 1978-2000 manufacturing output grew at an average annual rate of 8.5 per cent, compared to 4.8 per cent during the decade preceding the reforms. As a result, the manufacturing share in GDP increased from 11 per cent in the early 1980s to 18 per cent by the late 1990. Since the mid-1980s, there has been an increasingly close relationship between manufacturing growth and GDP growth.10
However, manufacturing growth has not been uniform over past two decades. There
was considerable volatility and periodic fluctuation in growth, reflecting policy shifts and changes in the overall investment climate (mostly associated with the course of the protracted civil war). The most impressive growth performance was in the first half of the 1990s when there was firm political commitment to reforms, macroeconomic conditions were relatively favorable and the debilitating effect of the civil war had been temporarily brought under control through an informal truce. Unfortunately, the resumption of the civil war and its impact on both macroeconomic stability and country-risk perceptions, the lack of clear policy directions, coupled with adverse developments in global markets in the aftermaths of the 1997-98 East Asian crisis constrained manufacturing performance during 1995-2001. The average annual manufacturing growth declined from 9.5 per cent during 1990-95 to 6.0 per cent during 1996-2001. 10 The correlation coefficient between two annual growth rates for the period 1986-2000 is 0.72, compared to 0.35 for 1960-96.
ASARC Working Paper 2004-10
10
The major immediate cause of output expansion in the liberalized economy was the free availability of imported inputs and capital goods. In particular, the availability of intermediate inputs contributed to output growth through greater capacity utilization. However, output has continued to expand at an increasing rate even after the capacity utilization reached an average stable rate of about 70 per cent by the late 1980s. Quite apart from greater input usage, growth of factor productivity seems to have played a significant role with some time lag.
The results of a simple growth accounting procedure undertaken to decompose
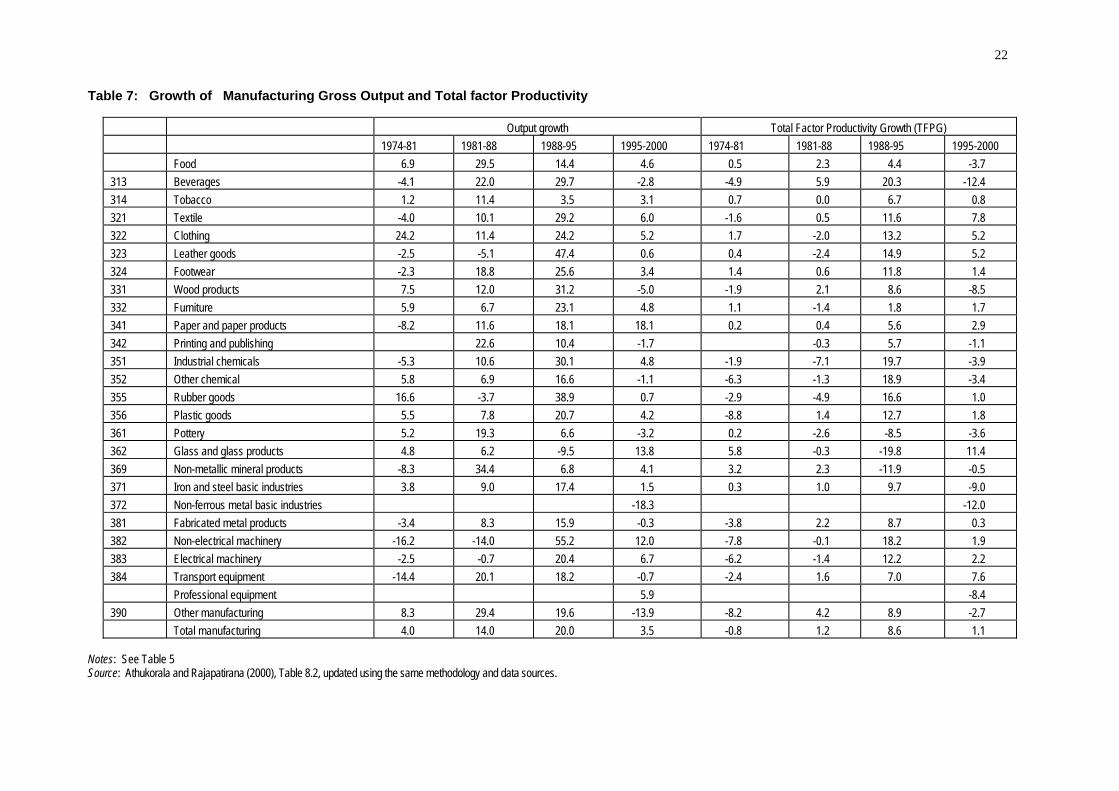
manufacturing output growth in to the relative contributions of factor accumulation and total factor productivity (TFP) growth are reported in Table 5.11 The estimates clearly point to the adverse productivity implications of the increased restrictiveness in the trade regime between 1966 and 1974. In the early post-liberalisation period (1977-81) output growth emanated predominantly from factor accumulation facilitated by the free availability of imported inputs and capital goods in the liberalised economy. In particular, the availability of intermediate inputs contributed to output growth through greater capacity utilisation. There was, however, a significant improvement in TFP growth between 1981 and 1995, recording an annual average rate of 7.5 per cent. Out of total output growth between these two years, almost 30 per cent came from TFP growth. However, TFP growth slowed to an annual average rate of 1.2 per cent during 1995-2000, reflecting the adverse domestic and external factors already noted.
At the time of market oriented policy reforms in 1977, SOEs accounted for over 60 per cent of manufacturing output and 50 per cent of manufacturing employment. This public sector dominance continued virtually unchanged until about the mid-1980s. From about the mid-1980s the position of SOEs continuously eroded in face of rapid output growth in private sector ventures and privatization of an increasing number of SOEs in the 1990s. SOEs accounted for a less than 3 per cent of total manufacturing output by the turn of the century.12
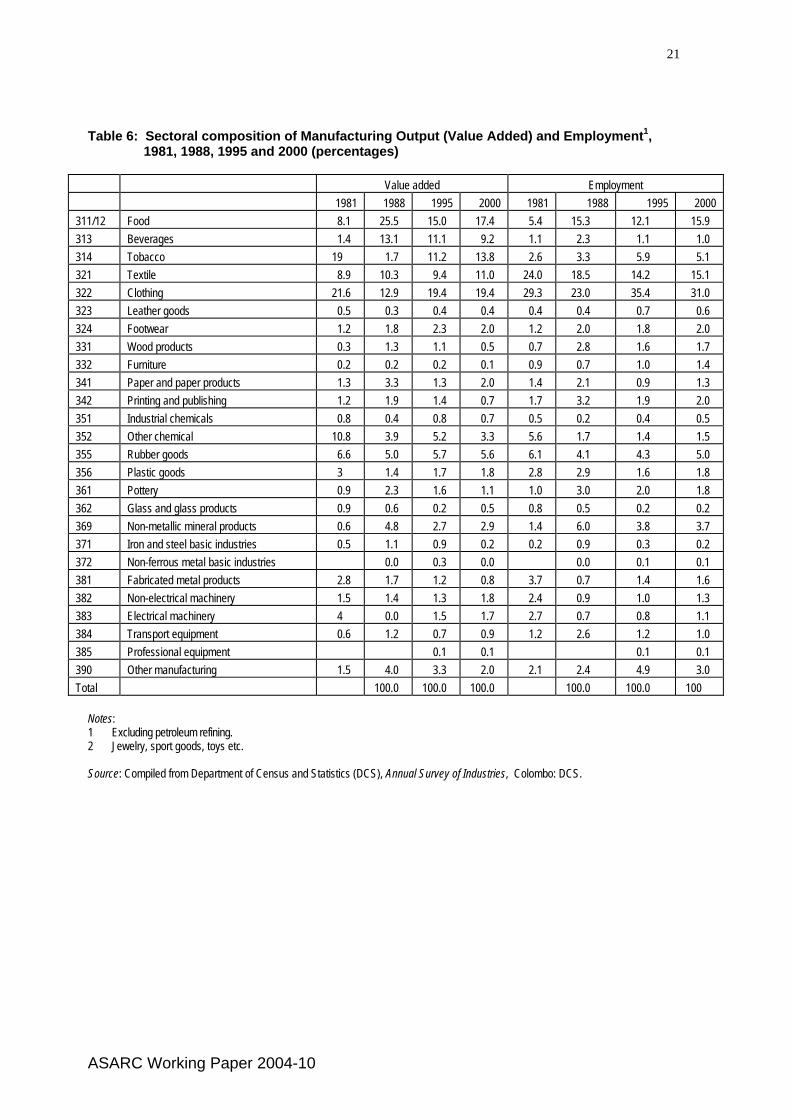
The response of private sector manufacturing to the new policy environment has
exhibited rather contrasting patterns across sectors (Table 6 and 7). As one would anticipate, labour-intensive, export-oriented sectors, wearing apparel, footwear, rubber goods and leather products indicated impressive growth performance and TFP growth. The only import-substitution production sector, which has generally recorded increase in output and employment shares, was food and beverages. The share of clothing in total manufacturing value added and employment increased form less that 10 per cent in the mid-1980s to over 35 per cent by the mid 1990s. In recent years, the production structure has become more diversiforeign fimsd as domestic market oriented industries gradually developed market niches in the new liberalized economy and some new export-oriented industries (in particular natural rubber-based products, ceramics, footwear and travel goods) gradually expanded.
The overall export orientation of manufacturing tended to increase sharply from the mid-1980s (Table 3). The ‘export coefficient’ (the ratio of exports to gross manufacturing output) increased from a mere 3 per cent in the late 1970s to over 50 per cent by the late 1980s and over 70 per cent by the late 1990s. 11 The estimates are based on the Tornquist method. The only assumption required to justify its use is that firms pursue profit maximization and/or cost minimization, and hence market return is a good approximation to the marginal product of a factor. No assumption about the properties of the underlying production function is required: production parameters are taken to be subsumed in expenditure (input) and revenue (output) (Harberger 1996). 12 The data used in this paper, unless otherwise indicated, come from the Central bank of Sri Lanka, Annual Report.
ASARC Working Paper 2004-10
11
(b) Trends and patterns of Manufactured Exports
By the time of 1977 policy reform, the share of manufactures in total merchandise exports was only 5 per cent (Table 8). Since then, manufactured goods have emerged as the most dynamic element in the export structure. Exports of manufactured goods grew (in current US$ terms) at an annual compound rate of over 30 per cent during 1978-2002, lifting their share in total exports to over 70 per cent. The value of total manufacturing exports increased from a mere $5.0 million in the mid-1960s to over $4 billion by the late 1990s. During 1985-2000, Sri Lanka was among the top five low-income countries in terms of both the average annual growth in earnings from manufactured exports and the increase in manufacturing share in total merchandise exports (UNCTAD 2002).
Manufactured exports of Sri Lanka are heavily concentrated in a single standard labour
intensive consumer good, clothing. However, from the late 1980s, there has been a noticeable increase in exports of other labour intensive products such as electronics (included under the commodity category of ‘machinery’), leather goods, footwear, toys, plastic products, jewellery, and resource-based products related to the traditional agricultural exports (tea, rubber and coconut fibre). Reflecting this ongoing pattern of commodity diversification, the share of clothing in total manufacturing exports declined from 72 per cent in the early 1980s to 60 per cent in the mid- 1990s (Table 8). The share of natural rubber (the second largest of the traditional ‘trio’) in total exports has declined sharply (reaching less than one per cent in 2002) as a result of rapid growth of rubber based manufactured products.
Given the dominance of textile and clothing in domestic manufacturing and the important role played by ‘quota-hopping’ investors in the expansion of the industry, the likely implications of the abolition of the MFA has become a key concern in Sri Lanka. However, it appears that while some exporting firms are still involved in the production of low-end products for quota protected markets, overall the Sri Lanka textile and clothing industry appears now to be relatively well positioned to cope with the new challenges.
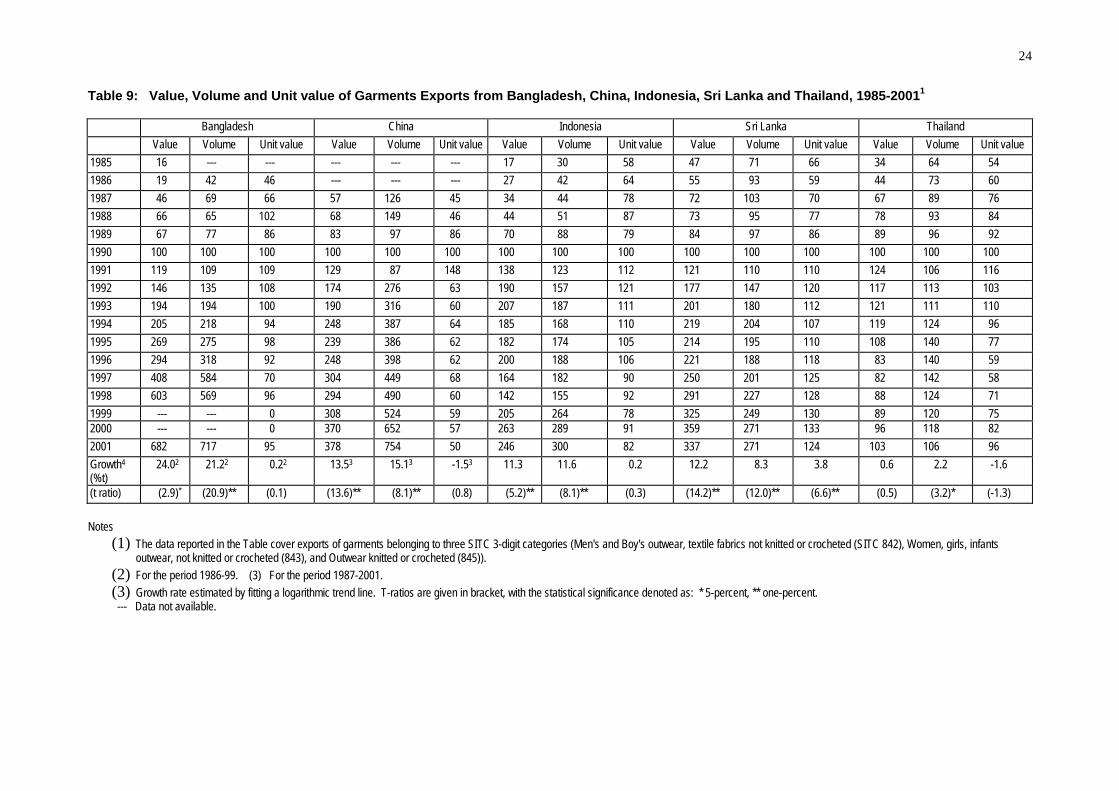
Concurrent liberalisation of trade and FDI regime seems to have provided Sri Lanka with an environment which is conducive for improvement in product quality, marketing stills, and rapid penetration in brad-names dominated high end of the global markets. As we will see below, there has been a significant shift in FDI in garment industry away from quota protected product lines and toward non-quota product lines. Through marketing links forged through foreign investors and international buyers, pure local firms also have made significant progress in movement ‘up market’. Consequently, Sri Lanka’s expansion in export revenue reflected both volume expansion and increase in unit value, with the latter growing by 6.6 per cent per annum (Table 9). In contrast, in other countries (such as China, Bangladesh Indonesia and Thailand), export revenue increase has come solely from volume expansion in face of stagnation or decline in export unit value. Unlike other South Asian countries where substantial segments of the domestic textile and clothing markets are highly protected, Sri Lanka has had a free trade regime for this sector for over two decades. This seems to have helped the local export industry to improve its international competitiveness. Exports from Sri Lanka, where internal prices are in line with prices in export markets, are likely to be less vulnerable to anti-dumping and countervailing duty actions in importing countries than exports from countries with less open domestic markets (World Bank 2003, p 34). (C ) Employment In determining the effects of industrial growth on employment in Sri Lanka, one is handicapped by relatively poor data. The coverage of the available employment and wage data is limited to
ASARC Working Paper 2004-10
12
production units in the organized (formal) manufacturing sector. Even for that sector, consistent data series of adequate length (encompassing both pre- and post-reform years) are not available. Nevertheless, several interesting facts emerge from the scanty data (Table 10).
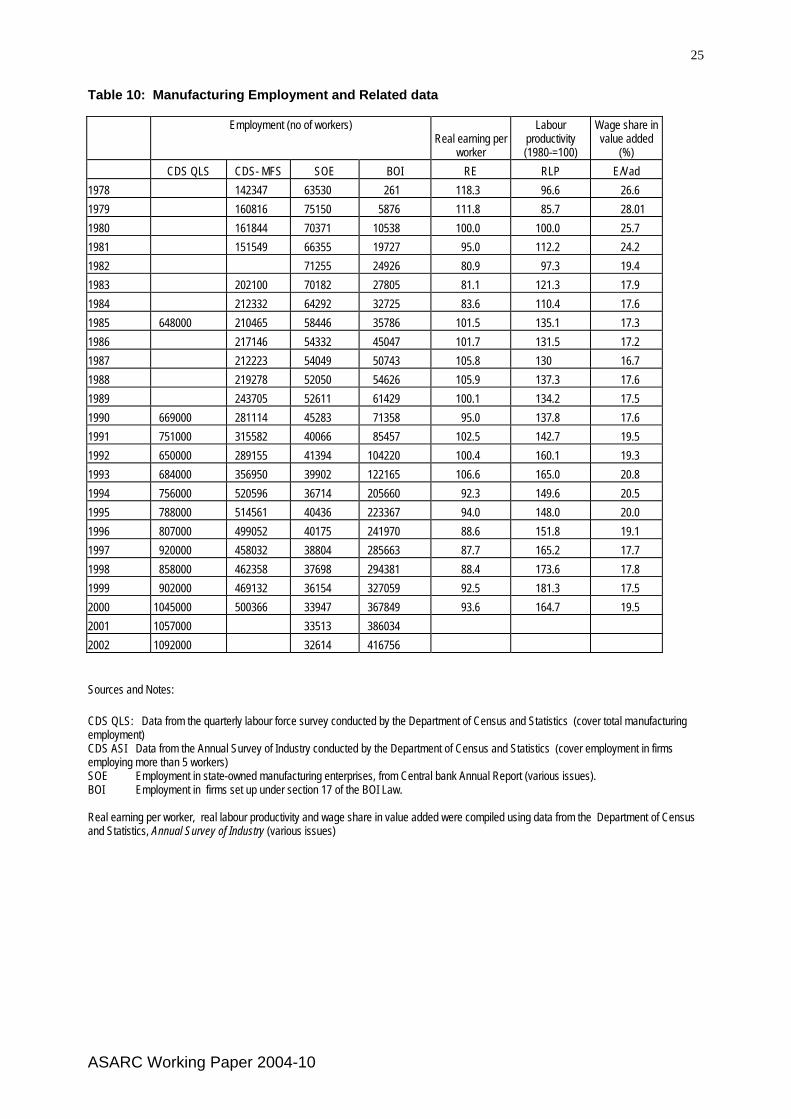
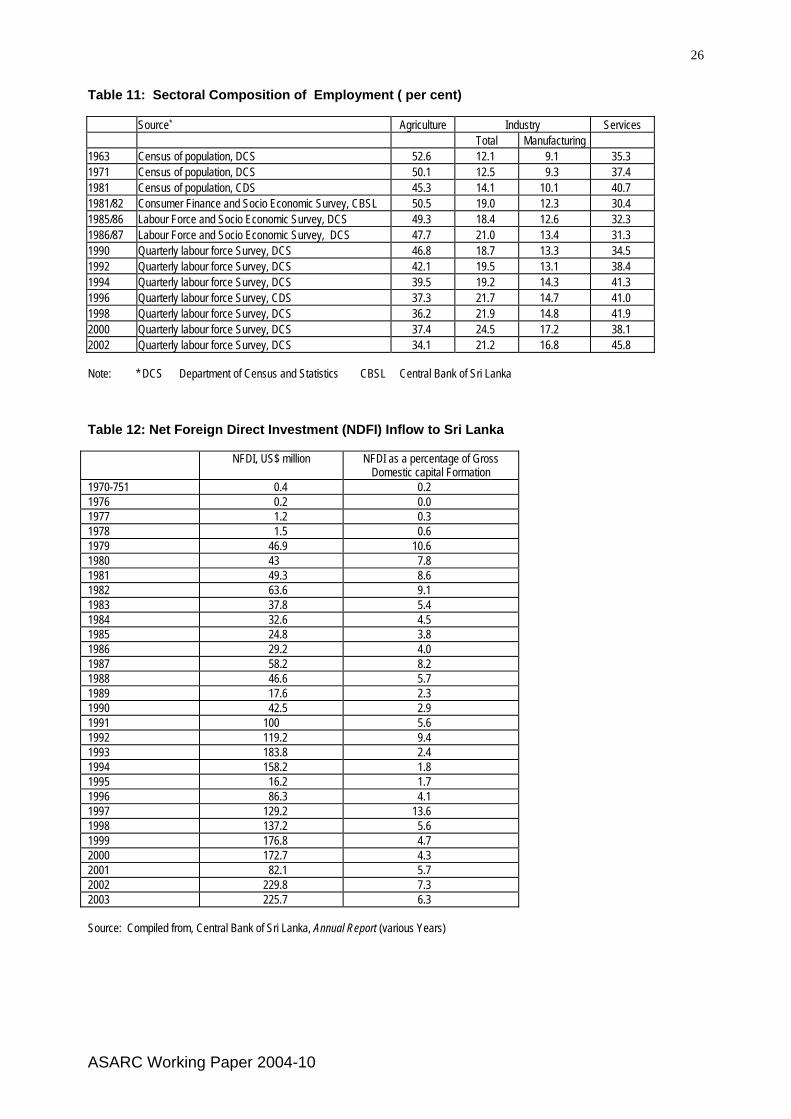
The post-reform years witnessed an impressive increase in manufacturing employment. According to data from the Annual Survey of Industry conducted by the Department of Census and Statistics (CDS), total employment in organized manufacturing (i.e., firms employing more than 5 workers) increased from 142 thousand in 1978 to over 500 thousand by the late 1990s (Table 10). According to the CDS Labour Force Survey, the island-wide manufacturing employment increased from 648 thousand in 1985 to 788 by the mid-1990s and passed the one-million mark in 2000. The share of manufacturing employment in total employment increased from around 10 per cent in the early 1980s to over 17 per cent by the end of 1990s (Table 11). Manufacturing sector contributed over 36 per cent of the increase in total employment in the economy between 1990/91 and 2001/02. The increase in manufacturing employment has come primarily from private sector manufacturing, in a context where employment in SOEs declined sharply, first because of output contraction caused by import competition and subsequently closing down and privatization.
Export oriented manufacturing accounts for the bulk of new employment opportunities. Total local employment in export-oriented BOI firms increased from around 10 thousand in the early 1980s to over 416 thousand in 2002 (or 40 per cent of total manufacturing employment). The export oriented garment industry contributed to over 35 per cent of total employment in organized manufacturing by the mid-1990s. This share has declined slowly in subsequent years reflecting the rapid expansion of other export-oriented industries such as rubber products, ceramics, and footwear and travel goods. The employment impact of new export oriented industries would look even more impressive if employment in small-scale manufacturing were appropriately accounted for. Many export-oriented firms in garments, toy and shoe industries have production subcontracting arrangements with small-scale producers in the unorganised sector.
The increase in manufacturing employment has not been accompanied by an increase in
real manufacturing wages. Real wages either declined or stagnated through out the post-reform period. At the same time, labour productivity recorded (real value added per worker) impressive growth over this period. The combined outcome of these developments has somewhat shifted the distribution of total factor income in favour of the employers. The share of employee remuneration (wages and other benefits) in manufacturing value added declined from over 20 per cent in the early 1970s to about 17 per cent since the mid-1980s. These patterns in the distribution of factor income and the real wage behaviour are much in line with what the theory predicts about the process of industrial adjustment in a labour-surplus economy under export-led industrialisation.
Even if the expansion of manufacturing worsened relative poverty though an increase in relative share of profits in total factor income as noted above,13 rapid manufacturing employment growth, coupled with the compositional changes in employment, would have led to a decline in absolute poverty. Reflecting the rapid expansion of export-oriented light manufacturing the share of female workers in total manufacturing employment increased from 32 per cent in the early 1980s to over 60 percent by the mid 1999-00s. There has also been a significant shift in the occupational composition in manufacturing, in favour of unskilled and
13 This is not a certainty given the high level of foreign capital participation in export-oriented industries.
ASARC Working Paper 2004-10
13
semi-skilled workers. Manual workers (unskilled, semi-skilled and skilled workers) accounted for over 90 per cent of total employment in BOI firms in 2002.14
4. The Role of FDI
Having averaged less than half a million a year during 1970-76, net FDI inflows increased rapidly in the post-reform period reaching US$ 64 million in 1982 (Table 12). The outbreak of the war in 1983 severely disrupted this impressive trend and annual flows were only in the US$17-58 million. The second-wave reforms and the temporary cessation of hostilities during the first half of the 1990s witnessed a notable surge in FDI which increased to an all-time high of US$184 million in 1993. The relative contribution of net FDI inflows to private sector fixed capital formation increased from 0.1 per cent during 1970-77 to 5 per cent during 1978-89 and to over 12 per cent during 1990-94. However, FDI inflows have declined since 1995 both in absolute terms and in relation to fixed capital formation. This excludes the impact of a mild reversal in the declining trend since 2000, mostly reflecting increased inflows related to the privatization program.15
Data relating to individual projects set up with FDI participation (henceforth referred to as ‘foreign firms’) points to a clear shift in FDI from domestic market-oriented to export-oriented activities. During 1967-77, a total of 82 foreign manufacturing firms were set up in Sri Lanka. Of these, only 13 were export-oriented ventures (garments 9; gem cutting 2; ceramic-ware 1; wall-tiles 1) (Athukorala 1995). In contrast, out of 2041 foreign firms set up during 1978-2002, 1341 received approval under the BOI special incentive scheme for export-oriented firms. These firms accounted for over 90 per cent of envisaged investment and employed of all projects. In addition, a considerable number of firms (over 125) approved under general incentive provisions are believed to export significant share of their output (Athukorala 1995).
Standard labour intensive manufacturing has been the main attraction to foreign investors (Table 13), with a heavy concentration in the garment industry. During the early stages, the dominant factor behind the surge of clothing exports through FDI participation was the quota restrictions imposed by the major importing countries on imports from “traditional” developing country producers in East Asia under the Multi Fibre Arrangement (MFA). This was clearly evident from the predominance of firms from Hong Kong (the major developing-country exporter of garments) in Sri Lanka’s export-oriented garment industry
Since the later 1980s, there has been a noticeable increase in the number of foreign firms
in other labour intensive activities, in particular footwear, travel goods, plastic products and diamond cutting and jewellery. There has also been an increase in processing of primary products which were previously exported in raw form, notably rubber-based products (heavy duty tires, rubber bands and surgical gloves) and ceramics. Initially, the surge of FDI in the garment industry responded to the imposition by developed countries of quota restrictions on garment imports from traditional East Asian developing countries under the Multi-fibre Arrangement (MFA). However, by 1983, garment exports from Sri Lanka also had come under quota restrictions, and the BOI stopped approval of new investors in quota restricted product categories and since then new foreign firms in garment industry have been predominantly involved in the production of non-quota garments have increased. (According to BOI firm-level 14 Calculated using data provided by the Board of Investment. 15 During 1999-2002, inflows relating to acquisitions accounted for over 30 per cent of net annual FDI inflows to Sri Lanka (calculations based data reported in the Annual Report of the Central Bank of Sri Lanka).
ASARC Working Paper 2004-10
14
data there were 23 non-quota garment producing foreign firms which accounted for 10 per cent of total garment exports by BOI approved firms. By 2002 these figures had increased to 36 and 42 per cent respectively. Another important recent development is the setting up of a number of yarn and textile producing factories by foreign firms to supply inputs to the garment industry.
The investment promotion campaign of GCEC (and BOI) aimed at attracting FDI into assembly activities in high-tech industries (category 3 in Table 17). However, it seems that the increase in political risk, following the eruption of the ethnic conflict in 1983, has prevented a positive response. Foreign firms involved in vertically integrated assembly activities, unlike those involved in light consumer goods industries, view investment risk from a long-term perspective because output disruption in a given location can disturb production plans for the entire production chain. In fact, two electronics multinationals, Motorola and Harris Corporation, abandoned plans to set up assembly plants in Sri Lanka in the early 1980s as the political climate begun to deteriorate. There is evidence that there is something of a heard mentality in the site selection process of electronics multi-national firms, particularly if the first-comer is a major player in the industry. If the two projects of Motorola and Harris Corporations had been successful, other multinationals would have probably followed suit (Athukorala and Rajapatirana 2000, Snodgrass 1998). Instead, today only a handful of small-scale firms from Germany, USA, Japan and Korea are involved in electronics assembly activities in Sri Lanka.
There is a close association between the growth of manufactured exports and the share of foreign firms (Table 14). The share of foreign firms in total manufacturing exports increased from 24 per cent in 1977 to over 65 per cent in the mid-1995. Over 80 per cent of the total increment in export value (in US$ terms) between 1980-95 came from foreign firms. There has been a decline in the FEI share in recent years, but still remained high at over 47 per cent by 2002. This decline mostly reflects the success of ‘pure’ local firms in expanding exports of standard light manufactured goods (mostly garments) benefiting from the market links established though their links with foreign firms (see below). Foreign firms still dominate ‘non-traditional’ product areas such as travel goods, heavy-duty tyres, surgical gloves and electronics assembly. In 2002, these firms accounted for over 80 per cent of total non-garment manufactured exports.16
Apart from the ‘direct’ contribution captured in this data, there is evidence that the presence of foreign firms generates significant positive spillover effects on the export success of local export producing firms (Athukorala 1995). Apart from the ‘direct’ contribution captured in this data, there is evidence that the presence of foreign firms generates significant positive spillover effects on the export success of local export producing firms. Following the entry of foreign firms into clothing and other light consumer goods industries in Sri Lanka, many international buying groups which had long-established market links with these firms also set up buying offices in the country. These buying offices have subsequently begun to play a crucial role in linking local firms with highly competitive international markets for these products. Moreover, over 80 per cent of export-oriened foreign firms in Sri Lanka operate through joint ventures set up with local entrepreneurs. Local entrepreneurs seem to make use of joint-venture operations with foreign investors as a means of acquiring production and marketing skills required for the successful operation of their own (independent) production units (Athukorala 1995, Lal and Wignaraja 1992 ). There are also many cases of the local partner taking over the entire production operation and continue to thrive in export business after an initial stage of joint-venture operation. What all the above reasoning suggests is that 16 Estimated using data provided by the Board of Investment.
ASARC Working Paper 2004-10
15
the spill-over effects of the presence of foreign firms have, to a significant extent, contributed to the ‘export success’ of local firms.
Sri Lanka’s heavy reliance on FDI for export expansion is in sharp contrast to the early
experience of newly-industrialized countries (NIEs) in East Asia, in particular that of Taiwan, Korea and Hong Kong. The spectacular export take-off of these countries in the 1960s through labor-intensive exports was predominantly based on initiatives of indigenous firms (Nayyar 1978). This contrast does not, however, warrant the inference that Sri Lanka could have achieved export expansion through indigenous entrepreneurial capabilities under a restrictive policy towards FDI. The important role played by foreign firms in export expansion is not a peculiar Sri Lankan phenomenon. The available evidence for ‘second-tier’ exporting countries generally points to a close association between the degree of ‘foreign presence’ (as measured by the share of foreign firms in total manufactured exports) and export growth. This close relationship can be explained in terms of at least two important recent developments in the process of internationalization of production. First, from about the early 1970s, successful exporting firms in NIEs have begun to play an important role in labor-intensive export industries in second-tier exporting countries. Second, assembly activities in global industries, which are predominantly undertaken by setting up overseas production plants rather than through arms-length arrangement, have become increasingly important as an avenue for developing countries to participation in international production.
Athukorala and Rajapatirana (2000) have undertaken an econometric analysis of the determinants of manufactured exports of Sri Lanka, with emphasis on the role of FDI. The results suggest that the significant involvement of foreign firms in export-oriented manufacturing contributed to a considerable weakening of the link between the real exchange rate and export performance. International production location decisions of export-oriented foreign firms are mostly governed by the relative attractiveness of the country vis a vis other investment locations. This depends on the nature of the trade and investment regimes and the availability of required inputs (mostly labor) are the key considerations. The domestic incentive structure per se, that determines the relative profitability of exporting compared to selling domestically of a given host country is not the prime criterion. Given this feature of the behaviour of foreign investors and their significant presence in domestic manufacturing, Sri Lanka has been able to achieve rapid export growth despite a less than satisfactory domestic incentive structure. 5. Conclusions
The liberalisation reforms initiated in 1977 have resulted on a significant opening of the Sri Lankan economy. The reform process has been successful in virtually eliminating quantitative restrictions and reinforcing tariff as the main instruments for regulating import trade. Tariff levels have also come down over the years and export producers have enjoyed duty free access to implored inputs from the very beginning of the reform process. Liberalisation of the foreign investment regime has gone in hand in hand trade liberalisation. These reforms have led to far-reaching changes in the structure and performance of the manufacturing sector in the Sri Lankan economy. The manufacturing sector has become increasingly export-oriented, and it is no longer reliant on the fortunes of the traditional primary export industries to obtain required imported inputs. With the gradual erosion of the dominant role of SOEs, the private sector has been largely responsible for growth of manufacturing in recent years. Despite some output disruption in the immediate aftermath of the removal of trade restrictions, the manufacturing sector has turned in an improved performance both in terms of output, productivity and employment, confounding the predictions of pessimists who expected trade liberalization to set
ASARC Working Paper 2004-10
16
in a process of deindustrialization. The gains from export-oriented industrialization have been impressive enough to set the stage for bipartisan acceptance of an outward-oriented policy stance as the centrepiece of national development policy – a landmark development in Sri Lanka’s post-independence policy history.
It is important to note that what has been achieved in Sri Lanka under liberalization reforms occurred while civil war had been persisting for much of the period. Quite apart from the direct debilitating effect of political risk on investor perception, the civil war hampered capturing the full benefits of economic opening through delays and inconsistencies in the implementation of reform process and macroeconomic instability emanating from massive war financing. In this context, the Sri Lankan experience with export-led industrialization so far can be explained as the joint outcome of trade liberalization that increased the potential returns to investments which capitalise on the country’s comparative advantage and investment liberalization that permitted the entry of international firms which have the capacity to take advantage of such profit opportunities. Despite political risk and policy uncertainty, rapid export growth was consistent with this policy configuration as it ensured a handsome profit in labour-intensive export production in a labour abundant economy, which is usually characterized by a short payback period. Interestingly, the Sri Lankan experience over the past two decades has clearly demonstrated that an outward-oriented policy regime can yield a superior industrial outcome compared to a closed-economy regime, even under severe strains of political and macroeconomic instability.
References
Athukorala, P. and S. Rajapatirana (2000), Liberalisation and Industrial Transformation: Sri Lanka in International Perspective, Oxford and Delhi: Oxford University Press.
Athukorala, Pprema-chandra and Sisira Jayasuriya (1994), Macroeconomic Policies, Crises and Growth in Sri Lanka, 1969-90, Washington D.C.: World Bank.
Athukorala, Prema-chandra (1995), ‘Foreign Direct Investment and Manufacturing for Export in a New Exporting Country: The Case of Sri Lanka,’ World Economy, 14 (2), 543-564.
Athukorala, Prema-chandra (2004) ‘Growth of Manufactured Exports and Terms of Trade in Sri Lanka: Pessimism Confounded’, Economic Policy Issues and Debates in Sri Lanka: Essays in Honour of Gamini Corea, New Delhi: Sage (forthcoming).
Cuthbertson, A. G. and P. Athukorala (1990), ‘Sri Lanka’, Part 3 in D. Papageorgiou, M. Michaely and A. M. Choksi eds. Liberalizing Foreign Trade: Indonesia, Pakistan and Sri Lanka, Oxford: Basil Blackwell, 287-414.
Dunham, David and Sisira Jayasuriya (2001), “Liberalisation and Political Decay: Sri Lanka's Journey from Welfare State to a Brutalised Society”, Working Paper No. 352, Institute of Social Studies, The Hague
Government of Sri Lanka (1972), Five-Year Plan, Colombo: Ministry of Planning and Employment.
Harberger, Arnold C. (1996), ‘Reflections on Economic Growth in Asia and the Pacific’, Journal of Asian Economics, 7(1996): 365-392.
ASARC Working Paper 2004-10
17
Keesing, D. B. and S. Lall (1992), ‘Marketing of manufactured Exports from developing Countries: Learning Sequences and Public Support’, in Helleiner, Gerald K. ed. (1992), Trade Policy, Industrialisation, and Development: New Perspectives, Oxford: Clarendon Press, 176-93.
Krueger, A. O. (1994), Problems of Liberalisation’ in Arnold Harberger (ed.), World Economic Growth, San Francisco, Cal: Institute for Contemporary Studies Press, 403-423.
Krueger, Anne.. O. (1992), Economic policy Reforms in Developing Countries, Oxford: basil Blackwell.
Lal, Deepak and Sarath Rajapatirana (1989) “Impediments to Trade Liberalization in Sri Lanka”, Thames Essays No. 51, Aldershot: Gower
Lall, Sanjaya, Kishore Sharma, Ganeshan Wignaraja, Sabrina Di Addario and Gokhan Akinci (1996), Building Sri Lankan Competitiveness: A Strategy for Manufactured Export Growth, Colombo: The National Development Council.
Little, I.M.D. (1982) Economic Development: Theory, Policy and International Relations, New York: Basic Books.
Michaely, Michael, D. Papageorgiou, M. Michaely (1991). Liberalizing Foreign Trade: Lessons of Experience in the Developing World, Oxford: Basil Blackwell.
Nayyar, Deepak (1978), ‘Transnational Corporations and Manufactured Exports from Poor Countries’, Economic Journal, 88, 59-84.
Rama, Martin (1994), ‘Flexibility in Sri Lanka’s Labour Market’, Policy Research Working Paper No 1262, Washington DC: World Bank
Rodrick, Dani (2003), Introduction: What do We Learn from Country Narratives”, in Rodrick, Dani (ed.) In Search of Prosperity: Analytic Narratives on Economic Growth, Princeton University Press, Princeton and Oxford
Singer, Hans W., 1987, ‘Terms of Trade’ in John Eatwell, Murray Milgate and Peter Newman eds. The New Palgrave: A Dictionary of Economics, London: Macmillan, pp. 626-628.
Snodgrass, D. R. (1966), Sri Lanka: An Export Economy in Transition, Homewood, Ill: Richard D. Irvin.
Snodgrass, Donald R. (1998), “The Economic Development of Sri Lanka: A Tale of Missed Opportunities”, in Robert I. Rotberg (ed.), Creating Peace in Sri lanka: Civil War and Reconcililation, Wahington DC: Brookings Institution Press, 89-107.
UNCTAD (United Nations Conference on Trade and Development) (2002), Trade and Development Report, 2002, Geneva: UNCTAD.
Wignaraja, G. (1998), Trade Liberalisation in Sri Lanka: Export, Technology and Industrial Policy, London: Macmillan.
World Bank (2003), Trade Policies in South Asia: An Overview, Washington DC: World Bank. (processed).
Wriggings, W. Howard (1960), Ceylon: Dilemmas of New Nations, Princeton: Princeton University Press.
ASARC Working Paper 2004-10
18
Table 1: Import Duty Collection Rates* and the Share of Dutiable Imports, 1978-95 (percentages)
Notes: 1 Actual import duty (including surcharges and cesses) as a per centage of total import value (c.i.f). 2 Total dutiable imports as a share of total imports. Source: Compiled from Sri Lanka Customs Department, Customs Returns (for the period 1978- 1997) and Central Bank of Sri Lanka, Annual Report (various years).
Table 2: Nominal and Effective Protection to Import-Competing Manufacturing, 1981, 1991, 1994 and 2002
ISIC No
Industry 1981 1991 1994 2002
ERP NRP ERP NRP ERP NRP ERP 31 Food, beverages and tobacco 72 50 61 47 68 21 36 32 Textiles, wearing apparel and leather products 78 45 58 46 84 25 54 33 Wood, wood products and furniture 79 43 96 37 52 25 57 34 Paper, paper products and printing 50 93 46 106 22 53 35 Chemicals, rubber and plastic products 56 38 118 42 69 25 125 36 Non-metallic mineral products 32 91 35 59 18 41 37 Basic metal products 28 40 273 41 104 22 85 38 Fabricated metal products, machinery and transport
equipment 107 48 132 45 95 25 86
39 Other manufacturing 55 122 50 115 20 25 3 Total manufacturing 90 45 77 43 70 23 56
Notes:
--- Not available.
NRP Nominal protection rate: The difference between domestic price and border (world) price as a percentage of the latter. EPR Effective protection rate: The percentage increase in value added under the existing trade policy intervention over value added at
boarder price. Source: Ministry of Finance (1994), (Table 5.4) (data for 1981 and 1994) and estimates provided by the Tariff Advisory Committee for the other two years.
ASARC Working Paper 2004-10
19
Table 3: Real Exchange Rate (RER) and its Components NER WPI CPI RER 1980 47.4 74.8 31.6 112.21981 51.9 80.6 37.2 112.41982 52.6 83.0 41.2 105.81983 57.3 84.9 47.0 103.51984 58.9 87.4 54.8 93.91985 61.4 88.6 55.6 97.71986 68.2 87.2 60.1 98.91987 75.1 88.7 64.7 103.01988 83.2 91.8 73.8 103.51989 89.3 95.9 82.3 104.11990 100.0 100.0 100.0 100.01991 101.2 103.1 112.2 93.11992 107.6 105.7 125.0 91.01993 116.2 108.2 139.6 90.01994 121.4 110.9 151.4 88.91995 130.1 115.2 163.1 91.91996 134.0 117.5 189.0 83.31997 139.4 118.9 207.1 80.01998 149.0 118.9 226.5 78.21999 166.2 120.1 237.2 84.22000 179.3 125.4 251.8 89.32001 199.9 127.2 287.5 88.52002 214.5 126.4 314.9 86.12003 232.3 129.0 327.3 91.6 Notes: NER: Trade weighted nominal exchange rate vis a vis the five major trading partner countries WPI: Trade weighted wholesale price of the five major trading partner countries CPI: Domestic (Sri Lanka) consumer price index. RER: Real exchange rate (= [NER*WPI]/CPI Trade weight used in compiling NER and WPI relate to the year 2002. Source: Compiled from Central Bank of Sri Lanka, Annual Report (various issues).
ASARC Working Paper 2004-10
20
Table 4: Key Indicators of Manufacturing Performance, 1965-961 (percentages
Notes 1. Capacity utilization and export output ratio relates to ‘organized’ manufacturing only. Others are economy-wide indicators. 2. Manufacturing excluding primary processing of plantation crops. 3. In current US$ terms, excluding petroleum products. --- Data not available Source: Complied from Central Bank, Review of the Economy and Annual Report (various issues). Table 5: Total Factor Productivity Growth (TFPG) to Output Growth in Private Sector Manufacturing
*
Go Contribution of : TFPG Labour
(SL*GL) Capital (SK*GK)
Intermediate inputs (SM*GM)
1966-1974 0.8 0.5 -1.3 4.6 -3.0 1974-1981 4.0 0.2 3.0 1.6 -0.8 1981-1988 14.0 0.6 3.6 8.5 1.2 1988-1995 17.4 1.5 4.9 1.3 9.7 1995-2000 3.5 -0.1 0.7 1.8 1.2 1981-2000 12.5 0.7 3.3 4.1 4.3 Notes: * Estimated using the formula: TFPG = GO - SL GL - SK GK - SMGM where, TFPG is total factor productivity growth; GO, GL, GK, GM denotes annual compound growth of gross output, labour, stock of capital and intermediate input between the two given years; and SL , SK and SM denote the average value shares of labour, capital and material in output. Source: Athukorala and Rajapatirana (2000), Table 8.1, updated using the same methodology and data sources.
ASARC Working Paper 2004-10
21
Table 6: Sectoral composition of Manufacturing Output (Value Added) and Employment1, 1981, 1988, 1995 and 2000 (percentages)
Notes: 1 Excluding petroleum refining. 2 Jewelry, sport goods, toys etc. Source: Compiled from Department of Census and Statistics (DCS), Annual Survey of Industries, Colombo: DCS.
ASARC Working Paper 2004-10
22
Table 7: Growth of Manufacturing Gross Output and Total factor Productivity
• Estimates for 1990-2002. Source: Compiled from, Central Bank of Sri Lanka, Annual Report (various Years)
ASARC Working Paper 2004-10
24
Table 9: Value, Volume and Unit value of Garments Exports from Bangladesh, China, Indonesia, Sri Lanka and Thailand, 1985-20011
Bangladesh China Indonesia Sri Lanka Thailand Value Volume Unit value Value Volume Unit value Value Volume Unit value Value Volume Unit value Value Volume Unit value
Notes (1) The data reported in the Table cover exports of garments belonging to three SITC 3-digit categories (Men's and Boy's outwear, textile fabrics not knitted or crocheted (SITC 842), Women, girls, infants
outwear, not knitted or crocheted (843), and Outwear knitted or crocheted (845)). (2) For the period 1986-99. (3) For the period 1987-2001. (3) Growth rate estimated by fitting a logarithmic trend line. T-ratios are given in bracket, with the statistical significance denoted as: * 5-percent, ** one-percent. --- Data not available.
25
Table 10: Manufacturing Employment and Related data
Sources and Notes: CDS QLS: Data from the quarterly labour force survey conducted by the Department of Census and Statistics (cover total manufacturing employment) CDS ASI Data from the Annual Survey of Industry conducted by the Department of Census and Statistics (cover employment in firms employing more than 5 workers) SOE Employment in state-owned manufacturing enterprises, from Central bank Annual Report (various issues). BOI Employment in firms set up under section 17 of the BOI Law. Real earning per worker, real labour productivity and wage share in value added were compiled using data from the Department of Census and Statistics, Annual Survey of Industry (various issues)
ASARC Working Paper 2004-10
26
Table 11: Sectoral Composition of Employment ( per cent) Source* Agriculture Industry Services Total Manufacturing 1963 Census of population, DCS 52.6 12.1 9.1 35.3 1971 Census of population, DCS 50.1 12.5 9.3 37.4 1981 Census of population, CDS 45.3 14.1 10.1 40.7 1981/82 Consumer Finance and Socio Economic Survey, CBSL 50.5 19.0 12.3 30.4 1985/86 Labour Force and Socio Economic Survey, DCS 49.3 18.4 12.6 32.3 1986/87 Labour Force and Socio Economic Survey, DCS 47.7 21.0 13.4 31.3 1990 Quarterly labour force Survey, DCS 46.8 18.7 13.3 34.5 1992 Quarterly labour force Survey, DCS 42.1 19.5 13.1 38.4 1994 Quarterly labour force Survey, DCS 39.5 19.2 14.3 41.3 1996 Quarterly labour force Survey, CDS 37.3 21.7 14.7 41.0 1998 Quarterly labour force Survey, DCS 36.2 21.9 14.8 41.9 2000 Quarterly labour force Survey, DCS 37.4 24.5 17.2 38.1 2002 Quarterly labour force Survey, DCS 34.1 21.2 16.8 45.8 Note: * DCS Department of Census and Statistics CBSL Central Bank of Sri Lanka Table 12: Net Foreign Direct Investment (NDFI) Inflow to Sri Lanka NFDI, US$ million NFDI as a percentage of Gross
3.2 Fabricated metal products, and machineryand transport equipment 2 0.2 1.3 4.7 78 6.9
Total Foreign 34 100 303 100 569 100 Note: 1. Firm approved under Section 17 (special export provision) of BOI Law. Source: Complied from official records ob the Board of Investment.