www.ubs.com/investmentresearch This report has been prepared by UBS Securities Australia Ltd. ANALYST CERTIFICATION AND REQUIRED DISCLOSURES BEGIN ON PAGE 31. UBS does and seeks to do business with companies covered in its research reports. As a result, investors should be aware that the firm may have a conflict of interest that could affect the objectivity of this report. Investors should consider this report as only a single factor in making their investment decision. Global Research 17 January 2018 Australian Banking Sector Update Household debt hits 200%. House prices sliding. Non-banks winning share, CBA loses. Total Household Debt restated upwards to 200% of disposable income In recent weeks there have been a number of data points which highlight the pressures facing the household sector. Household debt in Australia is extremely elevated and it was concerning to see the Australian Bureau of Statistics upwardly revise debt levels following the inclusion of new APRA reporting for Registered Superannuation Entities. This led to a further ~3% increase in household debt as leverage in Self Managed Superannuation Funds was fully incorporated. Now the ratio of household debt to disposable income has jumped to 200% (from 194%), one of the highest in the world. House prices continue to slide in Sydney in January and have peaked in Melb. Pricing data from CoreLogic continues to show that the housing cycle has turned. Home values in Sydney are continuing to slide in January (down 3% from their September highs) while Melbourne has now peaked. We expect weakness to continue given: (1) Macro Prudential measures; (2) Ongoing pressure on the banks to improve lax underwriting standards; (3) Fewer foreign buyers; (4) Concerns over the potential impact of the Opposition's proposed changes to negative gearing and capital gains tax. Housing credit growth slows while NBFIs take up the slack RBA data shows housing credit slowed to 0.44% (m/m) in November, down from the peak of 0.57% in May. This is consistent with our forecasts for an ongoing slowdown in housing credit. While the banks are feeling the full impact of this tightening, some of the void appears to have been taken by the Non-Bank Financial Institutions (NBFI) where housing credit growth has accelerated to 20% (the highest level since 2007). Given APRA's new powers to regulate the NBFIs and stricter monitoring of the use of bank warehouses we expect NBFI growth to slow. Within the Majors CBA is continuing to see its market share slip (as seen in its 1Q18 Trading Update). Although we are comfortable with below system growth at this stage of the cycle, in the past CBA has regularly used price (discounting) to address its market share losses. The banks are battered and bruised – unlikely to improve any time soon The banks have a challenging outlook as the housing market slows, NIM comes under pressure from competition and switching (Interest Only to Principal & Interest), offsetting improved funding. The Royal Commission is an area of material uncertainty, while mortgage mis-selling and responsible lending risks are a growing concern. We expect the Australian banks to continue to lag peers given regulatory risk and lack of leverage to global rates and growth. Order of pref: MQG, WBC, ANZ, CBA, NAB. Figure 1: Household Debt to Disposable Income, restated Figure 2: CBA vs Non-Banks Housing Credit Growth (%) Source: ABS, RBA, UBS estimates Source: RBA, APRA, UBS estimates 50 100 150 200 Jun 88 Jun 90 Jun 92 Jun 94 Jun 96 Jun 98 Jun 00 Jun 02 Jun 04 Jun 06 Jun 08 Jun 10 Jun 12 Jun 14 Jun 16 Jun 18 (%) Household Debt to Disposable Income (New Series) -20 -10 0 10 20 30 0 5 10 15 20 25 Jun 05 Jun 06 Jun 07 Jun 08 Jun 09 Jun 10 Jun 11 Jun 12 Jun 13 Jun 14 Jun 15 Jun 16 Jun 17 (%) CBA NBFIs (RHS) Bankwest acquisition & GFC Equities Australasia Financial Jonathan Mott Analyst [email protected]+61-2-9324 3864 Rachel Bentvelzen Analyst [email protected]+61-2-9324 2392
Transcript
www.ubs.com/investmentresearch
This report has been prepared by UBS Securities Australia Ltd. ANALYST CERTIFICATION AND REQUIRED DISCLOSURES BEGIN ON PAGE 31. UBS does and seeks to do business with companies covered in its research reports. As a result, investors should be aware that the firm may have a conflict of interest that could affect the objectivity of this report. Investors should consider this report as only a single factor in making their investment decision.
Global Research 17 January 2018
Australian Banking Sector Update Household debt hits 200%. House prices sliding. Non-banks winning share, CBA loses.
Total Household Debt restated upwards to 200% of disposable income In recent weeks there have been a number of data points which highlight the pressures facing the household sector. Household debt in Australia is extremely elevated and it was concerning to see the Australian Bureau of Statistics upwardly revise debt levels following the inclusion of new APRA reporting for Registered Superannuation Entities. This led to a further ~3% increase in household debt as leverage in Self Managed Superannuation Funds was fully incorporated. Now the ratio of household debt to disposable income has jumped to 200% (from 194%), one of the highest in the world.
House prices continue to slide in Sydney in January and have peaked in Melb. Pricing data from CoreLogic continues to show that the housing cycle has turned. Home values in Sydney are continuing to slide in January (down 3% from their September highs) while Melbourne has now peaked. We expect weakness to continue given: (1) Macro Prudential measures; (2) Ongoing pressure on the banks to improve lax underwriting standards; (3) Fewer foreign buyers; (4) Concerns over the potential impact of the Opposition's proposed changes to negative gearing and capital gains tax.
Housing credit growth slows while NBFIs take up the slack RBA data shows housing credit slowed to 0.44% (m/m) in November, down from the peak of 0.57% in May. This is consistent with our forecasts for an ongoing slowdown in housing credit. While the banks are feeling the full impact of this tightening, some of the void appears to have been taken by the Non-Bank Financial Institutions (NBFI) where housing credit growth has accelerated to 20% (the highest level since 2007). Given APRA's new powers to regulate the NBFIs and stricter monitoring of the use of bank warehouses we expect NBFI growth to slow. Within the Majors CBA is continuing to see its market share slip (as seen in its 1Q18 Trading Update). Although we are comfortable with below system growth at this stage of the cycle, in the past CBA has regularly used price (discounting) to address its market share losses.
The banks are battered and bruised – unlikely to improve any time soon The banks have a challenging outlook as the housing market slows, NIM comes under pressure from competition and switching (Interest Only to Principal & Interest), offsetting improved funding. The Royal Commission is an area of material uncertainty, while mortgage mis-selling and responsible lending risks are a growing concern. We expect the Australian banks to continue to lag peers given regulatory risk and lack of leverage to global rates and growth. Order of pref: MQG, WBC, ANZ, CBA, NAB.
Figure 1: Household Debt to Disposable Income, restated Figure 2: CBA vs Non-Banks Housing Credit Growth (%)
Household debt restated upwards With the release of the National Accounts the Australian Bureau of Statistics (ABS) has been undertaking 'quality assurance work' and making a number of revisions to historical estimates. One of the more significant changes was to incorporate new data from APRA for Responsible Superannuation Entities which it begun collecting in June 2016 and first published in September 2017.
As a result of these changes Total Household Liabilities have been increased by approximately 3% to $2,466bn. The largest change was to incorporate higher levels of debt within Self Managed Superannuation Funds (SMSFs). As a result of these changes the ABS and RBA now estimate total Household Debt to Disposable Income at 199.7%.
Figure 3: Household Debt to Disposable Income (%)
Source: ABS, RBA, UBS estimates
We recently downgraded our housing credit growth forecasts to 4.4% (FY18E), 3.0% (FY19E) and 1.7% (FY20E). With subdued growth in household income expected to continue this implies household leverage is likely to rise further in the near term. As a result we expect total household debt to disposable income to peak around 205% before the slow deleveraging process begins.
Figure 4: Major Banks Housing Fund Flows (A$bn)
Source: Company data, UBS estimates
40
60
80
100
120
140
160
180
200
Jun-
1988
Jun-
1990
Jun-
1992
Jun-
1994
Jun-
1996
Jun-
1998
Jun-
2000
Jun-
2002
Jun-
2004
Jun-
2006
Jun-
2008
Jun-
2010
Jun-
2012
Jun-
2014
Jun-
2016
Jun-
2018
(%)
June 2017 Series New Series
975
221 92
162
77
20
1,04
5
268
97
178
89
29
1,11
3
293 10
4
191
94
26
1,19
9
297 10
4
193
93
35
1,27
9
293 10
9
201
90
31
1,36
0
282 10
9
214
88
29
1,42
0 27
3 105
225
83
27
1,46
2
266
101
237
78
25
1,48
8
0
250
500
750
1,000
1,250
1,500
1,750
2,000
Bala
nce
FY12
Fund
ings
Redr
aw &
Int.
Repa
ymen
tsPr
oper
ty S
ales
Ex'n
al R
efi
Bala
nce
FY13
Fund
ings
Redr
aw &
Int.
Repa
ymen
tsPr
oper
ty S
ales
Ex'n
al R
efi
Bala
nce
FY14
Fund
ings
Redr
aw &
Int.
Repa
ymen
tsPr
oper
ty S
ales
Ex'n
al R
efi
Bala
nce
FY15
Fund
ings
Redr
aw &
Int.
Repa
ymen
tsPr
oper
ty S
ales
Ex'n
al R
efi
Bala
nce
FY16
Fund
ings
Redr
aw &
Int.
Repa
ymen
tsPr
oper
ty S
ales
Ex'n
al R
efi
Bala
nce
FY17
Fund
ings
Redr
aw &
Int.
Repa
ymen
tsPr
oper
ty S
ales
Ex'n
al R
efi
Bala
nce
FY18
EFu
ndin
gsRe
draw
& In
t.Re
paym
ents
Prop
erty
Sal
esEx
'nal
Ref
iBa
lanc
e FY
19E
Fund
ings
Redr
aw &
Int.
Repa
ymen
tsPr
oper
ty S
ales
Ex'n
al R
efi
Bala
nce
FY20
E
(A$bn) Actual Forecast
7.1% 6.6% 7.7%
growth
FY13 FY14 FY15 FY16
6.7% growth
FY17
6.3% growth
FY18E
4.4% growth
FY19E
3.0% growth
FY20E
1.7% growth
ABS has restated household debt higher by ~3% mainly due to higher debt in SMSFs
This has led to the Household Debt to Disposable Income ratio reaching 199.7%
We recently downgraded our housing credit growth forecasts but still expect Household Leverage to rise for another 1-2 years
Australian Banking Sector Update 17 January 2018
3
House prices continue to slip Following an extended period of strong house price growth pushing prices to extremely elevated levels, home prices in Australia are now beginning to correct.
Figure 5: CoreLogic Home Value Index - Daily (#)
Source: CoreLogic
The fall in house prices is most evident in Sydney where prices are now approximately 3% below the peak level seen in September. Based on the CoreLogic Home Value Index prices are continuing to slide during January, although transaction volumes are seasonally light at this time of the year.
House prices in Melbourne continued to rise for longer than in Sydney given less exposure to investment property buyers and greater affordability. However house prices in Melbourne have now peaked and we expect prices to ease in coming months. Interestingly prices in Perth have also eased back slightly in recent weeks after showing signs of stabilisation during Spring.
Figure 6: Long term house price history ($)
Source: CoreLogic, UBS estimates
We believe the housing market faces a number of material challenges as the housing bubble begins to deflate. These include:
The full impact of APRA's macro prudential measures, most importantly limits on interest only borrowing. Following moves by the banks to increase interest only mortgage rates to pass on the cost of the Bank Levy and reach these targets the level of interest only borrowing has fallen well below APRA's threshold to the mid-to-high teens. We believe a number of marginal
80
100
120
140
160
180
Aug
201
6
Sep
2016
Oct
201
6
Nov
201
6
Dec
201
6
Jan
2017
Feb
2017
Mar
201
7
Apr
201
7
May
201
7
Jun
2017
Jul 2
017
Aug
201
7
Sep
2017
Oct
201
7
Nov
201
7
Dec
201
7
Jan
2018
Index
Sydney Melbourne Brisbane / Gold Coast
Adelaide Perth 5 City Average
0
200,000
400,000
600,000
800,000
1,000,000
1,200,000
Dec
-95
Dec
-96
Dec
-97
Dec
-98
Dec
-99
Dec
-00
Dec
-01
Dec
-02
Dec
-03
Dec
-04
Dec
-05
Dec
-06
Dec
-07
Dec
-08
Dec
-09
Dec
-10
Dec
-11
Dec
-12
Dec
-13
Dec
-14
Dec
-15
Dec
-16
Dec
-17
Sydney Melbourne Brisbane Adelaide Perth
House prices in Sydney have fallen 3% from their September highs Prices in Melbourne have peaked
This follows a sustained rally in house prices (mainly Sydney & Melb) since 2013
We believe the housing market faces material pressures given:
(1) The full impact of Macro Prudential measures
Australian Banking Sector Update 17 January 2018
4
borrowers have exited the market given repayments under the principal and interest schedule are approximately 30-60% higher (depending on the residual term);
The major banks are also continuing to improve mortgage underwriting standards which we believe have been lax over the past few years (refer UBS Evidence Lab - $500bn in 'Liar Loans'? and UBS Evidence Lab – Liar Loans #2: Interest Only). During 2018 APRA is continuing to focus on the banks over their use of expense benchmarks (in particular the Household Expenditure Measure or HEM) as well as low levels of Net Income Surplus. Improving underwriting standards by the banks is likely to restrict the flow of new credit and demand in the housing market;
Demand for housing by foreigners is also falling following increases in taxes and duties as well as restrictions on capital outflows in China. Although exact numbers are difficult to ascertain, a survey by ANZ/Property Council of Australia estimates foreigners accounted for around 17% of Australian residential sales in 2017, including around 22% of purchases in New South Wales and Victoria.
Sentiment for investment into the housing market is waning, with the 'fear of missing out' euphoria fading quickly, especially in Sydney. This can be seen from the fall in survey responses to questions "where is wisest place for savings? – Real Estate" and "is it a good time to buy a property?". Further, affordability remains a material issue.
Figure 7: Sentiment towards housing purchases is weak
Source: Westpac Melbourne Institute, UBS
We believe the proposed changes to negative gearing and capital gains tax by the oppositions Australian Labor Party are also likely to weigh on the property market. Although it has proposed that existing investment property purchases will be grandfathered we believe these proposed changes add a level of uncertainty to some potential buyers.
25
40
55
70
85
100
115
130
145
160
10
15
20
25
30
35
40
45
50
55
88 90 92 94 96 98 00 02 04 06 08 10 12 14 16 18
RBA rate cut cycles (since 1990)'Wisest place for savings?' - real estate (LHS)Time to buy a dwelling (RHS)
Index % share
(2) Banks continuing to tighten lax mortgage underwriting standards
(3) Lower demand from foreigners
(4) Weaker sentiment towards housing with affordability a major concern
(5) Potential changes to negative gearing under an ALP government have also added to uncertainty
Non-Bank Financial Institutions winning share With APRA's renewed focus on sound lending practices and Macro Prudential measures the door has been opened for the Non-Bank Financial Institutions (NBFIs) to win share. This can be seen by the sharp growth in housing credit experienced by the non-banks, which has now hit 20%, and is the fastest growth the NBFIs have experienced since 2007. This has also led to a small increase in market share for the NBFIs from 5.3% to 5.5%, a trend we expect to continue. However, it should be noted that NBFI market share is well down on the 16% levels achieved prior to the Financial Crisis.
To address any potential regulatory arbitrage and poor lending practices by-passing the banking system into the non-ADIs the Government has introduced legislation into Parliament to give APRA powers over the non-ADIs where it believes there are risks to the stability of the financial system. However in a recent speech Wayne Byres, Chairman of APRA stated:
"The first point I would make is to stress that we see it very much as a reserve power. There is a clear threshold to be met before any rules could be applied to non-ADI lenders: that (i) APRA considers that the lending by non-ADI lenders contributes to risks of instability in the Australian financial system and, (ii) APRA considers that it is necessary, in order to address those risks, to make rules covering the lending of non-ADI lenders.
That means that, most of the time, the power to impose rules will lie dormant: non-ADI lenders will go about their business as they have always done, unconstrained by any APRA rules. Importantly, non-ADI lenders will not be subject to any day-to-day prudential oversight by APRA. For those of you uncomfortable at the thought of APRA supervising non-ADIs, let me assure you the feeling is mutual…
But equally, given international perceptions of Australia’s housing market, reinforcing the understanding of international investors that the Australian authorities have a wide range of tools at their disposal to support financial stability, should the need arise, certainly offers benefits as well…Let me finish on this issue by noting that, as things stand today, we do not foresee the need for any new non-ADI lender rules to be introduced the moment the legislation is passed."
-20
-15
-10
-5
0
5
10
15
20
25
30
Jun
2005
Jun
2006
Jun
2007
Jun
2008
Jun
2009
Jun
2010
Jun
2011
Jun
2012
Jun
2013
Jun
2014
Jun
2015
Jun
2016
Jun
2017
(%)
NBFIs
0
2
4
6
8
10
12
14
16
18
Jun
2005
Jun
2006
Jun
2007
Jun
2008
Jun
2009
Jun
2010
Jun
2011
Jun
2012
Jun
2013
Jun
2014
Jun
2015
Jun
2016
Jun
2017
(%)
NBFIs
Non-Bank housing credit growth has hit 20%. The fastest growth since 2007
APRA now has the powers to more closely regulate the non-ADIs. However, it does not appear to be in a rush unless it becomes a systemic concern
CBA share losses continue Over recent months CBA's housing market share has come under pressure. Housing credit growth has begun to slow sharply, more significantly than the system. This was seen in its recent 1Q18 Trading Update when it stated housing credit growth was up 2.7% annualised, while growth seen in October and November from the APRA statistics suggests this weakness has continued.
This slowdown in housing credit growth at CBA has led to questions as to whether this is a result of reputational damage following its alleged AML breaches. While this cannot be ruled out and is likely to have had some impact, the timing suggests other factors are likely to come into play given the usual 60-90 day period between when a loan is approved and funded onto a bank's Balance Sheet.
Perhaps the slowdown in housing credit growth may be a result of CBA's ongoing focus on proprietary channels rather than relying on mortgage brokers? Alternatively, it could be the 'law of big numbers' as maintaining 24% market share in any competitive industry is a challenge. These questions are likely to be explored in detail at CBA's 1H18 Result (due on the 7th Februrary).
While losing market share in any industry is usually not a good sign, we are not as concerned in this instance given the stage of the cycle. We would be more uncomfortable if CBA had been actively winning housing credit market share!
That said over the past twenty-five years since listing CBA has routinely used price/discounting in times when it has lost market share. CBA has the cheapest cost of funding of any Australian bank and the highest retail banking margin at 2.91% (2H17). As a result CBA can afford to discount more aggressively than its peers and still maintain a very healthy level of profitability.
As a result we expect ongoing mortgage competition in coming periods, especially for owner occupied, principal & interest mortgages.
0
2
4
6
8
10
12
14
16
18
20
Jun
2005
Jun
2006
Jun
2007
Jun
2008
Jun
2009
Jun
2010
Jun
2011
Jun
2012
Jun
2013
Jun
2014
Jun
2015
Jun
2016
Jun
2017
(%)
CBA
Bankwest acquisition & GFC
16
18
20
22
24
26
Jun
2005
Jun
2006
Jun
2007
Jun
2008
Jun
2009
Jun
2010
Jun
2011
Jun
2012
Jun
2013
Jun
2014
Jun
2015
Jun
2016
Jun
2017
(%)
CBA
Bankwest acquisition & GFC
CBA's market share losses seen with its 1Q18 Trading update have continued in October & November
While reputational damage from AML may be a factor, reducing reliance on brokers and 'law of big numbers' are more likely drivers
We are not uncomfortable with CBA's market share slipping at this stage of the cycle. Now is not the time to lend aggressively However, CBA has often reacted to market share losses by using price/discounting Expect mortgage competition to continue
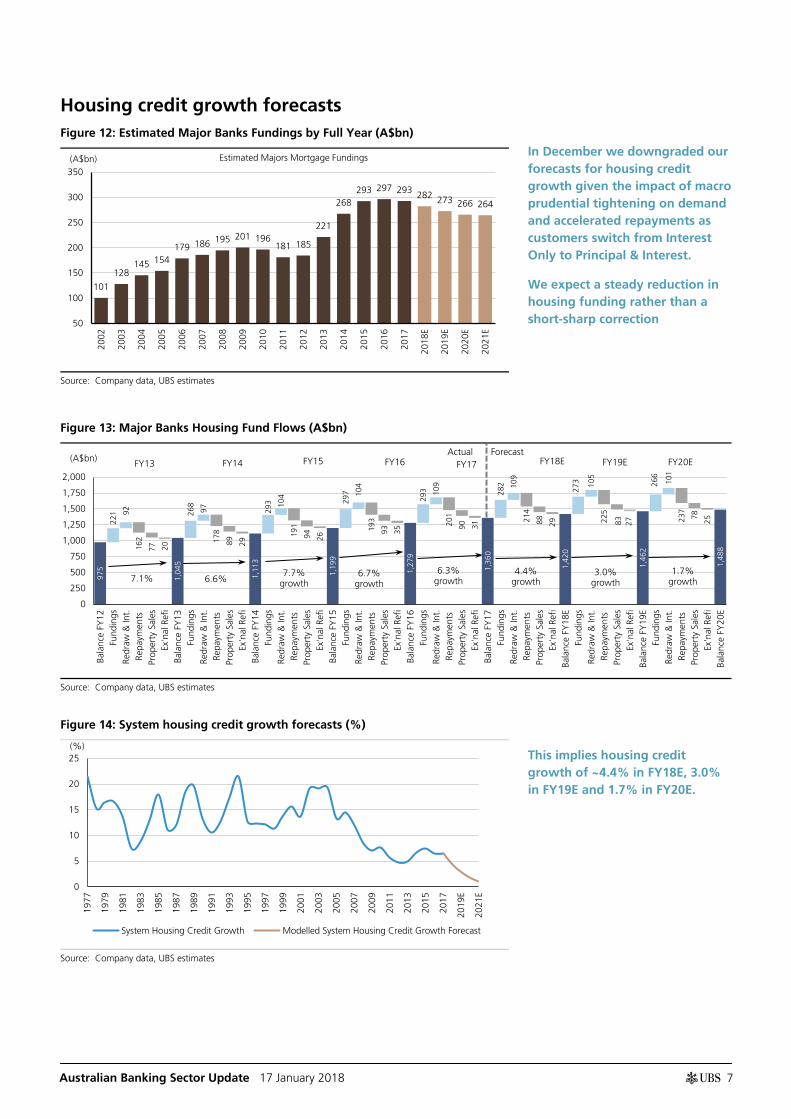
Housing credit growth forecasts Figure 12: Estimated Major Banks Fundings by Full Year (A$bn)
Source: Company data, UBS estimates
Figure 13: Major Banks Housing Fund Flows (A$bn)
Source: Company data, UBS estimates
Figure 14: System housing credit growth forecasts (%)
Source: Company data, UBS estimates
101
128 145 154
179 186 195 201 196 181 185
221
268 293 297 293 282 273 266 264
50
100
150
200
250
300
350
2002
2003
2004
2005
2006
2007
2008
2009
2010
2011
2012
2013
2014
2015
2016
2017
2018
E
2019
E
2020
E
2021
E
Estimated Majors Mortgage Fundings (A$bn)
975
221 92
162
77
20
1,04
5
268
97
178
89
29
1,11
3
293 10
4
191
94
26
1,19
9
297 10
4
193
93
35
1,27
9
293 10
9
201
90
31
1,36
0
282 10
9
214
88
29
1,42
0 27
3 105
225
83
27
1,46
2
266
101
237
78
25
1,48
8
0
250
500
750
1,000
1,250
1,500
1,750
2,000
Bala
nce
FY12
Fund
ings
Redr
aw &
Int.
Repa
ymen
tsPr
oper
ty S
ales
Ex'n
al R
efi
Bala
nce
FY13
Fund
ings
Redr
aw &
Int.
Repa
ymen
tsPr
oper
ty S
ales
Ex'n
al R
efi
Bala
nce
FY14
Fund
ings
Redr
aw &
Int.
Repa
ymen
tsPr
oper
ty S
ales
Ex'n
al R
efi
Bala
nce
FY15
Fund
ings
Redr
aw &
Int.
Repa
ymen
tsPr
oper
ty S
ales
Ex'n
al R
efi
Bala
nce
FY16
Fund
ings
Redr
aw &
Int.
Repa
ymen
tsPr
oper
ty S
ales
Ex'n
al R
efi
Bala
nce
FY17
Fund
ings
Redr
aw &
Int.
Repa
ymen
tsPr
oper
ty S
ales
Ex'n
al R
efi
Bala
nce
FY18
EFu
ndin
gsRe
draw
& In
t.Re
paym
ents
Prop
erty
Sal
esEx
'nal
Ref
iBa
lanc
e FY
19E
Fund
ings
Redr
aw &
Int.
Repa
ymen
tsPr
oper
ty S
ales
Ex'n
al R
efi
Bala
nce
FY20
E
(A$bn) Actual Forecast
7.1% 6.6% 7.7%
growth
FY13 FY14 FY15 FY16
6.7% growth
FY17
6.3% growth
FY18E
4.4% growth
FY19E
3.0% growth
FY20E
1.7% growth
0
5
10
15
20
25
1977
1979
1981
1983
1985
1987
1989
1991
1993
1995
1997
1999
2001
2003
2005
2007
2009
2011
2013
2015
2017
2019
E
2021
E
System Housing Credit Growth Modelled System Housing Credit Growth Forecast
(%)
In December we downgraded our forecasts for housing credit growth given the impact of macro prudential tightening on demand and accelerated repayments as customers switch from Interest Only to Principal & Interest.
We expect a steady reduction in housing funding rather than a short-sharp correction
This implies housing credit growth of ~4.4% in FY18E, 3.0% in FY19E and 1.7% in FY20E.
Australian Banking Sector Update 17 January 2018
8
System credit growth Figure 15: Credit growth in Australia (y/y basis) Figure 16: Australian Housing vs Business credit growth
Australian banks are large, highly leveraged financial institutions operating across a number of markets, and as such are subject to the risk of changes in the general business and economic conditions within these markets. A change in these conditions could include changes in interest rates, inflation, unemployment, monetary supply, exogenous shock, changes in foreign exchange rates, and the health of the general economy. The banks also face the risk of regulatory changes and increased competition which could affect the profitability of the sector. A key risk that financial institutions face is associated with extending credit to other parties. Less favourable business conditions could cause potential losses from loans to increase putting pressure on the group’s capital. The bank sector also faces operational risk from operating such large and complex businesses. Our Bank valuations and price targets are based on a Gordon Growth methodology, while our MQG valuation and price targets are based on a SOTP.
Australian Banking Sector Update 17 January 2018
31
Required Disclosures
This report has been prepared by UBS Securities Australia Ltd, an affiliate of UBS AG. UBS AG, its subsidiaries, branches and affiliates are referred to herein as UBS.
For information on the ways in which UBS manages conflicts and maintains independence of its research product; historical performance information; and certain additional disclosures concerning UBS research recommendations, please visit www.ubs.com/disclosures. The figures contained in performance charts refer to the past; past performance is not a reliable indicator of future results. Additional information will be made available upon request. UBS Securities Co. Limited is licensed to conduct securities investment consultancy businesses by the China Securities Regulatory Commission. UBS acts or may act as principal in the debt securities (or in related derivatives) that may be the subject of this report. This recommendation was finalized on: 17 January 2018 05:25 AM GMT. UBS has designated certain Research department members as Derivatives Research Analysts where those department members publish research principally on the analysis of the price or market for a derivative, and provide information reasonably sufficient upon which to base a decision to enter into a derivatives transaction. Where Derivatives Research Analysts co-author research reports with Equity Research Analysts or Economists, the Derivatives Research Analyst is responsible for the derivatives investment views, forecasts, and/or recommendations.
Analyst Certification:Each research analyst primarily responsible for the content of this research report, in whole or in part, certifies that with respect to each security or issuer that the analyst covered in this report: (1) all of the views expressed accurately reflect his or her personal views about those securities or issuers and were prepared in an independent manner, including with respect to UBS, and (2) no part of his or her compensation was, is, or will be, directly or indirectly, related to the specific recommendations or views expressed by that research analyst in the research report.
UBS Investment Research: Global Equity Rating Definitions
12-Month Rating Definition Coverage1 IB Services2
Buy FSR is > 6% above the MRA. 46% 27%
Neutral FSR is between -6% and 6% of the MRA. 39% 24%
Buy Stock price expected to rise within three months from the time the rating was assigned because of a specific catalyst or event. <1% <1%
Sell Stock price expected to fall within three months from the time the rating was assigned because of a specific catalyst or event. <1% <1%
Source: UBS. Rating allocations are as of 31 December 2017. 1:Percentage of companies under coverage globally within the 12-month rating category. 2:Percentage of companies within the 12-month rating category for which investment banking (IB) services were provided within the past 12 months. 3:Percentage of companies under coverage globally within the Short-Term rating category. 4:Percentage of companies within the Short-Term rating category for which investment banking (IB) services were provided within the past 12 months.
KEY DEFINITIONS:Forecast Stock Return (FSR) is defined as expected percentage price appreciation plus gross dividend yield over the next 12 months. Market Return Assumption (MRA) is defined as the one-year local market interest rate plus 5% (a proxy for, and not a forecast of, the equity risk premium). Under Review (UR) Stocks may be flagged as UR by the analyst, indicating that the stock's price target and/or rating are subject to possible change in the near term, usually in response to an event that may affect the investment case or valuation. Short-Term Ratings reflect the expected near-term (up to three months) performance of the stock and do not reflect any change in the fundamental view or investment case. Equity Price Targets have an investment horizon of 12 months.
EXCEPTIONS AND SPECIAL CASES:UK and European Investment Fund ratings and definitions are: Buy: Positive on factors such as structure, management, performance record, discount; Neutral: Neutral on factors such as structure, management, performance record, discount; Sell: Negative on factors such as structure, management, performance record, discount. Core Banding Exceptions (CBE): Exceptions to the standard +/-6% bands may be granted by the Investment Review Committee (IRC). Factors considered by the IRC include the stock's volatility and the credit spread of the respective company's debt. As a result, stocks deemed to be very high or low risk may be subject to higher or lower bands as they relate to the rating. When such exceptions apply, they will be identified in the Company Disclosures table in the relevant research piece.
Research analysts contributing to this report who are employed by any non-US affiliate of UBS Securities LLC are not registered/qualified as research analysts with FINRA. Such analysts may not be associated persons of UBS Securities LLC and therefore are not subject to the FINRA restrictions on communications with a subject company, public appearances, and trading securities held by a research analyst account. The name of each affiliate and analyst employed by that affiliate contributing to this report, if any, follows.
UBS Securities Australia Ltd: Jonathan Mott; Rachel Bentvelzen.
Company Disclosures
Company Name Reuters 12-month rating Short-term rating Price Price date
Source: UBS. All prices as of local market close. Ratings in this table are the most current published ratings prior to this report. They may be more recent than the stock pricing date 2. UBS AG, its affiliates or subsidiaries has acted as manager/co-manager in the underwriting or placement of
securities of this company/entity or one of its affiliates within the past 12 months. 4. Within the past 12 months, UBS AG, its affiliates or subsidiaries has received compensation for investment banking
services from this company/entity or one of its affiliates. 5a. UBS AG, Australia Branch or an affiliate expect to receive or intend to seek compensation for investment banking
services from this company/entity within the next three months. 5b. UBS AG, its affiliates or subsidiaries expect to receive or intend to seek compensation for investment banking
services from this company/entity within the next three months. 6. This company/entity is, or within the past 12 months has been, a client of UBS Securities LLC, and investment
banking services are being, or have been, provided. 7. Within the past 12 months, UBS Securities LLC and/or its affiliates have received compensation for products and
services other than investment banking services from this company/entity. 16. UBS Securities LLC makes a market in the securities and/or ADRs of this company. 18. UBS Securities Australia Ltd is acting as broker to Australia & New Zealand Banking Group Ltd in relation to its
announced A$1.5bn on-market buyback, and may receive a fee for acting in this capacity. 22. UBS AG, its affiliates or subsidiaries held other significant financial interests in this company/entity as of last
month`s end (or the prior month`s end if this report is dated less than 10 working days after the most recent month`s end).
Unless otherwise indicated, please refer to the Valuation and Risk sections within the body of this report. For a complete set of disclosure statements associated with the companies discussed in this report, including information on valuation and risk, please contact UBS Securities LLC, 1285 Avenue of Americas, New York, NY 10019, USA, Attention: Investment Research.
Global Disclaimer This document has been prepared by UBS Securities Australia Ltd, an affiliate of UBS AG. UBS AG, its subsidiaries, branches and affiliates are referred to herein as UBS.
Global Research is provided to our clients through UBS Neo, in certain instances, UBS.com and any other system, or distribution method specifically identified in one or more communications distributed through UBS Neo or UBS.com as an approved means for distributing Global Research (each a "System"). It may also be made available through third party vendors and distributed by UBS and/or third parties via e-mail or alternative electronic means. The level and types of services provided by Global Research to a client may vary depending upon various factors such as a client's individual preferences as to the frequency and manner of receiving communications, a client's risk profile and investment focus and perspective (e.g., market wide, sector specific, long-term, short-term, etc.), the size and scope of the overall client relationship with UBS and legal and regulatory constraints.
All Global Research is available on UBS Neo. Please contact your UBS sales representative if you wish to discuss your access to UBS Neo.
When you receive Global Research through a System, your access and/or use of such Global Research is subject to this Global Research Disclaimer and to the terms of use governing the applicable System.
When you receive Global Research via a third party vendor, e-mail or other electronic means, you agree that use shall be subject to this Global Research Disclaimer, where applicable the UBS Investment Bank terms of business (https://www.ubs.com/global/en/investment-bank/regulatory.html) and to UBS's Terms of Use/Disclaimer (http://www.ubs.com/global/en/legalinfo2/disclaimer.html). In addition, you consent to UBS processing your personal data and using cookies in accordance with our Privacy Statement (http://www.ubs.com/global/en/legalinfo2/privacy.html) and cookie notice (http://www.ubs.com/global/en/homepage/cookies/cookie-management.html).
If you receive Global Research, whether through a System or by any other means, you agree that you shall not copy, revise, amend, create a derivative work, provide to any third party, or in any way commercially exploit any UBS research provided via Global Research or otherwise, and that you shall not extract data from any research or estimates provided to you via Global Research or otherwise, without the prior written consent of UBS.
This document is for distribution only as may be permitted by law. It is not directed to, or intended for distribution to or use by, any person or entity who is a citizen or resident of or located in any locality, state, country or other jurisdiction where such distribution, publication, availability or use would be contrary to law or regulation or would subject UBS to any registration or licensing requirement within such jurisdiction.
This document is a general communication and is educational in nature; it is not an advertisement nor is it a solicitation or an offer to buy or sell any financial instruments or to participate in any particular trading strategy. Nothing in this document constitutes a representation that any investment strategy or recommendation is suitable or appropriate to an investor’s individual circumstances or otherwise constitutes a personal recommendation. By providing this document, none of UBS or its representatives has any responsibility or authority to provide or have provided investment advice in a fiduciary capacity or otherwise. Investments involve risks, and investors should exercise prudence and their own judgment in making their investment decisions. None of UBS or its representatives is suggesting that the recipient or any other person take a specific course of action or any action at all. By receiving this document, the recipient acknowledges and agrees with the intended purpose described above and further disclaims any expectation or belief that the information constitutes investment advice to the recipient or otherwise purports to meet the investment objectives of the recipient. The financial instruments described in the document may not be eligible for sale in all jurisdictions or to certain categories of investors. Options, derivative products and futures are not suitable for all investors, and trading in these instruments is considered risky. Mortgage and asset-backed securities may involve a high degree of risk and may be highly volatile in response to fluctuations in interest rates or other market conditions. Foreign currency rates of exchange may adversely affect the value, price or income of any security or related instrument referred to in the document. For investment advice, trade execution or other enquiries, clients should contact their local sales representative.
The value of any investment or income may go down as well as up, and investors may not get back the full (or any) amount invested. Past performance is not necessarily a guide to future performance. Neither UBS nor any of its directors, employees or agents accepts any liability for any loss (including investment loss) or damage arising out of the use of all or any of the Information.
Prior to making any investment or financial decisions, any recipient of this document or the information should seek individualized advice from his or her personal financial, legal, tax and other professional advisors that takes into account all the particular facts and circumstances of his or her investment objectives.
Any prices stated in this document are for information purposes only and do not represent valuations for individual securities or other financial instruments. There is no representation that any transaction can or could have been effected at those prices, and any prices do not necessarily reflect UBS's internal books and records or theoretical model-based valuations and may be based on certain assumptions. Different assumptions by UBS or any other source may yield substantially different results.
No representation or warranty, either expressed or implied, is provided in relation to the accuracy, completeness or reliability of the information contained in any materials to which this document relates (the "Information"), except with respect to Information concerning UBS. The Information is not intended to be a complete statement or summary of the securities, markets or developments referred to in the document. UBS does not undertake to update or keep current the Information. Any opinions expressed in this document may change without notice and may differ or be contrary to opinions expressed by other business areas or groups, personnel or other representative of UBS. Any statements contained in this report attributed to a third party represent UBS's interpretation of the data, information and/or opinions provided by that third party either publicly or through a subscription service, and such use and interpretation have not been reviewed by the third party. In no circumstances may this document or any of the Information (including any forecast, value, index or other calculated amount ("Values")) be used for any of the following purposes:
(i) valuation or accounting purposes;
(ii) to determine the amounts due or payable, the price or the value of any financial instrument or financial contract; or
(iii) to measure the performance of any financial instrument including, without limitation, for the purpose of tracking the return or performance of any Value or of defining the asset allocation of portfolio or of computing performance fees.
By receiving this document and the Information you will be deemed to represent and warrant to UBS that you will not use this document or any of the Information for any of the above purposes or otherwise rely upon this document or any of the Information.
UBS has policies and procedures, which include, without limitation, independence policies and permanent information barriers, that are intended, and upon which UBS relies, to manage potential conflicts of interest and control the flow of information within divisions of UBS and among its subsidiaries, branches and affiliates. For further information on the ways in which UBS manages conflicts and maintains independence of its research products, historical performance information and certain additional disclosures concerning UBS research recommendations, please visit www.ubs.com/disclosures.
Research will initiate, update and cease coverage solely at the discretion of UBS Research Management, which will also have sole discretion on the timing and frequency of any published research product. The analysis contained in this document is based on numerous assumptions. All material information in relation to published research reports, such as valuation methodology, risk statements, underlying assumptions (including sensitivity analysis of those assumptions), ratings history etc. as required by the Market Abuse Regulation, can be found on UBS Neo. Different assumptions could result in materially different results.
The analyst(s) responsible for the preparation of this document may interact with trading desk personnel, sales personnel and other parties for the purpose of gathering, applying and interpreting market information. UBS relies on information barriers to control the flow of information contained in one or more areas within UBS into other areas, units, groups or affiliates of UBS. The compensation of the analyst who prepared this document is determined exclusively by research management and senior management (not including investment banking). Analyst compensation is not based on investment banking revenues; however, compensation may relate to the revenues of UBS and/or its divisions as a whole, of which investment banking, sales and trading are a part, and UBS's subsidiaries, branches and affiliates as a whole.
For financial instruments admitted to trading on an EU regulated market: UBS AG, its affiliates or subsidiaries (excluding UBS Securities LLC) acts as a market maker or liquidity provider (in accordance with the interpretation of these terms in the UK) in the financial instruments of the issuer save that where the activity of liquidity provider is carried out in accordance with the definition given to it by the laws and regulations of any other EU jurisdictions, such information is separately disclosed in this document. For financial instruments admitted to trading on a non-EU regulated market: UBS may act as a market maker save that where this activity is carried out in the US in accordance with the definition given to it by the relevant laws and regulations, such activity will be specifically disclosed in this document. UBS may have issued a warrant the value of which is based on one or more of the financial instruments referred to in the document. UBS and its affiliates and employees may have long or short positions, trade as principal and buy and sell in instruments or derivatives identified herein; such transactions or positions may be inconsistent with the opinions expressed in this document.
United Kingdom and the rest of Europe: Except as otherwise specified herein, this material is distributed by UBS Limited to persons who are eligible counterparties or professional clients. UBS Limited is authorised by the Prudential Regulation Authority and regulated by the Financial Conduct Authority and the Prudential Regulation Authority. France: Prepared by UBS Limited and distributed by UBS Limited and UBS Securities France S.A. UBS Securities France S.A. is regulated by the ACPR (Autorité de Contrôle Prudentiel et de Résolution) and the Autorité des Marchés Financiers (AMF). Where an analyst of UBS Securities France S.A. has contributed to this document, the document is also deemed to have been prepared by UBS Securities France S.A. Germany: Prepared by UBS Limited and distributed by UBS Limited and UBS Europe SE. UBS Europe SE is regulated by the Bundesanstalt fur Finanzdienstleistungsaufsicht (BaFin). Spain: Prepared by UBS Limited and distributed by UBS Limited and UBS Securities España SV, SA. UBS Securities España SV, SA is regulated by the Comisión Nacional del Mercado de Valores (CNMV). Turkey: Distributed by UBS Limited. No information in this document is provided for the purpose of offering, marketing and sale by any means of any capital market instruments and services in the Republic of Turkey. Therefore, this document may not be considered as an offer made or to be made to residents of the Republic of Turkey. UBS Limited is not licensed by the Turkish Capital Market Board under the provisions of the Capital Market Law (Law No. 6362). Accordingly, neither this document nor any other offering material related to the instruments/services may be utilized in connection with providing any capital market services to persons within the Republic of Turkey without the prior approval of the Capital Market Board. However, according to article 15 (d) (ii) of the Decree No. 32, there is no restriction on the purchase or sale of the securities abroad by residents of the Republic of Turkey. Poland: Distributed by UBS Limited (spolka z ograniczona odpowiedzialnoscia) Oddzial w Polsce regulated by the Polish Financial Supervision Authority. Where an analyst of UBS Limited (spolka z ograniczona odpowiedzialnoscia) Oddzial w Polsce has contributed to this document, the document is also deemed to have been prepared by UBS Limited (spolka z ograniczona odpowiedzialnoscia) Oddzial w Polsce. Russia: Prepared and distributed by UBS Bank (OOO). Switzerland: Distributed by UBS AG to persons who are institutional investors only. UBS AG is regulated by the Swiss Financial Market Supervisory Authority (FINMA). Italy: Prepared by UBS Limited and distributed by UBS Limited and UBS Limited, Italy Branch. Where an analyst of UBS Limited, Italy Branch has contributed to this document, the document is also deemed to have been prepared by UBS Limited, Italy Branch. South Africa: Distributed by UBS South Africa (Pty) Limited (Registration No. 1995/011140/07), an authorised user of the JSE and an authorised Financial Services Provider (FSP 7328). Israel: This material is distributed by UBS Limited. UBS Limited is authorised by the Prudential Regulation Authority and regulated by the Financial Conduct Authority and the Prudential Regulation Authority. UBS Securities Israel Ltd is a licensed Investment Marketer that is supervised by the Israel Securities Authority (ISA). UBS Limited and its affiliates incorporated outside Israel are not licensed under the Israeli Advisory Law. UBS Limited is not covered by insurance as required from a licensee under the Israeli Advisory Law. UBS may engage among others in issuance of Financial Assets or in distribution of Financial Assets of other issuers for fees or other benefits. UBS Limited and its affiliates may prefer various Financial Assets to which they have or may have Affiliation (as such term is defined under the Israeli Advisory Law). Nothing in this Material should be considered as investment advice under the Israeli Advisory Law. This Material is being issued only to and/or is directed only at persons who are Eligible Clients within the meaning of the Israeli Advisory Law, and this material must not be relied on or acted upon by any other persons. Saudi Arabia: This document has been issued by UBS AG (and/or any of its subsidiaries, branches or affiliates), a public company limited by shares, incorporated in Switzerland with its registered offices at Aeschenvorstadt 1, CH-4051 Basel and Bahnhofstrasse 45, CH-8001 Zurich. This publication has been approved by UBS Saudi Arabia (a subsidiary of UBS AG), a Saudi closed joint stock company incorporated in the Kingdom of Saudi Arabia under commercial register number 1010257812 having its registered office at Tatweer Towers, P.O. Box 75724, Riyadh 11588, Kingdom of Saudi Arabia. UBS Saudi Arabia is authorized and regulated by the Capital Market Authority to conduct securities business under license number 08113-37. UAE / Dubai: The information distributed by UBS AG Dubai Branch is only intended for Professional Clients and/or Market Counterparties, as classified under the DFSA rulebook. No other person should act upon this material/communication. The information is not for further distribution within the United Arab Emirates. UBS AG Dubai Branch is regulated by the DFSA in the DIFC. UBS is not licensed to provide banking services in the UAE by the Central Bank of the UAE, nor is it licensed by the UAE Securities and Commodities Authority. United States: Distributed to US persons by either UBS Securities LLC or by UBS Financial Services Inc., subsidiaries of UBS AG; or by a group, subsidiary or affiliate of UBS AG that is not registered as a US broker-dealer (a ‘non-US affiliate’) to major US institutional investors only. UBS Securities LLC or UBS Financial Services Inc. accepts responsibility for the content of a document prepared by another non-US affiliate when distributed to US persons by UBS Securities LLC or UBS Financial Services Inc. All transactions by a US person in the securities mentioned in this document must be effected through UBS Securities LLC or UBS Financial Services Inc., and not through a non-US affiliate. UBS Securities LLC is not acting as a municipal advisor to any municipal entity or obligated person within the meaning of Section 15B of the Securities Exchange Act (the "Municipal Advisor Rule"), and the opinions or views contained herein are not intended to be, and do not constitute, advice within the meaning of the Municipal Advisor Rule. Canada: Distributed by UBS Securities Canada Inc., a registered investment dealer in Canada and a Member-Canadian Investor Protection Fund, or by another affiliate of UBS AG that is registered to conduct business in Canada or is otherwise exempt from registration. Mexico: This report has been distributed and prepared by UBS Casa de Bolsa, S.A. de C.V., UBS Grupo Financiero, an entity that is part of UBS Grupo Financiero, S.A. de C.V. and is a subsidiary of UBS AG. This document is intended for distribution to institutional or sophisticated investors only. Research reports only reflect the views of the analysts responsible for the reports. Analysts do not receive any compensation from persons or entities different from UBS Casa de Bolsa, S.A. de C.V., UBS Grupo Financiero, or different from entities belonging to the same financial group or business group of such. For Spanish translations of applicable disclosures, please go to www.ubs.com/disclosures. Brazil: Except as otherwise specified herein, this material is prepared by UBS Brasil CCTVM S.A. to persons who are eligible investors residing in Brazil, which are considered to be: (i) financial institutions, (ii) insurance firms and investment capital companies, (iii) supplementary pension entities, (iv) entities that hold financial investments higher than R$300,000.00 and that confirm the status of qualified investors in written, (v) investment funds, (vi) securities portfolio managers and securities consultants duly authorized by Comissão de Valores Mobiliários (CVM), regarding their own investments, and (vii) social security systems created by the Federal Government, States, and Municipalities. Hong Kong: Distributed by UBS Securities Asia Limited and/or UBS AG, Hong Kong Branch. Please contact local licensed/registered representatives of UBS Securities Asia Limited and/or UBS AG, Hong Kong Branch in respect of any matters arising from, or in connection with, the analysis or document. Singapore: Distributed by UBS Securities Pte. Ltd. [MCI (P) 008/09/2017 and Co. Reg. No.: 198500648C] or UBS AG, Singapore Branch. Please contact UBS Securities Pte. Ltd., an exempt financial adviser under the Singapore Financial Advisers Act (Cap. 110); or UBS AG, Singapore Branch, an exempt financial adviser under the Singapore Financial Advisers Act (Cap. 110) and a wholesale bank licensed under the Singapore Banking Act (Cap. 19) regulated by the Monetary Authority of Singapore, in respect of any matters arising from, or in connection with, the analysis or document. The recipients of this document represent and warrant that they are accredited and institutional investors as defined in the Securities and Futures Act (Cap. 289). Japan: Distributed by UBS Securities Japan Co., Ltd. to professional investors (except as otherwise permitted). Where this document has been prepared by UBS Securities Japan Co., Ltd., UBS Securities Japan Co., Ltd. is the author, publisher and distributor of the document. Distributed by UBS AG, Tokyo Branch to Professional Investors (except as otherwise permitted) in relation to foreign exchange and other banking businesses when relevant. Australia: Clients of UBS AG: Distributed by UBS AG (ABN 47 088 129 613 and holder of Australian Financial Services License No. 231087). Clients of UBS Securities Australia Ltd: Distributed by UBS Securities Australia Ltd (ABN 62 008 586 481 and holder of Australian Financial Services License No. 231098). This Document contains general information and/or general advice only and does not constitute personal financial product advice. As such, the Information in this document has been prepared without taking into account any investor’s objectives, financial situation or needs, and investors should, before acting on the Information, consider the appropriateness of the Information, having regard to their objectives, financial situation and needs. If the Information contained in this document relates to the acquisition, or potential acquisition of a particular financial product by a ‘Retail’ client as defined by section 761G of the Corporations Act 2001 where a Product Disclosure Statement would be required, the retail client should obtain and consider the Product Disclosure Statement relating to the product before making any decision about whether to acquire the product. The UBS Securities Australia Limited Financial Services Guide is available at: www.ubs.com/ecs-research-fsg. New Zealand: Distributed by UBS New Zealand Ltd. UBS New Zealand Ltd is not a registered bank in New Zealand. You are being provided with this UBS publication or material because you have indicated to UBS that you are a “wholesale client” within the meaning of section 5C of the Financial Advisers Act 2008 of New Zealand (Permitted Client). This publication or material is not intended for clients who are not Permitted Clients (non-permitted Clients). If you are a non-permitted Client you must not rely on this publication or material. If despite this warning you nevertheless rely on this publication or material, you hereby (i) acknowledge that you may not rely on the content of this publication or material and that any recommendations or opinions in such this publication or material are not made or provided to you, and (ii) to the maximum extent permitted by law (a) indemnify UBS and its associates or related entities (and their respective Directors, officers, agents and Advisors) (each a ‘Relevant Person’) for any loss, damage, liability or claim any of them may incur or suffer as a result of, or in connection with, your unauthorised reliance on this publication or material and (b) waive any rights or remedies you may have against any Relevant Person for (or in respect of) any loss, damage, liability or claim you may incur or suffer as a result of, or in connection with, your unauthorised reliance on this publication or material. Korea: Distributed in Korea by UBS Securities Pte. Ltd., Seoul Branch. This document may have been edited or contributed to from time to time by affiliates of UBS Securities Pte. Ltd., Seoul Branch. This material is intended for professional/institutional clients only and not for distribution to any retail clients. Malaysia: This material is authorized to be distributed in Malaysia by UBS Securities Malaysia Sdn. Bhd (Capital Markets Services License No.: CMSL/A0063/2007). This material is intended for professional/institutional clients only and not for distribution to any retail clients. India: Distributed by UBS Securities India Private Ltd. (Corporate Identity Number U67120MH1996PTC097299) 2/F, 2 North Avenue, Maker Maxity, Bandra Kurla Complex, Bandra (East), Mumbai (India) 400051. Phone: +912261556000. It provides brokerage services bearing SEBI Registration Numbers: NSE (Capital Market Segment): INB230951431, NSE (F&O Segment) INF230951431, NSE (Currency Derivatives Segment) INE230951431, BSE (Capital Market Segment) INB010951437; merchant banking services bearing SEBI Registration Number: INM000010809 and Research Analyst services bearing SEBI Registration Number: INH000001204. UBS AG, its affiliates or subsidiaries may have debt holdings or positions in the subject Indian company/companies. Within the past 12 months, UBS AG, its affiliates or subsidiaries may have received compensation for non-investment banking securities-related services and/or non-securities services from the subject Indian company/companies. The subject company/companies may have been a client/clients of UBS AG, its affiliates or subsidiaries during the 12 months preceding the date of distribution of the research report with respect to investment banking and/or non-investment banking securities-related services and/or non-securities services. With regard to information on associates, please refer to the Annual Report at:
http://www.ubs.com/global/en/about_ubs/investor_relations/annualreporting.htmlTaiwan: Distributed by UBS Securities Pte. Ltd., Taipei Branch which is regulated by the Taiwan Securities and Futures Bureau.
The disclosures contained in research documents produced by UBS Limited shall be governed by and construed in accordance with English law.