Australian commodities • vol 15 no 2 • June quarter 2008 325
Economic overview
Economic overviewProspects for world economic growth
Marina Kim and Jammie Penm
• World economic growth is assumed to average 4.0 per cent in both 2008 and 2009, compared with 4.9 per cent in 2007.
• While growth in the OECD economies, particularly in the United States, is likely to slow down in the short-term, continued robust performance in the emerging market economies is expected to provide support for world economic growth.
• In Australia, economic growth is assumed to be around 2.75 per cent in 2008-09, compared with an estimated 3.5 per cent in 2007-08.
Global economic prospects
World economic growth has slowedAfter four years of strong growth at nearly 5 per cent a year, global economic activity has slowed. The slowdown has been most significant in the OECD economies, par ticularly in the United States, where ongoing weakness in the housing market exacerbated financial market concerns. Among other OECD economies, growth in western Europe has moderated, although activity in Japan has been relatively resilient.
By contrast, economic per formance in the emerging market and devel-oping economies continued to be robust, notwithstanding some slowing in economic activity in mid-2008. China and India, which grew at 11. 4 per cent and 9.2 per cent respectively in 2007, have been the strongest economic per formers. As these countries progressively integrate into the global economy, the growth momentum is being generated by continued strong productivity gains and streng thening public policy frameworks.
Concerns about fi nancial market instability Conditions in world financial markets have remained strained, with both bank and non-bank channels of credit being affected by the US subprime market problems. The turmoil was initiated by rapidly rising defaults on US mor tgages in the course of a correction in the US housing market, which has triggered a decline in the value of mor tgage-related assets. The financial market instability has extended beyond the subprime mor tgage sector, cur tailing financial market liquidity and prompting the re-pricing of risks across a broad range of assets.
326 Australian commodities • vol 15 no 2 • June quarter 2008
Economic overview
In response, central banks in the major OECD economies have provided commercial banks with greater access to shor t-term funding in order to broaden their lending capacity. While sentiment in financial markets has improved in recent months, significant uncer tainty continues as the banking sector worldwide remains vulnerable to any fur ther weakness in financial markets. If it were to occur, another substantial increase in financial market instability could adversely affect the world economic outlook.
Commodity demand and prices have been resilientDespite slowing global economic growth, world commodity demand, and hence prices, have remained buoyant. The strong per formance of commodity markets over the past few years has been the result of both supply and demand factors. On the demand side, a major factor providing strong suppor t for commodity prices is a sharp increase in commodity demand in the emerging market economies, especially for mineral resources. More recently, increased demand for feedstock in biofuel production in many OECD economies, including the United States and those in western Europe, has par tly driven a significant increase in prices of many food crops. On the supply side, production responses to higher prices have been lagging, par ticularly for oil, iron ore and coal. Stock as a share of consumption for many commodities have remained at historical lows.
Higher food and energ y prices have led to concerns about inflationar y pressures around the world. The increase in inflationar y pressures has been more significant in the emerging market economies, reflecting both strong demand growth and the greater weight of energ y and food in their consumption baskets. In response, monetar y policy has been tightened in China and several South East Asian economies. A number of Asian coun-tries, including Viet Nam and India, have placed temporar y restrictions on staple food expor ts in an attempt to reduce upward pressures on domestic food prices.
Weaker global economic growth in the short-termOne major issue in the current world economic outlook is the duration of the economic slowdown in the United States, the largest economy in the world. In the past, economic slowdowns in the United States have typically been relatively shor t, followed by vigorous recoveries, as sharp correc-tions generally help resolve economic and financial imbalances especially in the presence of significant monetar y and fiscal stimuli. During the current economic weakness, key determinants of the ability of the US economy to recover quickly are associated with the future course of the housing and financial markets, and theireffects on household spending and business investment.
Australian commodities • vol 15 no 2 • June quarter 2008 327
Australian exchange ratesUS$/A$ 0.75 0.78 0.90 0.90Yen/A$ 85 93 99 99TWI for A$ h 63 65 70 70a Indonesia, Malaysia, the Philippines, Singapore and Thailand. b Excludes Hong Kong. c Weighted using 2007 purchasing-power-parity (PPP) valuation of country GDPs by the IMF. d Commercial bank prime lending rates in the United States. e Average of daily rates. g Large business weighted average variable rate on credit outstanding. h Base: May 1970 = 100. f ABARE assumptions. Sources: ABARE; ABS; IMF; OECD; RBA.
Key macroeconomic assumptions
Economic overview
After peaking in late 2005 , the US housing market has undergone a signifi-cant correction, with monthly housing star ts in early 2008 falling by more than 50 per cent from their recent peak. However, while the US housing market remains vulnerable to a fur ther decline in activity, commercial banks in the United States have been able to secure new funding sources. Thus, although credit has been squeezed, a full-blown credit crunch appears unlikely at this stage.
328 Australian commodities • vol 15 no 2 • June quarter 2008
Reflecting these developments, economic growth in the United States is assumed to remain relatively weak in the next few quar ters, before a gradual recover y in 2009. A recover y in economic growth in the United States is expected to provide suppor t for economic activity in other major world economies, including Japan, China and western Europe.
In preparing this set of commodity forecasts, world economic growth is assumed to average around 4 .0 per cent in both 2008 and 2009. This compares with growth of 4 .9 per cent in 2007.
Stimulus from emerging market economiesWhile a gradual recover y is assumed to occur in many OECD economies in 2009, a major contribution to world economic growth is likely to come from the emerging market economies, suppor ted by continued solid growth in their domestic demand. In China, economic growth is likely to ease, with rising consumption spending and continued strong fixed asset investment helping to par tially offset slowing growth in expor ts. In India, weaker expor t demand and higher financing costs are likely to dampen growth in private investment. For other emerging market economies in South East Asia, Latin America and eastern Europe, growth is assumed to moderate in the shor t-term but continue to be above trend.
Risks to the short-term economic outlookWhile world economic growth is assumed to gradually streng then in the next few quar ters, there remain a number of risk factors that could affect global economic prospects.
On the downside, world financial market conditions continue to be a major source of concern. Fur ther substantial losses in the financial sector, as a result of continued weakness in the mor tgage market, could lead to a deterioration of the credit market situation and adverse spillover effects on business lending in many par ts of the world.
Recent sharp increases in oil and food prices have also raised concerns about the significant upward pressures on inflation in many countries. The concern is par ticularly acute in emerging market economies where food and energ y often represent around 50 per cent of consumption baskets and monetar y policy response mechanisms are less well developed. Rising food and energ y costs have the potential to rapidly feed into other prices and wages in many emerging market economies, leading to higher domestic interest rates which can adversely affect economic growth.
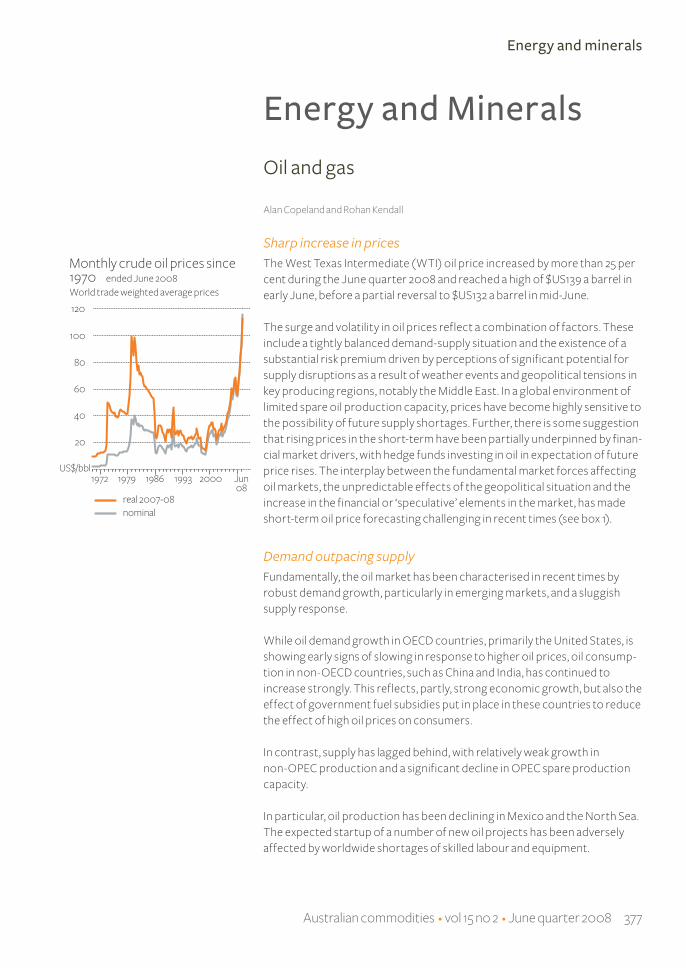
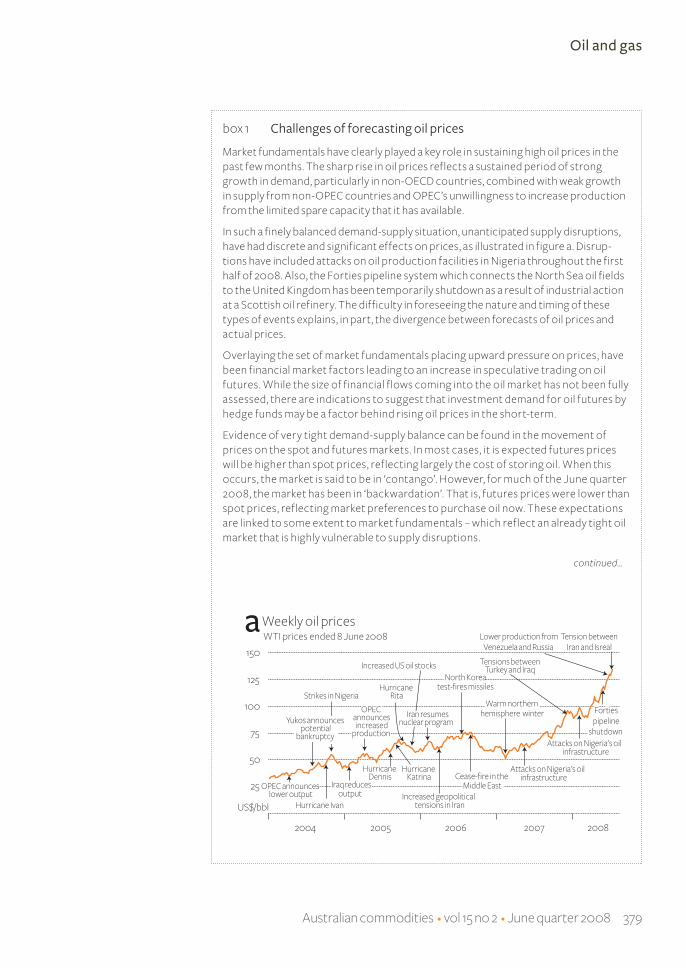
In par ticular, consumption and production remain finely balanced in the world oil market, with prices increasing to a recent high of US$139 a barrel (for West Texas Intermediate oil) in mid-2008. With spare productive
Economic overview
Australian commodities • vol 15 no 2 • June quarter 2008 329
capacity at historically low levels, unexpected supply shocks or heightened geopolitical tensions could lead to significant oil price spikes and quickly translate into higher inflationar y pressures in impor ting countries.
On the upside, domestic demand growth in the emerging market econo-mies could prove to be more resilient than currently expected.
In par ticular, the easing of economic growth in China could be more moderate than currently assumed, especially if domestic consumption continues to gather speed and policy measures aimed at slowing invest-ment growth fail to have the intended effect.
In contrast to previous periods of global financial market disruption, the spillovers of the US subprime market problems to the emerging market economies have so far been largely contained. Despite higher borrowing costs and lower equity prices, most emerging market economies have maintained relatively robust economic growth rates. Similarly, trade spillo-vers from slowing activity in the OECD economies to the emerging market economies have been relatively limited.
Rapid grow th in the emerging market economies in recent years has been suppor ted by productivit y gains from increased integration into the global economy and improved macroeconomic policy frameworks. In some countries, an improved public sector budgetar y situation has the potential to provide greater suppor t for economic activit y than in the past, should a more negative external environment emerge. In China, for example, the fiscal consolidation in the past few years has provided the Chinese Government with a greater abilit y to use fiscal measures to suppor t the economy.
Australia’s major export markets
US economic growth to easeFollowing a mild slowdown in 2007, economic activity in the United States weakened further in early 2008, growing at an annual rate of 0.6 per cent in the March quarter 2008. Net exports provided a boost to growth, although residential investment continued to exert a significant drag on the economy.
Par tial indicators released in mid-2008 have provided signals of a marked weakening in economic growth, largely reflecting the effect of recent financial market instability and problems in the housing market. Housing market indicators have been weak and consumer and business sentiment, and manufacturing activity, are also declining.
In the shor t-term, continued difficulties in the mor tgage market are expected to extend the decline in residential investment, while house price
Economic overview
330 Australian commodities • vol 15 no 2 • June quarter 2008
declines are likely to dampen household consumption spending. In contrast, expor ts are expected to grow strongly, benefiting from the decline in the value of the US dollar.
Reflecting these considerations, it is assumed that the US economy will remain relatively weak in the remainder of 2008, before a gradual recover y in 2009. Compared with the 2001 recession, economic recover y in 2009 is assumed to be more gradual, reflecting the time required for household and financial institutions to rebuild their balance sheets.
On an annual basis, growth in the US economy is assumed to slow to 0.8 per cent in 2008, before being expected to rise modestly to 1.5 per cent in 2009.
Risks around these growth assumptions are weighted to the downside, par ticularly for 2009. Continued weakness in financial and housing markets could lead to lower business investment and consumer spending. Never the-less, concerns have been par tially alleviated by vigorous policy responses, par ticularly those providing liquidity to financial markets.
Given this economic outlook, monetar y policy in the United States is expected to remain accommodative in the shor t-term. The federal funds rate was at 2.0 per cent in mid-2008, compared with 5 .25 per cent in the same period a year earlier. With core inflation still elevated and prospects for continued high and volatile energ y and food prices, there remain concerns about an increase in inflationar y pressures. However, the infla-tion risk should recede as spare capacity emerges and the labour market sof tens.
Economic growth in China to remain robustThe pace of economic growth in China moderated slightly in early 2008. Real gross domestic product expanded at an estimated year on year rate of 10.6 per cent in the first quar ter of 2008, compared with 11.2 per cent in the previous quar ter. Major contributors to economic growth in the March quar ter were higher investment expenditure, consumption spending and net expor ts.
The streng th of domestic demand and rising food and energ y prices have contributed to a buildup of inflationar y pressures in China. Inflation rose to a year on year rate of 7.7 per cent in May 2008. In response, the central bank has maintained a tight monetar y policy, fur ther raising the reser ve require-ments for bank lending in the first half of 2008. Domestic interest rates, however, have been left unchanged since late 2007.
Grow th prospects in China remain dependent on the size of financial and tr ade spillovers from the slowdown in the OECD economies, especially the United States. Although foreign direct investment in China could slow
Economic overview
Australian commodities • vol 15 no 2 • June quarter 2008 331
down in the shor t-term as a result of the tightening of global credit condi-tions, the direct ef fect on China’s economic per formance is expected to be limited.
Growth in China’s expor ts, par ticularly to the United States and western Europe, is likely to be adversely affected. However, the streng th of domestic demand in China is expected to provide suppor t to the overall economic growth. Against this backdrop, economic growth in China is assumed to be 10.0 per cent in 2008, before easing to 9.5 per cent in 2009.
Risks to China’s economic outlook remain broadly balanced at this stage. On the downside, a sharper than anticipated slowdown in the OECD economies has the potential to adversely affect China’s growth prospects, dampening investment spending and expor ts. On the upside, domestic demand could be more resilient to monetar y tightening measures and weaker external demand. It is also likely that China will provide fiscal stimulus to suppor t economic activity, should economic growth decline significantly.
Japan’s economic growth prospectsJapan’s economic expansion continued in early 2008, despite a slowdown in global economic growth. Gross domestic product, in real terms, grew at an annualised rate of 3 .3 per cent in the March quar ter 2008. Expor t per form-ance has continued to be robust, suppor ted by demand from other Asian economies and western Europe. After a contraction in the second half of 2007, residential investment rebounded in early 2008. Higher household consumption spending has par tly offset a decline in business investment expenditure.
Par tial indicators released recently indicate that the growth momentum could slow in the shor t-term. For example, the Bank of Japan’s latest Tankan repor t suggests business confidence has declined, with companies planning to cut capital investment spending. Consumer confidence has also fallen and there are indications expor t growth could ease in the shor t-term.
Weaker expor t growth as a result of a global economic slowdown is a key risk to the economic outlook for Japan. Emerging market economies in Asia, including China and many South East Asian countries, have become a destination for around one half of Japan’s expor ts, while the impor tance of the United States and the euro area has declined. Therefore, Japan’s expor t per formance prospects are linked to the economic per formance in the emerging market economies in Asia.
Lower domestic demand than currently assumed is another source of downside risk to Japan’s economic outlook. Higher food and energ y prices and slow wage growth could dampen household consumption, and busi-ness investment could moderate fur ther if the global credit conditions were
Economic overview
332 Australian commodities • vol 15 no 2 • June quarter 2008
to tighten. However, the exposure of Japan’s financial sector to global finan-cial market difficulties is relatively low as it has limited direct involvement in US subprime mor tgage related assets.
Economic growth in Japan is assumed to be around 1.3 per cent in 2008 and 1.5 per cent in 2009. This compares with growth of 2.1 per cent in 2007.
Growth prospects for non-OECD AsiaGrowth in non-OECD Asia (excluding Japan and the Republic of Korea) remained relatively robust in late 2007 and into 2008, although the pace of expansion has eased in some regional economies. In India, for example, economic growth slowed to 8. 4 per cent in year on year terms in the December quar ter 2007, down from 8.9 per cent in the September quar ter and 9.3 per cent in the June quar ter. Tighter monetar y conditions in India appear to have dampened consumer spending and hence industrial output in recent months.
Relatively strong domestic demand, led by growth in consumption, is suppor ting economic activity in Indonesia, Malaysia, the Philippines and Singapore. While expor t growth has remained relatively strong in the Republic of Korea and Thailand, high energ y prices are weighing on consumer demand in these economies.
Inflationar y pressures have begun to emerge in many South East Asian economies, including Indonesia, Thailand and the Philippines. In India, monetar y tightening in early 2007 led to an easing of inflationar y pres-sures later in the year. However, inflation has star ted to pickup once again since early 2008 owing to higher commodity prices. There is rising concern that sustained food price increases could spillover into wages and spark a broader pickup in inflation in non-OECD Asia.
Economic overview
Australian commodities • vol 15 no 2 • June quarter 2008 333
Trade spillovers from the slowdown in the OECD economies, combined with inflationar y pressures, are the key downside risks to growth prospects of this region. On the upside, rising consumption and continuing strong invest-ment in most countries are likely to help balance the effect of slower expor t growth, with economic growth in China expected to continue providing suppor t to expor t per formance in many regional economies.
For non-OECD Asia as a whole, economic growth is assumed to average around 7.6 per cent in both 2008 and 2009, compared with growth of 9.1 per cent in 2007.
Economic prospects in AustraliaAfter growing strongly in the first three quar ters of 2007, economic activity in Australia eased at the end of the year and in early 2008. Real gross domestic product, seasonally adjusted, rose by 0.6 per cent in the March quar ter 2008.This compares with growth of 1.3 per cent in the same period a year earlier. While the unemployment rate has edged up in recent months, it remains at historically low levels.
Australia’s current account imbalance widened in early 2008, with a season-ally adjusted deficit of $19.5 billion recorded in the March quar ter 2008. This compares with a deficit of $18.7 billion in the December quar ter 2008. The trade account recorded a seasonally adjusted deficit of around $8.0 billion in the March quar ter 2008, compared with a deficit of $6.6 billion in the December quar ter 2007.
The Australian economy is expected to continue to benefit from higher commodity expor t earnings. While a slowdown in global economic growth could dampen demand for mineral resources, a continued tight balance between consumption and production in many markets is expected to provide suppor t for world prices.
Under the assumption of a return to average seasonal conditions, the rural sector is forecast to recover in 2008-09. However, the actual timing and distribution of rainfall will have an impor tant effect on the prospects for rural production and expor ts. For 2008-09 as a whole, the volume of farm production is forecast to increase by around 10.0 per cent. The volume of crop production is forecast to expand by 21.7 per cent in 2008-09, while livestock production is forecast to fall slightly by 1.6 per cent.
Economic growth in Australia is assumed to average around 2.75 per cent in 2008-09, following estimated growth of 3 .5 per cent in 2007-08. Household consumption and business investment are likely to be the main contributors to economic growth in 2008-09. The recover y in farm production is fore-cast to contribute around 0.5 per cent to economic growth in 2008-09.
a Large business weighted average variable rate on credit outstanding.
Economic overview
334 Australian commodities • vol 15 no 2 • June quarter 2008
Infl ationProductive capacity constraints, combined with strong domestic demand growth, have contributed to an increase in Australia’s inflation rate. The consumer price index rose by 1.3 per cent in the March quar ter 2008, compared with an increase of 0.9 per cent in the December quar ter 2007. On an annual basis, Australia’s consumer price index was 4 .2 per cent higher year on year in the March quar ter 2008. Contributing most to the increase in the March quar ter were rises in food, fuel and housing costs.
Looking for ward, inflationar y pressures in Australia are likely to ease gradu-ally, par tly reflecting the effects of higher domestic interest rates and a tighter fiscal policy stance on economic activity. For 2008-09 as a whole, Australia’s inflation rate is assumed to average around 3 .5 per cent. This compares with an estimated 4 .0 per cent in 2007-08.
Exchange rateOver the past year, the Australian dollar has appreciated markedly both against the US dollar and on a trade weighted basis. The Australian dollar was trading around US94c and TWI 72 in mid-June 2008, compared with US84c and TWI 68 in mid-June 2007.
A key factor contributing to the recent appreciation of the Australian dollar is the weakness of the US dollar against most other major currencies. For example, the US dollar was trading around 0.64 euros in mid-June 2008. This compares with 0.75 euros in the same period a year earlier. Recent movements in the US dollar have been affected by the continued uneasiness in financial markets, as well as weakening US growth prospects.
Another factor continuing to provide strong suppor t for the Australian exchange rate is the significant rise in Australia’s terms of trade. In the December quar ter 2007, for example, Australia’s terms of trade were around 23 per cent higher compared with the same period in 2004 . Significant suppor t for a stronger Australian dollar, especially against the US dollar, has also come from a widening interest rate differential between Australia and the United States. Interest rates have been increasing in Australia in recent months, while monetar y policy in the United States has been easing.
Looking for ward, the previously mentioned factors are expected to continue to af fect movements in the Austr alian exchange r ate in the shor t-term. Movements in Austr alian interest r ates depend on the outlook for economic grow th and inflation. Given the outlook for continued inflationar y pressures in the domestic economy, Austr alian interest r ates are likely to remain relatively high in the shor t-term. In preparing this set of commodit y forecasts, the prime lending r ates in
Economic overview
Australian commodities • vol 15 no 2 • June quarter 2008 335
Austr alia are assumed to aver age around 7.5 per cent in 2008- 09, similar to the aver age in 2007- 08 .
Reflecting the assumption of a gradual economic recover y in the United States, there is a distinct possibility the US dollar will remain relatively weak in the shor t-term. The Australian dollar is consequently assumed to remain relatively strong, averaging around US90c and TWI 70 in both 2007-08 and 2008-09.
There is considerable uncer tainty surrounding the shor t-term outlook for the Australian dollar, as movements in the Australian exchange rate can be significantly influenced by changes in financial market sentiment. Given the volatility of movements in the Australian dollar, it remains impor tant for primar y producers and expor ters to manage the risks associated with fluctuations in the Australian exchange rate.
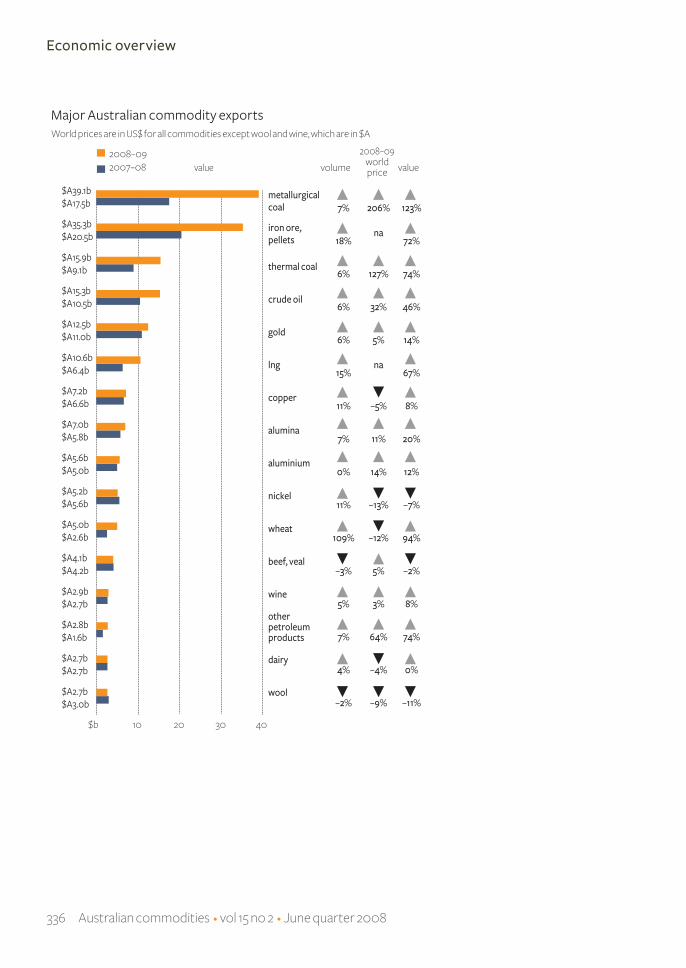
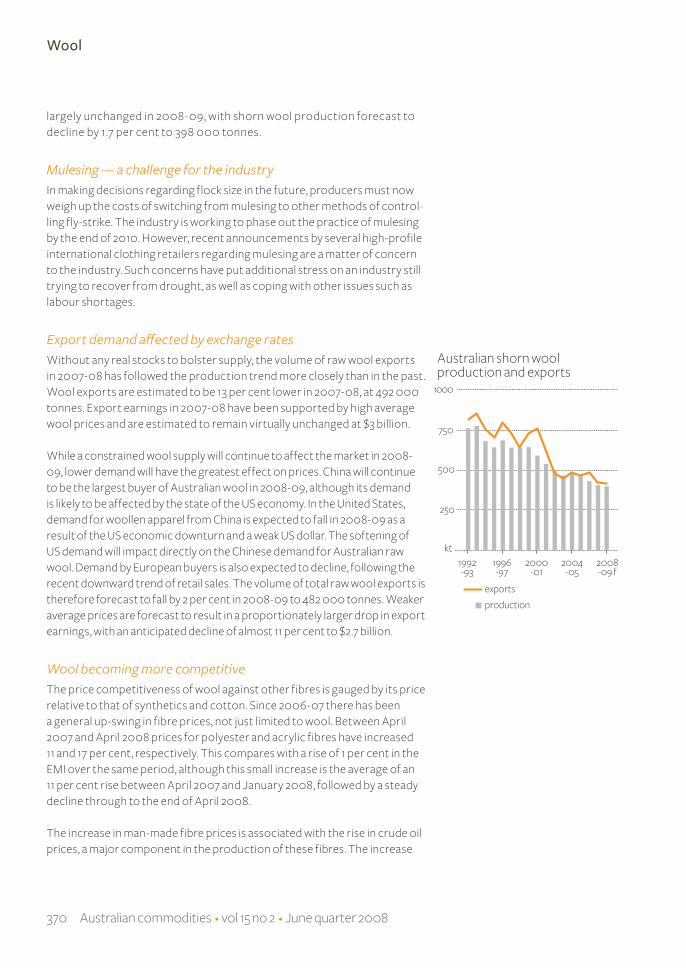
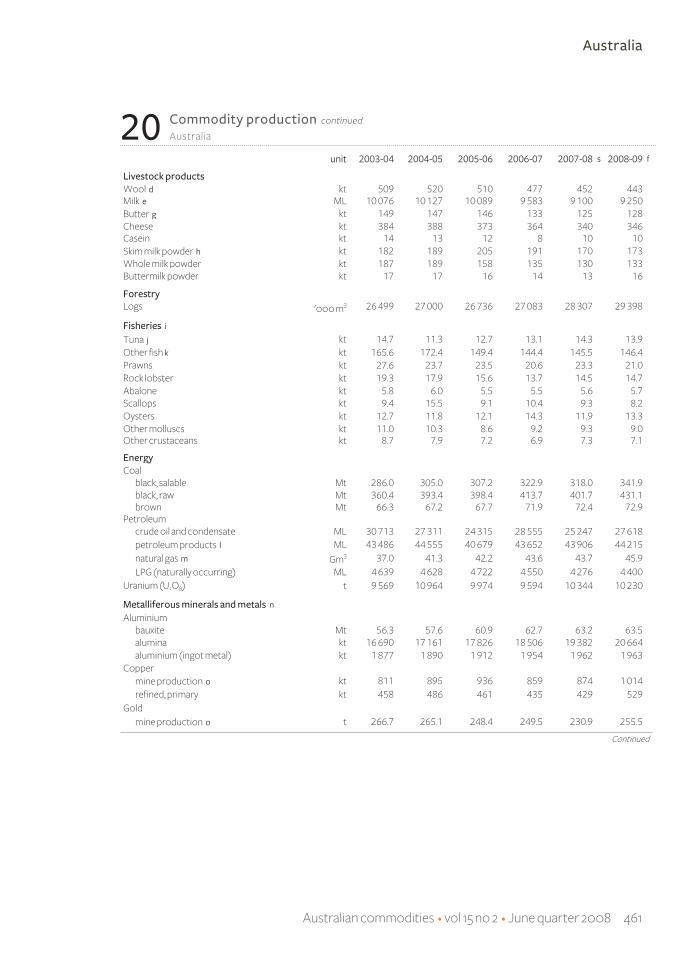
Commodity export prices up sharply in 2008-09The index of unit expor t returns for Australian commodities, in aggregate, is forecast to rise considerably in 2008-09, following a rise of 8 per cent in 2007-08. This is mainly the result of significantly higher energ y and mineral prices.
For farm commodities, the index of unit expor t returns is forecast to be largely unchanged in 2008-09, after increasing by 9 per cent in 2007-08. The effects of forecast lower world indicator prices for wheat, sugar, rice, wool and dair y products are expected to offset forecast higher world cotton, coarse grain and oilseed prices.
However, unit expor t returns for Australian mineral and energ y commodi-ties are forecast to rise by around 37 per cent in 2008-09, following a rise of 8 per cent in 2007-08. The increase in 2008-09 is largely a reflection of higher forecast prices for crude oil, coking coal, thermal coal, aluminium, gold and iron ore.
Unit returns for energ y expor ts are forecast to rise by 69 per cent in 2008-09, compared with an increase of 22 per cent in 2007-08. Unit expor t returns for metals and other minerals are forecast to increase by 14 per cent in 2008-09, compared with a reduction of almost 1 per cent in 2007-08.
Record commodity export earnings in sightEarnings from Australia’s commodity expor ts are forecast to be $212.3 billion in 2008-09, compared with an estimated $151. 4 billion in 2007-08 (a rise of 40 per cent). The forecast increase in the value of commodity expor ts reflects considerably higher earnings from energ y expor ts.
Economic overview
336 Australian commodities • vol 15 no 2 • June quarter 2008
Economic overview
Australian commodities • vol 15 no 2 • June quarter 2008 337
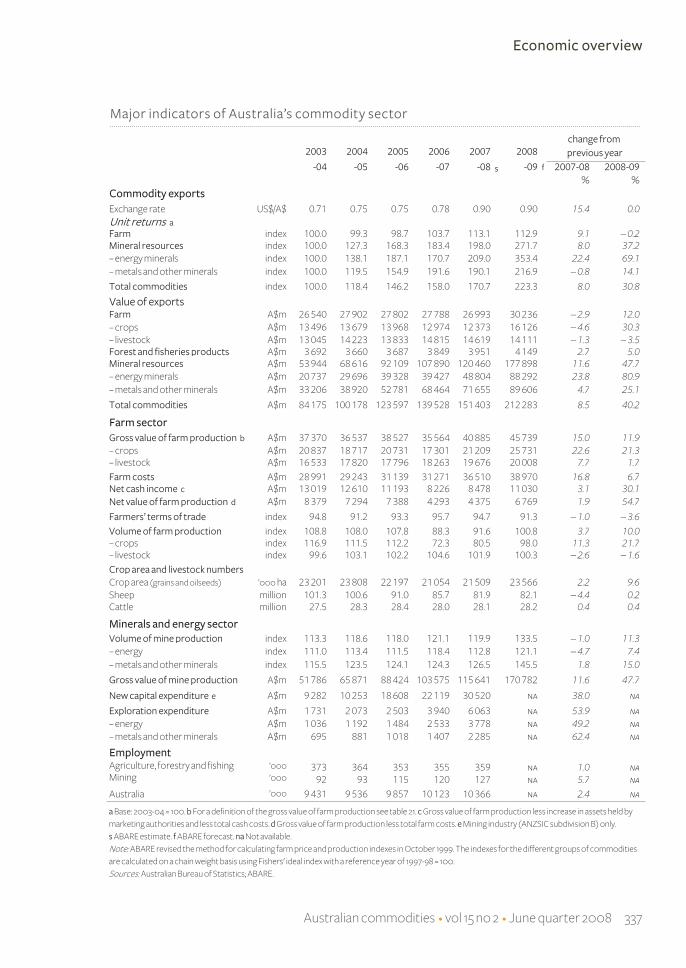
change from 2003 2004 2005 2006 2007 2008 previous year
-04 -05 -06 -07 -08 s -09 f 2007-08 2008-09% %
Commodity exports Exchange rate US$/A$ 0.71 0.75 0.75 0.78 0.90 0.90 15.4 0.0Unit returns a Farm index 100.0 99.3 98.7 103.7 113.1 112.9 9.1 – 0.2Mineral resources index 100.0 127.3 168.3 183.4 198.0 271.7 8.0 37.2 – energy minerals index 100.0 138.1 187.1 170.7 209.0 353.4 22.4 69.1– metals and other minerals index 100.0 119.5 154.9 191.6 190.1 216.9 – 0.8 14.1
Total commodities index 100.0 118.4 146.2 158.0 170.7 223.3 8.0 30.8
Farmers’ terms of trade index 94.8 91.2 93.3 95.7 94.7 91.3 – 1.0 – 3.6Volume of farm production index 108.8 108.0 107.8 88.3 91.6 100.8 3.7 10.0– crops index 116.9 111.5 112.2 72.3 80.5 98.0 11.3 21.7– livestock index 99.6 103.1 102.2 104.6 101.9 100.3 – 2.6 – 1.6Crop area and livestock numbersCrop area (grains and oilseeds) ’000 ha 23 201 23 808 22 197 21 054 21 509 23 566 2.2 9.6Sheep million 101.3 100.6 91.0 85.7 81.9 82.1 – 4.4 0.2Cattle million 27.5 28.3 28.4 28.0 28.1 28.2 0.4 0.4
Minerals and energy sectorVolume of mine production index 113.3 118.6 118.0 121.1 119.9 133.5 – 1.0 11.3– energy index 111.0 113.4 111.5 118.4 112.8 121.1 – 4.7 7.4– metals and other minerals index 115.5 123.5 124.1 124.3 126.5 145.5 1.8 15.0
Gross value of mine production A$m 51 786 65 871 88 424 103 575 115 641 170 782 11.6 47.7
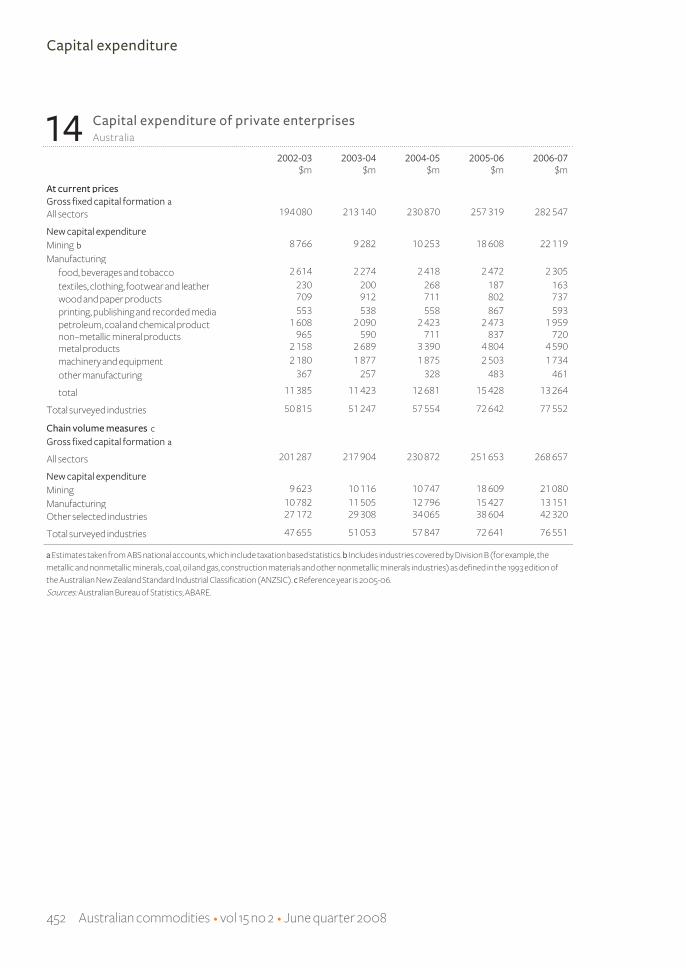
New capital expenditure e A$m 9 282 10 253 18 608 22 119 30 520 na 38.0 na
Exploration expenditure A$m 1 731 2 073 2 503 3 940 6 063 na 53.9 na– energy A$m 1 036 1 192 1 484 2 533 3 778 na 49.2 na– metals and other minerals A$m 695 881 1 018 1 407 2 285 na 62.4 na
EmploymentAgriculture, forestry and fishing ’000 373 364 353 355 359 na 1.0 naMining ’000 92 93 115 120 127 na 5.7 naAustralia ’000 9 431 9 536 9 857 10 123 10 366 na 2.4 na
a Base: 2003-04 = 100. b For a definition of the gross value of farm production see table 21. c Gross value of farm production less increase in assets held by marketing authorities and less total cash costs. d Gross value of farm production less total farm costs. e Mining industry (ANZSIC subdivision B) only. s ABARE estimate. f ABARE forecast. na Not available.Note: ABARE revised the method for calculating farm price and production indexes in October 1999. The indexes for the different groups of commodities are calculated on a chain weight basis using Fishers' ideal index with a reference year of 1997-98 = 100. Sources: Australian Bureau of Statistics; ABARE.
Major indicators of Australia’s commodity sector
Economic overview
338 Australian commodities • vol 15 no 2 • June quarter 2008
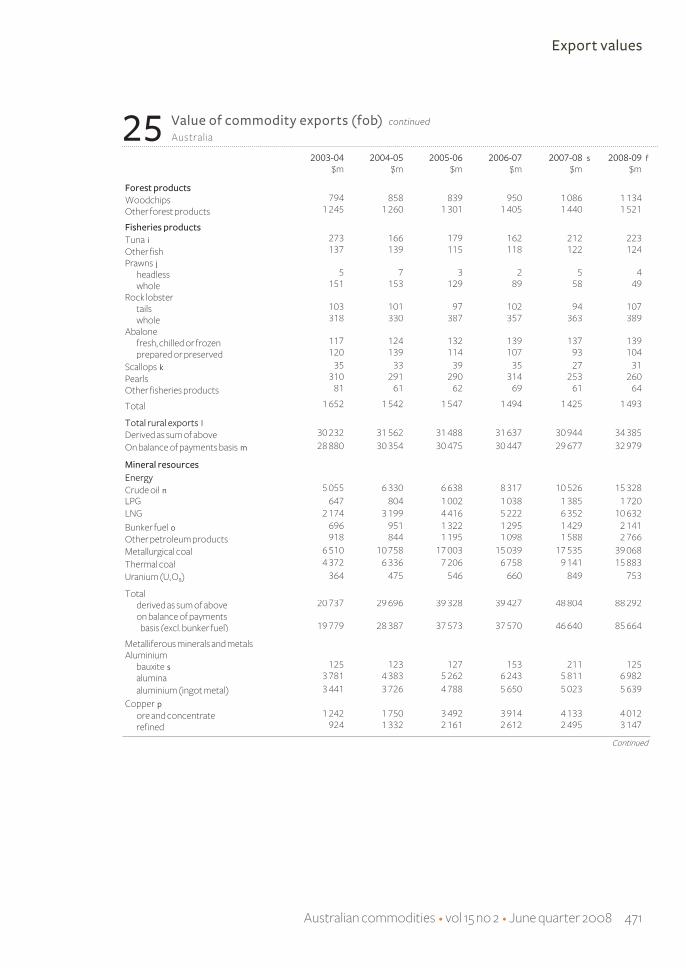
For agricultural commodities, expor t earnings are forecast to be $30.2 billion in 2008-09, an increase of 12 per cent from $27.0 billion in 2007-08, reflecting higher earnings from wheat, barley, cotton lint and seed, sugar, wine, pulses, canola, and sorghum. For forest and fisheries products, expor t earnings are forecast to be around $4 .1 billion in 2008-09, 5 per cent higher than in 2007-08.
The value of Australia’s minerals and energ y expor ts is forecast to be nearly 50 per cent higher, at $177.9 billion in 2008-09, compared with an estimated $120.5 billion in 2007-08. For energ y commodities, expor t earnings are fore-cast to increase by 81 per cent, from $48.8 billion in 2007-08 to $88.3 billion in 2008-09. For metals and other minerals, expor t earnings are forecast to rise by 25 per cent to $89.6 billion in 2008-09.
Economic overview
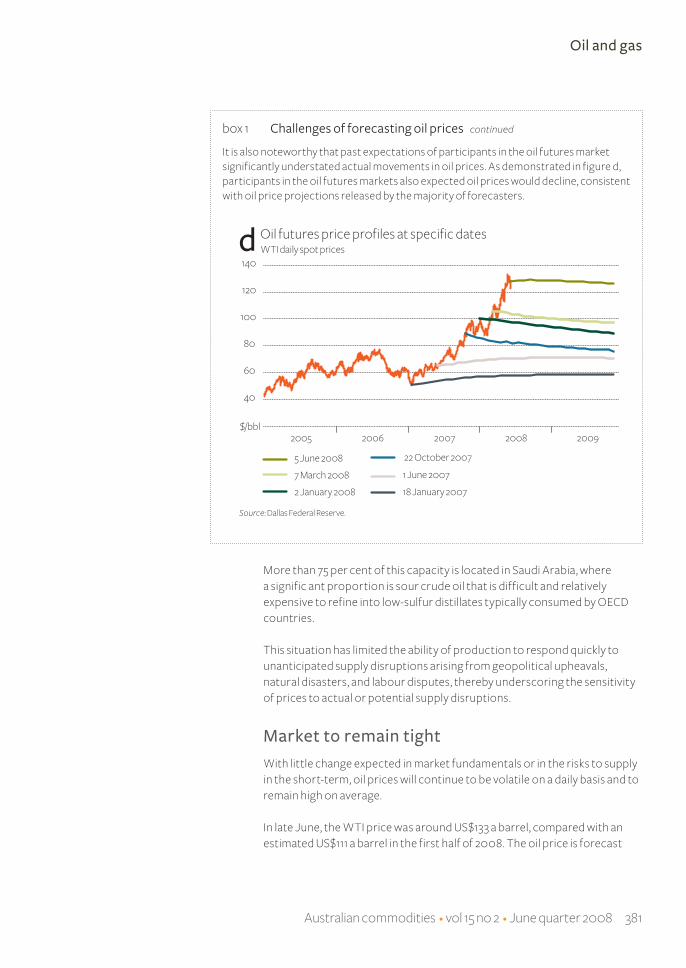
ABARE’s commodity forecasts: some key issues
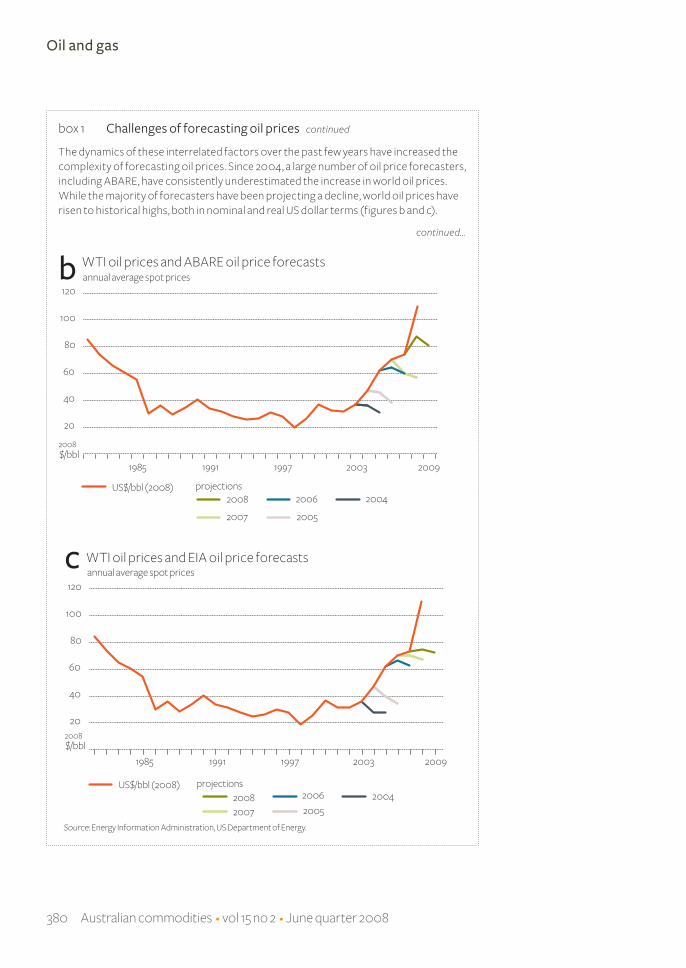
ABARE presents its forecasts of production, consumption, prices and expor ts of specific commodities as point estimates. These point forecasts are based on an economic assessment of data and information from a variety of sources available at the time the forecasts are made, suppor ted by discussions with industr y exper ts, the use of quantitative analytical tools, and professional judgement. The nature of forecasts made by ABARE (and other organisations) is such that actual outcomes are some-times different from the initial point forecasts.
A key reason for these differences is that ABARE is often required to make assumptions about factors that have the potential to affect actual outcomes. As more information becomes available over time, earlier assumptions are updated and forecasts are revised. ABARE forecasts are therefore conditional on the information available at the time they were made.
Also impor tant is that the differences between forecasts and actual outcomes reflect the impacts of factors that are ‘unforeseeable’. These can include unanticipated policy changes, unpredictable macroeconomic developments, changing weather conditions (especially for agricultural commodities) and unplanned production or supply disruptions (par ticu-larly for energ y and minerals commodities).
Changes in seasonal weather conditions over the forecast period are a major risk in forecasting agricultural production and hence agricul-tural expor ts and prices. In forecasting the major non-irrigated crops in Australia, ABARE takes into account information on the seasonal outlook released by the Australian Government Bureau of Meteorolog y and yield forecasts provided by the Agricultural Production Systems Research Unit, of the Queensland Depar tment of Primar y Industries and Fisheries. For agricultural production in the United States, a major agricultural producer,
continued...
Australian commodities • vol 15 no 2 • June quarter 2008 339
Economic overview
ABARE’s commodity forecasts: some key issues continued
ABARE utilises (among other information) the estimates and forecasts released by the US Depar tment of Agriculture (USDA). Any variation in those estimates/forecasts from the actual outcomes will also affect ABARE’s assessment of variables ranging from commodity production to prices.
Similarly, a range of risks applies to ABARE’s forecasts of energ y and minerals commodities. In recent times it has become increasingly difficult to accurately forecast movements in energ y and minerals prices on world markets. In addition to the fundamental factors impor tant to changes in consumption and production, a number of other factors have emerged as impor tant determinants of movements in world prices. These factors include geopolitical issues and their effects on supply potential; unfore-seen supply disruptions, including those related to insurgent action against supply infrastructure or unexpected shutdowns of production facilities; and investment and speculative trading on energ y and minerals markets. It is not possible to predict these factors with any level of confidence.
An example of the effect of unforeseeable events is the incidence of Hurricane Katrina in August 2005 . As well as devastating the United States city of New Orleans, Hurricane Katrina damaged infrastructure in the region, including grain expor t handling facilities and oil production and petroleum refining operations. In early September 2005 , the loss of crude oil production in the Gulf of Mexico region as a result of Hurricane Katrina was around 1. 4 million barrels a day. Based on the estimates released by the USDA at that time, the initial effect of Hurricane Katrina was to delay US coarse grains expor ts of 1.36 million tonnes to the following season. Both of these impacts resulted in higher than previously forecast prices for these commodities.
The occurrence and effect of events such as hurricanes, political upheavals and drought cannot be predicted and incorporated into commodity forecasts before the event. While ABARE forecasts attempt to balance a range of upside and downside risks, some of the key judgments relating to forecasts will inevitably be different from the actual outcomes.
Despite being largely unpredictable, information about the potential risks to the point forecasts that some of these factors pose will be useful for decision-makers in the commodity sector. For this reason, ABARE incor-porates discussions on the risk factors in the associated notes presented in Australian commodities. Decision-makers are encouraged to read the repor t in full in order to gain a comprehensive understanding of the context of ABARE’s commodity forecasts.
Australian commodities • vol 15 no 2 • June quarter 2008 341
Crops
Crops
Wheat
Leanne Lawrance
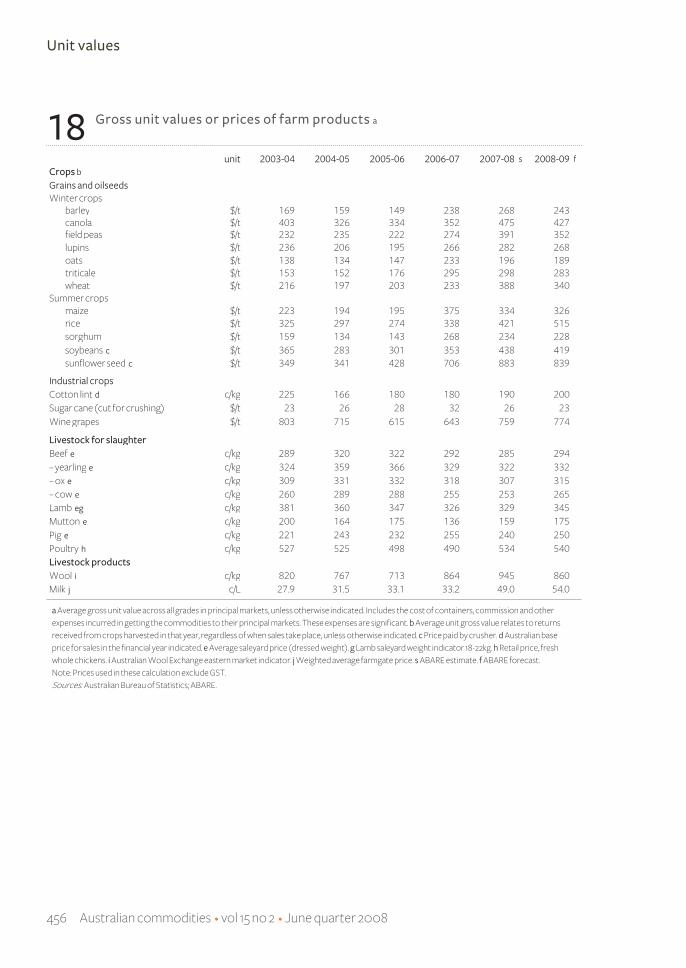
Since reaching a peak of US$454 a tonne in March 2008, the world wheat indicator price (US hard red winter, fob gulf por ts) has been declining. The indicator price averaged US$388 a tonne in April and US$346 a tonne in May. Despite the recent declines, world wheat prices remain at historical highs.
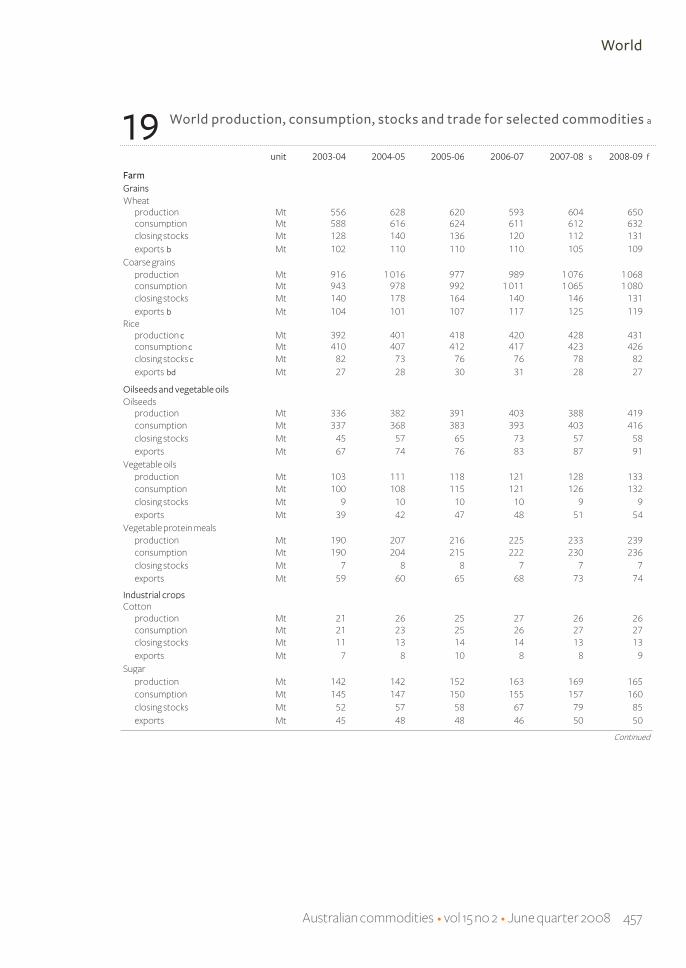
In 2008-09 the world wheat indicator price is expected to fall as world wheat supplies are forecast to rise by more than the increase in consump-tion. The world wheat indicator price is forecast to average US$320 a tonne in 2008-09 compared with an estimated average of US$362 a tonne in 2007-08. Despite the forecast rise in production, low stocks will suppor t relatively high prices. Low stocks mean any disruption to wheat supplies could quickly lead to a strong upward movement in prices.
Forecast lower global wheat prices and an expected increase in domestic production are likely to result in Australian wheat prices being lower in 2008-09. The pool return for Australian premium white wheat (APW 10) is forecast to decline from an estimated A$419 a tonne in 2007-08 to A$370 a tonne in 2008-09.
World wheat production higher in 2008-09The area sown to wheat is forecast to increase by around 4 per cent in 2008-09, the largest area sown to wheat in the past 10 seasons. The large area planted to wheat is a result of the historically high wheat prices currently being experienced. World wheat production is forecast to increase by around 45 million tonnes in 2008-09 as yields are expected to return closer to historical averages. This expected increase in production, combined with opening season stocks, is forecast to lead to a 5 per cent increase in global wheat supplies in 2008-09.
Out of the five major wheat producing regions, production in 2008-09 is forecast to increase in the European Union and the United States by 17 per cent and 13 per cent, respectively. In China, India and the Russian Federation, production is forecast to remain largely unchanged from the relatively high levels of the previous year. In the five major expor ting countries (Argentina, Australia, Canada, the European Union and the United States) total wheat production is forecast to increase by around 40 million tonnes in 2008-09.
342 Australian commodities • vol 15 no 2 • June quarter 2008
Wheat
In the European Union, high wheat prices and policy changes reducing the set-aside rate (land left fallow) to zero, have resulted in the area sown to wheat increasing by around 5 per cent in 2008-09. Assuming favourable seasonal conditions continue in the European Union, production is forecast to be 140 million tonnes in 2008-09, around 20 million tonnes more than was produced in the previous year.
In the United States the area sown is estimated to have increased by 5 per cent in 2008-09, compared with the area in 2007-08. This is the largest area sown to wheat in the United States in the past 10 seasons. US production is forecast to increase by around 13 per cent, to 63 million tonnes. While production is forecast to increase, there is still concern over the condition of the crop. In the weekly weather and crop bulletin released on 17 June 2008 by the United States Department of Agriculture (USDA), around 22 per cent of the winter wheat crop was rated poor or below, and 47 per cent was rated good or above. This compares with a rating a year earlier of 22 per cent being rated poor or below and 50 per cent as good or above. Despite these concerns production is forecast to increase by around 7 million tonnes in 2008-09.
Higher consumption expected in 2008-09 despite relatively high pricesDespite the expectation that wheat prices will remain relatively high in 2008-09, global wheat consumption is forecast to increase by around 3 per cent.
The largest use of wheat is for human consumption, accounting for more than 70 per cent of global consumption. Wheat used for human consump-tion has been increasing by around 1 per cent a year over the past 10 years. In 2008-09, wheat used for human consumption is forecast to increase again by around 1 per cent.
Changes in the total quantity consumed generally move in line with changes in the use of wheat for livestock feeding. The largest consumers of feed wheat are the European Union and the Russian Federation, accounting for a total of 70 per cent of global feed wheat consumption. In 2008-09 the use of wheat for livestock feed is forecast to increase by around 15 per cent.
In the European Union the use of wheat for livestock feeding is forecast to increase in 2008-09 as supplies increase and the price of feed wheat declines relative to other feed grains.
The use of wheat for biofuel production (or industrial use) has been relatively small in terms of overall wheat consumption. Over the past five years, industrial use of wheat has been around an average of 2 per cent of total wheat consumption. In 2008-09, industrial use of wheat is forecast to increase to around 18 million tonnes, or around 3 per cent of total wheat consumption.
Australian commodities • vol 15 no 2 • June quarter 2008 343
World trade to increase in 2008-09World wheat trade is forecast to increase by around 4 million tonnes in 2008-09. In the major expor ting countries a strong recover y in production (18 per cent increase) will be adding to the availability of expor table supplies in 2008-09. Total shipments from the five major expor ting countries (Argentina, Australia, Canada, the European Union and the United States) are forecast to increase by around 2 per cent in 2008-09.
Notwithstanding forecast higher impor ts from Algeria, Indonesia, Iraq, the Philippines and Viet Nam, in 2008-09 impor t demand from India is forecast to decline.
Impor t demand from India is forecast to fall in 2008-09, as production exceeds 75 million tonnes for the second consecutive year. In 2007-08 Indian wheat impor ts are forecast at 2 million tonnes and in 2006-07 were estimated at 6.7 million tonnes. Prior to these two years, India’s annual wheat impor ts were around 23 000 tonnes. The Indian Government oper-ates a procurement system under which it purchases wheat from growers to provide suppor t and to meet commitments under the ‘public distribution system’, a government initiative introduced to ensure the ready availability of food grains to the population. It is forecast that purchases from domestic
2006 2007 2008 %-07 -08 s -09 f change
World Production Mt 593 604 650 7.6– China Mt 105 106 106 0.0– EU27 Mt 125 120 140 16.7– India Mt 69 76 77 1.3– Russian Fed. Mt 45 49 50 2.0– United States Mt 49 56 63 12.5
344 Australian commodities • vol 15 no 2 • June quarter 2008
growers will be sufficient to meet government distribution needs. The Indian Government announced in late April 2008 there would be no need for impor ts in 2008-09.
Wheat stocks remain lowGlobal wheat stocks at the end of 2008-09 are forecast to be around 131 million tonnes, 19 million tonnes more than at the end of 2007-08. Despite this forecast increase, the level of stocks will remain low by historical standards. The low level of wheat stocks will help maintain prices at relatively high levels.
Stocks of high quality milling wheat, held by the five major expor ting coun-tries, are forecast to increase for the first time in four seasons. At the end of 2008-09, stocks held by the major expor ters are forecast to be around 38 million tonnes, 11 million tonnes more than the previous year.
Wheat stocks are also forecast to increase in China for the third consecutive year. In 2008-09, Chinese wheat stocks are forecast to increase by around 3 million tonnes.
Prospects of higher Australian productionThe area sown to wheat in Australia in 2008-09 is forecast to increase to a record 14 million hectares, a 13 per cent increase on the previous year. Historically high wheat prices and the need to secure a quick recover y in incomes, have encouraged growers to plant a larger area. Wheat produc-tion in 2008-09 is forecast to be 23 .7 million tonnes, nearly 11 million tonnes more than the previous year.
The star t to the 2008-09 winter cropping season has been variable across the states. Widespread rainfall across the majority of the Western Austral-ian’s grains belt in April 2008 provided growers in that state with a good star t to the 2008-09 winter cropping season. However, a lack of follow-up rainfall since then is hampering crop germination and delaying planting completion. The area sown to wheat in Western Australia is forecast to be a record 5 .2 million hectares.
Rainfall in early June 2008 across nor thern New South Wales and Queens-land benefited crops that were dr y sown in those regions and provided the rainfall growers needed to plant remaining crops. In southern and central par ts of New South Wales, continued dr y conditions have seen most crops dr y sown in those areas. In South Australia and Victoria, rainfall in May across par ts of the grains belt helped crops that had been dr y sown and provided the oppor tunity for fur ther plantings. Prolonged dr y periods in these states mean follow-up rains will be critical.
The Bureau of Meteorolog y, in its latest seasonal rainfall outlook for the June to August period (27 May 2008), indicates the chances of receiving
Wheat
Australian commodities • vol 15 no 2 • June quarter 2008 345
above average rainfall are mixed across the countr y. There is a 55 to 65 per cent chance of accumulating above average rainfall across most of Queens-land and nor th-east New South Wales. In contrast, the chance of exceeding average rainfall across the south-west of Western Australia is 30 to 40 per cent. However, the Bureau has advised that because of technical issues, its confidence in the current outlook assessment for Western Australia is low.
Domestic wheat prices to fallForecast lower global wheat prices and an expected increase in domestic production are likely to result in Australian wheat prices being lower in 2008-09. The pool return for Australian premium white wheat (APW 10) is forecast to decline from an estimated A$419 a tonne in 2007-08 to A$370 a tonne in 2008-09.
Increased supplies of feed grains on the domestic market, par ticularly from the 2007-08 grain sorghum crop, and an expected increase in wheat production in 2008-09, has led to a decline in the domestic cash price of wheat. The cash price of wheat (delivered Sydney) used for livestock feed averaged A$430 a tonne in May 2008. This compares with an average of A$513 a tonne in March and A$470 a tonne in April in the same year.
Australian exports to increaseReflecting an expected better harvest than last year, Australian wheat exports (October – September marketing year) are forecast to increase to around 16.3 million tonnes in 2008-09. The value of these exports in the fiscal year 2008-09 (July-June) is forecast to nearly double to A$5 .0 billion. Reflecting the fall in world wheat prices, the unit value of exports in 2008-09 is forecast to decline to A$358 a tonne compared with A$384 a tonne in 2007-08.
Wheat
346 Australian commodities • vol 15 no 2 • June quarter 2008
Coarse grains
Coarse grains
Leanne Lawrance
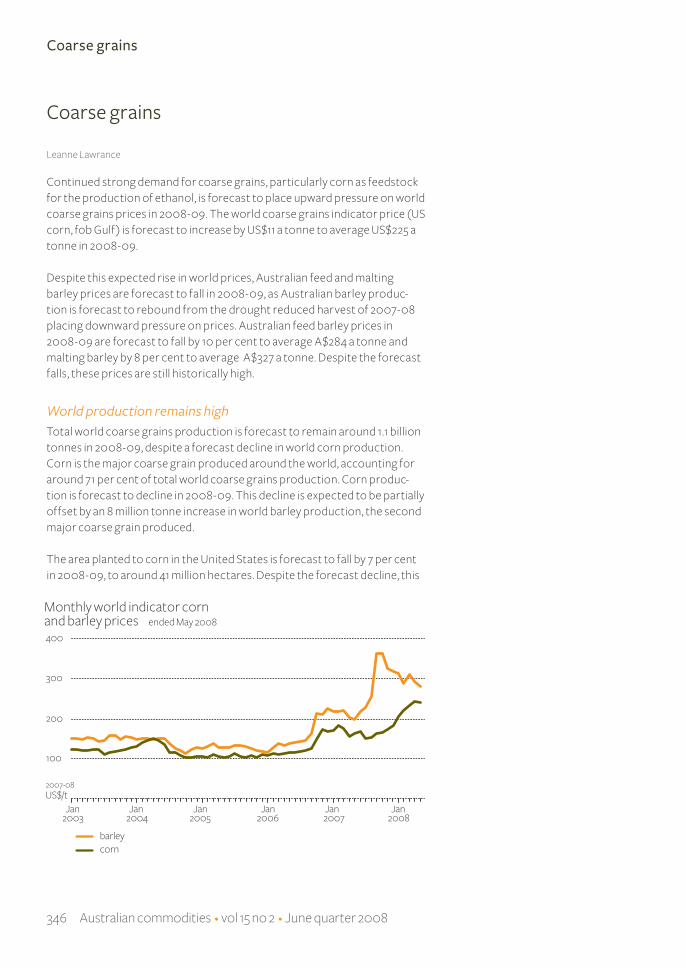
Continued strong demand for coarse grains, par ticularly corn as feedstock for the production of ethanol, is forecast to place upward pressure on world coarse grains prices in 2008-09. The world coarse grains indicator price (US corn, fob Gulf ) is forecast to increase by US$11 a tonne to average US$225 a tonne in 2008-09.
Despite this expected rise in world prices, Australian feed and malting barley prices are forecast to fall in 2008-09, as Australian barley produc-tion is forecast to rebound from the drought reduced har vest of 2007-08 placing downward pressure on prices. Australian feed barley prices in 2008-09 are forecast to fall by 10 per cent to average A$284 a tonne and malting barley by 8 per cent to average A$327 a tonne. Despite the forecast falls, these prices are still historically high.
World production remains highTotal world coarse grains production is forecast to remain around 1.1 billion tonnes in 2008-09, despite a forecast decline in world corn production. Corn is the major coarse grain produced around the world, accounting for around 71 per cent of total world coarse grains production. Corn produc-tion is forecast to decline in 2008-09. This decline is expected to be par tially offset by an 8 million tonne increase in world barley production, the second major coarse grain produced.
The area planted to corn in the United States is forecast to fall by 7 per cent in 2008-09, to around 41 million hectares. Despite the forecast decline, this
Australian commodities • vol 15 no 2 • June quarter 2008 347
Coarse grains
will still be one of the largest areas sown to corn in the United States. While the price of both corn and soybeans have increased over the past year, the expected returns from soybeans relative to corn have resulted in some shift of US arable land back into the production of soybeans. US corn production is forecast to decline by 7 per cent in 2008-09, to be 308 million tonnes.
In mid-June 2008, flooding occurred across much of Iowa in the United States, one of the largest corn producing states. At the time of writing insuf-ficient information was available on the extent of the damage to crops. If significant damage has occurred, US corn production could be lower than currently forecast, resulting in a higher than forecast world indicator price.
The area sown to corn in China is forecast to decrease slightly in 2008-09, but remain around a record 28 million hectares, reflecting high corn prices and strong domestic demand. With an assumed return to average yields, Chinese production is forecast to be 150 million tonnes in 2008-09, 3 per cent more than the 2007-08 har vest.
In Brazil and Argentina, har vest of the 2007-08 corn crop is approaching completion and production is estimated to be one of the highest on record. High corn prices are forecast to result in the area sown to corn in Brazil increasing by around 3 per cent in 2008-09, to a record 15 million hectares.
348 Australian commodities • vol 15 no 2 • June quarter 2008
Production in Brazil in 2008-09 is forecast to be close to 55 million tonnes, compared with the 10 year average of 45 million tonnes.
In 2008-09 the area sown to corn in Argentina is forecast to remain around 3 .1 million hectares, well above the 10 year average of 2.7 million hectares. Argentina’s corn production is forecast to be 23 .5 million tonnes, close to 10 per cent more than was har vested in the previous year.
World barley production is forecast to increase by 6 per cent in 2008-09. The European Union and the Russian Federation are the world’s largest barley producers, accounting for an average of just more than half of global production. The area sown to barley in the European Union is forecast to increase by around 3 per cent in 2008-09 and with an improvement in seasonal conditions, production is forecast to increase by around 2 million tonnes. In the Russian Federation, with an improvement in seasonal condi-tions and yields returning closer to historical averages, it is expected barley production will increase by around 9 per cent in 2008-09.
In Canada, corn and barley production are both forecast to fall in 2008-09 as the area sown to these crops declines in favour of wheat and oilseeds. The area sown to corn is forecast to decrease by 12 per cent and production by 14 per cent in 2008-09, compared with the previous year. Despite a forecast improvement in barley yields, the decline in area sown to barley is expected to lead to a decline of barley production in Canada by 5 per cent in 2008-09.
Consumption to remain constantIn 2008-09, global coarse grains consumption is forecast to remain at around 1.1 billion tonnes. A forecast decline in demand for coarse grains for livestock feed is likely to be outweighed by an increase in the demand for coarse grains for industrial purposes, par ticularly in producing ethanol.
US driving consumptionTotal coarse grains consumption in the United States, the world’s largest consumer, is forecast to increase by around 5 million tonnes in 2008-09. Increased US consumption is largely the result of growing demand for corn in producing ethanol. The use of coarse grains for livestock feed is forecast to fall by around 13 per cent in 2008-09, as feed wheat and distillers grains, a by-product from the production of ethanol, replace corn in feeding rations. The availability of distillers grains is also replacing a propor tion of corn in feed rations. However, the use of distillers grains is still in the developmental stage and significant research is being under taken to determine its suit-ability for different animals.
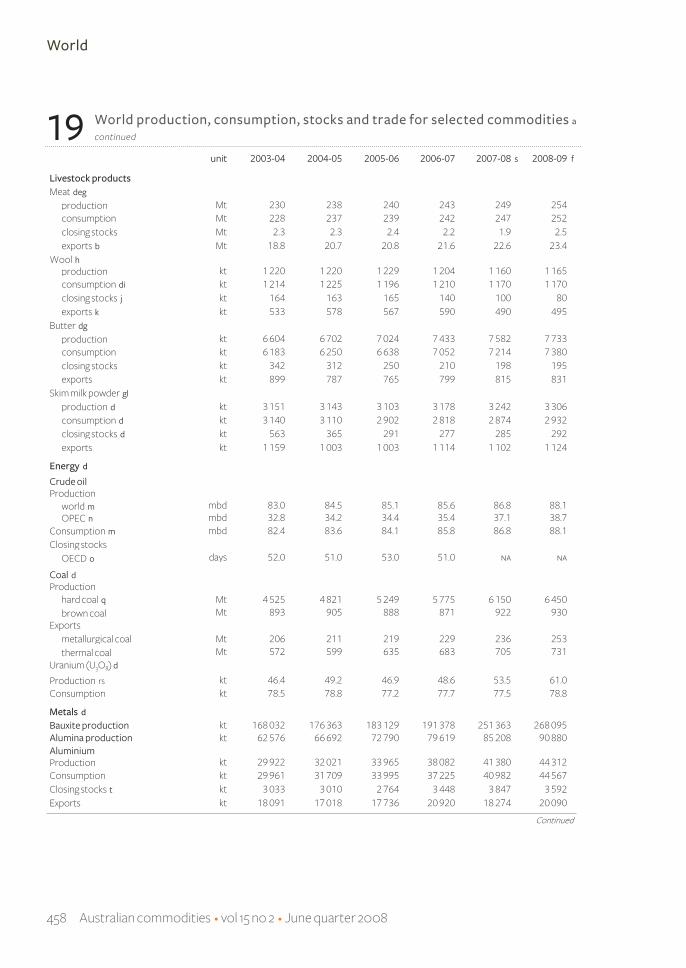
The ethanol industr y in the United States has expanded rapidly. In Januar y 2000 there were around 54 operational ethanol plants with capacity of
Coarse grains
Australian commodities • vol 15 no 2 • June quarter 2008 349
around 6.6 billion litres per year. It is now estimated there are 134 ethanol plants operational in the United States with a production capacity of 27. 4 billion litres. It is also estimated that 77 plants are under construction or expansion, which will increase capacity by a fur ther 23 .5 billion litres.
Mandated use of biofuels in transpor t fuels under the US Energ y Independ-ence and Security Act of 2007 (EISA), will mean that US domestic use of corn is likely to rise again in 2008-09. The mandate was set under the Act to 9.0 billion gallons (34 .1 billion litres) by 2008, compared with domestic production of 8.7 billion gallons (32.9 billion litres) in 2007.
European Union consumption decliningThe demand for coarse grains for livestock feed in the European Union is forecast to decline by around 7 million tonnes in 2008-09, where a poor wheat har vest in the previous season led to a higher use of coarse grains in feeding rations. In 2007-08 the use of coarse grains for livestock feed increased to 116 million tonnes, compared with an average consumption of 111 million tonnes. With a larger wheat har vest expected in 2008-09 and a forecast decline in world wheat prices, the use of coarse grains for livestock feed in the European Union is forecast to fall.
Stocks to fall as consumption rises End of season coarse grains stocks are forecast to be around 131 million tonnes in 2008-09, the lowest ending season stocks since the late 1970s. US corn stocks are forecast to decline to 19 million tonnes in 2008-09, the lowest level since the 1972-73 season.
Corn stocks in China are expected to decline by around 1 per cent in 2008-09, making it the ninth consecutive year of declining corn stocks and the lowest level since the 1977-78 season. This reflects continued strong growth in feed demand and increased demand for corn as a feedstock for ethanol production.
Balanced against a decline in corn stocks is a forecast 10 per cent increase in ending season barley stocks in 2008-09. Despite the forecast increase, barley stock will remain close to the lowest they have been since the early 1980s.
International trade in coarse grains declineWorld trade in coarse grains in 2008-09 is forecast to decline by 5 per cent on last year ’s record, to around 119 million tonnes. US corn expor ts are fore-cast to fall by around 16 per cent in 2008-09 because of stronger domestic demand.
Coarse grains
350 Australian commodities • vol 15 no 2 • June quarter 2008
Coarse grains
A decline in world corn expor ts is forecast to outweigh an increase in global barley expor ts in 2008-09. Barley expor ts from Ukraine and the Russian Federation are forecast to increase in 2008-09, assuming a relaxation of current expor t restrictions imposed by these two countries. In late May 2008, the Russian Agriculture Minister announced grain expor t duties would not be extended beyond 30 June 2008. In May 2008, the Ukraine Government lifted current expor t restrictions which it is unlikely to re-impose for the next season. An increase in Australia’s barley production in 2008-09 is also expected to result in increased expor table supplies.
The European Union in 2007- 08 is estimated to have impor ted a record 13 million tonnes of coarse gr ains to meet domestic production shor t-falls. With a forecast rebound in production in 2008- 09, impor t demand in the European Union is forecast to fall. The European Union suspended impor t duties on all cereals (except oats, buck wheat and millet) until 30 June 2008 , as a reaction to high gr ain prices.
Australian production to increase in 2008-09
In Australia, the area sown to barley is forecast to remain largely unchanged in 2008- 09 at 4 .5 million hectares. Production is forecast to increase by 2 million tonnes to close to 8 million tonnes in 2008- 09.
The recently har vested 2007-08 summer grain crops were significantly larger than historical averages. Above average summer rainfall in nor thern New South Wales and Queensland was of benefit to grain sorghum crops with yields being above the long-term average in both states. Total grain sorghum production is estimated to have reached a record 2.7 million tonnes in 2007-08, close to 600 000 tonnes greater than the previous record production in 1999-2000.
Exports to increase in 2008-09Total Australian coarse grains expor ts, in volume terms, are forecast to increase by around 35 per cent in 2008-09, reflecting a recover y in produc-tion. The most significant increase is expected to come from barley expor ts, which are forecast to increase by 860 000 tonnes in 2008-09. The value of Australian coarse grains expor ts is forecast to rise by 34 per cent to around $2.04 billion in 2008-09.
Australian commodities • vol 15 no 2 • June quarter 2008 351
Oilseeds
Oilseeds
Gayathiri Bragatheswaran
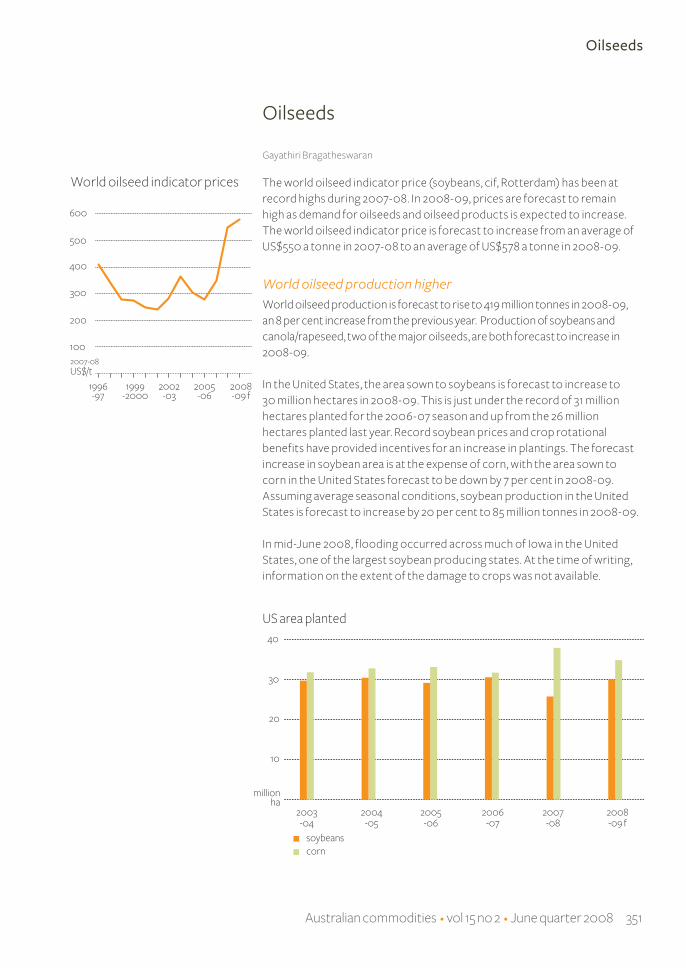
The world oilseed indicator price (soybeans, cif, Rotterdam) has been at record highs during 2007-08. In 2008-09, prices are forecast to remain high as demand for oilseeds and oilseed products is expected to increase. The world oilseed indicator price is forecast to increase from an average of US$550 a tonne in 2007-08 to an average of US$578 a tonne in 2008-09.
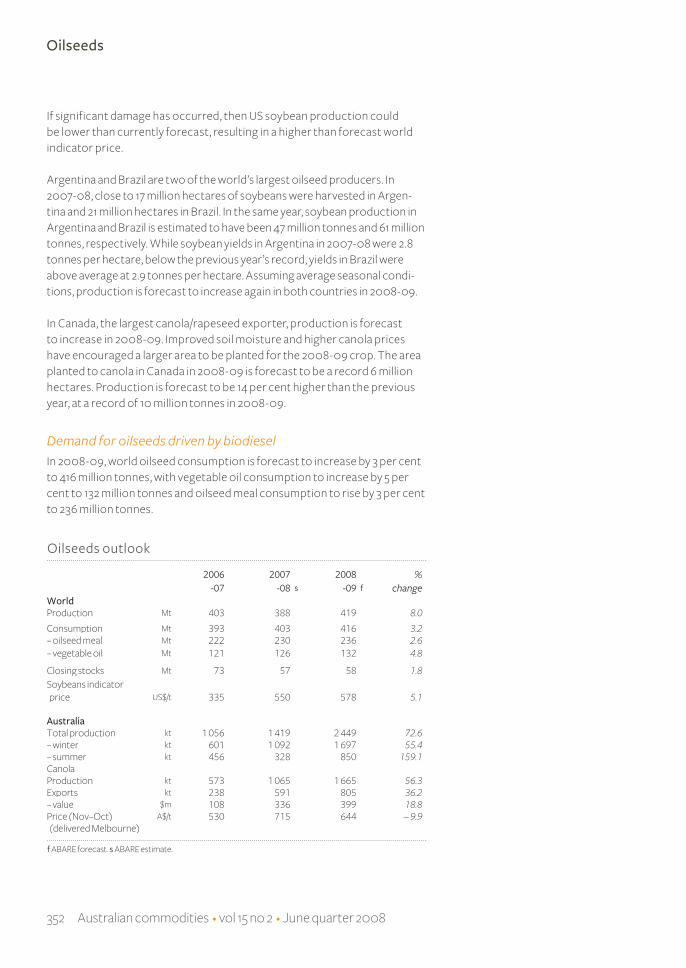
World oilseed production higherWorld oilseed production is forecast to rise to 419 million tonnes in 2008-09, an 8 per cent increase from the previous year. Production of soybeans and canola/rapeseed, two of the major oilseeds, are both forecast to increase in 2008-09.
In the United States, the area sown to soybeans is forecast to increase to 30 million hectares in 2008-09. This is just under the record of 31 million hectares planted for the 2006-07 season and up from the 26 million hectares planted last year. Record soybean prices and crop rotational benefits have provided incentives for an increase in plantings. The forecast increase in soybean area is at the expense of corn, with the area sown to corn in the United States forecast to be down by 7 per cent in 2008-09. Assuming average seasonal conditions, soybean production in the United States is forecast to increase by 20 per cent to 85 million tonnes in 2008-09.
In mid-June 2008, flooding occurred across much of Iowa in the United States, one of the largest soybean producing states. At the time of writing , information on the extent of the damage to crops was not available.
352 Australian commodities • vol 15 no 2 • June quarter 2008
If significant damage has occurred, then US soybean production could be lower than currently forecast, resulting in a higher than forecast world indicator price.
Argentina and Brazil are two of the world’s largest oilseed producers. In 2007-08, close to 17 million hectares of soybeans were har vested in Argen-tina and 21 million hectares in Brazil. In the same year, soybean production in Argentina and Brazil is estimated to have been 47 million tonnes and 61 million tonnes, respectively. While soybean yields in Argentina in 2007-08 were 2.8 tonnes per hectare, below the previous year ’s record, yields in Brazil were above average at 2.9 tonnes per hectare. Assuming average seasonal condi-tions, production is forecast to increase again in both countries in 2008-09.
In Canada, the largest canola /rapeseed expor ter, production is forecast to increase in 2008-09. Improved soil moisture and higher canola prices have encouraged a larger area to be planted for the 2008-09 crop. The area planted to canola in Canada in 2008-09 is forecast to be a record 6 million hectares. Production is forecast to be 14 per cent higher than the previous year, at a record of 10 million tonnes in 2008-09.
Demand for oilseeds driven by biodiesel In 2008-09, world oilseed consumption is forecast to increase by 3 per cent to 416 million tonnes, with vegetable oil consumption to increase by 5 per cent to 132 million tonnes and oilseed meal consumption to rise by 3 per cent to 236 million tonnes.
Australian commodities • vol 15 no 2 • June quarter 2008 353
Oilseeds
Industrial use of vegetable oil has increased strongly in the past several years, from below 10 million tonnes in 2000-01 to above 23 million tonnes in 2007-08. With high crude oil prices, mandated biofuels use and invest-ment in biodiesel plants across the world, industrial use of vegetable oil is expected to rise to a forecast 25 million tonnes in 2008-09.
The European Union is the largest biodiesel producer and the major feed-stock used in the region is canola /rapeseed oil. Total biodiesel production capacity in the European Union has risen from 6 million tonnes in 2006 to an estimated 10 million tonnes in 2007. As the biodiesel industr y expands, the demand for vegetable oil is expected to increase.
Human consumption of vegetable oil also strongThe use of vegetable oil for human consumption has also been increasing, from around 79 million tonnes in 2000-01 to 102 million tonnes in 2007-08.
China, in par ticular, has been a major driver of increased global vegetable oil consumption. Human consumption of vegetable oil in China has increased by an annual average of 8 per cent over the past ten years.
Despite the rising prices for vegetable oil in 2007-08, China’s food consump-tion of vegetable oil continued to increase, reaching 22 million tonnes. Per person consumption of vegetable oil in China has increased from 10 kilograms in 2000-01 to 16 kilograms per person in 2007-08. In 2008-09, consumption is forecast to rise again in China to around 17 kilograms per person.
Oilseed meal demand to growWorld oilseed meal consumption has been increasing at an annual average of 4 per cent over the past five years. Major contributors to this rise are China and the European Union, with average growth over the past five years of 6 per cent and 2 per cent a year, respectively.
The Russian Federation is an impor tant consumer of oilseed meal and its consumption has increased rapidly over the past 10 years. Increased oilseed meal demand has coincided with an increase in demand for poultr y products. Soybean meal is the major protein meal used for poultr y produc-tion in the Russian Federation, accounting for around 49 per cent of meal consumption in 2007-08. In 2008-09, meal demand in the Russian Federa-tion is forecast to increase as demand for livestock products, especially poultr y, rises.
354 Australian commodities • vol 15 no 2 • June quarter 2008
End of season stocks increasingWorld end of season oilseed stocks are forecast to increase by around 2 per cent to 58 million tonnes in 2008-09. Global oilseed stocks declined by around 22 per cent in 2007-08, in response to an increase in consump-tion of oilseeds and oilseed products. Although stocks were drawn down significantly during 2007-08, ending stocks of 57 million tonnes are close to the average of the five years ending 2006-07.
In the major soybean expor ting countries of the United States, Argentina, and Brazil, stocks were drawn down by a total of around 12 million tonnes in 2007-08 as domestic demand and expor ts grew.
Australian production to recover in 2008-09 Variable rainfall across the Australian grains belt has resulted in a mixed outlook for canola plantings in different regions. However, the total area sown to canola is forecast to rise by 16 per cent to 1.2 million hectares in 2008-09.
A late break to the 2008-09 winter cropping season has led to a forecast decline in the area sown to canola in New South Wales and Victoria of 6 per cent and 19 per cent, respectively. In South Australia reasonable rainfall has improved planting conditions and the area planted to canola is forecast to increase by 9 per cent in 2008-09. In Western Australia, above average rainfall in April provided an excellent star t for canola plantings with the area planted forecast to increase by 58 per cent in 2008-09.
Overall, Australian canola production is forecast to increase to 1.7 million tonnes in 2008-09, compared with 1.1 million tonnes in 2007-08. However, rainfall during the growing season will be critical for these forecasts to be realised.
Australian canola exports to increaseAustralian canola expor ts are forecast to rise by 36 per cent to 805 000 tonnes in 2008-09, as increased production adds to expor table supplies. The value of Australia’s canola expor ts is forecast to increase by 19 per cent to around A$399 million in 2008-09.
Oilseeds
Australian commodities • vol 15 no 2 • June quarter 2008 355
Sugar
Sugar
Max Foster
Modest decline forecast for sugar prices in 2008-09The world indicator price for sugar (Intercontinental Commodities Exchange no. 11 spot, fob Caribbean) is forecast to decline to US12.1 cents a pound in 2008-09, down from US12.8 cents a pound in the previous year, under the expected influence of fur ther buildup in world sugar stocks. The indicator price increased sharply in early 2008, to reach US16.7 cents per pound but then declined to around US13 cents a pound in mid-June 2008. However, current forecast prices for 2008-09 are still relatively favourable in historical terms.
World sugar production and consumption in 2008-09 are expected to be more evenly balanced than in 2007-08, despite a 16 per cent increase in sugar cane production in Brazil in 2008-09. This closer balance reflects an increasing propor tion of Brazilian sugar cane expected to be diver ted to ethanol production, rather than sugar production. A number of major sugar producing countries are also expected to produce less sugar in 2008-09.
World sugar production to decline in 2008-09World production of sugar is forecast to decline to 165 .5 million tonnes in 2008-09, after increasing sharply to a record 169 million tonnes in 2007-08.
356 Australian commodities • vol 15 no 2 • June quarter 2008
Sugar
Higher sugar production in Brazil, Australia and China is forecast to be more than offset by lower sugar production in the rest of the world, par ticularly in the European Union and India.
Brazilian sugar cane production is forecast to increase by 16 per cent in 2008-09. However, high world oil prices, favourable incentives for the use of ethanol as fuel and a rapidly increasing fleet of flexi fuel cars in Brazil, mean the propor tion of the cane har vest going to ethanol production is forecast to increase to 57 per cent in 2008-09, compared with 53 per cent in 2007-08. This implies an increase in Brazilian sugar production of only 2.1 million tonnes in 2008-09.
Thailand is also forecast to increase sugar cane production in 2008-09, boosted by government policies aimed at expanding the industr y. However, Thai sugar production could decline by up to 500 000 tonnes in 2008-09 if targets are met using sugar cane for ethanol production.
Production of sugar from sugar beet in the European Union is forecast to fall to 15 .6 million tonnes in 2008-09, down from 17.7 million tonnes in the previous year. The main cause of this decline is renunciations of quotas for sugar beet production, brought about by incentives provided under the reform arrangements for the European Union’s Common Agricultural Policy for sugar. The level of quota renunciations had reached 5 .65 million tonnes in May 2008, just shor t of the target 6 million tonnes.
Lower sugar production is also expected in the Russian Federation and the Ukraine in 2008-09, because of relatively favourable returns to grains and some redirection in government policies arising from relatively abundant supplies of sugar.
Indian sugar production is forecast to decline by 11 per cent, in 2008-09. This results from widespread payment delays to sugar growers with the
2006 2007 2008 %-07 -08 s -09 f change
World Production Mt 162.6 169.0 165.5 – 2.1– Brazil Mt 32.4 32.4 34.5 6.5Consumption Mt 155.3 157.0 159.9 1.8Closing stocks Mt 67.4 79.3 85.0 7.2Change in stocks Mt 9.9 10.1 5.7Price USc/lb 11.7 12.8 12.1 – 5.5
Australia Area ’000 ha 409 397 395 – 0.5Production kt 4 722 4 961 4 965 0.1Exports kt 3 714 3 683 3 707 0.7– value A$m 1 510 975 988 1.3
Sugar outlook
f ABARE forecast. s ABARE estimate.
Australian commodities • vol 15 no 2 • June quarter 2008 357
Sugar
2007-08 crop and higher returns for alternative crops, par ticularly rice, wheat, corn and pulses. The forecast decline also reflects expected drop-offs in sugar yields related to the planting cycle for Indian cane production.
Pakistan sugar production is forecast to decline by 12 per cent in 2008-09, because of low returns to cane growers, despite government eff orts to meet a widening domestic shortfall in sugar production.
In the United States, sugar production from sugar beet is forecast to fall by 0.3 million tonnes in 2008-09, while sugar from cane production is forecast to remain at the 2007-08 level. Sugar beet that is genetically modified to be herbicide tolerant will be grown commercially in the United States in 2008 for the first time, following approval for food use in key world markets.
Australian plantings of sugar cane are estimated to be down by 0.5 per cent in 2008-09. However, reasonably favourable conditions have prevailed in most growing regions since early 2008, raising the possibility that Australian sugar production in 2008-09 will be around the same level as 2007-08.
Demand growth assured in 2008-09The demand for sugar cane and sugar beet is being boosted by high oil prices and various policies throughout the world to encourage using renewable fuels. Ethanol is produced from sugar cane, sugar beet or molasses (a by-product of sugar processing).
Food sugar demand is continuing to grow strongly because of rapidly rising consumer incomes, par ticularly in emerging economies like China and India. World sugar consumption is forecast to grow by 1.8 per cent in 2008-09.
Rising world food prices have prompted calls to lower incentives for ethanol production in countries including the United States and the European Union. Should this happens, the effect on the world demand for sugar cane and sugar beet for ethanol production would probably be slight in 2008-09.
Smaller buildup in world sugar carry-over stocks in 2008-09The forecast balance between sugar production and consumption in 2008-09 sug gests a smaller buildup of world sugar carr y-over stocks in 2008-09 than occurred in the previous two years.
358 Australian commodities • vol 15 no 2 • June quarter 2008
Cotton
Cotton
Max Foster
Higher world prices off set by stronger Australian dollarThe world indicator price for cotton (Cotlook ‘A’ index) is forecast to average 77.9 cents a pound in 2008-09, 8.3 per cent higher than in the previous year, largely because of the expectation of a sustained period of lower US cotton production.
The cotton indicator price surged to US90 cents a pound in early March 2008 under intense speculative activity, but has since declined to aroundUS80 cents a pound in mid-June 2008. Reflecting the expectation of lower US cotton production, US cotton futures prices in mid-June 2008 ranged from US73 cents a pound for July 2008 deliver y, to US94 cents a pound for May 2010 deliver y.
However, the strong Austr alian dollar is weighing heavily on current and for ward prices available to Austr alian cotton growers. In mid-June 2008, for ward cash prices for Austr alian cotton growers for the 2008 crop were around $396 for a bale of standard qualit y Austr alian cotton, rising to $459 a bale for 2009 crop and $488 a bale for 2010 crop.
Small decline in world cotton productionDespite the higher prices, world cotton production is forecast to decrease slightly in 2008-09 to 26 million tonnes.
A further decline in US cotton production in 2008-09 is likely to be largely off set by small production increases in most other cotton producing countries.
Australian commodities • vol 15 no 2 • June quarter 2008 359
US cotton plantings in 2008- 09 are estimated to have declined by 13 per cent, following a 15 per cent reduction in 2007- 08. Contributor y factors to the sustained decline in US cotton plantings are competition for land from other crops for biofuel production and the removal of a par ticular subsidy arrangement (the Step 2 competitiveness provision) under the US farm program, following a successful challenge under the World Trade Organi-sation arrangements. US cotton production is forecast to be 3 .2 million tonnes in 2008- 09, down nearly 1 million tonnes on the previous year.
In response to improved prices, increases in cotton production are expected in most other cotton producing countries, with the exceptions of China, Brazil and Turkey. However the increases are being kept to modest levels by relatively high prices for competing cereal and oilseed crops being driven by demand for biofuels. The production increases in most countries are largely because of yield increases rather than area increases.
Limited growth in cotton consumption in 2008-09World cotton consumption is forecast to grow by only 1.1 per cent in 2008-09, considerably slower than the average 4.2 per cent annual growth over the past decade. World cotton consumption has been increasing over the past decade, mainly because of strong growth in consumer incomes in China and India. However, the threat of slower economic growth in key textile consuming countries in 2008-09, particularly the United States, appears to be dampening the demand for cotton for processing.
The effect of higher cotton prices appears to be most marked in China where a recent sur vey by the China Textile Industr y Association indicated nearly one-quar ter of all mills were running at a loss because of the strong Chinese currency and the rising cost of labour and other production inputs. Given the increasing reliance of China on cotton impor ts, it is possible the Chinese Government will make cuts to the sliding scale of impor t duties currently applying to cotton impor ts.
Cotton
2006 2007 2008 %-07 -08 s -09 f change
World Production Mt 26.6 26.1 26.0 – 0.4Consumption Mt 26.5 26.5 26.8 1.1Closing stocks Mt 13.7 13.5 12.7 – 5.9Stocks to consumption ratio % 51.9 50.7 47.5 – 6.3Cotlook ’A’ index USc/lb 58.1 71.9 77.9 8.3
Australia Area harvested ’000 ha 144 63 210 233.3Lint production kt 274 126 428 239.7Exports kt 487 240 206 – 14.2– value A$m 823 411 700 70.3
Cotton outlook
f ABARE forecast. s ABARE estimate.
360 Australian commodities • vol 15 no 2 • June quarter 2008
Cotton
Based on current expectations of world cotton production and consump-tion, a modest reduction of 5.9 per cent in world carry-over stocks of cotton is forecast for 2008-09. This represents a 6.3 per cent decline in the stocks to use ratio.
Continuation of irrigation water shortages in Australia in 2008-09Har vesting of the 2007-08 cotton crop in Australia has largely finished. Areas planted to cotton in Australia in 2007-08 were severely limited because of shortages of irrigation water. Growing conditions for the crop have generally been good, despite some periods of cooler weather unfa-vourable to cotton growth, achieving above average yields and fibre quality. Nevertheless, Australian cotton lint production in 2007-08 is estimated to have been only 125 800 tonnes, the smallest Australian har vest since 1982-83 .
The stored water situation in the cotton growing regions of Australia has deteriorated over the past three months because of a lack of rain, but is still somewhat better than at the same time in the previous year. Although gross margins at current expected prices for the various crop production possibili-ties appear to favour cotton, irrigation water and land are being diverted to winter grain production in the traditional cotton growing regions to generate cash fl ow. Nevertheless, Australian cotton production (a summer crop) in 2008-09 is forecast to increase by more than 300 000 tonnes compared with the severely drought aff ected harvest of 2007-08.
The small cotton har vests in 2007-08 and 2008-09 mean Australian cotton expor ts in 2008-09 will only be around one-quar ter of the record level of expor ts of 834 000 tonnes reached in 2001-02.
Australian commodities • vol 15 no 2 • June quarter 2008 361
Livestock
Livestock
Beef and veal
Sally Fletcher
The Australian weighted average saleyard price of cattle is forecast to increase by 3 per cent in 2008-09 to 294 cents a kilogram (dressed weight). The forecast increase in prices reflects a decline in slaughterings, par ticu-larly of cows and heifers, and an increase in re-stocker demand as producers begin to rebuild herds, assuming a return to average seasonal conditions. An increase in the quality of cattle being turned off is also expected to contribute to the forecast higher saleyard prices in 2008-09.
However, a forecast fall in the demand for Australian beef in the Republic of Korea, and possibly Japan, as competition from US beef increases, is expected to largely offset the upward pressure on saleyard prices. The assumed high value of the Australian dollar against the US dollar in 2008-09 is expected to constrain growth in demand for Australian beef in other expor t markets, also placing downward pressure on saleyard prices.
There is considerable uncertainty surrounding some factors that will infl u-ence saleyard prices in 2008-09. For example, if seasonal conditions do not improve in most regions, and slaughterings remain high, saleyard prices could be markedly lower than currently forecast. However, prices could be higher than currently forecast if the United States does not gain full access to the Japanese market during 2008-09, or if the implementation of new Korean protocols on US beef imports are further delayed. In this case, the demand for Australian beef in these two major export markets would remain strong, placing upward pressure on export prices and hence domestic saleyard prices.
Australian beef production to fall slightly in 2008-09Total cattle slaughterings in 2007-08 are estimated to have been 3 per cent lower than in 2006-07, at 8.8 million. Most of this decline is in slaughter-ings of steers, bulls and bullocks. This reflects fewer cattle being turned off from feedlots and an increase in cattle being expor ted live. However, female cattle slaughterings remained high in 2007-08, as seasonal condi-tions in many regions remained relatively poor and producers deferred herd rebuilding. This is par ticularly the case in many regions in southern Australia.
Assuming an improvement in seasonal conditions, total cattle slaughter-ings are forecast to fall fur ther in 2008-09 to 8.7 million as producers retain cows and heifers to rebuild herds. Reflecting the overall decline in slaugh-terings, beef and veal production is forecast to fall by 1 per cent to around 2.1 million tonnes in 2008-09.
362 Australian commodities • vol 15 no 2 • June quarter 2008
Beef and veal
In response to reduced production and lower demand for Australian beef in key expor t markets, Australian beef expor ts are forecast to fall by 3 per cent in 2008-09 to 900 000 tonnes. The value of beef expor ts in 2008-09 is forecast to fall by 2 per cent to around $4 .1 billion.
Uncertainty over beef agreement between the Republic of Korea and the United StatesAn agreement relaxing the Republic of Korea’s impor t protocols on US beef was reached in April 2008. This agreement is to replace the standards set in Januar y 2006 which limit Korean impor ts of US beef to only boneless beef from cattle aged 30 months or younger. However, there have been delays in implementing the new protocols.
On 18 April 2008, the Republic of Korea and the United States reached an agreement to allow all US beef products from cattle of all ages to enter the Korean market. This is a two phase agreement with bone-in US beef from cattle 30 months of age or less allowed in the fi rst phase. Under the second phase, contingent on the United States’ publication of an enhanced feed rule, US beef from cattle older than 30 months of age was to be accepted. The amended feed rule, which expanded the list of prohibited materials that could be fed to cattle and other animals, was published the week after the agreement was reached.
Quarantine inspections of US beef were originally scheduled to resume on 15 May 2008, but this was delayed in an effor t to calm public fears in the Republic of Korea about the safety of US beef. Since then there have been numerous protests from producers and consumers about the agreement on US beef impor ts, and the implementation of the new protocol has been delayed fur ther. There has been par ticular concern about removing the 30 month age restriction and fur ther discussions about this par t of the agree-ment are now taking place.
2006 2007 2008 %-07 -08 s -09 f change
Cattle numbers million 28.0 28.1 28.2 0.4– beef million 25.4 25.5 25.6 0.4Slaughterings ’000 9 081 8 800 8 700 – 1.1Production kt 2 226 2 160 2 135 – 1.2Exports (shipped weight)– to United States kt 303 242 245 1.2– to Japan kt 403 365 350 – 4.1– to Korea, Rep. of kt 157 146 125 – 14.4– total kt 974 930 900 – 3.2– value A$m 4 634 4 160 4 080 – 1.9Live cattle ’000 638 700 680 – 2.9Price– saleyard Ac/kg 292 285 294 3.2– US import USc/kg 282 300 316 5.3– Japan import USc/kg 477 510 520 2.0
Beef and veal outlook
f ABARE forecast. s ABARE estimate.
Australian commodities • vol 15 no 2 • June quarter 2008 363
Beef and veal
If the first phase of the agreement allowing bone-in US beef product to enter the Korean market were to go ahead, Australian beef expor ts to the Republic of Korea could be adversely affected. In 2003 , prior to the ban on US beef impor ts, nearly 60 per cent of impor ted US beef was bone-in products (mainly rib cuts), which are preferred cuts in the Republic of Korea. Since the ban on US beef, Australia has been unable to supply large quanti-ties of the preferred bone-in rib cuts. As a result, Korean consumers and retailers have switched to using pork and other cuts of beef as substitutes. When US bone-in product is again available in the Republic of Korea, it is likely the demand for Australian beef would be adversely affected to some degree.
These forecasts reflect the assumption that an easing of impor t restric-tions on US beef impor ts in the Korean market will occur in mid to late 2008. Under this assumption, impor ts of US beef into the Republic of Korea are forecast to increase in 2008- 09. The increase in impor ts of US beef is expected to lead to lower demand for Austr alian beef in the Republic of Korea . Reflecting this assumed development, expor ts of Austr alian beef to the Republic of Korea are forecast to fall by 14 per cent to 125 000 tonnes.
Prior to the discover y of the BSE (bovine spongiform encephalopathy or ‘mad cow disease’) case in the United States in December 2003 , more than 60 per cent of Korean beef impor ts were sourced from the United States. Even with an expected increase in impor ts of US beef in 2008-09, impor ts of Australian beef are likely to remain well above 2003 levels, as it will take time for US beef to be impor ted and accepted by retailers and consumers.
Given the recent protests in the Republic of Korea about the agreement on US beef imports, there is considerable uncertainty about consumer accept-ance of US beef in the Republic of Korea even if the import ban is lifted. If there is low acceptance of US beef by Korean consumers and retailers, the adverse effect on Australian beef exports to the Republic of Korea could be significantly less than currently forecast.
Lower volume of beef exports to Japan in 2008-09A strong Australian dollar, higher domestic feed grain prices and the associ-ated decline in the number of cattle on feed in Australia over the past year, has led to lower expor ts of beef to Japan. In the first 11 months of 2007-08, Australian total beef expor ts to Japan declined year on year by 10 per cent, while Australian grainfed beef expor ts to Japan fell by 17 per cent. Throughout 2007-08 the landed price in Japan of Australian beef increased, with the price of grainfed beef rising relatively more than the price of grassfed beef.
364 Australian commodities • vol 15 no 2 • June quarter 2008
Beef and veal
There has been no change to the Japanese impor t protocols on US beef. Only US beef from cattle under 21 months of age is allowed to enter the Japanese market, which continues to constrain shipments of US beef to Japan. It is unclear at this stage when this restriction is likely to be relaxed. However, if the age limit on US beef is increased, it is expected there will be an adverse effect on the demand for Australian beef.
Australian beef expor ts to Japan are forecast to fall by 4 per cent in 2008-09, to 350 000 tonnes, assuming impor t restrictions on US beef are relaxed toward the end of 2008 or early 2009. The landed price of grassfed beef in Japan is forecast to increase by 2 per cent to 520 US cents a kilogram in 2008-09, reflecting lower Australian beef production.
Exports to the United States to remain largely unchangedAustralian beef expor ts to the United States are estimated to have declined in 2007-08 as cattle slaughter in the United States has been high and the US dollar has been depreciating against the Australian dollar. With cow slaughter in the United States expected to decline in 2008-09, the demand for impor ted manufacturing beef is likely to increase.
However, the production of manufacturing beef in Australia is expected to fall in 2008-09 as producers reduce cow slaughter for herd rebuilding. Australian beef expor ts to the United States are forecast to be 245 000 tonnes in 2008-09, largely unchanged from the previous year.
The increase in US impor t demand for manufacturing beef is expected to put upward pressure on the landed prices of Australian beef in the United States. In 2008-09, the US impor t price of Australian beef is forecast to increase by 5 per cent to 316 US cents a kilogram.
Live exportsExpor ts of live cattle are estimated to have increased by 10 per cent to 700 000 head in 2007-08, as the supply of suitable cattle from Australia increased and demand from Indonesia continued to grow. The increase in live expor ts also reflected the lower demand from Australian feedlots for cattle as a result of the high grain prices over the past year.
Live expor ts are forecast to decline slightly in 2008-09, reflecting the fore-cast increase in Australian cattle prices and an assumed high Australian dollar. Live cattle expor ts are forecast to fall by 3 per cent to 680 000 head.
Australian commodities • vol 15 no 2 • June quarter 2008 365
Sheep meat
Sheep Meat
Thomas Jackson and Sally Fletcher
The Australian weighted average saleyard lamb price is forecast to increase by 5 per cent in 2008- 09, to an average of 3 45 cents a kilogram. This forecast reflects a tightening in domestic supply conditions for Australian lamb and steady demand grow th in both domestic and expor t markets.
Contingent on a return to average seasonal conditions, the weighted average saleyard price of sheep is expected to increase by 10 per cent to 175 cents a kilogram in 2008-09, as producers retain sheep for flock rebuilding. If an improvement in seasonal conditions does not eventuate, sheep slaughter rates would be expected to remain high, putting downward pres-sure on saleyard prices.
Prices stronger in 2008-09 as production fallsLamb prices are forecast to increase in 2008-09 as production falls in response to flock rebuilding. The number of lambs marked is forecast to decline in 2008-09, following two years of high sheep slaughter. In 2008-09, lamb slaughterings are forecast to decline by 4 per cent to 19.8 million with lamb production forecast to fall by 5 per cent to 410 000 tonnes.
Assuming improved seasonal conditions, sheep slaughterings in 2008-09 are forecast to decline by 24 per cent to 9 million and mutton production is forecast to fall by 25 per cent to 194 000 tonnes.
Favourable prices of cereals and other grains are also expected to contribute to the decline in production of both mutton and lamb in 2008-09. High grain prices are expected to result in a near-record area of winter crops being sown in Australia in 2008-09. This is expected to contribute to lower production of both lamb and mutton by reducing the land available for sheep enterprises.
Sheep numbers to remain relatively low The Australian sheep flock is estimated to have fallen by 4 per cent to slightly less than 82 million by the end of 2007-08. The smaller flock size mainly reflects relatively high sheep slaughter throughout 2007-08, following a significant increase in slaughterings in 2006-07.
Strong lamb prices are expected to provide producers with incentives to begin flock rebuilding in 2008- 09, provided seasonal conditions are favourable. However, the reduced size of the Australian flock will limit the rate at which this rebuilding occurs. Accordingly, the size of the sheep
366 Australian commodities • vol 15 no 2 • June quarter 2008
Sheep meat
flock is not expected to increase markedly in 2008- 09. If seasonal condi-tions are favourable over the nex t few years, the speed of flock rebuilding can be expected to increase.
Exports to moderateIn 2008-09, exports of Australian lamb are forecast to decline by 5 per cent to 158 000 tonnes. This forecast decline represents the first decline in lamb exports since 2002-03 and reflects lower expected lamb supplies in 2008-09.
Expor ts of lamb from Australia increased by more than 50 per cent between 1999-2000 and 2006-07. This growth occurred despite the total size of the Australian sheep flock declining by nearly 30 per cent over the same period. This growth in expor ts was achieved because of an increase in lamb produc-tion, mainly as a result of changes in the composition of the Australian sheep flock, with a greater propor tion of ewes being joined to produce lambs for slaughter.
Expor t markets for Australian lamb are highly segmented with the largest single market, the United States, accounting for an estimated 26 per cent of total expor ts in 2007-08. Other impor tant markets include the Middle East, the European Union and China. Strong expor t growth to these and other smaller markets has been maintained in recent years despite the apprecia-tion of the Australian dollar. Between 1999-2000 and 2006-07, expor ts of lamb to the United States and the Middle East increased by 90 per cent and 104 per cent, respectively. Expor ts to China also increased sharply although from a relatively low base.
In contrast, expor ts by Australia’s major competitor, New Zealand, have not been increasing because of drought and a shift away from lamb production
Australian commodities • vol 15 no 2 • June quarter 2008 367
Sheep meat
to other agricultural activities, especially dair y. Between 1999 and 2006, for example, the total number of sheep in New Zealand declined by 16 per cent and the number of dair y cattle increased by 22 per cent.
Australian mutton expor ts are forecast to decline by 25 per cent in 2008-09 as a result of higher domestic prices for Australian mutton arising from lower sheep slaughter and the assumed streng th in the value of the Australian dollar against other currencies.
Live sheep exports to fallAssuming a return to average seasonal conditions in 2008-09, the supply of sheep for live expor t is expected to decline as producers rebuild flocks. As a result, the number of live sheep expor ted from Australia is forecast to fall 12 per cent to 3 .7 million in 2008-09.
368 Australian commodities • vol 15 no 2 • June quarter 2008
Wool
Caroline Gunning-Trant
The eastern market indicator (EMI) price for wool remains relatively high despite a steady decline which began in Februar y 2008. In early May 2008, the EMI fell below 900 cents for the first time since August 2007. This fall in prices is the combined result of a strong Australian dollar, causing wool to be more expensive for foreign buyers, and a slowing in the growth of the global economy, precipitated by the US sub-prime crisis, causing the demand for final consumer goods including woollen apparel to fall. For the 2007-08 season, the average price is estimated to be 9 per cent higher than the previous year, at 945 cents a kilogram clean.
The factors affecting the price of wool in recent months are expected to continue into next season. Slowing global economic growth, combined with escalating prices for food and fuel, will dampen retail sales for luxur y goods such as woollen apparel both in the United States and in Europe. As a result, demand for raw materials fur ther up the supply chain is expected to fall, putting downward pressure on the prices offered for wool. Compounding this issue will be the value of the Australian dollar relative to other curren-cies, which is assumed to remain strong through 2008-09. These factors will put fur ther downward pressure on prices.
At the end of the 2007-08 season, the EMI in Australian dollar terms was approximately 200 cents, or 20 per cent, lower than its peak in Januar y 2008. The streng th of the Australian dollar relative to the US dollar has resulted in a smaller decline of 12 per cent in the EMI expressed in US dollar
Wool
Australian commodities • vol 15 no 2 • June quarter 2008 369
terms, demonstrating how the exchange rate can bolster the price paid for wool in a foreign currency. In euros, the EMI has fallen 17 per cent, making wool comparatively more affordable for European buyers.
Reflecting the assumed streng th in the Australian dollar and forecast weaker consumer demand, the EMI is forecast to fall by 9 per cent to average 860 cents a kilogram clean in 2008-09. A possible mitigating factor in the extent that prices fall is, however, the effect another year of low wool production will have on stimulating competition between wool buyers.
Producers shifting to grain production in 2008-09The 2006 - 07 drought caused many wool producers to reduce sheep numbers a s pa stures dried up and the cost of purcha sing feed out weighed the returns from the sale of wool or prime lambs . The contr action of the national flock , combined with lower fleece weights a ssociated with poor feed conditions , ha s led to an estimated f all in shorn wool production to 405 000 tonnes in 2007- 08 .
High wool prices in early 2008 , combined with f avour able summer r ainf all, signalled the possibilit y of an expansion in the national flock in 2008- 09. However since that time, continued high world gr ain prices have proven enticing to producers who have strug gled financially since the drought. Many producers have therefore opted to reduce their reliance on wool production and put more empha sis into cropping for the coming year. This situation is most apparent in Western Austr alia but is also occurring in the ea stern states . The national sheep flock is estimated to have declined to 82 million by June 2008 a s a result of high slaughter numbers in 2007- 08 . Reflecting this , the number of sheep shorn is foreca st to decline by 3 per cent in 2008- 09. A ssuming aver age sea sonal conditions , the aver age cut per head is foreca st to remain
2006 2007 2008 %-07 -08 s -09 f change
Sheep numbers million 86 82 82 0.0Sheep shorn million 100 93 90 – 3.2Wool production (greasy)– shorn kt 430 405 398 – 1.7– other kt 47 47 45 – 4.3– total kt 477 452 443 – 2.0Wool exports (balance of payments basis)– volume (gr. equiv.) kt 566 492 482 – 2.0– value A$m 3 065 3 000 2 680 – 10.7Market indicator (clean) – eastern Ac/kg 864 945 860 – 9.0– western Ac/kg 856 947 857 – 9.5Auction price (gr.) Ac/kg 544 593 546 – 7.9
Wool outlook
f ABARE forecast. s ABARE estimate.
Wool
370 Australian commodities • vol 15 no 2 • June quarter 2008
largely unchanged in 2008- 09, with shorn wool production foreca st to decline by 1.7 per cent to 398 000 tonnes .
Mulesing — a challenge for the industryIn making decisions regarding flock size in the future, producers must now weigh up the costs of switching from mulesing to other methods of control-ling fly-strike. The industr y is working to phase out the practice of mulesing by the end of 2010. However, recent announcements by several high-profile international clothing retailers regarding mulesing are a matter of concern to the industr y. Such concerns have put additional stress on an industr y still tr ying to recover from drought, as well as coping with other issues such as labour shor tages.
Export demand aff ected by exchange ratesWithout any real stocks to bolster supply, the volume of raw wool expor ts in 2007-08 has followed the production trend more closely than in the past. Wool expor ts are estimated to be 13 per cent lower in 2007-08, at 492 000 tonnes. Expor t earnings in 2007-08 have been suppor ted by high average wool prices and are estimated to remain vir tually unchanged at $3 billion.
While a constrained wool supply will continue to affect the market in 2008-09, lower demand will have the greatest effect on prices. China will continue to be the largest buyer of Australian wool in 2008-09, although its demand is likely to be affected by the state of the US economy. In the United States, demand for woollen apparel from China is expected to fall in 2008-09 as a result of the US economic downturn and a weak US dollar. The softening of US demand will impact directly on the Chinese demand for Australian raw wool. Demand by European buyers is also expected to decline, following the recent downward trend of retail sales. The volume of total raw wool exports is therefore forecast to fall by 2 per cent in 2008-09 to 482 000 tonnes. Weaker average prices are forecast to result in a proportionately larger drop in export earnings, with an anticipated decline of almost 11 per cent to $2.7 billion.
Wool becoming more competitiveThe price competitiveness of wool against other fibres is gauged by its price relative to that of synthetics and cotton. Since 2006-07 there has been a general up-swing in fibre prices, not just limited to wool. Between April 2007 and April 2008 prices for polyester and acr ylic fibres have increased 11 and 17 per cent, respectively. This compares with a rise of 1 per cent in the EMI over the same period, although this small increase is the average of an 11 per cent rise between April 2007 and Januar y 2008, followed by a steady decline through to the end of April 2008.
The increase in man-made fibre prices is associated with the rise in crude oil prices, a major component in the production of these fibres. The increase
Wool
Australian commodities • vol 15 no 2 • June quarter 2008 371
in the price of man-made fibres, combined with the comparatively high prices for raw wool, has led to the wool-to-synthetic price ratio remaining relatively stable throughout the current season, at approximately 4:1.
The ratio of the 21 micron wool price to the synthetic fibre price is forecast to decline by 22 per cent in 2008-09, to average 3 .5:1, as a result of contin-uing high prices for crude oil and the forecast decline in the price of greasy wool. This price ratio is closer to the average annual ratios that occurred between 2004-05 and 2006-07 and reflects an expected increase in wool’s competitiveness.
In the case of cotton, world cotton prices have also been increasing, with the Cotlook ‘A’ price index 33 per cent higher in April 2008 compared with April 2007. After remaining steady throughout the summer months at 5 .9:1, the ratio of wool to the Cotlook ‘A’ index fell 8 per cent through autumn 2008, to average 5 . 4:1, as a result of continued high cotton prices. This implies that, during the recent autumn months, the competitiveness of wool relative to cotton increased. However, compared to the average of 4 .5:1 between 2000 and 2007, wool has become less competitive than it once was.
The ratio of the wool price to the Cotlook ‘A’ index has been less variable in 2007-08 than the previous year. In 2006-07, soaring wool prices and comparatively stable cotton prices resulted in a steep increase in the wool to cotton ratio, from a low of 4 .3:1 at the beginning of that season to a high of 6.8:1 by May 2007. So far this season, the band within which the wool to cotton ratio has fluctuated has been more narrow, between 5 .3:1 and 5 .9:1. In 2008-09, the ratio of the price of 21 micron wool to the Cotlook ‘A’ index is forecast to fall by 11 per cent to 5:1, as a result of the forecast weakening of the wool price combined with expected increases in the world cotton price.
Wool
372 Australian commodities • vol 15 no 2 • June quarter 2008
Dairy
Dairy
Peter Berry
Australian-farm gate milk prices are forecast to rise by 10 per cent to 54 cents a litre in 2008-09 after averaging around 49 cents a litre in 2007-08. Higher domestic milk prices reflect high world prices for manufactured dair y products. However, despite the high domestic prices on offer, lead times in herd rebuilding and continuing low irrigation water allocations (par ticularly in the Murray-Darling Basin) will limit the ability of many Australian dair y farmers to increase production in 2008-09.
Seasonal conditions have the potential to significantly affect world dair y prices in 2008-09. Drought in Australia, and more recently in New Zealand, has reduced dair y production and expor ts and placed upward pressure on world prices. If there is not a return to average seasonal conditions in the major producing countries, world production growth will be slower than expected and world prices could rise.
World dairy trade continues to grow slowly, despite high pricesSupply constraints in the major dair y expor ting regions are expected to limit growth in world dair y trade in 2008-09, despite solid growth in global demand.
Among the key constraints on growth in world dair y supplies are market reforms in the European Union that have led to reduced surpluses and slower growth in expor ts, and government policies discouraging expor ts from Argentina. Also, continuing effects of drought in Australia have reduced milk production and the expor t of manufactured dair y products.
In 2008-09, milk production in the European Union is forecast to increase by around 2 per cent. While higher milk prices have provided incentives to increase production, growth in EU milk output will be limited by legislated production quotas under the Common Agricultural Policy (CAP), that will restrict output in some of the largest producers. Milk production quotas for 2008 were expanded — by 0.5 per cent to 11 member states and by a further 2 per cent to all member states from 1 April. Nevertheless, milk production within the European Union is not expected to increase to the full extent allowed by quota as industry restructuring and poor profi tability of some smaller farms will prevent some member states from fi lling their national quotas. In addition, high feed costs and the continuing presence of blue-tongue disease may reduce milk yields in some regions.
For the European Union as a whole, milk production quotas under the CAP will continue to limit that dair y industr y ’s supply response to higher world dair y prices, although these quotas will be increased gradually (by 1 per cent a year over the next five years) ahead of their abolition in 2015 .
Australian commodities • vol 15 no 2 • June quarter 2008 373
Dairy
Changes in domestic dair y consumption will also significantly affect the outlook for the European Union’s exports in 2008-09. Increasing consump-tion of fluid milk and manufactured dair y products (particularly in new member states where incomes are rising) will limit growth in exports, despite increasing output. In addition, changing patterns of dair y product demand within the European Union and associated price signals have changed the dair y product mix. Cheese production has grown significantly in recent years and is using an increasing proportion of milk production. This is reducing the quantity of milk available for the manufacture of other dair y products such as milk powders. As a result, EU milk powder exports have been declining for some years, and are not expected to grow significantly in 2008-09.
In Argentina, significant new investment in dair y farming and milk processing facilities has resulted in strong increases in milk and dair y production over the past decade. Combined with strong world demand and high prices, this has created potential to expand dair y expor ts. However, Argentina’s dair y expor ts have been constrained by expor t taxes aimed at reducing expor ts and maintaining low cost supplies for domestic consumers. As a result, expor t growth is expected to be limited in the shor t-term, despite a projected recover y in production.
In New Zealand (which has over taken the European Union as the world’s largest dair y expor ter), milk production is projected to increase by around 2 per cent in 2008-09. Despite strong price incentives, that dair y indus-tr y ’s ability to rapidly increase production and expor ts is expected to be constrained by lead-times in building dair y herds, competing land uses and increasing compliance costs associated with government regulation on effluent disposal.
374 Australian commodities • vol 15 no 2 • June quarter 2008
Dairy
Dair y production in the United States is forecast to increase by around 2 per cent in 2008-09 as higher milk prices outweigh the effects of higher feed costs. US dair y expor ts have increased in response to high world prices and improved expor t competitiveness, prompted by the lower US dollar. Expor ts, par ticularly of skim milk powder and cheese, are expected to be higher in 2008-09.
In China, both the production and consumption of milk and dair y products are expected to continue to increase rapidly in 2008-09. However, with an increasing propor tion of consumption being met by domestic production, China’s dair y impor ts, par ticularly of milk powders, are expected to decline.
World dairy prices to fall, but remain relatively high in 2008-09While remaining relatively high, world dair y product prices are forecast to average lower in 2008-09 as limited increases in production and expor ts from the United States and European Union improve the availability of dair y products on world markets.
In 2008-09, world prices for skim milk powder and whole milk powder are forecast to average around 13 per cent and 6 per cent lower at US$3650 a tonne and US$4275 a tonne respectively.
World impor t demand for milk powders continues to grow, par ticularly in par ts of Asia and the Middle East where income growth is high. Demand for milk powders also remains firm in developed countries such as the United States and in the European Union.
Despite this, growth in supplies of milk powders is expected to be limited, in line with slow growth in global milk production. In addition, changing patterns of dair y demand (par ticularly in the European Union) are expected to result in more milk going to cheese production. Slow growth in produc-tion, together with the exhaustion of EU inter vention stocks, will limit the amount of milk powder available for expor t and contribute to world prices remaining at relatively high levels.
Prices for skim milk powder and whole milk powder are projected to diverge somewhat in 2008-09, largely as a result of an expected increase in expor ts of skim milk powder from the United States.
Cheese prices are forecast to average 4 per cent lower, at around US$4875 a tonne in 2008-09 as world supply grows more rapidly than demand. Cheese production in the European Union is expected to increase, reflecting solid growth in domestic demand and relatively high world prices. However, increasing domestic cheese consumption in the European Union is expected to limit growth in expor ts in 2008-09.
Australian commodities • vol 15 no 2 • June quarter 2008 375
Dairy
Cheese expor ts from Australia are expected to be slightly higher in 2008-09 in line with a forecast relatively small increase in milk production, while expor ts from the United States are expected to increase as a result of strong world prices and a weak US dollar.
Butter prices are also forecast to fall by more than 6 per cent in 2008-09 to average US$3750 a tonne. Butter consumption has been increasing as incomes in the Russian Federation, Eg ypt and par ts of the Middle East have risen. In the United States and the European Union, butter consumption is growing more slowly. Rising butter production in the European Union and increased expor ts from the United States are expected to put some down-ward pressure on world prices.
Australian milk production beginning to recoverAfter falling by an estimated 5 per cent in 2007-08, Australian milk produc-tion is forecast to rise by 1.6 per cent to around 9.25 billion litres in 2008-09. Dair y cow numbers are expected to increase for the first time in seven years.
Milk production has been affected by low rainfall in major catchments which has prevented water allocations in irrigation-dependent regions from increasing significantly. As a result, milk production costs have increased because farms have become more reliant on expensive purchased feeds rather than irrigated pasture. However, for many less affected farms, higher farm-gate milk prices have contributed to improved profitability. As a result, Australia’s total dair y herd has been recovering slowly in the first half of 2008, with milking cows attracting relatively high prices at market.
376 Australian commodities • vol 15 no 2 • June quarter 2008
Dairy
Underlying this trend, cattle numbers on individual farms remain mixed, with some dair y farmers increasing their milking herds while others have sold their cattle and water allocations.
In 2008-09, Australian milk production will be strongly linked to rainfall patterns, improved water allocations for irrigation and the cost of supple-mentar y feeds. With an assumed return to average seasonal conditions, fodder availability is expected to improve in most dair ying regions. However, pasture availability in irrigation-dependent regions of inland Australia is expected to remain difficult, as catchments will require sustained, above-average rainfall before water allocations can return to more normal levels. With feed grain prices forecast to remain relatively high over 2008-09, improving fodder supplies from on-farm and off-farm sources in spring will be the key factor allowing continued herd rebuilding and increased milk production.
Farm-gate milk prices to average higher in 2008-09In 2008-09, Australian farm-gate milk prices are forecast to rise by more than 10 per cent, to average around 54 cents a litre.
Forecast higher farm-gate milk prices reflect high world prices for dair y products and the need for processors to maintain milk supplies for their factories. Higher farm-gate prices are expected to encourage farmers to maintain milk production despite high purchased feed and water costs which might other wise result in fur ther herd reductions. Although grain prices are forecast to decline, dair y farm profitability in 2008-09 is likely to be affected by relatively high feed grain prices.
Dairy export earnings higher in 2007-08, relatively fl at in 2008-09The value of Australian dair y expor ts is estimated to have increased by 10 per cent to around $2.69 billion in 2007-08. In 2008-09, the total value of Australian dair y expor ts is projected to be relatively stable at $2.7 billion as higher expor t volumes are offset by lower world prices.
In 2008-09, the value of skim milk powder expor ts is forecast to decline by 3 per cent to $516 million. Expor t earnings from whole milk powder are expected to be down marginally to $355 million. The value of butter expor ts is forecast to remain around $216 million, while expor t earnings from casein and cheese are expected to be down by 8 per cent and 1 per cent, to $102 million and $918 million respectively.
Australian commodities • vol 15 no 2 • June quarter 2008 377
Energy and minerals
Energy and Minerals
Oil and gas
Alan Copeland and Rohan Kendall
Sharp increase in pricesThe West Texas Intermediate (WTI) oil price increased by more than 25 per cent during the June quar ter 2008 and reached a high of $US139 a barrel in early June, before a par tial reversal to $US132 a barrel in mid-June.
The surge and volatility in oil prices reflect a combination of factors. These include a tightly balanced demand-supply situation and the existence of a substantial risk premium driven by perceptions of significant potential for supply disruptions as a result of weather events and geopolitical tensions in key producing regions, notably the Middle East. In a global environment of limited spare oil production capacity, prices have become highly sensitive to the possibility of future supply shor tages. Fur ther, there is some suggestion that rising prices in the shor t-term have been par tially underpinned by finan-cial market drivers, with hedge funds investing in oil in expectation of future price rises. The interplay between the fundamental market forces affecting oil markets, the unpredictable effects of the geopolitical situation and the increase in the financial or ‘speculative’ elements in the market, has made shor t-term oil price forecasting challenging in recent times (see box 1).
Demand outpacing supplyFundamentally, the oil market has been characterised in recent times by robust demand growth, par ticularly in emerging markets, and a sluggish supply response.
While oil demand growth in OECD countries, primarily the United States, is showing early signs of slowing in response to higher oil prices, oil consump-tion in non-OECD countries, such as China and India, has continued to increase strongly. This reflects, par tly, strong economic growth, but also the effect of government fuel subsidies put in place in these countries to reduce the effect of high oil prices on consumers.
In contrast, supply has lagged behind, with relatively weak growth in non-OPEC production and a significant decline in OPEC spare production capacity.
In par ticular, oil production has been declining in Mexico and the Nor th Sea. The expected star tup of a number of new oil projects has been adversely affected by worldwide shor tages of skilled labour and equipment.
378 Australian commodities • vol 15 no 2 • June quarter 2008
2006 2007 2008Australia -07 -08 s -09 fCrude oil and condensateProduction ML 28 555 25 247 27 618 9.4Exports ML 15 965 15 710 16 709 6.4 – value A$m 8 317 10 526 15 328 45.6Imports ML 25 345 26 955 28 155 4.5Natural gas
Production Gm3 43.6 43.7 45.9 5.0LNG exports Mt 15.20 14.75 16.90 14.6 – value A$m 5 222 6 352 10 632 67.4LPG Production ML 4 550 4 276 4 400 2.9Exports ML 2 824 2 863 2 728 – 4.7 – value A$m 1 038 1 385 1 720 24.2
Oil and gas outlook
f ABARE forecast. s ABARE estimate.
In addition, uncer tainty attached to the sustainability of current price levels over the medium to longer term, and an emerging trend of resource nationalisation in a number of countries, have added to the perceived risks associated with investment in oil projects.
In May, OPEC’s effective spare production capacity fell to 1.95 million barrels a day, compared with 2.9 million barrels a day a year earlier.
Australian commodities • vol 15 no 2 • June quarter 2008 379
Oil and gas
box 1 Challenges of forecasting oil prices
Market fundamentals have clearly played a key role in sustaining high oil prices in the past few months. The sharp rise in oil prices reflects a sustained period of strong growth in demand, par ticularly in non-OECD countries, combined with weak growth in supply from non-OPEC countries and OPEC’s unwillingness to increase production from the limited spare capacity that it has available.
In such a finely balanced demand-supply situation, unanticipated supply disruptions, have had discrete and significant effects on prices, as illustrated in figure a. Disrup-tions have included attacks on oil production facilities in Nigeria throughout the first half of 2008. Also, the For ties pipeline system which connects the Nor th Sea oil fields to the United Kingdom has been temporarily shutdown as a result of industrial action at a Scottish oil refiner y. The difficulty in foreseeing the nature and timing of these types of events explains, in par t, the divergence between forecasts of oil prices and actual prices.
Overlaying the set of market fundamentals placing upward pressure on prices, have been financial market factors leading to an increase in speculative trading on oil futures. While the size of financial flows coming into the oil market has not been fully assessed, there are indications to sug gest that investment demand for oil futures by hedge funds may be a factor behind rising oil prices in the shor t-term.
Evidence of ver y tight demand-supply balance can be found in the movement of prices on the spot and futures markets. In most cases, it is expected futures prices will be higher than spot prices, reflecting largely the cost of storing oil. When this occurs, the market is said to be in ‘contango’. However, for much of the June quar ter 2008, the market has been in ‘back wardation’. That is, futures prices were lower than spot prices, reflecting market preferences to purchase oil now. These expectations are linked to some ex tent to market fundamentals – which reflect an already tight oil market that is highly vulnerable to supply disruptions.
continued...
380 Australian commodities • vol 15 no 2 • June quarter 2008
Oil and gas
box 1 Challenges of forecasting oil prices continued
The dynamics of these interrelated factors over the past few years have increased the complexity of forecasting oil prices. Since 2004 , a large number of oil price forecasters, including ABARE, have consistently underestimated the increase in world oil prices. While the majority of forecasters have been projecting a decline, world oil prices have risen to historical highs, both in nominal and real US dollar terms (figures b and c).
continued...
Australian commodities • vol 15 no 2 • June quarter 2008 381
More than 75 per cent of this capacity is located in Saudi Arabia, where a signific ant propor tion is sour crude oil that is difficult and relatively expensive to refine into low-sulfur distillates typically consumed by OECD countries.
This situation has limited the ability of production to respond quickly to unanticipated supply disruptions arising from geopolitical upheavals, natural disasters, and labour disputes, thereby underscoring the sensitivity of prices to actual or potential supply disruptions.
Market to remain tightWith little change expected in market fundamentals or in the risks to supply in the shor t-term, oil prices will continue to be volatile on a daily basis and to remain high on average.
In late June, the WTI price was around US$133 a barrel, compared with an estimated US$111 a barrel in the first half of 2008. The oil price is forecast
Oil and gas
box 1 Challenges of forecasting oil prices continued
It is also noteworthy that past expectations of participants in the oil futures market significantly understated actual movements in oil prices. As demonstrated in figure d, participants in the oil futures markets also expected oil prices would decline, consistent with oil price projections released by the majority of forecasters.
382 Australian commodities • vol 15 no 2 • June quarter 2008
to decline moderately toward the end of 2008 under the assumption that demand, par ticularly in OECD countries, is unlikely to grow, and that non-OPEC production is expected to rise gradually with a number of projects completed recently. The WTI price is forecast to average around US$122 a barrel in 2008.
Oil prices are forecast to average about US$119 a barrel in 2009. This assumes a fur ther moderate increase in non-OPEC production and lower demand growth in non-OECD countries. Geopolitical issues, par ticularly in the Middle East, and their effects on supply risks, can be expected to continue to keep prices high.
A demand response is emerging slowly OECD oil consumption is forecast to decline slightly by 1 per cent to 48.7 million barrels a day in 2008. The reduction in consumption reflects weaker economic growth, especially in the United States and western Europe, and the effect of higher prices on oil consumption. In the United States, oil consumption is forecast to fall by around 2 per cent.
To the extent the recent instability in US financial markets and the associ-ated effect on economic activity could have a flow-on effect to economic activity in economies in western Europe and in Japan, oil consumption in these economies could also be lower than expected.
In contrast, non-OECD oil consumption is forecast to increase by 4 per cent in 2008 to around 38 million barrels a day. In 2009, this growth rate is forecast to slow to 2 per cent, reflecting lower economic growth in China, Latin America and the Russian Federation. In addition, retail petrol prices in a number of Asian economies, including China, Indonesia, India, Malaysia, Pakistan, Sri Lanka and Chinese Taipei, are expected to increase as govern-ments attempt to reduce the rising fiscal burden imposed by fuel subsidies.
It is estimated that in 2008, fuel subsidies in Indonesia, for example, could reach as high as 3 per cent of gross domestic product. In response to the sharp increase in oil prices, the Indonesian Government decreased the retail fuel subsidy in May 2008, causing prices to rise by around 30 per cent. Other economies with domestic fuel subsidies are expected to consider similar moves in an attempt to reduce the size of subsidy payments.
China’s oil consumption is forecast to increase by around 5 per cent in 2008 to 7.9 million barrels a day, compared with growth of 9 per cent in 2007 and 6 per cent in 2006. This expected slower growth in oil consumption mainly reflects the assumed easing of China’s economic growth in the shor t-term, and the Chinese Government’s plan to increase domestic gasoline and diesel prices, announced in June. However, there remains considerable uncer tainty about the extent to which China’s central government will
Oil and gas
Australian commodities • vol 15 no 2 • June quarter 2008 383
continue to move toward a domestic oil pricing system that is more directly linked to international prices.
Oil demand in the Middle East is forecast to grow strongly in 2008 as a result of strong economic growth associated with revenues from high oil prices. Oil consumption in this region averaged 6.6 million barrels a day in 2007 and is forecast to increase by 5 per cent in 2008 to 6.9 million barrels a day.
Supply response remains weak in non-OPEC countriesOver the period between 2004 and 2007, non-OPEC oil supply remained around 50 million barrels a day. In the first quar ter of 2008, OECD oil supply averaged 19.7 million barrels a day, a year on year decrease of 2 per cent. Higher production from the United States was offset by falling production in Mexico and the Nor th Sea.
The limited increases in non-OPEC supply, in response to high oil prices, are also underpinned by a number of factors affecting the investment outlook for oil. Impor tantly, the uncer tainty associated with the sustainability of current prices over the medium to longer term means there may not be an increase in investment in oil projects and alternative fuels and technologies such as oil sands and coal to liquids. These risks are also being reinforced by the potential implications of future climate change response policies on the energ y sector generally.
Rising construction and input costs are providing a fur ther disincentive to investment. While the continuation of high prices in recent years has, to some extent, encouraged an increase in investment in new crude oil production capacity, many of those projects have been delayed by shor t-ages of equipment and labour, driven by capacity constraints globally.
Nonetheless, a number of recently completed projects are expected to increase oil supply from non-OPEC countries. A significant propor tion of this increase is forecast to come from the Russian Federation, the Caspian republics and Brazil. Russian oil production capacity will increase following the commencement of production from the Vankorskoye field and the first phase of the Timan Pechora field in the second half of 2008. In addition, output from the Sakhalin 2 project is forecast to increase in 2009. Higher oil production in 2008 and 2009 is also forecast from Azerbaijan (develop-ment of the Guneshli field) and Kazakhstan (expansion of the Tengiz field).
Oil production in Brazil is also forecast to increase by 9 per cent in 2008 and 8 per cent in 2009. Higher crude oil production will be suppor ted by the recent commencement of production from deepwater fields, including Roncador, Polvo and Golfinho. In addition, production of ethanol from sugar cane is forecast to increase by around 15 per cent to average 360 000 barrels a day.
Oil and gas
384 Australian commodities • vol 15 no 2 • June quarter 2008
There are a number of other projects that could contribute to an increase in crude oil production by the end of 2009. For example, in the Gulf of Mexico, a number of projects are expected to commence production in the second half of 2008 or in 2009, which will suppor t increased production. These include Blind Faith, Thunder Horse, Neptune and Tahiti.
The completion of all the projects listed in the table below, according to their planned schedule, would add a total of 1.1 million barrels a day of new oil production capacity by the end of 2009. This is equivalent to approximately 2 per cent of total non-OPEC oil production. However, this gross addition to capacity is expected to be offset to some extent by declining production from existing mature oil fields in the Nor th Sea and Mexico.
In addition to the potential increase in the production of crude oil, Canada’s production of oil sands is expected to grow by 150 000 barrels a day during the remainder of 2008, reflecting the commencement of production from the Surmont project and the expansion of the Foster Creek project.
OPEC production increases only graduallyIn the first quar ter of 2008, OPEC crude oil production averaged 32.3 million barrels a day, an increase of 6.7 per cent year on year. Around one-third of this increase is attributable to higher production quotas agreed by OPEC in September 2007. In addition, Angola became an OPEC member in December 2007, contributing an additional 500 000 barrels a day of crude oil production.
For 2008 as a whole, OPEC crude oil production is forecast to average around 31.3 million barrels a day, an increase of 2 per cent compared with 2007. Production capacity in Saudi Arabia is expected to increase in the second half of 2008 following the star tup of production from the 500 000 barrel a day Khursaniyah project.
Oil and gas
Major oil projects in non-OPEC countries
major oil fi elds capacity b/d location year
Neptune 50 000 United States 2008Thunder horse 250 000 United States 2008Blind Faith 45 000 United States 2008Horizon 110 000 Canada 2008Vincent 100 000 Australia 2008Angel 50 000 Australia 2008Vankor 150 000 Russia 2008Shenzi 100 000 United States 2009Thunder Hawke 60 000 United States 2009Tahiti 125 000 United States 2009Frade 90 000 Brazil 2009
Australian commodities • vol 15 no 2 • June quarter 2008 385
In Iraq, steady progress is being made to increase crude oil production. In the first quarter of 2008, crude oil production averaged 2. 4 million barrels a day, a 20 per cent increase from the March quarter in 2007. The Iraqi Govern-ment and Kurdish authorities have reached agreement regarding produc-tion from two fields, Tawke and Taq Taq. It is estimated production from the Tawke field could increase toward its capacity of 90 000 barrels a day, from current production of 10 000 barrels a day. Production from the Taq Taq field is scheduled to commence in late 2008, also at a rate of 10 000 barrels a day, however ultimate capacity is estimated to be 200 000 barrels a day.
Nigeria’s crude oil production in the first quar ter of 2008 was 10 per cent lower than a year earlier, as a result of maintenance, sabotage and industrial unrest. An estimated 500 000 barrels a day of production remains unre-alised because of security concerns and this situation is not expected to improve over the outlook period.
OPEC spare production capacity fallingIn May 2008, OPEC’s effective spare production capacity fell to 1.95 million barrels a day, compared with 2.9 million barrels a day a year earlier. This excludes spare capacity in Indonesia, Iraq, Nigeria and Venezuela, where it is not considered feasible to increase production in the shor t-term. OPEC spare capacity is expected to fall even fur ther in the remainder of 2008 because in mid-June Saudi Arabia agreed to increase crude oil production by 200 000 barrels a day.
In 2009, OPEC spare production capacity is not expected to increase signifi-cantly. The process of developing oil projects in OPEC is being challenged in the same way as in non-OPEC countries and the global mining industr y in general — a shor tage of labour and equipment and higher construction costs.
Australian production and exportsAustralian oil production in 2007-08 is estimated to have declined by 12 per cent to 25 .2 gigalitres (435 000 barrels a day). This estimated lower produc-tion is mainly a result of technical difficulties at a number of fields, including Mutineer–Exeter and Corallina off the nor thern Australian coast, where production in the first half of 2008 was significantly lower than in the first half of 2007.
In 2008-09, Australian oil production is forecast to increase by 9 per cent to 27.6 gigalitres (476 000 barrels a day). Additions to production capacity in 2008 include the Angel, Skua /Swift and Vincent oil fields. In addition, higher output is expected from Stybarrow field as it increases toward full capacity following commencement in late 2007. In 2008-09, these four projects, which are all located off the coast of nor th-west Australia, are anticipated to
Oil and gas
386 Australian commodities • vol 15 no 2 • June quarter 2008
operate at full capacity, which is estimated at a total of more than 220 000 barrels a day (12.7 gigalitres a year), accounting for almost half of Australian production.
Reflecting the growing production from nor th-western Australia, expor ts are also forecast to increase. With close proximity to Asian refining markets, it is assumed that oil production within the Bonapar te and Carnar von Basins, including the Stybarrow and Puffin oil fields, will be expor ted.
Australian expor ts of crude oil are forecast to increase by 6 per cent in 2008-09 to 16.7 gigalitres. The value of crude oil expor ts is forecast to increase by 46 per cent to $15 .3 billion, reflecting the sharply higher oil prices forecast for the year.
Australian LNG exports to grow Australia’s LNG expor ts in 2007-08 are estimated to have been 14 .8 million tonnes, a decrease of 7 per cent from the previous year. The estimated fall reflects planned shutdowns of facilities at the Nor th West Shelf project and Dar win for maintenance in 2007. LNG expor ts are not expected to be affected by the fire which damaged the Varanus Island gas plant in May, as the plant supplies gas exclusively into the Western Australian domestic market.
In 2008-09, Australian LNG expor ts are forecast to increase by 15 per cent to 16.9 million tonnes. This forecast increase is expected to be suppor ted by the star tup of the fifth train at the Nor th West Shelf in late 2008, expanding its capacity by 4 .2 million tonnes to 16.9 million tonnes a year. The other operating LNG project in Australia is located in Dar win, with an annual capacity of 3 million tonnes.
Reflecting higher LNG prices (which are linked to oil prices) and increased expor t shipments, the value of Australia’s LNG expor ts is forecast to increase by 67 per cent to $10.6 billion in 2008–09.
Oil and gas
Australian commodities • vol 15 no 2 • June quarter 2008 387
Thermal coal
Alan Copeland
Thermal coal prices reach record levelsIn April 2008, Australian coal suppliers and Japanese power utilities settled thermal coal contract prices at US$125 a tonne for Japanese Fiscal Year 2008 (JFY, April-March), an increase of around 125 per cent from JFY 2007. The record contract prices reflect a combination of strong growth in coal-fired electricity generation in Asia and limited increases in expor t growth from major suppliers such as Australia, South Africa and China.
In Februar y 2008, Newcastle thermal coal spot prices reached US$140 a tonne with expor ts constrained in Australia, South Africa and China as a result of weather and infrastructure related disruptions. In Queensland, heav y rain in Januar y and Februar y disrupted production at a number of expor t mines. Infrastructure constraints in the New South Wales Hunter Valley prevented coal producers in that region from increasing expor ts to compensate for the disruptions in Queensland. In China, severe snow storms resulted in increased demand for electricity, the majority of which is coal-fired, and restricted the movement of coal around the countr y. Coal stocks at a number of power stations were exhausted, resulting in electricity shor tages in some areas. In order to maximise coal availability for domestic consumption the Chinese Government restricted thermal coal expor ts for most of the first quar ter of 2008. In South Africa, a combination of weather and infrastructure issues limited expor ts in the first quar ter of the year.
In mid-June, Newcastle thermal coal spot prices traded at a record US$166 a tonne par tly reflecting rising prices of thermal coal substitutes such as oil and gas. Another factor behind the rising coal prices is concern South Africa may cut its expor ts to ensure domestic power stations have an adequate coal supply.
Over the next 18 months, thermal coal prices are expected to remain high, suppor ted by the growth in demand for coal from electricity generators in Asia, and infrastructure constraints in Australia and South Africa. Growth in demand for thermal coal impor ts in Asia is expected to continue, par ticu-larly in India, the Republic of Korea and Malaysia.
Japanese imports to grow moderatelyJapanese impor ts of thermal coal are forecast to increase by 6 per cent in 2008 to 131 million tonnes and 1 per cent to 132 million tonnes in 2009. The growth in thermal coal impor ts in 2008 reflects growth in coal-fired elec-tricity generation as a result of lower utilisation of nuclear and hydroelectric
Thermal coal
388 Australian commodities • vol 15 no 2 • June quarter 2008
2007 2008 f 2009 f %World change
Total trade Mt 683.2 704.8 730.7 3.7
ImportsAsia Mt 374.3 395.9 415.8 5.0– China Mt 44.8 41.0 43.0 4.9– Chinese Taipei Mt 60.3 63.0 64.0 1.6– India Mt 29.1 33.0 39.0 18.2– Japan Mt 124.0 131.0 132.0 0.8– Korea Mt 66.6 75.0 80.4 7.2– Malaysia Mt 13.0 14.5 17.6 21.4– other Asia Mt 36.5 38.4 39.7 3.4Europe Mt 212.5 213.1 217.0 1.8– EU 25 Mt 172.7 171.1 174.0 1.7– other Europe Mt 39.8 42.0 43.0 2.4Other Mt 96.4 95.8 97.9 2.2
capacity in the first four months of 2008. Increased impor ts of thermal coal in 2009 are expected to be suppor ted by the addition of 600 megawatts of coal-fired electricity generation capacity over the next 18 months. This new capacity could create additional coal requirement of around 1.0 million tonnes in 2009.
In the Republic of Korea, thermal coal impor ts are forecast to increase in 2008 by 13 per cent to 75 million tonnes. In 2009, impor ts are forecast to increase by a fur ther 7 per cent to 80 million tonnes. The strong growth in the Republic of Korea’s thermal coal impor ts reflects the addition of 5200 megawatts of coal-fired electricity generation between 2007 and 2009.
European Union imports steadyEuropean Union thermal coal impor ts are forecast to remain at around 170 million tonnes in 2008. Germany ’s impor ts are forecast to increase as a result of declining domestic production. Mine closures in the past 18 months will result in Germany ’s production falling by around 3 million
Thermal coal
Australian commodities • vol 15 no 2 • June quarter 2008 389
tonnes in 2008. In contrast, Spain’s thermal coal impor ts are forecast to fall in 2008 as a result of planned outages at a number of coal-fired power stations undergoing maintenance and equipment upgrades.
In 2009, impor ts of thermal coal into the European Union are forecast to increase slightly. Germany ’s coal production is expected to continue to decline, while Spain’s impor ts are forecast to increase as coal-fired power stations operate at a higher capacity utilisation compared with 2008.
China’s imports in early 2008 In 2008, China’s thermal coal impor ts are forecast to remain steady at around 40 million tonnes. Rapid growth in electricity demand and prob-lems in transpor t infrastructure between mines in China’s nor th and the main consuming regions in the south-east, have suppor ted the growth of impor ts in 2006 and 2007. However, in the first quar ter of 2008, Newcastle thermal coal prices increased by 120 per cent and this has contributed to a 23 per cent decrease in China’s impor ts compared with the same period in 2007.
The reduction in impor ts reflects the inability of power stations to pass on higher input costs to consumers in the form of higher electricity prices. Despite increases in coal prices over the past two years, China’s government has not allowed electricity prices to increase. In order for power stations to be sufficiently supplied with coal, the government will either need to limit expor ts, subsidise power stations (the majority of which are running at significant financial losses) and/or increase electricity prices.
China’s exports to continue falling China’s thermal coal expor ts are managed by a quota system, whereby licences are allocated annually to coal expor ting companies. Through this mechanism, the government is able to control how much coal is expor ted in a year. In 2008, the government plans to issue a total of 49 million tonnes of expor t licences for thermal coal in two blocks. The first block of expor t licences was issued for 29 million tonnes of thermal coal. The second block of expor t licences is expected to be issued later in the year. However, if the domestic market is not adequately supplied, it is possible fewer expor t licences than planned will be issued in the second block resulting in China’s expor ts falling compared with 2007.
Assuming 49 million tonnes of expor t licences are issued in 2008, almost all of those licences are expected to be utilised to take advantage of higher prices in expor t markets. In 2006 and 2007, only 80 per cent of licences were utilised.
Thermal coal
390 Australian commodities • vol 15 no 2 • June quarter 2008
Infrastructure constraints continue to aff ect some major suppliersIn 2008 and 2009, growing demand for impor ted coal is expected to be met by increased shipments from most major expor ters including Colombia, Indonesia and Australia. Thermal coal expor ts from South Africa are expected to remain below 70 million tonnes in 2008 and 2009 because of capacity constraints at the Richards Bay Coal Terminal. Expor ts in 2008 and 2009 could be significantly lower than 70 million tonnes if the South African Government decides to limit expor ts to ensure domestic markets will have sufficient supplies.
In 2008, Colombia’s thermal coal expor ts are forecast to increase by 6 per cent to 69 million tonnes, being suppor ted by expansions at large mines such as Cerrejon and Drummond. Fur ther expansions to capacity are planned for 2009, enabling expor ts from Colombia to increase by a fur ther 6 per cent to 73 million tonnes.
US thermal coal expor ts in 2008 are expected to rise by 9 per cent to 26 million tonnes, encouraged mainly by high prices in Europe. US thermal coal generally has a high sulfur content which makes it less desirable for European power stations than low-sulfur coal sourced from Colombia and South Africa. However, low supply growth into the Atlantic market in 2008, par ticularly from South Africa and the Russian Federation, and falling expor ts from Poland, are likely to force European power stations to use more US coal. With Atlantic supply growth forecast to remain limited in 2009, demand for US coal is expected to remain strong, with expor ts remaining around 26 million tonnes.
Indonesia’s expor ts are forecast to continue growing in 2008 and 2009, allbeit at a slower rate than in 2006 and 2007. High expor t prices have encouraged a number of companies to expand production by developing coal resources that were previously uneconomic. Large propor tions of these resources are within existing mining leases, which has enabled production to star t relatively quickly. In 2008, Indonesia’s expor ts are fore-cast to increase by 8 per cent to 203 million tonnes and in 2009 by a fur ther 7 per cent to 217 million tonnes.
Australia’s exports to growIn 2008, growth of Australia’s thermal coal expor ts is expected to continue to be limited by infrastructure constraints and significant damage to some coal mines in Queensland caused by heav y rain in Januar y and Februar y. While the majority of the affected mines produce coking coal, one of the worst affected mines was Ensham which produces around 9 million tonnes of coal a year, the bulk of which is thermal coal. At the end of May, recover y operations at Ensham were continuing and coal production was below capacity.
Thermal coal
Australian commodities • vol 15 no 2 • June quarter 2008 391
Australian thermal coal expor t growth is being hampered by infrastructure capacity constraints which are limiting the industr y ’s ability to respond to growing global demand. However, some recent additions to infrastructure capacity, together with more expansions planned for the next 18 months, will help alleviate some of these constraints.
In Queensland, expansions at the por ts of Gladstone and Dalr ymple Bay were completed in early 2008, adding 28 million tonnes a year and 8 million tonnes a year to por t handling capacity, respectively. A fur ther 17 million tonne expansion at Dalr ymple Bay is scheduled for completion in early 2009. The Abbot Point coal terminal is undergoing a 4 million tonne expan-sion, which is expected to be completed in 2009. There are also a number of rail projects under construction in New South Wales and Queensland scheduled for completion in the next 18 months that will contribute to an increase in supply chain capacity.
In New South Wales, the 30 million tonnes a year Newcastle Coal Infrastruc-ture Group terminal is under construction and scheduled to star t operation in 2010. In addition, Kooragang Island Coal Terminal is being refurbished and expanded, the result of which will be an 11 million tonne increase in handling capacity to 113 million tonnes annually.
In 2008-09, Australia’s thermal coal production is forecast to increase by 5 per cent to 191 million tonnes. The Glendell mine (4 .5 million tonnes a year, run-of-mine) and the expansion of the Dawson Complex ( 3 .5 million tonnes) in Queensland were completed in the first quar ter of 2008. In addition, a number of mines are scheduled to commence operation in the second half of 2008 and in 2009, such as the Rocglen (1.5 million tonnes a year) and Narrabri (2.5 million tonnes) coal projects.
In 2007-08, thermal coal expor t volumes are estimated to have increased by 3 per cent to 116 million tonnes. The value of expor ts is estimated to have increased by 35 per cent to more than $9 billion reflecting higher contract prices which generally took effect from April 2008. In 2008-09, Australia’s thermal coal expor ts are forecast to increase by 6 per cent to 122 million tonnes. In line with increased expor t volumes and higher prices, the value of thermal coal expor ts in 2008-09 is forecast to increase by 74 per cent to $15 .9 billion.
Thermal coal
392 Australian commodities • vol 15 no 2 • June quarter 2008
Metals
Metals
Steel and steel-making raw materials
Rohan Kendall
World steel production is forecast to grow by 5 .3 per cent to 1. 42 billion tonnes in 2008 and a further 5 . 4 per cent to 1. 49 billion tonnes in 2009. This overall strong growth in world steel production masks differences in produc-tion growth across regions. Steel production is expected to grow most rapidly in developing and transition economies, underpinned by their strong steel demand. In contrast, steel production in the United States and the Euro-pean Union is expected to be weak because of lower demand associated with lower economic growth. Low steel production growth in the United States and the European Union also reflects the longer term trend of relocating steel production facilities from developed countries to the developing world.
As a result of the strong overall growth in world steel production, demand for steel-making raw materials, such as metallurgical coal and iron ore, is forecast to remain strong.
Substantial rises in raw material prices
Iron ore price negotiations continuingThe current round of iron ore contract price negotiations has so far resulted in Brazilian company, Vale, settling prices for iron ore fines 65 to 71 per cent higher for the 2008 Japanese financial year (JFY, April to March).
Contract prices for Australian iron ore are yet to be settled because Rio Tinto and BHP Billiton are attempting to obtain a larger price increase than Vale. Shipping rates have risen substantially in the past 12 months which, because of the shor ter distance, makes the landed cost of Australian iron ore much lower than the landed cost of Brazilian iron ore in Asia. Conse-quently, Australian iron ore producers believe they should obtain a larger free-on-board contract price rise than Brazilian miners to narrow the gap between the landed cost of Australian and Brazilian iron ore in Asia.
When contract prices for Australian iron ore are eventually settled, it is expected to be the sixth consecutive year of price increases. This reflects ongoing growth in global iron ore demand, driven in par ticular by steel production in China. Higher labour and equipment costs have increased production costs for iron ore miners and placed fur ther upward pressure on iron ore prices.
Australian commodities • vol 15 no 2 • June quarter 2008 393
Steel
Metallurgical coal prices tripleContract prices for most hard coking coals have tripled for JFY 2008 rising to around US$300 a tonne for premium hard coking coal. Significant contributing factors to the large rise in contract prices include strong global demand for metallurgical coals associated with growing steel production, supply difficulties resulting from congested Australian coal expor t infra-structure and high rainfall in Queensland during the March quar ter 2008.
Asia driving steel consumption growth…World steel consumption is forecast to grow by 5 .7 per cent to 1. 40 billion tonnes in 2008 and by a fur ther 5 . 4 per cent to 1. 47 billion tonnes in 2009. Economic growth is assumed to average 7.6 per cent in non-OECD Asia during that period, and will provide the main impetus for increased world steel consumption.
Steel consumption in China and India will continue its strong expansion, as steel intensive industries, such as automobile manufacturing, electrical appliance manufacturing and construction, are expected to grow strongly in line with rising incomes and infrastructure spending. Steel consumption in China may also be boosted by reconstruction following the ear thquake in Sichuan province in May. Combined, China and India are expected to account for about two-thirds of the increase in global steel consumption in 2008 and 2009.
394 Australian commodities • vol 15 no 2 • June quarter 2008
…while US and Europe negatively aff ected by economic downturnSteel consumption in the United States is forecast to be flat in 2008 and 2009 mainly because tightening credit market conditions have reduced construction activity. US steel consumption is also being adversely affected by greater impor t competition for manufactured products from the devel-oping world, par ticularly in Asia.
Steel consumption in Europe is forecast to grow by an annual average of 2.5 per cent in 2008 and 2009, but growth across the continent is expected to be uneven. Steel consumption in the European Union is expected to grow slowly because economic growth in some of its largest members, such as Germany and Italy, is expected to be affected by the financial market difficulties. However, steel consumption in transitional economies, such as the Russian Federation, is expected to grow strongly. Contributing factors to this growth include rapid expansion of the oil and gas sector, replacing ageing infrastructure, and strong growth in household incomes flowing through to higher demand for housing and steel intensive manufactured goods, such as automobiles and household appliances.
Steel production expanding…World steel production is forecast to grow by 5 .3 per cent to 1. 42 billion tonnes in 2008 and a fur ther 5 . 4 per cent to 1. 49 billion tonnes in 2009. Much of this growth is expected to occur in emerging economies, par ticu-larly China and India, where steel mills are located close to end-use markets and production costs are relatively lower.
Steel production is also forecast to grow rapidly in countries such as the Russian Federation and the Ukraine at around 5 per cent a year. Growth in steel production in these countries can be attributed to their transition toward market based economies that has led to increased private investment in steel-making facilities and improved efficiency. The Russian and Ukraine steel industries are export focused and high steel prices in their major export markets of Europe and Asia have also encouraged production increases.
…but slower growth in China in 2008Steel production in China is expected to grow by 9 per cent to 533 million tonnes in 2008 and accelerate in 2009 to grow by 10 per cent to 586 million tonnes. The slower growth in 2008 is attributable to several shor t-term disruptions including southern China’s severe snow storms in Februar y, an ear thquake in Sichuan province in May and the expected closure of Beijing ’s steel mills during the Olympic Games in August 2008.
Steel
Australian commodities • vol 15 no 2 • June quarter 2008 395
Rapid growth in iron ore supplyGlobal iron ore production is forecast to grow by 11 per cent in 2008 to 1.8 billion tonnes and a fur ther 8 per cent in 2009 to 2 billion tonnes. Most of this increase is expected to occur in Australia, Brazil and China.
Strong growth in Australian and Brazilian iron ore production and exportsThe volume of Australian iron ore exports is forecast to grow by 23 per cent in 2008 to 328 million tonnes and a further 15 per cent to 377 million tonnes in 2009.
The increase in expor ts in 2008 and 2009 reflects the star t up of several iron ore projects. The largest is For tescue Metals’ Pilbara iron ore project ( 55 million tonne a year capacity), which commenced expor ts in May. Rio Tinto commissioned two projects in the second half of 2007 that will contribute to higher expor ts over the next two years; the 22 million tonne a year Hope Downs iron ore mine and an expansion of the Yandicoogina mine, providing an additional 16 million tonnes a year. BHP Billiton also completed the Rapid Growth 3 iron ore project (additional 20 million tonnes year) in late 2007, which should add to production and expor t volumes as it increases output. Fur ther details on Australia’s iron ore projects are available from ABARE’s Major Australian Minerals and Energ y Development Projects (April 2008).
Iron ore expor ts from Brazil are forecast to increase by 14 per cent to 306 million tonnes in 2008 and a fur ther 13 per cent to 345 million tonnes in
396 Australian commodities • vol 15 no 2 • June quarter 2008
Iron ore
2009. Increases in Brazil’s expor ts are being driven by capacity expansions by Vale in response to high prices and strong world demand. Consequently, production increases are expected from Vale’s Mariana, Minas Centrais and Carajas iron ore systems.
Production increases are also expected from Brazil’s smaller iron ore miners. Casa de Pedra and MMX are both increasing production from recently completed mine expansions, although these smaller producers are more focused on supplying the Brazilian steel industr y and are not expected to add significantly to expor t growth.
Strong growth in China’s iron ore production and importsIron ore production in China (adjusted to world average iron content) increased by 20 per cent in 2007 to 332 million tonnes, which now makes China the world’s second largest iron ore producer behind Brazil.
China’s production of iron ore is forecast to rise by a fur ther 13 per cent to around 375 million tonnes in 2008 and by 9 per cent to around 410 million tonnes in 2009. The large increase in production is being driven by mining investment in response to high prices.
Despite the increase in domestic iron ore production, China will still require large increases in imports to meet demand from its growing steel industry. China’s iron ore imports are forecast to rise by 13 per cent in 2008 to 435 million tonnes and a further 12 per cent to around 490 million tonnes in 2009.
Indian iron ore exports to fall in 2009Expor ts of iron ore from India are forecast to rise in 2008 as producers look to benefit from high spot prices in China. However, a combination of expor t taxes and inefficient infrastructure places Indian iron ore expor ters higher up the cost cur ve relative to Australian and Brazilian expor ters. With the increased amount of iron ore becoming available from Australia, Brazil and China in the next two years, it is expected iron ore spot prices will decline in 2009 and expor ts of high-cost Indian iron ore will fall. In addition, strong domestic demand would suggest that iron ore is likely to be directed to India’s domestic markets rather than for expor t.
Metallurgical coal supply constraints persistingWorld metallurgical coal trade is forecast to increase by 3 .0 per cent in 2008, limited by the flood damage in Queensland’s Bowen Basin early in the year. Australian metallurgical coal expor ts, which account for around 60 per cent of global metallurgical coal trade, fell by 6 million tonnes in the March quar ter 2008 as a result of the floods. Congestion in Australia’s coal supply chains, par ticularly in relation to por ts and rail, implies that a signifi-cant propor tion of these lost expor ts is unlikely to be made up during the remainder of 2008.
Australian commodities • vol 15 no 2 • June quarter 2008 397
In 2009, world metallurgical coal trade is forecast to increase by 7 per cent to around 250 million tonnes. An expected recover y in expor ts from Australia suppor ted by increased production and infrastructure capacity will underpin the increase.
Rising metallurgical coal prices are also expected to provide an incentive for increased production elsewhere in the world. In par ticular, China is increasing output to meet demand from its steel industr y. Production and expor ts from Nor th America and the Russian Federation are also expected to rise in response to significantly higher world prices. However, growth in these regions may be limited by por t and rail capacity.
Metallurgical coal imports rising in IndiaWorld demand for metallurgical coal is expected to continue rising strongly in 2008 and 2009 in line with growth in blast furnace output. World metal-lurgical coal consumption is forecast to grow by an average of 5 .5 per cent a year in 2008 and 2009 with China and India being the main drivers of growth.
Metallurgical coal impor ts are forecast to grow most rapidly in India at an average of 15 per cent a year in 2008 and 2009. The forecast strong growth in India’s steel production and the low quality of domestic metallurgical coal reser ves are expected to lead to an increased reliance on impor ts. China, on the other hand, has good quality domestic metallurgical coal reser ves and, because of a tight global market, is expected to focus on increasing domestic coal production to satisf y demand.
398 Australian commodities • vol 15 no 2 • June quarter 2008
Metallurgical coal
Australian iron ore and coal export earnings to rise substantiallySignificant rises in iron ore and metallurgical coal prices and forecast increases in volumes shipped are expected to lead to substantial increases in Australia’s expor t earnings from these commodities.
In 2007-08, a 9.5 per cent increase in iron ore contract prices and a 15 per cent increase in volumes shipped are estimated to have led to iron ore expor t earnings totalling $20 billion, 32 per cent higher than in 2006-07. For 2008-09, a fur ther rise in iron ore contract prices and a forecast 18 per cent rise in expor t volumes are expected to lift expor t earnings by 72 per cent to $35 billion.
Expor t earnings from metallurgical coal are estimated to have increased by 17 per cent in 2007-08 because of higher contract prices in the June quar ter. Negotiated coal contract prices took effect for 12 months star ting in April 2008 and the significantly higher negotiated prices in the June quar ter are expected to more than offset lower contract prices that applied for the first three quar ters, limited growth in expor t volumes and the stronger Australian dollar. For 2008-09, a tripling of metallurgical coal prices and an increase in expor t volumes, is forecast to lead to metallurgical coal expor t earnings more than doubling to around $39 billion.
2006 2007 2008 %-07 -08 s -09 f change
ProductionIron and steel s Mt 8.01 8.15 8.41 3.2Iron ore Mt 287.7 324.2 377.9 16.6Metallurgical coal Mt 141.9 135.2 150.5 11.3Exports Iron and steel Mt 2.65 2.32 2.55 9.9– value A$m 1 743 1 818 2 077 14.2Iron ore Mt 257.4 296.2 349.9 18.1– value A$m 15 512 20 484 35 262 72.1Metallurgical coal Mt 132 135 144 6.7– value A$m 15 039 17 535 39 068 122.8
Iron ore and steel outlook
f ABARE forecast. s ABARE estimate.
Australian commodities • vol 15 no 2 • June quarter 2008 399
Gold
Gold
Andrew Schultz
The US dollar denominated gold price continued its upward movement in the March quar ter 2008, increasing by 18 per cent to an average of US$928 an ounce compared with the December quar ter 2007. The strong invest-ment demand that suppor ted the gold price in the second half of 2007, as a result of global credit market instability, has continued into 2008. Fur ther, investor interest has increased, reflecting a weakening US dollar and lower US interest rates. These conditions are expected to suppor t the gold price in the shor t-term, leading to a forecast average price of around US$890 an ounce in 2008, a year on year increase of 28 per cent.
The US dollar denominated gold price to fall marginally in 2009In 2009, the US dollar denominated gold price is forecast to average US$855 an ounce, around 4 per cent lower than the 2008 average, largely as a result of an expected reduction in investor interest in gold. Reflecting an assumed par tial recover y in US economic growth and the likelihood of greater stability in global financial markets, investment demand for gold as a hedge against financial and economic uncer tainty is expected to moderate during 2009. This, combined with rising demand for gold jeweller y in emerging markets, is expected to provide suppor t for the gold price in 2009.
A major risk to this price outlook relates to the assumed recover y of world financial markets and US economic growth in the next 18 months. A fur ther weakening in US economic growth could lead to a fur ther depreciation of the US dollar and additional US interest rates cuts, increasing the attractive-ness of gold as a hedge against uncer tainty and placing upward pressure on the gold price.
World mine production growth to increase in 2009 World gold mine production in 2008 is forecast to decline slightly to 2453 tonnes. Modest increases in production in China, Canada and Peru are expected to be more than offset by lower production in South Africa, Indo-nesia and Australia.
Mine production in China is forecast to increase in 2008 as some new mines, such as Sino Gold’s Jinfeng mine (5 .6 tonnes per year), have commenced production in response to the higher gold prices. Zijin Mining, China’s largest mine producer, is expected to increase production by around 10 per cent in 2008. An increase in base metal production is also expected to result in higher gold output as a by-product.
In Canada, increased production in 2008 from a number of mines, including Agnico Eagle Mines Goldex mine (5 tonnes per year), is expected to offset
400 Australian commodities • vol 15 no 2 • June quarter 2008
the effect on production of the closure of mines in Ontario, Quebec and British Columbia.
In Peru, the commissioning of Newmont’s new gold mill is expected to enable the processing of higher grade ores from its Yanacocha gold mine.
Electricity supply disruptions in South Africa resulted in mines oper-ating below capacity during the first quar ter of 2008. The state-run energ y company, Eskom, has advised problems are expected to continue throughout 2008. As a result, South African mine production is expected to fall by around 10 per cent in 2008.
A fall in mine production is also forecast for Indonesia where the world’s largest gold producing mine, Grasberg, is expected to produce around 40 tonnes in 2008, down 40 per cent year on year as a result of mining lower grade ores.
In 2009, world gold mine production is forecast to grow by more than 4 per cent to 2559 tonnes, the highest since 2003 . Increases are expected from around the world including Australia, Nor th America, China and the Russian Federation. This forecast growth in production reflects the star t up of numerous projects developed over the past few years. In addition, as some global producers return to mining higher grade ores, production from mature mines is expected to increase in 2009.
Offi cial sector sales to fall in the short-termNet gold sales by the official sector in 2008 are forecast to fall by around 16 per cent to 405 tonnes, reducing growth in gold supplies to the market. This fall is expected mainly as a result of lower sales by central banks that are signatories to the European Central Bank Gold Agreement (CBGA).
2007 2008 f 2009 f %World changeFabrication
consumption t 3 072 2 908 3 077 5.8Mine production t 2 475 2 453 2 559 4.3Scrap sales t 956 1 050 1 000 – 4.8Net stock sales t – 359 – 595 – 482 – 19.0– official sector t 481 405 385 – 4.9– private sector t (394) (680) (667)– producer hedging t (446) (320) (200)Price US$/oz 697 892 855 – 4.1
2006 2007 2008-07 -08 s -09 f
AustraliaMine production t 249 231 256 10.8Exports t 400 381 404 6.0– value A$m 10 320 10 955 12 481 13.9Price A$/oz 814 916 961 4.9
Gold outlook
f ABARE forecast. s ABARE estimate.
Gold
Australian commodities • vol 15 no 2 • June quarter 2008 401
Gold
The CBGA places a collective limit of 500 tonnes a year on the quantity of gold that the signatories, comprising 18 European central banks including the European Central Bank, are permitted to sell from their reser ves. The current CBGA began in 2004 and is set to expire in 2009.
Official sector sales are forecast to decline further in 2009, to 385 tonnes, partly as central banks reduce sales in order to meet publicly stated sales targets over the five year lifetime of the CBGA which ends in September 2009.
High and volatile prices eff ect gold fabrication demand in 2008Jeweller y fabrication, the main element of gold fabrication demand, declined in the second half of 2007 as a result of the markedly higher gold prices and increased price volatility. In 2008, jeweller y fabrication is forecast to decline, resulting in gold fabrication consumption falling by a further 5 per cent to 2908 tonnes. The slowdown in jeweller y fabrication demand is expected to be most evident in the price sensitive market of India where lower retail markups mean volatility in the gold price will be fully transmitted to domestic jeweller y prices. Additionally, export oriented jeweller y fabrication in India and the Middle East is likely to decline in response to slower economic growth in Europe and North America. However, jeweller y fabrication demand in China is expected to grow strongly, reflecting fast-rising incomes.
The forecast falling gold price is expected to result in a modest increase in global jeweller y consumption in 2009. More impor tantly, an expected reduction in price volatility could then stimulate demand for gold in India and the Middle East. As such, gold fabrication demand is forecast to rise by around 6 per cent in 2009 to 3077 tonnes.
Producer dehedging to decline in 2008 and 2009Producer hedging involves gold producers borrowing gold from central banks and selling it on the spot market in order to reduce exposure to the risk of lower gold prices at the time of actual production. As a result, future mine production of gold is effectively brought for ward.
Dehedging, through the buying back or unwinding of these hedged posi-tions, has largely occurred because of producers’ expectations of an increasing gold price.
Net dehedging, with the rate of gold repayments to central banks exceeding new producer hedging, imposes upward pressure on the gold price through reducing gold supplies to the spot market.
An estimated record of 4 46 tonnes of gold was reduced from outstanding hedge positions of gold producers in 2007, primarily as a result of
402 Australian commodities • vol 15 no 2 • June quarter 2008
Gold
dehedging from Newcrest Mining, Barrick Gold and Newmont Mining. With the size of remaining hedge books diminishing, dehedging is forecast to fall to 320 tonnes in 2008 and 200 tonnes in 2009. Angologold Ashanti is expected to contribute most to dehedging in 2008, with the company proposing a reduction in their hedge book of around 130 tonnes.
Development projects to stimulate Australian gold productionAustralia’s gold mine production is estimated to have fallen by around 7 per cent to 231 tonnes in 2007-08. In the third quar ter of 2007-08, Australian gold production is estimated to have totalled 51.5 tonnes, the lowest since the June quar ter 1989. This fall reflects events such as the closure of Norilsk ’s Thunderbox project and the placing on care and maintenance of Apex Minerals’ Wiluna project and Harmony Gold’s Mount Magnet project. Also contributing to this decline was lower production from several new projects such as Mercator ’s Meekatharra project and Citigold’s Warrior mine. Changes made to mine sequencing by several major producers, par tly in response to the higher gold price, has resulted in the mining of lower grades and lower production at numerous larger mines.
In 2008-09, Australia’s gold mine production is forecast to rise by 11 per cent to 256 tonnes when a number of new medium to large scale projects are expected to begin commercial production. These include the Bodding ton joint venture redevelopment in Western Australia (averaging 26. 4 tonnes per year), St Barbara’s Gwalia Deeps expansion (6.2 tonnes), Apex Minerals Wiluna redevelopment project (6.2 tonnes), Avoca’s Higginsville project (5 .9 tonnes), Oxiana’s Prominent Hill project (3 .6 tonnes) and Dioro Explora-tion’s Frogs Leg underground project (2.6 tonnes).
Gas shor tages associated with the fire at Varanus Island in early June 2008 have the potential to affect gold production in 2008-09, however the effect is uncer tain at this stage.
Reflecting changes in Australian mine production, the volume of Australian gold exports are estimated to have fallen by around 5 per cent to 381 tonnes in 2007-08, but are forecast to rise by 6 per cent to 404 tonnes in 2008-09. The trend for export volumes to remain above domestic gold production in Australia is expected to continue in the short-term as gold dore (up to 99 per cent pure) and scrap are sourced from overseas and refined into gold bullion.
The value of Australian gold expor ts in 2007-08 is estimated to have risen by 6 per cent to $11 billion. In 2008-09, Australian expor t earnings from gold are forecast to grow by around 14 per cent to $12.5 billion as expor t volumes rise in response to increased Australian mine production, offsetting the forecast marginal fall in the US dollar denominated gold price.
Australian commodities • vol 15 no 2 • June quarter 2008 403
Aluminium
Aluminium
Rebecca McCallum and Kate Penney
In the first five months of 2008, the price of aluminium averaged around US$2800 a tonne. Aluminium production in a number of countries was disrupted by power shor tages, contributing to concerns about current and future aluminium availability and resulting in rising prices since late Januar y.
Prices rising in 2008 and 2009The world aluminium price is forecast to average US$2830 a tonne in 2008, 7 per cent higher than in 2007, and production of aluminium is forecast to increase. However, disruptions to power supplies are resulting in slower aluminium production growth than previously anticipated.
Prices are forecast to rise by a fur ther 13 per cent in 2009, averaging around US$3200 a tonne. Fur ther increases in aluminium production capacity are not expected to be sufficient to meet demand and stocks are forecast to decline to around 4 .2 weeks of world consumption.
Aluminium prices are expected to remain above the historical average of around US$2200 a tonne, reflecting par tly increasing production costs and par tly higher demand for aluminium as incomes rise in emerging econo-mies, especially China and India.
Consumption growth still driven by developing economiesWorld aluminium consumption is forecast to increase by10 per cent in 2008, to 41.0 million tonnes and by a fur ther 8.7 per cent, to 4 4 .6 million tonnes in 2009. China continues to drive world aluminium consumption growth, accounting for more than 20 per cent of world consumption in 2007. The United States accounted for a fur ther 13 per cent of world consumption.
Rising incomes and continuing infrastructure development in China are forecast to result in domestic consumption growth of 25 per cent in 2008 and 18 per cent in 2009. However, rapid expansion of aluminium smelting capacity in China is forecast to be insufficient to meet the increase in domestic demand in both years. As a result, China is forecast to be a net impor ter of aluminium in 2008 and in 2009.
In the United States, monthly total motor vehicle assemblies fell below 10 million in March 2008, for the first time since August 1994 . In April, assemblies fell fur ther and with a continuing weak US economy, this number is expected to decline fur ther in coming months. The residential housing market is also expected to remain subdued. Although there was a small increase in both housing permits and star ts in April, aluminium demand
404 Australian commodities • vol 15 no 2 • June quarter 2008
from the residential construction sector is not expected to rise until 2009. However, US aluminium orders for products including pipes, plate and coil, used in transpor t, automotive and consumer goods manufacturing , have been higher in the first five months of 2008 compared with the same period in 2007. Domestic consumption in 2008 is expected to be similar to 2007, because lower consumption is forecast for the remainder of 2008 associ-ated with weaker growth in the US economy.
Production aff ected by power supply problemsWorld aluminium production is forecast to increase by 9 per cent in 2008, to 41. 4 million tonnes. Aluminium production was disrupted by power shor t-ages in a number of countries in early 2008.
In China, aluminium production in 2008 is forecast to increase by 18 per cent, compared with growth of 32 per cent in 2007. Severe snow storms in China in the first quar ter of 2008 affected coal supply and reduced elec-tricity supply as generators were forced to shut down. As a result, some aluminium smelters are operating below capacity or have stopped produc-tion altogether. The ear thquake in mid-May fur ther reduced the potential for increase in China’s aluminium production in 2008. A number of smelters scheduled to commence production in the remainder of 2008 have been delayed because of damage caused by the ear thquake. Some new smelters, although not directly affected, may still experience problems star ting production on schedule if electricity constraints persist because priority is likely to be given to existing operations.
Australian commodities • vol 15 no 2 • June quarter 2008 405
Aluminium
In South Africa, continued power shor tages have led to BHP Billiton’s Hill-side and Bayside smelters operating at only 90 per cent of capacity (around 94 000 tonnes below capacity). With the potential for electricity shor t-ages to persist at least in the shor t-term, there is a possibility South African aluminium production will be fur ther reduced.
Dr y weather in New Zealand has also reduced the availability of hydroelec-tric power to Rio Tinto’s Tiwai Point smelter. As a result, capacity utilisation at the smelter has been reduced by 10 per cent (a loss of around 35 000 tonnes in 2008).
More broadly, uncer tainty regarding the implementation of climate change response policies in a number of countries is delaying investment decisions by aluminium companies. The availability of reliable and relatively low cost energ y is impor tant to aluminium producers. In countries such as Australia, the details of proposed emissions trading schemes are yet to be finalised and as a result, aluminium producers have delayed decisions regarding new builds or expansions indefinitely.
In 2009, world aluminium production is forecast to increase by 7 per cent, to around 4 4 .3 million tonnes. Fur ther increases in China’s capacity are expected to result in domestic production growth of more than 11 per cent.
Large new smelters scheduled to begin producing in 2009 include Hydro’s Qatalum in Qatar (capacity of 585 000 tonnes a year) and UC Rusal’s Boguchanskaya in the Russian Federation (capacity of 600 000 tonnes a year). Venalum is also expected to complete its expansion of the Puer to Ordaz smelter in Venezuela (additional 140 000 tonnes a year).
Australian aluminium production to remain largely unchangedAustralian aluminium production is forecast to be 1.96 million tonnes in 2007-08 and 2008-09. No additions or expansions to Australia’s aluminium capacity are expected over the outlook period, pending finalisation of the details of an emissions trading scheme. However, small increases in produc-tion are expected as efficiency improves at existing smelters.
Australian aluminium export earnings are estimated to have declined by11 per cent in 2007-08 to $5 .0 billion, reflecting slightly higher export volumes but lower export prices. In 2008-09, export volumes are forecast to remain around 1.7 million tonnes. However, export values are forecast to increase by more than 12 per cent to $5 .6 billion, in line with higher world aluminium prices.
406 Australian commodities • vol 15 no 2 • June quarter 2008
Alumina
Alumina
The majority of world alumina sales are on a contract basis (where the contract price is usually linked to the aluminium spot price) or accounted for as internal transactions in ver tically integrated companies. Remaining alumina is sold on the spot market, usually to Chinese aluminium smelters. As a result, alumina spot prices tend to reflect the availability of alumina spot sales and not necessarily movements in aluminium prices.
In 2008, the alumina spot price is forecast to average around US$418 a tonne, 23 per cent higher than in 2007. Demand for alumina from aluminium producers has been strong, therefore increasing the alumina spot price. In addition, rising costs of alumina production, par ticularly the cost of electricity, have suppor ted these price increases. The alumina spot price is forecast to average around US$430 a tonne in 2009.
Alumina production is expected to increase in 2008 as new projects and expansions in Brazil, China, the Russian Federation, Kazakhstan and Jamaica commence and projects that commenced in 2007 increase production toward capacity. This is forecast to result in alumina production rising by 7 per cent in 2008, to more than 85 million tonnes. Production is forecast to increase by a further 7 per cent in 2009 as additional projects in China and Global Alumi-na’s Sangredi Refi nery in Guinea (capacity of 3.2 million tonnes) commence.
Australian export volumes risingAustralian production of alumina is estimated to have increased by around 5 per cent in 2007-08, to 19. 4 million tonnes. This reflects the completion of par t of the 1.8 million tonnes a year capacity expansion at Rio Tinto’s Gove refiner y, as well as moderate production increases at other Australian refin-eries, such as Worsley and Chalco.
Production is forecast to increase by a fur ther 7 per cent in 2008-09 as construction is completed at Gove. However, there is some uncer tainty around this growth, reflecting disruptions to Western Australia’s gas supply because of a fire at the Varanus Island gas plant. As a result of these disrup-tions, Alcoa has declared force majeure on its alumina contracts but is yet to announce the effect of the disruptions on production.
In line with increased production, alumina export volumes are estimated to have increased by around 4 per cent in 2007-08, to 15.7 million tonnes. However, the value of exports is estimated to have declined by 7 per cent as a result of lower export prices in the second half of 2007 when the aluminium price fell.
Australian expor t volumes are forecast to rise by a fur ther 7 per cent in 2008-09 as alumina production increases. With both increased volumes and higher spot alumina prices, the value of Australia’s alumina expor ts is forecast to rise by 20 per cent to $7.0 million.
Australian commodities • vol 15 no 2 • June quarter 2008 407
Nickel
Nickel
Rebecca McCallum
Nickel prices averaged US$28 770 a tonne in the first four months of 2008. For 2008 as a whole, the nickel price on the London Metal Exchange is forecast to average around US$27 000 a tonne, 27 per cent lower than the record achieved in 2007. However, a recover y in demand and a relatively tight production-consumption balance are expected to contribute to prices remaining above the long term trend.
Fall in nickel price limited in 2008 and 2009In early 2008, the price of nickel was suppor ted by rising chromium prices, a decline in nickel pig iron production and an increase in demand from stain-less steel producers. Rising nickel production at new mines, scheduled to commence from mid-2008, is expected to increase nickel supply in 2009. As a result, prices are forecast to average around US$22 000 in 2009, 18 per cent lower than the forecast average in 2008.
High nickel prices in 2007 encouraged stainless steel producers to produce ferritic stainless steels. These steels contain less nickel and more chromium than austenitic stainless steels, which have historically had the largest market share. As a result, chromium prices have risen and the incentive for fur ther substitution away from austenitic stainless steel has diminished, providing suppor t for nickel consumption.
Fur ther limiting the fall in the nickel price have been rising input costs, par ticularly for nickel pig iron. As coal prices increase, the marginal cost of producing nickel pig iron rises as it is produced by smelting low grade nickel ores in blast furnaces. A nickel floor price of US$22 000 is expected to be sustained until enough nickel can be obtained from new mines or other conventional sources to replace the supply of nickel pig iron.
Nickel prices star ted to decline from a high of US$54 000 a tonne in May 2007. Since August 2007, the price of nickel has been less volatile, fluctu-ating between US$25 000 and $35 000 a tonne. In 2008, the price of nickel is forecast to average 27 per cent lower than in 2007, as a result of lower prices in the first half of 2008 compared with 2007 and slowly declining prices from May 2008.
As seen in the graph, nickel prices increased throughout 2006 and in the first half of 2007, reaching US$54 000 a tonne before a change in the London Metal Exchange’s lending rules prompted a dramatic decline in price. Prices are forecast to remain between US$20 000 and $30 000 a tonne for the remainder of 2008, resulting in a lower average price in 2008 than the previous year.
408 Australian commodities • vol 15 no 2 • June quarter 2008
Consumption growth to resume in 2008After contracting in 2007, consumption of nickel is forecast to grow by 6 per cent in 2008, to 1. 4 million tonnes, and by 8 per cent in 2009, to 1.5 million tonnes.
Manufacturing industries that consume significant quantities of nickel in the form of stainless steel are increasingly moving to China. This trend has been evident from a change in world nickel consumption patterns. Nickel consumption in western European countries fell by more than 20 per cent in 2007. Consumption in the United States, Japan, Chinese Taipei and the Republic of Korea also fell between 7 and 10 per cent. Some of this contrac-tion was the result of record high nickel prices and the slower growth of the United States economy. However, it also reflects the declining competitive-ness of manufacturing in western Europe.
In contrast, manufacturing sectors in emerging market economies are expanding. In China, nickel consumption grew by 29 per cent in 2007, with a 27 per cent increase forecast for 2008. Assumed weaker economic condi-tions in the United States and Europe in 2008 and early 2009 are expected to reduce demand for consumer durables such as whitegoods, a significant propor tion of which is impor ted from China. However, increasing demand from Chinese consumers, as incomes rise and its middle class expands, is expected to offset lower growth of expor ts and to result in an overall increase in nickel consumption.
Nickel mine production rising…A small increase in world nickel mine production is forecast for 2008 with a larger increase projected in 2009. Production is forecast to increase by 1 per cent to 1.6 million tonnes in 2008, with a fur ther 6 per cent increase in 2009, to 1.7 million tonnes.
Australian commodities • vol 15 no 2 • June quarter 2008 409
Nickel
Relatively high nickel and cobalt prices have increased the incentives for companies to expand existing operations and develop new projects. A number of larger projects commenced production in late 2007 with addi-tional star tups scheduled for late 2008. New mines including Ravensthorpe in Australia and Shakespeare in Canada as well as an expansion at Moa Bay in Cuba are expected to contribute to higher nickel production in 2008. Other large projects such as Talvivaara in Finland and Onca Puma in Brazil are scheduled for completion early in 2009, fur ther increasing world nickel mine production.
… despite lower production in some countriesProduction in the Philippines, Indonesia and New Caledonia is expected to fall and this decline is expected to offset some of the production gains from new projects elsewhere in the shor t-term.
In 2007, nickel production in the Philippines increased by 60 per cent, while production in Indonesia and New Caledonia increased by more than 20 per cent. It is estimated that the majority of this increase (some 95 000 tonnes) was in the form of low grade nickel laterite ores used to produce nickel pig iron. Demand for these ores is expected to fall in 2008 and 2009 as the cost of producing nickel pig iron increases and reduces its attractiveness over conventional ferronickel.
Refi ned production also increasingRefined nickel production is forecast to increase by 3 per cent in 2008, to 1. 48 million tonnes, and by a fur ther 4 per cent in 2009 to 1.54 million tonnes. The completion of the expansion at Yabulu in Australia is expected to add 45 000 tonnes to world refined nickel capacity and to contribute to increased refined nickel production in 2008. However, the unexpected closure of the Kalgoorlie smelter in Australia in the second half of 2008 is expected to offset some of this gain.
Nickel mines scheduled to commence production in the second half of 2008
type of additionalproject name company country expansion ore type timing capacity (kt)
Shakespeare Ursa Major Minerals Canada Greenfield Sulfide 3rd quarter 5.00Bucko Lake Crowflight Minerals Canada Greenfield Sulfide commenced 6.00Avebury Zinifex Australia Greenfield Sulfide 3rd quarter 8.50Munali Albidon Zambia Greenfield Sulfide 2nd half 8.50Moa Bay Sherritt Cuba Brownfield Laterite 2nd half 13.00Sotkamo Talvivaara Mining Finland Greenfield Sulfide 4th quarter 60.00
410 Australian commodities • vol 15 no 2 • June quarter 2008
Australian production increasing in 2008-09Australia’s nickel expor t volumes are forecast to remain largely unchanged in 2007-08. Lower mine production at Minara’s Murrin Murrin, and BHP Billiton’s Nickel West is expected to be offset by production commencing at Western Areas’ Forrestania mine (capacity of 13 000 tonnes a year) and BHP Billiton’s Ravensthorpe mine (50 000 tonnes a year).
However in 2008-09, nickel mine production in Australia is forecast to increase by 32 per cent to 256 000 tonnes. Forrestania and Ravensthorpe are expected to increase production toward capacity and production is scheduled to commence at Zinifex’s Avebur y mine in Tasmania (8500 tonnes a year).
Australian production of refined nickel is expected to remain steady in 2007-08 and to increase by 2.5 per cent in 2008-09 to 150 000 tonnes. BHP Billiton announced in mid-June the Kalgoorlie nickel smelter would be shut-down and then rebuilt because of safety concerns, reducing the smelter ’s production by around 25 000 tonnes in 2008-09. Disruption to gas supplies to Murrin Murrin as a result of the explosion at Varanus Island will also reduce refined nickel production. However, the completion of BHP Billiton’s expanded Yabulu nickel refiner y is expected to more than offset the effects of lower production at Kalgoorlie in 2008-09 as it expands toward its full capacity of 45 000 tonnes.
Terminology
Austenitic stainless steel: Stainless steel with an ‘austenitic’ chemical structure. Nickel content of the most common austenitic stainless steels (the 300 series) is usually around 8 per cent. However, the 200 series which is less widely used contains only between 1 and 3 per cent nickel.
Chromium: An element used in place of nickel to prevent corrosion of steel. Stainless steels that use chromium to reduce the need for nickel to prevent corrosion are referred to as ‘ ferritic’.
Ferritic stainless steel: Stainless steel with a ‘ ferritic’ molecular or chemical structure. Chromium is the main element used to prevent corrosion with much lower nickel content than austenitic stainless steels. The 400 series stainless steels are ferritic.
Ferronickel: An intermediate nickel product that has a high iron content. It contains up to around 20 per cent nickel. Nickel pig iron is a form of ferron-ickel but has a much lower nickel content than conventional ferronickel (only 1.5 to 8 per cent).
Nickel
Australian commodities • vol 15 no 2 • June quarter 2008 411
Copper
Copper
Michael Lampard and Kate Penney
In April 2008, world copper prices traded at a record US$8880 a tonne. The record high copper prices reflect tight market conditions triggered by labour-related disruptions at a number of Chilean mines at a time when copper stocks are historically low.
Supply disruptions to support copper prices in 2008… In 2008, world copper prices are forecast to increase by 10 per cent to US$7828 a tonne (US355 .1c/lb). In the first five months of 2008, prices aver-aged US$8077 a tonne, an increase of 22 per cent year on year. Copper prices in the second half of 2008 are expected to decline moderately but remain well above the historical average in real terms. For the remainder of 2008, copper prices are expected to be suppor ted by the tight supply–demand balance as a result of the likelihood of continued industrial disputes in Chile (the world’s largest copper producer) lower ore grades and strong demand from emerging market economies.
World consumption is expected to slightly exceed production in 2008, and as a result, world copper stocks are expected to decline to around two weeks of consumption, well below historical averages.
…but weakening in 2009In 2009, world copper prices are forecast to decline by 8 per cent to average around US$7169 a tonne (US325 .2c/lb). Additions to supply capacity are forecast to outpace growth in demand, allowing stocks to increase to 2.3 weeks of consumption.
Strong consumption growth in 2008World refined copper consumption is forecast to increase by 5 per cent in 2008 to 18.8 million tonnes as strong demand from China offsets weaker demand from developed economies.
China is expected to remain a key driver of growth in world copper consumption, with strong growth in output of copper-intensive goods such as motor vehicles, electric motors and airconditioners forecast to continue. In addition, China’s electricity generation sector and power grid, which accounts for half of China’s copper consumption, will continue to expand. In 2008, expansions to China’s electricity generation capacity are expected to total 90 gigawatts, requiring an estimated 2 million tonnes of copper.
412 Australian commodities • vol 15 no 2 • June quarter 2008
US consumption continues to declineIn the first quar ter of 2008, consumption of refined copper in the United States declined by 7 per cent year on year. This reflects a slowdown in the housing and manufacturing sectors as a result of problems in the US subprime mor tgage market. For 2008 as a whole, copper consumption in the United States is forecast to decrease by 6 per cent to 1.9 million tonnes. With weaker growth in the US economy likely to continue into the first half of 2009, growth in copper consumption is expected to be relatively subdued, although there is potential for it to recover later in 2009.
World mine production to increase despite disruptions In 2008, world copper mine production is forecast to increase by 5 per cent to 16.3 million tonnes as production commences at a number of new mines. The largest of these, in terms of production capacity include Codelco’s Gaby and Andina projects in Chile (capacity of 150 000 and 120 000 tonnes a year respectively), Equinox Minerals’ Lumwana mine in Zambia (169 000 tonnes a year) and Oxiana’s Prominent Hill mine in Australia (90 000 tonnes a year). Increased production is expected to be partially offset by production losses associated with labour disputes in Chile and Mexico, which have persisted for a number of years and are expected to continue, at least in the short-term.
In 2009, world copper mine production is forecast to increase by a fur ther 8 per cent to 17.5 million tonnes as a number of projects commissioned in 2008 approach full capacity, and two large projects in the Democratic Republic of Congo commence operations. These two projects are the Nikanor-Katanga joint venture KOV mine restar t (250 000 tonnes a year) and Freepor t’s Tenke Fungurume (114 000 tonnes a year).
Australian commodities • vol 15 no 2 • June quarter 2008 413
Copper
Despite the forecast increase in output, mine production may be adversely affected by lower ore grades, labour disputes, and difficulties in sourcing equipment, all of which present a downside risk to this production forecast with the potential to fur ther push up world copper prices.
Refi ned production expanding.World production of refined copper is forecast to increase by 4 per cent in 2008 to around 18.8 million tonnes, and by a fur ther 7 per cent to 20 million tonnes in 2009. This growth is expected to be suppor ted by 17 per cent growth in China’s refining capacity over the next two years and new solvent extraction electrowinning (SX–EW) projects in Chile. However, higher rates of growth of refined copper production is expected to be limited by the availability of copper concentrates.
Australian export earnings to increaseIn 2007-08, Australian copper mine production is estimated to have increased by 2 per cent to 874 000 tonnes. The higher production was a result of CopperCo’s Lady Annie (25 000 tonnes a year), Matrix Metals’ Leichardt mine (10 000 tonnes a year), both in Queensland, and Jabiru Metals’ Jaguar mine (9600 tonnes a year) in Western Australia all beginning operation. In addition, production at Ernest Henr y and Mount Isa increased during 2007-08 following lower production in 2006-07 as a result of main-tenance shutdowns and the mining of lower grade ores.
Solvent extraction-electrowinning (SX-EW)
Solvent extraction-electrowinning uses copper oxide ores. It is a hydro-metallurgical process, as the copper is either in an aqueous or organic environment during processing until it is reduced to a metal form. This process involves leaching the material with a weak acidic solution ( gener-ally sulfuric acid). The solution (pregnant liquor) is then recovered and contacted with an organic solvent (extractant) in the solvent extraction phase. This extracts the copper and leaves most of the impurities in the leach solution. The copper-bearing material is advanced to the electrowin-ning stage, while the leach solution is returned to the solvent extraction stage. In the electrowinning stage the copper is reduced electrochemically from the copper sulfate solution to a cathode.
SX–EW has a number of benefits over conventional processing , including the production of pure cathode on site, the ability to treat lower grade ores and its suitability for both small and large scale projects. However, the SX–EW process is electricity intensive, so the economics of production are sensitive to electricity costs.
414 Australian commodities • vol 15 no 2 • June quarter 2008
Australian copper mine production in 2008-09 is forecast to increase by 16 per cent to around 1 million tonnes. Projects scheduled to begin production in 2008-09 include Oxiana’s Prominent Hill (90 000 tonnes a year), Newmont’s Bodding ton gold project (30 000 tonnes of copper a year), CBH resources’ Sulfur Ssprings (20 000 tonnes a year) and Compass Resources’ Browns Oxide (10 000 tonnes a year).
Refined copper production is estimated to have decreased by 1 per cent to 429 000 tonnes in 2007-08, reflecting lower production at Xstrata’s Townsville Copper Refiner y and BHP Billiton’s Olympic Dam. In 2008-09, refined production is forecast to increase by 23 per cent to 529 000 tonnes, with production at Townsville and Olympic Dam expected to return to normal and CopperCo’s Lady Annie SX-EW project approaching capacity.
Reflecting higher production, Australia’s expor ts of ores and concentrates are estimated to have increased by 13 per cent. However, expor ts of refined copper are estimated to have decreased by 1 per cent in 2007-08.
In 2008- 09, expor ts of Australian copper ores and concentrates are forecast to decline by 1 per cent to 1.7 million tonnes as Australian refining capacit y increases and a larger propor tion of ores and concentrates is refined domestically. As a result of higher production, Australian expor ts of refined copper in 2008- 09 are expected to increase by 33 per cent to 381 000 tonnes.
Australian expor t earnings from copper are estimated to have increased slightly to $6.6 billion in 2007-08 as higher world prices and increased production were largely offset by the significant appreciation of the Australian dollar. In 2008-09 expor t values are forecast to increase by 8 per cent to $7.2 billion. This forecast increase in expor t earnings mainly reflects the effect of higher expor t volumes which more than offsets an expected decline in world prices.
Advanced major Australian copper projects
annual capitalproject company project startup capacity expenditure
Browns Oxide project Compass Resources New project, under construction mid-2008 10 kt $135m
Northparkes Rio Tinto Expansion, under construction 2009 extension to (E48 development) life of mine $211m
Prominent Hill Oxiana New project, under construction late 2008 120 kt $1080m
Ernest Henry underground - stage one Xstrata Expansion, committed 2009 75 kt $26m
Copper
Australian commodities • vol 15 no 2 • June quarter 2008 415
Zinc
Rohan Kendall
World spot zinc prices have averaged around US$2350 a tonne in the first five months of 2008, about 28 per cent lower than the 2007 average price of US$3243 a tonne. For 2008 as a whole, the spot price of zinc is forecast to average US$2074 a tonne on the London Metal Exchange, a decline of 36 per cent from the average price for 2007.
Prices declining as supply increasesZinc production has exceeded consumption so far in 2008, resulting in rising zinc stockpiles and falling prices. For the year as a whole, production is forecast to exceed consumption by around 175 000 tonnes, leading to zinc stockpiles increasing by 30 per cent to 3 weeks of consumption.
Zinc production is forecast to continue to exceed consumption by around 240 000 tonnes in 2009 leading to a fur ther rise in zinc stockpiles to around 3 .9 weeks of consumption. As a result, zinc prices are forecast to fall by a fur ther 15 per cent in 2009 to average about US$1770 a tonne.
Asia continues to drive world zinc demand…World refined zinc consumption is forecast to increase by 4 .1 per cent to 11.8 million tonnes in 2008 and a fur ther 4 .5 per cent to 12.3 million tonnes in 2009. Approximately 70 per cent of zinc is consumed in the construction and automotive industries in the form of galvanised (zinc coated) steel or other components such as diecast par ts.
The majority of the increase in world zinc consumption is expected to be driven by growing demand in Asia. Zinc consumption in countries such as China, India, and the Republic of Korea is expected to increase by 10 per cent, 6.5 per cent and 6. 4 per cent a year respectively in 2008 and 2009. Underpinning this growth is investment in infrastructure projects, such as roads, railways, por t and power generation. In addition, strong growth in manufacturing output, such as motor vehicle production, is expected to continue in these countries.
…but demand weak in US and EuropeZinc consumption in the United States decreased by 311 000 tonnes (23 per cent) from 2000 to 2007 owing to flat domestic sales and greater impor t competition for manufactured goods, par ticularly automotive. US zinc demand is expected to remain weak in 2008 and 2009 reflecting the nega-tiveeffects on construction and manufacturing output associated with the current economic downturn.
Zinc
416 Australian commodities • vol 15 no 2 • June quarter 2008
Zinc consumption in Europe is forecast to grow by an average of around 1 per cent a year in 2008 and 2009. Strong consumption increases in coun-tries with high rates of economic growth, such as the Russian Federation, are expected to be par tially offset by declines in Germany and Italy where global financial market instability is having a negative effect on economic activity.
Zinc production expanding rapidly…The rising stockpiles and lower price forecasts for 2008 and 2009 reflect a strong increase in supply rather than reduced demand. Significant investment in mines and refineries has occurred over the past few years in response to high zinc prices. Zinc production has increased as these projects are completed and move into production.
The largest mine commissioned recently is Apex Silver ’s San Cristobal operation in Bolivia (annual capacity of 235 000 tonnes), which began production in August 2007 and will increase output during the remainder of 2008 and 2009. Other notable mine openings adding to production in the next six months include Minera Milpo’s Cerro Lindo mine in Peru (110 000 tonnes a year) and Lundin’s Aljustrel zinc mine in Por tugal (80 000 tonnes a year).
Major additions to world zinc capacity 2007–2009
additional startup/project name owners country annual capacity expected startup kt
Cerro Lindo Minera Milpo Peru 110 mid-2007Jaguar Jabiru Metals Australia 34 June 2007Caribou Blue Note Metals Canada 43 July 2007San Cristobal Apex Silver Bolivia 235 August 2007Aljustrel Lundin Portugal 80 December 2007Sotkamo Talvivaara Finland 60 October 2008Perseverence Xstrata Canada 115 mid-2008Angas Terramin Australia 60 June 2008Rasp CBH Resources Australia 37 early 2009Tulsequah Chief Redcorp Ventures Canada 50 mid-2009Penasquito Goldcorp Mexico 189 2009Perkoa Aim Resources Burkina Faso 68 2009Sulfur Springs (Panorama) CBH Resources Australia 50 late 2009Aguas Tenidas PGM Ventures Spain 50 late 2009Wolverine Yukon Zinc Canada 50 late 2009Jabali ZincOx Yemen 70 late 2009 Russian Cu Co Russia 70 2009Dairi Herald Resources Indonesia 115 2009
Zinc
Australian commodities • vol 15 no 2 • June quarter 2008 417
Zinc
The strong increase in world mine supply is forecast to continue in 2009 with the expected start up of Goldcorp’s Penasquito mine in Mexico (189 000 tonnes a year) and the possible startup of Herald Resources’ Dairi mine (115 000 tonnes a year) in Indonesia.
In addition to the projects in the previous table, there has also been signifi-cant investment in zinc mining in China. The International Lead and Zinc Study Group expects China’s zinc mine output to rise by around 10 per cent in 2008 with a similar increase forecast in 2009.
World output of refined zinc is forecast to rise by 5 .7 per cent in 2008 to 11.9 million tonnes and a fur ther 5 per cent to 12.5 million tonnes in 2009. Increased availability of zinc concentrates should enable existing refineries and smelters to operate at full capacity and a number of new refineries are scheduled to commence production.
Significant increases in refined zinc production are expected in China where a total of 860 000 tonnes of zinc smelting capacity is scheduled to commence operation in 2008. These capacity increases are expected to more than offset shor t-term production losses associated with severe snow storms in Februar y and an ear thquake in May in China. Elsewhere, Hindustan Zinc’s second 170 000 tonne a year capacity refiner y in India was commissioned in December 2007 and smelters in Mexico and Peru are also expected to commence production over the next 18 months.
Not all of this additional capacity will translate into increased production before the end of 2009. New operations require time to reach full capacity
418 Australian commodities • vol 15 no 2 • June quarter 2008
Zinc
as processes are fine-tuned to optimise per formance. However, it does indi-cate substantial production increases are likely over the next few years.
…but lower prices may close marginal operationsThe declines in zinc prices are causing some high cost operations to close. For example, Teck Cominco has signalled its intention to close the Lennard Shelf mine (80 000 tonne a year capacity) in Australia. This mine was reopened in 2007 to take advantage of high zinc prices but is no longer viable at today ’s prices and is scheduled to close in 2009. Should there be further declines in the price of zinc, this may force other high cost operations to reduce output and could jeopardise the viability of some new projects.
Strong growth in volume of Australian productionAustralian mine output is estimated to have increased by 190 000 tonnes (14 per cent) in 2007-08 to 1.6 million tonnes. The largest contributor to this increase has been Perilya’s Beltana zinc mine which operated for a period of 12 months to take advantage of high zinc prices. The mine produced 94 000 tonnes of zinc in the first three quar ters of 2007-08 and has now ceased operations. Significant increases in production also occurred at the Centur y, Canning ton and Mt Isa mines in Queensland. Production at Centur y and Canning ton is estimated to have been higher following fewer disruptions during 2007-08, while production at Mt Isa should increase following an expansion of the zinc concentrator. The star t up of Jabiru Metals’ Jaguar mine (40 000 tonne a year capacity) is also contributing to higher production.
Australian zinc mine production is forecast to increase by a fur ther 8 per cent to 1.7 million tonnes in 2008–09. Higher production is expected from Perilya’s Broken Hill operations CBH Resources’ Endeavour mine while Jabiru Metals’ Jaguar mine is expected to continue to increase production toward capacity. In addition, the star t up of Terramin’s Angas zinc mine should also be a major contributor to higher production.
Australia has the capacity to produce around 500 000 tonnes of refined zinc annually. With no additions scheduled to Australia’s zinc refining capacity, it is expected refined zinc production will remain around 500 000 tonnes during 2008-09.
Australian export earnings to fallLower zinc prices and a stronger Australian dollar are estimated to have more than offset higher volumes expor ted, leading to a decline of 22 per cent in Australian zinc expor t earnings to $3 .3 billion in 2007-08. Expor t earnings are forecast to decline by a fur ther 30 per cent to $2.3 billion in 2008-09 as higher volumes shipped are again expected to be more than offset by lower prices.
Australian commodities • vol 15 no 2 • June quarter 2008 419
Minerals and energyMajor development projects – April 2008 listingThis report was released 21 May 2008
∑ In 2007-08, exploration expenditure in Australia’s minerals and energy sector is estimated to be at a record $6.1 billion or two and a half times the average annual expenditure on mineral exploration over the past 25 years.
∑ In the six months to April 2008, 22 major minerals and energy projects, with a total capital expenditure of $11.3 billion, were completed. A further 97 projects are at an advanced stage with projected capital expenditure of $70.5 billion.
Exploration expenditure
Investment in mineral exploration will affect the ability of Australia’s minerals and energ y sector to sustain its recent strong growth and expand its contribution to national economic per formance over the medium and longer term. Expenditure on mineral exploration represents an investment in knowledge about the size, location and quality of mineral deposits.
In general, decisions to invest in mineral exploration depend on the proba-bility of discovering an economic mineral deposit or extending the resource base of a known deposit. A range of factors influence the decision to invest in mineral exploration, some of these are common to investment decisions across the economy, while others are more specific to the minerals sector. These factors include prevailing and expected mineral prices; existing mining and processing technologies; input costs more generally; and land access and government policies.
Australian mineral exploration expenditure in real terms (2007-08 dollars) for the period 1980-81 to 2007-08 is shown in figure a. The 2007-08 data are estimates based on actual data from the Australian Bureau of Statistics (ABS) for July–December 2007, combined with data from the ABS sur vey of expected expenditure for Januar y–June 2008.
Mineral exploration expenditure in Australia is estimated to have totalled $6.1 billion in 2007-08, a 50 per cent increase on 2006-07 expenditure. In real terms, mineral exploration expenditure in 2007-08 is estimated to have been the highest on record and two and a half times the average annual expenditure on mineral exploration over the past 25 years.
Minerals and energy projects listing
420 Australian commodities • vol 15 no 2 • June quarter 2008
The dramatic increase in exploration expenditure is a response to higher world prices for most mineral and energ y commodities as supply struggles to keep pace with growth in demand. It also reflects the trend toward devel-oping projects with higher production capacities, which generally require larger resource delineation programs.
In recent years, expenditure on brownfield exploration, that is exploration around existing or known deposits, has accounted for an increasing propor-tion of total exploration expenditure. This is par tly explained by companies reassessing reser ves at current and depleted deposits which are more economic to extract at higher world prices. Fur ther, mining in brownfield locations is attractive for companies because mineral extraction can star t sooner and generally requires lower capital expenditure than that of green-field projects because infrastructure already exists.
In 2007-08, exploration expenditure on all major mineral and energ y commodities is estimated to have increased. Petroleum exploration expenditure is estimated to have risen by 41 per cent in 2007-08 to around $3 .2 billion. Expenditure on petroleum exploration (in 2007-08 dollars) is estimated to have been the highest on record, encouraged by high global oil prices.
Exploration expenditure on iron ore is estimated to have increased by 76 per cent to $503 million in 2007-08 and has accounted for an increasing propor-tion of total mineral exploration expenditure over the past seven years. High contract prices and the prospect of continued strong demand in China over the medium term are the principal drivers behind this signifi cant increase in expenditure.
Gold exploration expenditure in 2007-08 is estimated to have increased by 40 per cent to around $660 million, the highest on record since 1997-98. The increased expenditure reflects the higher Australian dollar denomi-nated gold prices forecast to average A$916 an ounce in 2007-08, an increase of 13 per cent from 2006-07.
In 2007-08, exploration expenditure on base metals, including copper, silver, lead, zinc, nickel and cobalt, is estimated to have risen by 66 per cent to around $945 million. Expenditure on exploration for all base metals is estimated to have increased, par ticularly for nickel and copper, reflecting continued high global prices. In real terms, exploration expenditure on base metals in 2007-08 is estimated to have been more than three times the 25 year average.
Uranium exploration expenditure is estimated to have more than doubled in 2007-08 to around $285 million. This reflects relatively high uranium prices and an increased interest in uranium for use in nuclear power globally.
Minerals and energy projects listing
Australian commodities • vol 15 no 2 • June quarter 2008 421
Minerals and energy projects listing
Long lead times for key items of equipment encourage early expenditure commitments
Together with the rest of the world, Australia’s mineral resources sector is facing difficulties in securing inputs such as grinding mills, draglines and locomotives. This reflects the recent acceleration in global exploration and development in order to meet growing global demand for mineral and energ y commodities, par ticularly in China.
As such, the lead times for key items of equipment have increased consid-erably over the past few years. For example, according to Rio Tinto, lead times for obtaining large haul trucks and tyres have increased from around three months to around two years.
In response to the long lead times for obtaining key items of equipment, a number of companies are announcing pre-approval funding (prior to the final investment decision) to allow for procuring cer tain items of equip-ment in time for the expected project star tup.
For example, Woodside announced pre-approval funding of $1. 4 billion for its Pluto LNG project in Western Australia in December 2006 to allow for long lead time items and site preparation. The project was subject to a final investment approval decision in mid-2007.
Similarly, BHP Billiton announced approval for US$1 billion (A$1.3 billion) of capital expenditure to suppor t infrastructure development at its Rapid Growth Project 5 in Western Australia in Februar y 2008. This funding will be used to commence duplicating the railway track between the Yandi mine and Por t Hedland, and allows procuring items earlier which have long lead times, such as locomotives.
On a smaller scale, in March 2008, Iluka Resources announced funding of up to $8 million to procure cer tain long lead capital equipment integral to developing its Jacinth Ambrosia mineral sands project in the Eucla Basin of South Australia.
With a large number of minerals and energ y projects currently committed or under development over the next few years, decisions to pre-approve funding for equipment with long lead times will increase the prob-ability projects will commence operations at their targeted star tup dates.
422 Australian commodities • vol 15 no 2 • June quarter 2008
Over the medium term, exploration expenditure is expected to be influ-enced by a common set of factors in each of the main exploration sectors. These include the outlook for prices over the medium to longer term, prospectivity, expected future costs of exploration and development — including costs of labour, fuel and other inputs — and Australia’s relative attractiveness for mineral exploration and extraction.
Capital expenditure
New capital expenditure in the mining and metal products industries provides an indication, in aggregate terms, of the pace and scale of develop-ment in the Australian minerals and energ y sector (figure b).
Based on ABS sur vey data, new capital expenditure in the mining industr y is estimated to have been $32.3 billion in 2007-08, 25 per cent higher than in 2006-07. In real terms (2007-08 dollars), new capital expenditure in 2007-08 is estimated to have been the highest on record and more than two and a half times the average annual expenditure over the past 25 years ($12.7 billion).
There are indications capital expenditure in the mining sector may increase fur ther in 2008-09. Based on industr y intentions canvassed in the December quar ter 2007, ABS data indicate capital expenditure on mining in 2008-09 may be around $36.5 billion (2007-08 dollars). If this expenditure is realised, this would represent a 29 per cent increase on 2007-08 expendi-ture. The scale of this expenditure and its order of increase are consistent with development trends shown in the full list of major mineral and energ y projects.
However, capital expenditure in the metals products sector, which includes mineral processing activities covered in ABARE’s projects list, is estimated to have been $3 .8 billion in 2007-08, approximately 19 per cent lower (in real terms) than in 2006-07. Sur veyed industr y intentions indicate metal prod-ucts expenditure could fall by a fur ther 15 per cent in 2008-09 to $3 .3 billion (2007-08 dollars). This reflects the completion, or expected completion, of a number of large scale projects. However, this is likely to be par tially offset by the commitment of new projects including the Yar wun alumina refiner y, the two upgrades at the Boyne Island smelter (both in Queensland) and the recently approved Worsley alumina refiner y expansion in Western Australia.
Recently commissioned projects
In the six months ended April 2008, 22 major minerals and energ y projects, with a record total capital expenditure of $11.3 billion, were completed. The completion of these projects is expected to result in increased production and expor t capacity for a range of commodities including coal, petroleum,
Minerals and energy projects listing
Australian commodities • vol 15 no 2 • June quarter 2008 423
Minerals and energy projects listing
iron ore, gold, mineral sands and nickel. A summar y of these projects is provided in table 1.
While the total number of projects completed in the six months ended April 2008 is seven less than that for the six months ended October 2007 (table 2, figure c), the total capital expenditure was significantly higher than for the six months ended October 2007 and April 2007, respectively. The average value of projects completed in the six month period to April
1 Major mineral resource developments - projects completed, October 2007 to April 2008
capital project location company expenditure $mMining projects - energy Black coal Glendell opencut NSW Xstrata Mount Owen (washplant upgrade to wash Glendell coal) NSW Xstrata 290 Blackwater coal handling and processing facility Qld BHP Billiton Mitsubishi Alliance (BMA) 320 Dawson project Qld Anglo Coal Australia/Mitsui 1 120 Sonoma coal project Qld Qcoal 200 Blackwater to Burngrove duplication (rail) Qld Queensland Rail 43 Callemondah to RG Tanna 3rd spur Qld Queensland Rail 40 Dalrymple Bay Coal terminal 3rd Rail Loop Qld Queensland Rail 109 Dalrymple Bay Coal terminal 7X expansion project Phase 1 Qld Babcock and Brown Infrastructure 530 RG Tanna Coal terminal expansion Qld Central Queensland Ports Authority 800
Petroleum Stybarrow oil field WA BHP Billiton/ Woodside Energy 874 Dampier–Bunbury gas pipeline (DBNGP) expansion (Stage 5A) WA DBP 660
Mining projects – mineral Gold Perseverance (Coolgardie gold project) WA Focus Resources/ Committee Bay Resources 2.8
Iron ore Hope Downs Stage 1 WA Hancock Prospecting / Rio Tinto 1 130 Western Australian Iron Ore Rapid Growth project 3 (RGP3) WA BHP Billiton 1 730
Mineral sands Mindarie Zircon project SA Australian Zircon 74 Gwindinup WA BeMax Resources 17
Nickel Carnilya Hill WA Mincor/ View Resources 28 Cosmos project (includes Prospero and Tapinos deposits) WA Jubilee Mines Flying Fox (T1 deposit) (part of Forrestania project) WA Western Areas 165 Ravensthorpe WA BHP Billiton 2 400
424 Australian commodities • vol 15 no 2 • June quarter 2008
2008 was $512 million, around twice the historical average over the past nine years of around $255 million (in 2007-08 dollars).
Looking ahead, ABARE’s project list indicates the rate of project completion is likely to accelerate in the shor t-term, with 38 advanced projects scheduled for completion before the end of 2008. However, there is a possibility some of these projects will not meet announced scheduled completion dates or forecast budgets because of strong industr y wide competition for skilled labour and equipment.
Energy projectsIn the six months ended April 2008, 12 energ y projects (including infra-structure) were completed with a capital expenditure of $5 billion. Of these, 10 projects were coal mines and expor t infrastructure projects. The largest
2 Completed projects, June 1998 to April 2008
number of total capital average capital projects cost of projects cost of projects $m $mSix months ending June-98 3 415 138December-98 18 3 500 194June-99 19 6 500 342December-99 16 4 300 269June-00 9 1 800 200December-00 9 1 700 189June-01 5 282 56December-01 5 262 52June-02 10 1 082 108December-02 10 2 110 211
Australian commodities • vol 15 no 2 • June quarter 2008 425
ABARE’s list of major minerals and energy development projects
The full list
ABARE’s list of major minerals and energ y projects which are expected to be developed over the medium term is compiled ever y six months. Information contained in the list spans the mineral resources sector and includes energ y and mineral commodities projects and mineral processing projects. The information comes predominantly from publicly available sources but, in some cases, is supplemented by information direct from companies. The list is fully updated to reflect developments in the previous six months. The projects list is released around May and November each year.
What’s in the list
The latest projects list contains information on 3 41 projects, providing the following details:
• project name
• location
• expected star tup date
• capital cost of the project
• proponent company or joint venture
• project status
• additional output capacity
• additional employment, where available.
With one industr y exception, ABARE’s list provides details of each announced project for which total capital expenditure is expected to exceed $40 million. The exception is the gold industr y, which typically has a relatively large number of smaller projects. For gold, the expenditure threshold for inclusion in the list is $15 million.
In general, included projects are at relatively advanced stages of plan-ning. That is, for new projects the stage of planning categories range from ‘prefeasibility study under way ’ through to ‘under construction’.
Projects are listed by the principal mineral commodity to be produced, under the broad headings: mining projects – energ y; mining projects – minerals; and mineral processing facilities. The list includes new green-fields projects as well as expansions of existing projects.
Where to get the list
The list is only available as an electronic product.
426 Australian commodities • vol 15 no 2 • June quarter 2008
coal mining project was the $1.1 billion Dawson project, located south-west of Gladstone, Queensland. The project, which has a capacity of 5 .7 million tonnes of coking and thermal coal, is a joint venture between Anglo Coal Australia and Mitsui. Also completed were the Glendell, New South Wales (4 million tonnes) and Sonoma, Queensland (2 million tonnes) projects.
In the six months to April 2008, five coal infrastructure projects were completed. The most notable of these, in terms of capital expenditure, are the expansion of the RG Tanna coal terminal at the por t of Gladstone, Queensland (capital expenditure of $800 million), which will increase capacity by 28 million tonnes, and Phase 1 of the 7X expansion at Dalr ymple Bay Coal Terminal ($530 million), which will increase capacity by 8 million tonnes. In addition, three rail projects were completed at a total cost of $192 million.
Off the west coast of Australia, BHP Billiton’s Stybarrow oil project (capacity of 80 000 barrels a day) was completed two months ahead of schedule at a cost of $874 million. DBP’s Dampier–Bunbur y gas pipeline Stage 5A expan-sion, also in Western Australia, was completed at a cost of $660 million. The pipeline is capable of transpor ting an additional 100 terajoules of natural gas a day.
Metal mining projectsIn the six months to April 2008, nine metal mining projects were completed at a capital cost of $5 .5 billion. Three projects accounted for 95 per cent of this capital expenditure. The largest project was BHP Billiton’s $2. 4 billion Ravensthorpe project in Western Australia. The project will produce 50 000 tonnes of nickel and 1400 tonnes of cobalt a year, which will be transported to the Yabulu nickel refiner y, north of Townsville, for refining.
In the Pilbara region of Western Australia, two iron ore projects were completed during the six months to April 2008. BHP Billiton’s Rapid Growth Project 3 project was completed at a cost of $1.7 billion and will increase capacity at the mine by 20 million tonnes a year. In addition, Hope Downs Stage 1, a joint venture between Hancock Prospecting and Rio Tinto, was completed with a capital cost of $1.1 billion and will be capable of producing up to 22 million tonnes of iron ore annually.
Western Australian projects Mincor and View Resources’ Carnilya Hill and Western Areas’ Flying Fox (T1 deposit) were completed for a combined cost of $193 million. These projects are anticipated to have average outputs of 5000 tonnes and 8000–10 000 tonnes of nickel, respectively. In addition in South Australia, Australian Zircon’s Mindarie zircon project (capital expenditure of $74 million) will have an annual production of 6000–12 000
Minerals and energy projects listing
Australian commodities • vol 15 no 2 • June quarter 2008 427
tonnes of rutile, 31 000–50 000 tonnes of zircon, 60 000–110 000 tonnes of ilmenite and 4000–9000 tonnes of leucoxene.
Mineral processing projectsBHP Billiton’s Yabulu extension project in Townsville was completed during the first quar ter of 2008 at a capital cost of $731 million. The refiner y exten-sion will process ore from the Ravensthorpe mine, increasing its annual capacity by 45 000 tonnes of nickel and 1400 tonnes of cobalt.
Advanced projects
At the end of April 2008, there were 97 projects at advanced stages of development included in ABARE’s project list (table 3). These projects are either committed or under construction. This is broadly similar to the number of advanced projects in the October 2007 list. The number of advanced projects in the April 2008 list includes 14 projects that are either newly committed or entered the list at an advanced stage during the past six months. Total capital expenditure of the 97 advanced projects at the end of April 2008 comes to $70.5 billion, an increase of 21 per cent from October 2007 and 62 per cent year on year.
However, it should be noted projects which have reached the committed stage may be deferred, modified or even cancelled if economic or competi-tive circumstances change significantly. This is par ticularly relevant in the current period of rapid project development in which the global mineral resources sector is experiencing significant difficulties in securing sufficient inputs including materials, equipment and skilled labour. In this capacity
3 Advanced projects, April 2008 – number and estimated capital cost by state
mining mining mineral projects – energy projects – minerals processing facilities total
428 Australian commodities • vol 15 no 2 • June quarter 2008
constrained environment, the effect on project development is manifested in delays to scheduled completion dates for projects and increases in project capital costs.
For example, Dyno Nobel’s Moranbah ammonium nitrate plant in the Bowen Basin in nor th Queensland was removed from the April 2008 advanced projects list. Dyno Nobel cited substantial delays and difficulty in reliably forecasting project costs as the main reasons for suspending the develop-ment indefinitely.
In line with previous ABARE project listings, current investment intentions in the Australian minerals sector, as reflected in the large number and record value of minerals and energ y projects committed to, or under construction, continue to bode well for the sector ’s growth over the next few years.
The 97 advanced projects as at April 2008 indicate continued expansion across most mineral and energ y commodities and will suppor t increased Australian production over the medium term.
Minerals and energy projects listing
Australian commodities • vol 15 no 2 • June quarter 2008 429
Energy projectsAs at April 2008, energ y project developments accounted for 47 of the 97 advanced projects on ABARE’s list and around 55 per cent (or $38.8 billion) of committed capital expenditure. Estimated capital expenditure on energ y projects has increased by 23 per cent since October 2007, reflecting the addition of 15 projects, wor th a combined $10 billion, to the advanced list.
In terms of capital expenditure, Woodside’s Pluto LNG project, which has an announced capital cost of $12 billion, is the largest commitment to a single project in Australia’s mining and energ y industr y.
This project will have an annual production capacity of 4.3 million tonnes of LNG and is scheduled for completion in late 2010. The gas has been purchased by Tokyo Gas and Kansai Electric in Japan under long term contracts.
Six large petroleum developments, four operated by Woodside, account for a fur ther $14 billion or around 36 per cent of the total value of advanced energ y projects. The largest of these projects is the $5 .9 billion Nor th West Shelf Nor th Rankin B project in Western Australia. A fifth train is being built at the Nor th West Shelf project in Western Australia. It will have a gross annual capacity of 4 . 4 million tonnes of LNG and will increase the project’s total annual production to 16.3 million tonnes. The project is expected to be completed toward the end of 2008 at a capital cost of $2.6 billion.
The other four petroleum projects are the $1.9 billion Pyrenees oil field, located 50 kilometres nor th of Exmouth in Western Australia, scheduled for completion in 2010; the $1. 4 billion Angel gas and condensate field in the Carnar von Basin, scheduled for completion in 2008; the $1.3 billion Kipper gas and condensate field off the coast of Gippsland, scheduled for completion in 2011; and the $1 billion Vincent oil field in the Carnar von Basin, scheduled for completion in late 2008.
As at the end of April 2008, there were six natural gas pipelines at an advanced stage. Epic Energy has committed to constructing the 180 kilometres QSN Link which will connect the existing south-western Queensland network to the Moomba gas hub in northern South Australia. When the $140 million pipeline is completed, gas will be able to be piped from Queensland into the southern and eastern Australian gas markets.
Coal mine and coal infrastructure projects account for 18 per cent (or $6.8 billion) of the estimated capital cost of $38.8 billion for all advanced projects. The largest coal mine development in terms of capital cost is the Rio Tinto $1.1 billion Kestrel project, nor th east of Emerald. This will add around 1.7 million tonnes of coking coal capacity from 2012. Rio Tinto is also developing the Clermont opencut mine (capital cost $860 million) in Queensland. The mine will produce 12.2 million tonnes of thermal coal a
Minerals and energy projects listing
430 Australian commodities • vol 15 no 2 • June quarter 2008
year from 2010 and is expected to replace capacity from the existing Blair Athol mine. Anglo Coal and Mitsui’s Lake Lindsay opencut mine (capital cost of $690 million), near German Creek in central Queensland, is expected to commence production in 2008. Output will subsequently build up to a full capacity of around 4 million tonnes a year, mainly of hard coking and PCI coals.
Apar t from those listed above, six other advanced coal mine developments in Queensland and New South Wales are expected to raise coal production capacity by around 12. 4 million tonnes a year in the next two to three years. The combined capital cost of these six projects is $1.2 billion.
The large number of coal projects recently commissioned and scheduled for completion in the shor t to medium term has provided the impetus for expanded coal infrastructure (rail and por t) capacity. At the end of April 2008, there were four coal terminal expansions and three rail expansions either committed or under construction. The largest of these projects, in terms of capital expenditure, is the first stage of the Newcastle Coal Infra-structure Group expor t terminal at the por t of Newcastle.
When completed in early 2010, this $1 billion terminal will have a coal loading capacity of 30 million tonnes a year. Fur ther upgrades to the terminal could increase annual coal handling capacity to 66 million tonnes a year. Also at the Por t of Newcastle, Por t Waratah Coal ser vices is expanding and refur-bishing the Kooragang Island Coal Terminal. The $456 million project will result in an increased coal loading capacity of 11 million tonnes.
In total, coal infrastructure projects have an estimated capital cost of $2.6 billion or around 40 per cent of total committed capital expenditure in the coal industr y.
Metal mining projectsAt the end of April 2008, there were 41 advanced metals mining projects collectively valued at around $25.7 billion. Around half of these projects are located in Western Australia and comprise almost 90 per cent ($22.3 billion) of the estimated total capital expenditure. Nine metal mining projects, including iron ore (7), gold (1) and copper (1 project) account for almost 85 per cent ($19.5 billion) of committed metal mining capital expenditure in Australia.
In the six months to April 2008, 10 projects with a combined expenditure of $10.1 billion were added to the advanced project list, of which five were iron ore projects. The largest of these is CITIC Pacific Mining ’s Sino Iron project in Cape Preston, Western Australia ($5 .2 billion), which will have a produc-tion capacity of 27 million tonnes of iron ore pellets and concentrates. This project is expected to be completed in 2009.
Minerals and energy projects listing
Australian commodities • vol 15 no 2 • June quarter 2008 431
Rio Tinto has approved the Hammersley Iron Brockman 4 project in Western Australia ($1.7 billion), which is scheduled for completion in 2010. Initial production capacity will be 22 million tonnes a year, with the potential to build up to 36 million tonnes a year. Rio Tinto has also approved the Mesa A project ($1 billion), which is expected to build up to an expected capacity of 25 million tonnes a year from 2010.
BHP Billiton and Rio Tinto are progressing three iron ore infrastructure projects, with a collective capital expenditure of $1.3 billion. BHP Billiton’s Western Australian Iron Ore infrastructure project is expected to cost $1.3 billion and increase rail capacit y to 300 million tonnes a year from 2011. Rio Tinto’s East Intercourse Island project, also in Western Australia, is under construction. The whar f upgrade and ship loader replacement are expected to be completed in 2009 and to cost $75 million. In addition, Rio Tinto and Robe River have committed to a 25 million tonne expan-sion of their Cape Lamber t por t facilities ($1.1 billion). The expansion is expected to be completed in late 2008.
The significant growth in planned capital expenditure on iron ore projects reflects significant increases in iron ore prices during the past five years and the prospect of continued strong demand growth. Much of the projected growth in demand for Australian iron ore expor ts is expected to emanate from China as increases in its domestic production fail to keep pace with the increased demand associated with higher steel output.
The largest advanced gold project is Newmont and AngloGold Ashanti’s $2.6 billion redevelopment of the Bodding ton gold mine near Pinjarra in Western Australia. The redevelopment of Bodding ton is scheduled to be completed in early 2009, with an annual capacity of 850 000 ounces of gold and 30 000 tonnes of copper. Six other gold projects located in New South Wales, Victoria and Western Australia are either committed or under construction with a combined capital cost of $1.1 billion.
There are four copper projects currently under construction with a combined capital expenditure of $1.5 billion. The largest of these are Oxiana’s Prominent Hill project in South Australia and Rio Tinto’s expansion of its Nor thparkes mine in central New South Wales.
Prominent Hill is a greenfield project located south east of Coober Pedy and is due for completion in late 2008. The $1.1 billion project will produce 90 000 tonnes of copper in concentrates, 115 000 ounces of gold and 420 000 ounces of silver annually. In central New South Wales, Rio Tinto is under taking a $211 million upgrade of its Nor thparkes mine which is due to be completed in 2009. The upgrade to Nor thparkes will not result in an increase in capacity, but will allow for production at the mine to continue until 2016.
Minerals and energy projects listing
432 Australian commodities • vol 15 no 2 • June quarter 2008
In relation to diamonds, Rio Tinto’s Arg yle underground development in Western Australia is under construction. The development is expected to be completed in 2009 at a capital cost of $1.7 billion.
Mineral processing projectsAt the end of April 2008, there were nine advanced mineral processing projects, compared with six projects listed in October 2007. The combined capital expenditure on these projects is $6 billion, a 67 per cent increase from the figure quoted in the October 2007 list. The increase in capital expenditure largely reflects the recent approval of the Worsley Refiner y Efficiency and Growth project in Western Australia. The project is a joint venture between BHP Billiton (operator), Japan Alumina and Sojitz Alumina and has an announced capital cost of $2.5 billion. The project is expected to increase annual production capacity by 1.1 million tonnes and is due for completion in 2011.
In terms of capital expenditure, the other large mineral processing project is Rio Tinto’s Yar wun alumina refiner y expansion in Gladstone, Queensland. The project is expected to have a capital cost of $2.1 billion and add 2.2 million tonnes a year to its capacity from 2011.
Other major mineral processing projects include Rio Tinto’s upgrade at the Boyne Island aluminium smelter in Queensland and the reline at Bluescope’s Por t Kembla blast furnace in New South Wales.
At the Boyne Island aluminium smelter, Rio Tinto plans to replace cranes and runway lines one and two; and replace carbon bake furnace lines one and two. These projects are expected to be completed progressively during 2010 and 2011 at a combined capital cost of $710 million. The reline at the Por t Kembla blast furnace is expected to cost $370 million and be completed in 2009.
Figure d provides a breakdown of proposed capital expenditure on advanced projects, by major commodity grouping. Figure e shows the esti-mated capital cost on a regional basis.
At the end of April 2008, both the number of advanced projects (figure f ) and the total value of advanced projects (figure g) were at historically high levels, (in 2008 dollars). On average, the value of advanced projects, in real terms, at the end of April 2008 ($726 million) was well above the average for all years since 1995 ($439 million) as shown in figure h. This reflects a combination of higher input costs and the types and scale of projects being developed.
Minerals and energy projects listing
Australian commodities • vol 15 no 2 • June quarter 2008 433
Less advanced projects
Projects in the less advanced categor y are either still undergoing a feasibility study (in some cases, prefeasibility study), or not subject to a definite deci-sion on development following the completion of a feasibility study. Some of these projects may not proceed for several years. Some may confront changes in economic or competitive conditions, or may be targeting the same emerging market oppor tunities, necessitating rescheduling. In addition, securing finance for project development, even for high quality projects with a high probability of success, is not guaranteed.
Also, with an exceptionally large number of minerals and energ y projects currently committed or under development in the next few years, competi-tion for skilled labour and materials and the associated cost pressures are unlikely to be relieved in the shor t to medium term. This makes it likely the feasibility of many less advanced projects will need to be re-examined. This may also imply, from a commercial perspective, some project developments may be deferred beyond their scheduled star tup dates.
Despite the uncer tainty inherent to projects at these earlier stages of consideration, the significant number of large scale projects at less advanced planning stages under active consideration for development is expected to provide a firm platform for future growth in Australian mineral and energ y production in the medium term and beyond.
Of the 3 41 projects in ABARE’s April 2008 projects list (which is a record), 72 per cent (24 4 projects) remain uncommitted. Table 4 contains a summar y of the numbers and commodity distribution of the 24 4 uncommitted projects, together with their potential capital expenditure. The potential capital expenditure data should be used as an approximate guide only. Capital expenditure data for many early stage projects are either not available or, if available, likely to change significantly if these do proceed to development. In addition, changes in market conditions can often lead to significant variations in capital expenditure estimates.
However, most of the projects that will ultimately proceed to development in the medium term are included in ABARE’s current list of 24 4 less advanced projects.
Among the more notable large scale projects in ABARE’s April 2008 list still undergoing feasibility studies are eight proposed LNG developments that, collectively, could add around 58 million tonnes of annual LNG produc-tion capacity in the medium to longer term (compared with the 15 .2 million tonnes produced in 2006-07).
Minerals and energy projects listing
434 Australian commodities • vol 15 no 2 • June quarter 2008
These projects include the Browse, Gorgon, Icthys and Sunrise projects off the coast of Western Australia and two coal seam methane based LNG projects in Queensland being proposed by Santos, Queensland Gas and BG Group.
The largest less advanced metal mining project is BHP Billiton’s proposed Olympic Dam expansion in South Australia, currently undergoing prefea-sibility studies. This project aims to more than double the mine’s current output of copper, uranium, gold and silver. Among the less advanced iron ore projects, six have an estimated capital expenditure of $1 billion or more. These are: Gindalbie Metals’ Karrara magnetite project ($1.6 billion); Australasian Resources Balmoral South magnetite project ($2.5 billion); Murchison Metals’ Jack Hills Stage 2 mine ($1.5 billion); For tescue Metals’ Pilbara Iron Ore Stage 2 project ($3 .9 billion); Aquila Resources’ West Pilbara mine ($4 .5 billion) and Atlas Iron’s Ridley magnetite project ($1.6 billion)
Projects new to ABARE’s list
There are 58 projects (both advanced and less advanced) new to ABARE’s list relative to October 2007. Since the end of April 2007, 109 projects have been added to ABARE’s project list. The number of newly listed projects in this timespan is unprecedented and is another indication of the current high level of investment interest in the mineral resources sector. Figure i provides a summar y of the 58 newly listed projects in the six months ended April 2008 by commodity categor y. Of these 14 are either committed or already under construction.
Among the more notable less advanced projects new to the list are two LNG projects to be based in Gladstone, Queensland. Queensland Gas Company and BG Group are proposing to build a 3-4 million tonne LNG plant and 380 kilometres pipeline to coal seam methane fields at a cost of $8 billion. Sojitz and Sunshine Gas are proposing to build a 0.5 million tonne LNG plant in Gladstone at a cost of $500 million which will also be based on coal seam methane. In the past 12 months a total of four coal seam methane based LNG projects have been added to ABARE’s list that could have an annual capacity of 10 million tonnes.
Also new to the list are nine iron ore production and infrastructure projects. The most notable of these, in terms of capital expenditure, is Aquila Resources’ proposed US$3 .9 billion (A$4 .5 billion) West Pilbara project in Western Australia. The project includes mine and processing facilities with the capacity to produce 25 million tones of hematite ore; associated rail, rolling stock and por t infrastructure; and allowances for engineering, procurement and construction management and contingencies. The project, for which a prefeasibility study has just been completed, is scheduled to commence operation in 2012.
Minerals and energy projects listing
Australian commodities • vol 15 no 2 • June quarter 2008 435
Minerals and energy projects listing
4 Number of less advanced projects, April 2008
potential capital NSW Vic Qld WA SA Tas NT Aust expenditure
Store and breeding stock 125.8 144.0 159.5 157.6 157.8 156.0 161.4
Total livestock sector 128.1 129.3 135.4 136.4 136.0 149.4 162.0
Total prices received 122.6 116.5 115.2 122.2 132.3 150.2 156.0
a Total for the group includes commodities not separately listed. b Lamb saleyard indicator weight 18-20kg to 2002-03, from 2003-04 18-22kg. s ABARE estimate. f ABARE forecast. Note: 1 ABARE revised the method for calculating these indexes in October 1999. The indexes for commodity groups are calculated on a chained weight basis using Fisher's ideal index with a reference year of 1997-98 = 100. Indexes for most individual commodities are based on annual gross unit value of production. 2 Prices used in these calculations exclude GST.Source: ABARE.
Prices
Australian commodities • vol 15 no 2 • June quarter 2008 443
2 Indexes of prices paid by farmers, and terms of trade
Austr alia
2002-03 2003-04 2004-05 2005-06 2006-07 2007-08 s 2008-09 f
Farmers’ terms of trade a 101.0 94.8 91.2 93.3 95.7 94.7 91.3
Materials and servicesSeed, fodder and livestock
fodder and feedstuffs 167.5 148.3 140.4 140.4 166.0 201.3 190.8seed, seedlings and plants 118.3 104.9 95.3 90.5 104.3 123.7 119.1store and breeding stock 125.8 144.0 159.5 157.6 157.8 156.0 161.4
Capital items 118.3 121.3 124.4 128.4 132.3 137.4 142.2
Total prices paid 121.5 123.0 126.3 131.0 138.3 158.7 170.9
Excluding capital items 121.8 123.1 126.5 131.3 138.9 161.3 174.5Excluding capital and overheads 123.3 123.7 127.2 131.9 139.7 164.8 180.3Excluding seed, fodder and
store and breeding stock 115.6 119.2 123.6 129.4 134.6 154.3 170.2
a Ratio of index of prices received by farmers and index of prices paid by farmers. s ABARE estimate. f ABARE forecast.Note: 1 ABARE revised the method for calculating these indexes in October 1999. The indexes for commodity groups are calculated on a chained weight basis using Fisher's ideal index with a reference year of 1997-98 = 100. 2 Prices used in these calculations exclude GST.Sources: Australian Bureau of Statistics; ABARE.
Prices
444 Australian commodities • vol 15 no 2 • June quarter 2008
3 Farm costs and returns
Austr alia
unit 2003-04 2004-05 2005-06 2006-07 2007-08 s 2008-09 f
Returns Gross value of farm production $m 37 370 36 537 38 527 35 564 40 885 45 739Gross farm cash income b $m 37 992 37 732 38 077 35 114 40 435 45 289
Net returns and production Net value of farm production c $m 8 379 7 294 7 388 4 293 4 375 6 769Real net value of farm production d $m 9 398 7 985 7 837 4 425 4 375 6 588Net farm cash income e $m 13 019 12 610 11 193 8 226 8 478 11 030Real net farm cash income d $m 14 600 13 805 11 874 8 479 8 478 10 735
a Based on estimated movements in capital expenditure and prices of capital inputs. b Gross value of farm production less increase in farmers’ assets held by marketing organisations. c Gross value of farm production less total farm costs. d In 2006-07 Australian dollars. e Gross farm cash income less total cash costs. s ABARE estimate. f ABARE forecast.Note: Prices used in these calculations exclude GST.Sources: Australian Bureau of Statistics; ABARE.
4 Unit export returns
Austr alia
Annual indexes a 2002-03 2003-04 2004-05 2005-06 2006-07 2007-08 s 2008-09 f
a In Australian dollars. Base: 1989-90 = 100. b In Australian dollars. Base: 1994-95 = 100. p Preliminary. s ABARE estimate. f ABARE forecast.Source: ABARE.
Costs and returns
Australian commodities • vol 15 no 2 • June quarter 2008 445
5 Contribution to exports by sector, balance of payments basis
Austr alia
Exports
446 Australian commodities • vol 15 no 2 • June quarter 2008
6 Annual exports summary, balance of payments basis
Total s 87 887 89 864 90 786 97 976 102 627 114 726Total commodities sector s 117 402 120 812 121 263 127 645 130 154 145 394Other merchandise s 29 164 30 139 33 162 31 400 na na
Total merchandise s 146 566 150 951 154 425 159 045 na na
Services 40 241 41 076 41 849 44 505 na na
Total goods and services 186 357 192 045 196 275 203 552 na na
a Includes other farm, forest and fisheries products. Includes exports of wine and of paper and paperboard, which are not included in this balance of payments item by the ABS. b Includes diamonds, which are not included in this balance of payments item by the ABS. c Includes ABARE estimates for steel and nickel which were confidentialised by the ABS. d For a description of chain volume measures, see ABS, Introduction of chain volume measures, in the Australian National Accounts, cat. no. 5248.0, Canberra. Reference year is 2005-06. s ABARE estimate. f ABARE forecast. na Not available.Sources: ABS, Balance of Payments, Australia, cat. no. 5302.0, Canberra; ABARE.
Exports
Australian commodities • vol 15 no 2 • June quarter 2008 447
7 Quarterly exports summary, balance of payments basis
Austr alia
2006-07
June Sep. Dec. Mar. June p Sep. s Dec. f Mar. f June f
$m $m $m $m $m $m $m $m $m
At current prices RuralCereal grains and products 794 900 736 1 512 1 346 1 154 1 988 2 267 2 065
Total s 25 058 25 629 25 695 24 355 26 948 27 145 28 477 28 702 30 402
Total commodities sector s 32 155 32 585 32 639 30 564 34 367 34 360 36 487 36 187 38 360Other merchandise s 8 133 9 198 9 271 8 289 na na na na na
Total merchandise s 40 288 41 783 41 910 38 853 na na na na naServices 10 957 11 497 11 770 11 649 na na na na na
Total goods and services 51 246 53 280 53 680 50 501 na na na na na
2007-08 2008-09
a Includes other farm, forest and fisheries products. Includes exports of wine and of paper and paperboard, which are not included in this balance of payments item by the ABS. b Includes diamonds, which are not included in this balance of payments item by the ABS. c Includes ABARE estimates for steel and nickel which were confidentialised by the ABS. d For a description of chain volume measures, see ABS, Introduction of chain volume measures, in the Australian National Accounts, cat. no. 5248.0, Canberra. Reference year is 2005-06. p Preliminary. s ABARE estimate. f ABARE forecast. na Not available.Sources: ABS, Balance of Payments, Australia, cat. no. 5302.0, Canberra; ABARE.
Exports
448 Australian commodities • vol 15 no 2 • June quarter 2008
a Volume of roundwood equivalent removed from forests. b Uranium is included with energy. s ABARE estimate. f ABARE forecast. Note: ABARE revised the method for calculating production indexes in October 1999. The indexes for the different groups of commodities are calculated on a chained weight basis using Fishers' ideal index with a reference year of 1997-98 = 100. Sources: Australian Bureau of Statistics; ABARE.
a Company profits before income tax. na Not available.Sources: ABS, National Income and Expenditure and Product, cat. no. 5206.0, Canberra; ABS, Company Profits, Australia, cat. no. 5651.0, Canberra; ABS, Business Indicators, cat. no. 5676.0, Canberra; ABS, Australian Industry , cat. no. 8155.0, Canberra; ABARE.
12 All banks lending to business a
Austr alia
Dec. Mar. June Sep. Dec. Mar. June Sep. Dec. $b $b $b $b $b $b $b $b $b
a Includes variable and fixed interest rate loans outstanding plus bank bills outstanding. Source: Reserve Bank of Australia, Bank Lending to Business - Selected Statistics, Bulletin Statistical Table D8.
Business, banks
Australian commodities • vol 15 no 2 • June quarter 2008 451
a Derived from all banks lending to agriculture, fishing and forestry. b Includes the government agency business of state banks and advances made under War Service Land Settlement. Prior to 1996 includes loans from the Queensland Industry Development Corporation. From 1996 these loans are included in bank lending. c Includes loans from life insurance companies, lease agreements and indebtedness to hire purchase companies, trade creditors, private lenders and small financial institutions. s ABARE estimate. na Not available.Sources: Department of Agriculture, Fisheries and Forestry; Reserve Bank of Australia, Estimated Rural Debt to Specified Lenders, Bulletin Statistical Table D9; ABARE.
Farm debt
452 Australian commodities • vol 15 no 2 • June quarter 2008
a Estimates taken from ABS national accounts, which include taxation based statistics. b Includes industries covered by Division B (for example, the metallic and nonmetallic minerals, coal, oil and gas, construction materials and other nonmetallic minerals industries) as defined in the 1993 edition of the Australian New Zealand Standard Industrial Classification (ANZSIC). c Reference year is 2005-06.Sources: Australian Bureau of Statistics; ABARE.
Capital expenditure
Australian commodities • vol 15 no 2 • June quarter 2008 453
a US hard red winter wheat, fob Gulf. b US no. 2 yellow corn, delivered US Gulf. c Prices previously reported by the Thailand Board of Trade are no longer available. From September 1998 the price quoted is the USDA sourced nominal quote for Thai white rice, 100 per cent, Grade B, fob, Bangkok (August–July basis). d US cif Rotterdam (October–September basis). e Cotlook 'A' index. g Average of monthly averages of New York no.11 spot price; basis: fob Caribbean ports (October-September basis). h US cif price. i Australian Wool Exchange eastern market indicator. j Average of traded prices (excluding subsidised sales). k World trade weighted average price compiled by the US Department of Energy. Official sales prices or estimated contract terms for major internationally traded crude oils. l Average of weekly restricted spot prices over the period, published by Ux Consulting. m Average LME spot price unless otherwise stated. n London gold fix, London Bullion Market Association. o Australian hematite fines to Japan (fob) for Japanese fiscal year commencing 1 April. q Japanese fiscal year commencing 1 April. r London silver fix, London Bullion Market Association. Prior to March 2001, Handy and Harman, commercial bar price used. s ABARE estimate. f ABARE forecast. na Not available.Sources: Australian Bureau of Statistics; Australian Dairy Corporation; Meat and Livestock Australia; Australian Wool Exchange; Cotlook Ltd; Food and Agriculture Organisation; General Agreement on Tariffs and Trade; International Energy Agency; International Wheat Council; ISTA Mielke and Co.; London Bullion Market Association; The London Metal Exchange Ltd; New York Board of Trade; Reuters Ltd; Ux Consulting Company; Platts Oilgram; US Department of Agriculture; US Department of Energy; World Bureau of Metal Statistics; ABARE.
World prices
Australian commodities • vol 15 no 2 • June quarter 2008 455
17 Quarterly world indicator prices of selected commodities
2006-07
unit June Sep. Dec. Mar. June p Sep. s Dec. f Mar. f June f
a US hard red winter wheat, fob Gulf. b US no. 2 yellow corn, delivered US Gulf. c Prices previously reported by the Thailand Board of Trade are no longer available. From September 1998 the price quoted is the USDA sourced nominal quote for Thai white rice, 100 per cent, Grade B, fob, Bangkok. d US cif Rotterdam. e Cotlook ’A’ index. g Average of monthly averages of New York no.11 spot price; basis: fob Caribbean ports. h US cif price. i Australian Wool Exchange eastern market indicator. j Average of traded prices (excluding subsidised sales). k World trade weighted average price compiled by the US Department of Energy. l Average of weekly restricted spot prices over the period, published by Ux Consulting. m Average LME spot price unless otherwise stated. n London gold fix, London Bullion Market Association. o London silver fix, London Bullion Market Association. Prior to March 2001, Handy and Harman, commercial bar price used. p preliminary. s ABARE estimate. f ABARE forecast. Sources: Australian Bureau of Statistics; Australian Dairy Corporation; Meat and Livestock Australia; Australian Wool Exchange; Cotlook Ltd; Food and Agriculture Organisation; General Agreement on Tariffs and Trade; International Energy Agency; International Wheat Council; ISTA Mielke and Co.; Reuters Ltd; London Bullion Market Association; The London Metal Exchange Ltd; New York Board of Trade; Ux Consulting Co.; Platts Oilgram; US Department of Agriculture; US Department of Energy; World Bureau of Metal Statistics; ABARE.
World prices
456 Australian commodities • vol 15 no 2 • June quarter 2008
18 Gross unit values or prices of farm products a
unit 2003-04 2004-05 2005-06 2006-07 2007-08 s 2008-09 f
Livestock for slaughterBeef e c/kg 289 320 322 292 285 294– yearling e c/kg 324 359 366 329 322 332– ox e c/kg 309 331 332 318 307 315– cow e c/kg 260 289 288 255 253 265Lamb eg c/kg 381 360 347 326 329 345Mutton e c/kg 200 164 175 136 159 175Pig e c/kg 221 243 232 255 240 250Poultry h c/kg 527 525 498 490 534 540Livestock productsWool i c/kg 820 767 713 864 945 860Milk j c/L 27.9 31.5 33.1 33.2 49.0 54.0
a Average gross unit value across all grades in principal markets, unless otherwise indicated. Includes the cost of containers, commission and other expenses incurred in getting the commodities to their principal markets. These expenses are significant. b Average unit gross value relates to returns received from crops harvested in that year, regardless of when sales take place, unless otherwise indicated. c Price paid by crusher. d Australian base price for sales in the financial year indicated. e Average saleyard price (dressed weight). g Lamb saleyard weight indicator 18-22kg. h Retail price, fresh whole chickens. i Australian Wool Exchange eastern market indicator. j Weighted average farmgate price. s ABARE estimate. f ABARE forecast.Note: Prices used in these calculation exclude GST.Sources: Australian Bureau of Statistics; ABARE.
Unit values
Australian commodities • vol 15 no 2 • June quarter 2008 457
19 World production, consumption, stocks and trade for selected commodities a
unit 2003-04 2004-05 2005-06 2006-07 2007-08 s 2008-09 f
a Some figures are not based on precise or complete analyses. b Includes intra–EU trade. c Milled equivalent. d On a calendar year basis, e.g. 1991-92 = 1992. e Beef and veal, mutton, lamb, goat, pig and poultry meat. g Selected countries. h Clean equivalent. i Virgin wool at the spinning stage in 65 countries. j Held by marketing bodies and on-farm in five major exporting countries. k Five major exporting countries. l Nonfat dry milk. m Includes crude oil, marine bunkers, refinery fuel, nonconventional oil and natural gas liquids. 1 million litres a year equals about 17.2 barrels a day. n Includes OPEC natural gas liquids. o Industry stocks in OECD countries at the start of the financial year. q Includes anthracite and bituminous coal, and for the United States, Australia and New Zealand, sub-bituminous coal. r World production data has been revised to exclude reprocessed uranium. t LME and producer stocks. u China's iron ore production adjusted to world average. v Includes jewellery consumption. w Primary refined metal. x Excludes some small producers and large tonnages produced from ilmenite–magnetite ore in the Commonwealth of Independent States. s ABARE estimate. f ABARE forecast. na Not available. Sources: Australian Bureau of Statistics; Meat and Livestock Australia; Commodities Research Unit; Commonwealth Secretariat; Consolidated Gold Fields; Department of Agriculture, Fisheries and Forestry Australia; Economic Commission for Europe; Fearnleys; Food and Agriculture Organisation; Gold Fields Mineral Services; International Atomic Energy Agency; International Energy Agency; International Iron and Steel Institute; International Lead–Zinc Study Group; International Nickel Study Group; International Sugar Organization; International Wheat Council; ISTA Mielke and Co.; Metallgesellschaft A.G.; Ministry of Agriculture, Forestry and Fisheries (Japan); New Zealand Dairy Board; New Zealand Wool Board; UNCTAD Trust Fund on Iron Ore; United Nations; Uruguayan Association of Wool Exporters; US Department of Agriculture; World Bureau of Metal Statistics; ABARE.
World
460 Australian commodities • vol 15 no 2 • June quarter 2008
20 Commodity production
Austr alia
unit 2003-04 2004-05 2005-06 2006-07 2007-08 s 2008-09 fCropsGrains and oilseedsWinter crops
Nickelmine production o kt 185 192 186 192 195 256refined, class I s kt 113 117 105 104 105 91refined, class II u kt 11 10 10 15 14 31total ore processed v kt 234 229 224 236 243 304
Silvermine production o t 2 056 2 303 2 218 1 674 1 942 2 017refined t 619 722 655 618 620 663
Tinmine production o t 1 512 2 055 1 805 2 061 2 060 5 250refined t 553 445 736 321 0 30
a Linseed and safflowerseed. b Excludes animals exported for breeding purposes. c In carcass weight and includes carcass equivalent of canned meats. d Greasy equivalent of shorn wool (includes crutching), dead and fellmongered wool and wool exported on skins. e Includes the wholemilk equivalent of farm cream intake. g Includes the butter equivalent of butteroil, butter concentrate, ghee and dry butterfat. h Includes mixed skim and buttermilk powder. i Liveweight. j Tuna captured under joint venture or bilateral agreements or transhipped at sea is included. k Includes an estimated value of aquaculture but excludes inland commercial fisheries. l Includes production from petrochemical plants. m Includes ethane, methane and noncommercial natural gas. n Uranium is included with energy. o Primary production, metal content. q Excludes iron oxide not intended for metal extraction. r Includes lead content of lead alloys from primary sources. t Products with a nickel content of 99 per cent or more. Includes electrolytic nickel, pellets, briquettes and powder. u Products with a nickel content of less than 99 per cent. Includes ferronickel, nickel oxides and oxide sinter. v Includes imported ore for further processing. s ABARE estimate. f ABARE forecast. Sources: Australian Bureau of Statistics; Australian Dairy Corporation; Consolidated Gold Fields; Coal Services Pty Limited; DRET; International Nickel Study Group; Queensland Government, Department of Natural Resources and Mines; Raw Cotton Marketing Advisory Committee; ABARE.
Australia
Australian commodities • vol 15 no 2 • June quarter 2008 463
a Linseed, safflowerseed and peanuts. b Value delivered to gin. c Mainly fodder crops. d Includes dairy cattle slaughtered. e Excludes animals exported for breeding purposes. g Excludes skin values. h Lamb saleyard indicator weight 18-22kg. i Shorn, dead and fellmongered wool and wool exported on skins. j Milk intake by factories and valued at farmgate. k Total livestock slaughterings includes livestock disposals. l Value to fishermen of product landed in Australia. m Tuna captured under joint venture or bilateral agreements or transhipped at sea is included. n Includes an estimated value of aquaculture. o Includes Northern Territory aquaculture production. q Also includes fish and aquaculture values not elsewhere included. s ABARE estimate. f ABARE forecast.Note: The gross value of production is the value placed on recorded production at the wholesale prices realised in the market place. The point of measurement can vary between commodities. Generally the market place is the metropolitan market in each state and territory. However, where commodities are consumed locally or where they become raw material for a secondary industry, these points are presumed to be the market place. Note: Prices used in these calculations exclude GST. Sources: Australian Bureau of Statistics; ABARE.
Value of production
Australian commodities • vol 15 no 2 • June quarter 2008 465
22 Crop areas and livestock numbers
Austr alia
unit 2003-04 2004-05 2005-06 2006-07 2007-08 s 2008-09 f
Summer cropsmaize ’000 ha 70 72 76 49 68 71rice ’000 ha 66 51 102 20 2 30sorghum ’000 ha 734 755 766 613 800 763soybeans ’000 ha 33 26 24 14 15 25sunflower seed ’000 ha 46 46 79 17 48 38other oilseeds a ’000 ha 51 55 54 43 49 43
Total grains and oilseeds ’000 ha 23 201 23 808 22 197 21 054 21 509 23 566
Industrial cropsCotton ’000 ha 198 321 336 144 63 210Sugar cane b ’000 ha 448 434 398 409 397 395Winegrapes ’000 ha 146 153 158 163 165 168
Livestock numbers cCattle
beef million 24.41 25.40 25.61 25.37 25.50 25.59dairy million 3.06 2.86 2.79 2.66 2.57 2.60 milking herd d million 2.04 1.94 1.88 1.80 1.73 1.75
total million 27.47 28.26 28.39 28.04 28.07 28.19Sheep million 101.3 100.6 91.0 85.7 81.9 82.1
Pigs million 2.48 2.73 2.73 2.61 2.52 2.45
a Linseed and safflowerseed. b Cut for crushing. c At 30 June. d Cows in milk and dry. s ABARE estimate. f ABARE forecast.Sources: Australian Bureau of Statistics; ABARE.
Areas, stock
466 Australian commodities • vol 15 no 2 • June quarter 2008
23 Average farm yields
Austr alia
unit 2003-04 2004-05 2005-06 2006-07 2007-08 s 2008-09 f
a Includes the grain equivalent of malt. b Includes field peas and cowpeas. c Includes the wheat equivalent of flour. d Includes soybeans, linseed, sunflowerseed, safflowerseed and peanuts. Excludes meals and oils. e Excludes cotton waste and linters. g In shipped weight. Fresh, chilled or frozen. h Includes meat loaf. i Excludes breeding stock. j ABS recorded trade data adjusted for changes in stock levels held overseas by Wool International. k Includes ghee, dry butterfat, butter concentrate and butteroil, dairy spreads, all expressed as butter. l Exports of tuna landed in Australia. Tuna captured under joint venture or bilateral agreements or transhipped at sea is not included. m Excludes volume of other prawn products. n Includes crumbed scallops. o Includes condensate and other refinery feedstock. q 1 million tonnes of LNG equals about 1.31 billion cubic metres of gas. r International ships and aircraft stores. t Uranium is included with energy. u Quantities refer to gross weight of all ores and concentrates. v Quantities refer to total metallic content of all ores, concentrates, intermediate products and refined metal. w Includes all steel items in ABS, Australian Harmonized Export Commodity Classification , ch. 72, ’Iron and steel’, excluding ferrous waste and scrap and ferroalloys. x Excludes leucoxene and synthetic rutile. y Data from 1991-92 refer to standard grade zircon only. s ABARE estimate. f ABARE forecast. Sources: ABS, International Trade, Australia, cat. no. 5465.0, Canberra; Australian Mining Industry Council; Department of Foreign Affairs and Trade; Department of Agriculture, Fisheries and Forestry; International Nickel Study Group; ABARE.
Export volumes
470 Australian commodities • vol 15 no 2 • June quarter 2008
25 Value of commodity exports (fob)
Austr alia
2003-04 2004-05 2005-06 2006-07 2007-08 s 2008-09 f
$m $m $m $m $m $mFarmGrains and oilseedsWinter crops
Total mineral resources exports 53 944 68 616 92 109 107 890 120 460 177 898
Total commodity exports Derived as sum of above 84 175 100 178 123 597 139 528 151 403 212 283
On balance of payments t 82 128 98 019 121 262 137 042 148 708 208 736
a Includes the grain equivalent of malt. b Field peas and cowpeas. c Includes the wheat equivalent of flour. d Includes soybeans, linseed, sunflowerseed, safflowerseed and peanuts. Excludes meals and oils. e Excludes cotton waste and linters. g Excludes breeding stock. h On a balance of payments basis. ABS recorded trade data adjusted for changes in stock levels held overseas by Wool International. i Exports of tuna landed in Australia. Tuna captured under joint venture or bilateral agreements or transhipped at sea is not included. j Other prawn products included in other fisheries products. k Includes crumbed scallops. l Sum of farm, forest and fisheries products. m The value of exports derived as the sum of published detailed items differs from the balance of payments aggregates shown in table 6 for two main reasons: the ABS makes special adjustments to some recorded trade data for balance of payments purposes; and ABARE derives its own estimates, (using non-ABS sources), for several items as footnoted. For more detail on a balance of payments basis, see table 7. n Includes condensate and other refinery feedstock. o International ships and aircraft stores. p Value of metals contained in host mine and smelter products are not available separately and are included in the value of the mineral product or metal in which they are exported. q Excludes leucoxene and synthetic rutile; data from 1991-92 refer to bulk ilmenite only. r Data refers to standard grade zircon only. t As derived in table 6. s ABARE estimate. f ABARE forecast.Sources: ABS, International Trade, Australia, cat. no. 5465.0, Canberra; DRET; ABARE.
Export values
Australian commodities • vol 15 no 2 • June quarter 2008 473
26 Value of imports and exports of selected commodites
a Includes peanuts, oilseeds, vegetable oils and vegetable protein meals. b Includes all crustaceans and molluscs including canned. c Excludes tuna transhipped at sea or captured under joint venture or bilateral agreements. d Includes roundwood, other processed wood and minor forest products. e Includes roundwood, sawnwood, sleepers, processed wood and minor forest products. g Includes condensate and other refinery feedstock. h Includes LPG. i Naturally occurring and refinery byproduct gas. j International ships and aircraft stores. s ABARE estimate.Sources: Australian Bureau of Statistics; Department of Agriculture, Fisheries and Forestry; ABARE.
Import value
474 Australian commodities • vol 15 no 2 • June quarter 2008