26
Australian Governance & Ethical Index Fund (ASX: AGM) Investment update April 2019 For personal use only

Australian Governance &Ethical Index Fund (ASX: AGM)Investment update
April 2019
For
per
sona
l use
onl
y

Disclaimer
Australian Governance & Ethical Index Fund Investment update
This presentation has been prepared Walsh & Company Asset Management Pty Ltd (ABN 89 159 902 708, AFSL 450 257) (Investment Manager) as investment manager of Australian Governance & Ethical Index Fund (ARSN 625 826 646) (Fund).
This presentation may contain general advice. Any general advice provided has been prepared without taking into account your objectives, financial situation or needs. Before acting on the advice, you should consider the appropriateness of the advice with regard to your objectives, financial situation and needs.
Like all investments, an investment in the fund carries risk which may result in the loss of income or principle invested. In addition to the general risks of investing, specific risks associated with investing in the Fund include, but are not limited to, investment selection and strategy risk, ethical consideration risk, equity risk, and company specific risk. For further information about the risks of investing in the Fund please refer to Section 3 of the PDS.
Past performance is not a reliable indicator of future performance. This presentation may contain statements, opinions, projections, forecasts and other material (forward looking statements), based on various assumptions. Those assumptions may or may not prove to be correct. None of the Fund, the Investment Manager, its officers, employees, agents, advisers nor any other person named in this presentation (Parties) makes any representation as to the accuracy or likelihood of fulfilment of the forward looking statements or any of the assumptions upon which they are based. Actual results, performance or achievements may vary materially from any projections and forward looking statements and the assumptions on which those statements are based. Readers are cautioned not to place undue reliance on forward looking statements and the Parties assume no obligation to update that information.
The Parties give no warranty, representation or guarantee as to the accuracy or completeness or reliability of the information contained in this presentation. The Parties do not accept, except to the extent permitted by law, responsibility for any loss, claim, damages, costs or expenses arising out of, or in connection with, the information contained in this presentation. Any recipient of this presentation should independently satisfy themselves as to the accuracy of all information contained herein.
The S&P/ASX 100 (“Index”) is a product of S&P Dow Jones Indices LLC and/or its affiliates and has been licensed for use by the Investment Manager. Copyright © 2018 S&P Dow Jones Indices LLC, a division of S&P Global, Inc., and/or its affiliates. All rights reserved. Redistribution or reproduction in whole or in part are prohibited without written permission of S&P Dow Jones Indices LLC. For more information on any of S&P Dow Jones Indices LLC’s indices please visit www.spdji.com. S&P® is a registered trademark of S&P Global and Dow Jones® is a registered trademark of Dow Jones Trademark Holdings LLC. Neither S&P Dow Jones Indices LLC, Dow Jones Trademark Holdings LLC, their affiliates nor their third party licensors make any representation or warranty, express or implied, as to the ability of any index to accurately represent the asset class or market sector that it purports to represent and neither S&P Dow Jones Indices LLC, Dow Jones Trademark Holdings LLC, their affiliates nor their third party licensors shall have any liability for any errors, omissions, or interruptions of any index or the data included therein.
For
per
sona
l use
onl
y

1 Introduction
Australian Governance & Ethical Index Fund Investment update
For
per
sona
l use
onl
y

Investment strategy and objective
Overview
We aim to provide investors with relatively lower cost, well diversified exposure to domestic large capitalisation companies that exhibit positive governance, social and environmental attributes.
Primary focus on a corporations;
─ Corporate governance frameworks;
─ Commitment to overall corporate social responsibility; and
─ Sustainability of operating practices including minimisation of environmental harm.
Australian Governance & Ethical Index Fund Investment update
For
per
sona
l use
onl
y

Why focus on ESG?
Our philosophy
We believe companies who exhibit superior governance, social and environmental (ESG) practices on average
Australian Governance & Ethical Index Fund Investment update
Have more sustainable business
models
Are less exposed to exogenous
risk
Command a valuation
premium
• More competitive due to
better use of human capital
and resources
• Better risk management and
corporate governance
• Lower regulatory incidents
and remediation costs
• Lower variation in operating
performance and less
exposure to systemic risk
• Superior market ‘perception’
Better cash flow and profitability
Lower tail and stock specific risk
Higher valuation+ +=
For
per
sona
l use
onl
y

Why is it important?
Australian Governance & Ethical Index Fund Investment update Source:, CLSA, Quantifying Corporate Culture, 2016
Changing components of corporate value
Components of a corporations “value” have changed over time. ‘Non-financial’ factors such as corporate culture and brand value are becoming increasingly important.
Aggregate components of S&P 500 market value – 1975 - 2015
85%
68%
32%20% 16%
15%
32%
68%80% 84%
0%
10%
20%
30%
40%
50%
60%
70%
80%
90%
100%
1975 1985 1995 2005 2015
Tangible Assets Intangible Assets
For
per
sona
l use
onl
y

Philosophy in practice
Does ESG impact returns?
European markets are well ahead of global peers in terms of ESG integration and prove a practical example; we believe asset pricing domestically will follow a similar pattern.
Australian Governance & Ethical Index Fund Investment update Source: Walsh & Company Asset Management, FactSet, MSCI ESG Research,
Historical Performance is not a reliable indicator of future performance.
8%
9%
10%
11%
12%
13%
14%
Leaders (AAA) Average (AA-BB) Laggards (B-CCC)
5 y
ea
r tr
aili
ng
to
tal
sha
reh
old
er re
turn
(p
.a.)
Median annualised total shareholder return by MSCI ESG Rating (1 January 2013 – 31 December 2018) – European MSCI ACWI constituents
▪ In Europe, ESG Leaders (AAA rated) have significantly outperformed peers over the last 5 years
▪ ESG leaders have outperformed ESG laggards over 5 years by:
– 3.5% p.a. (median return)
– 4.4% p.a. (average return)
For
per
sona
l use
onl
y

2 Investment Process
Australian Governance & Ethical Index Fund Investment update
For
per
sona
l use
onl
y

Portfolio Construction
Australian Governance & Ethical Index Fund Investment update
Identify and avoid industry laggards
Re-allocate capital to industry leaders
Remaining securities analysed on the basis of +/- corporate governance, social and environmental performance
Apply materiality assessment overlay
S&P/ASX 100 Index
Screen investments with very high negative social or environmental impact
Negative Screen
ESG Analysis + Integration
Positive re-weighting
For
per
sona
l use
onl
y

Industry approach reduces sector bias
Australian Governance & Ethical Index Fund
Australian Governance & Ethical Index Fund Investment update Source: Walsh & Company Asset Management, Bloomberg, GICS industry classifications, excluding cash holdings, as at 31 March 2019
Notes: 1 Betashares Australian Sustainability Leaders ETF
Largest domestic ASX-listedESG focused fund1
Information Technology
Utilities
Consumer Staples
Communication Services
Consumer Discretionary
Energy
Health Care
Industrials
Materials
Real Estate
Financials
AGM S&P/ASX 100
Information Technology
Utilities
Consumer Staples
Communication Services
Consumer Discretionary
Energy
Health Care
Industrials
Materials
Real Estate
Financials
ESG Fund S&P/ASX 100
For
per
sona
l use
onl
y

Company measurement
▪ Governance analysis primarily based upon in-depth company and financial analysis through internal evaluation, industry consultants and investment network
▪ Process built through 8 years of experience and data from Australian Governance Masters Index Fund Limited (AQF)1
▪ Companies are analysed according to fundamental analysis of:
– Stewardship; board quality, independence and diversity
– Accountability; pay structure and materiality
– Ownership; related parties and alignment
– Transparency; reliability, timeliness, transparency and accuracy of financial accounts
Governance measurement driven by bottom up analysis.
Australian Governance & Ethical Index Fund Investment updateNotes: 1 Australian Governance Masters Index Fund Limited (AQF) was de-listed from the Australian Stock Exchange (ASX) on 16 July 2018
following a re-structure and majority distribution of capital to Australian Governance & Ethical Index Fund unitholders
For
per
sona
l use
onl
y
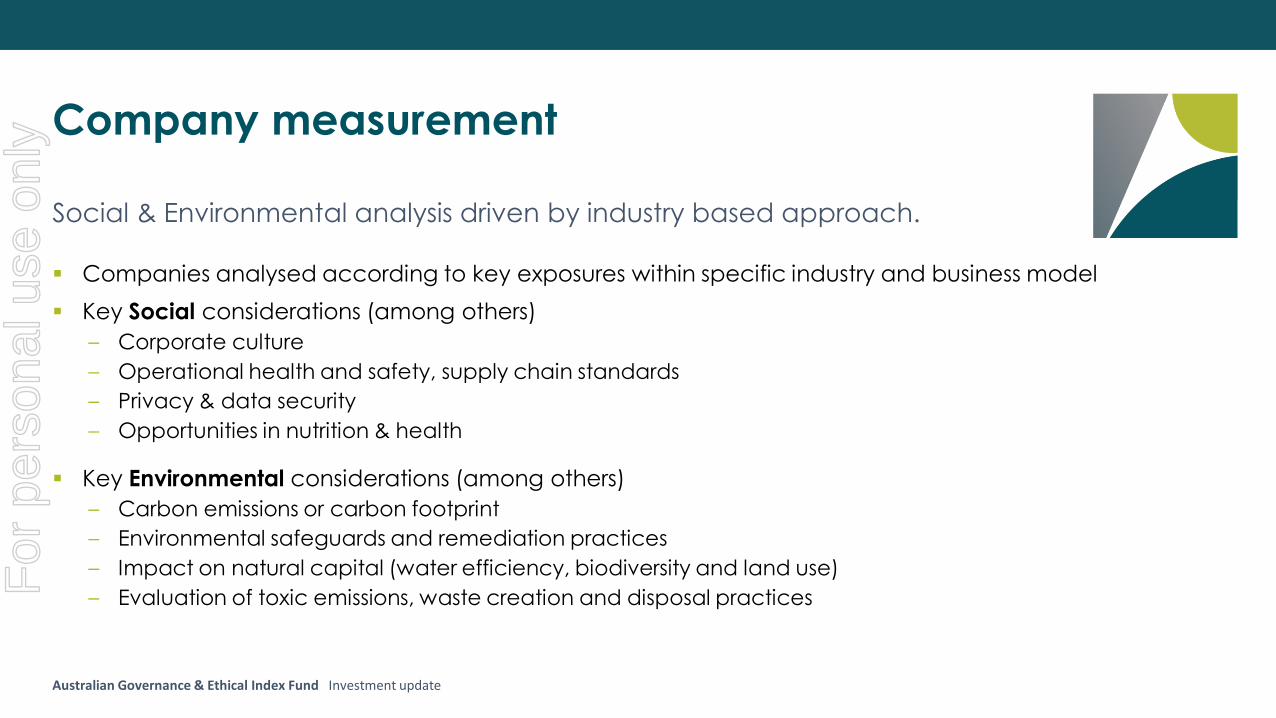
Company measurement
▪ Companies analysed according to key exposures within specific industry and business model
▪ Key Social considerations (among others)
– Corporate culture
– Operational health and safety, supply chain standards
– Privacy & data security
– Opportunities in nutrition & health
▪ Key Environmental considerations (among others)
– Carbon emissions or carbon footprint
– Environmental safeguards and remediation practices
– Impact on natural capital (water efficiency, biodiversity and land use)
– Evaluation of toxic emissions, waste creation and disposal practices
Social & Environmental analysis driven by industry based approach.
Australian Governance & Ethical Index Fund Investment update
For
per
sona
l use
onl
y

3 Portfolio positioning
Australian Governance & Ethical Index Fund Investment update
For
per
sona
l use
onl
y

Portfolio positioning
Largest active positions
14
Top 10 (overweight)
A2 Milk Company Rio Tinto
Cleanaway Waste
ManagementSydney Airport
CSLUnibail-Rodamco-
Westfield
Macquarie Group Woodside Petroleum
OZ Minerals Worleyparsons
Bottom 10 (underweight)
AGL Energy Origin Energy
Amcor Santos
Aristocrat Leisure Sonic Healthcare
BHP Group South32
Goodman Group Treasury Wine Estates
Australian Governance & Ethical Index Fund Investment updateSource: Walsh & Company Asset Management, as at 31 March 2019
Notes: Overweight and underweight positions relative to S&P/ASX 100 Index
For
per
sona
l use
onl
y

Corporate governance still key
Australian Governance & Ethical Index Fund Investment update
Source: Australian Financial Review, The Australian, Australian Broadcasting Corporation
Walsh & Company Asset Management, Factset, as at 31 March 2019
Historical Performance is not a reliable indicator of future performance
Stewardship and accountability remain key tenants of our investment approach and we believe these are becoming increasingly reflected in share prices.
AMP Limited (ASX:AMP) and IOOF Limited (ASX:IFL) 1 year total shareholder return (period ended 31 March 2019)
40
50
60
70
80
90
100
Mar/18 Jun/18 Sep/18 Dec/18
Tota
l sh
are
ho
lde
r re
turn
(in
de
x t
o
10
0)
AMP IFL
AMP (58%)
IFL (40%)
For
per
sona
l use
onl
y
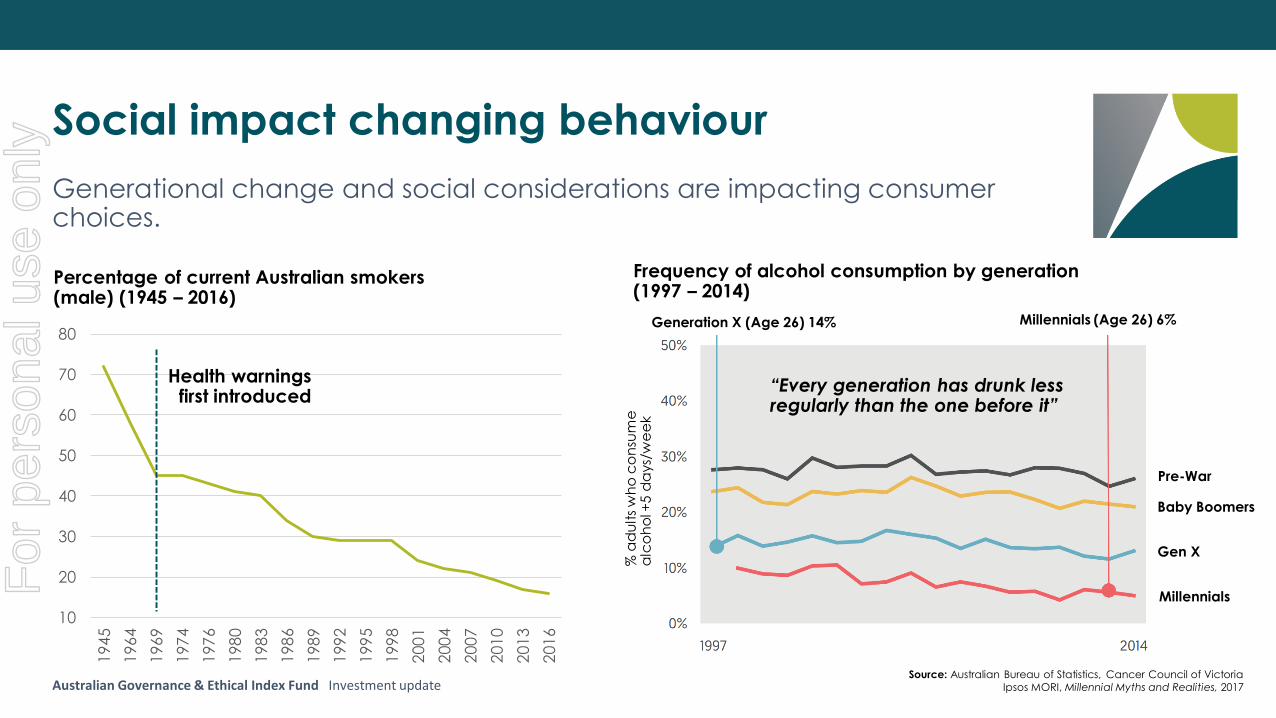
Social impact changing behaviour
Frequency of alcohol consumption by generation (1997 – 2014)
Australian Governance & Ethical Index Fund Investment updateSource: Australian Bureau of Statistics, Cancer Council of Victoria
Ipsos MORI, Millennial Myths and Realities, 2017
Generation X (Age 26) 14% Millennials (Age 26) 6%
Pre-War
Baby Boomers
Gen X
Millennials
Percentage of current Australian smokers (male) (1945 – 2016)
Generational change and social considerations are impacting consumer choices.
10
20
30
40
50
60
70
80
194
5
196
4
196
9
197
4
197
6
198
0
198
3
198
6
198
9
199
2
199
5
199
8
200
1
200
4
200
7
201
0
201
3
201
6
Health warnings first introduced
% a
du
lts
wh
o c
on
sum
e
alc
oh
ol +
5 d
ays/
we
ek
“Every generation has drunk less regularly than the one before it”
For
per
sona
l use
onl
y

The economics of power generation
2018 Levelized cost of Energy Analysis version 12.0 (unsubsidised)
Australian Governance & Ethical Index Fund Investment updateSource: Lazard, Levelized cost of Energy and Levelized Cost of Storage 2018
Historical Performance is not a reliable indicator of future performance
Marginal cost of coal power
generation
Un-subsidised new buildsolar PV
Un-subsidised new build
onshore wind
Economics are rapidly changing, while the environmental impact of energy generation is becoming increasingly important.
Mean unsubsidised levelised cost of energy (new build) and CO2 equivalent emissions
Estimated Cost (US$/MWh) CO2 Emissions
2009 2018 % ChangeTons/
MWh
%
Reduction
(vs. Coal)
Coal $111 $102 -8% 0.92 -
Gas
(combined
cycle)
$83 $58 -30% 0.51 -45%
Nuclear $123 $151 +23% - -100%
Onshore
Wind$135 $42 -69% - -100%
Solar PV $359 $43 -88% - -100%
For
per
sona
l use
onl
y

Stranded assets
Selected Australian coal fired power stations
Australian Governance & Ethical Index Fund Investment update Source: Australian Financial Review, Financial Times, Institute for Energy Economics and Financial Analysis
Walsh & Company Asset Management, Australian Energy Market Operator, Clean Energy Finance Corporation, Respective company reports
StationOutput
(TWh)
Scope 1
Emissions
(t CO2-e)
% of total
sector
emissions
Estimated
useful life
(years)
Owner
Liddell 8.5 7.8m 5% 3 AGL
Yallourn 10.2 13.7m 8% 5-9Energy
Australia
Gladstone 9.0 8.5m 5% 10 Consortium
Vales Point 8.1 7.0m 4% 10 Sunset Power
Eraring 17.2 14.8m 9% 13 Origin
Tarong 12.1 10.4m 6% 16 QLD Gov’t
Stanwell 8.8 7.6m 5% 24 QLD Gov’t
Bayswater 15.5 13.7m 8% 16-26 AGL
Loy Yang B 8.9 10.1m 6% 28Chow
Tai/Mitsui
Loy Yang A 17.0 19.8m 12% 29 AGL
Understanding both physical and transition risks.
For
per
sona
l use
onl
y

$0
$2,000
$4,000
$6,000
$8,000
$10,000
$12,000
$14,000
$U
S B
illio
n
2017 (Actual) 2018 - 2050 cumulative (estimated)
Renewables origination and financing
Australian Governance & Ethical Index Fund Investment update Source: Bloomberg New Energy Finance, as at 31 March 2019
With a change in economics green energy investment is expected to grow exponentially; where are the opportunities?
Estimated new renewable energy capacity investment (2018-2050)
~$US 11.5 Trillion
$0 $2,000 $4,000 $6,000 $8,000 $10,000 $12,000
Lazard
Rothschild & Co
JPMorgan Chase & Co
Royal Bank of Canada
Societe Generale
Banco Santander
Macquarie Group
Green Giraffe CP
Citigroup
Mitsubishi UFJ FG
$US Million
Global renewable energy investment – Asset finance financial advisory by total deal flows (2017 - current)
For
per
sona
l use
onl
y

Electrification of the transport industry
Copper contained in light vehicles by powertrain
Australian Governance & Ethical Index Fund Investment update Source: JP Morgan Commodities Research, “EV Outlook 2025”, Bloomberg New Energy Finance, “Electric Vehicle Outlook 2018”
Historical Performance is not a reliable indicator of future performance
Internal combustionengine (ICE)
Battery Electric Vehicle
Plug-in hybrid electric vehicle
Full + Mild Hybrids
0
200
400
600
800
1000
1200
1400
1600
2009 2014 2019 2024 2029
Actual Estimated ~ICE Upfront Breakeven
Average price of lithium ion batteries (US$/kWH)
Declining battery prices are expected to drive electric vehicle adoption. We are cognisant of changing material demands.
For
per
sona
l use
onl
y

Recycling and waste management
Australian Governance & Ethical Index Fund Investment update
Opportunity for incumbent players; domestic recovery rates well behind peers.
Recovery rates of municipal waste (selected countries)
0%
25%
50%
75%
100%
Austria Belgium Netherlands Germany United
Kingdom
France Europe Australia
Material recovery (recycling + composting) Waste to energy
Best in class (~99% recovery)
European developed peers(~70% recovery)
Australia(~50% recovery)
Source: Organisation for co-operative economic development (OECD), Municipal Waste Generation and Treatment 2016
For
per
sona
l use
onl
y

4 Overview
Australian Governance & Ethical Index Fund Investment update
For
per
sona
l use
onl
y

Portfolio characteristics
Australian Governance & Ethical Index Fund vs S&P/ASX100 Index
Weighted Average Carbon Intensity (t CO2e/$m Sales)
Australian Governance & Ethical Index Fund Investment update Source: Walsh & Company Asset Management, Factset, MSCI ESG Research, as at 31 March 2019
Historical Performance is not a reliable indicator of future performance
AGM S&P/ASX 100
Holdings 77 100
Dividend Yield 4.5% 4.5%
Price/Earnings 15.7x 16.3x
Price/Book 2.0x 2.0x
ROA 7.1% 6.3%
3-5 Year
EPS Growth5.4% 5.5%
As at 31 March 2019
220
240
260
280
300
320
Australian Governance &
Ethical Index Fund
S&P/ASX 100
T C
O2
e/$
m S
ale
s
For
per
sona
l use
onl
y

Competitive fee structure
Source: Walsh & Company Asset Management, Company reports, as at 15 April 2019
Notes: Ongoing fees include management fees and estimated other costs
Code Name Management Market capitalisation Total Ongoing Fees
FAIRBetaShares Australian Sustainability Leaders
ETFPassive $255 million 0.49%
RARIRussell Investments Australian Responsible
Investment ETFPassive $113 million 0.45%
UBA UBS IQ MSCI Australia Ethical ETF Passive $192 million 0.17%
AGM Australian Governance & Ethical Index Fund Active $45 million 0.19%
Australian Governance & Ethical Index Fund Investment update
ASX-listed Australian equity focused responsible investment products
For
per
sona
l use
onl
y

Investment performance
1 Months 3 Months 6 Months 1 Year 3 Year (p.a.)
Since Inception
(p.a.)
AGM 0.9% 10.8% 2.3% - - 3.4%
S&P/ASX 100
Accumulation Index0.8% 10.7% 2.2% - - 2.1%
Excess Return +0.1% +0.1% +0.2% - - +1.3%
Source: Walsh & Company Asset Management, Bloomberg
Historical performance is not a reliable indicator of the future performance. AGM Inception date 10 July 2018
AGM performance numbers are total returns based on Net Tangible Asset values, inclusive of distributions and net of fees and costs.
Australian Governance & Ethical Index Fund (AGM) – 31 March 2019
Australian Governance & Ethical Index Fund Investment update
For
per
sona
l use
onl
y

Our team
Ian Watt, ACAdvisory committee member
Former Secretary of the Department of the Prime Minister and Cabinet, Department of Finance and Administration
Citigroup Australia and Grattan Institute Board Member
Will HartPortfolio Manager
Prior roles across Evans Dixon in research and capital markets
BComm (Melb), MAppFin (Macq)
Matt Baillie, CFASenior Performance Analyst
Nerida ColeAdvisory committee member
Managing Director,Head of Advice atDixon Advisory
Member of the Financial Services Council Advice Board Committee
Josephine TanAdvisory committee member
UK based founder, CFO and COO, Sandown Bay Resource Capital
Previously Senior Investment Banker at UBS AG
Prior roles at CFSGAM and in small cap broking as an analyst/dealer
BEng, BComm (Syd), CFA
Australian Governance & Ethical Index Fund Investment update
For
per
sona
l use
onl
y


