Australian Hardwood Chip Export Volume & Price Forecasts and Stumpage and Harvest Cost Review
Report prepared for Macquarie Forestry Services Pty Ltd
April 2013
IndustryEdge Pty LtdABN 39 109 201 630
PO Box 7596Geelong West Victoria 3218Telephone +61 (3) 5229 2470Facsimile +61 (3) 5229 0334Email [email protected]
Executive SummaryHardwood plantation resources growing in Tasmania are generally a high quality and sought after resource. After
five years of volume and price turbulence, markets are returning to some normality. However, both demand and
supply factors have altered in that time, both in general and for northern Tasmania’s E.nitens plantations.
This analysis addresses the historical, current and future markets for northern Tasmanian E.nitens plantations.
The key points are as follows:
E.nitens plantation chip export prices are forecast to rise to USD170.00/bdmt in 2013-14 and to USD183.00/bdmt in the period 2015 to 2018
For certified, E.nitens plantation resource exported from northern Tasmanian ports, IndustryEdge forecasts the
following average price ranges:
E.nitens Weighted Average Hardwood Chip Export Price Forecasts: 2013-14 – 2015-18 (USD/t)
2013-14 2014-15 2015-18 (3 years)
Japan China Japan China Japan China
High Price 183.00 162.00 190.00 167.00 202.00 178.00
Low Price 165.00 150.00 165.00 155.00 165.00 160.00
Forecast Annual Average Price 170.00 172.50 183.00
Note: E.nitens price ~ includes USDFob10/bdmt discount * Note forecast qualifications and commentaries are detailed in the text of this report
Japan remains the preferred destination for hardwood chip exports from Australia through to 2018. Prices for
hardwood chips delivered to China are likely to increase at a faster rate than for Japan.
Demand and volume estimates for E.nitens are broadly consistent through to 2018
IndustryEdge estimates the following average volumes over the forecast periods:
IndustryEdge E.nitens Resource Estimates: 2013-14 – 2018+ (GMT)
GMT High Volume Low Volume Base Volume
2013-14 750,000 280,000 550,000
2014-15 1,200,000 600,000 1,000,000
2015-16 1,800,000 1,000,000 1,500,000
2016-17 2,500,000 1,200,000 2,150,000
2017-18 2,500,000 1,500,000 2,250,000
2018+ 2,500,000 1,750000 2,250,000
Source: IndustryEdge research & estimates * Note estimate qualifications are detailed in the text of this report
IndustryEdge notes that independent third party certification of plantations is essential to maximise sales and
prices.
1
Australian Hardwood Chip Export Volume & Price Forecasts and Stumpage and Harvest Cost Review
2 © 2013 IndustryEdge P/L
Port capacity is adequate and negotiators with significant volumes can facilitate access
Northern Tasmanian port capacity is adequate for all assessed volumes specified in this Report. Further,
although there appear to be access issues to resolve, IndustryEdge’s opinion is that the significant volumes
under consideration can be expected to facilitate access via negotiation.
Immediate sale of E.nitens plantation estates could be achieved – at a discount to the buyer of between 20% and 30% per annum
In the current circumstances and for a sale conducted in the near term (concluding in 4 to 6 months), the small
universe of potential investors is likely to focus on steep discounts. This is as much the case for estates that are
available for sale free of encumbrances, as those for which the encumbrances may be significant, such as much
of the northern Tasmanian E.nitens plantation estate.
IndustryEdge considers a reasonable assessment of integrated pulp and paper manufacturer and institutional
investor discount expectations would range between 20% and 30% per annum of assessed NPV.
Supply chain cost estimates for delivering hardwood chips on board ships in Northern Tasmania are reasonable and within boundaries
Each of the supply chain cost estimates is reasonable in the context of the relevant E.nitens plantation estate.
In addition, the low and high, total supply chain cost assumptions for the example of a 90 kilometre haul are
reasonable and within bounds.
[see the detailed summary of cost estimates on the following page]
Australian Hardwood Chip Export Volume & Price Forecasts and Stumpage and Harvest Cost Review
2 © 2013 IndustryEdge P/L
Sup
ply
Cha
in C
ost
s A
sses
smen
t S
umm
ary
(AU
D/G
MT
& %
) * #
Sup
ply
Cha
in C
ost
(per
GM
T un
less
oth
erw
ise
stat
ed)
Clie
nt A
ssum
pti
ons
Clie
nt A
ssum
pti
ons
In
dus
tryE
dg
e S
umm
ary
Ass
essm
ent*
Low
Hig
h
Har
vest
Long
term
con
trac
ts, G
ood
qual
ity e
stat
e$1
8.00
$22.
00R
easo
nabl
e –
Mai
nly
unifo
rm q
ualit
y es
tate
char
acte
ristic
s ar
e re
quire
d to
rem
ain
with
in th
e
high
ran
ge
Ro
adin
gP
rimar
ily G
unns
and
For
estr
y Ta
sman
ia la
nd$1
.25
$1.7
5R
easo
nabl
e
Ove
rhea
d
Long
term
con
trac
ts, W
ell m
anag
ed o
utso
urce
tend
erin
g$2
.50
$5.0
0R
easo
nabl
e –
Cos
ts o
f ach
ievi
ng a
nd m
aint
aini
ng
cert
ifica
tion,
sta
keho
lder
and
nei
ghbo
r
man
agem
ent a
nd O
H&
S m
ay in
crea
se c
osts
Tran
spo
rtFl
ag fa
ll (re
gard
less
of d
ista
nce)
. By
road
$1.5
0$2
.00
Rea
sona
ble
– Fl
ag fa
ll w
ould
incr
ease
for
tran
spor
t
by r
ail
Tran
spo
rt (G
MT
/km
)N
orth
ern
Tasm
ania
n ro
ads,
Wel
l man
aged
out
sour
ce
tend
erin
g
$0.1
15$0
.130
Rea
sona
ble
– Tr
ansp
ort (
$/G
MT/
km) w
ould
decr
ease
for
tran
spor
t by
rail
Chi
pp
ing
Long
term
con
trac
ts, S
cale
ope
ratio
ns$8
.00
$11.
00R
easo
nabl
e –
Cos
ts m
ay in
crea
se w
ithou
t lon
g
term
con
trac
ts in
pla
ce
Chi
pp
ing
Yie
ldE
.nite
ns re
sour
ce96
%98
%R
easo
nabl
e –
Yie
ld m
ay d
ecre
ase
for
infie
ld
chip
ping
Pile
/Lo
adLo
ng te
rm c
ontr
acts
, Sca
le o
pera
tions
$7.0
0$1
0.00
Rea
sona
ble
– In
clud
ing
basi
c co
sts
of p
ile
segr
egat
ion
to m
eet c
ertifi
catio
n re
quire
men
ts
Wo
od
fib
re c
ont
ent
Tota
l dry
woo
d fib
re c
onte
nt (B
DM
T/G
MT)
48%
50%
Rea
sona
ble
Exa
mp
leTo
tal S
uppl
y C
hain
Cos
ts fo
r 90
km
hau
l$4
8.32
$63.
25R
easo
nabl
e
Not
es: A
sses
smen
ts b
ased
on
Tasm
ania
n co
sts
# G
MT
is G
reen
Met
ric T
onne
*
This
sum
mar
y sh
ould
be
read
in c
onju
nctio
n w
ith th
e co
mm
enta
ries.
©
201
3 In
dust
ryE
dge
P/L
3
Aus
tral
ian
Har
dw
ood
Chi
p E
xpor
t Vo
lum
e &
Pric
e Fo
reca
sts
and
Stu
mp
age
and
Har
vest
Cos
t R
evie
w
Australian Hardwood Chip Export Volume & Price Forecasts and Stumpage and Harvest Cost Review
4 © 2013 IndustryEdge P/L
Australian Hardwood Chip Export Volume & Price Forecasts and Stumpage and Harvest Cost Review
© 2013 IndustryEdge P/L 5
About IndustryEdgeIndustryEdge is Australia’s leading data, information, analysis and industry intelligence firm in the pulp and paper
industry, and is a leading publishing and consulting company in the sector, covering plantations, forestry and
forest products.
The IndustryEdge team provides detailed analysis and strategic insights and intelligence on a range of land use,
forestry, pulp and paper and related sustainability issues, including:
• Production,importandexportvolumesandprices
• Fibresupplyissues,trendsandpricing
• Demandandsupplyforecastingforpulp,paperandpaperproducts
• Demandandsupplyforecastingforlogs,woodchipsandtimber
• Resourcedatacompilationandanalyses
• Carbonandemissionspolicy,programsandpricing
• Productandmarketinnovations,manufacturinginputsandstrategies.
IntroductionIndustryEdge has been engaged to provide expert analysis, advice and professional commentary on three
matters pertaining to Tasmanian hardwood chip exports:
• Pricesonbothhistoricalandforecastbasis
• Demandandvolumesonaforecastbasis,and
• Supplychaincostsfordeliveryofhardwoodchipsontoships.
We are requested to analyse historical data and provide near term (3 to 5 years) price and demand & volume
forecasts for exports of Eucalyptus Nitens (E.nitens, aka Shining Gum) resource from northern Tasmanian ports.
We are also requested to advise on the reasonableness of existing assessments of supply chain costs for
harvesting and delivering these woodchips on board.
In addition, opinion is included of the anticipated evaluation of value, the likely position and bid and negotiation
behaviour of potential institutional investors in the event of an immediate sale of a plantation estate.
Australian Hardwood Chip Export Volume & Price Forecasts and Stumpage and Harvest Cost Review
6 © 2013 IndustryEdge P/L
Background, Key Features & AssumptionsAustralia has long been an exporter of hardwood chips, initially from native forests, and more recently from
purpose grown plantations. Australia has approximately 980,000 hectares of hardwood plantations, almost
exclusively grown to supply pulpwood. The vast majority of the production from this estate is exported.
The majority of public debate about Australian hardwood chip exports has focussed on the declining exports
from native forests.
Australian Hardwood Species
The majority of Australian hardwood chip exports from plantations are E.globulus which is known for its high
quality and high fibre yield. The northern Tasmanian plantation resource is primarily E.nitens. Whilst E.nitens
has a higher pulp yield than most of the species produced by south-east Asia, it has a lower pulp yield
than E.globulus. As a result, E.nitens resource currently trades at a discount of between USDFob5/bdmt
to USDFob10/bdmt less than E.globulus. E.nitens however is an acceptable product, especially in China.
Additionally, Japanese buyers purchased significant volumes of E.Nitens out of the Port of Burnie for many years
prior to the global financial crisis and before the recent insolvency of many Tasmanian based forestry operators.
Forecasts in this report, adopt a discount of USDFob10/bdmt for E.nitens.
Certification
Independent third party certification of plantations is essential to maximise sales and prices. While this is absolutely
the case in Japan, it is an increasingly important element of supply to China. There is a preference among
Japanese buyers (due to campaigns conducted by environmental organisations) for certification by the Forest
Stewardship Council (FSC). Certification has implications for management of chipping, stockpiling and loading.
It is relevant to note the northern Tasmanian E.nitens plantations are largely on land converted from native
forest. We note these plantations are not currently certified under the FSC. However, under the rules of
FSC, once the plantations have changed ownership, the native forest issues, past and present, cease to be
critical. Achieving FSC certification will take more than a year if starting from scratch. The alternative is for an
owner or manager with existing certification to use that capacity to certify exports while plantation specific
certification is pursued.
This analysis assumes the relevant plantation resource is certified.
Markets
Traditionally, the sole market for Australian hardwood chips was Japan, for the manufacture of pulp and paper.
China entered the global import market in 2002 and by 2014-15, will surpass Japan to become the largest
importer of hardwood chips. Growth in Chinese paper manufacturing will ensure this is a permanent change.
Alternative markets for E.nitens resource exist and are growing. Log sales have increased and the wood is being
deployed for the production of energy and for plywood. Log sales of E.nitens will typically command a higher
price than resource that is used for woodchip.
While prices for these alternative uses of E.nitens resource may have a better medium to long-term outlook than
hardwood chip prices for pulp production, IndustryEdge has adopted a conservative approach and has forecast
only on the basis of utilisation for pulp manufacture.
Australian Hardwood Chip Export Volume & Price Forecasts and Stumpage and Harvest Cost Review
© 2013 IndustryEdge P/L 7
The development of a bleached hardwood kraft pulpmill in northern Tasmania would be a substantial driver in
increasing the level of demand for both hardwood and softwood chips in the region. No one estate has sufficient
resource to supply all of a local mill’s fibre requirements. The construction of a local BHKP mill would be very
positive for pulpwood suppliers.
Currency
On a global scale, hardwood chip sales are normally transacted in US dollars, however the Japanese have
historically purchased woodchip in Australian dollar terms. Nonetheless, the Australian dollar (AUD) to US dollar
(USD) exchange rate can have a significant impact on Australian woodchip pricing and therefore, on returns to
growers. This analysis applies the current AUD to USD exchange rate of approximately AUD1.00 to USD1.05.
However, IndustryEdge understands that the consensus currency forecasts for the AUD:USD exchange rate
out to 2016 is for a depreciation to occur in the AUD to USD0.89 to USD0.90 (derived from Bloomberg). A
depreciation of the Australian dollar of that magnitude would materially improve grower returns and significantly
assist in attracting supply opportunities.
In IndustryEdge’s view, the major foreign exchange factor that is currently (and also likely to be) present over the
forecast periods is the devaluation of the Japanese Yen against the USD, which has fallen by as much as 20%
over recent months. Woodchip imports into Japan are therefore 20% relatively more expensive, as are imports
of paper from China.
Exports of paper from Japan should, as a result, be cheaper in USD terms. However, this will squeeze the
margins of Japanese pulp and paper manufacturers, suppressing opportunities for increased hardwood chip
prices over the near to medium term.
The Australian federal government has recently announced an agreement for a direct exchange between the
Australian dollar (AUD) and the Chinese Yuan (Renminbi or CN¥). This is good news for woodchip exports to
China, in that the flow of funds from China to Australia will no longer need to be converted to US dollars as an
intermediary for the transaction.
Australian Hardwood Chip Export Volume & Price Forecasts and Stumpage and Harvest Cost Review
8 © 2013 IndustryEdge P/L
Hardwood Chip Price AnalysisLike all commodities, hardwood chip prices (and volumes) are subject to global conditions and situations.
In particular, hardwood chip markets are impacted by pulp prices that are themselves driven by the demand for
paper.
Historical Price Analysis
In 2011, Australia’s average hardwood chip export price was USDFob181.56/t and in 2012, it was
USDFob172.75/t. However, the national average price is not indicative of any one situation.
Excluding the impact of foreign exchange rates, Australian average hardwood chip prices have been heavily
influenced by four major factors since 2010, as follows:
• Slow demand growth for printing and writing papers, especially in Europe, North America and Japan as the effects of the global financial crisis linger.
The primary utilisation of hardwood chips is the manufacture of bleached pulp for the production of printing and writing papers.
Since 2008-09, global demand for printing and writing papers has declined by 18.0% to the end of February 2013. North American (-33.0%) and Western European (-27.0%) demand have led the decline. The rest of the world (dominated by China and Japan) was down just 2.0% over the same period.1
As a result of the declining demand, current global capacity utilisation across all grades of printing and writing papers is 81.0%. 2 This near 20.0% under-utilisation is driving continued pressure on paper prices which in turn are suppressing global pulp and hardwood chip prices.
IndustryEdge notes this differential in regional demand is reflected in expanding printing and writing paper production in China, at the same time as contractions continue to occur in Western Europe and to a lesser extent in North America.
Emerging economy demand from countries such as India and China for uses outside of writing papers is also growing. In particular, demand for woodchips is occurring to satisfy use in hygiene products such as tissue paper and toilet paper, however, the majority of this demand is met by softwood fibre supplies. These emerging trends are expected to continue as the standards of living in these countries improve over the coming years.
• Expandedsupplyfromlowercostsuppliercountries,mostnotablyVietnam.
Japanese demand for hardwood chip declined sharply during the global financial crisis. Supplies from all exporting countries declined in line with demand.
Demand improved from MQ’09, although events have caused it to be quite turbulent. Demand has not returned to its original levels.
Proportions of supply from importing countries have changed markedly over a period of just less than five years, as the following chart shows.
1 & 2 EMGE, Global Monthly Monitor, February 2013
Australian Hardwood Chip Export Volume & Price Forecasts and Stumpage and Harvest Cost Review
© 2013 IndustryEdge P/L 9
Japanese Hardwood Chip Imports by Country of Origin: MQ’08 – DQ’12 (kt)
Source: Japan Customs
In MQ’08, Australia supplied 1 006.8 kt of hardwood chips to Japan, which constituted 34.1% of total supply. In DQ’12, Australia supplied 574.8 kt or 25.2% of total supply. The decline of Australian supply over the period has been 42.9%, down from approximately 4.0 million bone dry metric tonnes per annum (circa 8.0 million GMT equivalent) in calendar 2008 to approximately 2.3 million bone dry metric tonnes in calendar 2012 (circa 4.6 million GMT equivalent). South African supply has suffered a similar fate to that of Australia.
Chile has retained a relatively stable supply volume and now delivers 26.0% of all hardwood chips, up from 20.1% in MQ’08.
It is lower priced supply from Vietnam that has grown a substantial position in the Japanese market. In MQ’08, Vietnam supplied 225.9 kt of hardwood chip to Japan, or 7.6% of the total quarterly supply. In DQ’12, that had risen to 426.9 kt or 18.7% of total supply.
Hardwood chip quality from Vietnam has reportedly been, on average, relatively sub-optimal, resulting in price discounts being applied. Plantation resource such as E.nitens, delivers a higher quality product, and is therefore likely to attract higher prices than those being paid to Vietnamese suppliers.
International industry expectations are for a tailing off of supplies from Vietnam and other south-east Asian producers over the next two to three years and a simultaneous improvement in average quality and price for hardwood chip supplies from that country.
This change in both market demand and supply factors in Japan has had significant price implications for Australian hardwood chip volumes and prices.
JQ'08
MQ'09DQ'09
SQ'10JQ
'11MQ'12
DQ'120
500
1000
1500
2000
2500
3000
3500
kt
Quarter
Australia
Brazil
Chile
Sth Africa
Thailand
Viet Nam
Other
Australian Hardwood Chip Export Volume & Price Forecasts and Stumpage and Harvest Cost Review
10 © 2013 IndustryEdge P/L
• Liquidationofsignificantvolumesofplantationresourceonlessproductivelands.
At least one major (post MIS) owner has engaged in significantly discounted sales to realise cash flows and optimise opportunities for sale of land which is sub-optimal (or worse) for growing trees and/or for which there are lower harvest costs.
It is notable that this strategy is currently deployed for the preferred E.globulus plantations, which is suppressing weighted average export prices for all hardwood chips, and is also limiting opportunities for E.nitens resource. Industry intelligence suggests that the liquidations are coming to an end and pricing normality will return as more profitable plots are harvested.
• DebateandcampaignsoverTasmaniannativeforestry,leadingtooneoffliquidationsfrom Tasmanian ports, including of old stock.
Hardwood chip sales from Australia’s native forests and especially from those in Tasmania, are occurring at lower prices as debate continues around native forestry.
Analysis of recent prices achieved for specifically plantation hardwood chips provides an additional and different perspective. IndustryEdge has selected the three Australian ports that export hardwood chips exclusively sourced from plantations (Bunbury and Albany in Western Australia, and Portland in Victoria).
The following table specifies the average price of hardwood chip exports from January 2011 to December 2012 from those ports, compared with the trade weighted average price for all exports of hardwood chips over the same period.
Quarterly Hardwood Chip Export Prices from ‘Plantation Only’ Ports:
2011 & 2012 (USDFob/bdmt)
Source: ABS and IndustryEdge research and analysis Note: E.globulus price ~ USDFob10/bdmt discount not applied for E.nitens
The differential against the trade weighted average price of all hardwood chip exports from Australia over the recorded period, for exports from plantation only ports has declined over the
MQ'11JQ
'11SQ'11
DQ'11MQ'12
JQ'12
SQ'12DQ'12
100
120
140
160
180
200
220
240
USD
Fob/
t
Quarter
Albany
Bunbury
Portland
Australian Hardwood Chip Export Volume & Price Forecasts and Stumpage and Harvest Cost Review
© 2013 IndustryEdge P/L 11
period to DQ’12. This chart emphasises both the preference for plantation woodchips (consistently above the Australian average price) and the impact of what appear to be liquidation sales of hardwood chips from under-performing plots.
It is relevant to consider the prices paid in the major countries supplied by Australia. Hardwood chip buyers in Japan and China pay different prices for hardwood chips imported from Australia.
The following chart shows Australian average hardwood chip prices for Japan and China over 2010 to 2012.
Hardwood Chip Export Prices by Country of Delivery: 2010 - 2012 (USDFob/t)
Source: ABS Note: E.globulus price ~ USDFob10/t discount not applied for E.nitens
It is evident from the chart Chinese buyers have purchased hardwood chips at lower prices than Japanese buyers.
However, Chinese buyers have increasingly exhibited a willingness to pay higher prices for better chip quality. Evidence of this may be found in the gradually increasing prices paid for Australian supply which has significant quality advantages to the hardwood species produced from south-east Asian countries.
It is notable that from 2011 to 2012, the average price of Australian hardwood chips increased in China by 9.2%, while in Japan the average price declined by 6.8%. Nonetheless, Japan remains the preferred destination for Australian hardwood chip exports throughout the forecast period.
Price Forecasts
Based on historical pricing data and taking into account the range of demand, supply and general economic
factors that are anticipated to be prevalent through to 2018, IndustryEdge forecasts the following likely price
ranges for hardwood chip exported from FSC certified, E.nitens plantations in northern Tasmania.
MQ'10
JQ'10
SQ'10DQ'10MQ'11
JQ'11
SQ'11DQ'11MQ'12
JQ'12
SQ'12DQ'12
100
120
140
160
180
200
220
240
USDFob/bdmt
Quarter
China
Japan
Taiwan
TWA
Australian Hardwood Chip Export Volume & Price Forecasts and Stumpage and Harvest Cost Review
12 © 2013 IndustryEdge P/L
E.nitens Weighted Average Hardwood Chip Export Price Forecasts: 2013-14 – 2015-18 (USD/bdmt)
2013-14 2014-15 2015-18 (3 years)
Japan China Avg Japan China Avg Japan China Avg
High Price 183.00 162.00 172.50 190.00 167.00 178.50 202.00 178.00 190.00
Low Price 165.00 150.00 157.50 165.00 155.00 160.00 165.00 160.00 162.50
Forecast Annual
Average Price170.00 172.50 183.00
Note: E.nitens price ~ includes USDFob10/bdmt discount
The following qualifications apply to these price forecasts:
• Highpriceforecastsonlyapplyforcertifiedplantations(becauseitassiststoensurevolumeandprovides a form of protection for buyers against environmentalist’s campaigns).
• Highpriceforecastsonlyapplyforvolumesuptoandincludingthe‘HighVolume’estimatesdetailed in this report for the forecast periods.
• Highpriceforecastsaredependentupon‘liquidation’salesendingincalendar2013.
• Opportunitiesforsaleasalternativeproductsarenotincluded.
• Overanyperiod,unforeseenfactorsandeventscanoccurandmayalteractualresults.
• Averagepricesassumea50/50splitofsalestoJapanandChina
Australian Hardwood Chip Export Volume & Price Forecasts and Stumpage and Harvest Cost Review
© 2013 IndustryEdge P/L 13
Demand and Volume ForecastsGlobal woodchip demand is almost entirely influenced by demand for paper and paper products. In turn,
demand for these is influenced by general economic conditions.
Demand for Australian hardwood chip will be impacted by many of the same factors that influence upon
Japanese and Chinese markets.
Historical Demand for Australian Hardwood Chips
For more than two decades, Australia held the dominant position as an exporter of hardwood chips to Japan.
A combination of factors has resulted in this position deteriorating. These factors include the commencement
of exports from lower cost supplier countries, weak Japanese economic growth and demand growth and
increasing pulp and paper production in China.
The following chart shows Australian hardwood chip exports to Japan from 2010 to 2012.
Quarterly Australian Hardwood Chip Exports to Japan: MQ’10 – DQ’12 (kbdmt & USDFob/bdmt)
Source: ABS Note: E.globulus price ~ USDFob10/bdmt discount not applied for E.nitens
Exports of hardwood chips to China only commenced in 2002. By 2006, China was a net importer of
hardwood chips. In 2012, aggregate Chinese hardwood chip demand was approximately 7.2 million BDMT (or
approximately 14.4 million GMT equivalent) and in 2013 is estimated to be approximately 8 million BDMT (or
approximately 16 million GMT equivalent).
MQ'10
JQ'10
SQ'10DQ'10MQ'11
JQ'11
SQ'11DQ'11MQ'12
JQ'12
SQ'12DQ'12
0
200
400
600
800
1000
1200
0
50
100
150
200
250
kbdmt
USDFob/bdmt
Quarter
Quantity
TWA
Australian Hardwood Chip Export Volume & Price Forecasts and Stumpage and Harvest Cost Review
14 © 2013 IndustryEdge P/L
JQ'10
SQ'10
DQ'10
MQ'11
JQ'11
SQ'11
DQ'11
MQ'12
JQ'12
SQ'12
DQ'12
0
50
100
150
200
250
0
20
40
60
80
100
120
140
160
kbdmt
USDFob/bdmt
Quarter
Quantity
TWA
3 RISI
The following chart shows Australian hardwood chip exports to China from 2010 to 2012.
Australian Hardwood Chip Exports to China: JQ’10 – DQ’12 (kbdmt & USDFob/t)
Source: ABS Note: E.globulus price ~ USDFob10/t discount not applied for E.nitens
Demand Growth for Hardwood Chips
In either 2014 or 2015, annual aggregate Chinese demand for hardwood chips will overtake Japanese demand.
Chinese pulp and paper manufacturing expansion will drive increased demand for hardwood chips.
Recent assessments indicate that a total of 2.4 million tonnes of additional paper making capacity will
commence operation in China in 2013, followed by an additional 1.9 million tonnes in 2014, with a further 0.7
million tonnes already scheduled for 2015 and 2016 combined. Of this 5.0 million tonne expansion, a total of
2.9 million tonnes will be based on the supply of hardwood kraft pulp, with some other opportunities existing for
supply of hardwood chips.3 It should be noted that significant volumes of recovered paper and softwood pulp
will be included in the fibre supply to meet this paper expansion in China.
On the other side of the Japan Sea, Japanese demand for hardwood chips for the manufacture of pulp
and paper will be static at best, with limited opportunities for new sales, although some sales for alternative
utilisations are possible.
IndustryEdge has conducted an analysis of potential supply opportunities for Australian hardwood chips, based
on the opportunities coming on line or which become available to supply in Japan and China over the forecast
periods. This analysis is exclusive of existing sales opportunities and those that might be supplied by recovered
paper or softwood chips and pulps. The analysis is detailed in the table below.
Australian Hardwood Chip Export Volume & Price Forecasts and Stumpage and Harvest Cost Review
© 2013 IndustryEdge P/L 15
Additional Hardwood Chip Sales Opportunities: 2013-14 – 2016 to 2018 (kGMT)
Japan China
Marusumi (</=160k GMT pa) Sun Paper (</=500k GMT pa)
Chuetsu (</=160k GMT pa) Chenming (</=500k GMT pa)
Oji (</= 400k GMT pa) Bohui (</=500k GMT pa)
APRIL (</=500k GMT pa)
Source: IndustryEdge research & estimates
The table indicates that over the forecast periods, at least 2.7 million GMT of additional supply opportunities are,
will be available or come on line over the forecast period, in addition to existing supply opportunities.
Reasonableness Estimates of E.nitens Resource Demand
IndustryEdge is requested to advise whether the following constitutes reasonable estimates of high and low
demand for northern Tasmanian E.nitens resource over the forecast periods. Note that this table refers to GMT
(green metric tonnes), while woodchips are sold by their dried fibre content in BDMT (bone dried metric tonnes).
It is appropriate to consider this resource in terms of GMT in recognition of the emergence and potential of
some alternatives to the utilisation of E.nitens as hardwood chips for the manufacture of pulp and paper.
Having considered current and future demand drivers, IndustryEdge considers the following to be reasonable
estimates of demand, on a specific estate basis, over the forecast periods.
IndustryEdge E.nitens Resource Estimates: 2013-14 – 2018+ (GMT)
GMT High Volume Low Volume Base Volume
2013-14 750,000 280,000 550,000
2014-15 1,200,000 600,000 1,000,000
2015-16 1,800,000 1,000,000 1,500,000
2016-17 2,500,000 1,200,000 2,150,000
2017-18 2,500,000 1,500,000 2,250,000
2018+ 2,500,000 1,750000 2,250,000
Source: IndustryEdge research & estimates
The following qualifications apply to these estimates:
• CurrentexpansionsofJapaneseandChinesepaperproductionneedtoproceedfortheseestimates to be maintained.
• Othersuppliers,includingfromAustralia,willparticipateinthesemarkets.
• Overanyperiod,unforeseenfactorsandeventscanoccurandmayalteractualresults.
Alternative Demand
Demand for hardwood from certified plantation sources continues to increase, for a variety of uses. The two
major alternative uses are exports of logs and exports of woodchips for energy production.
Log Exports
Export markets for logs have grown over the past few years, along with prices. Quarterly Australian hardwood
log export volumes since 2010 are detailed in the following chart.
Australian Hardwood Chip Export Volume & Price Forecasts and Stumpage and Harvest Cost Review
16 © 2013 IndustryEdge P/L
MQ'10JQ
'10SQ'10
DQ'10MQ'11
JQ'11
SQ'11DQ'11
MQ'12JQ
'12SQ'12
DQ'120
20
40
60
80
100
120
140
0
50
100
150
200
250
300
km3
AU
DFo
b/km
3
Quarter
NSW
Vic
Qld
WA
Tas
TWA
4 Hawkins Wright
Quarterly Australian Hardwood Log Exports by State: MQ’10 – DQ’12 (km3 & AUDFob/t)
Source: ABS
The market prognosis for shipments of logs, either for sawnwood or peeling, for the manufacture of wood
panels such as plywood, is stronger than for woodchips, with new markets, including India, opening up and
increasing demand.
Log exports are less costly per unit due to reduced handling and processing costs (no chipping costs are
incurred, drying time is reduced and logs can be stored in-field more easily and cheaply than woodchips).
Additionally, logs can attract better returns in some instances where the seller is able to negotiate with the buyer
based on the end use and value.
Biomass Energy
Following the Japanese tsunami and the closure of the Fukushima nuclear power plant, the Japanese
Government introduced substantial new renewable energy subsidies for biomass energy. In response, one
Japanese paper manufacturer has commenced the conversion of an existing pulp mill to the manufacture of
bio-energy, using hardwood chips as its fuel. 4 Other paper manufacturers are expected to follow.
Australian Hardwood Chip Export Volume & Price Forecasts and Stumpage and Harvest Cost Review
© 2013 IndustryEdge P/L 17
Supply Chain Considerations & CostsIndustryEdge has assessed the supply chain cost assumptions and confirms each is reasonable in the context of
the relevant E.nitens plantation estate, managed for hardwood chip production, with chipping undertaken at scale.
In addition, the low and high, total supply chain cost assumptions for the example of a 90 kilometre haul are
reasonable.
The table on page 18 summarises the assessments. Explanatory notes and details are supplied.
Port Capacity and Access
Port capacity and access arrangements are the major consideration (and potential risk) in the supply chain.
Northern Tasmania has three export woodchip facilities:
• Burnie/Hampshire(NorthWest)
• Longreach(NorthEast)
• BellBay(NorthEast)
These facilities have four wharf berths in total, with an implied shipping capacity of up to 8 million GMT per
annum. Capacity across northern Tasmania is not an issue.
Reduced native forest harvesting has decreased throughput, freeing up aggregate capacity across the northern
Tasmanian ports. Additionally, it is relevant to consider that the northern Tasmanian E.nitens plantation estates
were factored into port considerations by a variety of participants, including Tas Ports.
The annual volume of woodchips considered in this Report, and a strategy to enter into long term contracts, will
likely drive port access. Like all infrastructure, with appropriate downtime for maintenance factored in, the key to
maximizing returns and reducing unit costs, is operating at full capacity.
However, it is important to address the current and known circumstances for each of the ports.
There are two woodchip export facilities (Longreach and Bell Bay) in close proximity on the Tamar River. On
current estimates, IndustryEdge considers that each has additional capacity and importantly, has space to
ensure appropriate pile segregation. (see below for further consideration of this issue)
The Port of Burnie has a single woodchip export facility, operating three piles. On current estimates and
information, IndustryEdge considers it has additional capacity and pile segregation opportunities.
In the past, access preference though the Port of Burnie was provided by contract to Gunns Limited. This issue
needs to be resolved. IndustryEdge considers that the conditions under which preference was supplied are no
longer relevant. Maximising capacity utilization is important to all parties that might be involved in the Port of
Burnie because that will be likely, all other considerations aside, to reduce the unit costs of chipping and loading.
IndustryEdge notes that on significant volumes (say above 1 million GMT per annum), the economics of installing
additional loading infrastructure improve dramatically. Though not a preferred option, it is an available option for
a Responsible Entity to take in the absence of other access arrangements.
In summary, northern Tasmanian port capacity is adequate for all assessed volumes specified in this Report
and the expected harvest volumes to be generated under the harvest volumes forecast in this report. Further,
although there appear to be access issues to resolve, IndustryEdge’s opinion is that the significant volumes
under consideration can be expected to deliver access via negotiation.
Australian Hardwood Chip Export Volume & Price Forecasts and Stumpage and Harvest Cost Review
© 2013 IndustryEdge P/L 19
Sup
ply
Cha
in C
ost
s A
sses
smen
t S
umm
ary
(AU
D/G
MT
& %
) * #
Sup
ply
Cha
in C
ost
(per
GM
T un
less
oth
erw
ise
stat
ed)
Clie
nt A
ssum
ptio
nsC
lient
Ass
umpt
ions
In
dust
ryE
dge
Sum
mar
y A
sses
smen
t*Lo
wH
igh
Har
vest
Long
term
con
trac
ts, G
ood
qual
ity e
stat
e$1
8.00
$22.
00R
easo
nabl
e –
Mai
nly
unifo
rm q
ualit
y es
tate
cha
ract
eris
tics
are
requ
ired
to re
mai
n w
ithin
the
high
ran
ge
Ro
adin
gP
rimar
ily G
unns
and
For
estr
y Ta
sman
ia la
nd$1
.25
$1.7
5R
easo
nabl
e
Ove
rhea
d
Long
term
con
trac
ts, W
ell m
anag
ed
outs
ourc
e te
nder
ing
$2.5
0$5
.00
Rea
sona
ble
– C
osts
of a
chie
ving
and
mai
ntai
ning
cer
tifica
tion,
stak
ehol
der
and
neig
hbor
man
agem
ent a
nd O
H&
S m
ay
incr
ease
cos
ts
Tran
spo
rtFl
ag fa
ll (re
gard
less
of d
ista
nce)
. By
road
$1.5
0$2
.00
Rea
sona
ble
– Fl
ag fa
ll w
ould
incr
ease
for
tran
spor
t by
rail
Tran
spo
rt (p
er k
m/G
MT
)N
orth
ern
Tasm
ania
n ro
ads,
Wel
l man
aged
outs
ourc
e te
nder
ing
$0.1
15$0
.130
Rea
sona
ble
– Fl
ag fa
ll w
ould
dec
reas
e fo
r tr
ansp
ort b
y ra
il
Chi
pp
ing
Long
term
con
trac
ts, S
cale
ope
ratio
ns$8
.00
$11.
00R
easo
nabl
e –
Cos
ts m
ay in
crea
se w
ithou
t lon
g te
rm c
ontr
acts
in p
lace
Chi
pp
ing
Yie
ldE
.nite
ns re
sour
ce96
%98
%R
easo
nabl
e –
Yie
ld m
ay d
ecre
ase
for
infie
ld c
hipp
ing
Pile
/Lo
adLo
ng te
rm c
ontr
acts
, Sca
le o
pera
tions
$7.0
0$1
0.00
Rea
sona
ble
– In
clud
ing
basi
c co
sts
of p
ile s
egre
gatio
n to
mee
t
cert
ifica
tion
requ
irem
ents
Wo
od
fib
re c
ont
ent
Tota
l dry
woo
d fib
re c
onte
nt (B
DM
T/G
MT)
48%
50%
Rea
sona
ble
Exa
mp
leTo
tal S
upp
ly C
hain
Co
sts
for
90 k
m h
aul
$48.
32$6
3.25
Rea
sona
ble
Not
es: A
sses
smen
ts b
ased
on
Tasm
ania
n co
sts
# G
MT
is G
reen
Met
ric T
onne
* Th
is s
umm
ary
shou
ld b
e re
ad in
con
junc
tion
with
the
follo
win
g co
mm
enta
ries
Aus
tral
ian
Har
dw
ood
Chi
p E
xpor
t Vo
lum
e &
Pric
e Fo
reca
sts
and
Stu
mp
age
and
Har
vest
Cos
t R
evie
w
©
201
3 In
dust
ryE
dge
P/L
18
Australian Hardwood Chip Export Volume & Price Forecasts and Stumpage and Harvest Cost Review
© 2013 IndustryEdge P/L 19
Harvest • Harvestingestimatesareforclearfallregimes.ThelowerendofAUD18/GMTwouldbeforeasy
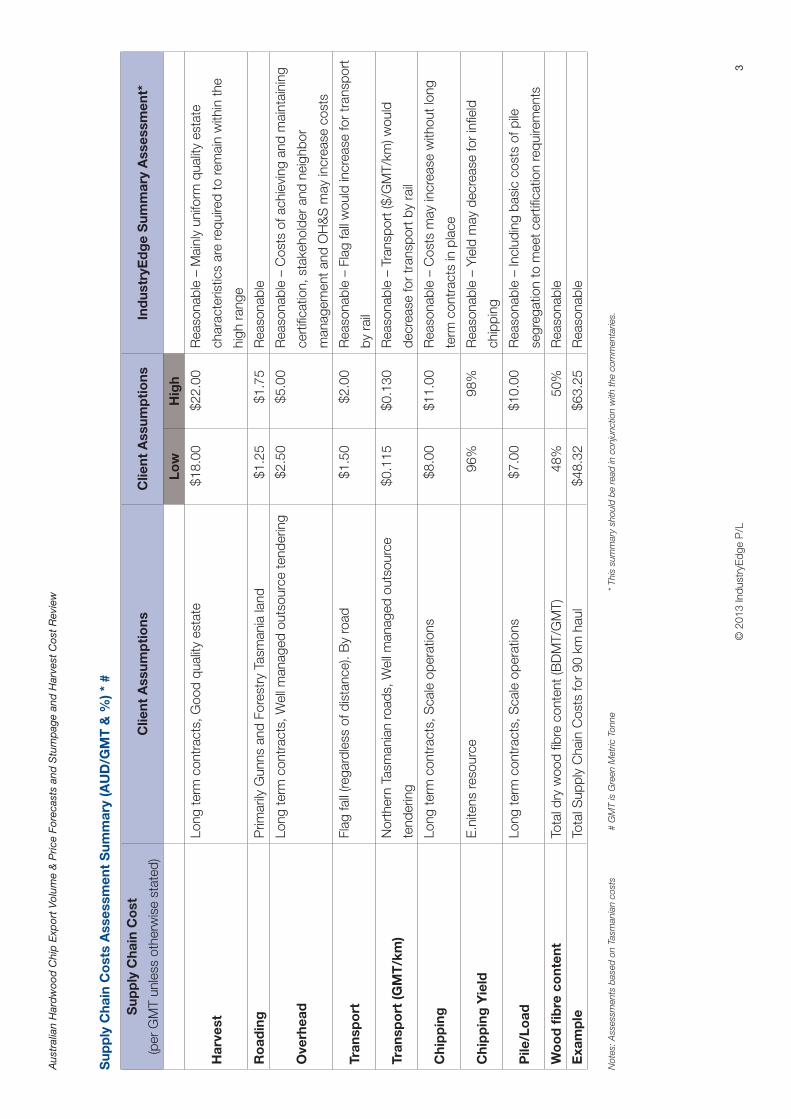
access and high automation. The mid-range of AUD20/GMT would be a better low end figure, especially for plots where growth rates are mixed and there are a number of smaller or undersized stems.
• Harvestingcontractsshouldbenegotiatedforthelong-term.However,itisalsoimperativetheharvesting manager/contractor is certified with AFS and FSC supply chain management.
• Ifinfieldchippingistooccur,thenharvestingcontractorsusuallyundertakethemobilechippingoperations. While this increases the cost of field operations, it will remove the cost of chipping at major chipping facilities. We estimate that an infield chipping cost of approximately AUD 26-28/GMT is reasonable.
• HarvestingcostswillbehigherthanAUD22/GMTiftheplantationregimeistogrowonselectivestems for sawlogs or peeler logs, thereby necessitating thinning operations within the plantations. The cost of thinning operations is very much site specific, but will raise the high end of the harvesting range to be closer to AUD30/GMT in some instances. However, if the plantations are managed to deliver sawlog or peeler log they will generally command a much higher price than woodchips.
Roading • Ex-Gunnsroadsaregenerallyofahighquality.Theyareexpectedtobesufficientforfirefighting
purposes, and in most instances would require little maintenance to enable harvesting to proceed. The most likely issues to arise with roading if not maintained for a while are washed out culverts, incline corrugation and bridge upkeep.
• Thehighandlowestimatesforroadingarewellwithinexpectedranges,however,thereisnonoteif FT levies have been included. The prices shown would cover private, as well as local government and state roads, but FT levies would be applicable in many instances which are not stated.
Overhead • Overheadcostsarenotspecified,however,costsinthisareaofoperationsvarybothinvalueand
in application. Often overheads are calculated by a set sum per hectare, possibly in the region of AUD25/ha, then a certain amount per tonne of wood, usually at the lower end of the range being AUD2.50/GMT.
• AqualifiedResponsibleEntitywithappropriateskillsandcredentialswouldseekalong-termcontract.
• Thelowandhighoverheadcostestimatesdonotappeartocovercertification,OH&S,contractmanagement, neighbour management or stakeholder management. Each of these issues is required to be addressed if certification by either the Forest Stewardship Council (FSC) or Australian Forestry Standard (AFS) is to be attained and maintained.
Australian Hardwood Chip Export Volume & Price Forecasts and Stumpage and Harvest Cost Review
20 © 2013 IndustryEdge P/L
Transport – Flag fall • Thelowandhighestimatesfortransportflagfallareinthecorrectrangeforlogstransportedfor
wood chipping at a major facility. However, they may be higher than the cost for the transportation of product from infield chipping. This statement is dependent on a number of variables, but the essence of the costing is that more volume (weight) can be carried in the form of chips since the air space between logs is not a factor in loading.
• Estimatedtransportflagfallisreasonableontheunderstandingalltransportisbyroad,andnotbyrail freight. Rail may become pertinent for resource managed in Southern Tasmania, then moved north to either the Longreach or Hampshire mills.
Transport – Rate • ThelowandhighestimatesfortransportratesstatedbyAUD/GMT/kmareaccurate.This
assessment is provided on the basis that most harvesting will be undertaken in a catchment of not much more than 90 kms around either the Longreach or Hampshire mills and that roads are in good condition, which they generally are.
• OutsourcetenderingfortransportwouldnormallybearrangedbytheResponsibleEntity,and would be for given volumes over a set period. There is ample available capacity in log transportation in Tasmania. As a result, prices will be towards the lower end of the range.
• InthenorthofTasmania,90kmcatchmentsaroundbothLongreachandHampshiremillswouldcover upwards of 80% of the specific resources. Major blocks, such as Surry Hills, are within the 90 km catchment zone.
Chipping Costs • Estimatedchippingcostsforoperationsatmajorfacilitiesareintheexpectedrange,andwould
not be necessarily relevant for infield operations, where chipping would be part of the harvesting operations.
• Thestatedlowandhighestimatesarewithinrangeforfacilitieswhichareownedbythemanagingentity or for which it has open access. However, the estimates may be on the low side if contract chipping is undertaken by a third party and is not contracted.
• Long-termcontractsforexpandingvolumeswillmovechippingcoststowardsthelowerendofthegiven range, but not below the stated, estimated low costs.
Chipping Yield • Thegivenestimatesof96%lowand98%highareforanefficientstaticchippingfacilityoperation.
Both Longreach and Hampshire have historically achieved yields within these ranges, however may require maintenance to achieve correct quality chip size.
• Problemsreducingchipyieldareshattercausedbybluntorpoorpositioningofchippingequipment, making chip sizes too large or non-uniform and the increase in fines falling to waste.
• Infieldchipping,whileoftenasmalleroperation,canalsoimpactfibreyieldifproductisleftonthe harvesting operation site for an extended period and moisture loss or gain is not managed within acceptable bounds. A corresponding increase in yield is able to be achieved with infield chipping because trees are taken down to a much lower small end diameter – meaning additional merchantable timber of approximately 1% to 2% is produced than for logs which go to a static chipping facility. Management of chip quality is critical to optimise outcomes from infield chipping
operations.
Australian Hardwood Chip Export Volume & Price Forecasts and Stumpage and Harvest Cost Review
© 2013 IndustryEdge P/L 21
Pile and Load • TheestimatedpilemanagementandloadingcostsAUD/GMTarewithinbounds.However,these
may be impacted through reduced costs if infield chipping operations are applied.
• Pilemanagementcostsmaybeslightlyhighersincesegregationofpilesmayberequired.Segregation would be by certified chain of custody, being:
– FSC must be managed in accordance with FSC product requirements,
– AFS pile not to contaminate any pile carrying FSC certification, and
– FSC controlled wood chip pile. This would not mean the wood has been certified, but the supply chain of management would be certified as meeting FSC requirements.
• CurrentlytheLongreachandHampshirechipmillsareclosed,alongwiththerespectivechippilesand loading facilities at the ports. It is understood these facilities are not ready to start immediate operations. In addition, it is also doubtful if the TasPorts contracted preferential treatment for Gunns
at the Burnie wharf could be transferred to a new incumbent.
Woodfibre content • Thestatedformulaforwoodfibrecontentisinaccordancewithindustryuseandstandards.
• Variancefromthelowof48%andhighof50%generallyarisesonanaveragebasis,ifthereispoorchipping yield due to shatter and fines, which will most likely arise where insufficient maintenance has been undertaken at a substantial chipping facility or where poor infield chipping management occurs. Other factors which may influence dry fibre content include climate, harvest timing and the amount of time logs are left out in the forest.
Australian Hardwood Chip Export Volume & Price Forecasts and Stumpage and Harvest Cost Review
22 © 2013 IndustryEdge P/L
Immediate Sale OptionAll the foregoing assumptions, data, forecasts and assessments are relevant to consideration of both continuing
operations and of an immediate sale on a discounted enterprise value. IndustryEdge is requested to advise
the approach an institutional investor might take to determine a bid price and to provide opinion of the
reasonableness of current discount rate assumptions.
Typically, institutional investors construct a bid price for plantation forestry assets based on their net present
value (NPV). This involves projecting out all internal and external costs associated with managing trees through
to harvest, including a required return on capital. The Supply Chain Costs section of this Report sets out those
costs and assesses their reasonableness. Cash flows generated at harvest are reduced by the costs incurred
through to harvest, with the capital costs (including interest) factored in to what is then the NPV.
Institutional investors typically calculate their return on capital into their bid price in the form of a discount (lower
price)ontheNPV,knownasthe‘discountrate’.In‘normal’marketconditions,thisdiscountrateistypically
8-12%. For assets that are sold under distressed conditions or perceived forced sales, buyers will typically apply
an additional discount. This is often the case in situations where there is an owner (or seller) of timber assets that
are perceived to be in distress, such as that which has applied in the Australian hardwood plantation sector in
recent years. It is not reasonable to assume that a discount rate of 20-30% may be sought in these situations.
The effect of discount rates on potential purchase prices can be illustrated using the following simplified
example. Assume, the cash flows that are expected to be generated by a timber asset in 3 years time is $100. If
a discount rate of 8% is used, the purchaser would attribute a value of $79.38. Conversely, (and using the other
end of the spectrum) if a discount rate of 30% is used the attributable value would be $45.52.
In the current circumstances and for a sale conducted in the near term (concluding in 4 to 6 months), the small
universe of potential investors is likely to focus on steep discounts. This is as much the case for estates that are
available for sale free of encumbrances, as those for which the encumbrances may be significant.
There are several relevant considerations:
• Encumbrance of Estates – Plantation estates established under Managed Investment Schemes (MIS) generally include some encumbrances that increase transactional and reputational risks. These include multiple counter-parties in the form of grower-investors.
• Uncertainty of Recent Estate Management – Plantations require constant management, maintenance and up-keep, including of infrastructure of the type detailed in the Supply Chain Considerations and Costs section of this Report. Additionally, ongoing rationalization of an estate on an orderly basis is critical to presenting an estate for sale in its best condition, without introducing market shocks such as significant liquidation volumes from under-performing plots. Uncertainty of the current condition of the plantation estate is increased where consistency of management may have been impacted by the financial capacity of the estate manager.
• Limited Potential Buyers – IndustryEdge considers the universe of potential buyers to be limited to vertically integrated pulp and paper manufacturers (most likely from Japan and China) and institutional investors, operating through established managers.
Established managers and their institutional investors have made extensive purchases of Australia’s hardwood plantation assets in the last three years. This has reduced the number of potential buyers. Additionally, the capacity of the remaining entities to fund further, significant acquisitions is not without limits. One of the major entities has expressed itself unwilling to participate in Tasmania at all.
Australian Hardwood Chip Export Volume & Price Forecasts and Stumpage and Harvest Cost Review
© 2013 IndustryEdge P/L 23
Japanese pulp and paper manufacturers are unlikely to have capacity or interest in significant direct expansions of their plantation estate holdings in Australia.
Chinese pulp and paper manufacturers may be interested in securing long-term access to a plantation estate. Their intentions are however unknown and as yet untested.
• Demand and Supply of Hardwood Chips – Japanese and Chinese pulp and paper manufacturers are currently able to secure hardwood chip resource as required, at prices that still include liquidation volumes and at a time when most paper prices are stagnant and global production to capacity of printing and writing papers is around 80% (as described in this Report).
In this context, IndustryEdge considers there is uncertainty about the interest, capacity and desirability (from a buyer
stand point) of the current E.nitens plantation estates, particularly if the assets are perceived to be a distressed
sale. As a result, IndustryEdge considers a reasonable assessment of integrated pulp and paper manufacturer and
institutional investor discount expectations would range between 20% and 30% per annum of the assessed NPV.
In the circumstance of estates where evident distress is not a feature, there is potential to significantly improve
return prospects and the potential purchase price that can be achieved from a buyer. In such a circumstance,
there is likely to be a higher degree of competitive pricing tension between potential purchasers.
Australian Hardwood Chip Export Volume & Price Forecasts and Stumpage and Harvest Cost Review
24 © 2013 IndustryEdge P/L
Appendix OneThese data tables apply to the corresponding charts in the body of this report.
Japanese Hardwood Chip Imports by Country of Origin: MQ’08 – DQ’12 (kt)
Australia Brazil Chile Sth Africa Thailand Viet Nam Other Total
MQ’08 1,006.8 198.9 594.7 480.8 123.2 225.9 321.4 2,951.7
JQ’08 1,225.1 117.3 578.6 564.4 102.1 286.7 309.4 3,183.6
SQ’08 1,231.1 229.4 589.5 491.7 114.6 329.1 222.6 3,208.0
DQ’08 1,000.7 144.1 562.9 624.3 108.1 229.1 260.2 2,929.4
MQ’09 638.6 148.3 571.0 259.9 76.3 205.2 148.3 2,047.6
JQ’09 754.3 119.7 522.9 351.7 74.7 216.6 146.4 2,186.3
SQ’09 904.9 80.1 646.3 433.8 69.2 178.4 259.5 2,572.2
DQ’09 832.9 121.4 488.6 358.5 98.5 209.2 137.0 2,246.1
MQ’10 819.2 153.7 588.6 325.6 142.8 247.0 105.2 2,382.1
JQ’10 889.9 132.9 541.1 463.0 176.0 249.5 128.3 2,580.7
SQ’10 844.5 117.2 691.6 299.3 150.2 294.9 85.3 2,483.0
DQ’10 1,037.8 151.8 556.1 377.4 147.6 272.2 102.7 2,645.6
MQ’11 754.3 146.8 701.8 356.6 192.1 340.9 103.8 2,596.3
JQ’11 535.5 162.7 775.1 312.7 167.5 440.5 91.6 2,485.6
SQ’11 613.8 145.3 461.2 380.4 175.2 484.2 114.7 2,374.8
DQ’11 694.3 121.3 642.2 273.8 238.9 381.9 86.7 2,439.1
MQ’12 733.0 113.8 736.5 381.4 185.1 348.6 130.4 2,628.8
JQ’12 590.8 176.8 646.7 282.5 199.4 432.8 79.9 2,408.9
SQ’12 614.3 207.6 610.1 188.6 188.7 369.3 91.0 2,269.6
DQ’12 574.8 153.1 594.5 230.7 217.0 426.9 82.1 2,279.1
Source: Japan Customs
Quarterly Hardwood Chip Export Prices from ‘Plantation Only’ Ports: 2011 & 2012 (USDFob/bdmt)
Albany Bunbury Portland
MQ'11 204.05 202.17 205.64
JQ'11 190.45 187.96 181.89
SQ'11 188.35 196.69 186.12
DQ'11 193.63 194.99 185.34
MQ'12 181.98 175.81 179.05
JQ'12 183.25 183.49 170.99
SQ'12 169.13 169.78 164.75
DQ'12 165.94 165.90 166.42
Source: ABS and IndustryEdge research and analysis Note: E.globulus price ~ USDFob10/bdmt discount not applied for E.nitens
Australian Hardwood Chip Export Volume & Price Forecasts and Stumpage and Harvest Cost Review
© 2013 IndustryEdge P/L 25
Hardwood Chip Export Prices by Country of Delivery: 2010 - 2012 (USDFob/t)
China Japan Taiwan TWA
MQ'10 – 213 120 198
JQ'10 143 220 137 205
SQ'10 133 219 140 198
DQ'10 114 196 123 175
MQ'11 137 197 129 179
JQ'11 134 183 113 169
SQ'11 141 190 114 174
DQ'11 155 194 126 183
MQ'12 145 180 102 171
JQ'12 151 188 107 178
SQ'12 146 170 112 159
DQ'12 145 173 105 162
Source: ABS Note: E.globulus price ~ USDFob10/t discount not applied for E.nitens
Quarterly Australian Hardwood Chip Exports to Japan: MQ’10 – DQ’12 (kbdmt & USDFob/bdmt)
Quantity TWA
MQ'10 832.9 213
JQ'10 982.9 220
SQ'10 1,191.2 219
DQ'10 1,192.0 196
MQ'11 941.0 197
JQ'11 908.4 183
SQ'11 840.8 190
DQ'11 879.2 194
MQ'12 928.3 180
JQ'12 780.4 188
SQ'12 854.2 170
DQ'12 769.1 173
Source: ABS Note: E.globulus price ~ USDFob10/t discount not applied for E.nitens
Australian Hardwood Chip Export Volume & Price Forecasts and Stumpage and Harvest Cost Review
26 © 2013 IndustryEdge P/L
Australian Hardwood Chip Exports to China: JQ’10 – DQ’12 (kbdmt & USDFob/t)
Quantity TWA
JQ'10 120.0 143
SQ'10 212.7 133
DQ'10 231.3 114
MQ'11 202.7 137
JQ'11 156.3 134
SQ'11 173.2 141
DQ'11 190.6 155
MQ'12 71.8 145
JQ'12 218.1 151
SQ'12 162.6 146
DQ'12 196.8 156
Source: ABS Note: E.globulus price ~ USDFob10/t discount not applied for E.nitens
Quarterly Australian Hardwood Log Exports by State: MQ’10 – DQ’12 (km3 & AUDFob/t)
NSW Vic Qld WA Tas TWA
MQ’10 17.8 33.3 – 1.1 – 136
JQ'10 18.7 20.2 0.3 1.4 44.0 126
SQ'10 12.2 8.2 0.4 1.5 10.2 196
DQ'10 18.4 8.3 1.6 1.7 3.4 269
MQ'11 8.0 13.5 11.8 1.1 26.8 147
JQ'11 17.7 12.9 11.1 1.6 24.3 152
SQ'11 10.3 5.4 102.1 2.0 19.5 132
DQ'11 9.1 5.0 12.4 2.2 43.0 150
MQ'12 0.6 2.3 0.4 6.0 15.7 122
JQ'12 0.2 0.6 0.5 4.6 25.9 144
SQ'12 0.4 0.6 0.5 0.9 25.9 151
DQ'12 1.4 0.4 0.6 13.2 8.0 230
Source: ABS
www.industryedge.com.au
IndustryEdge Pty LtdGPO Box 77Hobart Tasmania 7001Ph +61 (0)3 6231 5677Fx +61 (0)3 6231 0333
IndustryEdge Pty LtdPO Box 7596Geelong West Victoria 3218 Telephone +61 (3) 5229 2470Facsimile +61 (3) 5229 0334Email [email protected]