168
Australian Innovation System Report 2011
| Date post: | 05-Jun-2018 |
| Category: |
Documents |
| Upload: | phungthien |
| View: | 215 times |
| Download: | 0 times |

Australian Innovation System Report 2011

Further Information
For more information on data or government initiatives presented in this report please open the HTML version of this report and click on the title of the initiative or on the data link provided below each chapter. Additional case studies on innovation can be found in the Case Study Compendium to this report found on the report website.
You can access this report from the Department’s website at: http://www.innovation.gov.au/AISReport
For more information, or to comment on the report, please contact:ManagerCollaboration ResearchDepartment of Innovation, Industry, Science and ResearchGPO Box 9839CANBERRA ACT 2601Telephone: +61 2 6213 6000Facsimile: +61 2 6213 7000Email: [email protected]
Project team
Dr Luke Hendrickson (Project Leader)Dr Antonio Balaguer (Project Leader)Ms Di BallantyneDr Krisztian BaranyaiMs Rachel CollinsMr Paul DrakeMs Gordana JosipovicMs Margaret MarshallMr Brett StillMs Louise TalbotMs Brigit Verey
Acknowledgements
The Department wishes to acknowledge the contributions received from Commonwealth, State and Territory government departments, businesses and other private organisations, universities and publicly funded research organisations. The Department also wishes to acknowledge the contributions of Dr Mark Mathews from the HC Commbs Policy Forum at the Australian National University.
© Commonwealth of Australia 2011
ISBN 978 1 921916 09 0
This work is copyright. Apart from any use as permitted under the copyright act 1968, no part may be reproduced by any process without prior written permission from the Commonwealth. Requests and inquiries concerning reproduction and rights should be addressed to the Department of Innovation, Industry, Science and Research, GPO Box 9839, Canberra ACT 2601.

Foreword
iii
FOREWORD
Without people working together effectively we cannot hope to answer many of the great challenges of our time, from environmental issues, to sustainable and productive industries, to curing disease, and to enriching community life. An innovation system is about people: the knowledge, technology, infrastructure and cultures they have created or adopted, who they work with, and what new ideas they are experimenting with.
Australia therefore needs an effective and resilient innovation system if we are to improve our way of life. A resilient and effective innovation system is one where the conditions are right for innovation and entrepreneurship. It is where people have the motivation, resources, creativity and timing to absorb, generate and apply new ideas that have value. Together, we must continue to build this capability into the innovation system.
With this goal in mind the Australian Government released Powering Ideas: An Innovation Agenda for the 21st Century, in May 2009. Powering Ideas outlined plans to revitalise our innovation system and make Australia more productive over the next decade. It included seven national innovation priorities and targets. The Government promised to produce an annual report on innovation to keep track of the innovation system and measure progress against these priorities and targets. This 2011 edition is the second of these reports.
It describes and reports on aspects of the innovation system, with particular focus on the themes within Powering Ideas of skills and research capacity, business innovation, links and collaboration and public sector innovation. The 2011 report also touches on the importance of vocational education and training, entrepreneurship and social innovation.
The Australian Government recognises the vital importance of Australia’s innovation system, which is why continued investments in innovation are a feature of this year’s Budget, despite difficult economic times.
This report shows considerable progress on the Australian Government’s commitments, but there is still more that needs to be done.
Senator Kim CarrMinister for Innovation, Industry, Science and Research

Australian Innovation System
Report 2
011
iv
CONTENTS
Further Information ii
Acknowledgements ii
Foreword iii
Contents iv
Tables, Charts, Figures and Features vi
Executive Summary 1
The performance of the Australian Innovation System 1
Research capacity and skill base 2
Business innovation 3
Links and collaboration 3
Social and Public Sector Innovation 4
Emerging opportunities and challenges 5
Innovation system performance indicators 5
Introduction 6
The objective and structure of this report 6
What is innovation? 7
Why should we innovate? 8
OECD Green Growth Strategy: A new driver of innovation 10
Chapter 1: The performance of the Australian Innovation System 11
What is an innovation system and what does it do? 11
Assessing the performance of the innovation system 16
Chapter 2: Research capacity and skill base 30
Research capacity 30
Skill base 33
Government initiatives that build research capacity and skills base 40
Case studies 47

v
Contents
Chapter 3: Business innovation 52
Innovation is the means to deliver profit, productivity and other benefits to business 52
Innovation activities 57
Business environment 63
Government initiatives that foster business innovation 68
Case studies 75
Chapter 4: Links and collaboration 80
Innovation involves everyone 80
Knowledge exchange 82
Global integration 88
Government initiatives that enhance networking and collaboration 90
Case studies 97
Chapter 5: Public Sector and Social Innovation 102
Public sector innovation 103
Government public sector innovation initiatives and case studies 106
Social innovation in Australia 110
Government initiatives that support social innovation and entrepreneurship 115
Social Innovation Case studies 117
Chapter 6: Emerging opportunities and challenges 122
Introduction 122
Green growth: A new driver of innovation 122
Platform technologies in the Australian Innovation System 124
Global Engagement and the Australian Innovation System – collaboration or competition 130
Case Studies 134
Abbreviations 140
Appendix 1: Science, Research and Innovation Budget tables 143

Australian Innovation System
Report 2
011
vi
TABLES, CHARTS, FIGURES AND FEATURES
TABLES
Table 1.1: Australia’s performance in innovation outcomes against other OECD countries 25Table 1.2: Sectoral expenditure on GDP in current prices, 2009–10 28Table 1.3: Selected Industries, contributions to GVA, employment, exports, innovation and R&D 29Table 2.1: Australia’s performance in research capacity against other OECD countries 31Table 2.2: Australia’s skill base compared to other OECD countries 34Table 2.3: Full-year training equivalents by subject result, 2005–09 38Table 3.1: Australia’s performance in innovative activities against other OECD countries 57Table 3.2: Entrepreneurship framework conditions 62Table 3.3: Entrepreneurship performance 62Table 3.4: Business framework conditions for demand, competition and access to finance and other
incentives to innovate 64Table 3.5: Australia’s performance in intellectual property against other OECD countries 68Table 4.1: Australia’s performance in knowledge exchange against other OECD countries 84Table 4.2: Australia’s performance in global integration against other OECD countries 88
CHARTS
Chart 1: Types of expenditure for innovation purposes in Australian businesses, 2008-09 7Chart 2: Breakdown of contributions to Australia’s labour productivity growth, market sector
(percent per year), 1994–95 to 2005–06 9Chart 1.1: Expenditure on research and development by socio-economic objective and by sector, 2008–09 14Chart 1.2: Science, research and innovation expenditures by the Australian Government,
by category, 2009–10 15Chart 1.3: National innovation system input indicators (grouped by activity and OECD ranking). The figure
compares Australia with the top 5 OECD countries for each indicator (normalised to 100%) 17Chart 1.4: Investmenst in physical capital and intangibles as a proportion of gross domestic
product, 2006 18Chart 1.5: Gross expenditure on research and development, 1998–99 to 2008–09 19Chart 1.6: Major flows of funding for research and development in Australia, 2008–09 20Chart 1.7: National innovation system output indicators (innovation creation and diffusion
i.e. the health of the system). The figure compares Australia with the top 5 OECD countries for each indicator (normalised to average of top 5 OECD countries = 100) 21
Chart 1.8: Proportion of different types of innovators, by firm size, 2008–09 22Chart 1.9: Comparison of innovation modes across 17 OECD countries 23Chart 1.10: National innovation system outcome indicators (identification of opportunities,
innovation creation and diffusion). The figure compares Australia with the average of the top 5 OECD countries for each indicator (normalised to 100) 24
Chart 1.11: Proportion of innovating businesses by innovation type and degree of novelty, 2006–07 and 2008–09 26
Chart 1.12: Top 25 export goods in which Australia shows a strong revealed comparative advantage (US$ Billion) 27
Chart 2.1: Relative impacts of Australian scientific publication – by research field, 2005–09 32Chart 2.2: Educational attainment of the Australian population aged 25 to 64 years, 1997 to 2008 33

vii
Tables, charts, figures and features
Chart 2.3: Number of students completing higher degrees by research, 1998 to 2009 35Chart 2.4: Australian sources of labour for innovation in innovation-active business, 2008–09 36Chart 2.5: Skill shortages or deficiencies in undertaking core business activities in Australia,
by innovation status, 2008–09 37Chart 2.6: Number of student enrolments in Vocational Education and Training, 2000–2009 38Chart 3.1: Drivers of innovation in innovation-active Australian businesses, 2008–09 53Chart 3.2: Increases in business performance from the previous year, by innovation status, 2008–09 54Chart 3.3: Geographic markets in which businesses sold goods or services, by innovation status, 2008–09 54Chart 3.4: Summary of innovative activity in Australian business, by status, 2009–10 55Chart 3.5: Barriers to innovation for innovation-active Australian businesses, 2008–09 56Chart 3.6: Innovative activities in Australian business, 2009–10 58Chart 3.7: Australian businesses which introduced or implemented any new or significantly improved
innovation, by type, by selected industry, 2008–09 58Chart 3.8 (a) Percentage of innovating businesses by industry sector (vertical axis), by percentage
of gross value added (size of the bubble), 2009–10. (b) Percentage of innovating businesses by industry sector (vertical axis), by percentage of employment (size of the bubble), 2006 59
Chart 3.9: Contribution to business expenditure on research and development growth in key industry sectors by size of firm between 1992–93 and 2008–09 60
Chart 3.10: Venture capital and late expansion investments as a percentage of gross domestic product, 2008 66
Chart 3.11: Venture Capital New and Follow-on Investment, 2005-06 to 2009–10 66Chart 3.12: Australian business intellectual property protection methods used by innovation status,
2008–09 67Chart 4.1: Sources of ideas or information for innovation-active Australian firms, 2008–09 81Chart 4.2: Main source of income for innovation-active businesses, by employment size, 2008–09 82Chart 4.3: Main supplier of goods or services for innovation-active businesses, by employment size,
2008–09 83Chart 4.4: Collaborative arrangements, by innovation status and by employment size, 2008–09 85Chart 4.5: Collaboration by innovation-active businesses within Australia, by type of organisation
collaborated with, 2008–09 86Chart 4.6: Firms with national/international collaboration on innovation, 2004–06 (As a percentage of
innovative firms) 87Chart 4.7: Highly cited (top 1%) scientific articles by type of collaboration, by country, 2006–08 89Chart 5.1: Government research and development by socio-economic objective, 2008–09
Total expenditure = $3.4 billion 104Chart 5.2: Australian Public Service employee responses to the statement ‘I am always looking
for better ways to do things’, 2008–2010 104Chart 5.3: Australian Public Service employee responses to the statement ‘My current agency
encourages innovation and the development of new ideas’, 2008–2010 105Chart 5.4: Australian Public Service employee perceptions of barriers to innovation in their
workplace, 2010 105Chart 5.5: Australia’s total expenditure on research and development towards social outcomes,
1992–93 to 2008–09 111Chart 5.6: Private Non Profit research and development (PNPRD) intensity (expenditure as a
percentage of gross domestic product), by country 111Chart 5.7: Market-facing and non market-facing non-profit institution income (NPI), by type, 2006–07 112Chart 5.8: Main mission-based functions of Australian social enterprises 114Chart 5.9: Types of innovation undertaken by Australian social enterprises 114Chart 6.1: Australian business use of information technology by innovation status, 2008–09 129Chart 6.2: Annual growth rate of gross expenditure in research and development by country, 2000–2008 131Chart 6.3: Gross expenditure in research and development (GERD) and gross domestic product
(indicated by size of the bubble) in selected countries, 2008 132
Australian Innovation System
Report 2
011
viii
FIGURES
Figure 1.1: A conceptual model of an innovation system 12Figure 2.1: A map of submitted government initiatives that build Australia’s research capacity
and skills base 41Figure 3.1: A map of submitted government initiatives that support business innovation 69Figure 4.1: A map of submitted government initiatives that support networking and collaboration 91Figure 5.1: Landgate idea review process 109Figure 5.2: Mechanisms for implementing social innovations 113Figure 6.1: Regulation of nanomaterials 125
FEATURES
Feature 1: Measuring the impact of innovation on productivity growth 9Feature 2: The Australian macroeconomic environment 28Feature 3: The role of Vocational Education and Training in innovation 37Feature 4: Australian Entrepreneurship: The business of doing something different 61Feature 5: Social entrepreneurship and innovation 112

1
Executive Summ
ary
EXECUTIVE SUMMARY
This is the second of a series of annual reports on the performance of Australia’s National Innovation System. It provides new innovation metrics, analysis and where possible updates of baseline indicators established in the Australian Innovation System 2010 Report. Most of these indicators benchmark Australia’s innovation performance against other Organisation for Economic Co-operation and Development (OECD) countries and track progress against the Australian Government’s priorities and targets.
The Australian Government’s ten year innovation agenda, Powering Ideas, promotes a systems approach to innovation policy and uses the term ‘national innovation system’. This acknowledges that innovation is about people: the knowledge, technology, infrastructure, rules and cultures they have created or learned; who they work with; and what new ideas they are experimenting with.
This report defines the Australian Innovation System as an open network of organisations interacting with each other and operating within framework conditions1 that regulate their activities and interactions. The three components of the innovation system: networks, innovation activities; and framework conditions; collectively function to produce and diffuse innovations that have economic, social and/or environmental value.
Innovation is highly contextual, evolves out of varying mixes of activities, and is influenced by framework conditions that are not globally uniform. This makes it difficult to define an ‘optimal’ or ‘ideal’ innovation system. Instead, system performance must be assessed by making comparisons with other national innovation systems and setting and testing national targets through evidence-based policy analysis and experimentation.
Data on Australia’s innovation performance since Powering Ideas (2009) and the Australian Government’s major investments on science, research and innovation – $9.4 billion in financial year (FY) 2011–12 – is still largely unavailable, particularly those indicators with international comparisons. This is due to the lead times required for funding and other initiatives to influence innovation performance and the time required to gather and compile relevant corporate data. For example, the effects of the global financial crisis are just starting to be seen in Australian data.
The performance of the Australian Innovation System
This report suggests a number of broad features of the Australian Innovation System.
It takes a wider look at the framework conditions for innovation and entrepreneurship than the previous report to now include access to finance, demand for innovation, market competition and regulatory barriers to entrepreneurship. With the exception of collaboration, the data shows Australia’s framework conditions rate relatively highly compared to other OECD countries, demonstrating a high capacity of the innovation system to produce and diffuse innovations.
Recent evidence shows that investment in intangible capital (innovation-related activities such as skills development, design and organisational improvements) and multifactor productivity (spill-over impacts of these intangible investments) together accounted for 62% of Australia’s productivity growth between 1994–95 and 2004–05. However, a comparison of Australia’s investment in intangibles with that of other countries shows that we are more than twice as likely to adopt existing technology embodied in physical machinery and equipment, than we are to invest in our own intangible innovation capabilities. Based on this measure, OECD countries such as the United States, Sweden, UK and Finland show the reverse trend, suggesting that either we are not as advanced along our transition to a ‘knowledge-based’ economy, or that we are taking an atypical pathway. However, average annual growth in intangible investment in Australia has been higher than tangibles investments since 1974–75.
Analysis of the ways in which Australian firms innovate confirms that modification of innovations that have already been introduced to Australia is by far the most common approach. The data also shows a significant difference between small and large firms. Large Australian firms are more than twice as likely to modify and introduce to Australia innovations already developed internationally. This suggests the important role of large firms as conduits for overseas innovations reaching the domestic market.
1 Framework conditions comprise a set of established practices, rules or laws that regulate the interactions between people, e.g. Intellectual Property regulations or culture of entrepreneurship.

Australian Innovation System
Report 2
011
2
Relatively high rates of entrepreneurship suggest that Australian firms have an excellent capacity for identifying opportunities or problems where new solutions are required. Australia has good rates of knowledge diffusion (represented by soft technology adoption/procurement indicators) and above average rates of industrial design and trademark registrations.
Australia has extremely low proportions of ‘new to the market international innovations’ even for large businesses. Where data is available, most other OECD countries appear much more likely to develop innovations that are new to international markets than Australia. Our strengths appear to lie in consolidating existing global comparative advantages rather than creating new export markets. Given that our research capacity is moderate to high by international standards this could suggest there is a problem with research-industry partnering, or a lack of complementary markets in Australia for our research output. Our generally low rate of patenting and low rate of collaboration between industry and research sectors compared to the OECD supports this observation.
Irrespective of the mix of innovation activities in Australia, the impact of the Australian Innovation System on our economy and society is apparent. Our current level of human development is ranked 2nd in the OECD, our global competitiveness and our gross domestic product (GDP) per capita is high. Environmental performance is below the OECD average, suggesting a need to focus on how well this is being addressed in the innovation system.
The following sections describe the findings of chapters of the report that centre around the Australian Government’s national innovation priorities and targets.
Research capacity and skill base
In Powering Ideas the Australian Government set out its priorities for the nation’s research capacity and skill base along with targets that it aims to achieve through its ten year innovation agenda.
Priority 1: Public research funding supports high-quality research that addresses national challenges and opens up new opportunities. Target: The Australian Government’s ambition is to increase the number of research groups performing at world class levels, as measured by international performance benchmarks.
Priority 2: Australia has a strong base of skilled researchers to support the national research effort in both the public and private sectors. Target: The Australian Government’s objective is to significantly increase the number of students completing higher degrees by research over the next decade.
Australia’s research capacity and skills base are moderate to good compared with other OECD nations, particularly in our tertiary education standards. This suggests a moderate to good capacity to be creative, find solutions, and generate new ideas.
Excellence in Research for Australia (ERA) evaluates the quality of research undertaken in Australian higher education institutions. Outcomes for the ERA 2010 evaluations show that of the 1738 four-digit units of evaluation assessed, approximately 68% performed at world standard; of the 697 two-digit units of evaluation assessed, approximately 59% performed at world standard. There were 19 out of 131 fields of research at the four-digit level in which Australia performed ‘well above world standard’. That is, four or more Australian universities had the highest rating for research excellence in those fields.
Australia produced 3.2% of the world’s total research publications in 2009, a small increase on the previous baseline year, ranking 9th among OECD countries. Research is dominated globally by the United States of America (USA), which accounts for 28.6% of world publications. An indicator of the impact of Australia’s research publications that is used as a proxy for Priority 1 (and the related target) is the number of research fields, in which Australia has a higher citation rate than the world average. Australia achieved this in 18 of 22 research fields over 2005-09, noting that three other fields were at, or close to, the world average. This indicator is suggestive of a country’s relative strength in international research.
In Powering Ideas, the government set a target to significantly increase the number of students completing higher degrees by research (HDR) over the next decade. According to development work undertaken for the government’s recently released Research Workforce Strategy 2, Australia faces research skills shortfalls into the future and is unlikely to remedy this through domestic sources alone. Encouragingly, the number of students completing HDR studies in Australia increased by 41% to 7,174 students in 2008 before declining slightly in 2009. Whilst this growth is mostly driven by the doubling of international students, we currently retain between 20 per cent and 50 per cent of international HDR graduates. We will need to maintain or increase the number of international students undertaking HDR studies in Australia out to at least 2020 in order to meet the expected demand for research skills.
2 Research Skills for an Innovative Future: A research workforce strategy to cover the decade to 2020 and beyond can be found here: http://www.innovation.gov.au/Research/ResearchWorkforceIssues/Documents/ResearchSkillsforanInnovativeFuture.pdf

3
Executive Summ
ary
In 2008–09, Australia’s gross expenditure on research and development (GERD) increased 10.9% to 2.2% of GDP. We are rapidly closing the gap with the rest of the OECD and have one of the highest annual GERD growth rates in the developed world. However, the gap between Australia’s GERD as a percentage of GDP and the average of the top five OECD countries remains at 41.4%.
Data on Australia’s skill base shows high rates of education investment and attainment. Australia appears to have a moderate to good proportion of researchers, technicians and professionals in the working population compared to other OECD countries. However, a lack of skilled people remains one of the highest barriers to business innovation in Australia, particularly in medium and large businesses. When we look at skill shortage data for innovation-active businesses across all firm sizes and sectors of the economy we see that trades, marketing and management skills are much more sought after than research or engineering skills. The data suggests an important role for vocational education and training in innovation and a need to look more closely at skills needed across different business sizes and sectors.
Business innovation
In Powering Ideas, the Australian Government set out its priorities for business research and development (R&D) and innovation along with targets that it aims to achieve through its ten year innovation agenda.
Priority 3: The innovation system fosters industries of the future, securing value from the commercialisation of Australian research and development.Target: The Australian Government aims to see a continuing increase in the number of businesses investing in R&D.
Priority 4: More effective dissemination of new technologies, processes, and ideas increases innovation across the economy, with a particular focus on small and medium-sized enterprises.Target: The Australian Government’s goal is to achieve a 25% increase in the proportion of businesses engaging in innovation over the next decade.
The data shows that innovative businesses make a vital contribution to Australia’s productivity and continued prosperity. Compared to businesses that don’t innovate, innovative Australian businesses are:
› Twice as likely to report increased productivity;
› 41% more likely to report increased profitability;
› Twice as likely to export; and
› Up to four times more likely to increase employment and social contributions.
Business conditions, such as demand, competition and access to finance compare particularly well with other OECD countries, although seed/start-up stages of venture capital investment is low. Australia’s framework conditions for entrepreneurship are considered one of the best in the world,3 enhancing our ability to undertake market experiments with new innovations. Business R&D has continued to increase, whereas venture capital investment has declined significantly during the period of the global financial crisis.
An indicator associated with the target ‘increase in the number of businesses investing in R&D’ is the number of business registered for the R&D Tax Concession. Businesses registered for the R&D Tax Concession increased 6.8% in 2008-09 over the baseline year of 2007–08.
The proportion of innovation-active business in Australia is the indicator used to measure and monitor the Government’s target of a 25% increase in the proportion of businesses engaging in innovation over the next decade. Since 2007–08 the proportion of innovation-active businesses in Australia has varied significantly, dropping to 39.8% in 2008–09 and then climbing back to 44.7% in 2009–10. There has therefore been a negligible change since the 2007–08 baseline year. This dip in measured innovation might be the result of impact and recovery from the global financial crisis, however, longer term trend data suggests a positive, low annual growth rate in the proportion of innovation-active firms (~0.7% per year).
Links and collaboration
In Powering Ideas, the Australian Government set out the following priorities and targets for collaboration:
Priority 5: The innovation system encourages a culture of collaboration within the research sector and between researchers and industry.Target: The Australian Government’s ambition is to double the level of collaboration between Australian businesses, universities and publicly-funded research agencies over the next decade.
3 World Bank Group & International Finance Corporation (2011) Doing Business 2011 report, World Bank Group, Washington D.C.

Australian Innovation System
Report 2
011
4
Priority 6: Australian researchers and businesses are involved in more international collaborations on research and development.Target: The Australian Government has adopted the long-term aim of increasing international collaboration in research by Australian universities.
The data on how firms innovate, reinforces the importance of bulding a firm’s capacity to absorb ideas from elsewhere. Innovating firms source ideas from other businesses, and collaborate primarily with other businesses. However, based on available internationally comparable indicators, networking and collaboration remains the most significant flaw in the Australian Innovation System particularly large firm collaboration, international collaboration and business-to-research collaboration.
Australia ranks poorly on the total proportion of firms collaborating on innovation (18th). Interestingly this masks the fact that Australian small and medium enterprise (SME) collaboration, although having lower absolute percentages than large firms, is ranked relatively highly in the OECD (ranked 5th). Large firms are ranked relatively lowly (23rd) in the OECD for collaboration on innovation.
Two indicators are used to measure the progress of business-to-research collaboration in relation to the Australian Government’s target of doubling collaboration between business, universities and research agencies over the next decade. These are the proportion of innovation-active businesses collaborating with universities, and the proportion of innovation-active businesses collaborating with publicly-funded research agencies. During 2008–09 the two indicators moved in opposite directions. The proportion of innovation-active businesses collaborating with universities increased to 2.4%, a rise of 0.8 percentage points since 2006–07, but collaboration with publicly funded research agencies fell by nearly 2.8 percentage points to 4.4%.
Research commercialisation metrics measure the level of interaction between research institutions and other organisations in the innovation system. The data shows that commercialisation inputs such as patenting continues to grow but activity was impacted by the global financial crisis. In 2009, Publicly Funded Research Organisations (PFROs) reported gross incomes totalling $297 million from licenses, options and assignments, and $1.2 billion from contracts and consultancies with end-users. In 2009, PFROs recorded equity holdings in 176 start-up companies. This equates to a slight decrease in the number of start-ups and gross income from contracts since the last recorded period (2007–08).
Australia ranks well on domestic collaboration (ranked 6th in the OECD). However, Australia has a relatively low rate of international collaborate on R&D and innovation. The proportion of Australian businesses that collaborate internationally ranks 20th out of 23 OECD countries at 3.6%. GERD financed abroad has decreased since the last reporting period (2006) by 28.7%. This may be a reflection of the global financial crisis, especially for indicators that measure overseas investment in Australian R&D, as other countries have been affected more severely than Australia by a shortage of available finance.
Social and Public Sector Innovation
In Powering Ideas, the Australian Government set out its final national innovation priority as:
Priority 7: The public and community sectors work with others in the innovation system to improve policy development and service delivery.
Using R&D expenditures as an imperfect proxy, Governments across Australia are increasing investments in innovation. R&D expenditure by government agencies has grown almost two-fold since 1992–93 to total $3.4 billion in 2008–09.
In terms of measuring innovation in the public sector, data is scarce. More comprehensive indicators of public sector innovation are currently being developed by the Department of Innovation, Industry, Science and Research (DIISR). The Australian Public Service Commission’s (APSC) State of the Service reports highlight public sector agencies’ commitment to innovation.
More than half of APS agencies in 2009–10 have (43%), or are developing (13%), strategies to identify and reward innovation. The majority of APS employees report a willingness to innovate but are much less likely to agree that the agencies they work for encourage innovation. Fifty four per cent of employees surveyed reported barriers to innovation in their workplace. The greatest barriers were considered to be financial/budget pressures or administrative/regulatory in nature. The data suggests a high potential for innovation in the APS.
As with public sector innovation, data is limited for social innovation. The data available suggests that members of the community sector and social enterprises are highly innovative (rates up to 75%) with innovation being their number two objective.4 Investment in social innovation (using private non-profit R&D as an imperfect proxy) shows that Australia is in the top five of OECD countries and that this is dominated by investment in health outcomes for society.
4 Finding Australia’s Social Enterprise Sector report, QUT and Social Traders, July 2010.

5
Executive Summ
ary
Emerging opportunities and challenges
By 2020, the Australian Government wants a national economy in which businesses of all sizes in all sectors embrace innovation as the pathway to greater competitiveness, supported by policies that minimise barriers and maximise opportunities for commercialisation of new ideas. Chapter 6 looks at some emerging challenges and opportunities for the national innovation system that will influence our ability to meet this goal.
There are opportunities to transition our economy to be cleaner and more resource efficient through eco-innovation. The emergence of enabling platform technologies (specifically biotechnology, nanotechnology and smart infrastructure) has the ability to underpin an increasing number of breakthrough innovations in products, services, and processes. These technologies have the potential to transform the economy and achieve long term productivity enhancements to assist Australia face the impact of an ageing population, climate change and other pressures.
The need for increased global engagement on innovation, particularly with China and India as major emerging trading and knowledge partners in our region, is discussed within the context of opportunities and challenges for Australian innovators.
Innovation system performance indicators
The following table shows the indicators that reflect progress against the Australian Government’s Powering Ideas innovation targets. This data set, for the most part, predates the Australian Government’s Powering Ideas agenda and the investments that came with it. The combination of the lag effect of the Powering Ideas innovation stimulus and the potential immediate impact of the global financial crisis combine to give a mixed picture of progress against the Australian Government’s innovation targets. Comparing this year’s report data with the previous report data hides longer term trends and magnifies small variations that emerge from year to year. For example the percentage of innovating firms in Australia dropped from 45% to 40% and then increased to 45% again, since the last report.
Target Indicator Latest Figure
Latest Reference Period
% change from baseline
Target 1: Increase the number of research groups performing at world class levels, as measured by international performance benchmarks
Number of fields with higher than world average citation rate
18 out of 22 2005–09 No change
Target 2: Increase the number of students completing higher degrees by research over the next decade
Number of students completing higher degree by research in Australia
7,091 2009 � 1.2%
Target 3: Increase in the number of businesses investing in R&D
Number of businesses registered for the R&D Tax Concession
8,440 2008–09 � 6.8%(r)
Target 4: 25% increase in the proportion of businesses engaging in innovation over the next decade
Proportion of innovation-active businesses in Australia
44.7% 2009–10 � 0.4%
Target 5: Double the level of collaboration between Australian businesses, universities and publicly-funded research agencies over the next decade
Proportion of innovation-active businesses collaborating with publicly-funded research agencies
4.4% 2008–09 � 38.9%
Proportion of innovation-active businesses collaborating with universities
2.4% 2008–09 � 50%
Target 6: Increasing international collaboration in research by Australian universities
Number of formal agreements on academic/research collaboration between Australian universities and overseas institutions
3,493 2009 No new data
Share of HERD financed from abroad 2.06% 2008 � 28.7%
Note: (r) baseline has been revised according to the latest available data.

Australian Innovation System
Report 2
011
6
INTRODUCTION
The objective and structure of this report
In May 2009 the Australian Government set out a ten year agenda for strengthening innovation and increasing productivity in Powering Ideas: An innovation agenda for the 21st century. In this statement, the Australian Government committed to producing an annual report on the Australian Innovation System. This report is the second of this series.
Using the most recent available data, this report describes the performance of the Australian Innovation System (Chapter 1). It outlines the research capacity and skills base (Chapter 2), business framework conditions, innovation and entrepreneurship (Chapter 3), and the networks, collaboration and knowledge exchange between individuals and organisations (Chapter 4) in the Australian Innovation System. It then looks at social and public sector innovation, including evidence of social entrepreneurship (Chapter 5), concluding with a discussion of the opportunities or challenges facing the Australian Innovation System (Chapter 6).
The Australian Innovation System’s ‘performance’ is measured against the Australian Government’s seven National Innovation Priorities identified in Powering Ideas and the performance of other national innovation systems around the world. In doing so, the report tries to show the direction our innovation system is taking and whether or not we are achieving our ambitions for a prosperous and sustainable future.
The report also highlights recent achievements and actions by individuals and organisations in the national innovation system. It describes new or significantly improved policies and programs by Commonwealth, State and Territory governments, plus new case studies from businesses, research organisations and others. A more comprehensive itemisation of the Australian Government’s research and innovation policies is included in Appendix 1 where the 2011–12 Science, Research and Innovation Budget tables are reproduced. A significant number of Commonwealth, State and Territory innovation initiatives are not detailed in this report. The reader is encouraged to visit the www.innovation.gov.au, www.business.gov.au, www.arc.gov.au or www.grantslink.gov.au websites for a more complete picture of the governance and government support for the national innovation system. Over 200 case studies were submitted for this report with only a small selection able to be included. The reader is encouraged to view the Compendium of case studies for the Australian Innovation Report 2011, available online.5
Data on Australia’s innovation performance since Powering Ideas was released is for the most part still unavailable. The data available mostly predates the Australian Government’s major investments on science and innovation – $9.4 billion in 2011–12 representing a 43% increase since 2007–08 – and recent initiatives by other participants in the national innovation system.
Concepts, Definitions and Methodology
This report outlines a systems approach to measuring innovation and looks at available data that describes the complex, systemic nature of innovation in Australia. Where possible, this report’s concepts, definitions and methodology are based on the Australian Government’s Innovation Metrics Framework Report.6 As part of a systems approach to measuring innovation, international comparisons for each indicator are presented. Unlike Australia, many other Organisation for Economic Co-operation and Development (OECD) countries’ national survey instruments for measuring business innovation are not mandatory leading to a variable coverage and low response rates.7 This may have the effect of skewing other country data towards the most innovative firms that are motivated to report their innovative activities.
A number of indicators presented in the 2010 report are unable to be updated due to a lack of new international data. Where new data exists, the report measures a percentage change from the ‘baseline’ year, which is taken as the indicator provided in the 2010 report. A number of new indicators have also been added to this report to broaden our view of the Australian Innovation System. Where possible these new indicators are presented with a baseline (the previous year or reporting period).
Most Australian innovation data is compiled according to fiscal years, while OECD data is compiled according to calendar years. In this report, the performance of the Australian innovation system in a fiscal or calendar year is compared with the previous corresponding period, unless stated otherwise. Baseline reference years for innovation indicators also vary.
5 www.innovation.gov.au/AISReport6 Australian Government (2010) Innovation Metrics Framework Report, Department of Innovation, Industry, Science and Research (DIISR) Canberra 7 OECD (2009) Innovation in Firms: A Microeconomic Perspective, OECD, Paris.

Introduction
7
It also has not been possible to adjust for industrial structure for every indicator and every sector. Further analysis is required to consider how differences in innovation between Australia and other OECD countries might be explained by differences in industrial structure.
What is innovation?
Innovation has many dimensions that make defining it a complex issue.8 A microbiologist’s perspective on innovation might be different from that of a social entrepreneur. What a business that creates new technology thinks about innovation may be different to the attitude of a firm that adopts existing technology. Innovation can be radical and disruptive, but more often it is incremental. Innovation can be based heavily on technological development or not at all. Individual innovations need not always be immediately successful to have impact. Trial and error – learning what not to do – is an important part of getting it right in the long run. Innovation is about market experimentation, the implication being that failure comes with the territory. Yet innovations can be so successful that as they create new markets, or revolutionise existing markets, they can in turn sweep away entire economic sectors or transform communities in their wake. This is what makes innovation so important to understand and to measure.
For the purposes of this report we adopt a definition of innovation that is recognised by OECD countries around the world and was developed to build an internationally consistent way of measuring innovation. According to the Oslo Manual:
Innovation is the implementation of a new or significantly improved product (good or service), process, new marketing method or a new organisational method in business practices, workplace organisation or external relations.9
So innovation is more than just the generation of novel ideas or the dissemination of knowledge, it is about making a change or doing something in a new way. This second element of innovation, implementation, is crucial as only those novel ideas that are implemented can have an impact on society. It is this implementation element that separates knowledge and invention from innovation.
The OECD definition also recognises that innovation is more than expenditure on research and development (R&D) and patenting new technology. Innovation active10 firms in Australia are more likely to invest in purchasing new equipment, training and marketing than investment in R&D or acquiring intellectual property (IP; Chart 1). Innovation does not always require spending money either. Almost one third of innovation-active businesses had no expenditure on activities related to innovation in 2008–09.
Chart 1: Types of expenditure for innovation purposes in Australian businesses, 2008-09
Source: Australian Bureau of Statistics (ABS) (2010) Innovation in Australian Business, 2008–09, cat. No. 8158.0.
8 Australian Government (2009), Powering Ideas: An Innovation Agenda for the 21st Century, Commonwealth of Australia, Canberra; and Cutler T (2008) Venturous Australia: Building Strength in Innovation, Cutler & Company, Melbourne.
9 OECD (2005) Oslo Manual Guidelines for collecting and interpreting innovation data, 3rd edition, OECD and European Commission, Paris.10 ‘Innovation active’ businesses are those that undertook any innovative activity irrespective of whether that innovation has been introduced, is not yet
completed or has been abandoned. ABS Innovation in Australian Business, 2008–09, cat. no. 8158.0
45.4
30.0
27.7
3.9
9.8
13.7
9.5
12.0
10.6
10.1
14.9
28.9
0 10 20 30 40 50
Acquisition of machinery, equipment or technology
Training
Marketing activities undertaken to introduce new goodsand/or services to the market
...acquired from other businesses
...undertaken by the business
Design, planning or testing
Acquisition of licences, rights, patents or other intellectual property
...goods and/or services
...operational processes
...organisational/managerial processes
...marketing methods
No expenditure on activities related to innovation
Percentage of respondents
Research and experimentaldevelopment for purposes ofintroducting innovation that was...
Other activities relatedto the development orintroduction of new orsignificantly improved…

Australian Innovation System
Report 2
011
8
Why should we innovate?
Innovation delivers economic, social and environmental benefits to society
Innovation is a fundamental tool used by the private, public and community sectors to improve the competitiveness and productivity of Australian industries and thus enhance social welfare and standards of living in many different ways – such as job creation, health improvements and eliminating pollution from our environment.11 High capacity for innovation allows us to experiment and adapt to change, creating a more resilient economy and society. A resilient innovation system coordinates and shapes itself to address immediate or future challenges such as those outlined below.
Innovation’s role in sustaining productivity growth
One measure of a nation’s living standards is the per capita share of the nation’s total output (gross domestic product, GDP). GDP per capita can be increased by increasing the number of hours we work (labour utilisation) or by improving the efficiency with which we work (labour productivity)12. In the long term, contributions through increased work hours will be limited by an ageing population and by the maximum number of hours people are willing to work. Therefore, sustained growth in living standards will have to come mainly from labour productivity increases.13 Labour productivity is of critical importance because of its association with the standard of living.
Productivity is about using our finite resources as efficiently as possible and maximising our efforts in the pursuit of prosperity. There are a number of avenues to increase productivity but innovation is the most significant factor. Increases in labour productivity14 can occur through increases in the capital stock to labour ratio (capital deepening), economies of scale, increases in labour quality, intangible capital investment (skills, R&D, new technology or business models etc.), framework conditions and other factors. Efforts to measure the inputs to labour productivity growth show that investments in innovation, and their spillover benefits including multi-factor productivity (MFP),15 are the key driver of sustainable productivity, economic growth and prosperity (Feature 1).16
Macroeconomic conditions, the regulatory environment and microeconomic reforms can affect short-run and long-run productivity changes through their impact on firm investment and other resource allocation decisions (Features 1 & 2). The business transformations and new capabilities behind Australia’s productivity gains in the 1990s came from the use of enabling technologies like information and communication technology, improved management competencies, and regulatory reforms. It was not generally the result of greater capital investment to replace labour.17 While appropriate capital investments in the past are important for raising labour productivity in the future, growth through physical capital accumulation alone cannot be sustained in the long-run if it is the result of a temporary gain based on forgone consumption.18 Physical capital may eventually encounter diminishing returns.
Innovation can increase productivity through the creation of higher value products, more efficient production processes, more effective workplace organisation and opening up new markets. Innovative entrepreneurs and workplaces boost productivity by transforming their businesses’ capabilities, problem-solving, collaborating with customers, suppliers and competitors, adapting existing technologies and processes to new uses, and creating solutions to meet customers’ needs.19 This is why innovation is considered the only significant avenue for sustaining productivity growth, and therefore our standard of living into the future.
11 OECD (2010) The OECD Innovation Strategy: Getting a head start on tomorrow OECD Paris; OECD (2011) Towards Green Growth OECD Paris; United Nations Environment Programme (2011) Towards a Green Economy: Pathways to Sustainable Development and Poverty Eradication United Nations, New York
12 GDP/capita = hours/capita (labour utilisation) x GDP/hour (productivity). 13 The Treasury Department (2010) The Intergenerational Report 2010 Australia to 2050: Future challenges Commonwealth of Australia Canberra14 Labour is not the only input to production, there are other key measures of input productivity such as capital productivity. But in this instance, discussion is
focussed on labour productivity because of its association with living standards. 15 Also known as total-factor productivity (TFP).16 Robertson PE (2009) Productivity, innovation & economic growth, In, Innovation Metrics Framework, Department of Innovation, Industry, Science and
Research Canberra Australia17 Hughes A & Grinevich V (2007) The contribution of services and other sectors to Australian productivity growth, 1980-2004, A Report Prepared for the
Australian Business Foundation Sydney Australia18 Robertson PE (2009) Productivity, innovation & economic growth, In, Innovation Metrics Framework, Department of Innovation, Industry, Science and
Research Canberra Australia19 Australian Business Foundation (2010) Innovation and Productivity Available from http://abfoundation.com.au/research_knowledge/latest_thinking/4
[Accessed 12 May 2011]

Introduction
9
FEATURE 1: MEASURING THE IMPACT OF INNOVATION ON PRODUCTIVITY GROWTH
Economic theory has long held that innovation, particularly technological change, is the most important contributory factor driving long run economic growth.20 These longstanding assumptions have been validated by recent empirical research by the OECD.21
Innovation drives productivity growth by enabling inputs such as capital and labour to be combined in new ways to produce higher value added goods, services and increased efficiencies. Experimental work being conducted across the OECD is applying a new method22 to measure the contribution of innovation to growth in productivity (Chart 2). Investments in so-called intangible capital (skills, R&D, design, organisational improvements etc.), what we know to be innovation-related activities, are now being accounted for in calculations of productivity growth. Multifactor productivity (the component unaccounted for by labour quality and capital investments) can be attributed to better ways of doing things, including technological advances and improved processes23,24 (so-called knowledge spillover25 benefits to the economy). The data suggests that innovation (both the initial intangible capital investments and their spillover benefits) amounts to at least 62% of Australia’s productivity growth in the long term (Chart 2). If we also consider that much of our physical capital investment embodies adoption of new technology and other improvements26, the proportion of labour productivity growth attributed to innovation is even larger (up to 90%).
Chart 2: Breakdown of contributions to Australia’s labour productivity growth, market sector (percent per year), 1994–95 to 2005–06
Source: Barnes P & McClure A (2009) Investments in Intangible Assets and Australia’s Productivity Growth, Productivity Commission Staff Working Paper, Canberra. Note that components may not add due to rounding.
20 Smith K & West J (2007) Innovation policy, productivity, and the reform agenda in Australia: A framework for analysis Council of Australian Governments Report In its analysis of issues surrounding enhancing Australia’s productivity, the Productivity Commission concluded that innovation and its diffusion are the core drivers of productivity growth. (2007–08 Annual Report Productivity Commission Canberra). Solow R (1957) Technical change and the aggregate production function Review of Economics and Statistics 39(3) 312-320
21 OECD (2010) The OECD Innovation Strategy: Getting a head start on tomorrow. OECD, Paris22 Corrado C, Hulten C & Sichel D (2006) Intangible Capital and Economic Growth, NBER Working Paper no. 11948, National Bureau of Economic Research
Cambridge, Massachusetts23 It is important to note that there are data and methodological challenges in the MFP measurement and the computation of the relationship between
innovation and MFP. MFP has methodological difficulties in taking into account quantitatively important economic issues such the increasing resources depletion, quality improvement and mitigation of climate change.
24 National Endowment for Science, Technology and the Arts (NESTA) (2009) The Innovation Index: Measuring the UK’s investment in innovation and its effects NESTA London, UK.
25 A knowledge spillover is an exchange of ideas where the benefits of innovations developed by innovators are used by others that don’t invest in innovation themselves.
26 Arundel A & O’Brien K (2010) Innovation metrics for Australia, In, Innovation Metrics Framework Report, Department of Innovation, Industry, Science and Research, Canberra Australia
0.19
2.78
0.89
0.35
0.22
1.16
0.0 0.5 1.0 1.5 2.0 2.5 3.0
Labour quality
Physical capital investment
Percent per year
R&D, Design, Market research & Branding, Organisational
improvement, Firm-specifictraining and skills development
Software development, Mineralexploration and Artistic originals
Multifactor Productivity
Labourquality
Investment ininnovation
Physicalcapital
investmentMultifactorProductivity
Total
7%
42% 31%
20%

Australian Innovation System
Report 2
011
10
Innovation and social and environmental benefits
Stronger productivity growth is not the only social policy objective that can be served by innovation. The ability to address increasingly urgent issues such as climate change, health, food security and poverty depends on our capacity to innovate and on new forms of international collaboration. Global challenges require collective and innovation-driven responses.27
Attitudes of business leaders to innovation both nationally and across the world show that the majority (~95% of those surveyed in 2011) believe that innovation not only contributes to a more competitive national economy but will also unlock future social prosperity and environmental quality (75-90% of those surveyed in 2011).28 Social and environmental problems such as obesity and climate change are characterised by a high level of complexity and uncertainty, a pressing need for change, multiple connections and value-laden perspectives. Such ‘wicked problems’ exhibit classic system failure characteristics such as coordination problems, resistance to change and unintended consequences such as rebound effects.29 A systems approach to policy encourages engagement of diverse organisations in the policy development process, working across organisational boundaries, and a willingness to better understand behavioural and cultural change, particularly entrepreneurship. Embracing the complexity and systemic nature of innovation helps develop better whole-of-government or multi-disciplinary approaches to innovation, builds resilience in the innovation system and gets a better dividend from Australia’s investments in innovation. In this way innovation can be harnessed as a tool to address the most intractable social and environmental problems.
OECD Green Growth Strategy: A new driver of innovation
In June 2009, all OECD member countries signed a Declaration on Green Growth, recognising their ability to drive economic development while ‘addressing urgent challenges’ including climate change, environmental degradation and energy security. The Declaration tasked the OECD with developing a Green Growth Strategy, which was released at the OECD Ministerial Council Meeting on 25–26 May 2011.
Green growth means: ‘fostering economic growth and development while ensuring that natural assets continue to provide the resources and environmental services on which our well-being relies. It is also about fostering investment and innovation which will underpin sustained growth and give rise to new economic opportunities.’
It has the potential to secure future growth and build prosperity by promoting new markets and economic opportunities that also help us to manage ‘wicked problems’, such as climate change and unsustainable natural resource depletion.
Green growth represents a significant economic opportunity. Despite ongoing international uncertainty regarding emission reduction action, markets for green technologies, goods and services are growing rapidly. Countries will need to take advantage of these new opportunities to maintain their competitiveness as global consumer and business preferences shift towards more environmentally sustainable modes of production and consumption. Green growth is therefore, as much a part of the productivity and business agenda, as it is about promoting better environmental outcomes.
The Green Growth Strategy provides a framework for green growth that identifies three main areas for work:
1. Improving resource management and boosting productivity;2. Encouraging economic activity to take place where it is of the best advantage to society over the long
term; and3. Enabling new ways for business and the community to achieve these goals.
The Green Growth Strategy also examines specific tools and recommendations to help both OECD and non-OECD governments develop efficient policies for promoting the transition to a more sustainable growth path. Innovation is identified as being at the core of this process. As resource use continues to grow in the future, there will be a point at which outcomes that are simultaneously economically, environmentally and socially beneficial will be limited by the continued depletion of natural capital. Innovation, both through the development of radical new solutions and the spread of incremental improvements throughout the economy, will be the key to doing more with less, enabling continued growth beyond present limits. The OECD also identified infrastructure development and governance capacity as important enabling factors.
This introduction has outlined the structure and methodology of this report. The definition and broad importance of innovation to the economy, environment and society has also been described. The following chapter explores the role and performance of the Australian Innovation System in this context.
27 OECD (2010) The OECD Innovation Strategy: Getting a head start on tomorrow. OECD Paris28 GE Global Innovation Barometer 2011 Available from http://files.gereports.com/wp-content/uploads/2011/01/GIB-results.pdf [Accessed 12 May 2011] 29 Australian Public Service Commission (2007) Tackling wicked problems: A public policy perspective. APSC, Canberra.

Chapter 1: The perform
ance of the A
ustralian Innovation System
11
CHAPTER 1: The performance of the Australian Innovation System
What is an innovation system and what does it do?
The Australian Government’s innovation agenda, Powering Ideas30, promotes a systems approach to innovation policy. But what is an innovation system and how does it help us better understand and measure innovation?
An innovation system31 is an open network of organisations both interacting with each other and operating within framework conditions that regulate their activities and interactions. These three components of the innovation system: networks; innovation activities; and framework conditions, collectively function to produce and diffuse innovations that have, in aggregate, economic, social and/or environmental value (Figure 1.1).32
An innovation system is about people, the knowledge, technology, infrastructure and cultures they have created or learned, who they work with, and what new ideas they are experimenting with. Each sectoral, regional or national innovation system evolves its own set of laws, regulations and cultures. A systems approach to innovation therefore teaches us that no two innovation systems are identical.
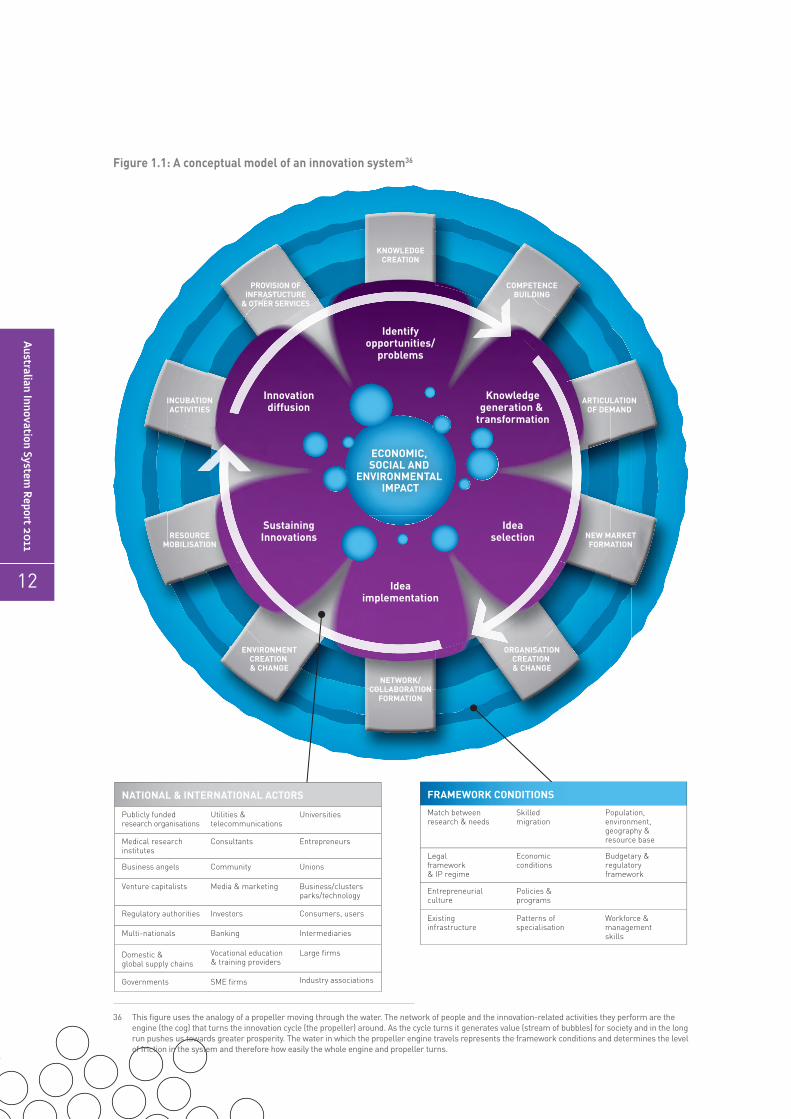
Figure 1.1 is an attempt to graphically represent the concept of a national innovation system. The cycle in the centre of the figure (the propeller) represents the concept of innovation and entrepreneurship33. Entrepreneurs and innovators (individuals and organisations) usually start by seeing an opportunity or problem to act upon. Knowledge gathering, transformation and/or creation follows in an attempt to find ideas that address their needs. A range of options are usually generated through this process, several of which are trialled internally and in the market. The ideas underpinning the innovations, if not the business models and technologies themselves, are scaled-up and spread through society to generate economic, social and environmental impacts in Australia and the world. The successful innovations inspire others, or generate problems for others, with the result that they are copied or countered by other innovations. The creative-destructive cycle continues.
This innovation cycle represents the accumulation and communication of knowledge34 or technologies and other innovations that embody knowledge. The ‘engine’ or ‘cog’ that drives this cycle is made up of many ‘component part’ activities undertaken by an open network of people (individuals and organisations). These activities influence the speed and direction of the innovation cycle. Figure 1.1 identifies35 many of the people and activities important for a healthy innovation system.
30 Australian Government (2009) Powering Ideas: An innovation agenda for the 21st century Canberra Australia31 The concept of national systems of innovation emerged in the late 1980s and has received considerable attention by the OECD principally emerging from
the works of Lundvall B (1992) National Systems of Innovation: Towards a Theory of Innovation and Interactive Learning Pinter, London, and Nelson RR (1993) National Systems of Innovation: A Comparative Study Oxford University Press, Oxford. There is currently no consensus on the exact definition of an innovation system, and the concept is still emerging. This definition has been adapted from Edquist C (2008) Identification of policy problems in systems of innovation through diagnostic analysis, Centre for Innovation, Lund University, Lund, Sweden
32 Commonwealth, State and Territory Advisory Council on Innovation (2009) Framework of Principles for Innovation Initiatives DIISR33 For a discussion of the difference between entrepreneurship and innovation see Feature 4 in Chapter 334 Codified knowledge is explicit information that can be articulated, stored and transmitted via media and is acquired through formal education, reading,
conferences etc. Tacit knowledge is implicit knowledge that can only be transmitted via training or gained through personal experience.35 Edquist, C (2005) Systems of Innovation: Perspectives and Challenges, In Fagerberg, J Mowery, D C. & Nelson, R. (Eds) The Oxford Handbook of Innovation
Oxford University Press, Oxford, UK.
Australian Innovation System
Report 2
011
12
Figure 1.1: A conceptual model of an innovation system36
36 This figure uses the analogy of a propeller moving through the water. The network of people and the innovation-related activities they perform are the engine (the cog) that turns the innovation cycle (the propeller) around. As the cycle turns it generates value (stream of bubbles) for society and in the long run pushes us towards greater prosperity. The water in which the propeller engine travels represents the framework conditions and determines the level of friction in the system and therefore how easily the whole engine and propeller turns.
KNOWLEDGECREATION
COMPETENCEBUILDING
ORGANISATIONCREATION & CHANGE
NETWORK/COLLABORATION
FORMATION
ENVIRONMENTCREATION & CHANGE
ARTICULATIONOF DEMAND
NEW MARKETFORMATION
RESOURCEMOBILISATION
INCUBATIONACTIVITIES
PROVISION OFINFRASTUCTURE
& OTHER SERVICES
ECONOMIC, SOCIAL AND
ENVIRONMENTAL IMPACT
Identifyopportunities/
problems
Knowledgegeneration &
transformation
Ideaselection
Ideaimplementation
SustainingInnovations
Innovationdiffusion
FRAMEWORK CONDITIONS
Match between research & needs
Skilled migration
Population, environment, geography & resource base
Legal framework & IP regime
Economic conditions
Budgetary & regulatory framework
Entrepreneurialculture
Policies & programs
Existinginfrastructure
Patterns of specialisation
Workforce & management skills
NATIONAL & INTERNATIONAL ACTORS
Publicly fundedresearch organisations
Utilities & telecommunications
Universities
Medical researchinstitutes
Consultants Entrepreneurs
Business angels Community Unions
Venture capitalists Media & marketing Business/clusters parks/technology
Regulatory authorities Investors Consumers, users
Multi-nationals Banking Intermediaries
Domestic & global supply chains
Vocational education& training providers
Large firms
SME firmsGovernments Industry associations

Chapter 1: The perform
ance of the A
ustralian Innovation System
13
It is easier to consider an innovation system from the point of view of activities rather than organisations because:
› The same activity can be performed by more than one type of organisation (e.g. firms, governments and universities create new businesses);
› All organisations do more than one kind of activity (e.g. universities build skills and undertake research);
› There is a division of labour between private and public organisations for each activity (e.g. both the Commonwealth Scientific and Industrial Research Organisation (CSIRO) and businesses do applied R&D).37 The government’s role is not to substitute these activities but to coordinate, supplement and complement the activities of the private sector;
› It emphasises what happens in an innovation system rather than who is in it; and
› There is greater potential to point out why a system performs well or badly with regard to certain kinds of innovation activity, which is important for the design and implementation of innovation policy.
Framework conditions, also known as institutions or rules of the game,38,39 comprise a set of established practices, rules or laws that regulate the interactions between individuals and organisations. Framework conditions might have nothing to do with markets, they might be intended to create markets, or make markets more efficient. Framework conditions represent the history of an innovation system and can either resist the momentum of the innovation cycle or accelerate it. Framework conditions are to a large degree national, but can also depend on the history of the technology, sector, region and global network that innovators operate in.
The balance between private and public organisations
The private sector is that part of the economy that is run by private individuals or organisations, generally with a for-profit motive, and is not controlled by the state. The public sector comprises organisations that deal with the production, delivery and allocation of goods and services by and for the government or its citizens, whether national, regional or local. The community sector (also called the third sector) encompasses social activity undertaken by organisations that are non-profit, non-governmental or voluntary.
A systems approach to innovation emphasises the close interaction between the private, public and community sectors to achieve the functional outcomes of the system — the development and diffusion of innovations. Each innovation activity is the sum of that activity within and across these three sectors.
The role of industry and community sectors
Some innovation activities are mainly market-oriented, involving entrepreneurs and innovators trialling new goods and services in the market and experimenting with new processes and business models to find the most efficient or profitable outcomes. These activities are almost always the domain of private enterprise.
The economy and society benefit from innovation, while benefits also accrue to individual businesses and entrepreneurs. Given the evident advantages to business in terms of increasing profitability, efficiency and exports, it is in the interests of industry to promote and increase innovation where the gains from innovation are greater than ‘routine’ alternatives and the risk is sufficiently manageable. The gains can be economic, social or environmental. Non-economic considerations are not always peripheral to the goals of the business (see Chapter 3, Chapter 5 and Chapter 6 for further discussion).
The community sector – which includes social enterprises, private non-profit organisations, representative bodies and community organisations – innovates to achieve social and environmental goals and increasingly uses market approaches to achieve behavioural change (see Chapter 5 for a discussion of social innovation).
The innovation activities of the business and community sectors can combine to influence and create the right framework conditions, such as a culture of entrepreneurship and open collaboration, so that innovation can flourish in their own organisations and stimulate innovation in others.
37 Edquist C (2008) Identification of policy problem in systems of innovation through diagnostic analysis: Identification of Systemic Problems (or Failures) Centre for Innovation, Research and competence in the Learning Economy, Lund University, Lund Sweden
38 Edquist C & Hommen L (2008) Comparing national systems of innovation in Asia and Europe: theory and comparative framework, In Edquist C & Hommen L (Eds) Small Country Innovation Systems: Globalization, Change and Policy in Asia and Europe Edward Elgar Publishing, United Kingdom
39 Freeman C (2002) Continental, national and sub-national innovation systems – Complementarity and Economic Growth, Research Policy 31: 191-211

Australian Innovation System
Report 2
011
14
The role of government
Governments make decisions and investments that, broadly speaking, minimise risks and build the resilience of the Australian Innovation System as well as stimulating innovative activities. Things that might be taken for granted, such as high quality infrastructure or healthy and well educated workers are the result of policies and complementary investments by the governments of Australia.
Innovation policy encompasses many elements of research, industry, social inclusion, education, competition and trade policy that have an impact on the innovation system. Governments’ responsibility in an innovation system is to supplement and facilitate the collective activities of the system through policy strategies and programs rather than trying to control all elements or be the major funder of innovation projects. Government can have a significant effect on business innovation through framework policies such as education policy, intellectual property law and business regulation but its ability to influence rates of innovation through direct financing innovation projects is limited.40
The public sector tends only to intervene where a market or system failure is apparent and where there is a significant public good to be gained or protected. In practice, at the firm level, government policies and funding can provide incentives to firms to substitute one form of investment for another (e.g. physical versus intangible, new activities versus routine activities). Clearly, these substitution effects can result in opportunity costs and inefficiencies, so innovation policy must try to minimise these adverse effects. By taking expenditure on R&D as an imperfect proxy for investment in innovation, the data shows that businesses are the major investors in innovation for economic development (Chart 1.1). Governments make complementary investments for economic development in areas such as high risk and exploratory basic research, and where the likelihood of beneficial spillovers (that result in changing business investment decisions and other behaviours) to the economy is high. The majority of government investment in innovation is therefore more focussed on defence, social good and environmental sustainability objectives whereas business investment is relatively limited.
In 2009 the Queensland Government commissioned a study by Deloitte Touche Tohmatsu on the impact of the approximately $3 billion invested in Smart State initiatives. The study confirmed that long lags exist between investment in basic research capability and the realisation of economic returns. However, the report estimated that the real Gross State Product for 1998–2020 would be $6.4–$8.4 billion greater than it otherwise would have been in the absence of these investments. This finding suggests a future Gross State Product of $4.5-$5.94 higher for every Smart State dollar spent.
Chart 1.1: Expenditure on research and development by socio-economic objective and by sector, 2008–09
Source: ABS (2010) Research and Experimental Development, All Sector Summary, Australia, 2008–09, cat. No. 8112.0. *The Environment category does not include investments by businesses in environmentally sustainable business activities, which totalled $261.3 million in 2008–09. Note that 84% of Higher Education expenditure comes from Government.
40 According to the ABS only 4% of innovation-active businesses indicated receiving financial assistance from Australian Government organisations specifically for innovation in 2008–09. Australian Bureau of Statistics (2010), Innovation in Australian Business, 2008–09, cat. no. 8158.0.
$0.8bn
$18.7bn
$5.3bn
$1.5bn* $1.4bn
0
4
8
12
16
20
Defence Economic Development Society Environment Other
Expe
ndit
ure
on R
&D
, $bi
llio
ns (C
urre
nt p
rice
s)
Private non-profit
Higher education
Government
Business

Chapter 1: The perform
ance of the A
ustralian Innovation System
15
Investments by the Australian Government are detailed in the Science, Research and Innovation Budget tables reproduced in this report (Appendix 1). The majority of government support for the innovation system comes in capacity building (more prominent in State & Territory governments), research and development investment and incentives (Chart 1.2) and maintaining conditions conducive to innovation. These policies include maintaining a safe, healthy, skilled workforce, a legal and corporate governance framework that balances competition and cooperation and a stable and positive macroeconomic environment that stimulates entrepreneurship and investment.
Chart 1.2: Science, research and innovation expenditures by the Australian Government, by category, 2009–10
Source: Australian Government Science, Research and Innovation Budget tables, 2011–12. See Appendix 1 for more information.
In the pursuit of good public administration the Australian public sector itself can increase efficiency and find greater impact through innovation.41 Governments are also looking to solve or manage seemingly intractable or complex problems such as climate change, poverty, and the ageing population. Designing and implementing these policies needs an innovative public service with the capacity to effectively serve the public interest and strengthen framework conditions for well-functioning markets.42 Public sector innovation is further discussed in Chapter 5.
Government cooperation on innovation policy
The Commonwealth, State and Territory Advisory Council on Innovation (CSTACI)43 is a council of high level officials from the Australian Government, the State and Territory governments, and the New Zealand Government. Meeting twice a year, CSTACI advises and coordinates innovation policy, activities and programs. With a targeted and strategic approach to innovation issues, the CSTACI aims to improve the effectiveness, integration and coordination of the national innovation system.
The Victorian Government’s $30 million VicStart Technology Commercialisation Initiative (VicStart) is an example of how complementary State and Commonwealth programs can work together to support the growth and sustainability of local companies through successful commercialisation of their products and services. VicStart operated from 2003 to 2009, providing a range of commercialisation support services through external providers, known as Program Partners to improve the linkages, processes and skills needed to successfully commercialise Victoria’s science and technology base. VicStart was designed to leverage Commonwealth funding programs by raising awareness of such programs, matching businesses to appropriate programs, and providing support through the application process.
41 Management Advisory Committee (2010) Empowering Change: Fostering Innovation in the Australian Public Service, Australian Government, Canberra Australia.
42 OECD (2009) Government at a glance, OECD, Paris43 http://www.innovation.gov.au/Innovation/CouncilsandForums/Pages/CSTACI.aspx
DSTO
R&D TaxIncentives
AustralianResearchCouncil
NHMRC andOther Health
CSIRO
Other R&D support
UniversityBlock Funding
CRCs
Other ResearchAgencies
$1.72 bn
Other InnovationSupport
$2.34 bn
RRDCs and otherrural support
Other
$2.36 bn
Energy &Environment
Other Science Support
$1.95 bn
0.0
0.5
1.0
1.5
2.0
2.5
Major Australian GovernmentResearch Agencies
Business EnterpriseSector
Higher EducationSector
Multisector
Expe
ndit
ure,
$bi
llio
ns

Australian Innovation System
Report 2
011
16
In 2010, an independent evaluation by KPMG found that VicStart delivered on its intended objectives and achieved strong positive outcomes for Victorian businesses undertaking commercialisation of technology. In particular, KPMG found that VicStart brokered or facilitated $159.4 million of public and private investment into client companies, representing a return on Government investment of 6.5 to 1. A significant portion of this investment was Commonwealth grants to support commercialisation and business growth, including through Commercial Ready. The overwhelmingly positive feedback gathered through the evaluation also supported this finding, with clients reporting that VicStart was particularly effective in the areas of funds acquisition and increasing the commercial viability of technology businesses.
Assessing the performance of the innovation system
Innovation is highly contextual, evolves out of varying mixes of activities, and is influenced by conditions that are not globally uniform. This makes it difficult to specify what an ‘optimal’ or ‘ideal’ innovation system looks like. System failures must be resolved through policy, developed after considering international comparisons with other innovation systems, and learning through policy experimentation. The conceptual model (Figure 1.1) allows assessment of the function of the innovation system by the economic, social and environmental impacts it contributes to. The model can also help explain differences between innovation systems by comparing innovation activities that underpin the function of the system.
By applying an input-output-outcome measurement framework to the model of an innovation system, a more complete assessment of the performance of the Australian Innovation System can be achieved. This requires measuring:
1. Australia’s capacity to innovate. This is an ‘inputs’ assessment of our networks, collaboration, organisations and their activities and framework conditions.
2. The function of Australia’s innovation system. This is an ‘outputs’ assessment of the innovation cycle: identification of opportunities, creation and diffusion of innovation.
3. The impacts of innovation. This is an ‘outcomes’ assessment of what the innovation system is delivering in terms of social, environmental and economic results.
The following three spider-charts in this chapter summarise the indicators presented in this report, respectively describing the capacity, function and impacts of the Australian Innovation System. Each unweighted indicator is compared with the average of the top five Organisation for Economic Co-operation and Development (OECD) countries and the overall OECD average. A value of 100 represents the average of the top five performing OECD countries for each indicator. A value close to or at 100 indicates that Australia is one of the top five OECD countries for that indicator and is ahead of most developed countries of the world. A value below 100 shows Australia is behind the leading developed countries in the world. This assessment, like any other, is highly contextual and the reader is encouraged to refer to the relevant chapter of this report and the references contained within to obtain a broader understanding of the working of the innovation system.
Assessing the capacity of the innovation system
Chart 1.3 summarises many of the indicators that describe the innovation-related activities and conditions commonly used by Australia and other OECD countries. Together they describe an input-based measure of the capacity of the Australian innovation system when compared with other developed countries. Four main areas are shown: resource mobilisation or investment in innovation (highlighted in blue), research capacity and skills base (highlighted in green), business conditions (highlighted in yellow), and networking and collaboration (highlighted in red).
The data shows that for three of the four areas investigated, the capacity of the Australian Innovation System is generally above or around the OECD average. Australia’s research capacity and skills base are moderate-to-good compared with the OECD, particularly in our share of tertiary educated and professionals/technicians in the workforce. This suggests a moderate to good capacity to be creative, find solutions and generate new ideas (see Chapter 2 for more details). Business conditions (highlighted in yellow) compare particularly well with other OECD countries. Our conditions for entrepreneurship is considered one of the best in the world44 enhancing our ability to undertake market experiments with new innovations (Feature 4).
44 World Bank – IFC (2011) Doing Business 2011 report; and Kelley DJ, Bosma N, Amoros JE (2010) Global Entrepreneurship Monitor 2010 Global Report, Global Entrepreneurship Research Association.

Chapter 1: The perform
ance of the A
ustralian Innovation System
17
Chart 1.3: National innovation system input indicators (grouped by activity and OECD ranking). The figure compares Australia with the top 5 OECD countries for each indicator (normalised to 100)
Source: Varies by indicator. See other chapters in the report for detailed indicator descriptions. An asterix indicates an inverted scale.
Australia’s record on collaboration on innovation with all organisations is still below the OECD average but is relatively high domestically, particularly for small and medium enterprises (SMEs) (Chart 1.3;Chapter 4). Resource mobilisation to innovation is generally positive and either at, or above OECD average. Seed/start-up stages of venture capital investment remain below the OECD average. The latest comparative figures on resource mobilisation do not take account the latest data on Australia’s investments. Australia’s total spending on R&D has continued to increase, driven by business R&D, whereas venture capital investment declined significantly through the global financial crisis period (Chapters 2 and 3). Our total investment in fixed and intangible assests is around the average of 16 OECD countries. However, Australia’s investment in intangibles, such as skills, is below the OECD average and is also low relative to investments in machinery and equipment on an OECD scale. A more detailed look at investment in innovation is provided below and, for a discussion of access to finance see Chapter 3.
Investment in innovation
Many innovation reviews and international organisations45 have argued that the transformation of an economy to one that is ‘knowledge-based’ is important to escape environmentally and socially unsustainable competition on commodity prices.
As outlined in Feature 1, investment in intangibles46 is a broad indicator of investment in innovation.47,48
45 OECD (2010) The OECD Innovation Strategy: Getting a head start on tomorrow, OECD, Paris; Cutler, T (2008) Venturous Australia. Review of the national Innovation System Cutler & Company Pty Ltd, Melbourne; Lord Sainsbury of Turville (2007) The Race to the Top: A Review of Government’s Science and Innovation Policies, London, UK; and Obama B (2011) A Strategy for American Innovation: Driving Towards Sustainable Growth and Quality Jobs, Obama Presidential Administration.
46 The indicator includes three types of intangibles: i) Computerised information which is computed as the expenditures in software and databases, ii) Innovative property which captures expenditures on scientific R&D, mineral exploration, copyright and licence costs, and other product development, design and research, and iii) Economic competencies that is a measure of firm assets such as brand equity, firm-specific human capital and organisational capital.
47 Corrado C, Hulten C & Sichel D (2006) Intangible Capital and Economic Growth, NBER Working Paper no. 11948 National Bureau of Economic Research, Cambridge, Massachusetts
48 Barnes, P & McClure, A. (2009) Investments in Intangible Assets and Australia’s Productivity Growth Productivity Commission Staff Working Paper, Canberra.
Perceived business opportunities
Fear of business start up failure*Barriers to entrepreneurship*
Entrepreneurial intentionsBuyer sophistication
Tax treatment of R&D in SMEsMarket capitalisation
Net Foreign Direct InvestmentIntensity of local competition
Professionals and technicians in employmentTime required to start a business*
Population aged 25-64 with tertiary educationCost of business start-up procedures*
Relative impact of publicationsStart-up procedures to register a business*
Researchers in the labour forceGross expenditure on R&D financed abroad
Tertiary education expenditureTotal International firm collaboration on innovation
25-64 year olds attaining upper secondary school education% Patents with foreign co-inventors
Share of world top 1% scientific articlesTotal Large firm collaboration on innovation
Investment in fixed and intangible assetsHigher Education R&D financed by business
Venture Capital Seed/Startup investment
Total SMEs collaboration on innovation Gross expenditure on R&D
Total Domestic firm collaboration on innovation Venture Capital early development and expansion investment
100
80
60
40
20
0
Researchcapacity
& Skills base
Business frameworkconditions
Resourcemobilisation
Networks andcollaboration
Australia
OECD average
OECD top 5

Australian Innovation System
Report 2
011
18
Chart 1.4 shows that Australia ranks 8th out of the 16 OECD countries measured in terms of fixed and intangible investment (19.1% of gross domestic product; GDP). The contributions of the three intangible categories – computerised information, innovative property and economic competencies – are relatively low, with economic competencies the largest contributor (2.9% of GDP). The United States, Sweden, Japan, Canada, United Kingdom and Finland all have shares of intangibles investments over 9% of GDP. Over the past decade, investment in intangibles has grown as a share of GDP in many OECD countries while investment in tangibles has stayed the same or declined.49 This trend is led by the United States, Sweden, UK and Finland whose intangible investments exceed machinery and equipment investments. In contrast, Australia’s investment in intangibles is less than half that of investments in machinery and equipment. However average annual growth in intangible investment in Australia has been higher than tangibles since 1974–75.50
Chart 1.4: Investment in physical capital and intangibles as a proportion of gross domestic product, 2006
Source: OECD (2010) Measuring Innovation: A new perspective. OECD, Paris. The 16 OECD countries are ranked by total expenditure in intangibles assets as a percentage of GDP. Investment in intangible assets is provided in the three categories: computerised information, innovative property and economic competences. Investment in fixed assets (machinery and equipment) is shown in purple as a contrast with intangibles for each country.
The measurement of intangible investments suggests that leading OECD economies have increasingly higher shares of intangibles assets as a percentage of the GDP (generally over 9%). Secondly, intangible investment does not have a large direct effect on the level or pattern of conventionally-measured multi-factor productivity growth in Australia51. This is in contrast to the United States and United Kingdom where intangibles account for a large share of productivity acceleration. The data suggests that Australia still lags behind OECD leaders in its transition to a knowledge-based economy or that we are taking an atypical pathway. Further analysis of time series data is required to see if Australia’s investments in intangibles are out of phase with other OECD countries and to what extent this data is affected by differences in industrial structure. Analysis of other measures of a transition to a knowledge-based economy, such as investment in R&D would also bring clarity to this debate.
49 OECD (2010) The OECD Innovation Strategy: Getting a head start on tomorrow OECD, Paris50 Barnes P & McClure A (2009) Investments in Intangible Assets and Australia’s Productivity Growth Productivity Commission Staff Working Paper, Canberra, p.xii51 Ibid. p. .xxv.
1.4
7.5
2.0
9.7
2.2
15.3
1.0
11.6
1.4
5.9
1.0
7.5
1.4
8.9
1.9
8.8
0.8
10.7
0.7
8.3
0.9
10.0
0.7
16.2
0.8
13.2
0.8
11.9
0.6
16.9
Fixed
Intangible
0.4
19.8
4.7
5.5 6.1
5.0 2.9 4.0 3.2
3.0
3.3 3.6 3.1 2.8 2.2 2.8
2.2 1.8
5.9 4.4 2.8
3.8
5.4 4.1 3.3 3.0
3.5 2.8 2.4 2.9
2.9 1.9 2.2
2.4
0
2
4
6
8
10
12
14
16
18
20
Uni
ted
Stat
es
Swed
en
Japa
n (2
005)
Can
ada
(200
5)
Uni
ted
Kin
gdom
Finl
and
Fran
ce
Den
mar
k
Por
tuga
l(2
005)
Ger
man
y
Aus
tria
Cze
chR
epub
lic
Aus
tral
ia
Spai
n
Ital
y
Slov
akR
epub
lic
Per
cent
age
of G
DP
Machinery andequipment
Brand equity,firm specific human capital, organisational capital
R&D and other intellectual propertyproducts
Computerised information, software and databases
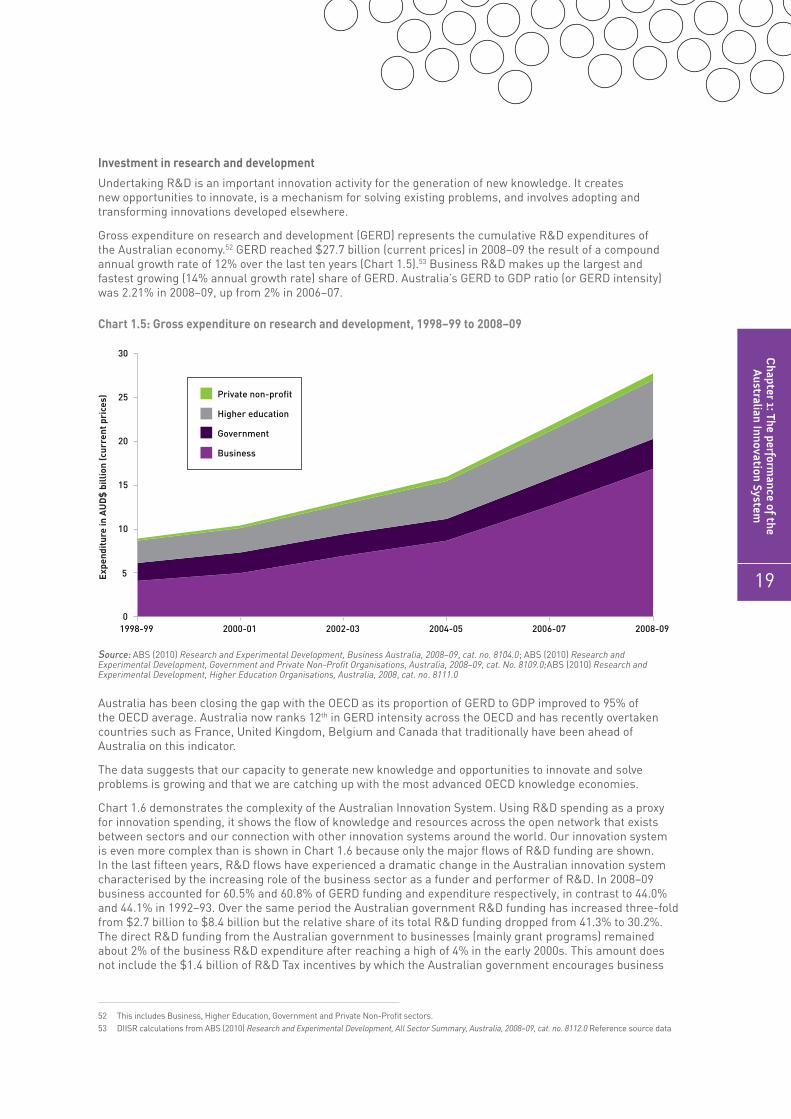
Chapter 1: The perform
ance of the A
ustralian Innovation System
19
Investment in research and development
Undertaking R&D is an important innovation activity for the generation of new knowledge. It creates new opportunities to innovate, is a mechanism for solving existing problems, and involves adopting and transforming innovations developed elsewhere.
Gross expenditure on research and development (GERD) represents the cumulative R&D expenditures of the Australian economy.52 GERD reached $27.7 billion (current prices) in 2008–09 the result of a compound annual growth rate of 12% over the last ten years (Chart 1.5).53 Business R&D makes up the largest and fastest growing (14% annual growth rate) share of GERD. Australia’s GERD to GDP ratio (or GERD intensity) was 2.21% in 2008–09, up from 2% in 2006–07.
Chart 1.5: Gross expenditure on research and development, 1998–99 to 2008–09
Source: ABS (2010) Research and Experimental Development, Business Australia, 2008–09, cat. no. 8104.0; ABS (2010) Research and Experimental Development, Government and Private Non-Profit Organisations, Australia, 2008–09, cat. No. 8109.0;ABS (2010) Research and Experimental Development, Higher Education Organisations, Australia, 2008, cat. no. 8111.0
Australia has been closing the gap with the OECD as its proportion of GERD to GDP improved to 95% of the OECD average. Australia now ranks 12th in GERD intensity across the OECD and has recently overtaken countries such as France, United Kingdom, Belgium and Canada that traditionally have been ahead of Australia on this indicator.
The data suggests that our capacity to generate new knowledge and opportunities to innovate and solve problems is growing and that we are catching up with the most advanced OECD knowledge economies.
Chart 1.6 demonstrates the complexity of the Australian Innovation System. Using R&D spending as a proxy for innovation spending, it shows the flow of knowledge and resources across the open network that exists between sectors and our connection with other innovation systems around the world. Our innovation system is even more complex than is shown in Chart 1.6 because only the major flows of R&D funding are shown. In the last fifteen years, R&D flows have experienced a dramatic change in the Australian innovation system characterised by the increasing role of the business sector as a funder and performer of R&D. In 2008–09 business accounted for 60.5% and 60.8% of GERD funding and expenditure respectively, in contrast to 44.0% and 44.1% in 1992–93. Over the same period the Australian government R&D funding has increased three-fold from $2.7 billion to $8.4 billion but the relative share of its total R&D funding dropped from 41.3% to 30.2%. The direct R&D funding from the Australian government to businesses (mainly grant programs) remained about 2% of the business R&D expenditure after reaching a high of 4% in the early 2000s. This amount does not include the $1.4 billion of R&D Tax incentives by which the Australian government encourages business
52 This includes Business, Higher Education, Government and Private Non-Profit sectors.53 DIISR calculations from ABS (2010) Research and Experimental Development, All Sector Summary, Australia, 2008–09, cat. no. 8112.0 Reference source data
Expe
ndit
ure
in A
UD
$ b
illio
n (c
urre
nt p
rice
s)
0
5
10
15
20
25
30
1998-99 2000-01 2002-03 2004-05 2006-07 2008-09
Private non-profit
Higher education
Government
Business
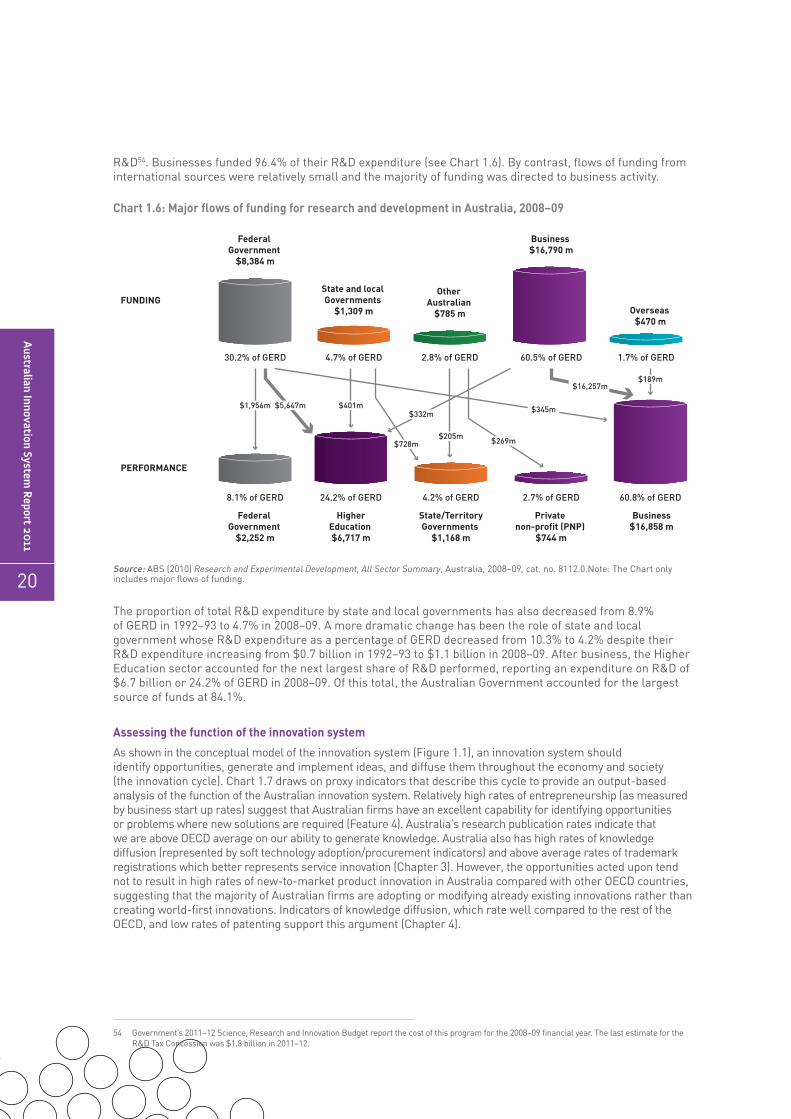
Australian Innovation System
Report 2
011
20
R&D54. Businesses funded 96.4% of their R&D expenditure (see Chart 1.6). By contrast, flows of funding from international sources were relatively small and the majority of funding was directed to business activity.
Chart 1.6: Major flows of funding for research and development in Australia, 2008–09
Source: ABS (2010) Research and Experimental Development, All Sector Summary, Australia, 2008–09, cat. no. 8112.0.Note: The Chart only includes major flows of funding.
The proportion of total R&D expenditure by state and local governments has also decreased from 8.9% of GERD in 1992–93 to 4.7% in 2008–09. A more dramatic change has been the role of state and local government whose R&D expenditure as a percentage of GERD decreased from 10.3% to 4.2% despite their R&D expenditure increasing from $0.7 billion in 1992–93 to $1.1 billion in 2008–09. After business, the Higher Education sector accounted for the next largest share of R&D performed, reporting an expenditure on R&D of $6.7 billion or 24.2% of GERD in 2008–09. Of this total, the Australian Government accounted for the largest source of funds at 84.1%.
Assessing the function of the innovation system
As shown in the conceptual model of the innovation system (Figure 1.1), an innovation system should identify opportunities, generate and implement ideas, and diffuse them throughout the economy and society (the innovation cycle). Chart 1.7 draws on proxy indicators that describe this cycle to provide an output-based analysis of the function of the Australian innovation system. Relatively high rates of entrepreneurship (as measured by business start up rates) suggest that Australian firms have an excellent capability for identifying opportunities or problems where new solutions are required (Feature 4). Australia’s research publication rates indicate that we are above OECD average on our ability to generate knowledge. Australia also has high rates of knowledge diffusion (represented by soft technology adoption/procurement indicators) and above average rates of trademark registrations which better represents service innovation (Chapter 3). However, the opportunities acted upon tend not to result in high rates of new-to-market product innovation in Australia compared with other OECD countries, suggesting that the majority of Australian firms are adopting or modifying already existing innovations rather than creating world-first innovations. Indicators of knowledge diffusion, which rate well compared to the rest of the OECD, and low rates of patenting support this argument (Chapter 4).
54 Government’s 2011–12 Science, Research and Innovation Budget report the cost of this program for the 2008–09 financial year. The last estimate for the R&D Tax Concession was $1.8 billion in 2011–12.
FUNDING
PERFORMANCE
Federal Government
$8,384 m
Business $16,790 m
Overseas $470 m
Other Australian
$785 m
State and local Governments
$1,309 m
Federal Government
$2,252 m
30.2% of GERD 4.7% of GERD 2.8% of GERD 60.5% of GERD 1.7% of GERD
8.1% of GERD 24.2% of GERD 4.2% of GERD 2.7% of GERD 60.8% of GERD
Private non-profit (PNP)
$744 m
Business$16,858 m
State/TerritoryGovernments
$1,168 m
HigherEducation $6,717 m
$1,956m $5,647m $401m
$728m
$332m
$205m $269m
$345m
$189m$16,257m

Chapter 1: The perform
ance of the A
ustralian Innovation System
21
Chart 1.7: National innovation system output indicators (innovation creation and diffusion i.e. the health of the system). The figure compares Australia with the top 5 OECD countries for each indicator (normalised to average of top 5 OECD countries = 100)
Source: Varies by indicator. See chapters 2, 3 and 4 in the report for detailed indicator descriptions.
Understanding how Australian firms innovate
It is too simplistic to just report the percentage of firms that innovate or to map the organisations involved. Australia needs to embrace complexity by learning not just who is innovating but how they are innovating. To do this we must understand (and measure) the historical context in which innovation is created and diffused. Monitoring innovation activities over time and identifying where conditions interact with innovating organisations helps inform the how of innovation. Innovation indicators can give an insight into how innovation happens in Australia. A methodology developed through the Innovation Metrics Framework Report55 has been used to construct composite indicators on how Australian businesses innovate. These ‘modes’ of innovation are described below and illustrated in Chart 1.8 and Chart 1.9.
Chart 1.8 shows that domestic modification of innovations already introduced elsewhere in the world is by far the most common way Australian firms innovate. These results are consistent with earlier findings that Australian firms have long been technology integrators, modifiers and adopters, able to combine other people ideas to generate impact.56,57 Barlow58 suggests that this is a core skill in a world of open innovation where the development of new products is supported by collaboration and increasingly driven by the sharing of competencies across and between firms. It should be noted here that the data does not indicate whether Australian firms are fast followers.
The data also shows a significant difference between SMEs and large firms. Large firms are more than twice as likely to modify innovations already available on international markets and then sell them on to international markets. Large firms are also up to five times more likely to introduce innovations new to the domestic markets than SMEs. This data suggests an important role for large firms in both bringing innovations developed internationally into the domestic market and also in developing solutions for their sector.
55 Australian Government (2010) Innovation Metrics Framework Report, Department of Innovation, Industry, Science and Research, Canberra, Australia.56 Scott-Kemmis D, Jones AJ, Arnold E, Chitravas C & Sardana D (2007) Absorbing innovation by Australian enterprises: The role of absorptive capacity.
Department of Innovation, Industry, Science and Research, Canberra, Australia
57 Barlow T (2006) The Australian Miracle: An Innovative Nation Revisited. Picador Pan-Macmillan Eds: Sydney, p.24458 Ibid.
0
20
40
60
80
100
Triadic patent families
Proportion of large firms with new-to-market products
Proportion of SMEs with new-to-market products
Industrial design registrations
Patent applications filedunder PCT
Trademark registrations
Proportion of non-technological innovators in services sector
Proportion of non-technological innovators in manufacturing sector
Publications per thousand researchers
Total Early-Stage Entrepreneurship Activity
Opportunity entrepreneurship
Government procurement of advanced technology products
Firm level technology absorption
Business entry rate
Australia OECD average OECD top 5

Australian Innovation System
Report 2
011
22
Australia has extremely low proportions of ‘New to the market international innovators’ even for large businesses (1.5%; Chart 1.8) which generally increase the proportions of innovators across all modes. Most other OECD countries appear much more likely to develop innovations that are new to international markets than Australia (Chart 1.9).
Output-based ‘modes’ of innovators
New to the market international innovatorsThese innovators introduced one or more product (good or service) innovations that are new to international markets. These innovations were developed in house or in collaboration with others.
New to the market domestic innovatorsThese innovators introduced one or more product innovations that are new to domestic markets only. These innovations were developed in house or in collaboration with others.
International modifiersThese innovators have introduced one or more products or processes that are already available on international markets. These innovations were developed in-house or in collaboration with others.
Domestic modifiersThese innovators introduced one or more products or processes that already exist in international and domestic markets. These innovations were developed in-house or in collaboration with others.
AdoptersThese innovators introduced one or more products or processes that already exist internationally and domestically, however, unlike Domestic modifiers, Adopters have no in-house development but instead acquire innovations from others without modifying them.
Businesses with abandoned or ongoing innovationThese businesses have undertaken innovation projects or activities that have either been abandoned or have not yet been finalised.
Chart 1.8: Proportion of different types of innovators, by firm size, 2008–09
Source: ABS (2010). Data analysis commissioned by DIISR. Adapted from (Arundel and O’Brien 200959).
59 Arundel, A and O’Brien, K (2009), Innovation Metrics for Australia, report commissioned by the Department of Innovation, Industry, Science and Research.
0
5
10
15
20
25 New to Market International Innovators
New to Market Domestic Innovators
International Modifiers
Domestic Modifiers
Adopters
Business with Abandoned orOngoing innovation only
0–4 persons
5–19 persons
20–199 persons
200 or more persons

Chapter 1: The perform
ance of the A
ustralian Innovation System
23
The high proportions of modifiers of existing innovations suggests that achieving and maintaining high firm absorptive capacity60 is vital to the function of the Australian innovation system. If the majority of Australian firms’ innovations are based on modifications of foreign innovations, then the increasing investments in R&D may be for incremental modification rather than creation of totally new goods and services. This agrees with the data on sources of ideas (Chapter 4, Figure 4.1). It shows firms not only use a wide variety of sources of information for innovation, and mostly source their ideas through other businesses and customers, rather than through research agencies or intermediaries. The evidence suggests that Australian firms have a high reliance on market based modes of knowledge transfer.
Chart 1.9: Comparison of innovation modes across 17 OECD countries
Source: Adapted from Bloch, C. and V. López-Bassols (2009) Chapter 1: Innovation indicators. In, Innovation in Firms: A microeconomic perspective, OECD, Paris. Note that Australia’s ‘new to market international’ has been reduced in novelty to match the definitions of other OECD countries. Note: Other OECD countries use ‘New to the Market International innovators’ instead of the ‘New to the World International innovators’. Australian data has been adjusted to match the other country definitions.
Assessing the impact of the Australian innovation system
Chart 1.10 summarises Table 1.1 for all of the proxy indicators that describe the outcomes, or impacts, of innovation found in this report. Each indicator is represented by the gap from the averaged performance of the top five OECD countries. By doing this we are comparing the impact of Australia’s innovation system with leading developed countries.
The impact of the national innovation system can be ‘measured’ by looking at broad indicators of economic prosperity, societal wellbeing and the state of the natural environment in Australia (Chart 1.10), as well as looking at broad indicators of economic structural change and renewal. Exercising the link between output and outcome indicators is difficult as there are many factors – such as timing, lag effects and the domestic impact of innovations originating from other countries – that can contribute to the net effect. Australia continues to lag behind in the OECD rankings in some areas such as the share of high and medium-high level technology in manufacturing exports or gross value added. The difference between knowledge-intensive services and manufacturing sectors is stark when compared to other OECD countries. Australia’s knowledge intensive business services rank 5th in the OECD for contribution to gross value added compared to 30th for the manufacturing indicator. All other indicators are either at the OECD average or above it. There has been minimal change to these indicators from the previous reporting year and there has also been minimal change in Australia’s gap from the top five OECD average on each indicator.
60 Absorptive capacity can be described as an organisation’s ability to identify, acquire, transform and exploit innovations from external sources. See Cohen WM & Levinthal DA (1989) Innovation and learning: the two faces of R&D. Economic Journal 99: 569-596; Scott-Kemmis D, Jones AJ, Arnold E, Chitravas C & Sardana D (2007) Absorbing innovation by Australian enterprises: The role of absorptive capacity. Department of Innovation, Industry, Science and Research, Canberra, Australia
0 10 20 30 40 50
Percentage of respondents
60 70 80 90 100
Brazil (manuf. and mining)
Australia
Germany
Austria (CIS-3)
Japan
New Zealand
Norway
France
Belgium
Canada (manuf.)
United Kingdom
Netherlands
Denmark
Sweden
Luxembourg
Finland
Korea (manuf.)
New-to-marketinternational
New-to-marketdomestic
Internationalmodifiers
Domesticmodifiers
Adopters

Australian Innovation System
Report 2
011
24
Chart 1.10: National innovation system outcome indicators (identification of opportunities, innovation creation and diffusion). The figure compares Australia with the average of the top 5 OECD countries for each indicator (normalised to 100)
Source: Varies by indicator. See Table 1.1 below for details.
Australia compares well on social and economic prosperity indicators with other OECD countries. Our current global competitiveness is ranked 12th in the OECD and our GDP per capita is high, thanks to the combined impact of innovation and structural reform on long-term productivity growth, as well as our natural resource endowments (Australian ranks 3rd in the OECD on the export of raw commodities; Chart 1.10). Although the score appears close to other OECD countries, Australia ranks near the bottom of developed countries regarding environmental performance. We are not doing as well on environmental indicators such as water use and greenhouse gas emissions, suggesting a need to focus on how well this is addressed in the innovation system.61 This area has been a recent focal point of discussion in Australia, particularly environmental pricing of greenhouse gases and water, to drive business innovation and renewal. International forums such as the United Nations Green Economy initiative and the OECD’s Green Growth Strategy recognise the importance of transforming economies to be more environmentally sustainable (Introduction and Chapter 6).
Taken together the data suggests that, we have a poorer tendency to collaborate and a greater tendency to modify existing innovations over creating our own new innovations. Despite this, our moderate to good ranking in innovation, has helped create a competitive economy and inclusive society.
61 World Wildlife Fund, Zoological Society of London and Global Footprint Network (2010) Living Planet Report 2010: Biodiversity, biocapacity and development, Switzerland. This report ranks Australia as 29th out of 34 OECD countries in terms of both Ecological footprint (6.83 gha) and Water footprint (119.09 km3/year).
0
20
40
60
80
100
Exports in services (% of GDP)
Share of high and medium-hightechnology manufacturing in
total gross value added
Exports in goods (% of GDP)
Share of high and medium-hightechnology in manufacturing exports
GDP per hour worked
World ranking by the EnvironmentalPerformance Index
GDP per capita
Exports in raw commodities(% of GDP)
Share of knowledge-intensivemarket services in total
gross value added
World ranking by the Global Competitiveness Index
World ranking by the Human Development Index
Australia OECD average OECD top 5

Chapter 1: The perform
ance of the A
ustralian Innovation System
25
Table 1.1: Australia’s performance in innovation outcomes against other OECD countries
IndicatorsLatest Figure
Reference Year
OECD Ranking(a)
Gap from the Top
Five OECD Performers
Baseline figure
Reference year
baseline figure
Change from
baselinefigure
Share of high and medium-high technology manufacturing in total gross value added [1]
3.0%(nd) 2004 25th 76.5% 3.0% 2004 -
Share of knowledge-intensive market services in total gross value added [1]
23.2%(nd) 2004 5th 13.2% 23.2% 2004 -
Share of high and medium-high technology in manufacturing exports [2]
27.4%(nd) 2007 30th(r) 64.9%(r) 27.4% 2007 -
Exports in goods as a % of GDP(b) [3] 15.5 2009 30th 73.1% 14.4(r) 2007 7.9%
Exports in services as a % of GDP(b) [3] 4.2 2009 30th 87.0% 4.1(r) 2007 2.7%
Exports in commodities as a % of GDP(c) [4] 15.5 2009 30th 75.7% 17.8 2008 -12.9%
Exports in raw commodities as a % of GDP(c) [4] 8.3 2009 3rd 21.3 9.6 2008 -13.7%
GDP per capita relative to the USA (USA=100)(d) [5] 86.2 2009 6th 21.9 % 83.9(r) 2008 2.7%
GDP per hour worked (USA=100) [5] 83.4 2009 11th 26.0% 82.0 2008 1.7%
World ranking by the Global Competitiveness Index [6] 16th 2010-11 12th 6.7% 15th 2009–10 -0.8%
World ranking by the Human Development Index [7] 2nd 2010 2nd No gap 2nd 2007 0.63%
World ranking by the Environment Performance Index [8]
51st 2010 25th 23.3%(r) 51st 2010 -
Source: [1] OECD, Science, Technology and Industry Scoreboard 2007. [2] OECD, Science, Technology and Industry Scoreboard 2009. [3] OECD Factbook Statistics 2010. [4] OECD International Trade by Commodity Statistics database [5] OECD Productivity database, May 2011. [6] World Economic Forum, The Global Competitiveness Index 2010-2011. [7] The United National Development Programme, Human Development Report 2010. [8] Yale University and Columbia University, in collaboration with the World Economic Forum at the Joint Research Centre of the European Commission, Environmental Performance Index 2010.Note: (a) OECD rankings are performed on those OECD countries for which data is available. Individual data availability may vary between indicators. (b) The figures are derived by DIISR from the OECD source based on data on exports in goods and services and GDP in billion US dollars, current prices and PPPs. (c) Exports are measured in current US$ and classified according to the Harmonized Commodity Description and Coding System (HS) 2007. The GDP used to derive the indicator is measured in US$, current prices, current exchange rates. The HS 2007 chapters selected as a proxy for raw commodities comprise: 01 : Live animals; animal products; 10 : Cereals; 26 : Ores, slag and ash; 27 : Mineral fuels, mineral oils and products of their distillation; bituminous substances; Mineral waxes. (d) The measure used is in per head, US $, constant prices, constant PPPs, OECD base year (nd) No new data (r) The baseline has been revised according to the latest available data. – = not applicable.
Renewal of the innovation system
As indicated previously, a key function of an innovation system is its capacity for renewal, and the Australian innovation system faces two related strategic opportunities – diversification and specialisation. Through diversification there is the need to create essentially new industries or new markets based on radical innovation. Through specialisation there is the need to continue incremental innovation to retain competitiveness in existing industries.62
62 Smith K & West J (2005) Australia’s innovation challenges: Building an effective national innovation system. The Melbourne Review 1(1): 15-22

Australian Innovation System
Report 2
011
26
Chart 1.11 shows the degree of novelty has dropped significantly between 2006–07 and 2008–09 in almost all firm sizes. ‘New to the business’ innovations reflect the use of adoptive or imitative strategies and have grown in the same period. This data is consistent with earlier discussion of domestic modifiers being the main modes of innovation in the Australian innovation system (Chart 1.8 and Chart 1.9). The data further suggests that while this way of innovating might contribute to specialisation of existing markets it will not necessarily create or confer any ‘first-mover’ competitive advantage.
Chart 1.11: Proportion of innovating businesses by innovation type and degree of novelty, 2006-07 and 2008-09
Source: ABS (2010), Innovation in Australian Business, 2008–09, cat. no. 8158.0. ABS (2008), Innovation in Australian Business, 2006–07, cat. no. 8158.0.
An empirical study showed that countries that have high levels of specialisation in particular industry sectors and that dominate export markets with high sectoral shares are supported by strong innovative activity.63 These observations also appear relevant to other sectors and economic activity. Although it is of great importance that countries maintain their specialisation, the risk of locking in existing technologies and industries64 and the inability of the innovation system to generate new industries needs to be considered. Chart 1.12 shows our level of specialisation and competitiveness by providing a ranking of export goods where Australia exhibits a strong revealed comparative advantage (RCA) in exports.65
63 Fagerberg J (1988) International Competitiveness, The Economic Journal 98: 355-37464 For a discussion on lock-in failures and path dependence see Smith K (2000) Innovation as a Systemic Phenomenon: Rethinking the Role of Policy.
Enterprise & Innovation Management Studies 1(1): 73-102 65 Revealed Comparative Advantage (RCA) is a measure of a country’s current export specialisation, or the strength in exports of goods relative to other
countries. The definition of RCA for a nation is the ratio of relative share of exports of a good M in country N over the relative share of exports M for the world. An RCA above 1 for a given good implies that the country is specialised in the export of this good.
Goods and/or services
Operational processes
Organisational/managerial processes
Marketing methods
0
20
40
60
80
100
2006–07 2008–09
New to the world
Per
cent
age
of R
espo
nden
ts
New to Australiabut not the world
New to the industry in Australia but not new to
Australia or the world
New to the business only
2006–07 2008–09 2006–07 2008–09 2006–07 2008–09

Chapter 1: The perform
ance of the A
ustralian Innovation System
27
Chart 1.12: Top 25 export goods in which Australia shows a strong revealed comparative advantage (US$ Billion)
Source: Based on UN Comtrade database. The analysis compares three six-year periods to obtain a more robust indication of the export profiles. The columns show the level of specialisation for each period and data levels indicates the dollar amount of exports in the period 2002–09.
The RCA data shows that over the last 20 years Australia has maintained significant specialisation and competitive advantage in industries that depend heavily on Australia’s resource base of minerals, energy, and agricultural commodities (Chart 1.12). The existence of a well-articulated sectoral innovation system supporting the specialisation of the export-oriented mining industry66 and some areas of the agricultural industry is an important ingredient of this success. The data also shows that Australia has developed only one new area of export specialisation to a considerable level over the last 20 years.67 This area, the Australian wine industry (classified broadly as food and beverages manufacturing), has developed rapidly into a major export industry totalling US$16 billion in export revenue over 2002–09. This rapid development and export success has been argued to be due, in part, to the creation of a significant sectoral innovation system where marketing, product and process innovation have evolved68.
Australian service sectors are not considered in Chart 1.1269, but some services sectors show an interesting case of renewal. Sectors such as higher education (classified as travel services and business services) have experienced growth over the past decade. The increase in services exports since 1999–00 was $15 billion in education services and $4 billion in business services. Tourism exports also increased by over $7 billion from $15 billion in 1999–00, to nearly $23 billion in 2009–10.70
66 Scott-Kemmis D, Holmen M, Balaguer A, Dalitz R, Bryant K, Jones AJ & Matthews JH (2005) No Simple Solutions: How Sectoral Innovation Systems Can Be Transformed : Key Findings from the Australian Innovation Systems (AUSIS) Project, Australian National University, Canberra.
67 This analysis of RCA may not pick up export growth that occurs across the economy in a number of products or sectors at lower scale. If the growth of new export industries is diverse and scattered this can help build resilience to external shocks.
68 Smith K & March I (2007) Wine and economic development: technological and corporate change in Australian wine industry. International Journal of Technology and Globalisation 3(2/3): 224-244
69 Whilst there is no one agreed definition of the services sector, for the purposes of this report, it is taken as the collection of industry sectors that are not agriculture, mining and manufacturing, as defined in the Australian New Zealand Standard classification system (ANZSIC), 2006.
70 Australian Bureau of Statistics (2010) Tourism Satellite Account, cat. no. 5249.0. Tourism is not identified in the Australian and New Zealand Standard Industrial Classification. A Tourism Satellite Account is recognised internationally as the benchmark for estimating the economic contribution of tourism.
1988–1994
1995–2001
2002–2009
0
10
20
30
40
50
60
70
$3.4B
$14.7B $29.7B
$145.5B $92.1B
$5.3B
$5.2B
$4.2B
$26.5B
$6.2B
$16.0B
$8.1B
$28.5B
$16.9B
$55.4B $20.3B
$16.8B $3.9B $5.9B
$4.8B
$1.5B $5.8B
Ura
nium
, Tho
rium
Ore
s et
c.
Woo
l, O
ther
Ani
mal
Hai
r
Alu
min
ium
Ore
,C
once
ntra
tes
etc.
Coa
l, N
ot A
gglo
mer
ated
Iron
Ore
, Con
cent
rate
s
Woo
d in
Chi
p, P
arti
cles
Bar
ley,
Unm
illed
Lead
Bov
ine
Mea
t
Nic
kel O
res,
Con
cent
rate
s, M
atte
Ore
, Con
cent
rate
s,B
ase
Met
als
Gol
d, N
onm
ontr
y Ex
clud
ing
Ore
s
Whe
at, M
eslin
, Unm
illed
Cop
per
Ore
s, C
once
ntra
tes
Hid
es, S
kins
(Exc
ludi
ngFu
rs),
Raw
Zinc
Cot
ton
Ani
mal
Oils
and
Fat
s
Live
Ani
mal
s
Alu
min
ium
Milk
and
Cre
am
Alc
ohol
ic B
ever
ages
Rev
eale
d C
ompa
rati
ve A
dvan
tage
in E
xpor
ts

Australian Innovation System
Report 2
011
28
Chapter 3 shows that some services sectors, such as wholesale trade, are leading Australian firms in terms of the percentage of firms innovating. The higher education industry has shown an increased focus on international markets and offshore activities. This is an example of organisational innovation and entrepreneurship. Innovation has been critical for firms engaged in export markets. All exporting firms face challenges and opportunities when engaging in global markets. Innovation will be a key ingredient in sustaining export growth.
FEATURE 2: THE AUSTRALIAN MACROECONOMIC ENVIRONMENT
In describing the Australian innovation system, it is important to have some measure of the macroeconomic environment in which innovation in Australia is occurring. Fiscal and monetary policy, the regulatory environment, microeconomic reforms, as well as external shocks, such as the global financial crisis or spikes in the demand from particular industry sectors, are important for business investment decisions, including decisions to invest in innovation.71 This feature explores some specific characteristics of the macroeconomic environment to provide some context to the environment in which demand and supply of innovation are created.
The contributions of innovation to Australia’s Gross Domestic Product (GDP)GDP is a complex measure of the size of a nation’s economy, and when divided by the population gives an idea of the real income per person. GDP comprises consumption spending by both households and government, investment by both the public and private sectors, and net exports, which is the difference between exports and imports (Table 1.2). The combination of household and government spending on goods and services represents both a large market for innovation, and a significant demand signal triggering investment in innovation by Australian and multinational firms (See Chapter 3 for further discussion of demand). In other words, the size of the domestic market matters for innovation72.
Exports are also important as they open up new markets for domestically produced goods and services. This ensures that economic growth is not constrained by what domestic demand can support. The data in Chapter 3 of this report shows that innovators are twice as likely to export and four times more likely to increase targeting of export markets than non-innovators (Charts 3.2 and 3.3). Imports are also important to the competitiveness of Australian firms, providing access to critical inputs, including technology, and ensuring that innovation and economic growth are not constrained by what the domestic market can supply.
Table 1.2: Sectoral expenditure on GDP in current prices, 2009–10
Expenditure itemsValue
$ MillionsProportion
%
Final Consumption expenditure
Households 697,943 54.3%
General government 234,336 18.2%
Gross fixed capital formation
General government 53,538 4.2%
Public corporations 25,288 2.0%
Private 281,515 21.9%
Changes in inventories -748 -0.1%
(Exports)-(Imports) -5,151 -0.4%
Statistical discrepancy -2,051 -0.2%
GROSS DOMESTIC PRODUCT (GDP) 1,284,670 100.0%
Source: Australian Bureau of Statistics (ABS), 2010, Australian System of National Accounts 2009-2010 (Catalogue No. 5204.0)
71 OECD (2010) The OECD Innovation Strategy: Getting a head start on tomorrow, OECD Paris72 Acemoglu, D. and J. Linn (2004). Market Size in Innovation: Theory and Evidence from the Pharmaceutical Industry Quarterly Journal of Economics 119(3):
1049–1090

Chapter 1: The perform
ance of the A
ustralian Innovation System
29
Australian business units73 are grouped to 19 industry divisions according to the Australian and New Zealand Standard Industrial Classification (ANZSIC)74. The ‘services’ sector is often loosely referred to as the remaining sixteen ANZSIC industry divisions after deducting Agriculture, forestry and fisheries, Mining and Manufacturing. The combined services industries accounted for about 80% of industry gross value-added (GVA) and about 86% of total industrial employment in 2009–10, which is what prompts many commentators to call Australia a ‘services economy’ (Table 1.3). The three industry divisions Agriculture, Forestry and Fishing, Mining and Manufacturing accounted for only 20% of industry GVA and 14.1% of employment in total in 2009–10. However, when examining total exports of goods and services, these three industries contributed 74% (or $202 billion) in 2009–10 and all services sectors contributed 21% (or $53 billion). It should be noted that export data captures only part of all international engagement activities.75 Also, industries do not operate separately, but interact. Many services businesses providing critical inputs to the activities of other businesses across the economy, including exporting businesses. A 2010 report by ITS Global estimated the value of services that are embodied in Australia’s merchandise exports at around $35 billion for 2008-09, with growth predicted. Most of the services that were ‘embodied’ were property and business, transport and storage, and wholesale trade services.76
Table 1.3: Selected Industries, contributions to GVA, employment, exports, innovation and R&D
Industry (ANZSIC Division)
Percentage of Gross Value
Added (Basic prices) at June
2010 (%)
Employment Share as at
August Quarter 2010 (%)
Percentage of total exports in 2009–10
(%)
Percentage of firms
innovating in 2009–10
(%)
Share of total Australian
BERD in 2008–09
(%)
Financial and Insurance Services 10.6 3.5 0.5 49.1 12.1
Manufacturing 9.3 8.9 20.0 50.7 25.8
Mining 8.4 1.8 43.0 45.8 25.2
Professional, Scientific and Technical Services 7.3 7.6 0.7 49.2 14.9
Retail Trade 4.4 10.7 N/A 49.7 0.5
Information, Media and Telecommunications 3.3 1.9 0.7 48.9 4.9
Agriculture, Forestry and Fishing 2.3 3.4 10.1 32.5 0.9
Source: Australian Bureau of Statistics (ABS), 2010, Australian System of National Accounts 2009-2010 (Catalogue No. 5204.0); ABS (February 2011) Labour Force, Australia, Detailed, Quarterly (Catalogue No. 6291.0.55.003); ABS (2011) International Trade in Goods and Services, Australia (Catalogue No. 5368.0) – Table 3 Goods credits, original and ABS (2011) International Trade in Services by Country by State and by Detailed Services Category, Financial Year 2009–10 – Table 1.9 (Catalogue No. 5368.0.55.003) and DIISR calculations. Note that the exports goods and services categories are approximately in line with industry, but they are not exact; ABS (2011) Summary of IT use and innovation in Australia business, 2009–10 (Catalogue No. 8166.0); ABS (2010) Research and Experimental Development, Businesses, Australia (Catalogue No. 8104.0).
Another important link between innovation and GDP is through gross fixed capital formation, or investment. Businesses contribute to GDP growth, both in the current period and in future capacity, by investing in capital. Several data sets throughout this report77 infer that innovation-active businesses are more likely to invest in intangibles such as skills, acquisition of new technology or equipment, training and design than non-innovators. Intangible investment is crucial for productivity growth (see above and Feature 1).
73 There were just over 2.05 million actively trading business units (i.e. with GST role) in Australia at June 2009, of which 32.7% were companies, 29.5% were sole proprietors, 20.2% were trusts and 17.6% were partnerships. Just over 1.2 million business units (60%) were non-employing businesses while 4.1% employed 20–199 employees and 0.3% were large businesses with 200 or more employees. [ABS (2010) Counts of Australian Businesses, including entries and exits, June 2007 to June 2009. cat. no. 8165.0]
74 Australian Bureau of Statistics (2006) Australian and New Zealand Standard Industrial Classification 2006, cat. no. 1292.0 75 There are four modes through which services can be directly traded internationally, and export figures understate the level of services engagement.
The four modes are described below. – Cross-border trade. This form of trade most closely resembles goods trade — the service itself crosses national frontiers. Examples include an
architect sending design drawings to a consumer in a foreign country, or freight and insurance services. – Consumption abroad. This typically involves the movement of consumers across borders, perhaps for tourism or to attend an educational establishment.– Commercial presence. This involves a supplier establishing a foreign-based corporation, joint venture, partnership, or other arrangement to supply
services to people in the host country. Examples include the establishment of branch offices or agencies to deliver services such as banking, insurance, legal advice or communications.
– Presence of natural persons. This involves an individual temporarily travelling abroad to provide a service, for example, consultancy services.76 ITS Global (2010) Services International Linkages, available at <http://www.dfat.gov.au/publications/trade/Services-International-Linkages.pdf>77 Subsequent chapters show data suggesting that innovation-active businesses are more likely to invest in skills, intellectual property protection,
collaboration and ICT than non-innovation active businesses.

Australian Innovation System
Report 2
011
30
CHAPTER 2Research capacity and skill base
Australia’s human capital is the sum total of the skills, experience and inventiveness of everyone in the country. Human capital is deployed to create new sources of economic growth and new ways to address social and environmental challenges78 and centres on the level and quality of the workforce skill base. As our population ages and global markets become more competitive, Australia must therefore significantly improve foundation and higher level workforce skills to lift productivity and raise innovation levels.79 This requires workplace cultures that promote employee engagement, create high performance workplaces and learning organisations, encourage job flexibility and knowledge exchange, and provide incentives for innovation.
Many ideas that inspire transformative innovation are born from research particularly for development of new goods and services. Australia’s research capacity indicates how well our national innovation system is equipped to supply highly skilled researchers, productivity-enhancing knowledge and solutions to environmental and social challenges. Increasing the number of businesses investing in innovation requires more people with necessary research and technical skills to undertake R&D and operate and maintain world-class research infrastructure capabilities.80
In Powering Ideas the Australian Government set out its priorities for the nation’s research capacity and skill base, along with targets for its 10-year innovation agenda.
Priority 1: Public research funding supports high-quality research that addresses national challenges and opens up new opportunities. Target: The Australian Government’s ambition is to increase the number of research groups performing at world class levels, as measured by international performance benchmarks.
Priority 2: Australia has a strong base of skilled researchers to support the national research effort in both the public and private sectors. Target: The Australian Government’s objective is to significantly increase the number of students completing higher degrees by research over the next decade.
This chapter provides selected measures of Australia’s research capacity and skill base and its performance against other Organisation for Economic Co-operation and Development (OECD) countries. It summarises major achievements in addressing these priorities and the targets by Commonwealth, State and Territory governments. It also presents case studies illustrating the important role that higher education institutions and publicly funded research organisations (PFROs) play in the Australian innovation system by maintaining and improving national research capacity and the skills base.
Research capacity
Table 2.1 provides indicators on Australia’s research capacity. In 2008, Australia’s gross expenditure on research and development (GERD) increased 10.9% to 2.21% of gross domestic product (GDP) or $867 per capita (in current purchasing power parity PPP$). Despite this increase, Australia’s OECD ranking was little changed, at 12th and 14th respectively of thirty countries on these measures.
Governments are a major source of funds for R&D in OECD countries. Government-financed R&D indicates the amount of a country’s GERD directly funded by its governments at all levels – national, state and local. Australia’s government-funded GERD to GDP ratio increased slightly from 0.75% in 2006 to 0.77% in 2008. However, Australia’s ranking on this indicator remained the same, placing it 6th among OECD countries.
78 OECD (2011) Skills for Innovation and Research, OECD, Paris.79 Skills Australia (2010) Australian Workforce Futures: A national workforce development strategy, http://www.skillsaustralia.gov.au/PDFs_RTFs/WWF_
strategy.pdf 80 Australian Government (2011) Research Skills for an Innovative Future, http://www.innovation.gov.au/Research/ResearchWorkforceIssues/Documents/Rese
archSkillsforanInnovativeFuture.pdf

Chapter 2: R
esearch capacity and skill base
31
Government budget appropriations or outlays on research and development (GBAORD) provide a different measure of government support for R&D by counting only national government spending. Australia’s GBAORD accounted for 0.54% of GDP in 2009, an increase of 16.3% attributable to the Government’s Powering Ideas investment, but ranked 23rd of 27 OECD countries.81
R&D expenditure by universities and publicly funded research organisations (PFROs) shows the magnitude of a country’s investment in public research. Higher education expenditure on research and development (HERD) provides a measure of R&D performed in the higher education sector.82 Australia’s HERD accounted for 0.54% of GDP ($6.7 billion) in 2008, which ranked Australia 11th among OECD countries. Government expenditure on research and development (GOVERD) indicates the size of R&D performed in the government sector.83 Australia’s GOVERD was $3.4 billion, representing 0.27% of GDP in 2008, ranked 10th out of 30 OECD countries.
While R&D expenditure is a measure of research input, publications, on the other hand, can be used as one measure of research output. Australia produced 3.24% of the world’s total publications in 2009, a small increase on the previous year (the baseline), and ranking 9th among OECD countries (Table 2.1). Global research is dominated by the USA, which accounts for 28.6% of world publications. Of greater relevance to Australia is research output relative to underlying research capacity. One such indicator is the 402 publications per thousand researchers produced in 2009, ranking Australia 7th in the OECD.
Table 2.1: Australia’s performance in research capacity against other OECD countries
IndicatorsLatest Figure
Reference Year
OECD Ranking
(a)
Gap from the Top
Five OECD Performers
Baseline figure
Reference year
baseline figure
Change from
baselinefigure
GERD as a % of GDP [1] 2.21% 2008 12th 41.4% 2.00%(r) 2006 10.9%
GERD per capita (current PPP$) [1] $867 2008 14th 37.5% $740(r) 2006 17.1%
Government-financed GERD as a % of GDP [1] 0.77% 2008 6th 14.1% 0.75%(r) 2006 3.1%
GBAORD as a % of GDP [1] 0.54%(nd) 2009 23rd 49.9% 0.54%(r) 2009 -
HERD as a % of GDP [1] 0.54% 2008 11th 26.1% 0.50%(r) 2006 7.7%
GOVERD as a % of GDP [1] 0.27% 2008 10th 30.1% 0.28% 2006 -3.8%
Number of fields where Australian Universities have a National Research Strength [3]
19 2010 n/a n/a 19 2010 -
Share of world publications [2] 3.24% 2009 9th 71.1% 3.18% 2008 1.9%
Publications per thousand researchers [2] 402(nd) 2008 7th 31.5% 402(r) 2008 -
Citations per publication [2] 5.50 2005–09 18th 25.9% 5.24(r) 2004–08 5.0%
Relative impact of publications [2] 1.15 2005–09 18th 26.1% 1.13 2004–08 1.8%
Number of fields with higher than world average citation rate by field* (2)
18 2005–09 n/a n/a 18(r) 2004–08 No change
Share of highly cited (top 1%) scientific articles worldwide [4] 4.3%(nd) 2006–08 9th 75.3% 4.3% 2006–08 -
Sources: [1] OECD, Main Science and Technology Indicators database, 2010/2. [2]Thomson ISI, National Science Indicators database, 2010. [3] ARC (2010) ERA 2010 Outcomes-National Overview, [4] OECD, Measuring Innovation: A new perspective 2010.Notes: Indicators with * and in the figures in the coloured rows of the table are the primary indicators applied to measure and monitor progress against the Australian Government’s innovation targets. Note that some of the previous report’s bibliometric indicators from Thompson ISI database have been revised. (a) OECD rankings are performed on those OECD countries for which data is available. Individual data availability may vary between indicators. (nd) No new data (r) The baseline has been revised according to the latest available data. n/a = not available. – = not applicable.
81 The GBAORD/GDP ratio was significantly revised – both numerator and denominator – by the OECD from the baseline figure published in the Australian Innovation System Report 2010.
82 The OECD definition of the higher education sector encompasses universities and other institutions of post-secondary education regardless of their source of finance or legal status. The scope of the ABS R&D survey in the higher education sector is based on the OECD definition, but excludes colleges of Technical and Further Education.
83 The general government sector comprises all government units of the Commonwealth, State and Territory governments and each local government authority, and all resident non-market, non-profit institutes (NPIs) that are controlled and mainly financed by those governments. The scope of the ABS R&D survey in the government sector is based on the OECD definitions, including organisations such as CSIRO, ANSTO, and Geoscience Australia.

Australian Innovation System
Report 2
011
32
Establishing the value of research publications and assessing their direct or indirect effects is considerably more complex. The Excellence in Research for Australia (ERA) initiative shows that there were 19 out of 131 fields of research where Australian universities performed ‘well above world standard’. That is, four or more Australian universities had the highest rating for research excellence in those fields (further details on ERA are below).84 Another relevant indicator is Australia’s share of the world’s most highly cited scientific research papers. Australia ranks 9th in the world at 4.3% but is well behind the top five OECD countries, including the USA which produces almost half of the world’s most highly cited scientific articles (48.8%). Citations per publication are indicative of the attention a research project has attracted. By this measure Australia ranked 18th in the OECD over the five year period 2005–09, despite a 5% increase in citations of Australian research compared with the baseline period. The relative impact of Australia’s publications is the ratio of the national citation average to the world average – over the same five year period, Australia’s OECD rank against this measure was also 18th.
Another (proxy) indicator of the impact of Australia’s research publications is measured by the number of research fields in which Australia has a higher citation rate than the world average in the given field. In fields where this is achieved, it is suggestive of a country’s relative strength in international research. Australia achieved this in 18 of 22 research fields over the five year period 2005–09, noting that three other fields were at or close to world average (Chart 2.1). Further analysis is required to establish the alignment between Australia’s research strengths and comparative innovation advantages of Australian industry sectors.
Chart 2.1: Relative impacts of Australian scientific publication – by research field, 2005–09
Source: Thomson ISI, Essential Science Indicators database, 2011. The relative impact of Australian research publications is calculated as the number of citations per Australian publication divided by the number of citations per world publication by field of research over the period, 2005–09.
84 See ERA 2010 Outcomes-National Overview http://www.arc.gov.au/pdf/ERA_2010_national_fact.pdf
1.01
1.04
1.05
1.09
1.09
1.10
1.10
1.14
1.15
1.17
1.17
1.18
1.23
1.24
1.26
1.28
1.28
1.30
0.80
0.95
1.00
1.00
0 0.2 0.4 0.6 0.8 1 1.2 1.4
Economics & Business
Neuroscience & Behavior
Social Sciences, general
Multidisciplinary
Psychiatry/Psychology
Immunology
Computer Science
Agricultural Sciences
Engineering
Molecular Biology & Genetics
Biology & Biochemistry
Chemistry
Mathematics
Microbiology
Materials Science
Pharmacology & Toxicology
Environment/Ecology
Clinical Medicine
Physics
Space Science
Plant & Animal Science
Geosciences
Relative impact
Relative Impact > 1 Relative Impact ≤ 1

Chapter 2: R
esearch capacity and skill base
33
Skill base
A country’s skill base is commonly indicated by the number and type of highly qualified people in the workforce, assessed by the proxy measure of educational attainment.
The structure of educational attainment in Australia has changed significantly in a relatively short period, as Chart 2.2 shows. In 1997, just 24% of the working population aged 25 to 64 years had a tertiary education qualification, while for 47% their highest level of education was below upper secondary school level. The highest educational attainment of the remaining 29% was upper secondary school or a post-secondary qualification in the non-tertiary higher education sector. By 2008 tertiary-educated individuals accounted for 36% of 25 to 64 year olds, with the sub-upper secondary proportion falling to 30%.
This structural change in Australia’s human capital reflects both a supply side push as government policy significantly increased the number of places offered at tertiary institutions and a demand-side pull as Australian firms move up the value chain and become more knowledge-intensive. The workforce absorbed this increase in graduates as employers raised the skill and qualification levels required across the labour market.
Chart 2.2: Educational attainment of the Australian population aged 25 to 64 years, 1997 to 2008
Source: OECD, Education at a Glance 2010
A proxy indicator for the unskilled is the proportion of Australians aged 25 to 64 years having educational attainment that is below the level of upper secondary school. As shown in Chart 2.2, this proportion has fallen from 47% in 1997 to 30% in 2008 and is part of an OECD wide trend.
The Australian Government’s Productivity Agenda aims to increase Year 12 completion rates to 90% by 2015. A KPMG Econtech report estimated that this could contribute a 0.6% gain in labour productivity from 2010 to 2040.85 An intermediary skills indicator is the proportion of the population whose highest educational attainment is upper secondary school or equivalent vocational education or training. For Australia, this was 34% in 2008, 7th lowest in the OECD.
Table 2.2 presents a summary of Australia’s skill base compared with other OECD countries. Australia is among the top one-third of OECD countries for gross expenditure on tertiary education, proportion of population with a tertiary qualification, new PhDs, and professionals and technicians in total employment. Australia’s performance is more moderate on indicators of public investment in tertiary education, new graduates with science and engineering qualifications, R&D personnel in total employment, and researchers in the total labour force. Australia’s gap from the average of the top five OECD countries ranges between 8.6% for professionals and technicians in total employment and 49.4% for public expenditure on education as a proportion of the GDP.
Australia’s total tertiary education expenditure as a share of GDP accounted for 1.55% of GDP in 2007, a fall of 5.2% on the previous year, ninth among 28 OECD countries and 34.6% below the average of the OECD top five (USA, Canada, Korea, Chile and Denmark).
85 KPMG Econtech (2010), ‘Measuring the Impact of the Productivity Agenda’, Final Report, February, p. vii.
0
5
10
15
20
25
30
35
40
45
50
1997 1998 1999 2000 2001 2002 2003 2004 2005 2006 2007 2008
Per
cent
age
Below upper secondary
Upper secondary and post-secondary non-tertiary
Tertiary education
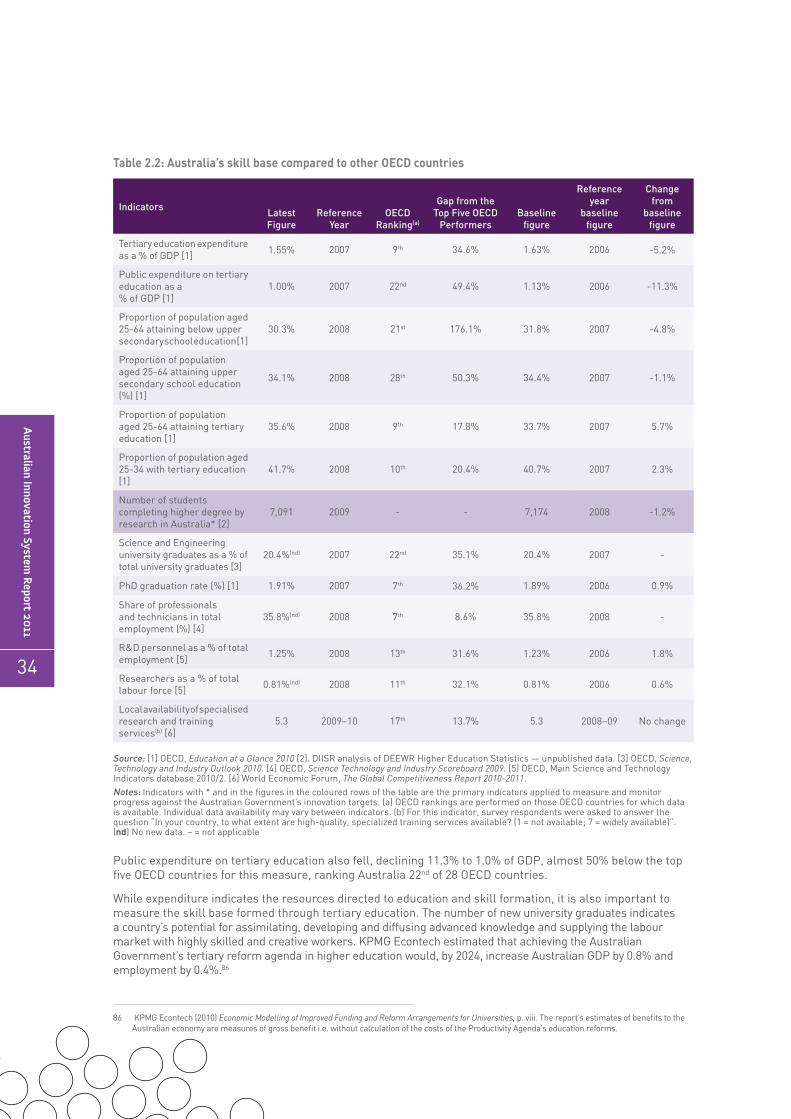
Australian Innovation System
Report 2
011
34
Table 2.2: Australia’s skill base compared to other OECD countries
Indicators Latest Figure
Reference Year
OECD Ranking(a)
Gap from the Top Five OECD
PerformersBaseline
figure
Reference year
baseline figure
Change from
baselinefigure
Tertiary education expenditure as a % of GDP [1] 1.55% 2007 9th 34.6% 1.63% 2006 -5.2%
Public expenditure on tertiary education as a % of GDP [1]
1.00% 2007 22nd 49.4% 1.13% 2006 -11.3%
Proportion of population aged 25-64 attaining below upper secondary school education [1]
30.3% 2008 21st 176.1% 31.8% 2007 -4.8%
Proportion of population aged 25-64 attaining upper secondary school education (%) [1]
34.1% 2008 28th 50.3% 34.4% 2007 -1.1%
Proportion of population aged 25-64 attaining tertiary education [1]
35.6% 2008 9th 17.8% 33.7% 2007 5.7%
Proportion of population aged 25-34 with tertiary education [1]
41.7% 2008 10th 20.4% 40.7% 2007 2.3%
Number of students completing higher degree by research in Australia* [2]
7,091 2009 - - 7,174 2008 -1.2%
Science and Engineering university graduates as a % of total university graduates [3]
20.4%(nd) 2007 22nd 35.1% 20.4% 2007 -
PhD graduation rate (%) [1] 1.91% 2007 7th 36.2% 1.89% 2006 0.9%
Share of professionals and technicians in total employment (%) [4]
35.8%(nd) 2008 7th 8.6% 35.8% 2008 -
R&D personnel as a % of total employment [5] 1.25% 2008 13th 31.6% 1.23% 2006 1.8%
Researchers as a % of total labour force [5] 0.81%(nd) 2008 11th 32.1% 0.81% 2006 0.6%
Local availability of specialised research and training services(b) [6]
5.3 2009–10 17th 13.7% 5.3 2008–09 No change
Source: [1] OECD, Education at a Glance 2010 [2]. DIISR analysis of DEEWR Higher Education Statistics — unpublished data. [3] OECD, Science, Technology and Industry Outlook 2010. [4] OECD, Science Technology and Industry Scoreboard 2009. [5] OECD, Main Science and Technology Indicators database 2010/2. [6] World Economic Forum, The Global Competitiveness Report 2010-2011.Notes: Indicators with * and in the figures in the coloured rows of the table are the primary indicators applied to measure and monitor progress against the Australian Government’s innovation targets. (a) OECD rankings are performed on those OECD countries for which data is available. Individual data availability may vary between indicators. (b) For this indicator, survey respondents were asked to answer the question “In your country, to what extent are high-quality, specialized training services available? (1 = not available; 7 = widely available)”. (nd) No new data. – = not applicable
Public expenditure on tertiary education also fell, declining 11.3% to 1.0% of GDP, almost 50% below the top five OECD countries for this measure, ranking Australia 22nd of 28 OECD countries.
While expenditure indicates the resources directed to education and skill formation, it is also important to measure the skill base formed through tertiary education. The number of new university graduates indicates a country’s potential for assimilating, developing and diffusing advanced knowledge and supplying the labour market with highly skilled and creative workers. KPMG Econtech estimated that achieving the Australian Government’s tertiary reform agenda in higher education would, by 2024, increase Australian GDP by 0.8% and employment by 0.4%.86
86 KPMG Econtech (2010) Economic Modelling of Improved Funding and Reform Arrangements for Universities, p. viii. The report’s estimates of benefits to the Australian economy are measures of gross benefit i.e. without calculation of the costs of the Productivity Agenda’s education reforms.

Chapter 2: R
esearch capacity and skill base
35
Around 35.6% of Australians aged 25 to 64 had a tertiary education qualification in 2008, an increase of 5.7% on 2007. This is the result of a high proportion of 25 to 34 year-olds with tertiary qualifications (41.7%). The Australian Government’s tertiary reform agenda has a goal of increasing the proportion of 25 to 64 year old cohort with a bachelor qualification, or higher, to 40% by 2025. Compared to 31 other OECD countries, Australia ranked 9th for the group aged 25 to 64 and 10th for 25 to 34 year olds.
The number of students who complete higher degrees by research provides a pointer to the future supply of research workers. In Powering Ideas, the Government set a target to significantly increase the number of students completing higher degrees by research (HDRs) over the next decade.87 Chart 2.3 shows that since 1998 the number of students completing HDRs in Australia increased by 41%, to 7,174 students in 2008 before declining slightly in 2009. While Australian HDR graduates increased 27% over this period, the number of HDR graduates from overseas almost doubled, from 961 to 1,849. It is notable that overseas students now comprise 26% of all HDR completions in Australia’s universities, compared with 19% in 1998.88 To the extent that many overseas students leave the country after completing their studies, an increase in Australia’s research capacity should not be solely dependent on international graduates.
Chart 2.3: Number of students completing higher degrees by research, 1998 to 2009
Source: DEEWR, Award course completions 2009: selected higher education statistics.
Science and engineering skills are particularly important to R&D.89 In 2007, new university graduates with a science and engineering degree accounted for approximately 20.4% of new university graduates in Australia. This is relatively low by international standards, ranked 22nd out of 30 OECD countries. At the typical age of graduation, around 1.9% of the population in Australia completed a doctoral degree in 2007, ranked 7th among 30 countries. When the PhD graduation rate is adjusted to focus on domestic students only Australia’s ranking falls to 1.5% and 8th among 22 OECD countries.
The stock of workers employed in professional and technical occupations is a measure of the highly qualified section of the labour force, which is of critical importance to innovation performance. In 2008, workers in professional and technical occupations comprised 35.8% of total employment in Australia, ranking seventh in the OECD.
87 Higher degrees by research (HDRs) are Doctorate by Research and Master’s by Research.88 See Chapter 1 for a short discussion of the international education industry.89 OECD (2011) Skills for Innovation and Research, OECD, Paris
Overseas Domestic
0
1,000
2,000
3,000
4,000
5,000
6,000
7,000
Num
ber
of s
tude
nts
8,000
1998 1999 2000 2001 2002 2003 2004 2005 2006 2007 2008 2009
4118 4327 4461 4523 4805
5158 5081 5359 5423 5371 5379 5242
961 995 970 1003
1034
1162 1388 1450
1671 1767 1795 1849

Australian Innovation System
Report 2
011
36
R&D personnel and researchers, expressed as a share of total employment or the labour force, enables comparison of human resources devoted to R&D activities. In 2008, 1.25% of total employment was related to R&D activities, while researchers accounted for 0.81% of total labour force ranking Australia 13th and 11th, respectively, in the OECD in these two indicators.
Where do the skills for innovation come from?
The provision of human capital, skills and competence is a pivotal activity of the innovation system and a lack of skills is a persistent, large barrier to innovation in Australia (Chapter 3). Official data on sources of labour for innovation show that when businesses innovate they resort in the first instance to the existing skills of their employees (Chart 2.4). This is particularly the case for large firms where more than 93% indicated using personnel from the business or related company (81% for all business sizes). Two important factors reinforce this trend. Firstly, most firms do not have a dedicated unit or department for innovation. Second, innovation requires the integration of skills from different areas within an organisation to assemble multi-disciplinary ‘innovation teams’.90 In addition, innovation is not always initiated or driven by engineering or R&D areas – management and marketing/sales departments are often important, not only in starting innovation projects, but also for providing critical analysis on the commercial potential of these projects. As Feature 3 shows, innovation-active firms (more than non-innovation-active firms) are strong users of a range of skills for innovation including vocational skills. More importantly, management plays the key role in driving innovation and productivity in the organisation. Management Matters91 and other reports92 find that well-managed firms tend also to exhibit superior innovation capabilities.
Chart 2.4: Australian sources of labour for innovation in innovation-active business, 2008–09
Source: ABS (2010), Innovation in Australian Business, 2008–09, cat. No. 8158.0.
Australian Bureau of Statistics data also shows that the size of the firm matters when it comes to sourcing skills for innovation. Small and medium enterprises (SMEs) tend to be less active in hiring graduates or contracting consultants from higher education institutions when they are undertaking innovation. Interestingly, micro-firms (0-4 employees) are the type of business more willing to employ skills from the business’s collaboration partners.
90 This trend was also found when examining factors explaining the variation of R&D expenditure and personnel (see Department of Industry, Tourism and Resources (2007) High variation of R&D expenditure by Australian firms, Canberra, Australia)
91 Green R (2009) Management Matters in Australia: Just how productive are we? Findings from the Australian Management Practices and Productivity global benchmarking project, Commissioned by the Department of Innovation, Industry, Science and Research, Canberra.
92 Samson D (2010) Innovation for business success: Achieving a systematic innovation capability, Report prepared for the Department of Innovation, Industry, Science and Research, Canberra.
81
22 18
11
0
10
20
30
40
50
60
70
80
90
Persons already withinthe business or
related company
Employ any new personsincluding graduates
Contractors/Consultantsfrom other organisations
(including higher education)
Persons employed bythe business's
collaboration partners
Per
cent
age
of r
espo
nden
ts

Chapter 2: R
esearch capacity and skill base
37
FEATURE 3: THE ROLE OF VOCATIONAL EDUCATION AND TRAINING IN INNOVATION
The concept of an innovation system encompasses the competence building activities necessary for an organisation to innovate and this goes beyond a purely R&D focus on innovation. A major component of competence building is developing the skills base necessary to identify, create, transform and implement innovations. If the predominant form of innovation in firms is adaptation and modification (Chapter 1) the broader workforce has a central role in the generation, adaptation and diffusion of technical and organisational change in the firm.93,94 A lack of skilled people is consistently one of the highest barriers to innovation in Australia (Chapter 3). Chart 2.5 shows that skills shortages reported by innovation-active Australian businesses are highest in trades and technicians, marketing, finance-related, information technology and business management, all of which are vocational education and training (VET) sector95 core business fields. Rather than innovation being nurtured in the complex technologies surrounding these skills, it is the way they are developed as tools for problem-solving, communication and team-work that makes them drivers for improved productivity and workplace capacity.96 In this context the VET sector increasingly plays an important role in the national innovation system, as indicated by the relatively high number of enrolments (Chart 2.6) and increasing completions (Table 2.3). 97
Chart 2.5: Skill shortages or deficiencies in undertaking core business activities in Australia, by innovation status, 2008–09
Source: ABS (2011) Selected characteristics of Australian businesses, 2008-09. cat. no. 8167.0
93 Toner P (2011) Workforce skills and innovation: An overview of major themes in the literature, OECD/CERI working paper series. SG/INNOV(2011)194 Skills Australia (2010) Creating a future direction for Australian vocational education and training: A discussion paper on the future of the VET system, Skills
Australia, Canberra95 The VET sector is a diverse space with many different activities across Australia. A national policy approach in the past decade has been to open up the
training market through contestable funding for registered public and private training providers. Within states and territories numerous programmes and initiatives have been implemented to meet local and regional needs. At the core of the accredited VET system are nationally recognised units of competency and qualifications specified in national training packages of which approximately 70 exist. See OECD/CERI (2009) Systemic Innovation in the Australian VET System: Country Case Study Report, OECD, Paris
96 Stanwick J & Loveder P (2010) Skills for innovation, Issues paper for the National Centre for Vocational Education Research, Adelaide.97 Smith A, Courvisanos J, Tuck J & McEachern S (2011) Building innovation capacity: the role of human capital formation in enterprises, NCVER, Australia
Innovation-active businesses
Non Innovation-active businesses
2.4
1.2
3.4
2.6
10.5
1.8
5.9
3.3
4.3
5.9
1.5
0.5 1.1 1.1
8.1
1.0
2.4
1.0
1.9 2.1
0
2
4
6
8
10
12
Engi
neer
ing
Scie
ntifi
c an
dre
sear
ch
IT p
rofe
ssio
nals
IT s
uppo
rtte
chni
cian
s
Trad
es
Tran
spor
t, p
lant
and
mac
hine
ry o
pera
tion
Mar
keti
ng
Pro
ject
man
agem
ent
Bus
ines
sm
anag
emen
t
Fina
ncia
l
Per
cent
age
of r
espo
nden
ts

Australian Innovation System
Report 2
011
38
Chart 2.6: Number of student enrolments in Vocational Education and Training, 2000–2009
Source: NCVER (2010), Australian vocational education and training statistics, Students 2009, NCVER VET Collection
In 2009 there were 1.7 million students enrolled in the public Vocational Education and Training (VET) system. In 2009 around one in nine people aged 15 to 64 years participated in the publicly funded VET system in Australia. The number of qualifications completed in 2009 was 436,100 (71.5%). Most qualifications completed were at certificate III level (40.4%).98
Table 2.3: Full-year training equivalents by subject result, 2005–09
Subject result2005(’000)
2006(’000)
2007(’000)
2008(’000)
2009(’000) %
% change
from 2008
Assessed-passed 352.5 360.9 388.3 407.1 436.1 71.5 7.1
Recognition of prior learning 13.5 17.1 19.9 26.2 34.4 5.6 31.1
Recognition of current competency - - 0.4 0.4 0.7 0.1 94.1
Recognition of prior learning/current competency – not granted - - 0.3 0.6 1.0 0.2 72.2
Assessed – failed 41.1 40.7 45.1 46.4 52.7 8.6 13.5
Withdrawn 56.8 58.8 60.8 60.9 60.7 10.0 -0.4
Continuing studies 12.5 13.3 - - - - na
Not assessed – completed 23.8 22.6 24.4 24.3 21.3 3.5 -12.5
Not assessed – not completed 2.7 3.5 2.5 2.4 2.7 0.4 15.9
Total full-year training equivalents 502.8 516.8 541.8 568.4 609.6 100 7.3
Source: NCVER (2010), Australian vocational education and training statistics, Students 2009, NCVER VET Collection
98 NCVER Students and Courses 2009
ACT
NT
Tas.
WA
SA
Qld.
Vic.
NSW
0.0
0.2
0.4
0.6
0.8
1.0
1.2
1.4
1.6
1.8
2.0
2000 2001 2002 2003 2004 2005 2006 2007 2008 2009
Num
ber
of V
ET e
nrol
men
ts, m
illio
n

Chapter 2: R
esearch capacity and skill base
39
The wide dispersal of VET institutes and their focus on the more immediate skills needs of local and regional business communities allows innovation to be dispersed rapidly and effectively without reliance on more rigid channels of knowledge flow which do not take local circumstances into account.99 Similar to the role that VET institutes played in the formation and success of Silicon Valley and many other innovative clusters in the US, VET institutes in Australia show a strong commitment to innovative practice and the development of an innovative culture. There are several examples of technical and further education (TAFE) collaboration across state boundaries to form national centres of excellence. These provide a new source of complementary skills for applied R&D for particular industry sectors.100
Recent research relating to VET and innovation
The Department of Education, Employment and Workplace Relations (DEEWR) commissioned the University of Western Sydney to undertake research to identify strategies aimed at improving the innovation performance of Australia’s R&D organisations’ workforces. The study identifies the gaps in the practical skills and knowledge base of technician and trade occupations working in R&D laboratories. This information will assist training institutions such as TAFE to improve training provision for these occupations. The study also examines the extent to which job design and the organisation of work within R&D laboratories, fully utilises the contribution of these occupations to innovation within the laboratory101. DEEWR also commissioned the National Centre for Vocational Education Research (NCVER) to develop a book of readings drawn from the works of a number of authors focusing on innovation. A working title is “Fostering enterprise: the innovation and skills nexus – research readings” scheduled to be published mid 2011 and will be available from the National Centre for Vocational Education Research.102
Innovation and investment in training
The Australian Government has already allocated $10.9 billion to the VET sector, including $810 million for capital works to upgrade and modernise hundreds of training facilities across the country. In the 2011–12 Budget, the Government committed to enhance ongoing reforms to the VET sector to make the system more productive by expanding capacity and lifting quality of the training outcomes. The Government will work with states and territories to renegotiate the $1.46 billion National Agreement for Skills and Workforce Development and introduce a National Partnership to reform the VET system. Based on the level of reform that States and Territories commit to, an additional funding of $1.75 billion over five years from 2012-13 will be available for the new reform focussed National Partnership agreement. This will help drive a new, modern national training system. The development of a more flexible, responsive training system will help to ensure that employers, including small businesses, will benefit from the improved availability of people with the skills they require.
DEEWR continues to facilitate pilot programs that encourage greater engagement between VET institutions and Australian businesses to encourage local innovative workforce and productivity solutions.
Auto Skills Australia was established in December 2010 as a subsidiary of Manufacturing Skills Australia. Auto Skills Australia will be responsible for the national training advisory arrangements for the Australian automotive industry. The establishment of Auto Skills Australia will enable the automotive industry to support the industry’s current and future skills and training needs with focus and autonomy long desired by the industry and within the policy framework of the national training advisory arrangements.
99 Moodie G (2006) Vocational education institutions’ role in national innovation, Research in Post-Compulsory Education 11(2): 131-40100 TAFE Directors Australia (2008) The Key to the Knowledge Economy is Innovation and Applied Learning, TAFE Directors Australia Response to the Review
of the National Innovation System, http://www.tda.edu.au/resources/TAFE_Directors_Aust_response_to_Government-Cutler_Innovation_Review-Feb_2009.pdf [Accessed 7 January 2011]
101 Toner P, Turpin T, Woolley R & Lloyd C (2011) The Role and Contribution of Tradespeople and Technicians in Australian Research & Development – An Initial Study, Department of Education, Employment and Workplace Relations, Canberra.
102 http://www.ncver.edu.au/publications/duesoon.html

Australian Innovation System
Report 2
011
40
A major investment by the Australian Government is The Critical Skills Investment Fund (CSIF). This initiative provides $200 million in Australian Government co-funding for industry partnerships to undertake projects that provide training and employment opportunities in critical industry sectors to help increase the supply of skilled labour for enterprises in these sectors. To achieve this, CSIF supports projects that train and place job seekers into available positions or up-skill existing workers to meet new demands.
Another Australian Government initiative is The Skills for the Carbon Challenge initiative. This aims to provide national leadership in building the capacity of the tertiary education sector to supply the skills needed for workers and businesses to prosper in a sustainable, low-carbon economy. Under this initiative, the Australian Research Institute for Environment and Sustainability (ARIES) developed a three-hour teaching module (Country & Sustainability: Applied Holistic Thinking from an Aboriginal Perspective) that can be inserted across a tertiary education curriculum.
Government initiatives that build research capacity and skills base
Governments across Australia make significant investments in research capacity and skills base development through a range of initiatives (Figure 2.1) that:
› Create the research infrastructure to support Australia’s research efforts;
› Fund, undertake or raise the quality of research activities that address national or regional government priorities;
› Foster greater knowledge exchange and engagement between research organisations and community, government and business sectors; and
› Provide a skilled and creative workforce and fill critical skills gaps in the economy.
A large number of research and skills innovation initiatives were detailed in the 2010 Australian Innovation System Report and up-to-date details of all Commonwealth, State and Territory research and skills development programs can be found by exploring the Australian Government’s www.business.gov.au, www.deewr.gov.au/Skills, www.arc.gov.au and www.grantslink.gov.au websites. The objectives of these initiatives align well with the Australian Government’s National Innovation Priorities 1 & 2. For example, the ARC Centres of Excellence are prestigious hubs of expertise through which high-quality researchers maintain and develop Australia’s international standing in research areas of national priority. The outcomes of the selection round for funding commencing in 2011 were finalised in July 2010. The 13 new ARC Centres of Excellence will share in $255.9 million over seven years and cover research fields such as astrophysics, climate system science, population ageing and quantum technology.
Although the programs in Figure 2.1 are not exhaustive they show a considerable spread of initiatives across all four themes presented here. Total investments in education are significant, with Australian Government investments alone totalling $32.6 billion in 2010–11103. The following is an update on policy developments in existing research and skills programs and an introduction of new initiatives announced since the last report.
103 Australian Government (2011) Budget Paper number 1. Statement 6 – General government sector expenses, www.budget.gov.au/2011–12/

Chapter 2: R
esearch capacity and skill base
41
Figure 2.1: A map of submitted government initiatives that build Australia’s research capacity and skills base
Notes: State and Territory initiatives are highlighted in purple. This figure does not present all government initiatives that build research capacity and skills base and is intended as an indicative analysis only. These initiatives presented here are not scaled by size of funding or stakeholder coverage. Programs are mapped by objectives. The reader is encouraged to search the above websites or the AIS website to find out more about each initiative.
Publicly funded Research Agencies, e.g. AAO, AIATSIS, AIMS, ANSTO, CSIRO, DSTO
Australian Research Council Linkage Program
Mission-based Compacts
Cooperative Research Centres
Western Australian Centres of Excellence in Science and Innovation Program (WA)
Queensland research and development investment strategy 2010-2020 (Qld)
Western Australian Conservation Science Centre (WA)
Victoria’s Science Agenda (Vic)
Australian Antarctic Program
Australian Space Science Research Program
NHMRC fellowships, Program grants and Centres Research Excellence
Water for the Future
Industry Innovation CouncilsExcellence in Research for Australia
QuestaconARC Discovery Program
NHMRC Project GrantsOffice of the Chief Scientist
Research Workforce Strategy Commercialisation Training Scheme
NHMRC TRIP Fellowships
Royal Institution of Australia
NHMRC Practitioner Fellowships
Science Leveraging Fund (NSW)
Victoria Prize & Fellowships (Vic)
Queensland International Fellowships (Qld)
Health and FoodSciences Precinct (Qld)
Research Training Scheme Rapid Prototyping, Development and Evaluation
NHMRC Development Grants
Australian National Low Emissions Coal R&D Agency
Stem Cells Australia
Forest Industries Climate Change Research Fund
Transport Development and Innovation Projects
Australian Solar Institute
National Environmental Research Program
Smart Infrastructure Awards
Goyder Institute for Water Research (SA)
Mawson Institue (SA)
Victorian Endowment for Science, Knowledge and Innovation (Vic)
ARC Centres of Excellence and Special Research Initiatives
Co-funded Centres e.g. Australian Centre for Plant Functional Genomics and National Centre for Groundwater Research and Training
Investments in universities and vocational education & training (all Australian governments)
National ICT Australia (Australian, ACT, NSW, Vic and Qld governments)
Translational Research Institute (Qld)
SkillsAustralia
Skilling Australia’sDefence Industry
NHMRC Infrastructure support initiatives
Research InfrastructureBlock Grants
Sustainable ResearchExcellence
Education InvestmentFund
AustralianSynchotron
Super Science investments
SMART InfrastructureFacility (NSW)
Elizabeth MacarthurAgricultural Institute
Upgrade (NSW)
National MeasurementInstitute
National CollaborativeResearch Infrastructure
Strategy
Critical Skills Investment Fund
Skills for the Carbon Challenge
Skilling Australiafor the Future
Workplace InnovationProgram
Innovation Fund
RESEARCH & RESEARCH TRAINING KNOWLEDGE EXCHANGE BROADER SKILLS DEVELOPMENT RESEARCH INFRASTRUCTURE
Australian Innovation System
Report 2
011
42
Research workforce strategy
The Australian Government’s Research Workforce Strategy, Research Skills for an Innovative Future Future to Cover the Decade 2020 and Beyond 104, was launched on Tuesday, 19 April 2011. The strategy aims to strengthen the nation’s research workforce to 2020 and beyond. The Government’s vision for 2020 is of a strong and productive Australian research workforce, comprising the scale, breadth and depth of skills required to support innovation, educate the next generation of Australians, and ultimately drive productivity improvements across the economy. It is underpinned by seven aspirations that are closely aligned with, and will directly support, the Government’s seven Powering Ideas innovation priorities, particularly Priority Two.
› Australian firms have access to the research skills and experience that will enable them to move up the value-chain and be globally competitive.
› Australia’s public sector research organisations have a sufficient research skills base to support their diverse roles.
› Australia’s HDR graduates have the skills and attributes to both engage in world-class research and make productive contributions in a wide spectrum of professional roles.
› Australian universities, as the major providers of research training in Australia, have sufficient numbers of research qualified staff to develop the next generation of researchers.
› Australian research students, researchers and research support staff are provided with clear and equitable pathways for career progression and supported to meet individual career needs and objectives.
› Australian research employers have in place the communication channels and linkages which promote the effective diffusion of knowledge (both codified and tacit) across the economy.
› Australia effectively draws on and harnesses the potential contributions of all research qualified individuals and facilitates participation in and engagement with the research workforce.
The Government is already providing incentives to increase participation in Australia’s research workforce. Initiatives such as the introduction of the Researchers in Industry Training Awards Scheme and the announcement of the Aboriginal and Torres Strait Islander Researchers’ Network, both to be administered by the ARC. More will be done to develop policies that facilitate researcher mobility and allow Australia to meet the anticipated demand for research skills to 2020 and beyond.
The development and deployment of Australia’s research workforce is a shared responsibility and the Government cannot achieve it alone. The Government will work collaboratively with the sector to implement the strategic framework and it is important that other players such as universities, research agencies, industry, professional associations and students all contribute. Shorter and longer term priorities will be addressed.
The Research Workforce Strategy will provide a framework for Australia to address priorities for its research workforce such as: the development of new models for research training, including those that explicitly focus on the professional training needs of graduates; strengthening of the quality of supply through Australia’s research training system; and enhancement of the attractiveness of research careers in Australia. These initiatives will contribute to Australia’s ability to maintain its strength in attracting international research talent.
Excellence in Research for Australia
Excellence in Research for Australia (ERA) evaluates the quality of research undertaken in Australian higher education institutions by discipline, using a range of discipline-specific indicators, and compares Australia’s research effort against international benchmarks. ERA provides an evaluation framework that gives government, industry, business and the wider community assurance of the excellence of research conducted in Australia’s higher education institutions. ERA findings inform government policy decisions and investment to support improvements in Australia’s research capacity.
The first full round of ERA occurred in 2010, culminating in the release of the ERA 2010 National Report on 31 January 2011. The Report outlines the performance of the 41 institutions who participated in ERA 2010, in each of the research disciplines, using a one to five point rating scale (five being the highest rating for excellence, and a rating of three or above is world standard, and an excellent outcome). National Research Strengths for Australia (which are defined as four or more institutions receiving a 5 at the four-digit discipline level) in ERA 2010 are:
104 http://www.innovation.gov.au/Research/ResearchWorkforceIssues/Documents/ResearchSkillsforanInnovativeFuture.pdf

Chapter 2: R
esearch capacity and skill base
43
› Astronomical and Space Sciences;
› Cardiovascular Medicine and Haematology;
› Clinical Sciences;
› Ecology;
› Electrical and Electronic Engineering;
› Evolutionary Biology;
› Geology;
› Historical Studies;
› Human Movement and Sports Science;
› Immunology;
› Macromolecular and Materials Chemistry;
› Medical Physiology;
› Oncology and Carcinogenesis;
› Optical Physics;
› Pharmacology and Pharmaceutical Sciences;
› Physical and Structural Chemistry;
› Plant Biology;
› Quantum Physics;
› Zoology.
Another round of ERA is scheduled for 2012. The 2012 process will allow for the establishment of trend data about research performance over time and provide additional valuable information about where to guide research investment. To ensure that the evaluation exercise remains robust and current for 2012, the ARC has implemented a range of improvements to ERA’s methodology, based on feedback from broad and targeted reviews of the indicators and processes used for ERA 2010.
Discovery Early Career Researcher Award
The new Discovery Early Career Researcher Award scheme, administered by the ARC, will provide career opportunities for early-career researchers, and a flexible assessment process to improve the success rate of early-career researchers and to improve gender equity at this early stage. Proposals for the inaugural selection round closed in May 2011. Researchers who have been awarded a PhD within five years or, commensurate with significant career interruption for maternity or parental leave; carer’s responsibility; illness; international post doctoral studies; or non-research employment have been awarded a PhD within eight years of the closing date for the scheme are eligible to apply. Up to 200 awards will be offered each year.
Mission-based compacts
Mission-based compacts105 provide the framework for a partnership between the Australian Government and universities to achieve reform of higher education. Compacts aim to promote excellence and build capacity and international competitiveness in Australia’s university sector. Compacts assist individual universities to capitalise on their strengths and to articulate the unique role they play in the higher education system, the innovation system, their local region and community, and internationally. Mission-based compacts have encouraged each university to look afresh at its mission in light of the government’s broader policy goals. Each university has articulated the strategies it will adopt to fulfil its unique mission while aligning with the Commonwealth’s goals for higher education, research, research training and innovation.
Following consultations with the higher education sector on the mission-based compact template in 2010, universities submitted their draft compacts in early 2011. The sector was supportive of the general structure and the research, research training and innovation sections of the compact template. Some changes were made to the template in response to suggestions to better reflect institutional autonomy and diversity of mission.
105 http://www.deewr.gov.au/HigherEducation/Policy/Pages/Compacts.aspx and http://www.innovation.gov.au/Research/MissionBasedCompacts/Pages/default.aspx

Australian Innovation System
Report 2
011
44
DIISR officers met with each institution for strategic discussions and negotiation of individual compact agreements from February to mid-April 2011. The government finalised mission-based compacts with the sector during mid 2011.
Targets provide the compacts with quantitative illustration of a university’s aspirations, directions and progress. Excellence in Research for Australia (ERA) results provide a key measure of research performance. In their responses to the research training section of the template, universities outlined their plans to promote the quality of research training and to lift the overall quality of research. Universities considered their innovation strategies, and some developed or commenced developing their strategies and systems.
Sustainable Research Excellence
Sustainable Research Excellence (SRE) provides block grants on a calendar year basis to eligible higher education providers. SRE aims to close the gap in funding for the indirect costs of Australian Competitive Grant (ACG) research, support providers to build and maintain research excellence, secure the sustainability of research over the longer term and increase transparency and accountability of research funding. SRE augments the Research Infrastructure Block Grants scheme. Some $510 million (indexed) has been committed between 2009–10 and 2012–13 for this initiative. Funding is performance based, with access to 80% of the funding being contingent on universities having transparent costing procedures in place and participating in the Australian Research Council’s Excellence in Research for Australia exercise.
All 41 higher education providers participated in the transparent costing and Excellence in Research for Australia exercise in 2010. Two new data collections underpinning transparent costing were successfully trialled in 2010. The first is the research hours data collection, which involved institutions administering a staff hours survey to quantify the effort of staff directed towards research. The second is the SRE financial data collection, which required institutions to complete an indirect costs financial return, detailing total indirect costs. Combined these inputs produce a ratio of ACG research costs relative to ACG research income for each institution. Results showed that there is a range of indirect cost levels associated with ACG research across the sector. The trial of transparent costing was completed in late 2010 and its results incorporated in the SRE funding methodology for 2011.
National Centre for Groundwater Research and Training
The National Centre for Groundwater Research and Training is co-funded by the Australian Research Council (ARC) and the National Water Commission. It was established in June 2009 with the objective of creating a groundwater institution of national and international standing that will enhance Australia’s future environmental, economic, social and cultural wellbeing. The Centre will achieve this by undertaking the critical scientific research needed to improve our understanding and management of Australia’s groundwater systems. It will also train the next generation of researchers and professionals in groundwater related fields, filling a significant gap in Australia’s current resource management capabilities. The Centre is therefore making an important contribution to the successful implementation of the National Water and National Groundwater Assessment Initiatives.106
The Australian Government has committed up to $29.5 million (over five years) with an additional $15 million being provided by the Education Investment Fund for the SuperScience Initiative and $11 million being contributed by the Centre’s partner organisations. This is the largest investment that has ever been made in Australian groundwater research. The funding is being used to recruit research staff and 146 postdoctorate, PhD and Honours students who will be working within five research programs in locations across Australia over the next 3 years. It is also being used to build world-class research infrastructure, as well as providing important opportunities for staff and students to learn and collaborate with leading international groundwater scholars and research institutions.
The Centre also has a specialist Industry Training Team which delivers a comprehensive program of vocational training courses to support the continuing development of groundwater professionals in Australia and overseas.
Skills Australia
Skills Australia is an independent statutory body, providing advice to the Minister for Tertiary Education, Skills, Jobs and Workplace Relations on Australia’s current, emerging and future workforce skills needs and workforce development needs. During 2010 its advice has focused on workforce development, skill shortages and the future of the Vocational Education and Training (VET) system with the view to ensuring that the VET
106 http://www.nwc.gov.au/www/html/350-groundwater-action-plan.asp
Chapter 2: R
esearch capacity and skill base
45
system is producing the required depth of skills and facilitating better use of those skills in the workplace, thereby contributing to higher levels of productivity and innovation. During 2010 the Chair of Skills Australia participated in a forum on the OECD’s draft Innovation Strategy, contributing advice in relation to both the higher education and the VET sector.
To meet the labour market and fiscal challenges of an ageing population and burgeoning international competitiveness, Australia will require significantly improved foundation and higher level skills in the labour force. A highly skilled workforce is critical to strong innovation performance. In Australian Workforce Futures107, Skills Australia points to the importance of improving the use of skills in Australian workplaces as a means of lifting productivity and raising innovation levels. ‘Using Skills Productively’ was the theme of a national conference held by Skills Australia in 2010.108
Smart Infrastructure Awards
In March 2010, the Minister for Infrastructure and Transport, the Hon Anthony Albanese MP, launched the annual Smart Infrastructure Awards. The awards consist of the Australian Smart Infrastructure Project Award for an innovative technology based project, and the Australian Smart Infrastructure Research Award which provides a $25,000 (GST exclusive) grant for an innovative proposal supporting excellence in smart infrastructure research and development.
The Smart Infrastructure Awards recognise excellence in design, delivery and use of “smart technologies” in the provision of infrastructure services in the following areas:
› A national broadband network;
› A true national energy market;
› Competitive international gateways;
› A national rail freight network;
› Transforming our cities;
› Providing essential indigenous infrastructure; and
› Adaptable and secure water supplies to cope with climate change.
The winner of the Smart Infrastructure Research Award in 2010 was the University of Wollongong for a research project related to Hybrid Wireless Journey Capture in Ticketless Transport Networks. The winner of the Smart Infrastructure Project Award in 2010 was VicRoads for the M1 Freeway Management System.
2011 Strategic Roadmap for Australian Research Infrastructure
During 2011, a Strategic Roadmap for Australian Research Infrastructure (2011 Roadmap)109 is being developed to inform future decisions on where Australia should make strategic infrastructure investments to further develop its research capacity and improve research outcomes over the next five to ten years. The 2011 Roadmap aims to consider new and emerging areas of research which may require different types of infrastructure in the future, and determine whether the current mix of capability areas continues to meet researchers’ needs. A Discussion Paper was released in March 2011 for stakeholder comment followed by the release of an Exposure Draft of the 2011 Roadmap in June 2011. The final 2011 Roadmap is expected to be released in September 2011.
Victoria’s Science Agenda
Victoria’s Science Agenda (VSA)110 is a $145 million initiative that builds on the achievements of the $620 million Science, Technology and Innovation Initiative (1999 to 2008) by enhancing and leveraging Victoria’s science and technology capabilities to effectively respond to health, sustainability and productivity challenges.
The VSA Investment Fund is providing $36 million in 24 competitive grants to business and research organisations that have co-invested a further $76 million in partnerships aimed at strengthening Victoria’s science and technology capabilities and translating these to market outcomes.
107 Skills Australia (2010) Australian Workforce Futures: A National Workforce Development Strategy, Skills Australia, Canberra108 http://www.skillsaustralia.gov.au/UsingSkillsProductivelyConference.shtml109 http://www.innovation.gov.au/Science/ResearchInfrastructure/Pages/default.aspx 110 http://www.business.vic.gov.au/BUSVIC/STANDARD/PC_63064.html

Australian Innovation System
Report 2
011
46
Of the 24 projects, 16 are led by industry, eight projects are led by public research organisations and five projects have international partners. In addition, seven projects are either fully located in regional areas or have significant regional activity.
The VSA Strategic Project Fund has been implemented to establish new research capacity or strengthen existing research platforms in Victoria’s research and technology precincts. Three major investments totalling $24 million have been made to date in facilities and human capital, through collaborative projects between research and external partner organisations. This program has leveraged a further $31 million of investment from its project partners. Two of these projects are integral components of Education Investment Fund grants in the areas of future fibres and biomedical imaging.
Translational Research Institute
The new $354 million Translational Research Institute (TRI)111 at Princess Alexandra Hospital (PAH) is a joint initiative of the Queensland Government, which has contributed $107 million, the Australian Government which has contributed $150 million, and The Atlantic Philanthropies, which contributed $50 million towards the research institute. The institute will be the largest of its kind in the Southern Hemisphere, and one of just a handful of similar Institutes in the world, covering five floors and 32,000m2 of research space.
The TRI is a joint venture between the Queensland Government, The University of Queensland, The Queensland University of Technology, PAH and the Mater Medical Research Institute. The BioPharmaceuticals Australia facility will also call the TRI home, and will manufacture drugs and vaccines developed by researchers at the Institute, as well as other local researchers and companies.
The centre will accommodate up to 700 researchers from the four TRI partners: the University of Queensland, Queensland University of Technology, Mater Medical Research Institute and the Princess Alexandra Hospital and transform Australia’s capability to develop and produce life saving biopharmaceuticals. This means that when a scientist develops a life saving treatment in Queensland it can be produced, clinically tested, and manufactured in Brisbane. Research activities at the TRI will concentrate on chronic diseases such as cancer, diabetes, obesity and liver disease, as well as other diseases such as inflammatory diseases, HIV, malaria, and bone and joint diseases.
The construction of the TRI is expected to be completed in 2012.
SA Goyder Institute for Water Research
The Goyder Institute for Water Research is a new research institute based in South Australia. With funding of $50 million over 5 years, it is a collaboration between the State Government of South Australia, the Australian Commonwealth Scientific and Industrial Research Organisation, the University of Adelaide, the University of South Australia and the Flinders University.
The Goyder Institute aims to support world leading water resource policy and management in South Australia through scientific research and to underpin sustainable development of the state. The Institute has four Research Programs – urban water, industry development, environmental water, and climate change – and its funded projects are designed to integrate the work of multiple organisations and inter-disciplinary research.
A board and a research advisory group have been established with representatives from all partners. The first project commenced is a scientific review of the Murray Darling Basin Plan Guide and its impact on South Australia’s economy and environment.
111 http://www.tri.edu.au/
Artist’s impression of the Translational Research Institute. Image provided by the Queensland Government.

Chapter 2: R
esearch capacity and skill base
47
Professor Hung Nguyen (r) and the commercialisation team. Image provided by KiLN Media.
Case studies
The following cases studies demonstrate the contribution of research and other organisations to the innovation system. Additional case studies on research and skills development can be found in the Case Study companion to this report.
University Of Technology Sydney – Thought Controlled Wheelchair
Professor Hung Nguyen, Dean of UTS’s Faculty of Engineering and Information Technology, and his team from the Centre for Health Technologies have developed a wheelchair that promises to give mobility to people with severe disabilities.
The intelligent wheelchair technology identifies and classifies the user’s brain signals, which are then translated into commands to control a motorised or electronic device. Professor Nguyen explains:
“I started developing a head movement system in 1997, and it’s only recently that we came up with a very small and wireless technology. The thought controlled technology took some time to get here. We use a number of different electrodes – though I’d prefer to only use one electrode. We use lasers and stereoscopic cameras to allow the user to navigate. You can also call the wheelchair to come to you, just by thinking. The wheelchair can even be parked without you being in the chair.”
Professor Nguyen says he hopes to explore possibilities for people with a locked-in syndrome, such as those who are aware and alert but unable to respond.
“They can use this technology to communicate with people or to control the wheelchair, to even turn on the TV. They wouldn’t need carers all the time. The technology will soon have the ability to adapt to the user, so the device will rewire itself to cope with different disabilities.” The wheelchair is only the beginning – Professor Nguyen and his team are already working on a thought controlled car.
University of Wollongong – ADHD training system
Newly-developed software and associated training methodology developed by researchers at the University of Wollongong (UOW) has been licensed to an Australian-based neurocognitive software company for commercialisation. The novel training system, developed by Dr Stuart Johnstone and Associate Professor Steven Roodenrys at UOW’s School of Psychology, helps children improve their attention, memory and impulse control skills. When used in conjunction with a NeuroSky Mindset, a device which allows for Electroencephalography or EEG data collection, the regular use of the system has been shown to benefit children’s cognitive skills and behaviour. The intellectual property associated with this technology is the subject of a PCT patent application and has been exclusively licensed to Neuro Cognitive Software Pty Ltd for commercialisation in the field of Attention Deficit Hyperactivity Disorder.
Associate Professor Steven Roodenrys (l) and Dr Stuart Johnstone (r) with their program that helps children improve attention, memory and impulse control. Image provided by the University of Wollongong.

Australian Innovation System
Report 2
011
48
Dr Katherine Trinajstic. Image provided by James Rogers.
Curtin University – Organic & Isotope Geochemistry Centre
The Curtin University Western Australian – Organic and Isotope Geochemistry Centre (WA -OIGC) is an international recognised Centre contributing to world-class research to:
› Improve our ability to forecast environmental responses to climate change;
› Help to manage current threats to biodiversity;
› Increase the ability to identify crude oil and gas sources, to the benefit of petroleum exploration; and
› Improve our understanding of controls on water quality and to help protect our precious freshwater resources which are already under intense pressure from climate change and urban development.
The WA – OIGC works in areas of biomarker and compound specific isotope together with undertaking research in: the study of climatic trends both past and present; issues concerning environmental sustainability research (e.g. water, sediments and soil); as well as assisting the full realisation of Australia’s natural resources (e.g. petroleum, gas exploration).
The WA-OIGC works in areas of biomarker and compound specific isotope together with undertaking research into past and present climatic trends, issues concerning environmental sustainability research (e.g. water, sediments and soil), as well as assisting the full realisation of Australia’s natural resources (e.g. petroleum, gas exploration).
These application areas are consistent with the Australian Government’s National Research Priorities. Curtin has identified “Resources and Energy and Sustainable Development and Technologies” as key research themes.
Dr Katherine Trinajstic, a palaeontologist working in the WA-OIGC, won the prestigious 2010 Malcolm McIntosh Prize for Physical Scientist of the Year for her work in the preservation of fossilised soft tissue of ancient fish. Dr Trinajstic’s work has found muscles and internal organs of ancient fish preserved along with fossilised bones. This has led to a series of discoveries including the oldest known fossilised vertebrates with soft tissue and discovery of the ‘first womb’.
Monash University – Building industry skills in green chemistry
The Monash Centre for Green Chemistry (CfGC) formally began as an ARC Special Research Centre in January 2000. CfGC was one of the world’s first university-based research organisations dedicated to Green Chemistry, and its goal of driving sustainable manufacturing practices into industry has resonated strongly with the sector’s needs. In June 2010, Monash University announced that, with support from the Federal Government, it would establish a $72.8 million multidisciplinary hub, Green Chemical Futures (GCF). GCF will serve as a pipeline for the technologies and human resources needed by an industry striving for a lower environmental footprint, and positioning Monash and Australia as a location of choice for R&D into sustainable technologies for this sector.
CfGC has unique skills in a number of key sustainable industrial technology areas, particularly in novel manufacturing, while operating alongside and networking with some of the largest academic and commercial organisations internationally. As well as contributing to more sustainable technology outcomes, the CfGC has been an important player in establishing and growing Australia’s green-economy workforce. Since 2000, the Centre has employed 101 research fellows/assistants and produced over 70 PhD graduates that have subsequently gone to industry (49%), Commonwealth Scientific and Industrial Research Organisation (CSIRO) (8%) and public/private research (40%).

Chapter 2: R
esearch capacity and skill base
49
A myopic boy uses Vision CRC technology to read. Image provided by the Vision CRC.
Breeding for Less Methane
The NSW Department of Primary Industries (DPI) is developing a world-first breeding program to reduce methane emissions from livestock without sacrificing growth performance. With the average herd of 100 cows emitting the same amount of greenhouse gases as 40 large cars every day, and global demand for protein set to rise, livestock methane emissions is a growing environmental issue.
Based at the Armidale Beef Industry Centre of Excellence, the project began with a 2008 discovery that production of methane in livestock can be genetically controlled. After determining that the answer to reducing livestock methane emissions could lie in good old-fashioned breeding, researchers began mating for the project’s ‘next generation’. In July 2010, they used the ‘best’ and ‘worst’ (emitting) new young bulls from NSW DPI’s pedigree Angus herd to mate with 500 cows. The progeny will be measured for methane production as they approach their first birthdays in early 2012.
To take these measurements, a small gas cylinder is inserted into the rumen or fore stomach of the animal. Over following days the cylinder releases tracer gas and researchers measure the ratio of tracer gas in the air breathed out to calculate the rate of methane produced by the animal.
While methane is a greenhouse gas, methane produced in cow and sheep bellies also represents a loss of energy, “We are looking at benefits for the environment and improved efficiency in the way cows and sheep extract energy from their food,” says Principal Research Scientist for the project Dr Roger Hegarty. “We want cattle that eat well and grow well, but at the same time produce less methane.”
Vision CRC and anti-myopia technology
Myopia (short sightedness) affects over 1.6 billion people globally, with two thirds of those affected living in the Asia region. If unchecked, the number of myopia sufferers is expected to reach 2.5 billion by 2020. Some 3.5 million Australians suffer from this condition.
The current Vision CRC Anti-Myopia Program demonstrated that spectacle lenses are able to control the progression of myopia by approximately 30% in younger children (6 to 12 years of age) with certain parental history of myopia. This ground breaking discovery in myopia vision control has resulted in the commercial production of a new spectacle lens through a licence to industry leader, Carl Zeiss Vision. This world first breakthrough is based on collaborative research conducted over many years by the Vision Cooperative Research Centre (CRC) in partnership with the Brien Holden Vision Institute and the University of Houston’s College of Optometry.
The new spectacles were launched under the ZEISS brand name throughout Asia in April 2010. Contact lens applications of the myopia control technology have also been developed by CIBA VISION under licence from Vision CRC.
Professor Brien Holden, CEO of the Vision CRC, says myopia can create a serious challenge to eye health. “High myopia significantly increases the risk of cataract, glaucoma, and retinal detachment, all potentially blinding conditions and the public health risk is significant. The commercialisation of this technology is a most important outcome for the CRC program because of the potential vision and eye health benefits.
Professor Earl Smith, Dean of the University of Houston’s College of Optometry, says the correction technology is timely. ”Evidence shows that the number of individuals with myopia will dramatically escalate with increasing urbanisation and less outdoor activity in China, USA, Australia and in developing nations. This new technology is not just for children either. Over 25% of myopes in the western world are adult-onset myopes, which often begins at university. We believe that this technology has potential benefits for all myopes.”

Australian Innovation System
Report 2
011
50
Professor Durrant-Whyte and the Governor of NSW Professor Marie Bashir AC. Image provided by the NSW Government.
Accelerating High End Skills Development in the Dairy Manufacturing Sector
This Dairy Australia112 project produced workforce development models to equip workers in specialist dairy manufacturing with high end skills and enable companies engaged in the industry to understand and improve on their own workforce development needs and processes.
Collaboration and innovation was encouraged by adopting a skills ecosystem approach in which industry, Vocational Education and Training and company partners have equal influence and outcomes are not fixed in advance.
The outcomes of this project provide a number of opportunities for wider industry application. In particular, it provides guidance and tools to allow other industry sectors to:
› Find ways to leverage experience in individual companies to build overall workforce capability;
› Identify implications for VET providers to develop internal skills and capability and/or form alliances with industry;
› Structure competency standards in the VET system to ensure training can be monitored and improved; and
› Scope opportunities for VET to work with industry and design specific learning interventions to influence workforce development outcomes.
New South Wales Scientist of the Year - Professor Hugh Durrant-Whyte
Professor Durrant-Whyte has helped develop autonomous solutions for a wide range of applications industries including mining, marine, military, aeronautics and agriculture. As part of his work in robotics, Professor Durrant-Whyte and his team have spun out a number of companies, most recently Marathon Robotics, which has developed free-ranging robots protected by armour plating to train marksmen. The Marathon Robotics system has attracted a $57 million contract with the US Marines.
Professor Durrant-Whyte was awarded NSW’s most prestigious science prize, the NSW Scientist of the Year 2010. The NSW Scientist of the Year Award recognises creative, high calibre research that brings benefits to the State’s economy, environment and people. It is also designed to engage and involve the general public and the NSW research community to promote the value of science and encourage science careers. Prize money is awarded to researchers to acknowledge their exceptional achievements in: environment, water and climate change sciences; physics, earth sciences, chemistry and astronomy; biomedical sciences; plant and animal sciences; and engineering, mathematics and computer sciences. Professor Durrant-Whyte won $55,000 for his achievement and six category winners are awarded $5,000 each.
112 http://www.dairyaustralia.com.au/skills-development

Chapter 2: R
esearch capacity and skill base
51
UB Spatial: An interoperable web-GIS supporting natural resources management
UB Spatial is an interoperable web-Geographic Information System designed by Dr Peter Dahlhaus and Helen Thomson of the University of Ballarat (UB) in a collaborative project with the Corangamite Catchment Management Authority (CMA). The impetus for the project was the need to provide the most relevant and current Natural Resource Management data into an environment where it can be accessed by catchment managers, researchers, consultants, municipalities, government agencies and members of the general public. Datasets that have been made available through this platform include groundwater bores, mapped salinity, soil erosion, and landslides. The design of UB Spatial is based on the key themes for making data accessible including flexibility, adaptability, user-friendly interoperability and access considerations. Dozens of data sets including light detection and ranging digital elevation models have been contributed to the project by collaborating partners such as The Department of Sustainability and Environment (DSE), Corangamite CMA, Department of Primary Industries (DPI) and DSE (Groundwater). The output of the project is generating intense interest among user groups.
Since the implementation of the web-GIS, the Colac Otway Shire and Municipal Association of Victoria have co-invested in the project. DSE has encouraged the extension of the UB Spatial groundwater bore database across the whole of Victoria, while collaboration with the Australian Spatial Research Data Commons project is being discussed.
University of Queensland – Geometallurgical testing
JKTech Pty Ltd is the technology transfer company for the Sustainable Minerals Institute at the University of Queensland. It transfers research outcomes from mining and geology, mineral processing, water, health and safety, social responsibility and risk management to the global mining industry. JKTech offers a range of innovative solutions to improve efficiency and performance in the planning and operation of minerals projects.
A large research project (AMIRA P843), undertaken in 2005-2008 and headed by Professor Steve Walters, developed test protocols for the evaluation of ore samples which allowed processing parameters to be incorporated in mine block models. These tests allow measurements to be obtained from large numbers of samples, thereby improving understanding of ore body characteristics and reducing risk for the mining companies.
JKTech officially opened its new geometallurgical testing facility in Brisbane in June 2010. This 5,000m2 laboratory houses state of the art equipment and is the main characterisation testing facility for geometallurgical projects, using the protocols developed in the AMIRA P843 project. Then in the pre-commercial stage, these test protocols were validated by JKTech on an industry-scale and were commercially released in January 2011.
Research sponsors from mining companies around the world continue to invest in R&D within this project and associated research projects, leading to more efficient and sustainable mining operations now and in the future.
JKTech’s Rotary Breakage Tester. Image provided by JKTech.

Australian Innovation System
Report 2
011
52
CHAPTER 3: Business innovation
Many Australian businesses are part of rapidly changing markets and the pace of change is even faster where businesses trade on global markets. Competitive business models, marketing strategies, improved services and better technologies in the market encourage innovation. Building innovation capability therefore becomes an important, if not necessary, strategy for a business to develop resilient market niches and find greater efficiencies in the ways it uses resources. Yet innovation, by definition, is market experimentation with uncertain outcomes. On top of this an innovator cannot always capture the full benefits of their investments because knowledge and therefore many innovations can easily be transferred to others. Thus innovation is an activity with high uncertainty both in technical and financial outcomes. This leads to a tendency for businesses to under-invest in innovation from a societal perspective. Factors such as size and industry sector also influence the opportunities and incentives for businesses to pursue innovation.
The longer-term benefits and the shorter term risks of innovation highlight the importance of communicating the benefits of innovation to businesses, understanding business motivations to innovate and acknowledging the important role of the broader environment in encouraging innovation.
In order for business innovation to thrive, the broader environment (also known as framework conditions) in which it takes place must be encouraging and supportive. Innovation will falter if businesses face excessive or limiting regulation in bringing new products to market or their intellectual property is not protected. Other framework conditions include macroeconomic stability, the depth and breadth of financial markets (including venture capital), taxation, competition policy, and openness to trade and foreign investment.113 A number of indicators are introduced in this chapter to explore these framework conditions.
In Powering Ideas, the Australian Government set out its priorities for business research and development (R&D) and innovation along with targets that it aims to achieve through its ten year innovation agenda:
Priority 3: The innovation system fosters industries of the future, securing value from the commercialisation of Australian research and development.Target: The Australian Government aims to see a continuing increase in the number of businesses investing in R&D.
Priority 4: More effective dissemination of new technologies, processes, and ideas increases innovation across the economy, with a particular focus on small and medium-sized enterprises.Target: The Australian Government’s goal is to achieve a 25% increase in the proportion of businesses engaging in innovation over the next decade.
This chapter explores what motivates or demotivates Australian businesses to innovate, the benefits of innovation, business framework conditions, and business innovation performance. It also outlines government programs supporting business innovation and case studies of business innovation.
Innovation is the means to deliver profit, productivity and other benefits to business
Organisations achieve systematic innovation capability by taking active decisions and mobilising and coordinating their resources, capabilities, and creativity to make it happen.114 This is not always a top-down strategic approach, but can be based on the merits of individual projects that arise as part of tactical problem solving processes. Businesses tend not to invest in innovation unless there is demonstrable and acceptable investment risk. Therefore the why of entrepreneurship and innovation is important for understanding innovation and creating innovation policy – this means measuring and analysing the barriers and drivers to innovation and entrepreneurship in Australia.
113 OECD (2010) The OECD Innovation Strategy: Getting a Head Start on Tomorrow, Paris, pp. 87-96.114 See Samson D (2010) Innovation for business success: Achieving a systematic innovation capability, Report prepared for the Department of Innovation,
Industry, Science and Research for a discussion of principles behind achieving systematic innovation capabilities.
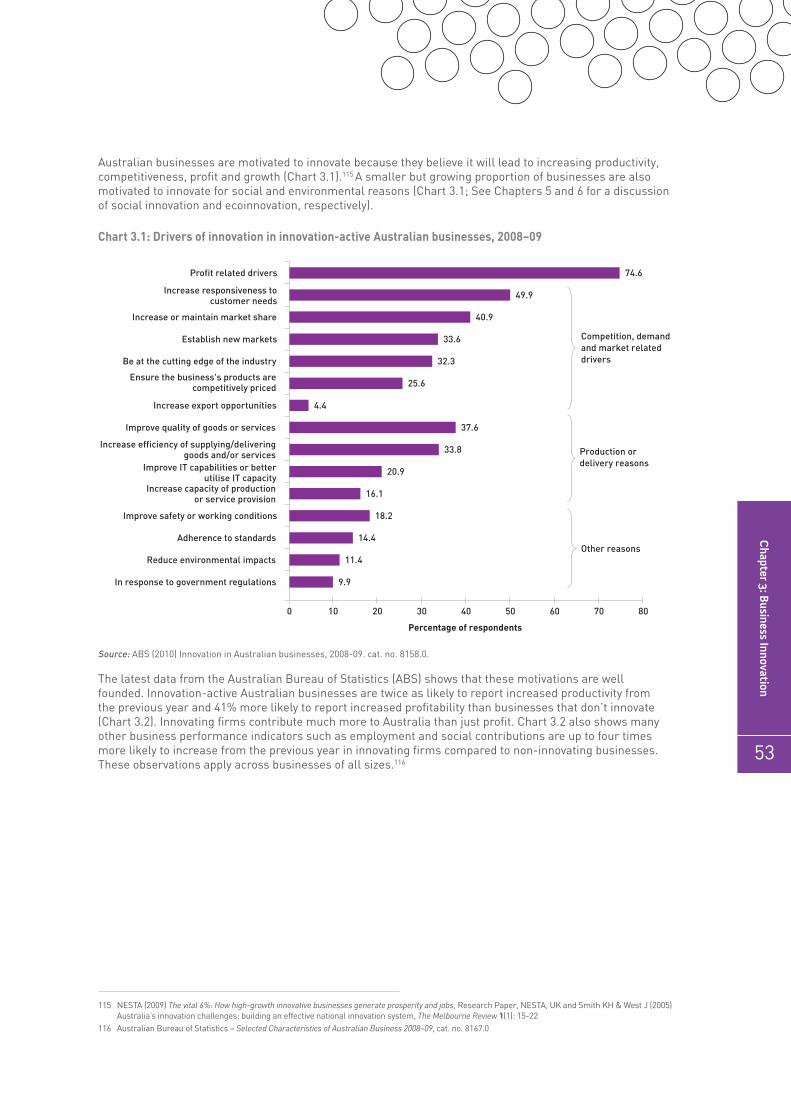
Chapter 3: B
usiness Innovation
53
Australian businesses are motivated to innovate because they believe it will lead to increasing productivity, competitiveness, profit and growth (Chart 3.1).115 A smaller but growing proportion of businesses are also motivated to innovate for social and environmental reasons (Chart 3.1; See Chapters 5 and 6 for a discussion of social innovation and ecoinnovation, respectively).
Chart 3.1: Drivers of innovation in innovation-active Australian businesses, 2008–09
Source: ABS (2010) Innovation in Australian businesses, 2008-09. cat. no. 8158.0.
The latest data from the Australian Bureau of Statistics (ABS) shows that these motivations are well founded. Innovation-active Australian businesses are twice as likely to report increased productivity from the previous year and 41% more likely to report increased profitability than businesses that don’t innovate (Chart 3.2). Innovating firms contribute much more to Australia than just profit. Chart 3.2 also shows many other business performance indicators such as employment and social contributions are up to four times more likely to increase from the previous year in innovating firms compared to non-innovating businesses. These observations apply across businesses of all sizes.116
115 NESTA (2009) The vital 6%: How high-growth innovative businesses generate prosperity and jobs, Research Paper, NESTA, UK and Smith KH & West J (2005) Australia’s innovation challenges: building an effective national innovation system, The Melbourne Review 1(1): 15-22
116 Australian Bureau of Statistics – Selected Characteristics of Australian Business 2008–09, cat. no. 8167.0
74.6
49.9
40.9
33.6
32.3
25.6
4.4
37.6
33.8
20.9
16.1
18.2
14.4
11.4
9.9
0 10 20 30 40 50 60 70 80
Profit related drivers
Increase responsiveness tocustomer needs
Increase or maintain market share
Establish new markets
Be at the cutting edge of the industry
Ensure the business's products arecompetitively priced
Increase export opportunities
Improve quality of goods or services
Increase efficiency of supplying/deliveringgoods and/or services
Improve IT capabilities or betterutilise IT capacity
Increase capacity of productionor service provision
Improve safety or working conditions
Adherence to standards
Reduce environmental impacts
In response to government regulations
Percentage of respondents
Competition, demand and market related drivers
Production or delivery reasons
Other reasons

Australian Innovation System
Report 2
011
54
Chart 3.2: Increases in business performance from the previous year, by innovation status, 2008–09
Source: ABS (2010) Selected Characteristics of Australian Business, 2008–09, cat. no. 8167.0.
Innovators are much more likely to be operating in geographical markets outside their local area than non-innovators and are more than twice as likely to export as non-innovators (Chart 3.2 and Chart 3.3).
Chart 3.3: Geographic markets in which businesses sold goods or services, by innovation status, 2008–09
Source: Australian Bureau of Statistics (2010) – Selected Characteristics of Australian Business 2008–09 cat. no. 8167.0.
Innovation-active businesses
Non Innovation-active businesses
33.3 33.6
47.3
4.1
33.0
23.7
19.4 18.4
23.7
16.0
33.3
1.0
9.3 8.8 5.9 5.9
0
10
20
30
40
50 P
rofit
abili
ty
Pro
duct
ivit
y
Inco
me
from
sale
s of
goo
dsor
ser
vice
s
Expo
rt m
arke
tsta
rget
ed
Ran
ge o
fpr
oduc
ts o
rse
rvic
es o
ffer
ed
Tota
l num
ber
ofjo
bs o
r po
siti
ons
Am
ount
of
stru
ctur
es/
form
al tr
aini
ngfo
r em
ploy
ees
Soci
alco
ntri
buti
ons
Per
cent
age
of r
espo
nden
ts
Innovation-active businesses
Non Innovation-active businesses
0
20
40
60
80
100
Per
cent
age
of r
espo
nden
ts
Local area Outside of local area butwithin the state/territory
Geographic markets
Outside of state/territorybut within Australia
Overseas
8083
50
33 33
17
11
5

Chapter 3: B
usiness Innovation
55
The barriers to innovation
Since innovations are essentially market experiments, particularly for new goods and services, failure is an inevitable and important part of the innovation process.117 Early failures are important milestones because they generate systemic learning about how to identify real opportunities and how to address them. Once recognised, failures also quickly free up people, capital, and ideas for more-promising projects.118 Many ideas and possible projects are weeded out as businesses assess their attractiveness and feasibility. Chart 3.4 shows that a number of market experiments are abandoned every year by businesses. The true extent of ‘failure’ in the innovation cycle will never be fully evident since only firms that survive can report on abandoned projects.119 Many firms do not survive the commercialisation process and are counted as business exits. This number could be up to 15% of the total pool of Australian businesses every year (See also Feature 4 on Entrepreneurship).120
Chart 3.4: Summary of innovative activity in Australian business, by status, 2009–10
Source: ABS (2011) Summary of IT use and innovation in Australian businesses, 2009-10, cat. no. 8166.0
Innovators bear additional costs in developing relevant or specific skills, gathering and creating knowledge and testing their innovations in the marketplace. The benefits of these investments in innovative activities cannot always be completely captured over the life of the innovation because they can spill over into other organisations, other industries and the broader community as the product becomes known, as people move, and as information flows. These added risk factors act as disincentives to private investment in innovation, especially when there are competing investment priorities with lower demonstrable and acceptable investment risk levels.
Taking ideas to market is a critical part of effective innovation. It is also higher risk because firms and individual entrepreneurs who identify opportunities do not necessarily have the management skills and track record to attract private sector investment. Investors prefer to avoid this higher uncertainty/higher risk area and naturally move to private equity investment at a later and safer stage of business development.
117 Foster J (2010) Productivity, creative destruction and innovation policy. Occasional paper Series, Australian Business Foundation118 Isenberg DJ (2010) Entrepreneurs and the Cult of Failure, Harvard Business Review, April 2011119 Dodgson M, Hughes A, Foster J and Metcalfe JS (2010) Systems thinking, market failure, and the development of innovation policy: The case of Australia,
University of Queensland Economics Discussion Paper no. 403 and Centre for Business Research Working Paper 397, University of Cambridge.120 Australian Bureau of Statistics (2010) Counts of Australian Businesses, including Entries and Exits, Jun 2007 to Jun 2009, cat. no. 8165.0
Businesses with introduced or implementedinnovation (innovating businesses)
…still in development
…abandoned
Businesses with any innovative activity(innovation–active businesses)
Businesses withinnovation activitythat was…
Percentage of respondents
39.5
20.4
7.5
44.7
0 5 10 15 20 25 30 35 40 45 50

Australian Innovation System
Report 2
011
56
Chart 3.5 outlines the comparative impacts of key barriers to innovation and shows they are generally highest for small firms in Australia. The data also shows that limited access to either funds or skilled people are the two most common perceived barriers to innovation. During the global financial crisis, the impact of financial barriers to innovation (access to funds and costs of implementation) and uncertain demand increased, whereas a lack of skilled people, although still a high barrier, became less of a concern compared to 2007–08.121
Chart 3.5: Barriers to innovation for innovation-active Australian businesses, 2008–09
Source: ABS (2010) Innovation in Australian businesses, 2008-09, cat. no. 8158.0
121 Australian Bureau of Statistics (2009) Selected Characteristics of Australian Businesses, 2007–08, cat.no. 8167.0.
0 10 20 30 40 50
Lack of access toadditional funds
Lack of skilled personsin any location
Cost of development orintroduction/implementation
Uncertain demands fornew goods or services
Government regulationsor compliance
Adherence to standards
Lack of access to knowledgeor technology
Percentage of respondents
0–4 persons
5–19 persons
20–199 persons
200 or more persons

Chapter 3: B
usiness Innovation
57
Innovation activities
Table 3.1 provides a summary of Australia’s innovative performance, comparing it to other OECD countries and the average of the top five OECD performers.
Table 3.1: Australia’s performance in innovative activities against other OECD countries
IndicatorsLatest Figure
Reference Year
OECD Ranking(b)
Gap from the Top
Five OECD Performers
Baseline figure
Reference year
baseline figure
Change from
baselinefigure
Number of businesses registered for the R&D Tax Concession*[1] 8,440 2008-09 - - 7,899(r) 2007–08 6.8%
BERD as a % of GDP [2] 1.35% 2008 12th 53.6% 1.26%(r) 2007 6.7%
Proportion of BERD financed by government [2] 2.21% 2008 21st 83.1% 2.88%(r) 2007 -23.3%
Tax treatment of R&D in SMEs (1 – B Index)(a) [3] 0.117(nd) 2008 14th(r) 64.6% 0.117 2008 -
Tax treatment of R&D in large firms (1 – B Index)(a) [3] 0.117(nd) 2008 10th(r) 62.1% 0.117 2008 -
Proportion of innovation-active businesses in Australia* [4] 44.7% 2009–10 n/a n/a 44.9% 2007–08 -0.4%
Proportion of large firms with new-to-market products [5] 12.0%(nd) 2002–04 26th 77.2% 12.0% 2002–04 -
Proportion of SMEs with new-to-market products [5] 7.0%(nd) 2002–04 24th 75.6% 7.0% 2002–04 -
Proportion of non-technological innovators in the manufacturing sector [3]
31.7%(nd) 2004–06 15th 47.1% 31.7% 2004–06 -
Proportion of non-technological innovators in the services sector [3] 28.2%(nd) 2004–06 17th 52.7% 28.2% 2004–06 -
Sources: [1] Innovation Australia Annual Report 2009–10. [2] OECD, Main Science and Technology Indicators database 2010/2. [3] OECD, Science, Technology and Industry Scoreboard 2009. [4] ABS (2011), Summary of IT Use and Innovation in Australian business, excluding agriculture, 2009–10, cat. no. 8166.0. [5] OECD, Science, Technology and Industry Scoreboard 2007.Notes: Indicators with * and in the figures in the coloured rows of the table are the primary indicators applied to measure and monitor progress against the Australian Government’s innovation targets. (a) The B index is defined as the present value of before tax income necessary to cover the initial cost of R&D investment and to pay corporate income tax, so that it is profitable to perform research activities. The amount of tax subsidy for R&D is calculated as 1 minus the B index.122 Therefore, the higher the 1 – B index is, the greater the tax subsidy. (b) OECD rankings are performed on those OECD countries for which data is available. Individual data availability may vary between indicators. (nd) No new data (r). The baseline has been revised according to the latest available data. n/a = not available. – = not applicable.
The proportion of innovation-active businesses in Australia is used to measure and monitor the Government’s target of a 25% increase in the proportion of businesses engaging in innovation over the next decade. Since 2007–08 there has been a lot of variation in the proportion of innovation-active businesses in Australia. In 2008–09 there was a decrease of 5.1 percentage points down to a total of 39.8%. In 2009–10 there was an increase of 4.9 percentage points to a total of 44.7%. Overall, there has been little movement (a 0.4% decline) in this indicator since 2007-08. Although annual changes are variable, the time series data between 2005–06 and 2009–10 suggests a positive, low annual growth rate in the proportion of innovation-active firms (~0.7% per year).
Size matters for innovation activity. When we consider Chart 3.4 in the context of firm size, with the exception of innovation activities that were abandoned, the percentage of innovation-active large firms (200 or more employees) was two to three times that of micro-firms (with 0-4 employees). This effect of size does not necessarily reflect impact. The large proportion of small and medium enterprise (SMEs) in Australia should also be taken into account when we consider the total impact of innovation across the economy.
122 Warda J (2001) Measuring the Value of R&D Tax Treatment in OECD Countries, STI Review 27: Special Issue on New Science and Technology Indicators, OECD, Paris.

Australian Innovation System
Report 2
011
58
Chart 3.6: Innovative activities in Australian business, 2009–10
Source: ABS (2011) Summary of IT use and innovation in Australian businesses, 2009-10. cat. no. 8166.0. Note that this data excludes the Agriculture, Forestry and Fishing sector.
Sectoral innovation
Innovation processes differ greatly from sector to sector in terms of development, linkages, access to knowledge, organisational structures and framework conditions. Some sectors are characterised by rapid change and radical innovations, others by smaller, incremental changes. In high-technology sectors, R&D plays a central role in innovation activities, while other sectors rely to a greater degree on adoption, modification or non-technological innovation. Differences in innovation activity across sectors also place different demands on the organisational structure of firms. Framework conditions such as regulations and intellectual property rights can therefore vary greatly in their role and importance.
Chart 3.7 highlights the different forms of innovation across selected industries. The data shows that only manufacturing, wholesale trade and retail trade sectors have relatively higher rates of goods innovation compared to service innovation (retail trade not shown). In all sectors, rates of process innovation and more non-technological forms of innovation are high compared to goods or service innovation. The data shows that even in sectors that are technology intensive, a firm’s organisational and marketing innovation capability is high.
Chart 3.7: Australian businesses which introduced or implemented any new or significantly improved innovation, by type, by selected industry, 2008–09
Source: ABS (2010) Innovation in Australian Business 2008–09, cat. no. 8158.0
Percentage of respondents
39.5
17.1
21.2
17.0
20.8
0 5 10 15 20 25 30 35 40
Innovating businesses (businesseswith any innovation mentioned above)
...Marketing methods
...Organisational/Managerial processes
...Operational processes
...Good or services
Businesses thatintroduced any newor significantlyimproved…
Goods innovation Service innovation Process innovation
Organisational/Managerial innovation Marketing innovation
6
19
5
24
10
3 4
3
6
11
7
14
20
15 15 14
17
29
11
22
19 18 18
14
18
21
15
24
18
21 23
19
10
18
12
22 22
20 18
15
0
5
10
15
20
25
30
35
Mining Manufacturing Construction Wholesale Trade
InformationMedia and
Telecommunications
Financialand Insurance
Services
Professional,Scientific and
Technical Services
Health Care andSocial Assistance
Per
cent
age

Chapter 3: B
usiness Innovation
59
The proportion of innovating firms is a useful indicator to compare innovation rates between industrial sectors (Chart 3.8a&b). Given the importance of innovation for sustaining sectoral productivity growth and employment, a key goal is to maintain a high proportion of innovative firms in sectors with high contribution to gross value add (GVA) (Chart 3.8a) and/or high employment (Chart 3.8b). A significant decline in the number of innovation-active firms, particularly those that concentrate on goods or service innovation, may be detrimental to long-term employment growth.123
Chart 3.8 (a) Percentage of innovating businesses by industry sector (vertical axis), by percentage of gross value added (size of the bubble), 2009–10. (b) Percentage of innovating businesses by industry sector (vertical axis), by percentage of employment (size of the bubble), 2006124
Source: ABS (2011) Australian Industry, 2009-10, cat. no. 8155.0; ABS (2011) Labour force, Australia, cat. no. 6291.0; ABS (2011) Summary of IT use and innovation in Australian businesses, 2009-10, cat. no. 8166.0; Australian System of National Accounts, cat. no. 5204.0. Note that the total percentage of innovating businesses is lowered by the introduction of the Agriculture, Fishing and Forestry Sector.
Chart 3.8b shows that key employment sectors such as retail trade (11.5%) and manufacturing (8.5%) have high proportions of innovating firms. On the other hand, construction and healthcare, also important in employment terms, show lower proportions of innovation active firms. The transport, postal and warehousing industry was the only sector to register a fall in the proportion of innovating businesses, dropping from 29.3% in 2008–09 to 20.6% in 2009–10 (Chart 3.8b).
123 Edquist C, Hommen L & McKelvy M (2001) Innovation and Employment: Process versus Product Innovation. Edward Elgar publisher, Cheltenham, UK124 The vertical axis of the bubbles represents the proportion of innovating businesses 2008–09 in that industry sector, so large bubbles on the left side represent
sectors that are both important in terms of employment and have a high proportion of innovating firms. The size of the bubbles represent how important the industry sector is to the Australian economy, measured in (a) as its proportion of employment in 2006; and (b) as the percentage of gross value added.
Per
cent
age
of In
nova
ting
Bus
ines
ses
15
47
45
43
41
39
37
35
33
31
29
27
25
23
21
19
17
53
51
49
55
Arts andRecreationServices0.8%
Total % of innovatingbusinesses = 38.6%
Manufacturing 9.3%
Electricity, Gas, Water and Waste Services 2.1%
Mining8.4%Professional,
Scientific andTechnical Services7.3%
Accommodation and Food Services2.3%
Information, Media andTelecommunications3.3%
Administrative and Support Services 2.5%
Health Care and Social Assistance6.2%
Transport, Postal and Warehousing5.2%
Construction7.9%
Rental, Hiring and Real Estate Services 2.7t%
Other Services1.8%
WholesaleTrade 4.8%
Retail Trade 4.4%
Agriculture, forestryand fishing 2.3%
Financial and Insurance Services 10.6%
Per
cent
age
of In
nova
ting
Bus
ines
ses
15
47
45
43
41
39
37
35
33
31
29
27
25
23
21
19
17
53
51
49
55
Arts andRecreationServices1.7%
Total % of innovatingbusinesses = 38.6%
Manufacturing 8.5%
Electricity, Gas, Water and Waste Services 1.0%
Mining1.3%Accommodation
and Food Services7.9%
Information, Media andTelecommunications1.6%
Administrative and Support Services 6.4%
Health Care and Social Assistance7.9%
Transport, Postal and Warehousing4.9%
Construction6.4%
Rental, Hiring and Real Estate Services 3.2%
Other Services4.1%
Professional, Scientific and Technical Services 8.4%
WholesaleTrade 4.9%
Retail Trade 11.5%
Agriculture, forestryand fishing 4.2%
Financial and Insurance Services 3.5%

Australian Innovation System
Report 2
011
60
Business expenditure on R&D
The number of businesses registered for the R&D Tax Concession continues to increase (Table 3.1). In 2008–09, 8,440 businesses were registered with a reported total of $17.4 billion of R&D expenditure, a 6.8% increase on 2007–08 registrations. The R&D Tax Concession registration indicator assists the Australian Government to measure and monitor performance against its target of a continual increase in the number of businesses investing in R&D.
The proportion of business expenditure on research and development (BERD) as a percentage of GDP has also continued to increase. In 2008–09, $16.8 billion or 1.35% of GDP was spent on BERD, a 6.7% increase on the previous year, despite a moderately ranked tax treatment of R&D across OECD countries. This increase in BERD also improved Australia’s OECD ranking from 14th place to 12th place. The gap between Australia and the average of the top five OECD performers remained the same as other countries increased their BERD/GDP ratios. Australia’s BERD to GDP ratio remains below the OECD average of 1.63% however Table 3.1 shows our rate of growth has been significantly higher than the OECD average over the last decade.
Strong BERD growth has occurred across the economy. Over the fifteen years from 1993-94 to 2008–09, BERD increased at a compound annual rate of 12% in current price terms, exceptional growth in the mining and financial and insurance services over this period. Historically, these sectors were not considered R&D intensive but recorded average annual BERD growth rates of 19% and 21% respectively, more than three times the rate of manufacturing (6%) over the same period.
In most sectors, large firms are the main engines of BERD growth accounting for more than 80% of growth (Chart 3.9). A notable exception is in the property and business services sector where SMEs drive BERD growth. This data suggests that R&D may be important for maintaining large market shares and economies of scale in sectors such as finance, mining, construction and to a lesser extent manufacturing and property and business services.
Chart 3.9: Contribution to business expenditure on research and development growth in key industry sectors by size of firm between 1992–93 and 2008–09
Source: ABS (2010) Research and Experimental Development, Business Australia, 2008–09, cat. no. 8104.0
The proportion of BERD financed by government fell by 23.3%, which increased the gap between Australia and the average of the top five OECD countries (Table 3.1). However, Australia’s OECD ranking improved from 25th in 2007–08 to 21st place in 2008–09 indicating that government funding for BERD in some OECD countries has also been reduced.
A deeper exploration of firm size, type of innovation and concentration of R&D is needed to understand sectoral innovation dynamics in Australia.
Per
cent
age
2.6 3.8 0.6 0.6
9.7 3.7
7.0 4.2 4.2 1.9
26.8
8.9 6.1
18.6 14.2
3.0
33.9
14.7
84.3 73.4
82.1
94.5
27.4
72.8
0
20
40
60
80
100
Mining Manufacturing Construction Finance andInsuranceServices
Total property& businessservices
All sectors
0–4 persons
5–19 persons
20–199 persons
200 or morepersons

Chapter 3: B
usiness Innovation
61
FEATURE 4: AUSTRALIAN ENTREPRENEURSHIP: THE BUSINESS OF DOING SOMETHING DIFFERENT.
Entrepreneurship is recognised as an important driver of economic growth, productivity, innovation, employment, diversity and structural adjustment.125,126,127 As firms enter and exit the market, new arrivals will be more efficient than those they displace. Existing firms are forced to innovate and become more efficient in order to survive and compete. In this way resources flow to more efficient firms and aggregate production improves across the economy.128,129
Entrepreneurship facilitates the transfer of knowledge to Australia as well as between research institutions and other knowledge creation organisations and the firms that can apply it.130 Despite general agreement on the importance of entrepreneurship in all its forms to society there is a lot of debate on its definition, specifically over how it is differentiated from innovation. Recent movement towards an international definition led by the OECD and the European Commission provides this formulation:
‘Entrepreneurial activity is the enterprising human activity in pursuit of the generation of value, through the creation or expansion of economic activity, by identifying and exploiting new products, processes or markets.’131
Using this definition, every entrepreneur is an innovator but not all innovators are entrepreneurs as entrepreneurship is not about improving the efficiency of existing activities but creating or recognising opportunities and bringing together the resources to take advantage of that opportunity. This definition would also imply that much of this report measures aspects of entrepreneurship as much as it does innovation.
Australia’s performance in entrepreneurship depends on a lot of underlying factors including the personal attributes of entrepreneurs, market conditions, access to finance and regulatory frameworks.132 At this stage the ABS collects few internationally comparable entrepreneurship indicators relative to other countries. The ABS is currently working with the OECD and the Department of Innovation, Industry, Science and Research (DIISR) to develop a measurement framework and a comparative set of indicators in this area. Table 3.2 and 3.3 therefore provides a number of proxy indicators that paint a picture of Australian entrepreneurial activity and the framework conditions that influence this activity in Australia.
Table 3.2 shows a selection of framework conditions that influence the rate and extent of entrepreneurship. Overall the data shows that Australia has some of the best conditions for entrepreneurship in the world.133 Regulatory barriers are very low, incentives such as the balance between marginal personal tax rates and corporate tax rates are moderate and attitudes to entrepreneurship (fear of failure, perceived opportunities and entrepreneurial intentions) are positive relative to other OECD countries.
Together these positive framework conditions have produced a high rate of entrepreneurship (Table 3.3). Data from both the ABS and the Global Entrepreneurship Monitors (business entry rates and total early-stage entrepreneurship rates, respectively) show a high rate of entrepreneurship relative to other OECD countries (Australia ranks 3rd and 4th, respectively). More recent data shows that the rates of business entry continues to be high. Unlike many other OECD countries, Australian business entry rates over time bounced back from the financial crisis reaching pre-crisis levels.134 Other indicators include a high rate of opportunistic entrepreneurship three times that of necessity driven entrepreneurship (Table 3.3). This reflects positively on the identification of opportunities in the Australian innovation cycle, an important characteristic of a healthy innovation system.
125 Isenberg DJ (2010) How to start and entrepreneurial revolution, Harvard Business Review June 2010 126 United Nations Conference on Trade and Development (2005) Entrepreneurship and economic development: The Empretec showcase, January 2005.127 OECD (2011) Entreprenurship at a Glance, OECD, Paris128 Shumpeter JA (1934) The theory of economic development: An inquiry into profits, capital, credit, interest and the business cycle, (Opie R, Trans.) Harvard
University Press, Cambridge.129 Ahmad N & Hoffman AN (2008) A framework for addressing and measuring entrepreneurship, OECD Statistical Working Paper, Paris.130 Kukoc K & Regan D (2008) Measuring entrepreneurship, Treasury Economic Roundup, Discussion paper.131 Ahmad N & Seymour RG (2008) Defining entrepreneurial activity: Definitions supporting frameworks for data collection, OECD, Paris.132 Ahmad N & Hoffman AN (2008) A framework for addressing and measuring entrepreneurship, OECD Statistical Working Paper, Paris.133 World Bank Group & International Finance Corporation (2011) Doing Business 2011 report, World Bank Group, Washington D.C.134 OECD (2011) OECD (2011) Entreprenurship at a Glance, OECD, Paris

Australian Innovation System
Report 2
011
62
Table 3.2: Entrepreneurship framework conditions
IndicatorsLatest Figure
Reference Year
OECD Ranking(a)
Gap from the Top
Five OECD Performers
Baseline figure
Reference year
baseline figure
Change from
baselinefigure
Fear of failure rate(a) [1] 35.8(nd) 2010 18th 44.1% 35.8 2010 -
Perceived opportunities(b) [1] 45.7(nd) 2010 8th 20.6% 45.7 2010 -
Entrepreneurial intentions(b) [1] 8.7(nd) 2010 11th 60.4% 8.7 2010 -
Barriers to entrepreneurship [2] 1.1(nd) 2008 7th 17.6% 1.1 2008 -
Marginal personal income tax and social security contribution rates on gross labour income [2]
45.0(nd) 2009 14th 44.2% 45.0 2009 -
Statutory corporate income tax rates [2] 30.0(nd) 2009 15th 75.4% 30.0 2009 -
Starting a Business
Start-up procedures to register a business (number) [3] 2 2009 2nd No gap 2 2008 No
change
Time required to start a business (days) [3] 2 2009 2nd No gap 2 2008 No
change
Cost of business start-up procedures (% of GNI per capita) [3] 0.8% 2009 6th No gap 0.8% 2008 No
change
Closing a business
Time required to recover debt (years) [4] 1.0 2011 5th 38.9% 1.0 2010 No change
Cost required to recover debt (% of debtor’s estate) [4] 8.0% 2011 5th 135.3% 8.0% 2010 No
change
Recovery rate for creditors (cents on the dollar) [4] 81.8 2011 9th 9.8% 78.8 2010 3.8%
Sources: [1] Global Entrepreneurship Monitor, Adult Population Survey, 2010. [2] OECD, Measuring Innovation: A new perspective, 2010. [3] The World Bank, World Development Indicators & Global Development Finance, December 2010. [4] The International Bank for Reconstruction and Development / The World Bank, Doing Business 2011: Making a difference for entrepreneurs.Notes: (a) OECD rankings are performed on those OECD countries for which data is available. Individual data availability may vary between indicators. (b) These indicators refer to entrepreneurial attitudes. (nd) No new data. – = not applicable
Table 3.3: Entrepreneurship performance
IndicatorsLatest Figure
Reference Year
OECD Ranking(f)
Gap from the Top
Five OECD Performers
Baseline figure
Reference year
baseline figure
Change from
baselinefigure
Business entry rate (new registrations as % of total) [1] 14.3% 2005 3rd 1.1% 14.9% 2004 -3.6%
Firm death rate(a) [2] 15.4% 2008–09 n/a n/a 15.3% 2007–08 0.5%
Churn rate(b) [2] -0.96% 2008–09 n/a n/a -0.07% 2007–08 -1,206%
Firm survival rates (annual)(c) [2] 84.7% 2008–09 n/a n/a 84.7% 2007–08 -0.1%
Total Early-Stage Entrepreneurship Activity (TEA)(d) [3] 7.8(nd) 2010 4th 24.3% 7.8 2010 -
Opportunity entrepreneurship (% of TEA)(d) [3] 59.0%(nd) 2010 6th 12.7% 59.0% 2010 -
Ratio of opportunity to necessity entrepreneurship(e) [3] 3.1%(nd) 2010 11th 56.1% 3.1% 2010 -
Sources: [1] The World Bank, World Development Indicators & Global Development Finance, December 2010. [2] ABS (2011), Counts of Australian Businesses, including Entries and Exits, Jun 2007 to Jun 2009, 2008–09, cat. no. 8165.0. [3] Global Entrepreneurship Monitor, Adult Population Survey, 2010.Notes: (a)The firm death rate is defined as 100*{Exits/No. of businesses operating at the start of the financial year. (b) The churn rate is defined as Net (Births – Deaths)/Total Stock %, as it appears in the publication NESTA, Measuring Wider Framework Conditions for successful innovation: A system’s review of UK and international innovation data, January2011, pp. 36-37. n/a = not available. – = not applicable. (c) The survival rate is defined as 100 – Firm death rate. (d) GEM defines Total Early-Stage Entrepreneurship Activity (TEA) as the prevalence rate of individuals in the working-age population who are actively involved in business start-ups, either in the phase preceding the birth of the firm (nascent entrepreneurs), or the phase spanning 3½ years after the birth of the firm (owner-managers of new firms). The cut-off point of 3½ years has been made on a combination of theoretical and operational grounds. (e) Necessity entrepreneurs are those who have entered self-employment because they have no better options for work; in other words, they start businesses to generate income for themselves and their families. Opportunity entrepreneurs, on the other hand, have chosen to start businesses out of opportunity, even when they have other employment possibilities. (f) OECD rankings are performed on those OECD countries for which data is available. Individual data availability may vary between indicators. n/a = not available. – = not applicable. (nd) No new data.

Chapter 3: B
usiness Innovation
63
Business environment
This section looks at several framework conditions that influence the rate and extent of innovation: demand, competition and access to finance, including venture capital.
Demand for innovation
There is considerable amount of conceptual and empirical evidence to show that clear demand signals encourage innovation by reducing market uncertainty for innovators and investors.135 Demand from household consumers, firms and governments triggers innovation as they signal their changing needs and indicate their willingness and ability to adopt innovations as they are produced.136 Australian evidence shows that 74.6% of innovating businesses are motivated by competition, demand and market-related drivers (Chart 3.1). Uncertain demand for new goods and services, is a significant barrier to innovation, particularly for small firms (Chart 3.5).
Table 3.4 shows a number of demand indicators recommended by Britain’s National Endowment for Science and Technology and the Arts (NESTA) recent framework conditions for innovation report.137 The data describes general consumer’s ability to understand and use innovation, firms’ ability to absorb new technology, household purchasing behaviour of technology-intensive goods and services and the public procurement of advanced technology products. These indicators, although technology focussed give us the best comparative approximation of demand for innovation across OECD countries.138 The data suggests a high demand for innovation relative to other developed ‘innovation-driven’ countries.
Competition and innovation
It is generally agreed that competition between firms increases and reflects the level of innovation in the economy. Conceptual and empirical research has long argued that competition, by stimulating entrepreneurship and innovation, is the driving force of economic development as it encourages novelty or variety and thereby increases the diversity and productivity of the economy as less efficient firms are displaced.139,140,141 ABS data supports this argument. Non innovation-active firms are more than twice as likely to have no effective competition or a captive market, whereas innovation-active businesses are 40% more likely to operate in strongly competitive markets.142
Table 3.4 provides some other broad indicators of the level of competition between firms in Australia as well as the economy’s openness to international competition. The data shows that the intensity of local competition is high relative to other OECD countries. Other broader measures of competition, such as business entry rate, closure rate and churn, Australia also ranks relatively high and trending higher (Table 3.2). Measures of Australia’s exposure to international competition are mixed. Australia’s Trade-to-GDP ratio is very low on the OECD ladder whereas net foreign direct investment is relatively high (though still behind the top five OECD average).
135 Mowery D & Rosenberg N (1979) The influence of market demand upon innovation: A critical review of some recent empirical studies. Research Policy 8: 102-153 and Schmookler J (1962) Economic Sources of Inventive Activity. The Journal of Economic History 22: 1-20.
136 Edler J (2009) Demand Policies for Innovation in EU CEE Countries. Manchester Business School Working Paper No 579. Manchester Business School.137 Allman K, Edler J, Georghiou L, Jones B, Miles I, Modivar O, Ramlogan R & Rigby J (2011) Measuring wider framework conditions for successful innovation:
A system’s review of UK and international innovation data, Index Report, NESTA, UK.138 Ibid.139 Foster J (2010) Productivity, Creative Destruction and Innovation Policy, Australian Business Foundation Occasional Paper.140 Fagerberg J (2005) Innovation: A Guide to the Literature. In Fagerberg J, Mowery DC and Nelson R (Eds) The Oxford Handbook of Innovation, Oxford
University Press, Oxford UK.141 See also Kilponen J & Santavirta T (2007) When do R&D subsidies boost innovation? Revisiting the inverted U-shape. Bank of Finland Research Discussion
Papers, No 10. Bank of Finland, Helsinki; and Aghion P, Bloom N, Griffith R, Blundell R, & Howitt P (2005) Competition and Innovation: An Inverted U Relationship. Quarterly Journal of Economics 120: 701–28.
142 Australian Bureau of Statistics (2010) Selected Characteristics of Australian Business 2008–09, cat. no. 8167.0

Australian Innovation System
Report 2
011
64
Table 3.4: Business framework conditions for demand, competition and access to finance and other incentives to innovate
IndicatorsLatest Figure
Reference Year
OECD Ranking(f)
Gap from the Top
Five OECD Performers
Baseline figure
Reference year
baseline figure
Change from
baselinefigure
Buyer sophistication(a) [1] 4.40 2009–10 7th 12.0% 4.70 2008–09 -6.4%
Firm level technology absorption(b) [1] 5.90 2009–10 7th 6.9% 5.90 2008–09 No change
Percentage of final household consumption expenditure on Health, Communications and Education [2]
11.53%(nd) 2008 4th 29.7% 11.53% 2008 -
Government procurement of advanced technology products(c) [1] 4.10 2009–10 8th 12.4% 4.00 2008–09 2.5%
Intensity of local competition(d) [1] 5.70 2009–10 4th 3.7% 5.70 2008–09 No change
Trade (% of GDP) [3] 41.4% 2008 32nd 79.0% 40.7% 2007 1.7%
Business impact of rules on foreign direct investment (FDI)(e) [1]
4.90 2009–10 10th 15.5% 5.10 2008–09 -3.9%
Net Foreign Direct Investment Inflows as a percentage of GDP [3] 2.4% 2009 10th 97.0% 4.5% 2008 -46.3%
Total investment in early-stage venture capital as a % of GDP [4] 0.033% 2009–10 n/a n/a 0.054% 2008–09 -40.1%
Venture capital investment – Seed/Start-up as a % of GDP [2] 0.018(nd) 2008 13th 64.7 0.018 2008 -
Venture capital investment – Early development and expansion as a % of GDP [2]
0.117(nd) 2008 5th 20.1 0.117 2008 -
Market capitalization of listed companies (% of GDP) [3] 136 2009 2nd 5.5% 65 2008 109.3%
Stocks traded, total value (current US $billion) [3] 762 2009 10th 93.4% 1,018 2008 -25.1%
Stocks traded, total value (% of GDP) [3] 82.4 2009 8th 53.2% 97.9 2008 -15.9%
Stocks traded, turnover ratio (%) [3] 78.8 2009 18th 61.3% 103.1 2008 -23.6%
Sources: [1] World Economic Forum, The Global Competitiveness Report 2010-2011. [2] OECD, Measuring Innovation: A New Perspective 2010. [3] World Development Indicators & Global Development Finance, The World Bank, 2010. [4] ABS, Venture Capital and Later Stage Private Equity Survey, Australia, 2009–10, cat. no. 5678.0Notes: (a) For this indicator, survey respondents were asked to answer the question “In your country, how do buyers make purchasing decisions? [1 = based solely on the lowest price; 7 = based on a sophisticated analysis of performance attributes] (b) For this indicator, survey respondents were asked to answer the question “To what extent do businesses in your country absorb new technology? [1 = not at all; 7 = aggressively absorb]” (c) For this indicator, survey respondents were asked to answer the question “Do government procurement decisions foster technological innovation in your country? [1 = no, not at all; 7 = yes, extremely effectively]” (d) For this indicator, survey respondents were asked to answer the question “How would you assess the intensity of competition in the local markets in your country? [1 = limited in most industries; 7 = intense in most industries]”. (e) For this indicator, survey respondents were asked to answer the question “To what extent do rules governing foreign direct investment (FDI) encourage or discourage it? [1 = strongly discourage FDI; 7 = strongly encourage FDI]”. (f) OECD rankings are performed on those OECD countries for which data is available. Individual data availability may vary between indicators. (nd) No new data. – = not applicable. n/a = not available.

Chapter 3: B
usiness Innovation
65
Access to finance
There is often a gap between the rate of return required by a business investing its own funds and that required by external investors. Where internal funds are limited, such as in many SMEs, some innovations will fail to be developed because the cost of external capital is too high.143 Access to finance has always been a high barrier to innovators and entrepreneurs in Australia. ABS data shows that at least two thirds of innovation active Australian firms spend money on innovation.144 Access to finance in Australia was the highest barrier to innovation in Australia during the global financial crisis (Chart 3.5). External equity has a major role in financing investments in innovation.145 Availability of funds and the efficient functioning of markets are essential if companies are to raise high risk investment capital for early-stage investment through to supporting large firms in financing significant technological developments.146 Two indicators from the World Economic Forum’s Global Competitiveness Index (GCI), the ease of raising money from issuing stock market shares and ease of getting bank loans with no collateral and a good business plan – show very few countries with high scores, although Australia ranks, respectively, third and fifth in the OECD on those indicators.
Table 3.4 shows that Australia performs relatively well when it comes to access to finance in terms of financial assets and liquidity measures. The market capitalisation of listed companies, representing the size of the capital market, has doubled since last year to rank third in the OECD. Although the absolute size of the Australian stock market is small by some international comparisons, its relative liquidity provides fertile ground for entrepreneurs and innovators looking for late stage equity investment. The total value of stocks traded as a proportion of GDP (a liquidity measure) has fallen since 2008 but still ranks ninth in the OECD. The stocks traded turnover ratio (total value of shares traded during the period divided by the average market capitalization for the period) has also fallen since 2008, but remains in a moderate position in the OECD.
Venture capital is seen as crucial in innovation-driven economies as it provides significant funding for commercially high risk early-stage opportunities which may eventually redefine industries and sectors.147
It should be noted here that there is no data for the amount of informal investment (such as from family members or angel investors) in new business ventures. Evidence from the USA suggests that informal investment accounts for around 99.9% of new businesses and 92% of total investment.148 The World Economic Forum’s GCI ranks Australia 6th in the OECD for the ease in which entrepreneurs with innovative but high risk projects find venture capital.149 This is based on an executive opinion survey and may also reflect data from Chapter 1 showing that most Australian businesses are not creating world first innovations. Chart 3.10 shows investment in venture capital (including late expansion) in a selected group of OECD countries where this data is available. Like the GCI, Chart 3.10 shows that Australia is well positioned on this indicator. However it is important to note that the OECD definition is the sum of “seed/start-up stages” and “early development and expansion stages” while the definition of venture capital used in Australia encompasses pre-seed, seed, start-up and early expansion (but not late expansion). Thus, the full column in Chart 3.10 includes the late expansion stage. In other words, under the Australian definition the full column represents a mix of venture capital and private equity and does not accurately represent the capital available for new high risk firms.
In contrast to the total venture capital investments (including late expansion) compared in Chart 3.10, Australia’s percentage of GDP invested in seed/start-up stage venture capital ranks 13th out of 23 countries at 0.018%. Although this small percentage of GDP devoted to seed/start-up stages is similar to the US, it highlights a scarcity of available capital for early-stage innovative firms in Australia.
The global financial crisis reduced availability of capital in Australia and elsewhere. The 2009–10 Venture Capital and Later Stage Private Equity survey150 found that since 2007–08 (and the onset of the GFC) total investment in venture capital (new and follow-on) has decreased by 53%, and new investments decreased by 69%. Total investment in venture capital decreased by 39% from 2008–09 to 2009–10 or $419 million compared to $683 million as Chart 3.11 indicates.
143 Hall BH & Lerner J (2010) The Financing of R&D and Innovation, In, Hall BH & Rosenberg N (eds.) Handbook of the Economics of Innovation, Elsevier-North Holland.
144 Chart 1 from the Introduction shows that about one-third of innovation-active businesses do not spend money on innovation. 145 Brown JR, Martinsson G & Petersen BC (2011) Do Financing Constraints Matter for R&D? Social Sciences Research Network Working Paper Series
(May 5, 2011).146 Allman K, Edler J, Georghiou L, Jones B, Miles I, Modivar O, Ramlogan R & Rigby J (2011) Measuring wider framework conditions for successful innovation: A
system’s review of UK and international innovation data, Index Report, NESTA, UK.147 Ibid.148 Bygrave WD (2004) Financing entrepreneurs and their ventures, In, Global Entrepreneurship Monitors 2003 Executive Report, Ewing Marion Kauffman
Foundation, USA149 World Economic Forum (2010) The Global Competitiveness Report 2010-2011, Washington DC150 Australian Bureau of Statistics (2011) Venture Capital and Later Stage Private Equity, Australia 2009–2010, cat. no. 5678.0

Australian Innovation System
Report 2
011
66
Chart 3.10: Venture capital and late expansion investments as a percentage of gross domestic product, 2008151
Source: OECD (2009), Measuring Entrepreneurship—A Collection of Indicators based on OECD Entrepreneurship Financing Database
Chart 3.11: Venture Capital New and Follow-on Investment, 2005-06 to 2009–10
Source: ABS (2011) Venture capital and later stage private equity, Australia, 2009-10. cat. no. 5678.0
151 OECD (2009), Measuring Entrepreneurship—A Collection of Indicators based on OECD Entrepreneurship Financing Database
Seed/start-up
Early development and expansion
0.00
0.05
0.10
0.15
0.20
0.25
Finl
and
Swed
en
Uni
ted
Kin
gdom
Nor
way
Den
mar
k
Aus
tral
ia
Irel
and
Swit
zerl
and
Fran
ce
Spai
n
Uni
ted
Stat
es
Cze
ch R
epub
lic
Net
herl
ands
Bel
gium
Ger
man
y
Can
ada
Kor
ea
Hun
gary
Ital
y
Por
tuga
l
Aus
tria
Pol
and
Gre
ece
Per
cent
age
Follow-on
New
Tota
l inv
estm
ent,
$m
illio
n
485
603 653
366
200
184
193
248
317
219
0
100
200
300
400
500
600
700
800
900
1000
2005–06 2006–07 2007–08 2008–09 2009–10

Chapter 3: B
usiness Innovation
67
Intellectual property
The creation and protection of Intellectual Property (IP) is one of the pillars of a successful national innovation system. Protection of IP is important so inventors and producers of original work have economic incentives to begin or continue innovating. In the long term, this may have an important economic impact because innovative firms and foreign investors prefer locations with stronger IP laws. A joint research project of the World Intellectual Property Organisation (WIPO) and the United Nations University which measured the impact of IP systems on six Asian countries found “a positive correlation between the strengthening of the IP system and subsequent economic growth.”152
IP data such as patent numbers have been traditionally used as intermediate ‘output’ measures of the innovation system. Trademarks and designs are also useful indicators of innovation in industries where branding and design are key elements in market competition. Trademark applications are highly correlated with other innovation indicators and have a broader coverage of non-technological innovations.153 Trademarks are therefore a better indicator of service sector innovation.
Australia’s IP regulatory environment is being used by a large number of innovation-active businesses in Australia. OECD evidence shows that firms that engage in patenting have higher survival rates than firms that do not.154 This further underlines the importance of innovation. Chart 3.12 shows that innovating Australian businesses are much more likely to engage in intellectual property protection compared to non-innovators. Innovators also utilise other measures as well as regulatory protection as evidenced by the high proportion of innovating businesses using secrecy or confidentiality agreements (23.9%), compared to non-innovating businesses (6.7%).
Chart 3.12: Australian business intellectual property protection methods used by innovation status, 2008–09
Source: ABS (2010) Selected characteristics of Australian businesses, 2008-09. cat. no. 8167.0
Table 3.5 shows indicators of intellectual property activity for Australia against baseline figures and other OECD countries. The largest increase occurred in Australian designs certified by IP Australia followed by Australian patents granted by IP Australia, while trademarks registered contracted slightly. The table also shows drops in 2008 relative to 2007 in patents indicators relative to million of population, while the share of world triadic patent families remained almost unchanged.
152 WIPO (2007) Measuring the Economic Impact of IP Systems, World Intellectual Property Organisation, New York153 OECD (2010) Measuring Innovation, OECD, Paris154 OECD (2009) Innovation in Firms: A Microeconomic Perspective, OECD, Paris
Innovation–active businesses
Non-innovation–active businesses
Per
cent
age
of r
espo
nden
ts
0
5
10
4.0
15
20
25
30
35
40
Patents Registrationof design
Copyright ortrademark
Secrecy orconfidentialityagreements
Complexity ofproduct design
Any methods usedto protect
intellectual property
1.4
4.8
0.8
17.5
4.6
23.9
6.77.9
0.8
37.2
11.2

Australian Innovation System
Report 2
011
68
Australia’s OECD rankings (7th in designs and 6th in trademarks compared to 18th in patents) suggest that Australia has relative strengths in areas characterised by non-technological or service innovation. However, this is a complex issue. OECD analysis shows that most innovative firms introduce both product and process innovations, as well as marketing or organisational innovations. This is the case for both manufacturing and service firms.155
Table 3.5: Australia’s performance in intellectual property against other OECD countries
IndicatorsLatest Figure
Reference Year
OECD Ranking(a)
Gap from the Top
Five OECD Performers
Baseline figure
Reference year
baseline figure
Change from
baselinefigure
Patents granted by IP Australia, for Australian residents [1] 1,179 2010 - - 1,052(r) 2007 12.1%
Designs certified by IP Australia, for Australian residents [1] 328 2010 - - 238(r) 2007 37.8%
Trade Mark applications from Australian residents [1] 39,693 2010 - - 39,846(r) 2007 -0.4%
Share of world triadic patent families [2] 0.62 2008 17th 96.1% 0.62(r) 2007 0.1%
Triadic patent families per million population [2] 13.72 2008 19th 84.9% 14.23(r) 2007 -3.6%
Share of world patent applications filed under PCT [2] 1.35 2008 12th 91.0% 1.39(r) 2007 -2.3%
Patent applications filed under PCT per million population [2] 82.76 2008 18th 69.1% 95.55(r) 2007 -13.4%
Trademark registrations per million population [3, 4] 1,524 2009 6th 54.3% 1,700(r) 2008 -10.3%
Industrial design registrations per million population [3] 162 2009 7th 73.7% 176(r) 2008 -8.19
Sources: [1] IP Australia, special data request. [2] OECD, Main Science and Technology Indicators database, 2010/2. [3] World Intellectual Property Organisation (WIPO), WIPO Statistics database, January 2011. [4] The latest available trademark registrations data for Australia was provided by IP Australia, based on the WIPO data, as per [3].Notes: (a) OECD rankings are performed on those OECD countries for which data is available. Individual data availability may vary between indicators. (nd) No new data (r) The baseline has been revised according to the latest available data. – = not applicable.
Government initiatives that foster business innovation
Governments across Australia have a large number of initiatives that support business innovation (Figure 3.1). These initiatives:
› Foster a culture of innovation;
› Build innovation capacity through mentoring and advice services, networking and collaboration initiatives (Chapter 4), skills development (Chapter 2) and technology fore-sighting and adoption;
› Support R&D, design and other knowledge creation activities;
› Support proof of concept, demonstration and other commercialisation and market development activities; and
› Encourage increased investment in innovation activities.
The majority of business innovation programs focus on building the capacity of businesses to innovate (for example Enterprise Connect156 and the NSW Government’s Sustainability Advantage Program157) and support for early-stage commercialisation (such as Commercialisation Australia158 and the Queensland Government’s Proof of Concept Fund159). Governments also support the growth of venture capital markets because of their critical role in providing finance for fast growing new companies. This focus aligns with the Australian Government’s stated National Innovation Priorities 3 and 4.
155 OECD (2010) Measuring Innovation, OECD, Paris, p.26156 http://www.enterpriseconnect.gov.au157 http://www.environment.nsw.gov.au/sustainbus/sustainabilityadvantage.htm158 http://www.commercialisationaustralia.gov.au159 http://www.sd.qld.gov.au/dsdweb/v4/apps/web/content.cfm?id=10388
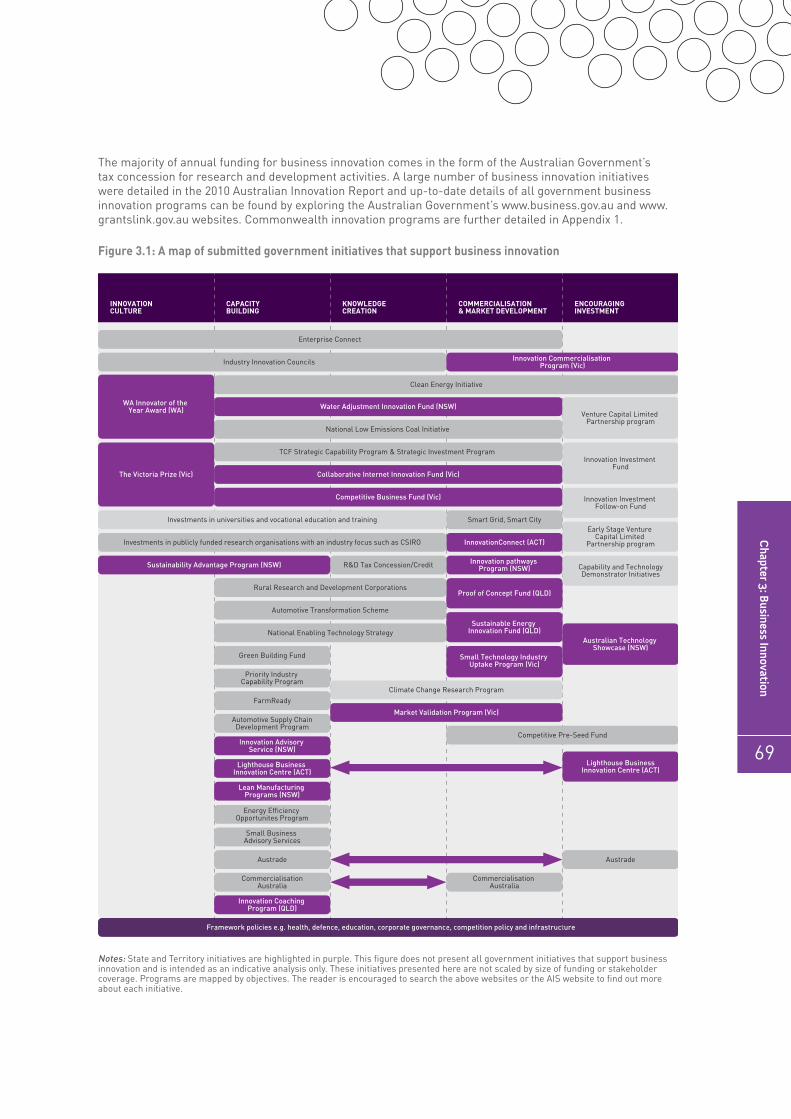
Chapter 3: B
usiness Innovation
69
The majority of annual funding for business innovation comes in the form of the Australian Government’s tax concession for research and development activities. A large number of business innovation initiatives were detailed in the 2010 Australian Innovation Report and up-to-date details of all government business innovation programs can be found by exploring the Australian Government’s www.business.gov.au and www.grantslink.gov.au websites. Commonwealth innovation programs are further detailed in Appendix 1.
Figure 3.1: A map of submitted government initiatives that support business innovation
Notes: State and Territory initiatives are highlighted in purple. This figure does not present all government initiatives that support business innovation and is intended as an indicative analysis only. These initiatives presented here are not scaled by size of funding or stakeholder coverage. Programs are mapped by objectives. The reader is encouraged to search the above websites or the AIS website to find out more about each initiative.
Framework policies e.g. health, defence, education, corporate governance, competition policy and infrastructure
Smart Grid, Smart City
InnovationConnect (ACT)
Innovation pathways Program (NSW)
Proof of Concept Fund (QLD)
R&D Tax Concession/Credit
Green Building Fund
Priority Industry Capability Program
FarmReady
Automotive Supply ChainDevelopment Program
Small Technology Industry Uptake Program (Vic)
Water Adjustment Innovation Fund (NSW)
National Low Emissions Coal Initiative
TCF Strategic Capability Program & Strategic Investment Program
Collaborative Internet Innovation Fund (Vic)
Competitive Business Fund (Vic)
Investments in universities and vocational education and training
Investments in publicly funded research organisations with an industry focus such as CSIRO
Sustainability Advantage Program (NSW)
Rural Research and Development Corporations
Sustainable Energy Innovation Fund (QLD)
Automotive Transformation Scheme
National Enabling Technology Strategy
Enterprise Connect
Clean Energy Initiative
WA Innovator of the Year Award (WA)
The Victoria Prize (Vic)
Lighthouse Business Innovation Centre (ACT)
Venture Capital Limited Partnership program
Innovation Investment Fund
Innovation Investment Follow-on Fund
Early Stage Venture Capital Limited
Partnership program
Capability and TechnologyDemonstrator Initiatives
Lighthouse BusinessInnovation Centre (ACT)
Australian Technology Showcase (NSW)
Industry Innovation Councils Innovation Commercialisation Program (Vic)
CommercialisationAustralia
Small Business Advisory Services
Energy Efficiency Opportunites Program
Austrade
Innovation Coaching Program (QLD)
Austrade
Commercialisation Australia
Competitive Pre-Seed Fund
Market Validation Program (Vic)
Climate Change Research Program
Innovation Advisory Service (NSW)
Lean Manufacturing Programs (NSW)
ENCOURAGING INVESTMENT
KNOWLEDGE CREATION
COMMERCIALISATION& MARKET DEVELOPMENT
INNOVATIONCULTURE
CAPACITYBUILDING

Australian Innovation System
Report 2
011
70
The following section provides an update on policy developments in existing programs and introduces new initiatives announced since the last report.
R&D Tax Credit
The R&D Tax Credit will be a broad-based, market-driven package to replace the R&D Tax Concession with a tax credit system. Key points include a 45% refundable tax credit (the equivalent to a 150% tax deduction) for small firms with an annual turnover of less than $20 million and a 40% non-refundable tax credit (the equivalent of a 133% tax deduction) for firms with an annual turnover of more than $20 million. The R&D Tax Credit legislation is currently awaiting debate in the Senate on 15 June 2011, the Minister welcomed crossbench Senator’s support on the new R&D Tax Credit which will commence for income years starting on or after 1 July 2011.
Automotive Transformation Scheme
The Automotive Transformation Scheme (ATS) commenced on 1 January 2011. The $3.4 billion ATS is directed towards encouraging new investment and innovation in the Australian automotive industry. It provides support payments of up to 50% of investment in eligible research and development, whilst investment in plant and equipment will receive support payments of up to 15 per cent. Participants in the Automotive Transformation Scheme are required to demonstrate progress towards achieving economic sustainability, improved environmental outcomes and workforce skills development.
Support through the ATS will help the local industry transition to the new carbon dioxide emission standards for all new light vehicles scheduled to take effect from 2015.
Commercialisation Australia
In its first 16 months of operation, Commercialisation Australia awarded a total of $44.95 million for 115 contracted projects. Some of the latest projects include biomedical products for targeted drug delivery, a braking innovation to improve safety and reliability of heavy vehicles and reduce brake wear, and a plantation system for biofuel production on otherwise marginal land. Commercialisation Australia helps create an enhanced innovation ecosystem, where access to skills, networks and experience are just as important as funding for commercialising intellectual property and building competitive businesses. Volunteer business mentors complement the assistance provided by Commercialisation Australia’s experienced case managers by offering guidance and practical approaches to assist participants tackle specific commercialisation hurdles and to build valuable business networks.
Commercialisation Australia’s broad mandate includes investigating new approaches to commercialisation policy and their applicability to the Australian innovation system, to enable the program to respond to changes in the innovation landscape and remain relevant. A Pilot Programs component was launched recently to fund pilot programs of up to 12 months duration. Up to $2 million per year will be available to run one large, or a number of smaller projects to test new approaches to commercialisation. Applications for pilot programs may be made by individuals, corporations, industry bodies or government. If a pilot program is successful it could, subject to appropriate Government approval, become a permanent stream of assistance under Commercialisation Australia.
Australian Centre for Renewable Energy (ACRE)
The Australian Centre for Renewable Energy (ACRE)160 is a component of the Government’s expanded $5 billion Clean Energy Initiative (CEI). ACRE’s objective is to promote the development, commercialisation and deployment of renewable energy and enabling technologies and to improve their competitiveness in Australia. Over $690 million has been committed for ACRE to fund renewable energy and enabling technology development.
In July 2010, the Government announced the establishment of a new $100 million Renewable Energy Venture Capital (REVC) fund to make critical early-stage equity investments that leverage private funds to help commercialise emerging renewable technologies, for instance in geothermal, solar, wave and bio-energy technologies. The program is part of the CEI and complements the suite of programs administered by ACRE, including the Emerging Renewables Program and the Renewable Energy Demonstration Program.
160 http://www.ret.gov.au/energy/clean/cei/acre/Pages/default.aspx

Chapter 3: B
usiness Innovation
71
The Minister for Resources and Energy released the REVC Program Administrative Guidelines and opened the program for applications on 10 May 2011. ACRE is seeking to appoint up to two experienced fund managers that have the capability to support renewable energy companies in commercialising their technologies. The selection of venture capital fund managers will be undertaken through a competitive merit assessment process. Applications closed on 22 June 2011. It is expected that venture capital fund manager(s) will be licensed in early 2012.
Enterprise Connect
During 2010, Enterprise Connect has continued to provide a range of services and support to help firms build their internal capacity and capability. One thousand one hundred and thirty five Australian SMEs benefited from the Enterprise Connect Business Review service, with 612 Tailored Advisory Service improvement projects which flow from the business reviews being completed. Enterprise Connect also continued to deliver the Researchers in Business initiative, provide Workshop, Industry Intelligence and Networking (WIIN) grants, provide technology advice through Technology and Knowledge Connect (TKC), and provide access to equipment through the Technical Partnerships Equipment Register (TPER).
The Australian Government’s new Clean 21 initiative, announced at the 2010 election, is helping Australian manufacturers reduce pollution and fight climate change. Core to this is the $4 million Making Better Managers program, which Enterprise Connect has begun implementing, and aims to lift management skills in SMEs and embed change. Improved management will enable SMEs to better seize new business opportunities in climate change technology as well as reduce waste and resource consumption in their processes.
Venture capital programs
Governments across Australia support a number of venture capital (VC) funds through direct co-funding and tax incentives. Programs include the Innovation Investment Fund (IIF), the Early-Stage Venture Capital Limited Partnerships161 program and the TransTasman Commercialisation Fund.162
To identify the impact of the fund managers in the Australian Innovation Investment Fund (described below) compared to fund managers outside the program, an independent econometric analysis was undertaken in 2010163. The analysis found that:
› Funds affiliated with IIF managers are more likely to finance start-up and early-stage firms than other types of private funds;
› IIF fund managers have developed expertise in financing early-stage firms but not to the extent of more experienced overseas counterparts;
› The program has provided finance that in the absence of the program would not have otherwise been available;
› IIF investments are significantly more highly concentrated in the biotechnology and internet sectors when compared to the investments of commercial (non-IIF) funds;
› The program has made modest returns; however, the full value of the program is not captured in any financial measure alone; and
› Foreign investors do not typically support VC in Australia.
The analysis also noted that the IIF program has raised considerable capital that has been well targeted and has not competed with private venture capital initiatives. Further, a cadre of professional early-stage fund managers have been created, and while not having the depth of skills or experience of their US or European peers, has produced a material improvement in innovation finance capacity and capabilities.
Innovation Investment Fund
The Innovation Investment Fund (IIF)164 commenced in 1997. It is a venture capital co-investment program that aims to develop fund managers, encourage the growth of new companies that are commercialising R&D, create a medium term self sustaining funding pool, and develop a self sustaining early-stage venture capital industry in Australia.
161 http://www.ausindustry.gov.au/VentureCapital/EarlyStageVentureCapitalLimitedPartnershipsESVCLP/162 http://www.ttcf.com.au/163 Murray GC, Cowling M & Liu W (2010, forthcoming) Exeter University, http://www.innovation.gov.au/Innovation/Policy/Pages/IndependentEconometric
AnalysisofIIF.aspx164 http://www.ausindustry.gov.au/VentureCapital/InnovationInvestmentFundIIF/
Australian Innovation System
Report 2
011
72
The program supports fund managers to invest in early-stage companies commercialising Australian R&D. It involves co-investment of government and private sector capital. Of the 16 licensed funds under IIF, only seven have the capacity to make new and follow on investments, as the other nine will cease thier IIF fund within the next 12 months. The IIF funds support the development of early-stage companies in variety of sectors, including biotechnology, internet, information technology and telecommunications, industrial/energy and medical.
On 9 June 2011, Minister Kim Carr announced three successful $40 million funds under the third funding tranche of the IIF, Round 3. The Government will provide $20 million to each fund to commercialise Australian research across a range of sectors.
Innovation Investment Follow-on Fund
The Australian Government’s Innovation Investment Follow-on Fund (IIFF)165 is a temporary, targeted and timely response to the lack of venture capital available to high potential innovative companies during the global financial crisis. The program was implemented in August 2009 and will run for three years. To 21 June 2011, $55.9 million (of total program funding of $64.4 million) had been paid to fund managers for follow-on investment in these companies.
Improving enforcement of intellectual property rights
Two recent reviews by the Government’s Advisory Council on Intellectual Property (ACIP) found that owners of patents and plant breeder’s rights often encounter difficulties in enforcing their intellectual property (IP) rights. ACIP concluded that the cost and time needed to resolve an IP dispute may pose challenges to small and medium-sized enterprises.
The Australian Government has responded to recommendations made by ACIP and accepted most of these recommendations. Measures will be introduced to improve the ability of IP right owners to enforce their rights and resolve IP disputes at an early stage.
IP Australia, the Government agency responsible for patents, trade marks, designs and plant breeder’s rights, will set up an online resource to help IP owners find cheaper and faster alternatives for resolving IP disputes through mediation and arbitration.
Australian Capital Territory – InnovationConnect (Icon)
InnovationConnect (ICon) is an Australian Capital Territory (ACT) Government initiative that provides creative innovators and entrepreneurs with small grant funding to support the development and commercialisation of viable, creative ideas. This initiative fills the funding gap that early stage innovative companies face in taking their product or service to investment readiness or commercialisation. The program was initially funded over a period of three years in the 2007 08 ACT Budget and formally commenced receiving applications in September 2008. The 2009–10 ACT Budget renewed ICon’s funding for a further four years. To date ICon has received 89 applications seeking $2.4 million. Of these, 61 applications have been funded with approximately $1.03 million committed in grant support. The program also operates as pipeline for local businesses to access a range of Government support services. ICon involvement assists in facilitating an introduction to the Canberra region’s commercialisation pathway and raises awareness of the range of locally available business support resources including Canberra BusinessPoint, Lighthouse Business Innovation Centre and federally funded programs such as Commercialisation Australia.
A mid-term independent review of the InnovationConnect (ICon) grant program was completed in September 2010. The review strongly supported the continuation of ICon, noting the value to the ACT Government in maintaining a grant program of this nature to assist in effectively interacting with the commercialisation component of the private sector. The review also found strong support for the program from employer groups, industry, ACT-based universities, AusIndustry, Commercialisation Australia and business angels. Exposure through the ICon program was successful in facilitating an introduction to the Canberra region’s commercialisation pathway, leading ACT small and medium businesses to other sources of funds and advice both locally and federally, and raising awareness of the range of locally available business support resources.
165 http://www.ausindustry.gov.au/VentureCapital/InnovationInvestmentFollowonFund/

Chapter 3: B
usiness Innovation
73
Queensland Government’s new Innovation Voucher Program
In October 2010 the Queensland Government launched – What’s Your Big Idea Queensland?166 The Queensland Government has allocated $2.5M for this initiative over two years in conjunction with the Australian Industry Group to deliver this pilot program aimed at giving small to medium-sized Queensland businesses access to expertise to put their big ideas to action to improve business performance and competitiveness. Selected businesses will receive a voucher worth up to $50,000 to turn their idea into reality within 12 months. This funding can be used for:
› New product/process development
› New business model development
› New service delivery or customer interface
› New service development
› Innovation/technology audits
› Access professional skills and research
› Introduce knowledge of a scientific, technical or innovative nature that is new to the enterprise
› Costs associated with securing intellectual property rights
Applications closed on the 10th December 2010 with winners announced on the 19th April 2011.
NSW Smallbiz Website and Tool Kit
The NSW Government’s Smallbiz website and Small Business Tool Kit provides information designed to enhance the productive capacity of small businesses. Events, news, interactive resources, and specialist assistance is delivered by videos, detailed learning modules, quizzes, case studies, directories and planning tools. The self-paced interactive Small Business Tool Kit develops business knowledge such as improving systems and processes; financial management; and improving customer relations.
Since its launch in September 2009, the Smallbiz website has serviced over 410,000 unique visitors who have accessed 2 million pages. The Small Business Tool Kit has received around 155,000 unique visitors of which around 8,500 have registered an account to enable them to develop business knowledge and prepare and save business plans.
Victorian Competitive Business Fund supporting Innovation
In 2010–11, the Victorian Government commenced implementing the Competitive Business Fund. This $11.4 million grants program supports Victorian businesses to build their competitive edge and take advantage of emerging global opportunities.
The program targets growing and competitive Victorian businesses with the potential to move into new markets, to develop processes and solutions, or to invest further in their business in order to enhance their competitiveness and capitalise on emerging opportunities.
Twenty four grants worth a total of $5,670,000 were provided in Round One of the Competitive Business Fund, supporting business investments worth more than $70,000,000 in total for new equipment, infrastructure, technology and product or process innovation.
Funding has been provided under two streams on a co-contribution basis:
› Up to $250,000 for a project involving one company
› Up to $500,000 for a collaborative project involving multiple companies.
Applications for grants under Round Two of the Competitive Business Fund opened in February 2011 and closed 8 April 2011. Round Two grants will be progressively announced in 2011.
166 http://www.bigideaqld.com.au/

Australian Innovation System
Report 2
011
74
Victoria Smart SMEs Innovation Commercialisation Program
The Smart SMEs Innovation Commercialisation Program (ICP)167 is a new Victorian Government initiative that assists Victorian technology businesses to progress along the commercialisation pathway towards establishing global markets. The Smart SMEs ICP aims to grow globally competitive businesses by building commercialisation skills and capabilities, facilitating access to finance and boosting the adoption of technology by industry.
The Smart SMEs ICP is delivered through contracted partner organisations (program partners) specialising in technology commercialisation. More than 120 Victorian technology SMEs are expected to benefit from targeted assistance to help them commercialise innovative, technology-based products and processes and provided help in establishing domestic and global markets. The Victorian Government has appointed five program partners to deliver commercialisation support services for Victorian SMEs from late 2009/late 2010 to mid-2013.
Western Australia’s Innovation Gateway
The Western Australian Innovation Gateway168 is a planned one-stop, online portal for organisations and innovators seeking to establish networks, identify opportunities and further develop their business innovation activities in WA. The objective of the Gateway is to connect innovators and facilitate collaboration and commercialisation opportunities in WA by allowing WA innovators and entrepreneurs to access the innovation community as well as to provide nationwide and international access to the WA innovation community.
The Gateway will be designed to allow user-generated content to be added to the Gateway, allowing participants to update their own content in a ‘wiki’ style; and to accommodate a flexible delivery style so that new applications can be created based on user-demand in the future.
167 http://www.business.vic.gov.au/BUSVIC/STANDARD/PC_64154.html168 More information is available online at www.innovation.wa.gov.au.

Chapter 3: B
usiness Innovation
75
The SmartCap. Image provided by CRCMining.
Case studies
This section profiles a number of Australian business innovations. Additional case studies on business innovation can be found in the Case Study companion to this report.
Opal Therapeutics Pty Ltd – Opal Immunotherapy
Opal Therapeutics Pty Ltd is developing a potential immunotherapeutic for human immunodeficiency virus (HIV) utilising technology that originates from the University of Melbourne. Opal immunotherapy uses short peptides from the target virus to generate a strong immune response so patients can improve control of the infection. The peptides are mixed ex vivo (outside the body) with blood where they bind to immune cells and are then distributed to all parts of the body to stimulate the immune response. The technique requires a single patient visit for each treatment. It is highly advantageous when compared to current HIV treatments such as cell-based vaccine techniques which usually require time-consuming isolation of rare specialised cells from blood.
Opal Therapeutics has already demonstrated strong reduction of the acquired immune deficiency syndrome (AIDS) virus in non-human primate studies with the Opal technology. In collaboration with the Massachusetts General Hospital in the USA and Medicines Development Limited in Australia, Phase 1 clinical trials of the Opal immunotherapy for HIV were initiated in 2010. The trials will assess the safety and immunogenicity of the therapy for the first time in humans.
CRC Mining and Smart Cap
The Cooperative Research Centre for Mining (CRCMining) has developed a baseball cap headwear technology to measure and manage drowsiness in real time, in order to overcome the significant problem of driver fatigue in the coal mining industry.
Known as the SmartCap Operator Fatigue Management System, the baseball cap technology solves a problem identified in the mining industry and is expected to be of much wider benefit to other workplaces where fatigue is a major concern.
Supported by CRCMining member Anglo American Metallurgical Coal, the SmartCap has evolved from a field-proven prototype in 2008 to commercial trials in 2010. AngloAmerican is currently providing SmartCaps to heavy vehicle drivers and heavy machine operators at its coal mine sites across Australia, and CEO, Cynthia Carroll, has confirmed deployment to mines in other countries will follow during 2011.
Each baseball cap contains brain monitoring sensors concealed in the cap lining and uses an operator’s brain wave information to calculate a measure of drowsiness. This calculation is wirelessly communicated to a display in-cab, or to any Bluetooth enabled device to alert the driver or operator of fatigue.
Such fatigue is most pervasive in long-haul transport and heavy industries such as construction and mining, where it is responsible for hundreds of fatalities and injuries each year as well as millions of dollars in lost productivity. In the absence of appropriate fatigue management strategies and technologies, this problem is exacerbated by the combination of an ageing workforce and increasing demands on operators to achieve production quota.
‘Mining companies are committed to safety, and this commitment has translated into a successful collaboration that will benefit the global mining industry, and the wider community,’ project manager Dr Daniel Bongers said. ‘This project has been good for industry, and good for Australia. The coming year is full of promise and excitement for the project team, for CRCMining and for the mining industry,’ he said.
With the look and feel of a typical baseball cap, the SmartCap has overcome operator acceptance problems experienced at mining sites where camera or response based technologies have been implemented in the past.

Australian Innovation System
Report 2
011
76
Dyesol’s DSC technology is a low-cost, large scale solution for renewable energy. Image provided by Dyesol.
Dyesol Ltd – Solar Energy
Solar technology that mimics the energy-making processes of plants will soon enable building materials to generate their own electricity.
‘It’s an exciting time to be developing this technology, with industry beginning to understand that solar power generation is a potential value-add for a range of existing products,’ says Sylvia Tulloch, Director of Dyesol Ltd.
Silicon-based first-generation photovoltaic panels are expensive to manufacture and difficult to mount on buildings. An alternative method of solar power generation being developed by Dyesol can be layered directly onto existing materials such as glass panels or steel roof cladding, effectively turning them into solar cells. Dyesol’s third-generation dye solar cell (DSC) technology is a form of photovoltaic cell that uses artificial photosynthesis to mimic the processes used by plants to generate energy.
‘Because it is a layer technology, you can layer it onto most substrate materials,’ Tulloch says. ‘It can go on to glass, it can go on to a car, or it can go onto parts of a mobile phone or a laptop, in a way that first generation cells cannot.’
DSCs are made up of a nano-scale pigment and photoelectric dye sandwiched between layers – one layer can be of glass or metal, topped by either glass or plastic. Light striking the glass excites electrons that are absorbed by the pigment and create an electric current many times stronger than that found in plants. Transparent dye solar cells can be layered onto glass which can be incorporated directly into building designs, and the cells can absorb light falling on both faces of the glass. Dyesol has also demonstrated multi-coloured flexible cells to suit military applications such as battery re-charging in the field.
The technology has a lower cost of manufacture than first-generation photovoltaic cells and is more efficient when generating electricity in suboptimal conditions, such as when light falls at wide angle, or during cloudy weather. For this reason, Sylvia Tulloch says DSC promises to be the first solar cell technology that can be economically competitive with traditional forms of power generation in the normal light conditions experienced by most cities.
“[Dyesol’s] goal is to form partnerships with companies in various market sectors that can take advantage of the dye solar cell technology,”Ms Tulloch says. The company is seeking other global joint venture partners to provide vertical market specialisation. Dyesol is also supplying materials to solar researchers around the world. In April 2009, Dyesol raised $10 million for further international development. Since 2008 Dyesol has partnered with British steelmaker Corus and with the US-based glassmaker Pilkington (PNA) as well as a joint venture in Korea, all aimed at developing new commercial applications for Dyesol’s technology and exploring new markets.
Dyesol will continue to conduct research and development activities in NSW, where it has a $2.4 million manufacturing facility for the production of new generations of its technology for use in pilot programs. Dyesol has also signed a collaboration agreement with the CSIRO to develop next-generation dyes, and has research and development projects under both Commonwealth (ARC Linkages) and State (Queensland Smart State) with Queensland University of Technology. Dyesol has recently won a share in a ¥2.5 billion (A$29 million) pool of grant money awarded to five international firms by Japan’s Ministry of Trade (METI). Dyesol will use the money to establish a new R&D centre and promote links with other research centres within Japan.
Sylvia Tulloch believes says the potential for DSC technology is enormous. In the case of steel coatings alone the annual addressable market is forecast to be over 200 million m2 of photovoltaic product, generating up to 35GW of electricity. She says that Dyesol’s lower cost, its ability to produce electricity more efficiently in low light conditions, and the fact that it can be directly incorporated into buildings by replacing conventional glass panels or metal sheets, makes it a strong contender in the growing solar industry.

Chapter 3: B
usiness Innovation
77
Australian Membrane Technologies
Australian Membrane Technologies Pty Ltd (AMT) was established in 2007 to commercialise the Australian Nuclear Science and Technology Organisation’s (ANSTO) novel waste-water treatment technology. AMT provides a unique water recycling product that aims to revolutionise household-water use through recycling, cutting water and power consumption by at least 60%. The product is a nano-particulate membrane bioreactor (NMB) which is best described as a simple arrangement of gills that uses bacteria to operate as a lung and stomach, which literally eats waste matter and breathes air, so it is self perpetuating. Patented by ANSTO, the technology is cost effective and is ideal for recycling sewage and grey (washing machine) water for waste-water treatment for domestic use, small-scale industrial use, and large municipal treatment plants.
The NMB contains a biomass, which is essentially many cells made up of fungi and bacteria, which eat solid material. In most current systems, cells are grown in liquid, which means oxygen (which is needed) levels are low and aeration is expensive. With the NMB, cells are grown on one side of the membrane in direct contact with air, enabling 50 times as much biomass (cells) to grow on the membranes, compared to other such membrane-surface culture technologies’. On the other side, a liquid nutrient stream (sewage and waste water) feeds the cells through the extremely porous membrane. The best feature of this system is that aeration is passive and free, reducing the cost of secondary and some of tertiary treatment for a kilolitre of water from $1.00 to 20c, which has resulted in strong industry support.
The NMB technology was licensed to BioGill Environmental Pty Ltd in mid 2009 for global commercialisation.
CeramiSphere
CeramiSphere Pty Ltd (CeramiSphere) is a Sydney-based company commercialising technology developed by ANSTO scientists. This exciting new business is based on an encapsulation and controlled-release platform technology that delivers active ingredients in tiny glass (silica) spheres that can be measured in microns (millionths of a metre). These particles can be tailored to release the active ingredients that they carry in minutes or in months. This innovative technology can be used to protect proteins inside very small porous glass beads and deliver them, intact, to the desired organ in the body. CeramiSphere materials can be ‘tailor-made’ for a range of applications, including the oral delivery of insulin, wound healing, improved vaccines and gene therapy.
This technology was protected by a number of patent applications filed by ANSTO, and CeramiSphere has an exclusive license for its use. One of the major potential applications for this technology is for the delivery of new pharmaceuticals and, in particular, the use of therapeutic proteins for the treatment of diseases. These proteins are fragile molecules that can easily be destroyed, but when encapsulated in silica, using the CeramiSphere technology, their activity can be protected. CeramiSphere has many applications outside the healthcare field, such as corrosion-resistant paints, laundry detergents, cosmetics and food. The name “CeramiSphere” combines the notion of the ceramic material (such as silica) with the spherical shape of the particles in which the molecules are encapsulated.
CeramiSphere – advanced encapsulation and controlled-release technology. Image provided by ANSTO

Australian Innovation System
Report 2
011
78
RedFlow Limited
Energy storage is a critical enabling technology for electricity supply systems to meet peak demand loads and to enable solar PV generation to be used at nighttimes. Electricity storage is also a cost-effective way for electricity grids with limited transmission or generation capacity to ensure supply.
In 2001, Chris and Dr. Alex Winter, two engineers in Brisbane, began to develop a zinc-bromine flowing electrolyte battery system in a backyard shed. Their technology offers the potential to overcome limitations of existing battery systems by providing:
1. Much lower cost and longer life;
2. Light weight and readily recyclable;
3. The repeated capability for hard work, being designed for repeated full charge and discharge cycles; and
4. A good match for time-shifting electricity use with a discharge tome of 3 to 8 hours.
The company RedFlow Limited was formed to commercialise the technology. With mentoring early support, funding and collaboration with the Queensland Government, the University of Queensland, Ergon Energy and the Australian Government, RedFlow was able to scale-up and test the battery and purchase specialised equipment needed to produce the battery prototypes.
With support from angel investors, additional expertise could be taken on, allowing production capacity to be greatly increased. New remote monitoring and interfacing functions were incorporated, so that RedFlow’s technology is no longer limited to battery energy storage, but provides an integrated system to augment power supply grids. By late 2010, RedFlow’s technology was being installed throughout Australia and New Zealand. RedFlow’s complete energy storage systems are being used in the first commercial Smart Grid roll-out, part of the SmartGrid SmartCity project in NSW.
The company now employs 100 staff in high technology manufacturing. In December 2010, RedFlow raised $17.5 million Initial Public Offering and is now listed on the ASX. The funds are being used to further expand its production capacity and operations. RedFlow is now further expanding into other export markets.
With further support from angel investors, additional expertise was taken on, allowing production capacity to be greatly increased. New remote monitoring and interfacing functions were incorporated, so that RedFlow’s technology is no longer limited to battery energy storage, but provides an integrated system to augment power supply grids.
By late 2010, RedFlow’s technology was being installed throughout Australia and New Zealand. The company now employs more than 50 staff, and is in the process of raising $17.5 million in an Initial Public Offering on the stock exchange to further expand their production capacity and operations.
A row of freshly manufactured RedFlow batteries undergoing testing before shipment to customers in June 2011. Image provided by RedFlow Ltd.

Chapter 3: B
usiness Innovation
79
The Morton Seed Factory and waste oat hulls. Image provided by the Department of Innovation, Industry, Science and Research.
Morton’s Specialist Seed & Grain
The Western Australian company Morton’s Specialist Seed & Grain employs 65 people with exports making up 90% of its business. Morton’s processes some 60,000 tonnes of oat grain each year for the company’s production of instant, quick and rolled oats cereal products. Oat kernels or “groats” are first separated from the hulls, then kiln dried or converted into rolled oat flakes. The process results in 20,000 tonnes of waste hulls, which offer limited value to the business as a saleable by-product, but vast potential as a renewable energy source.
By replacing its LPG-fuelled boiler with one powered by waste oat hulls the company found a way to turn their production waste into energy. Independent research commissioned by Morton’s showed that by using just 8% of the biomass waste the company could eliminate the use of imported LPG as a fuel source for the boiler and reduce its annual greenhouse gas emissions from the burning of LPG by more than 1000 tonnes of CO2 equivalent.
‘We will save around $400,000 a year by removing the need for LPG but my real excitement is in the improved competitiveness and sustainability of the company,’ says Morton’s Managing Director Jonnie Morton. ‘There is the potential to use all of our waste biomass to fuel a larger electricity co-generation system, once the performance of this project has been evaluated.
‘This will make us more competitive on the international stage, and it’s positive from so many angles – reducing costs of our products, new growth and more employment and a better environmental footprint.’

Australian Innovation System
Report 2
011
80
CHAPTER 4Links and collaboration
Innovation involves everyone
Organisations rarely innovate alone. Innovation is a highly interactive, multidisciplinary process which increasingly involves cooperation and partnerships between a growing and diverse network of organisations and individuals.169 OECD analysis shows that a major global trend in business innovation involves ‘networked innovation’, whereby firms increasingly seek external sources of knowledge, often from the public knowledge bases, and through formal collaboration.170 Independent, global surveys of business leaders show the majority believe that innovation relies on partnerships.171 Firms collaborate with other firms to share knowledge and material resources, reduce risks and create new sources of competitive advantage.172 Firms network and collaborate with research organisations and other partners to stay abreast of developments, expand their market reach, tap into a larger base of ideas and technology, build expertise, solve technical problems and generate options for new goods and services.173,174,175,176 Research organisations network and collaborate to steer their work in new or more applied directions, encourage the transfer of relevant research knowledge for societal or personal gains and extend their capabilities to provide higher quality research outputs.177,178 Research is shifting towards more cooperative processes as researchers increasingly network and collaborate across research organisations and national borders.179
Official data shows that Australian businesses gather ideas and information for innovation from a wide variety of sources (Chart 4.1). While the majority of firms source ideas from within their own business or business group, their organisations are made up of people who were previously educated or employed elsewhere, use many technologies developed somewhere else, and exploit infrastructure and market conditions created or influenced by others. This point emphasises the interdependence of organisations in an innovation system.180
Adoption of existing innovations throughout the economy drives productivity improvements.181 One of the key factors in the drive for innovation-led productivity growth is therefore the ability of firms and other organisations to identify, absorb, transform and exploit innovations, known as absorptive capacity182. The first step to raising absorptive capacity is the development of relevant and extensive networks and collaborations. There is substantial evidence that a characteristic of more innovative, and competitive firms is that they have more external networks.183,184,185,186,187 There is a strong link between collaboration and product/process
169 OECD (2010) The OECD Innovation Strategy: Getting a head start on tomorrow. OECD, Paris170 OECD (2009) Innovation in firms: A microeconomic perspective. OECD, Paris.171 Eighty six% of respondents agreed that ‘21st century innovation is about partnerships between several players more than the success of an organisation
alone.’ GE Global Innovation Barometer 2011 http://files.gereports.com/wp-content/uploads/2011/01/GIB-results.pdf [Accessed 13 May 2011]172 MacCormack A, Forbath T, Brooks P & Kalaher P (2007), ‘Innovation through Global Collaboration: A New Source of Competitive Advantage’, Harvard
Business School Working Paper 07-079.173 Australian Industry Group (2010) Innovation: New thinking, new directions A report to the Australian Industry Group by the Innovation Review Steering
Committee, Sydney, Australia174 Ternouth P, Herrmann K & Docherty D (2010) Absorbing research: The role of university research in business and market innovation CIHE, London, UK175 OECD (2010) The OECD Innovation Strategy: Getting a Head Start on Tomorrow OECD, Paris, p41176 Broström A (2010) Firms’ rationales for interaction with research universities and the principles for public co-funding. The Journal of Technology Transfer 177 D’Este P & Perkmann M (2010) Why do Academics Engage with Industry? The Entrepreneurial University and Individual Motivations, The Journal of
Technology Transfer 36(3): 316-339.178 Perkmann M & Walsh K (2009) The Two Faces of Collaboration: Impacts of University-Industry Relations on Public Research. Industrial and Corporate
Change 18(6): 1033-1065.179 OECD (2010) Measuring Innovation: A New Perspective. OECD, Paris p.31180 Dodgson M, Hughes A, Foster J, Metcalfe JS (2010) Systems thinking, market failure and the development of innovation policy: The case of Australia.
University of Queensland Economics discussion paper no. 403; Centre for Business Research working paper 397, University of Cambridge.181 OECD (2005) Oslo Manual Guidelines for collecting and interpreting innovation data, 3rd edition, OECD and European Commission, Paris.182 Cohen WM & Levinthal DA (1989) Innovation and learning: The two faces of R&D. Economic Journal 99: 569-596.183 Samson D (2010) Innovation for business success: Achieving a systematic innovation capability, Report prepared for the Department of Innovation, Industry,
Science and Research.184 Scott-Kemmis D (2007) Absorbing innovation by Australian enterprises: the role of absorptive capacity. Report prepared for Department of Innovation,
Industry, Science and Research.185 Freeman C & Soete L (1997) The economics of industrial innovation, Pinter London.186 Fosfuri A & Tribó JA (2008) Exploring the antecedents of potential absorptive capacity and its impact on innovation performance. Omega 36: 173-187.187 Arnold E, Allinson R, Muscio A and Sowden P (2004) Making best use of technological knowledge: a study of absorptive capacity of Irish SMEs. Brighton,
Technopolis.

Chapter 4
: Links and collaboration
81
innovation188,189,190,191 and between collaboration and the introduction of new to Australia or world-first innovations.192 Building the networks (linkages and collaborations) across business, research and other sectors improves the coherence and resilience of the national innovation system and builds strong innovation performance.193 International collaboration integrates Australia194 with global knowledge networks from which new opportunities arise, including innovative efforts to address social and environmental challenges. Going out to meet the world gives industry exposure to the latest technological, organisational, management and other innovations. Flows of knowledge and innovations through this open network, known as ‘knowledge exchange or knowledge diffusion’, are therefore vital to economic prosperity and a greener, fairer Australia.
Chart 4.1: Sources of ideas or information for innovation-active Australian firms, 2008–09
Source: ABS (2010) Innovation in Australian Business 2008–09 cat. no.8158.0
This chapter firstly provides selected measures of Australia’s performance in knowledge exchange, collaboration and global integration compared with other OECD countries. Secondly, it outlines initiatives undertaken by the Commonwealth and State and Territory governments to enhance Australia’s performance in networking and collaboration, thereby addressing National Innovation Priorities 5 and 6. Lastly, it provides case studies to illustrate the importance of collaboration within and between industry and research sectors.
188 Ahuja G (2000) Collaboration networks, structural holes, and innovation: A longitudinal study, Administrative Science Quarterly 45: 425-455.189 Pittaway L et.al. (2004) Networking and Innovation: A Systematic Review of the Evidence, International Journal of Management Reviews 5-6(3-4): 137-168190 Huang KF & Yu C-MJ (2010) The effect of competitive and non-competitive R&D collaboration on firm innovation. The Journal of Technology Transfer DOI:
10.1007/s10961-010-9155-x191 Lööf H & Broström A (2008) Does knowledge diffusion between university and industry increase innovativeness? The Journal of Technology Transfer 33(1):
73-90.192 Department of Industry, Tourism and Resources (2006) Collaboration and other factors influencing innovation novelty in Australian businesses: An econometric
analysis, Canberra, Australia.193 OECD (2010) The OECD Innovation Strategy: Getting a head start on tomorrow. OECD, Paris194 Science & Engineering Indicators 2008, National Science Foundation website, www.nsf.gov; Data calculated by country from all science and engineering
articles from all fields in 2005 shows that Australia produces around 2% of world scientific and engineering knowledge.
60.7
39.2
30.4
30.2
27.8
21.6
18.1
17.5
4.1
2.6
1.5
1.0
0 10 20 30 40 50 60 70
Within the business or related company
Clients, customers or buyers
Competitors and other businesses fromthe same industry
Suppliers
Websites, journals, researchpapers, publications
Professional conferences, seminars,meetings, trade shows
Industry associations
Consultants
Government agencies
Universities or other highereducation institutions
Commercial laboratories/research anddevelopment enterprises
Private non-profit research institutions
Percentage of respondents

Australian Innovation System
Report 2
011
82
In Powering Ideas, the Australian Government set out its priorities and targets for collaboration as follows:
Priority 5: The innovation system encourages a culture of collaboration within the research sector and between researchers and industry.Target: The Australian Government’s ambition is to double the level of collaboration between Australian businesses, universities and publicly-funded research agencies over the next decade.
Priority 6: Australian researchers and businesses are involved in more international collaborations on research and development.Target: The Australian Government has adopted the long-term aim of increasing international collaboration in research by Australian universities.
Knowledge exchange
Knowledge exchange depends largely on links and connections between organisations and individuals. Although it is difficult to measure, current indicators focus primarily on formal knowledge exchange mechanisms such as collaboration, funding flows between the public and private sectors, and research commercialisation activities (Table 4.1). These measures indicate the existence of an interaction, not its intensity or frequency, and therefore do not always measure the impact of knowledge exchanges.
Despite the strengths of Australia’s public research system and growing private investment in innovation and research and development (R&D) outside of the resources sector, collaboration and networking have been cited as consistent weaknesses in the Australian innovation system compared with other OECD countries.195,196,197,198,199 Chart 4.2 and Chart 4.3 indicate the level of business interconnectedness within the economy. Although the main source of income for innovation-active businesses is the general public, there are considerable transactions between businesses, government agencies and other organisations. It is notable that large firms tend to interact more with other large firms and governments and are more likely to operate internationally.
Chart 4.2: Main source of income for innovation-active businesses, by employment size, 2008–09
Source: ABS (2010) Selected Characteristics of Australian Businesses 2008–09, cat. no. 8167.0
195 Department of Industry, Science and Resources (1999) Shaping Australia’s Future: Innovation Framework paper. A report compiled for the National Innovation Summit, 10-11 February 2000.
196 Roos G, Fernström L & Gupta O (2005) National innovation systems: Finland, Sweden & Australia compared: Learnings for Australia. Report prepared for the Australian Business Foundation.
197 Cutler & Company (2008) Venturous Australia. Report for the Australian Government’s Review of the National Innovation System.198 Scott-Kemmis D & Matthews J (2010) Australia’s Innovation System, In: Encyclopaedia of technology and innovation management (Narayanan VK, O’Connor
GC, Eds.) John Wiley & Sons, London, UK199 Australian Industry Group (2011) Innovation: New thinking, new directions. A report to the Australian Industry Group by the Innovation Steering Committee,
Sydney.
Percentage of respondents
0–4 persons
5–19 persons
20–199 persons
200 or morepersons
6.2
13.7
35.4
51.7
2.6
6.3
14.3
36.2
51.1
1.8
12.4
26.9
27.9
43.4
3.1
20.2
42.2
19.1
27
7.5
0 10 20 30 40 50 60
Government organisations
Large businessesor organisations
Small and/or mediumbusinesses or organisations
General public
Overseas sources

Chapter 4
: Links and collaboration
83
The Global Competitiveness Report 2010-11 uses a number of opinion-based indicators that seek to assess the extent of interconnectedness between firms and sectors of the economy. Australia still ranks poorly on these metrics. For example, in the indicators of ‘state of cluster development’ and ‘value chain breadth’ Australia ranks 19th and 34nd among OECD countries, with little change over the last few years.200 Although weaknesses in some of these indicators may be a consequence of Australia’s geographic isolation or industrial structure dominated by small and medium enterprises (SMEs), they may also reflect a poor collaboration culture which results in a low propensity to network and collaborate across industries and between organisations in the innovation system.
Chart 4.3: Main supplier of goods or services for innovation-active businesses, by employment size, 2008–09
Source: ABS (2010) Selected Characteristics of Australian Businesses 2008–09, cat. no. 8167.0
200 World Economic Forum, The Global Competitiveness Report 2010-11
Percentage of respondents
200 or more persons
20–199 persons
5–19 persons
0–4 persons
Government organisations
Large businessesor organisations
Small and/or mediumbusinesses or organisations
Overseas supplier
Not applicable
1.6
19.5
58.2
6.6
16.7
1.8
22.3
64.2
8.2
8.2
2.1
29.9
55.5
8.5
10.2
2.6
43.9
36.6
15.5
9.7
0 10 20 30 40 50 60 70

Australian Innovation System
Report 2
011
84
Table 4.1: Australia’s performance in knowledge exchange against other OECD countries
IndicatorsLatest Figure
Reference Year
OECD Ranking(a)
Gap from the Top
Five OECD Performers
Baseline figure
Reference year
baseline figure
Change from
baselinefigure
Proportion of innovation-active businesses collaborating with universities [1]
2.40% 2008–09 n/a n/a 1.60% 2006–07 50.0%
Proportion of innovation-active businesses collaborating with publicly-funded research agencies [1]
4.40% 2008–09 n/a n/a 7.20% 2006–07 -38.9%
Proportion of Australian businesses collaborating in innovation(b) [2] 20.6%(nd) 2004–06 18th 53.8% 20.6% 2004–06 -
Proportion of SMEs collaborating in innovation(b) [3] 17.70%(nd) 2004–06 5th 15.7% 17.70% 2004–06 -
Proportion of large firms collaborating in innovation(b) [3] 23.50%(nd) 2004–06 23rd 60.6% 23.50% 2004–06 -
Gross income from Licences, Options and Assignments by publicly funded research organisations and universities ($million)(c) [4]
297 2009 n/a n/a 226(r) 2007 31.1%
Gross income from contracted research and consultancies by publicly funded research organisations and universities ($billion)(c) [4]
1.16 2009 n/a n/a 1.30(r) 2007 -11.3%
Number of Start-up companies in which publicly funded research organisations and universities have an equity holding(c) [4]
176 2009 n/a n/a 178(r) 2007 -1.1%
Share of patents owned by universities and government [5] 7.0%(nd) 2003–05 10th(r) 29.9% 7.0% 2003–05 -
Proportion of HERD financed by business [6] 5.86% 2008 11th(r) 59.8% 6.76%(r) 2006 -13.3%
Proportion of GOVERD financed by business [6] 9.93% 2008 7th 26.1% 11.53%(r) 2006 -13.9%
Sources: [1] ABS (2010), Innovation in Australian Business 2008–09, cat. no. 8158.0. [2] OECD, Measuring Innovation: A New Perspective 2010. [3] OECD, Science, Technology and Industry Scoreboard 2009. [4] DIISR (2011), National Survey of Research Commercialisation 2008 and 2009. [5] OECD, Compendium of patent Statistics 2008. [6] OECD, Main Science and Technology Indicators database 2010/2.Notes: Indicators with * and in the figures in the coloured rows of the table are the primary indicators applied to measure and monitor progress against the Australian Government’s innovation targets. (a) OECD rankings are performed on those OECD countries for which data is available. Individual data availability may vary between indicators. (b) Australia data reference period is 2006–07. (c) Values are in constant 2009 dollars (AUD). (nd) No new data. n/a = Not available. – = not applicable. (r) The baseline has been revised according to the latest available data.
Collaboration
Collaboration spans a range of possible relationships between partners, from informal modes of cooperation such as open source coding at one extreme to contractually binding joint ventures at the other. Whatever its form or intensity, collaboration generally involves a mutual commitment by all the partners to an activity which entails some form of sharing resources and jointly undertaking tasks; a sharing of risk in which the interests of all parties are affected if the activity is unsuccessful and generation of mutual benefits for all parties.201 Collaboration can involve the joint development of new products, processes or other innovations with customers, suppliers, other enterprises or publicly funded research organisations (PFROs).
201 OECD (2010) The OECD Innovation Strategy: Getting a head start on tomorrow. OECD, Paris, p41

Chapter 4
: Links and collaboration
85
Australian Bureau of Statistics (ABS)202 data shows that regardless of the size of the firm and the type of collaboration undertaken, innovative firms are far more active collaborators than non-innovative firms (Chart 4.4). These data are substantiated by OECD econometric analysis that shows that collaborating businesses spend 20% to 50% more on innovation than non-collaborating firms.203 This suggests that collaboration is not necessarily a cost saving measure but is used to extend the scope of a project or to complement the firms’ capabilities, thereby reducing risks.204
Chart 4.4: Collaborative arrangements, by innovation status and by employment size, 2008–09
Source: ABS (2010) Innovation in Australian Business 2008–09, cat. no. 8158.0
Table 4.1 shows two indicators sourced from the ABS that are used as metrics of the progress of business collaboration in relation to the government’s target of doubling collaboration between business, universities and research agencies over the next decade. During 2008–09 the two indicators moved in opposite directions. The proportion of innovation-active businesses collaborating with universities rose to 2.4% since the last period (2006–07) an increase of 0.8 percentage points but collaboration with publicly funded research agencies fell by nearly 2.8 percentage points.
Research commercialisation metrics measure the level of interaction between research institutions and other organisations in the innovation system. In 2009, PFROs205 reported gross incomes totalling $319 million from licenses, options and assignments, and $1.2 billion from contracts and consultancies with end-users. In 2009, the PFROs recorded having an equity holding in 176 start-up companies (Table 4.1). This equates to a slight decrease in the number of start-ups (1.1%) and gross income from contracts and consultancies (11.3%) since the last period (2007). In contrast, there has been a significant increase in income from licenses, options and assignments (31.1%). This can mainly be attributed to the revenue arising from settlements received by Commonwealth Scientific and Industrial Research Organisation (CSIRO) as a result of the wireless local area network (WLAN) invention.206
Clients, suppliers, competitors and other businesses remain the major source of ideas and collaboration for innovation-active Australian businesses, more so than research organisations and government agencies (Chart 4.1 and Chart 4.5). This trend has not changed since 2006–07, however the proportion of businesses collaborating with consultants has almost doubled over that period. This result is not unusual compared with other OECD countries.207 The data show that sources of ideas from research organisations are more likely to
202 ABS (2010) Selected Characteristics of Australian Business 2008–09, cat. no. 8158.0. The Australian Bureau of Statistics innovation survey defines collaboration as “active participation in joint innovation projects with other organisations”, but excludes the pure contracting out of work.
203 OECD (2009) Innovation in Firms: A Microeconomic Perspective, OECD, Paris; OECD (2010) Innovation and Firms’ Performance: Exploiting the Potential of Microdata (working title), OECD, Paris, forthcoming.
204 OECD (2010) The OECD Innovation Strategy: Getting a head start on tomorrow. OECD, Paris, p41205 These institutions include universities, publicly funded research agencies, medical research institutes and cooperative research centres.206 DIISR (2010) Australian Innovation System Report 2010, Canberra p27207 OECD (2010) The OECD Innovation Strategy: Getting a head start on tomorrow OECD, Paris
Innovation-active businesses
Non Innovation-active businesses
Per
cent
age
of r
espo
nden
ts
Firm size (number of employees)
22 24
20
42
6
10
15
26
0
5
15
25
35
45
0–4 persons 5–19 persons 20–199 persons 200 or more persons

Australian Innovation System
Report 2
011
86
reach businesses through intermediary channels such as industry associations, consultants, conferences and research papers (Chart 4.1). Although total collaboration within all industry sectors remained at about 17% in 2008–09, large increases occurred in sectors such as rental hiring and real estate services and retail trade. Offsetting this were large drops in health care and social assistance; electricity, gas, water and waste services; and information media and telecommunications.208
Chart 4.5: Collaboration by innovation-active businesses within Australia, by type of organisation collaborated with, 2008–09
Source: ABS (2010) Innovation in Australian Business, 2008–09, cat. no. 8158.0.
Australia ranks poorly on the total proportion of businesses collaborating in innovation compared to other OECD countries (Chart 4.6). If we disaggregate this data into domestic and international collaboration in innovation we see that our level of international innovation is not on par with other OECD countries. The propensity for domestic business collaboration on innovation is high in Australia relative to other OECD countries (ranking 6th; Chart 4.6). The data shows that Australian business international collaboration ranks relatively poorly against other OECD countries (ranking 20th out of 23 countries). This data may be a reflection of our distance from major markets. In most countries, including Australia, a higher proportion of large firms collaborate on innovation compared to small firms (Table 4.1). As large firms have easier access to partners and a larger resource base.209 However, innovation-active large Australian businesses rate relatively poorly against other OECD countries (third last) on their propensity to collaborate whereas innovation-active SMEs are ranked 5th in the OECD for collaboration (Table 4.1).
When considering the innovation mode data from Chapter 1, this collaboration data suggests that Australian SMEs have a good track record for collaborating domestically with innovation partners sourced from market-based networks. These data fit well with the high proportion of ‘domestic modifiers’ and the high proportion of SMEs in Australia (Chapter 1). This has implications for industry-research collaboration. Large Australian firms are relatively poor collaborators by world standards but, for most sectors of the economy, business investment in R&D is dominated by large firms (Chart 3.9). The R&D funding flows from industry to the higher education sector are quite low compared to the funds that business spends on its own R&D activity (~4%; Chart 1.6).
208 ABS (2010) Selected Characteristics of Australian Business 2008–09, cat. no. 8158.0. The Australian Bureau of Statistics innovation survey defines collaboration as “active participation in joint innovation projects with other organisations”, but excludes the pure contracting out of work.
209 Ibid.
Percentage of respondents
29.2
41.1
35.7
31.0
33.7
2.4
2.7
4.4
5.2
9.4
0 5 10 15 20 25 30 35 40 45
Other business(es) relatedto the business
Clients, customers or buyers
Suppliers of equipment, materials,components or software
Competitors and other businessesfrom the same industry
Consultants
Universities or other highereducation institutions
Private non-profit
Government/public
Commercial
Government agencies

Chapter 4
: Links and collaboration
87
The data suggests that if the productivity enhancing benefits of industry-research collaboration are to increase, large firms should be encouraged to collaborate more within their appropriate sector. These data ignores the largest impact that research organisations have on industry through provision of skilled graduates and researchers. A more complete and calibrated comparison of the various productivity impacts of the supply of skilled people compared to the benefits of collaboration is required. Comparative empirical analysis of the depth and frquency of collaborations with research organisations should also be undertaken between SMEs and large firms.
Chart 4.6: Firms with national/international collaboration on innovation, 2004–06 (As a percentage of innovative firms)
Source: OECD (2010) Working Party of National Experts in Science and Technology (NESTI) innovation microdata project based on CIS-2006, June 2009 and national data sources.
Business’ share of HERD and GOVERD
Research and development financed by business in the higher education sector (HERD) and the government sector (GOVERD) are used as indicators for measuring knowledge exchange, collaboration and closeness between businesses, government, R&D agencies, and universities (Table 4.1).
Both indicators have registered significant percentage decreases relative to the previous year. This may be a reflection of the impact of the global financial crisis on business decisions to finance research undertaken in the higher education and government sectors. It should also be viewed in the context that Australia has had several years of increasing business financing of HERD. In spite of the decline of 18% in 2008–09, business funded more than 25% of the GOVERD, ranking Australia 7th among the OECD countries (Table 4.1). By comparison, other industrialised countries within the OECD have either gradually reduced or maintained business share of HERD and generally have lower levels of business financing of GOVERD.
It is interesting to note that the proportion of innovation-active businesses collaborating with universities has increased by 50% since last year across all business size ranges, and particularly in the small and medium business ranges. A similar pattern is also observed for business financing GOVERD. This shift in business preferences from R&D to other innovation activities when engaging with universities and government may reflect cost pressures due to the global financial crisis. It also illustrates the complexity of the innovation system and the necessity to focus on a set of indicators broader than just R&D.
National collaboration only
International collaboration
Per
cent
age
of in
nova
tive
firm
s
0
10
20
30
40
50
60
Finl
and
Chi
le
Swed
en
Cze
ch R
epub
lic
Net
herl
ands
Aus
tria
Sout
h A
fric
a (2
002–
04)
Bel
gium
Nor
way
Esto
nia
Den
mar
k
Luxe
mbo
urg
New
Zea
land
(200
6–07
)
Icel
and
(200
2–04
)
Uni
ted
Kin
gdom
Irel
and
Japa
n (1
999–
2001
)
Can
ada
(200
2–04
, man
ufac
turi
ng)
Chi
na
Aus
tral
ia (2
006–
07)
Kor
ea (2
005–
07, m
anuf
actu
ring
)
Por
tuga
l
Spai
n
Ger
man
y
Ital
y

Australian Innovation System
Report 2
011
88
Global integration
After decades of trade liberalisation, markets have become more globalised, creating new opportunities as well as intensifying the level of competition.210 The acquisition of overseas technology and its diffusion through the domestic economy as well as the incorporation of highly skilled labour in the labour market fosters productivity growth. New technologies and ideas for innovation are transferred through imports, through exposure to foreign buyers, via foreign direct investment (FDI) or through trade in intellectual property (e.g. licensing contracts). Stronger growth performance is not the only major public policy objective that can be served by innovation. Many of society’s most pressing challenges know no borders and cannot be met by a single country. The ability to address increasingly urgent issues such as climate change, health, food security and poverty, depends on stronger innovation and new forms of international collaboration. Global challenges require collective and innovation-driven responses.211 The indicators in Table 4.2 seek to capture some of these factors.212
Table 4.2: Australia’s performance in global integration against other OECD countries
IndicatorsLatest Figure
Reference Year
OECD Ranking(c)
Gap from the Top
Five OECD Performers
Baseline figure
Reference year
baseline figure
Change from
baselinefigure
Proportion of GERD financed abroad [1] 1.69% 2008 19th 88.3% 2.38% 2006 -28.7%
Share of HERD financed from abroad [2] 2.06% 2008 n/a n/a 2.89% 2006 -28.7%
Number of formal agreements on academic/research collaboration between Australian universities and overseas institutions [3]
3,493(nd) 2009 n/a n/a 3,493 2009 -
Internationally co-authored scientific articles per capita [4] 0.86(nd) 2008 11th 39.3% 0.86 2008 -
R&D expenditure of foreign affiliates as % of R&D expenditure of the enterprise [5]
34.7 2008–09 n/a n/a 36.2(r) 2007–08 -4.0%
Firms with international collaboration on innovation (% of innovative firms) [4]
3.6%(nd) 2004–06 20th 86.0% 3.6% 2004–06 -
Proportion of patents with foreign co-inventors [6] 15.2% 2006 25th 68.2% 13.3% 2005 14.4%
Technology balance of payments (Receipts minus payments) as a % of GDP [1]
-0.20% 2008 20th 115.7% -0.14% 2007 48.1%
Foreign Direct Investment as a source of technology transfer(a) [7] 5.2 2009–10 5th 7.47% 5.4 2008–09 -3.7%
Net gains of skilled persons through migration(b) [8] 53,400 2009–10 n/a n/a 74,000 2008–09 -27.8%
Proportion of international students enrolled in advanced research programs
23.3% 2008 6th 31.9% 20.8% 2007 11.7%
Sources: [1] OECD, Main Science and Technology Indicators database 2010/2. [2] ABS (2010), Research and Experimental Development, Higher Education Organisations, 2008, cat. no. 8111.0. [3] Universities Australia, International Links of Australian Universities, May 2009. [4] OECD, Measuring Innovation: A New Perspective 2010. [5] ABS (2008–09), Research and Experimental Development, Businesses, Australia, cat. no. 8104.0. [6] OECD, OECD in Figures 2009. [7] World Economic Forum, The Global Competitiveness Report 2010-2011. [8] Department of Immigration and Citizenship, special data request.Notes: Indicators with * and in the figures in the coloured rows of the table are the primary indicators applied to measure and monitor progress against the Australian Government’s innovation targets. (a) For this indicator, survey respondents were asked to answer the questions “To what extent does foreign direct investment (FDI) bring new technology into your country? [1 = not at all; 7 = FDI is a key source of new technology]”. (b) Net gains of skilled persons through migration is defined as the final Net Overseas Migration (NOM) of skilled workers (i.e. permanent skilled plus temporary 457 visa holders). This definition differs from that used in the last report. (c) OECD rankings are performed on those OECD countries for which data is available. Individual data availability may vary between indicators. (nd) no new data. n/a = not available. - = not applicable. (r) The baseline has been revised according to the latest available data.
210 Ibid.211 Ibid.212 Some of the indicators published in the AIS report 2010 have not been updated as no new data have been released since the publication of the last report.
Therefore this affects the calculation of gaps and rankings.

Chapter 4
: Links and collaboration
89
International R&D flows
Australia has a relatively low rate of international collaboration on R&D and innovation, reflecting in part our geographic distance from international markets. Only 3.6% of innovative firms collaborated internationally, ranking Australia 21st out of 23 OECD countries (Chart 4.6). Gross expenditure on R&D (GERD) financed abroad has decreased since the last reporting period (2007) from 2.4% to 1.7%, or by 28.7%. As seen in the R&D statistics in Table 4.2 for HERD and GOVERD, this may be a reflection of the global financial crisis. The indicators that measure the investment from overseas in Australian R&D support this, as other countries have been affected more severely than Australia by a shortage of available finance.
The amount of higher education R&D financed abroad (one of the indicators for Target 6: ‘Increasing international collaboration in research by Australian universities’) has been falling since 2002 as a share of total HERD (Table 4.2). However, in nominal terms it has been increasing rapidly over the last 16 years, achieving a compound annual growth rate of 12.8% per annum between 1998 and 2008. The exception to this is the latest period where there was a decline from $157 million to $138 million ( 12%). No new data has become available since the last report on the number of agreements on academic/research collaboration between Australian universities and overseas institutions, the other indicator for Target 6.
Research collaboration, particularly international collaboration, strengthens the breadth and quality of research. Australia ranks 11th on the number of internationally co-authored scientific articles per capita (Table 4.2). Looking at Australian highly cited (top 1%) scientific articles213 in 2006-08, articles which involve co-authorship (either domestic or international) are 15 times more likely to be in this category than single author articles (Chart 4.7). This ratio is larger for other OECD countries.214
Chart 4.7: Highly cited (top 1%) scientific articles by type of collaboration, by country, 2006–08
Source: OECD calculations, based on Scopus Custom Data, Elsevier, December 2009.
213 The OECD definition of scientific articles in this publication include: life science (clinical medicine, biomedical research and biology); physical science (chemistry, physics and Earth and space sciences); mathematics, social and behavioural sciences (social sciences, psychology, health sciences and professional fields). Engineering includes computer sciences and engineering and technology).
214 OECD (2010) Measuring Innovation: A New Perspective. OECD, Paris p.98
0
5
10
15
20
25
Uni
ted
Stat
es
Uni
ted
Kin
gdom
Ger
man
y
Fran
ce
Can
ada
Chi
na
Ital
y
Net
herl
ands
Japa
n
Aus
tral
ia
Swit
zerl
and
Spai
n
Swed
en
Bel
gium
Den
mar
k
Kor
ea
Aus
tria
Indi
a
Finl
and
Bra
zil
Nor
way
Rus
sian
Fed
erat
ion
Pol
and
Turk
ey
Irel
and
Gre
ece
New
Zea
land
Por
tuga
l
Cze
ch R
epub
lic
Hun
gary
Mex
ico
Icel
and
Slov
ak R
epub
lic
Luxe
mbo
urg
Per
cent
age
48.8
Single author
International co-authorship
Domestic co-authorship

Australian Innovation System
Report 2
011
90
Non-R&D international flows
The majority of Australian firms appear much more likely to collaborate domestically than they do internationally (Chart 4.7).215 Factors such as size of the country, proximity to other nations and dependency on trade may affect international collaboration. The ‘Technology balance of payments’ indicator measures international technology transfers such as licence fees, patents, purchases and royalties paid, know-how, and research and technical assistance. Unlike R&D expenditures, these are payments for production-ready technologies. Measured by its share of GDP (-0.2%), Australia ranked 20th out of 26 OECD countries that reported on this indicator. This represents a relative increase of 48.1% for Australia since 2007 (Table 4.2). An alternative indicator of international flow of knowledge and technology transfer is a World Economic Forum indicator of FDI as a source technology transfer.216 On this indicator Australia scored 5.2, ranking 5th out of 34 OECD countries led by Ireland with 6.3. This suggests that Australia is increasingly a net importer of technology and know-how and relies on foreign direct investment for technology more than most other OECD countries (Table 4.2). This agrees with the general tendency for Australian innovating firms to modify existing innovations (Chapter 1). Given Australia is a service-based economy, it should be noted that trade in services and non-technological innovations may be underestimated on these technology-focussed indicators.
The flow of skilled people across Australia’s borders provides another measure of knowledge exchange. There was an 27.8% drop in the net gain of skilled migrants between 2008–09 and 2009–10. In addition, the proportion of international students enrolled in advanced research programs represents a significant contribution to innovation capacity, and Australia, with 23.3%, ranks 6th among 19 countries across the OECD (Table 4.2).
Government initiatives that enhance networking and collaboration
The national innovation system is supported by a range of government initiatives that foster domestic and international networking and collaboration between and within industry, research, government and community sectors. Figure 4.1 is a map of submitted networking and collaboration initiatives from governments around Australia including publicly funded research agencies with a collaboration mission. The general focus of these initiatives is to build capacity of Australian organisations to absorb knowledge from external sources, and encourage a culture of collaboration and open innovation. A number of initiatives aim to build business innovation capability by establishing and supporting networks and alliances within industry sectors and internationally. Examples include Industry Innovation Councils217, the Queensland Government’s Innovation Projects Fund218 and the Western Australian Government’s Innovation Gateway initiative219.
A large number of networking and collaboration initiatives are focussed on research-to-research collaboration (such as the Australian Research Council (ARC) Centres of Excellence220, the Australia-India Strategic Research Fund221 and the Victoria-California Stem Cell Alliance222), or industry-to-research collaborations (such as the Cooperative Research Centres223, ARC Linkage Projects224 and the NSW Government’s TechVouchers program225), in line with the national innovation priorities of the Australian Government. Initiatives that focus on the public or the community sectors collaborating on innovation projects are detailed in Chapter 5. A large number of collaboration initiatives were detailed in the previous edition of this report, and up-to-date details of all government collaboration programs can be found by exploring the Australian Government’s www.business.gov.au, www.arc.gov.au and www.grantslink.gov.au websites. Commonwealth innovation programs are further detailed in Appendix 1.
215 For small, open European economies such as Luxembourg international collaboration is a matter of necessity according to the OECD not the same as Australia considering the geographical barriers and differences in industrial structure.
216 The survey asks managers: ‘To what extent does foreign direct investment (FDI) brings new technology into your country?’ the answers range from 1 = not at all to 7 = FDI is a key source of new technology.
217 http://www.innovation.gov.au/Industry/IndustryInnovationCouncils/Pages/default.aspx218 http://www.industry.qld.gov.au/funding-and-assistance/264.htm219 http://www.innovation.wa.gov.au/ 220 http://www.arc.gov.au/ncgp/ce/ce_default.htm221 https://grants.innovation.gov.au/AISRF/Pages/Home.aspx222 http://www.business.vic.gov.au/BUSVIC/STANDARD/PC_63759.html 223 https://www.crc.gov.au/Information/default.aspx224 http://www.arc.gov.au/ncgp/lp/lp_default.htm225 http://ww3.business.nsw.gov.au/TechVouchers/home.aspx

Chapter 4
: Links and collaboration
91
Figure 4.1: A map of submitted government initiatives that support networking and collaboration
Notes: State and Territory initiatives are highlighted in purple. This figure does not present all government initiatives that support networking and collaboration and is intended as an indicative analysis only. These initiatives presented here are not scaled by size of funding or stakeholder coverage. Programs are mapped by objectives. The reader is encouraged to search the above websites or the AIS website to find out more about each initiative.
Australian Technology Showcase (NSW)
CollabIT (ACT)
Australian Antarctic Program
Collaborative Research Networks
IP Australia Patent Analytics
Tasmanian ICT Centre (Comm. & Tas)
Innovation Vouchers (Qld) CSIRO Flagship Collaboration Fund
TechVouchers (NSW)
NHMRC Development Grants
ARC Linkage Program
Joint Research Engagement
ARC Discovery Program
SMART InfrastructureFacility (NSW)
AustralianSolar Institute
National EnvironmentalResearch Program
National Collaborative ResearchInfrastructure Strategy
Small Technology IndustryUptake Program (Vic)
Enterprise Connect
INDUSTRY-TO-RESEARCH RESEARCH-TO-RESEARCHBUSINESS-TO-BUSINESS
Textile, Clothing and Footwear Strategic Capability Program
Industry Innovation Councils
Digital Economy Strategy (NSW)
Enhanced Project By-Law Scheme
Automotive Supply Chain Development Program
Supplier Access to Major Projects
Innovation Gateway (WA)
Innovation Projects Fund (QLD)
Industry Capability Network
Supplier Advocates
HEAT Fashion & HEAT Architecture (QLD)
International fellowships (QLD)
Victoria-California Stem Cell Alliance (VIC)
National Low Emission Coal Initiative
Australia China Science & Research Fund
National ICT Australia (Australian, ACT, NSW, Vic and Qld Governments
University and vocational education and training funding
ARC Centres of Excellence and Special Research Initiatives
Cooperative Research Centres
Energy Research Alliance (WA)
Rapid Prototyping, Development and Evaluation
Austrade
Australia-India Strategic Research Fund
Innovation and R&D technology clinics and forums (QLD)
Publicly Funded Research Agencies e.g. CSIRO, AIATSIS
International
Domestic & International
Domestic

Australian Innovation System
Report 2
011
92
Cooperative Research Centres (CRC) Program
The Cooperative Research Centres (CRC) Program is a key government initiative that supports end-user driven research partnerships between publicly funded researchers and end-users to address clearly articulated, major challenges facing Australia, many of which are also global challenges. In 2010–11, the government provided more than $170 million to support 42 CRC collaborations. In December 2010, the Minister for Innovation, Industry, Science and Research, Senator the Hon Kim Carr, announced the outcomes of the 13th selection round, when 4 CRCs were selected for funding of $100 million in total. Subject to successful contract negotiations, these four CRCs will commence operations in 2011–12.
On 4 November 2010 the Minister announced three priorities for the 14th CRC selection round to be held in 2011: clean manufacturing, social innovation and sustainable regional communities. Applications for the 14th selection round closed 1 July 2011.
Collaborative Research Networks (CRN) Program
The Australian Government’s Collaborative Research Networks Program will provide up to $61.5 million from mid 2011 until mid 2014 to encourage less research-intensive, smaller and regional universities to strengthen their research capacity by teaming up with other institutions in areas of common interest. The CRN Program was developed in consultation with the higher education sector. Sixteen universities were eligible to apply for CRN funding in the initial round, which closed in December 2010. The applications were discussed with universities at compact discussions in early 2011. On 31 May 2011 Innovation Minister Carr announced the 12 successful projects.
Industry Innovation Councils
Industry Innovation Councils actively engage with stakeholders and collaborate on projects and initiatives with organisations across the innovation system. The following are two examples of the Councils forging links and collaborating with a wide range of stakeholders.
The Automotive Council endorsed the comprehensive Automotive Australia 2020 Technology Roadmap project which was supported by the Australian and Victorian Governments and managed by the Cooperative Research Centre for Advanced Automotive Technology with assistance from the University of Cambridge, the Australian National University and CSIRO. Approximately 220 individuals from 160 organisations contributed more than 2,500 hours to the project. Participants included vehicle producers, automotive suppliers, science and research organisations, governments and other stakeholder groups.
The Roadmap, released on 6 August 2010, identifies short, medium and long term drivers, applications, capabilities and enablers for 32 technology opportunities in four broad areas: vehicle electrification; gaseous fuels; light weighting; and advanced data and communications systems. The industry has indicated that there is close alignment between the commercial direction of the industry and the technology applications identified in the roadmap.
The Future Manufacturing Council identified manufacturing for sustainable energy and water as priority areas. In 2010, it supported the funding of targeted research. These priorities were brought together in a 2011 workshop to identify opportunities and challenges for Australian manufacturing in a sustainable built environment. The workshop was held in collaboration with other councils and stakeholders from industry, research and government.
Austrade
Austrade’s new directions
The Australian Trade Commission (Austrade) has recently announced a shift in focus to better assist Australian business exports and to attract further productive international investment into Australia. In trade, there will be a shift from those established markets with which Australian business is more familiar, to growth and emerging markets – where businesses often have a greater need for support on the ground – and where assistance is more difficult to obtain. These reforms will allow Austrade to assist companies more effectively in critical growth and emerging markets such as China, Central and South Asia, Latin America and the Middle East and Africa where, increasingly, new opportunities exist. Investment activity will be focused in markets where there are sources of investible funds, predominantly established markets in Europe and North America, but increasingly, growth and emerging economies. A sharper focus for investment will also be achieved through the determination of proactive investment attraction priorities via structured consultation across government.

Chapter 4
: Links and collaboration
93
Austrade’s work in innovation
Australian innovation has a relatively low profile amongst the global business community, though in the scientific community Australia is internationally well regarded. Over the past year, Austrade has sought to raise awareness of Australia’s innovation strengths. Recognising that international business networks and collaboration contribute directly to stimulating innovation and productivity, Austrade has:
› Promoted Australian innovation capabilities globally; often in partnership with CSIRO, CRCs, and Universities;
› Highlighted Australia as a competitive destination for foreign direct investment into R&D and innovation; and
› Worked to increase industry partnership opportunities with key corporates seeking and investing in innovation.
Examples of Austrade’s activity in the clean energy sector include:
› Next generation biofuels: Austrade is targeting international investors in the next generation biofuels sub-sector and has helped to attract investment in new technology projects in algae biofuel production and sustainable aviation fuel development;
› Solar technology: Austrade has engaged with international companies in the solar energy sector to attract technologies, expertise and capital to Australia, utilising Solar Flagships and the Australian Solar Institute programs to attract interest; and
› Carbon, capture and storage (CCS): Austrade has promoted Australia’s leadership credentials in CCS in partnership with the CRC for Greenhouse Gas Emissions, CSIRO, the Department of Resources, Energy and Tourism and the Global CCS Institute. A series of seminars have been held in Europe, North America and Australia to focus international interest in R&D collaboration, demonstration projects and commercial opportunities.
Australia-India Strategic Research Fund
The $65 million dollar Australia-India Strategic Research Fund (AISRF) was established in 2006 to facilitate and support scientific and technological research cooperation between Australia and India. With matching funding being provided by the Government of India, the AISRF has to date funded over 90 collaborative projects involving leading Australian and Indian scientists and research organisations. Projects are in priority areas that include agricultural research, astronomy and astrophysics, environment sciences (including climate change research), renewable energy, biomedical devices and implants, vaccines and medical diagnostics, transgenic crops and marker-assisted breeding, and bioenergy and biofuels.
The inaugural call for applications under the Grand Challenge Fund component of the AISRF opened in November 2010. This new component aims to support collaborative research projects of larger scope and scale that will help deliver practical solutions to some of the complex problems that both countries face in areas of food and water security, energy, health and the environment. Seventy-four expressions of interest were received in February 2011. Of the 74 EOIs submitted, 12 applicants were invited to submit full applications and the outcomes are due to be announced in August 2011.
Another new component of the AISRF is the Indo-Australian Fellowships Program that will provide support for post-doctoral researchers to undertake exchanges of up to 12 months duration and for more senior researchers to undertake short visits. Applications under this program are expected to open in late 2011.
Australia-China Science and Research Fund
The Science Ministers of the Commonwealth of Australia and the People’s Republic of China have reaffirmed both countries’ commitment to continue to expand collaboration on strategic science and research initiatives of mutual interest. Both governments have committed $9 million each over three years to a new Australia-China Science and Research Fund from 2011–12226. China is now the 3rd most important partner for Australian researchers and Australia is China’s 6th highest partner as reflected in scientific publications. These collaborations have contributed to breakthrough discoveries in areas as diverse as medical research, disaster management, biodiversity, water conservation, food security, wireless communications, and new alloys for manufacturing and clean energy. Scientific cooperation has also created new opportunities for
226 For further information see https://grants.innovation.gov.au/ISL/Pages/Doc.aspx?name=ChinaFund.htm [Accessed 27 May 2011]
Dr TJ Higgins examines a chickpea plant. Image provided by Dr Higgins (CSIRO) from an AISRF Project ‘Genetic enhancement of chickpeas (Cicer arietinum) using a two gene strategy to confer protection against Pod Borer (Helicoverpa armigera).
Australian Innovation System
Report 2
011
94
Australian researchers and firms to work at the heart of the Chinese economic powerhouse. The new fund will renew our strong partnership for the years ahead, helping both nations prepare for the challenges of a low-carbon, high-tech century.
Patent Analytics to improve collaboration between Australian universities
Patents help innovators to recoup the cost of their investment in R&D. In return for securing patent protection, inventors must fully disclose their inventions, including a full description of how each invention works. As a result of this disclosure requirement, patent databases provide a comprehensive and world-wide source of information about technological developments.
Patent analytics can extract useful insights from patent databases, through the mining, visualisation and deep analysis of the information included in patent documents.
Over the past two years, IP Australia has tested patent analytics software and developed a study analysing the patent holdings of 15 Australian universities, including the Group of Eight. IP Australia, in collaboration with the Innovation Division of DIISR, then consulted with each of the university’s technology transfer offices. The purpose of the consultation was to validate the results of the study and discuss their patenting and technology commercialisation activities. Consultations were also held with the IP Licensing Team at CSIRO.
These consultations established that patent analytics would significantly assist publicly-funded research agencies (PFRAs) to:
› Participate in domestic and international collaborations and identify prospective collaborators, licensees or research partners;
› Determine the commercialisation potential of their research at an early stage;
› Prevent duplication of R&D efforts and resources;
› Interact with and learn from others;
› Identify emerging areas of patenting activity and help to strategically position Australia’s research into the future; and
› Inform their IP management and commercialisation strategies.
IP Australia has investigated the feasibility of conducting a national patent analytics pilot for selected PFRAs. Subject to receiving funding, IP Australia plans to commence the pilot for PFRAs later this year.
CSIRO international engagement
In line with its 2007–2011 strategic plan, CSIRO continues to strengthen existing research relationships and forge new linkages globally. In 2009–10, CSIRO participated in over 800 international activities, across 70 countries, ranging from collaborative research to consulting and supervision of scientists from overseas. The value of CSIRO’s commercial transactions featuring an international partner component (including contracts with Australian Government agencies such as the Australian Agency for International Development (AusAID), and the Australian Centre for International Agricultural Research (ACIAR)), exceeded $92 million in 2009–10. CSIRO’s single most important international partner country continues to be the USA, with the greatest participation recorded on all indicators. CSIRO involvement with China continues to strengthen, with significant improvements in joint publication rates in the last year. The following are some of the highlights of the past year.
› The signing of the CSIRO – AusAID strategic partnership, which has led to two initiatives with a total value of approximately $50 million over four years.
› The signing of a Memorandum of Understanding (MoU) with the National Oceanic and Atmospheric Administration in February 2010.
› CSIRO is continuing to foster a stronger relationship with India’s Energy and Resources Institute, with whom it has two existing collaborative projects (funded by the Asia-Pacific Partnership on Clean Development and Climate) on solar energy technologies.
› The hosting of 24 PhD students from China under the MoU with the Chinese Ministry of Education/China Scholarship Council.

Chapter 4
: Links and collaboration
95
› CSIRO’s 1985 MoU with the Chinese Academy of Sciences (CAS) was renewed in 2008. In 2009, CSIRO and CAS agreed to the formation of a new joint steering committee to oversee the relationship and discuss opportunities for new collaboration in four key areas: sustainable water, agriculture and crop breeding; climate science and remote sensing; nanotechnology and new materials for energy; and health and biotechnology. CSIRO and CAS also established an exchange scheme to facilitate further mobility of science researchers between the two organisations.
› CSIRO hosted one of the six European Union Joint Science and Technology Cooperation thematic workshops in Canberra on 7 June 2010 on Biotechnology, Agriculture, and Food as part of the current ‘Knowledge Based Bioeconomy’.
› CSIRO’s Division of Plant Industries’ signed two MoUs with the Guangxi Sugarcane Research Institute and the Guangzhou Sugarcane Industry Research Institute in March and April 2010 to determine whether the genes of wild sugarcane varieties in China may be used to increase Australia’s sugarcane production levels.
› CSIRO’s work within the Global Research Alliance continues. One of the key outcomes from the meeting included the development of a joint project with Germany’s Fraunhofer Institute to provide low cost broadband solutions to Zambia.
NSW SMART Infrastructure Facility at the University of Wollongong227
The SMART Infrastructure Facility, a simulation, modelling, analysis, research and teaching facility located at the University of Wollongong is expected to be opened in July 2011. The NSW Government through RailCorp has contributed $10 million towards the establishment of the SMART Infrastructure Facility.
The facility will consist of 30 state-of-the-art laboratories connected by a national simulation and data centre and up to 150 research staff. The data centre will provide an e-research capability and collaboration with infrastructure planners, designers and researchers to better understand urban and regional development and model future growth of Australian metropolitan and regional communities. The facility is designed to transform the way that infrastructure-related disciplines are taught and researched. It will promote research collaboration nationally and internationally across traditional disciplines; increase and expand research capacity; stimulate collaboration with industry, government and research institutions; and provide an independent, comprehensive, inter-disciplinary facility for holistic and evidence-based evaluation of infrastructure. The facility’s mandate is to provide the data and analytical capability to successfully create and execute a national integrated infrastructure plan for Australia.
Small Technology Industry Uptake Program
The Victorian Government’s Small Technologies Industry Uptake Program (STIUP) 228 has been underway since October 2010 and uses a world’s best practice system of three tiers of vouchers to stimulate uptake of small technologies by industry, utilising existing research infrastructure and capability.
Over the nine months that the program has been running, 14 feasibility vouchers, 21 technical vouchers and three trial vouchers have been awarded. Successful applicants have been from a variety of industries such as textiles, bio medical, devices and microelectronics, developing products such as an improved hearing aid, functional sports fabrics and a bushfire beacon.
Australian Capital Territory Government – CollabIT
CollabIT is an engagement and business development initiative that links small and medium sized enterprises with multi-national corporations and other stakeholders in the information and communications technology sector in a collaborative environment. CollabIT is a joint initiative of the ACT Government and the Australian Information Industry Association. It is currently funded to July 2012.
CollabIT activities include brokered introductions, networking events engaging multinational companies in CollabIT activities and, supporting local SMEs to engage in CollabIT. CollabIT continues to grow with a current membership base of 153 companies. This membership comprises a mix of SMEs (94) and multinational companies (17), with the balance comprising a mix of companies offering recruitment, education and training.
227 http://smart.uow.edu.au/index.html 228 http://www.business.vic.gov.au/BUSVIC/STANDARD/PC_64109.html

Australian Innovation System
Report 2
011
96
The Tasmanian ICT Centre
The Tasmanian Information and Communication Technologies (ICT) Centre was created in 2006 as a research alliance between CSIRO, the Australian Government and the Tasmanian Government, with the goal of developing an internationally competitive ICT sector in Tasmania. The ICT tools developed here, in collaboration with industry, are helping improve energy use, monitor fish stocks, protect oceans, develop food production capacity and manage water resources. The Centre will also host a node of the Australian Centre for Broadband Innovation (ACBI) to leverage the opportunities and benefits that arise from the wide-scale connectivity provided by the National Broadband Network (NBN). The Tasmanian ICT Centre will be extended for a further five years from 2011–12 through a $50 million package. The Australian Government has committed $20 million, matched by $20 million from the CSIRO, $5 million from the Tasmanian Government and the final $5 million from industry.
Western Australian Energy Research Alliance
The Western Australian Energy Research Alliance (WA:ERA) provides state-of-the-art research and technology-based solutions and education services to the global energy industry through the multi-disciplinary expertise of three leading research institutions.
The Western Australian Government’s support of $20 million over five years (2005–2010), through the Western Australian Major Research Facility Program, has enabled the alliance between the University of Western Australia, Curtin University of Technology and CSIRO to share their collective knowledge, expertise and facilities to build relationships with WA:ERA’s key industry members that include Woodside Energy, Chevron Australia and CGGVeritas.
Working with these companies and with the State Government as part of Western Australia’s rapidly expanding energy sector, WA:ERA is building a reputation as one of the world’s leading and easily accessible oil and gas research organisations with wide-ranging capability in the discovery, development, recovery, transportation and refinement of subsurface energy solutions. One example of WA:ERA involvement is the Collie Hub Carbon Capture and Storage (CCS) Project. The project is a West Australian government-industry partnership including:
› The Department of Mines and Petroleum (leading the project);
› Perdaman Chemicals and Fertilisers;
› Verve Energy;
› The Griffin Group;
› Wesfarmers Premier Coal;
› BHP Billiton Worsley Alumina; and
› Alcoa of Australia.
The focus of the Collie Hub partnership is to support the research, demonstration and development of low carbon dioxide (CO2) emission technologies through carbon capture and storage in the South West of Western Australia.
The acquisition of a detailed seismic picture of the subsurface allows the application of innovative techniques. A seismic survey undertaken in Harvey in March 2011 for the Collie Hub project. Image provided by Gemma Dunthorne.

Chapter 4
: Links and collaboration
97
Case studies
The following case studies showcase examples of collaborations between Australian public and private organisations on innovation. Additonal case studies on collaboration can be found in the case study companion to this report.
Deakin University – Re-inventing the wheel
A wheel is a considerably complex structure with performance characteristics that include lightness, rigidity, and durability and shock absorption. Collaboration between Deakin University and Australian company CFusion has literally re-invented the wheel, creating the world’s first car wheel made totally from carbon composites. This use of carbon fibre in the manufacturing of wheels offers huge benefits to both vehicle makers and end-users. In contrast to metal designs, carbon composites can be varied infinitely throughout the wheel structure. This enables the properties of the end product made from carbon composites to be tailored to precise specifications. It is also easier to customise a composite design for varying degrees of stiffness than it is to customise a metal design.
Carbon Revolution’s Dr Matthew Dingle says that each wheel weighs 40–50% less than the best aluminium wheel of comparable size. This characteristic will also have applications for the aerospace, alternative energy, automotive and textiles industries. Other benefits of the CFusion wheel are:
› Significant reduction of un-sprung mass;
› Improved suspension for better grip;
› Improved acceleration and braking; and
› A crisper/sharper steering feel.
The wheel is also designed to meet the most demanding of performance and safety standards.
Further improvements in the product will be helped by the creation of the Australian Future Fibres Research and Innovation Centre (AFFRIC) at Deakin University’s Waurn Ponds Campus in 2012. This facility is being developed with support from the Commonwealth Government through its Education Investment Fund.
AMIRA International
AMIRA International, headquartered in Melbourne and with offices in three other regions, is an R&D broker for the minerals industry. AMIRA’s success as a broker of syndicated research projects is globally recognised in both industry and the research community, largely due to the fact that it is a not-for-profit association of most of the world’s largest mining companies and their major suppliers. AMIRA develops and then manages collaborative R&D projects on behalf of global consortiums of mining companies and industry supplier companies. The projects are carried out by leading research teams based at universities, CSIRO and elsewhere. AMIRA’s 2010 R&D portfolio has a budget exceeding $70 million. The outcome in 2010 from the following project illustrates how AMIRA engenders business innovation.
Victorian Minister for Regional and Rural Development, the Hon. Jacinta Allan holds up a carbon fibre wheel at the opening of the Geelong Technology Precinct redevelopment. Image provided by Deakin University.

Australian Innovation System
Report 2
011
98
AMIRA’s Minerals Exploration program
A significant outcome from AMIRA’s Minerals Exploration program was a new approach that will improve minerals exploration decision making in West Africa, a region where the mining industry is increasingly focussing exploration efforts. AMIRA was instrumental in getting the initiative off the ground not only by securing the necessary financial backing but, crucially, in designing the proposal. Ten research institutions from around the world, including the Institut de Recherche pour le Développement in France, the University of the Witwatersrand in South Africa and the Centre for Exploration Targeting at University of Western Australia, are contributing to the research and to the delivery of training courses for West African geoscientists. The scope of the project encompasses 13 countries in West Africa. Mining companies are contributing more than $2.2 million for the project, with important additional support from AusAID for the capacity building module. Recently the new initiative secured a further $1.6 million of funding through an ARC Linkage grant that will help to extend the science program to include comparative studies with two key Australian mineral terranes.
ElastatherapyTM
Elastagen is a clinical stage medical device company based in Sydney that is pioneering Elastatherapy™ using the human protein Elastin to naturally repair and augment the skin. Skin elasticity deteriorates with age due to the progressive loss of the Elastin protein, one of the three key molecules associated with youthful skin. Two of these molecules, hyaluronic acid and collagen, are already used in aesthetic dermatology, but the potential for Elastin has remained untapped and offers a novel direction in anti-ageing therapy. Elastagen has pioneered the scientific understanding of elastin and the “elastagenesis” process in collaboration with Professor Tony Weiss and other researchers at the University of Sydney and with the financial backing of GBS Venture Partners, Brandon Capital Partners and BizCapital/ATP Innovations.
Elastagen has worked extensively with a number of Australian contract research and manufacturing companies to progress its product development program and is the first company globally to have succeeded in the scalable commercial ‘good manufacturing practice’ (GMP) compliant manufacture of full length recombinant human elastin for use in dermatology applications.
During 2010, Elastagen successfully transitioned its dermatology products into the clinic and is currently conducting multiple clinical studies in Australia to evaluate the potential of its Elastin formulations to augment the skin and restore elasticity in both cosmetic and medical dermatology applications. Successful formulation development and manufacturing campaigns were conducted in Australia.
Bureau of Meteorology – Australian Hydrological Geospatial Fabric (the “Geofabric”)
The Australian Hydrological Geospatial Fabric is a Geographic Information System (GIS) that maps the spatial relationships between hydrological features such as rivers, lakes, dams, catchments, aquifers, water supply channels and drains. The Geofabric is being developed by the Bureau of Meteorology in collaboration with CSIRO, Geoscience Australia and the Australian National University.
When coupled to hydrologic observations and models in AWRIS, the Geofabric provides a basis for tracing the movement of water through the Australian landscape. By querying the Geofabric it is now possible to click on any point of any river reach in Australia, and immediately determine the properties of the catchment upstream of that point.
This diagram illustrates the Geofabric conceptual architecture and data workflows. Key to the design of the Geofabric are formal data product specifications that describe each product as well as input data sets. Underpinning the Geofabric is a formal, modular conceptual model that allows for direct mapping between the input data sets and the products. Image provided by the Bureau of Meteorology (through the Water Information Research and Development Alliance)

Chapter 4
: Links and collaboration
99
Phase 1 of the Geofabric was launched at the Spatial@gov conference on 5 October 2010, and the Bureau now provides free public access to national coverage of elevation data, a network of connected streams and a nested hierarchy of catchment reporting units.
The underlying concept being tested in this first version of the Geofabric is a set of points, also called ‘contracted nodes’, that represent known features in the landscape such as the confluence of two major rivers. These points are assigned a permanent identifier that will persist through subsequent versions of the Geofabric and will become the framework of the Geofabric through space and time. Over the next few years, the Geofabric will be progressively refined using higher resolution spatial data as they become available.
CSIRO Food Security – The ‘Perfect’ Prawn boosts local industry
CSIRO scientists have collaborated with the Australian prawn industry to develop a new prawn that is producing record yields and can be sustainably farmed. With around 50% of all prawns in Australia currently imported from other countries such as China and Vietnam, this research will dramatically improve the production efficiency and profitability of locally produced seafood.
After ten years of research, the new Australian Black Tiger prawn is a major boost for both the local prawn industry and consumers wanting to buy Australian seafood. The Food Futures National Research Flagship project has combined selective breeding techniques with DNA fingerprinting to develop a naturally bred Black Tiger prawn that captures the best features nature can provide. The new breed is grown and farmed in ‘drought proof’ saltwater ponds, has improved growth and survival rates and greater disease resistance combined with improved taste, texture and colour. Its high yields could also play an important role in securing food supplies, both in Australia and globally, through the production of a more sustainable and high yielding source of healthy protein.
The average harvest yield from Australian Black Tiger prawn farms is five tonnes per hectare. The average yield of the new breed developed by CSIRO and Gold Coast Marine Aquaculture in 2010 was 17.5 tonnes per hectare, with 30% of the ponds producing more than 20 tonnes per hectare – a world record yield result for Black Tiger prawns. If the entire Australian Black Tiger prawn industry adopts this new breeding technology, it will increase the industry’s production from 5,000 tonnes to 12,500 tonnes and add $120 million per annum to the value of the industry by 2020.
This image illustrates a Geofabric river network trace and surrounding catchment area upstream from the Barmah Forest on the border between New South Wales and Victoria. Image provided by the Bureau of Meteorology, Satellite image from Bing Maps.
Australian Black Tiger Prawns, Image provided by Darren Jew.
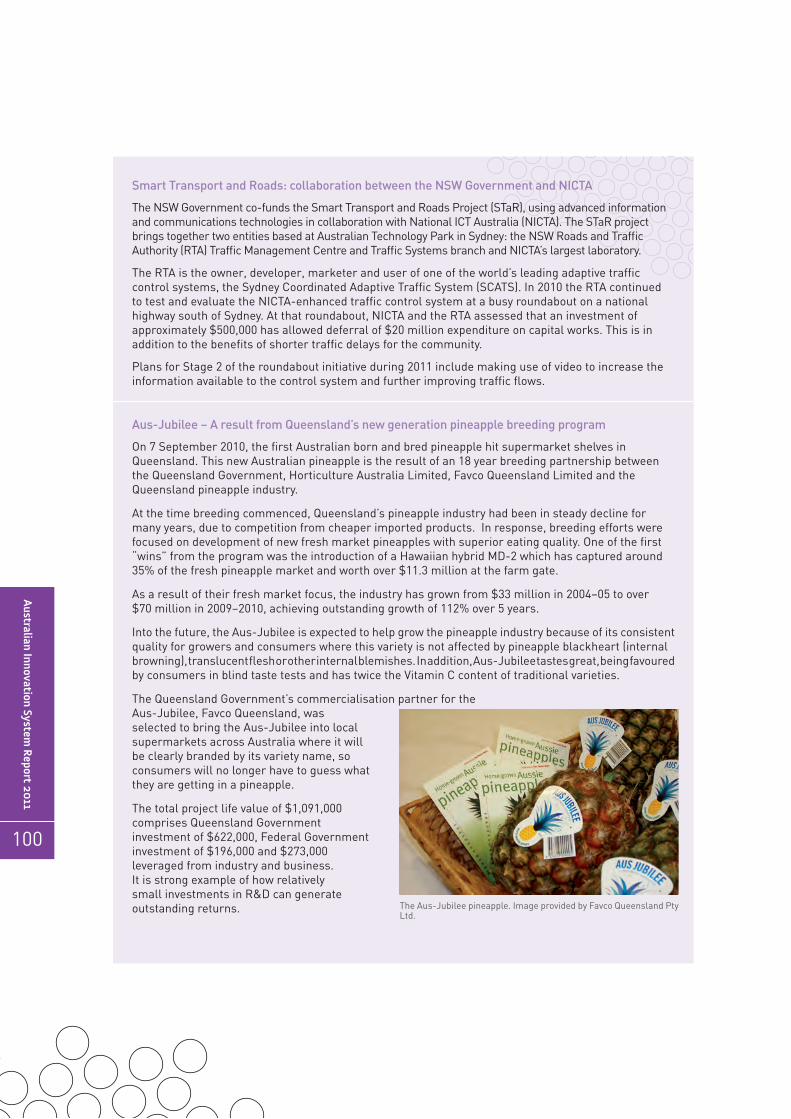
Australian Innovation System
Report 2
011
100
Smart Transport and Roads: collaboration between the NSW Government and NICTA
The NSW Government co-funds the Smart Transport and Roads Project (STaR), using advanced information and communications technologies in collaboration with National ICT Australia (NICTA). The STaR project brings together two entities based at Australian Technology Park in Sydney: the NSW Roads and Traffic Authority (RTA) Traffic Management Centre and Traffic Systems branch and NICTA’s largest laboratory.
The RTA is the owner, developer, marketer and user of one of the world’s leading adaptive traffic control systems, the Sydney Coordinated Adaptive Traffic System (SCATS). In 2010 the RTA continued to test and evaluate the NICTA-enhanced traffic control system at a busy roundabout on a national highway south of Sydney. At that roundabout, NICTA and the RTA assessed that an investment of approximately $500,000 has allowed deferral of $20 million expenditure on capital works. This is in addition to the benefits of shorter traffic delays for the community.
Plans for Stage 2 of the roundabout initiative during 2011 include making use of video to increase the information available to the control system and further improving traffic flows.
Aus-Jubilee – A result from Queensland’s new generation pineapple breeding program
On 7 September 2010, the first Australian born and bred pineapple hit supermarket shelves in Queensland. This new Australian pineapple is the result of an 18 year breeding partnership between the Queensland Government, Horticulture Australia Limited, Favco Queensland Limited and the Queensland pineapple industry.
At the time breeding commenced, Queensland’s pineapple industry had been in steady decline for many years, due to competition from cheaper imported products. In response, breeding efforts were focused on development of new fresh market pineapples with superior eating quality. One of the first “wins” from the program was the introduction of a Hawaiian hybrid MD-2 which has captured around 35% of the fresh pineapple market and worth over $11.3 million at the farm gate.
As a result of their fresh market focus, the industry has grown from $33 million in 2004–05 to over $70 million in 2009–2010, achieving outstanding growth of 112% over 5 years.
Into the future, the Aus-Jubilee is expected to help grow the pineapple industry because of its consistent quality for growers and consumers where this variety is not affected by pineapple blackheart (internal browning), translucent flesh or other internal blemishes. In addition, Aus-Jubilee tastes great, being favoured by consumers in blind taste tests and has twice the Vitamin C content of traditional varieties.
The Queensland Government’s commercialisation partner for the Aus-Jubilee, Favco Queensland, was selected to bring the Aus-Jubilee into local supermarkets across Australia where it will be clearly branded by its variety name, so consumers will no longer have to guess what they are getting in a pineapple.
The total project life value of $1,091,000 comprises Queensland Government investment of $622,000, Federal Government investment of $196,000 and $273,000 leveraged from industry and business. It is strong example of how relatively small investments in R&D can generate outstanding returns. The Aus-Jubilee pineapple. Image provided by Favco Queensland Pty
Ltd.

Chapter 4
: Links and collaboration
101
Australia-China Centre on Water Resources Research
The Australia-China Centre on Water Resources Research is a collaborative venture sponsored by the Australian Government Department of Innovation, Industry, Science and Research (DIISR) and Learned Academies in Australia, and government agencies in China. It is based at the University of Melbourne to conduct collaborative research on water management challenges.
The centre has developed a vibrant and productive program with an ongoing exchange of ideas and knowledge fostering 423 network activities between Australian and Chinese professionals and 9 research partnerships. The Centre has hosted seven workshops and is supporting 13 research projects with direct funding of $3.3 million, which have so far resulted in 36 high-impact journal papers.
In 2010, the centre took the lead in developing a framework for systemic and adaptive preparedness of catchment management to address reduced water availability, funded by the ARC. Through this framework, Australia’s experiences in the Murray-Darling Basin have been showcased in the Shiyang and Shule river basins in China (funded by AusAID), and Australians have access to Chinese research funding through the Black River project funded, by the Chinese Government. In collaboration with leading water researchers and agencies in Australia and China, the centre has been making significant progress on addressing water challenges in both countries.
Boeing names the CSIRO Supplier of the Year
Global aeronautics giant Boeing recently recognised CSIRO’s world-leading research and development, performance and customer service by naming them as a Supplier of the Year at an awards ceremony in Seattle on 19th May 2011.
Selected from a field of more than 17,500 suppliers from 50 countries, the CSIRO is one of 16 organisations – and the only Australian organisation – to be awarded this honour.
The CSIRO and Boeing have worked together on collaborative agreements for more than 22 years, and CSIRO has consistently delivered leading edge technical solutions to Boeing on time and on budget. These projects have led to technical breakthroughs in diverse product areas of materials, information technology, coatings and communications. Boeing forecasts continue to include CSIRO as a collaborative partner in future research and development.
Commenting on the award, the CSIRO Chief Executive, Dr Megan Clark, said, “We know we cannot be successful unless our collaborators, partners and stakeholders realise the value and outcomes of our science and describe working with us as a pleasure. I congratulate all of our people who have been working to make a meaningful and valuable collaboration with Boeing.”
Boeing recently established R&D laboratories in Brisbane and Melbourne, employing 37 scientists, many of whom collaborate with the CSIRO on joint projects. Together, these projects have more than 120 Australian scientists engaged on advanced aerospace technologies.
The CSIRO wins a Supplier of the Year Award from Boeing. (l-r) Mr Andrew Dingjan (CSIRO), Dr Alex Zelinsky (CSIRO), Mr Don Winter (Boeing). Image provided by the CSIRO.
Australian Innovation System
Report 2
011
102
CHAPTER 5Public Sector and Social Innovation
Social, economic and environmental innovations have historically been treated as separate pursuits, often with conflicting goals. Creating social value has generally been seen as the domain of the public and community sector, while the corporate sector focussed on maximising economic value. Until recently, the prevailing approach in most Organisation for Economic Co-operation and Development (OECD) countries has been to measure the costs and benefits of innovation in financial terms and to focus on social innovation inputs, without ‘counting’ social and environmental outputs or outcomes in a structured or systematic way.229
This view is changing as policymakers recognise the arbitrary or questionable delineation between social, economic and environmental domains. Chapter 3 shows that innovating enterprises across Australia are three times more likely to increase social contributions230 than non-innovating organisations, strongly suggesting that an innovative firm’s impact extends beyond its financial performance (Chart 3.2).231
Our understanding of innovation has progressively broadened to include non-technological innovation and the contributions of public sector and community organisations to driving and diffusing innovation for societal benefit. These organisations play a role in delivering important services across society, provide an environment for entrepreneurship and creativity, and often contribute additional resources to experiment with innovation in market and non-market conditions. The importance of social entrepreneurship in Australia was recognised through the granting of the 2011 Australian of the Year award to Simon McKeon232.
These public and community organisations are not only acting on identified social and environmental opportunities but are dealing with the wider social, economic and environmental ramifications of radical innovations that may give rise to new economic, social or environmental problems.233 Empirical evidence from the International Monetary Fund shows that recent increases in inequality across the world are primarily driven by technological progress.234 Intergenerational inequity can also be created for future generations from the unintended consequences of innovation. The burning of fossil fuels for energy has underpinned several waves of innovation and significant improvements in wealth and prosperity in the last 160 years235 yet has arguably created a huge environmental burden in the form of climate change.236
This chapter:
› Describes trends and outcomes of public sector innovation and government actions to foster it;
› Outlines indicative trends in social innovation and social entrepreneurship and government initiatives to encourage it; and
› Identifies a number of case studies from the public and community sectors illustrating innovative approaches and solutions to social challenges facing Australia.
The Australian Government’s seventh National Innovation Priority is relevant to these issues:
Priority 7: The public and community sectors work with others in the innovation system to improve policy development and service delivery.
229 The European Commission, United Nations and the OECD are currently developing a new economic growth accounting framework to incorporate social investments and environmental degradation into our measure of national prosperity. See European Commission (2009) GDP and beyond: Measuring progress in a changing world, Communication from the Commission to the Council and the European Parliament, Brussels, 20.8.2009, 433 final
230 This would include corporate social responsibility initiatives such as specific community enhancement projects, charity contributions or support.231 OECD (2010) Social Entrepreneurship and Innovation, In, SMEs, Entrepreneurship and Innovation, OECD, Paris.232 http://www.australianoftheyear.org.au/recipients/?m=simon-mckeon-2011233 OECD op. cit. 234 IMF (2007) World Economic Outlook, October 2007, Globalisation and Inequality, Washington DC, USA: 235 Freeman C & Louçã F (2002) As Time Goes By: From the Industrial Revolutions to the Information Revolution, Oxford University Press, Oxford.236 The Treasury (2010) Australia to 2050: Future Challenges, Intergenerational Report 2010, Australian Government

Chapter 5: P
ublic Sector and Social Innovation
103
Public sector innovation
The Australian Government has recognised that a dynamic national innovation system requires a dynamic and innovative public sector. The importance of public sector innovation in addressing economic, societal and environmental challenges has been highlighted in recent key Government documents including Powering Ideas (2009); Innovation in the Public Sector: Enabling Better Performance, Driving New Directions (2009)237; Ahead of the Game (2010), and Empowering Change (2010) 238 and, most recently, through a special project in public sector innovation overseen by the Secretaries Board of the Australian Public Service.
Public sector organisations complement and facilitate private innovation activities in the innovation system when they are compatible with government goals and priorities. Public sector organisations and agencies must also strive to be inherently innovative in the creation and delivery of novel policies that improve the way they interact with stakeholders and deliver public goods and services. This was discussed in the 2010 Australian Innovation System Report.
The challenges faced by governments in Australia and around the world are likely to expand in response to a range of mounting and converging pressures:
› Fiscal pressures to do more with less, heightened in recent times by the financial crisis;
› Global competition;
› Impacts of information and communications technology (ICT);
› Rising public expectations regarding service delivery, efficiency, openness, flexibility, accountability and participation in policy development; and
› Addressing complex problems such as an ageing population, sustainability, affordable health care, and social inclusion.239,240,241
These pressures provide a rationale for heightened focus on public sector innovation in all countries.242 The size of the Australian public sector – which accounted for around 35% of GDP in 2009–10243 also provides a compelling reason to ensure that its performance is maximised through innovation.
Using research and development (R&D) expenditures as an imperfect proxy measure, governments across Australia244 are increasing investments in innovation. R&D undertaken by governments (GOVERD) has almost doubled since 1992–93 to total $3.4 billion in 2008–09. The GOVERD to gross domestic product (GDP) ratio was 0.27% in 2008–09 ranking approximately 10th in the OECD.245 The fields of research attracting the largest amounts of GOVERD in 2008–09 were engineering ($611 million), agricultural and veterinary sciences ($545 million) and medical and health sciences ($452 million), respectively accounting for 18%, 16% and 13% of GOVERD.
Investments by Australian governments cover a broad range of socio-economic objectives that complement investments by other sectors and potentially underpin innovation in the public sector itself. Just over half (52%) of total government R&D expenditures are directed at social and environmental issues (Chart 5.1) compared with only 4% of total business expenditure on R&D.
237 Australian National Audit Office (2009) Innovation in the Public Sector: Enabling Better Performance, Driving New Directions, ANAO Better practice guide, ANAO, Canberra
238 Advisory group on Reform of Australian Government Administration (2010) Ahead of the Game: Blueprint for the Reform of Australian Government Administration, Australian Government Department of the Prime Minister and Cabinet, Canberra; and Management Advisory Committee (2010) Empowering Change: Fostering Innovation in the Australian Public Service, Australian Government, Canberra, Australia.
239 OECD (2009) Government at a glance, OECD, Paris240 Management Advisory Committee (2010) Empowering Change: Fostering Innovation in the Australian Public Service, Australian Government,
Canberra, Australia.241 The Treasury (2010) Australia to 2050: Future Challenges, Intergenerational Report 2010, Australian Government242 Scott-Kemmis D (2009) The Challenge of Sustaining Innovation in the Public Sector, in Assessing Policies, Programs and Other Initiatives to Promote
Innovation in the Public Sector: International Case Studies, Annex 1, Management Advisory Committee, APSC, Empowering Change: Fostering Innovation in the Australian Public Service 2010. Available at: http://www.apscgov.au/mac/empoweringchange.htm
243 Estimate on general government expenditure as a share of GDP, by Innovation Analysis Branch, Department of Innovation, Industry, Science and Research244 The General Government sector comprises all government units of the Australian Government, each state and territory government, and all local
government authorities, and all resident non-market Not-for-profit Institutions that are controlled and mainly financed by those governments. It includes courts, government departments, the Governor General’s office, and public universities. Government entities mainly engaged in market production or financial activities are not included in the General Government sector.
245 8109.0 Australian Bureau of Statistics – Research and Experimental Development, Government and Private Non-Profit Organisations, Australia, 2008–09.

Australian Innovation System
Report 2
011
104
Chart 5.1: Government research and development by socio-economic objective, 2008–09 Total expenditure = $3.4 billion
Source: ABS (2010) Research and experimental development, Government and Private Non-Profit Organisations, Australia, 2008-09. cat. no. 8109.0
The Australian Public Service Commission’s (APSC) State of the Service Reports highlights the commitment of Australian Public Service (APS) agencies to innovation.246 In 2009–10, 44% of agencies reported that they were implementing strategies to encourage reasonable risk-taking and a further 18% had strategies under development. More than half of APS agencies have (43%), or are developing (13%), strategies to identify and reward innovation. The reports also suggest a high potential for innovation in the APS.
While the great majority of APS employees report a willingness to innovate the proportion has declined marginally between 2008 and 2010 (Chart 5.2). APS employees are much less likely to agree that the agencies they work for encourage innovation (Chart 5.3) with 54% of employees reporting barriers to innovation in their workplace.247 The greatest barriers are considered to be financial/budget pressures or administrative/regulatory in nature (Chart 5.4).
Chart 5.2: Australian Public Service employee responses to the statement ‘I am always looking for better ways to do things’, 2008–2010
Source: Australian Public Service Commission, State of the Service Employee Surveys, 2008, 2009 and 2010.
246 The APS specifically being composed of people employed under the Public Service Act 1999 by departments, agencies and courts under the Government of Australia, to administer the working of the public administration of the Commonwealth of Australia.
247 Australian Public Service Commission, State of the Service Employee Survey, 2010, question 55a results.
Defence, $486m
Plant production & plant primary products, $263.8m
Animal production & animal primary products, $215.9m
Mineral resources(excl. energy) , $104.0m
Energy, $149.2m
Manufacturing, $164.9m Construction, $17.4m
Transport, $23.4m Information & communication services, $156.9m
Commercial services & tourism, $12.7m Economic framework, $50.6m
Health, $543.7m
Education & training, $16.1m
Law, politics & community services, $180.0m
Cultural understanding, $15.3m
Environment, $794.1m
Expanding knowledge, $226.5m
90 89 86
9 10 12
1 1 2
0
20
40
60
80
100
2008 2009 2010
Per
cent
age
of e
mpl
oyee
s Disagree
Neither agreeor disagree
Agree

Chapter 5: P
ublic Sector and Social Innovation
105
Chart 5.3: Australian Public Service employee responses to the statement ‘My current agency encourages innovation and the development of new ideas’, 2008–2010
Source: Australian Public Service Commission, State of the Service Employee Surveys, 2008, 2009 and 2010.
Chart 5.4: Australian Public Service employee perceptions of barriers to innovation in their workplace, 2010
Source: Australian Public Service Commission, State of the Service Employee Survey, 2010.
Per
cent
age
of e
mpl
oyee
s
Disagree
Neither agreeor disagree
Unsure
Agree
46 52 50
31
30 33
21 17 16
1 1 1
0
20
40
60
80
100
2008 2009 2010
Percentage of employees
10
20
23
23
28
35
40
47
60
61
0 10 20 30 40 50 60 70
Other
Extensive use of contractors or consultants
Lack of learning and development opportunities
Lack of recognition or reward for ideas
Lack of communication across agencies
Lack of consultation within my agency (e.g. with staff at alllevel or between policy design and service delivery areas)
Lack of managerial support
A culture of risk aversion
Excessive 'red tape' (e.g. regulatory oradministrative processes)
Budgetary pressures and/or lack of resources

Australian Innovation System
Report 2
011
106
Government public sector innovation initiatives and case studies
Over recent years there have been a number of initiatives to foster innovation in the public sector in Australia, state, territory and local governments play an active role in this area.248 The National Awards for Local Government run by the Department of Regional Australia, Regional Development and Local Government, were set up in 1986 to recognise, reward and promote the innovative work of local governments across Australia.249 The Victorian Public Service developed an Innovation Action Plan in 2009 which focuses on increasing collaboration, building capability, generating ideas and sharing information and data to embed innovation across the public service.250 Since 2008, the Western Australian Government and other WA organisations have been active in promoting public sector innovation through auditing, innovation training and workshops.251 Examples of public sector innovation strategies and initiatives occurring in WA are outlined in the WA Public Sector Case Studies report252 and below. A number of actions, achievements and forward plans related to public sector innovation are detailed below. Additional case studies on public sector innovation can be found in the Case Study companion to this report.
Australian Public Service Project on Public Sector Innovation253
In 2010 the Empowering Change report on fostering innovation in the Australian Public Service was published. As part of its commitment to building a more innovative public service, in August 2010, the Australian Public Service’s most senior leadership body, the Secretaries Board, set up a high level project committee to advise on implementation of the report. The project committee considered a range of factors including how to foster greater collaboration between agencies, what skills sets would be needed and where innovation fits in existing governance arrangements, as well as issues of resourcing and culture.
The project committee’s findings, which were endorsed in April 2011, highlighted key areas for future focus, including:
› Openness (greater use within the APS of knowledge and challenge platforms, broader engagement on policy development, and greater operational use of external expertise);
› Leadership (hardwiring innovation into agency leadership systems);
› Risk (better acceptance and management of risk);
› Measures to assist innovation (e.g. the Innovation Toolkit);
› Strategy (encompassing innovation in strategy and planning); and
› Recognition and dissemination (recognising innovation successes and sharing learning).
One of the key deliverables from the project is the APS Innovation Action Plan, which sets out a commitment by the secretaries of all APS agencies to harness the innovative potential of the APS leadership and staff. The Action Plan provides a framework for embedding innovation in the operations of the APS and to achieve more innovative outcomes in four action areas: Developing an innovation consciousness within the APS;
› Building innovation capacity;
› Leveraging the power of co-creation; and
› Strengthening leadership so there is the courage to innovate at all levels.
Development is also underway on the concept of an APS Design Centre, a facility for the APS where new skills, techniques and disciplines can be utilised to engage with and respond to wicked problems and cross cutting issues. Such a centre would link with citizens and businesses to find fresh ideas and co-create & design solutions to tackle policy challenges in key areas.
248 Martin J (No date specified) Innovation Strategies in Australian Local Government, Australian Housing and Urban Research Institute, Occasional Paper 4, http://www.ahuri.edu.au/downloads/publications/Occasional_Paper_4.pdf
249 http://www.regional.gov.au/local/awards/index.aspx 250 Department of Premier and Cabinet, Victoria, VPS Innovation Action Plan, Nov. 2009. Available at: www.dpc.vic.gov.au.251 http://www.agric.wa.gov.au/PC_94215.html?s=1001 and http://www.wa.ipaa.org.au/userfiles/Media%20Releases/Launch%20of%20Public%20Sector%20
Innovation%20Programs.pdf252 http://www.agric.wa.gov.au/objtwr/imported_assets/content/amt/innovation_workshop_booklet_sm.pdf253 http://www.innovation.gov.au/INNOVATION/PUBLICSECTORINNOVATION/Pages/default.aspx

Chapter 5: P
ublic Sector and Social Innovation
107
Australian Public Sector Innovation Indicators project254
The Australian Public Sector Innovation Indicators (APSII) Project seeks to improve the measurement of public sector innovation in Australia. Managed by the Department of Innovation, Industry, Science and Research (DIISR), the project arose as a specific initiative of the APS200 Project on Public Sector Innovation in September 2010 and now reports to the Secretaries Board.
The aims of the APSII project are to equip public sector agencies with the information they need to assess their innovation performance and capabilities, and to benchmark Australia’s performance against other international public sectors, especially in OECD countries. The project includes the development of a new data collection tool – an Australian Public Sector Innovation Survey – and a new measurement tool – a set of Australian Public Sector Innovation Indicators. The project has appointed a Technical Reference Group (TRG) comprised of individuals with specific expertise on innovation measurement. The TRG, which met in March and June 2011, has endorsed a draft conceptual and methodological framework for measuring public sector innovation in Australia for further consultation.
The project has contributed to the development of innovation questions for the employee and agency components of the Australian Public Service Commission’s 2010-11 State of the Service Survey. These surveys, conducted in May and June 2011, respectively, will result in a set of new, quality data on public sector innovation in the Australian Public Services (APS).
The project has also established a Stakeholder Reference Group (SRG), with representatives from Commonwealth portfolio departments, academic and key public policy forums. The SRG, whose inaugural meeting was held in June 2011, will have a continuing role in providing a user perspective on the data, indicators and measurement tools to be delivered by the Project.
It is envisaged that by the end of 2012, the project will have conducted a pilot public sector innovation survey, delivered a measurement framework paper for public sector innovation in Australia, produced a pilot report on the state of innovation in the APS, and prepared pilot analytical reports on innovation for individual APS agencies.
At a later stage the project may expand to the wider public sector subject to the outcome of previous stages.
Departmental Innovation Initiative – innovate
The Department of Infrastructure and Transport launched a pilot departmental innovation initiative on 17 August 2010. The purpose of the initiative, known as innovate, is to provide all staff with an avenue to develop and implement their innovation ideas.
Innovate enables staff members to put forward their ideas through the Department’s internal innovate site where they are published on the innovate site for consideration. Additionally, open forums have been established, at which staff members are invited to meet with the Deputy Secretaries who facilitate discussion regarding particular topics of interest for the Department.
A number of innovative proposals have been received and implemented within the Department, including the creation of a one-stop helpdesk contact page on the intranet that provides staff with easy access to the contact information they need.
The Australian Centre of Excellence for Local Government
The Australian Government has contributed $8 million to establish the Australian Centre of Excellence for Local Government255 which opened in June 2009. The Centre is a consortium of research organisations, local government representative bodies and other organisations. Its mandate is to enhance good governance, strategic leadership and workforce capability in local government; stimulate and inform debate on key issues for local government; and encourage innovation and best practice across local government.
The Centre’s new Innovation and Best Practice program has been designed to disseminate good examples of innovation and better practice in local government, and facilitate and encourage knowledge exchange and experience sharing. An interactive online space called the Innovation and Knowledge Exchange Network256 (IKEN) is currently under development and scheduled for launch by mid-2011. IKEN will provide a range of methods and tools for information exchange, networking and collaboration, mutual learning and shared
254 http://www.innovation.gov.au/INNOVATION/PUBLICSECTORINNOVATION/Pages/default.aspx255 www.acelg.org.au256 www.iken.net.au

Australian Innovation System
Report 2
011
108
insights. In 2011, the program also intends to develop and facilitate a ‘peer’ review system that can provide an assessment mechanism across the sector.
The Australian Centre of Excellence for Risk Analysis
The Australian Centre of Excellence for Risk Analysis (ACERA) at the University of Melbourne has developed a close working relationship with the Federal Department of Agriculture, Fisheries and Forestry (DAFF). Led by director Professor Mark Burgman, ACERA’s mandate is to develop tools, methods, and procedures for risk analysis with a particular focus on biosecurity. The work assists DAFF to deal with quarantine and inspection systems, trade risk analysis, market access and Australia’s responsibilities under the World Trade Organisation. ACERA’s work also contributes to State and Territory emergency response procedures, surveillance and monitoring activities, and capacity building in our trading partners.
ACERA is working under four major themes: estimating the consequences of invasive organisms; developing efficient border inspection systems and post-border surveillance strategies; gathering biosecurity intelligence; and integrating risks of multiple pathways and pests. Much of this work is motivated by the recent Beale Review of Biosecurity Systems in Australia which recommended that DAFF move towards implementing risk-return strategies. The breadth of this work is reflected in the involvement of people from many disciplines including animal and plant biology, philosophy, psychology, social science, law, mathematics, statistics and computer science, and institutions including the University of California Riverside in the USA, the Technion – Israel Institute of Technology and the University of Helsinki.
Australian e-Government Technology Cluster
The Australian e-Government Technology Cluster is a Canberra based initiative established in late 2009 by the National ICT Australia (NICTA), the ACT Government, international corporations and smaller ICT companies. Its objective is to facilitate collaboration in developing technology that will enable governments to deliver better services, reduce costs and open up new opportunities for businesses.
The ACT Government has collaborated with the other partners to support the cluster for an initial three year period to 2012. The cluster’s activities will position the ACT and Australia as the leading centre for e-government technology and innovation in the Asia Pacific region.
The cluster has taken the leadership role in holding seminars both in the ACT and nationwide on e-health and the modelling of cloud computing cost and performance. Other cluster activities have included the establishment of a new Cooperative Research Program with the Chief Information Officer Group (CIOG) of the Department of Defence.
Queensland Government: Enabling collaboration and saving millions
The eExtension project within Queensland’s Department of Employment, Economic Development and Innovation (DEEDI) has successfully trialled and implemented five online collaboration technologies as interim corporate solutions.
The five eTools are blogs (using WordPress), wikis (using GovDex), web conferencing (using WebEx), eSurveys (using SurveyMonkey) and eBooks (using eBookGold). Adoption and use of these newly available technologies has been swift. Currently there are 131 webinar hosts, 107 eSurvey creators, 22 wiki owners, 4 blog owners and 4 people interested in creating eBooks. These numbers are growing.
In the last two years DEEDI has saved an estimated $2.2 million through the use of web conferencing ($600,000 saving in airfares plus $1,400,000 in associated salaries) and eSurveys ($176,000 saving in printing and postage). Web conferencing is showing the greatest potential and there have now been over 750 webinars conducted with over 3,500 participants. This equates to the following savings:
› 14,457 hours of travel time for DEEDI staff;
› $1,445,688 of associated salaries due to not travelling;
› $602,370 of airfares; and
› 723 metric tonnes of CO2.257
257 This is based on the assumption that one hour of web conferencing (with 10 participants from regional centres around Qld) saves 60 hours of travel time; $6,000 in associated salaries; $2,500 of airfares and 3 metric tonnes of CO2.

Chapter 5: P
ublic Sector and Social Innovation
109
Western Australia – Landgate Innovation Program
The Landgate Innovation Program258, the first of its kind within the Western Australian Public Sector and a 2010 Premiers Awards finalist, was established in 2008. It was created to develop new products, improve business efficiency and enhance commercial focus. Its core elements are:
› Strategic direction from the Board of Management and routine involvement from the Executive;
› $2 million in annual funding managed by a cross-organisation Innovation Peer Review Team;
› Easy to use collaboration tools in an Innovation Forum and Wiki where everyone can post, read, comment and develop ideas;
› Staff are encouraged to spend 5% (or 1.5 hours of a full-time work week) on innovation and research;
› Over 600 staff members, approximately 85% of Landgate staff, have been trained in creative thinking;
› Successes and failures are celebrated and fun is promoted; and
› A simple idea review process has been adopted to evaluate inputs on an ongoing basis (Figure 5.1).
Figure 5.1. Landgate idea review process
The Landgate Innovation Program has had significant success. There have been over 100,000 hits on the Innovation Forum, over 3,000 ideas have been floated and around 45 formal projects have been funded including complex 3D systems, mobile platform and online applications as well as simple efficiency and communication ideas. New revenue streams have been created and in-house business efficiency savings have been realised.
The Shared Spatial Land Information Platform Developers Program is one example of how the program has been able to facilitate industry empowerment and community awareness around the multi-layered intelligent mapping services that the agency provides. Expressions of interest were sought from local developers to improve the State’s mapping capabilities with grants of up to $100,000 made available. In this project, the agency was able to receive constructive feedback from the industry as to how it might improve its products and services for the greater community. Eight individual projects were funded, which focused on local government online reporting tools within a mapping framework, increasing open source integration into State services and mobile device applications.
Landgate has also been involved in developing a WA Public Sector Innovation Initiative with the Department of Commerce, the Department of Agriculture and Food and Australia Post. Landgate regularly presents its Innovation Program to other government organisations sharing its experience in adopting an innovative attitude and culture. A new innovation-out-of-a-box package provides the tools and process guides to easily share the Landgate Innovation story with other organisations. This package is designed to help organisations start their own innovation programs so they can enjoy similar benefits to those Landgate has delivered.
258 www.landgate.wa.gov.au/innovation
Idea generated by staff member Peer review teamforum input (all staff)
further information required
approved
Closed with reason given
Passed to business area
for immediete use
Further development with funding
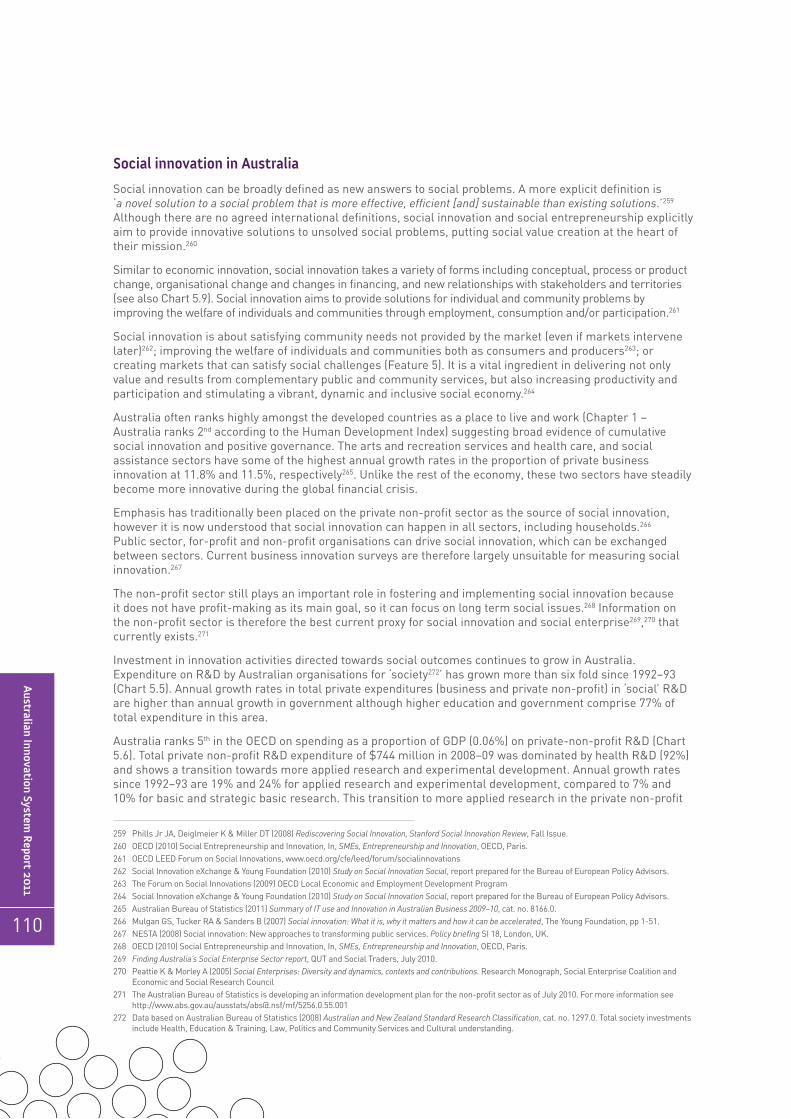
Australian Innovation System
Report 2
011
110
Social innovation in Australia
Social innovation can be broadly defined as new answers to social problems. A more explicit definition is ‘a novel solution to a social problem that is more effective, efficient [and] sustainable than existing solutions.’259 Although there are no agreed international definitions, social innovation and social entrepreneurship explicitly aim to provide innovative solutions to unsolved social problems, putting social value creation at the heart of their mission.260
Similar to economic innovation, social innovation takes a variety of forms including conceptual, process or product change, organisational change and changes in financing, and new relationships with stakeholders and territories (see also Chart 5.9). Social innovation aims to provide solutions for individual and community problems by improving the welfare of individuals and communities through employment, consumption and/or participation.261
Social innovation is about satisfying community needs not provided by the market (even if markets intervene later)262; improving the welfare of individuals and communities both as consumers and producers263; or creating markets that can satisfy social challenges (Feature 5). It is a vital ingredient in delivering not only value and results from complementary public and community services, but also increasing productivity and participation and stimulating a vibrant, dynamic and inclusive social economy.264
Australia often ranks highly amongst the developed countries as a place to live and work (Chapter 1 – Australia ranks 2nd according to the Human Development Index) suggesting broad evidence of cumulative social innovation and positive governance. The arts and recreation services and health care, and social assistance sectors have some of the highest annual growth rates in the proportion of private business innovation at 11.8% and 11.5%, respectively265. Unlike the rest of the economy, these two sectors have steadily become more innovative during the global financial crisis.
Emphasis has traditionally been placed on the private non-profit sector as the source of social innovation, however it is now understood that social innovation can happen in all sectors, including households.266 Public sector, for-profit and non-profit organisations can drive social innovation, which can be exchanged between sectors. Current business innovation surveys are therefore largely unsuitable for measuring social innovation.267
The non-profit sector still plays an important role in fostering and implementing social innovation because it does not have profit-making as its main goal, so it can focus on long term social issues.268 Information on the non-profit sector is therefore the best current proxy for social innovation and social enterprise269,270 that currently exists.271
Investment in innovation activities directed towards social outcomes continues to grow in Australia. Expenditure on R&D by Australian organisations for ‘society272’ has grown more than six fold since 1992–93 (Chart 5.5). Annual growth rates in total private expenditures (business and private non-profit) in ‘social’ R&D are higher than annual growth in government although higher education and government comprise 77% of total expenditure in this area.
Australia ranks 5th in the OECD on spending as a proportion of GDP (0.06%) on private-non-profit R&D (Chart 5.6). Total private non-profit R&D expenditure of $744 million in 2008–09 was dominated by health R&D (92%) and shows a transition towards more applied research and experimental development. Annual growth rates since 1992–93 are 19% and 24% for applied research and experimental development, compared to 7% and 10% for basic and strategic basic research. This transition to more applied research in the private non-profit
259 Phills Jr JA, Deiglmeier K & Miller DT (2008) Rediscovering Social Innovation, Stanford Social Innovation Review, Fall Issue.260 OECD (2010) Social Entrepreneurship and Innovation, In, SMEs, Entrepreneurship and Innovation, OECD, Paris.261 OECD LEED Forum on Social Innovations, www.oecd.org/cfe/leed/forum/socialinnovations262 Social Innovation eXchange & Young Foundation (2010) Study on Social Innovation Social, report prepared for the Bureau of European Policy Advisors.263 The Forum on Social Innovations (2009) OECD Local Economic and Employment Development Program264 Social Innovation eXchange & Young Foundation (2010) Study on Social Innovation Social, report prepared for the Bureau of European Policy Advisors.265 Australian Bureau of Statistics (2011) Summary of IT use and Innovation in Australian Business 2009–10, cat. no. 8166.0. 266 Mulgan GS, Tucker RA & Sanders B (2007) Social innovation: What it is, why it matters and how it can be accelerated, The Young Foundation, pp 1-51.267 NESTA (2008) Social innovation: New approaches to transforming public services. Policy briefing SI 18, London, UK.268 OECD (2010) Social Entrepreneurship and Innovation, In, SMEs, Entrepreneurship and Innovation, OECD, Paris.269 Finding Australia’s Social Enterprise Sector report, QUT and Social Traders, July 2010.270 Peattie K & Morley A (2005) Social Enterprises: Diversity and dynamics, contexts and contributions. Research Monograph, Social Enterprise Coalition and
Economic and Social Research Council271 The Australian Bureau of Statistics is developing an information development plan for the non-profit sector as of July 2010. For more information see
http://www.abs.gov.au/ausstats/[email protected]/mf/5256.0.55.001272 Data based on Australian Bureau of Statistics (2008) Australian and New Zealand Standard Research Classification, cat. no. 1297.0. Total society investments
include Health, Education & Training, Law, Politics and Community Services and Cultural understanding.

Chapter 5: P
ublic Sector and Social Innovation
111
sector is confirmed from Medical Research Institute (MRI) commercialisation outcomes, a reasonable proxy given that health R&D dominates private non-profit R&D. MRI patenting and licensing of intellectual property has grown annually at 10% and 29% respectively since 2000. However, rates of entrepreneurship from MRIs have declined significantly through the global financial crisis (declining by 85% between 2007 and 2009).273
Chart 5.5: Australia’s total expenditure on research and development towards social outcomes, 1992–93 to 2008–09
Source: ABS (2010) Research and experimental development, All sector summary, Australia, 2008-09. cat. no. 8112.0
Chart 5.6: Private Non Profit research and development (PNPRD) intensity (expenditure as a percentage of gross domestic product), by country
Source: OECD, Main Science and Technology Indicators, January 2011. Note that data is not available for 12 OECD countries
273 DIISR (2011) National Survey of Research Commercialisation 2008–09, Australian Government. This data represents the small proportion of all medical research institutes across Australia that responded to all surveys across all years. Total numbers will be higher.
Private non-profit
Higher education
Government
Business
0
1
2
3
4
5
6
1992–93 1994–95 1996–97 1998–99 2000–01 2002–03 2004–05 2006–07 2008–09
GER
D, $
bill
ion
(cur
rent
pri
ces)
Finl
and
Swed
en
Uni
ted
Kin
gdom
Slov
enia
Pol
and
Den
mar
k
Aus
tral
ia
Icel
and
Swit
zerl
and
Fran
ce
Spai
n
Uni
ted
Stat
es
Cze
ch R
epub
lic
Esto
nia
Tota
l OEC
D
Japa
n
Kor
ea
Isra
el
Bel
gium
Aus
tria
Can
ada
Ital
y
Por
tuga
l
0.00
0.02
0.04
0.06
0.08
0.10
0.12
0.14
PN
PR
D, %
GD
P

Australian Innovation System
Report 2
011
112
FEATURE 5: SOCIAL ENTREPRENEURSHIP AND INNOVATION
Social enterprises can be broadly defined as market-based entrepreneurship where the primary business mission is to provide innovative solutions to unsolved social problems rather than gain personal wealth.274 Social entrepreneurship is therefore a major vehicle and agent (although not the only one) of social innovation. Market-based activity is increasingly being recognised as an innovative and effective model for addressing a range of social problems. The importance of social entrepreneurship in Australia was recognised through the granting of the 2011 Australian of the Year award to Simon McKeon275. This reflects new demands for innovative responses to ‘wicked’ social and environmental problems, as well as growing requirements for not-for-profit organisations to diversify their income sources.276
Around the world, social enterprises have been estimated to employ up to 6% of working populations, have revenues in the order of tens or hundreds of billions contributing significantly to GDP.277 The 300 largest cooperatives in the world have combined assets of US$30-40 trillion and an annual turnover of US$963 billion.278 As market activity led by a mission to achieve public, cultural, environmental or community benefit, social entrepreneurship is challenging presumed divisions between social and economic activity.279 Social enterprises are a large, mature sector of the economy. Most social enterprises have been established for more than ten years and according to the 2010 Finding Australia’s Social Enterprise Sector (FASES) report there are approximately 20,000 social enterprises in Australia, very close to the 21,965 market-facing non-profit institutions (NPIs)280 estimated by the Australian Bureau of Statistics as of June 2007.
These market-facing NPIs contribute two-thirds of all non-profit institution incomes (approx. 2.64% GDP) through the sale of goods and services in Australia and rely less on transfers and donations than non-market facing NPIs (Chart 5.7).
Chart 5.7: Market-facing and non market-facing non-profit institution income (NPI), by type, 2006–07
Source: ABS (2008) Australian National Accounts: Non-profit institutions satellite account, 2006-07. cat. no. 5256.0
274 Kernot C (2009) Social Enterprise: A powerful path to social inclusion, The Centre for Social Impact; OECD (2010) Social Entrepreneurship and Innovation, In, SMEs, Entrepreneurship and Innovation, OECD, Paris.; Mair J & Ganly K (2010) Social entrepreneurs: Innovating towards sustainability, In (E. Assadourian Ed.), State of the World, Transforming Cultures: From consumerism to sustainability, WorldWatch Institute, Washington D.C; Santos F (2009) A positive theory of social entrepreneurship, Faculty and research working paper, Social Innovation Centre, INSEAD, 2009/23/EFE
275 http://www.australianoftheyear.org.au/recipients/?m=simon-mckeon-2011276 Finding Australia’s Social Enterprise Sector report, QUT and Social Traders, July 2010.277 OECD (2010) Social Entrepreneurship and Innovation, In, SMEs, Entrepreneurship and Innovation, OECD, Paris.278 Ibid.279 http://www.socialtraders.com.au/finding-australias-social-enterprise-sector-fases#A_research_based_def280 Market-facing non-profit institutions are those that ‘receive income from sales sufficient to cover the majority of their costs of production. Sales in this context
includes income received from government provided on a volume basis, rent, leasing and hiring income, sponsorship income and membership fees.’
Market facing NPIs
Non Market facing NPIs
4.9
36.2
6.3
1.5 1.5
50.4
1.8
11.1 10.3
1.2 1.9
26.2
0
10
20
30
40
50
60
Sales ofgoods
Income fromservice provision
Transfers anddonations
Investmentincome
Other income Total income
Inco
me,
$bi
llio
n

Chapter 5: P
ublic Sector and Social Innovation
113
Social enterprises create social value or change that leads to better outcomes for people in a community. They cover a wide range of organisations from cooperatives to public service providers and community/voluntary associations to companies limited by guarantee and even for-profit enterprises that have a social change mission at their centre. Most social enterprises have a revenue stream, whether or not they are “for profit” or “not for profit” (Chart 5.7). Social entrepreneurship reflects emerging hybrid business models that provide a platform for experimentation and risk taking to develop innovative solutions. It has the capacity for place-based solutions to social issues and a means for community led social innovations.281 Social enterprises directly deliver social innovations by seeking and creating ‘win-win’ economic & social dividends (Figure 5.2).
Figure 5.2: Mechanisms for implementing social innovations
Source: Australian Government Department of Education, Employment and Workplace Relations.
Social innovation is the second most likely mission of social enterprises with 26.4% of those surveyed responding that their mission was to develop new solutions to social, cultural, economic or environmental problems (Chart 5.8). Unofficial data indicates that social enterprises are highly innovative with the proportions of innovating social enterprises ranging between 40 and 75% (Chart 5.9). Service and process innovations are more likely in social enterprises than goods innovation. This is not surprising given the large differences in goods and service income streams (Chart 5.7).
281 Finding Australia’s Social Enterprise Sector report, QUT and Social Traders, July 2010.
2
1
Social Contracting 4 Corporate Social Reponsibility
FOCUS OF ACTIVITY:
PRIMARY PURPOSE: People & Products
Social Purpose
CommercialPurpose
Social Enterprise
3
Social Business
Profits
5
Intermediaries
Performance
of enterprising solutions to social problems
provision of funding and support to deliver those solutions
Direct Delivery Indirect delivery

Australian Innovation System
Report 2
011
114
Chart 5.8: Main mission-based functions of Australian social enterprises
Source: FASES survey report (2010). Note that these questions are not compatible with the ABS innovation survey.
Chart 5.9: Types of innovation undertaken by Australian social enterprises
Source: FASES survey report (2010). Note that these questions are not compatible with the ABS innovation survey.
12.6
23.5
17.5
5.4
2.3
6.9
18.1
8.0
21.2
13.5
44.4
20.9
23.2
26.4
0 10 20 30 40 50
Other
Generate income to reinvest in charitableservice or community activities
Advance cultural awareness
Provide a vehicle for members to tradetheir goods or services on the open market
Provide a vehicle for members to tradetheir goods or services with each other
Address an environmental issue
Create meaningful employment opportunitiesfor people from a specific group
Create meaningful employment opportunitiesfor people from a specific area
Provide training opportunities for peoplefrom a specific group
Provide training opportunities for peoplefrom a specific area
Create opportunities for peopleto participate in their community
Provide needed goods or servicesto a specific group
Provide needed goods or servicesto a specific area
Develop new solutions to social, cultural,economic and environmental problems
Percentage of respondents
Purpose:
42.5
64.1
74.6
67.1
70.2
39.9
44.2
0 20 40 60 80
Expand your mission to target newor different beneficiaries
Develop any new or substantially changed processes toimprove your social impact
Develop any new or substantially changed processes toimprove your business operations
Develop any new or substantially improved services tomeet the needs of your beneficiaries
Develop any new or substantially improved services tosupport the development of your business
Develop any new or substantially improved goodsto meet needs of beneficiaries
Develop any new or substantially improved goods tosupport development of your business
Percentage of respondents
In the past 12 months, did your social enterprise:

Chapter 5: P
ublic Sector and Social Innovation
115
Government initiatives that support social innovation and entrepreneurship
As awareness of the importance of social innovation policy has grown, a number of government initiatives have emerged to encourage social innovation and entrepreneurship. The first wave of support came with the Jobs Fund282, the Innovation Fund283, Golden Gurus284 and the Professional Partnership Project285. Under the Jobs Fund, a number of social enterprises were provided with funding for their work to increase employment participation and/or retention of jobs, play a greater role in addressing skill shortages and help individual job seekers, particularly disadvantaged job seekers find sustainable employment. Under the Innovation Fund, a number of initiatives aimed at reducing the barriers to employment for disadvantaged job seekers have been funded. Across these initiatives work designed to build capacity within the social enterprise sector and encourage participation, such as the School for Social Entrepreneurs, have also been funded. A new wave of experimental government social innovation support programs have since been developed to facilitate and build capacity across the Australian innovation system for social innovation. A number of these initiatives are detailed below but do not take into account a significant number of initiatives that support social innovation without this being their primary aim. For example both the 13th and the 14th Cooperative Research Centre selection rounds (2010 and 2011) included social innovation as one of its priorities.
Social Enterprises Development and Investment Funds (SEDIF)
The Australian Government has allocated $20 million as a cornerstone investment to seed the establishment of Social Enterprise Development and Investment Funds (SEDIF). This initiative aims to enable the development of financial products and related capacity building for Australian start-up and growth-stage social enterprises. The intent is to leverage additional investment from the corporate and philanthropic sectors on a one-to-one basis and increase the funds available to support social enterprises during their growth phase. The funds will be managed by licensed funds managers.
This investment represents the Government’s recognition of the potential for impact and innovation by social enterprises and socially-driven individuals and communities. The SEDIF program is part of a broader Government contribution to an enabling environment and infrastructure for effective solutions to social challenges and to encourage meaningful, long-term partnerships.
The funds are intended to have a demonstration effect; designed to increase access to capital and diversify sources of finance for social enterprises. It is a contribution to forge a new path for Government involvement in social impact investment and introduce a range of investors to the social enterprise sector. Operating on the principles of innovation, partnership and social change, this initiative is designed to catalyse a social impact investment market that will continue to provide opportunities for social investors to achieve significant social value and create sustainable social impact.
An announcement on the successful candidate/s is expected in July 2011.
Community Development Finance Institutions (CDFI) Pilot
The community finance sector in the US and UK has played a key role in providing appropriate access to financial services and products to those who would otherwise be excluded from mainstream financial institutions. Through an emphasis on social as well as financial outcomes Community Development Financial Institutions (CDFIs) assist disadvantaged individuals to be financially included. In doing so, they contribute to economic and social development through access to consumer credit and the creation of new businesses, employment and community improvement.
CDFIs also have a business model that maximises financial sustainability and independence from government funding. They do this by leveraging philanthropic and private investment to cover costs and even generate a return on capital investment.
In order to test and gain further evidence on the demand for financial services and products and the contribution of CDFIs in meeting this demand the Australian Government, through the Department of Families, Housing, Community Services and Indigenous Affairs (FaHCSIA), has initiated the CDFI Pilot. Funds of $6 million has been provided to five community finance organisations for a range of infrastructure and business development costs. These organisations provide micro-finance and micro-enterprise loans as
282 http://www.deewr.gov.au/employment/pages/jobsfund.aspx283 http://www.deewr.gov.au/Employment/JSA/Pages/InnovationFund.aspx284 www.deewr.gov.au/goldengurus285 http://www.deewr.gov.au/employment/programs/socialinnovation/pages/ppp.aspx

Australian Innovation System
Report 2
011
116
well as financial literacy training to marginalised Australians who are not able to access mainstream financial services, including Indigenous Australians and low income individuals. The project will also contribute to an investigation of the infrastructure and legislative framework necessary to support CDFIs in Australia.
A formal evaluation is being run in conjunction with the CDFI pilot; indicative results are expected in the middle of 2012.
Reform of the Not-for-Profit sector
As a sign of its commitment to supporting innovation in the not-for-profit sector, the Australian Government has established the Office for the Not-For-Profit Sector within the Department of the Prime Minister and Cabinet. The Office will drive and coordinate a whole-of-government approach to volunteering, social investment and philanthropy, including regulatory and taxation reform to support this agenda.
Northern Territory Aboriginal Interpreter Service
The Aboriginal Interpreter Service (AIS), with offices in Darwin, Alice Springs, Katherine, Tennant Creek, Nhulunbuy, Maningrida, Yuendumu and Wadeye, works to overcome language barriers faced by Indigenous Territorians through providing oral interpreter services to government and non-government agencies.
Established in April 2000, AIS boasts a register of 395 active Aboriginal interpreters, covering 104 languages/dialects. The service is committed to bridging the language gap. The Australian Government’s Intervention into Aboriginal communities in the Northern Territory created an urgent demand for interpreters to communicate at short notice both high-level policy and ground level actions. Positioning interpreters as agents of change is a new trend for the Aboriginal Interpreter Service that had previously only provided interpreters for assignments in the justice and health systems.
The AIS had to quickly change the way it did business. The AIS have been working with private business and government agencies to produce cutting-edge communication tools designed to deliver key messages, in language, at the press of a button. The tools include talking posters, talking books and talking storyboards – all of which enable Indigenous Territorians to access information in their own time and, most importantly, in their own language.
However, it is not just about a new device to deliver a message. The AIS needs to unpack the information in order to communicate the concepts and messages effectively. It is not a matter of direct translation. The information that the AIS is requested to translate is very complex and requires workshopping and up-skilling of the interpreters to ensure accurate meaning is conveyed. They need to understand before they can provide an accurate interpretation.
The innovative concept of talking posters and talking storyboards was developed and patented in the Northern Territory. These are the first Indigenous communication tools of their kind in Australia. These progressive communication tools can already be found in 52 communities across the Territory.
James Gaykamangu from the Aboriginal Interpreter Service (l) and Anya Lorimer, Bill Ulstrup from OneTalk with Josie Guy from the Aboriginal Interpreter Service (r) hold up talking posters. Images provided by OneTalk.

Chapter 5: P
ublic Sector and Social Innovation
117
SA Government Integrated Design Commission
The Integrated Design Commission of South Australia (IDCSA)286 is fostering methods to achieve the best possible designed environments for communities across the state. To achieve this goal, the IDCSA is developing best-practice research, design models and tools to promote sustainable models of living that will reduce greenhouse emissions and improve the environmental performance of buildings and infrastructure.
The South Australian Government has established the IDCSA to provide input into the design-related policies and practices that will secure the state’s sustainable future, and build eco-literacy. Initiatives to enhance awareness and skills within building professions and trades are among the activities that will ensure energy efficiency, recycling and other ecological considerations are included in the planning, design and construction of South Australia’s living and working environments.
Social Innovation Case studies
The following case studies demonstrate the many different ways in which Australian public, private and community organisations match workable ideas with social needs. Additonal case studies on social innovation can be found in the case study companion to this report.
Media Access Australia (MAA) – Classroom Access Project (CAP)
The Classroom Access Project (CAP) improves access to educational support materials delivered via electronic media for hearing impaired students in mainstream educational settings by developing a ‘model classroom’. The ‘model classroom’ comprises a Soundfield amplification system to augment sound quality for the whole class, with lesson content driven by a laptop and delivered with captions via an interactive whiteboard to ensure access to electronic resources. As 83% of hearing impaired students attend mainstream classes in Australia, there is clear need for innovation across the education sectors to meet goals of social and educational inclusion for these students, and to improve educational service delivery more broadly. CAP unites the community and education sectors through innovative use of technology to improve hearing impaired access in the classroom.
Throughout 2010, MAA partnered with the Catholic Education Office, Sydney, and the Catholic Education Diocese of Parramatta to deliver two demonstration programs at La Salle Catholic College, Bankstown, and Cerdon College, Merrylands. Together, the demonstrations involved eight hearing impaired students, two MAA staff, 16 teachers, the schools’ Principals and Assistant Principals, and the sectors’ sensory impairment program teams. CAPs 1 and 2 demonstrated that access can be provided affordably and practically in mainstream classes. With each new demonstration, MAA builds on previous learning, to improve planning and implementation and refine use of technology, whilst focusing on developing the school’s ownership of the project. MAA is currently developing an up-scaled model for approximately 30 primary and secondary schools, to be implemented in NSW in 2012.
286 http://www.premcab.sa.gov.au/dpc/department_idc.html
The Classroom Access Project in action. Image provided by Media Access Australia.

Australian Innovation System
Report 2
011
118
ABC Innovation
The media sector in which the Australian Broadcasting Corporation (ABC) operates is rapidly changing. Traditional radio and television broadcasting is still in wide use, yet Australians increasingly access media via internet and mobile technologies. As a result, public expectations of the ABC have changed, and the ABC has been vigorously innovative in order to meet those expectations.
In 2007, all output areas of the ABC were made responsible for integrating online activities with traditional broadcasting, reflecting contemporary consumption patterns in digital media. At the same time, a dedicated Innovation Division was created to develop new directions in ABC content, audience connection and new platform distribution.
This structural change has allowed the ABC to become one of the most flexible and innovative media organisations in Australia. It was an early adopter of social media platforms and the first broadcaster to introduce an online “catch-up television” service, iView. This digital innovation model has also given the ABC freedom to experiment with new modes of online storytelling and interaction with its audiences.
In April 2010, it launched Bluebird AR, which combined the conventions of the established alternate reality game genre with the relatively new area of online drama to create a hybrid ‘participatory drama.’ Using a mixture of third-party social media spaces and websites created by the ABC, the story incorporated online articles, scientific journals and media to explore – through a fictional narrative – issues surrounding the experimental science of geo-engineering. Audiences could actively participate and collectively play over a six-week period, helping to solve puzzles and drive an emerging narrative, or simply watch the story unfold in real-time across the internet. The experience gained from the Bluebird AR experiment will be particularly valuable as the ABC continues to explore new forms of interactive and participatory storytelling.
Social Traders – The Crunch
Piloted in Victoria in 2009, the Crunch is a Social Traders initiative that provides capacity building and investment for early-stage social enterprises. Social Traders is a social enterprise development company started with Victorian Government and philanthropic funding.
The Crunch is run as an intensive, high engagement five month challenge in which each emerging social enterprise works through a rigorous business planning process that has been developed by Social Traders just for social enterprises. At the end of the five months, each enterprise submits a business plan and pitches for start-up investment from the Social Traders’ Social Enterprise Development Fund.
In the 2010 pilot, the Crunch process started with information sessions and workshops around Victoria attended by around 140 individuals, groups, and organisations interested in social enterprise. Following the workshops, Social Traders received and considered 80 applications with ideas for a social enterprise, from which nine were selected to participate in the Crunch.
Each of the nine Crunch enterprises were teamed with business mentors from Crunch corporate partners – Australia Post, Transfield Services, Telstra, Westpac and Leadership Victoria. Crunch teams also included a Melbourne Business School MBA student helping with business planning and market research as a ‘for credit’ subject towards their degree. Crunch teams were then taken through a series of six workshops to develop their idea into an investment-ready business plan. All teams had access to an initial $10,000 contribution from Social Traders to help them to resource their business planning.
Crunch launch event Melbourne October 2010. Survival packs issued and countdown begins. Image provided by Social Traders.

Chapter 5: P
ublic Sector and Social Innovation
119
Crunch pitching session Melbourne February 2011. Image provided by Social Traders.
Community Contact Service in operation. Image provided by the Brotherhood of St Laurence.
A hazard for governments and philanthropists interested in supporting social enterprise is that they frequently lack the skills, resources and expertise to assess which ideas will have the capacity to really work and become financially viable. Research also tells us that investment in early stage social enterprises without capacity building seldom results in optimal outcomes. Through the Crunch process, social enterprise ideas can be rigorously tested and challenged, maximising the likelihood of viability and therefore positive social impact.
Among entrants to the Crunch in 2010 are a community resource centre in a Victorian bushfire regeneration area for a wooden pallet recycling business, a disability enterprise proposal to expand its packaging operations into quality food packaging in significantly greater volume, and an enterprise promoting inter-faith and cross-cultural respect and understanding through short-films. Another social enterprise proposed, was to promote urban and regional renewal by making otherwise empty buildings available for short and medium term use by artists, creative projects and community groups.
With signs of an ever-increasing interest in social investment, the Crunch is another way to build investor confidence and make the most of multi-sectoral resources and expertise. The investment outcomes of the Crunch 2010–11 will be announced in late April 2011.
Brotherhood of St Laurence – Community Contact Service
The Community Contact Service (CCS) is a Brotherhood of St Laurence (BSL) social enterprise providing concierge, information and referral support to residents living in 12 high rise public housing towers in the inner Melbourne suburbs of Fitzroy, Collingwood and Richmond. The service is staffed by around 20 disadvantaged unemployed people recruited from residents on those estates, who are employed as trainees for 12 months while they earn a Certificate III in Community Services. When they finish, the BSL works with them to find another job, using that qualification and the practical work experience they have acquired.
The CCS is a successful example of social procurement using purchasing power to achieve social outcomes. In this joint venture between the BSL and the Office of Housing, the key goals of each partner were mutually served. The Office of Housing needed to meet residents’ needs for community safety, the greatest issue of concern raised when they were consulted as part of the Office of Housing’s Neighbourhood Renewal project in the early 2000s. Initially, the Office responded by contracting a private company to provide higher levels of security visibly present on site. But the Office wanted to develop a more comprehensive and preventative service, modelled on concierge roles that can be found in private high-rise apartment accommodation.

Australian Innovation System
Report 2
011
120
On its part, the Brotherhood of St Laurence has always looked for ways to improve the employment prospects of unemployed and disadvantaged people, the typical profile of public housing tenants. One of the common problems with standard employment services is that they emphasise job searching in a competitive labour market, but without recent work experience and work references it is very hard to compete. The BSL has explored a variety of social enterprises as a way to create pathways towards long term employment. These typically include: pre-employment training to explain the skills needs and activities of the job and to determine readiness for recruitment; a 12-month fixed term job, an accredited traineeship; access to a support worker; and, at the end of the 12 months, advice and help to find work in the open labour market.
The Office of Housing is pursuing more ways to improve employment participation among public housing residents through increased social procurement purchasing.
The Australian Centre for Social Innovation: Family by Family
Family by Family finds and resources successful families to help other families seeking change. The idea comes from The Australian Centre for Social Innovation’s Family Project, which is working to co-create new ways to enable more South Australian families to thrive and fewer to spiral towards state intervention.
The Australian Centre for Social Innovation, with the support of the South Australian Department for Families and Communities and the City of Marion, has used a bottom-up policy methodology to reset outcomes, co-design solutions, prototype interactions and experiences, and develop the case for scale. Over 100 families took part in the first stage of the project, Look, which used ethnographic and visualisation techniques to understand what family life looked and felt like and to identify the behaviours that enabled families to thrive.
The core concept behind Family by Family is that for families to adopt thriving behaviours they need to see and experience them first-hand. Behaviour change comes from exposure to whole family experiences over time. The Family Project is currently prototyping the concept with 20 families and iterating the roles, materials, trainings, supports, messages, and metrics to learn what just might work. It is hoped that the Family by Family initiative will grow city by city, and that next year the initiative can start to embed the philosophy and approach within state services.
Edith Cowan University – SImPLE
In 2010, staff members in the School of Computer and Information Science at Edith Cowan University released a piece of software for law enforcement agencies. Simple Image Preview: Live Environment (SImPLE) is a tool which enables police officers to quickly and easily find, view and export media files stored on a suspect computer, while preserving the forensic integrity of the hard-drive.
Criminal cases involving the trading and tracking of illicit or illegal images are estimated to account for 60-80% of all computer crimes, and case backlogs can be as much as two or three years. In regional areas, officers with specialised computer training may not be available to attend the scene during a search and seizure operation, resulting in long delays and significant expense while the computer is delivered to a metropolitan computer lab. SImPLE was developed in collaboration with the Western Australian Police Service to address these issues. Officers can now locate a suspect’s computer, run SImPLE, and with a few clicks of a mouse, have all the images and video stored on that machine displayed in real time, without compromising the rules of evidence. Having the incriminating evidence available enables law enforcement officials to interrogate suspects more effectively, and increases the likelihood of confessions and convictions.
TACSI Family Project - A family explore what they’ve got out of being part of the project. Image provided by the Australian Centre for Social Innovation

Chapter 5: P
ublic Sector and Social Innovation
121
SImPLE, developed by Glen Thompson, Peter Hannay, Craig Valli, and Andrew Woodward, increases the speed with which predators can be removed from the community, protecting Australian children. In the first few months of trial, SImPLE has resulted in charges being laid and convictions secured.
Hepburn wind
Australia’s first community wind farm is being built on farmland at Leonards Hill, near Daylesford, north-west of Melbourne. There is usually a lot of community resistance to building wind farms around the world. But by making the asset collectively beneficial they have overcome this market constraint. Despite many challenges, overwhelming support from the community has made it happen – inspiring similar projects to explore the co-operative model for community-owned renewable energy projects. The Hepburn Community Wind Park Co-operative (Hepburn Wind) project will comprise two turbines with a combined capacity of 4.1 MW, expected to produce enough electricity to power 2,300 homes when completed in mid-2011.
The wind farm is owned by the local community through Hepburn Wind. This method of mobilising financial resources to create a multi-stakeholder community owned asset is a good example of social innovation.287 The co-op will manage the wind park, provide financial returns to its members and fund community projects through a community sustainability fund. For the next 25 years, it has committed a $1 million donation to local community projects and activities. Over 1,400 cooperative members have contributed over $8.7 million to construction of the wind park. The Victorian State Government has provided grants totalling $1.73 million and the Bendigo Bank a $3.1 million loan. Raising that sum has been a significant achievement, particularly for a project that has never been attempted before in Australia.
Right from the start, the team knew that community support was vital to the success of the project. A community forum was held to explain the idea and gauge support. The response was overwhelming – a survey taken at the end of the forum showed that 95% of those present were in favour of the idea. A presentation to Hepburn Council also met with an encouraging reaction, and shortly afterwards the Hepburn Renewable Energy Association formed to garner the community support necessary to get planning permission.
Raising capital, maintaining momentum over a 6 year journey, estimating costs and getting council backing are some of the challenges this group has managed. With clear regional economic and ecological benefits, Hepburn Wind is a model for others. Now it helps other communities develop similar projects through Embark, a non-profit organisation promoting the uptake of community renewable energy projects.
Hepburn Wind illustrates the convergence of social with environmental and financial benefits which are realised in this model of community ownership.
287 OECD (2010) Social Entrepreneurship and Innovation, In, SMEs, Entrepreneurship and Innovation, OECD, Paris.
Local members watch final stages of construction, March 2011. Image provided by Tibor Hegedis.

Australian Innovation System
Report 2
011
122
CHAPTER 6Emerging opportunities and challenges
Introduction
By 2020, the Australian Government wants a national economy in which businesses of all sizes and in all sectors embrace innovation as the pathway to greater competitiveness, supported by policies that minimise barriers and maximise opportunities for commercialisation of new ideas.288 This chapter looks at cases of emerging challenges and opportunities to the national innovation system that influence our ability to meet this goal.
This chapter discusses the opportunities of transitioning our economy to a cleaner and more resource efficient one. This chapter also investigates the emergence of platform technologies, specifically biotechnology, nanotechnology and smart infrastructure, that have a range of characteristics that will help generate longer term productivity increases and economic growth289 to help manage the impact of an ageing population, climate change and other pressures. These technologies have the ability to underpin an increasing number of breakthrough innovations in products, services, and processes and to offer solutions to address major global and national challenges, such as medical treatments, energy generation and environmental remediation. This chapter also looks at the necessity of increased global engagement on innovation, particularly with China and India as emerging major trading and knowledge partners in our region.
Green growth: A new driver of innovation
Sustainability challenges are driving fundamental economic changes
Australia faces a number of critical sustainability challenges. As the driest inhabited continent with a climate characterised by weather extremes, we are exposed to ’greater risks of climate change than any other developed country’.290 Australia is one of the most emissions and water intensive economies in the world; we also face a number of other threats including food security, biodiversity and land quality.
Green growth has the potential to secure Australia’s future prosperity by managing these “wicked problems”. It relies on promoting and taking advantage of a number of current trends which, in combination, constitute a significant economic opportunity:
Consumer demand is changing. Consumers are modifying their behaviour to reduce their environmental footprint, for example by increasing energy and water efficiency, recycling, and avoiding brands with poor green reputations. This pattern has continued despite the global financial crisis and subsequent economic downturn.291 In many cases, consumers are willing to pay a price premium for green products, thus opening up green opportunities for business. 292
Financial markets are increasingly promoting positive green outcomes. Financial markets are supporting green outcomes both directly and indirectly. Socially responsible investment (SRI) funds selectively invest in companies and projects with good social and environmental outcomes while still maximising financial returns. In 2010, SRI funds managed an estimated US$3.07 trillion in assets in the United States, representing approximately 12% of the total marketplace investment.293 Individual investment choices can also contribute to this effect. Australia has the highest rate of private share ownership in the world, with ownership highest and growing fastest among groups more likely to be concerned about green issues: those with higher income and education levels, and young people.294
288 Australian Government (2009) Powering Ideas: An Innovations Agenda for the 21st Century, Canberra 289 Roco M, Mirkin CA & Hersan MC (2010). WTEC Panel Report on Nanotechnology Research Directions for Societal Needs in 2020. Springer: New York USA.290 Garnaut Climate Change Review Update 2011 – Update paper 4 – Transforming Rural land use – page 10.291 Boston Consulting Group (2009) Capturing the Advantage for Consumer Companies, 2009, p7292 Mintel Oxygen Report (2010) Are Americans Willing to Pay More to Pay More Green to Get More Green, http://www.mintel.com/press-centre/press-
releases/514/are-americans-willing-to-pay-more-green-to-get-more-green293 Social Investment Forum (2010) Report on Socially Responsible Investing Trends http://www.socialinvest.org/resources/sriguide/srifacts.cfm294 Deni Green Consulting Services with Standards Australia and Ethical investment Services for Environment Australia (2001) A Capital Idea – Realising value
from environmental and social performance.

Chapter 6
: Emerging opportunities
and challenges
123
Environmental risk factors are also increasingly being recognised in financial decisions by the broader financial community295, indirectly making it more difficult for companies to obtain finance for environmentally risky projects.
Governments are promoting change. Governments are playing a crucial role by addressing key market failures, educating consumers and providing incentives for the development of green products and services. For example, Australia’s Renewable Energy Target will ensure that at least 20% of Australia’s electricity will be generated by renewable energy sources by 2020.
Governments also have an important indirect role in the development of markets and influencing consumer behaviour through the use of regulations, standards and consumer awareness programs. As one example, internationally developed emission standards for vehicles are having a significant effect on Australian exporters wishing to exploit low-emissions technology markets.
Businesses are investing in innovation to reduce operating costs. Many businesses are choosing to invest in more efficient production technology to stay competitive. While this can be capital intensive, it reduces operating costs in the long term, particularly as markets begin pricing environmental externalities. In the short term, businesses are also achieving cost savings throughout value chains by investing in innovative new or improved processes. For example, by repackaging or flat-packing stock, companies are able to get more of the product on the ship, truck and shelf, reducing logistics, fuel, pollution and out-of-stock costs. The impacts are increased when major companies require their suppliers to meet certain green standards.
The role of innovation
The combined result is a massively increased demand for green technologies, products, services and skills, driving rapid expansion in green markets. This trend is expected to continue with global green markets projected to double from $US1.4 trillion per year to $US2.7 trillion by 2020.296 As noted in the introductory chapter, international organisations such as the Organisation for Economic Co-operation and Development (OECD) are already recognising this green growth potential.
Critically, innovation is at the heart of taking advantage of these opportunities. Innovation delivers new ideas, new ways of doing business, new markets and new jobs. These are the tools of transformational change. As resource use continues to grow there will be a point at which outcomes that are simultaneously economically, environmentally and socially beneficial will be limited by the continued depletion of natural capital. Innovation, both through the development of radical new solutions and the spread of incremental improvements throughout the economy, will be the key to doing more with less, enabling continued growth beyond present limits.
Innovation for green growth will thus involve two quite different processes. The first focuses on research and development to invent new technologies and solutions that can support a green growth transformation.297 New energy delivery techniques, alternate transport solutions, novel agricultural processes and improved communication tools are just a few examples. Such radical innovation requires the continuous strengthening of Australia’s public sector research capabilities. As outlined in Chapter 4, there is a need to enhance collaboration between public and private organisations to strengthen research and development, support commercialisation of new technologies and catalyse the emergence of new industries.298 Other key issues to be addressed include assisting innovative businesses gain access to finance, addressing inadequate business management experience and maintaining effective legal frameworks to support the commercialisation process.
The second process recognises that innovation for green growth is not just about new technology or inventions. It is also about greening the existing economy by increasing resource efficiency and implementing new production processes, business models, and communication strategies.299 Unfortunately, many businesses simply do not have the time or resources to adequately respond to green growth challenges and opportunities. Green growth potential often remains unrecognised or unexplored, due to a lack of information, inadequate skills, or perception that it is peripheral to the bottom line. In other cases, cleaning up business operations may require significant investment or retooling. Government programs to overcome these failures and ease restrictions on business access to finance will be a big contribution to business embracing green growth.
295 See for example, Mercer (2011) Climate Change Scenarios – implications for strategic asset allocation, International Finance Corporation.296 Australian Council of Trade Unions and the Australian Conservation Foundation (2008) Green Gold Rush: How ambitious environmental policy can make
Australia a leader in the global race for green jobs, http://www.actu.org.au/Images/Dynamic/attachments/6211/Green_Gold%20_Rush_final.pdf.297 See Priorities 1-3, Powering Ideas: An Innovation Agenda for the 21st Century.298 See Priorities 5-6, Powering Ideas: An Innovation Agenda for the 21st Century.299 See Priority 4, Powering Ideas: An Innovation Agenda for the 21st Century.

Australian Innovation System
Report 2
011
124
While these challenges are not new, and largely no different to those facing the broader innovation system, failing to address them brings particularly significant risks in the context of green growth. Not only would Australia suffer from continued environmental degradation, it could also substantially miss out on big opportunities in a highly competitive global economy.
Australia enjoys a variety of excellent natural resources, a strong economy, proximity to booming economies in Asia, highly skilled workforce, world-class research capability, a rich ecology and deep cultural heritage. Recognising these advantages, as well as key challenges, allows Australia to optimise its pursuit of green growth. For example, specific opportunities exist to:
› Leverage our extensive renewable resources to become a testing ground for new technology;
› Develop the bio-economy;
› Enhance the impact of green service opportunities (especially through improvements in information and communication technology (ICT);
› Promote a green transformation in the manufacturing industry; and
› Achieve building efficiency improvements.
This means many Australian companies must reconsider some of their current approaches and practices and pursue green growth strategies to take advantage of the opportunities that the green global marketplace offers.
Platform technologies in the Australian Innovation System
Nanotechnology
Nanotechnology enables the purposeful engineering of matter at near atomic or molecular scales. This offers the possibility of new industrial applications in a very broad range of sectors including energy production and storage, filtration of contaminated water for drinking, hygienic food packaging, drug delivery and, in the future, new ways to regenerate damaged parts of the human body, including blood vessels, brain, nerves, bone and cartilage. Nanotechnology is expected to lead to many additional and qualitatively new applications in response to societal needs. Market analysis predicts very large markets for nanotechnology-enabled products, and forecasts suggest that many new jobs may be created. Nanotechnology is therefore receiving a lot of attention in many countries through government policies and considerable investments in research and development (R&D) and related nanoscience infrastructure. It has been estimated that in 2009 global government investments in this field totalled about $7.8 billion.300
Nanotechnology is a thriving field of research, development and commercialisation in Australia with a strong reputation for scientific and technological creativity in areas such as nano-materials, nano-biotechnology, electronics and photonics, energy and environment and quantum technology. Australia has more than 75 nanotechnology research organisations and around 80 nanotechnology companies ensuring a rich flow of commercial products301. These products range from delivering energy solutions, such as the Australian firm Dyesol’s dye solar cell (Chapter 3), to delivering medical solutions, such as Starpharma’s VivaGel® to prevent the transmission of sexually transmitted infections and Sonoeye™ from Seagull Technologies which uses a combination of nanotechnology and ultrasound to replace injections with non-invasively deliver drugs.302
The bulk of nanotechnology research is undertaken at universities and research institutions including Cooperative Research Centres, Centres of Excellence, the Australian Nuclear Science and Technology Organisation and the Commonwealth Scientific and Industrial Research Organisation (CSIRO). Infrastructure investments such as the Australian Synchrotron and the Australian National Fabrication Facility also provide new product development platforms and world class facilities. Collaboration is therefore a defining feature of the Australian nanotechnology sector, with the country’s research institutes and private companies having formed strong alliances to bring products with commercial and social benefits quickly to market. Australia is renowned for its strong R&D credentials; innovative and highly skilled scientists, and enterprising workforce.303 Collaboration with universities and ‘star scientists’ is important, especially for small companies.
300 ibid. 301 Department of Innovation, Industry, Science and Research (2011) Nanotechnology: Australian Capability Report Fourth Edition, Australian Government302 http://www.innovation.gov.au/Industry/Nanotechnology/NationalEnablingTechnologiesStrategy/Pages/NETSPublications.aspx303 Department of Innovation, Industry, Science and Research (2011) Nanotechnology: Australian Capability Report Fourth Edition, Australian Government

Chapter 6
: Emerging opportunities
and challenges
125
Larger companies in relatively mature nanotechnology areas appear to focus more on applications that are driven by market demand. They also tend to collaborate with a broader range of organisations to leverage their in-house R&D.
Nanotechnology is a complex field owing to its dependency on various scientific disciplines, research/engineering approaches and advanced instrumentation. These features of nanotechnology can often create barriers to entry, particularly for smaller companies which have limited research, management and other resources. As most of Australian nanotechnology firms are small and medium enterprises (SMEs), it is important to understand the resource limitations faced by SMEs in this complex field, and identify market positions where SMEs are more resilient and competitive.
Like other firms in the Australian innovation system, nanotechnology firms face challenges associated with the recruitment and retention of human resources, especially people with highly technical and managerial skills to support R&D and production activities. Nanotechnology firms also need employees who can combine specialist and general knowledge (knowledge integration) and manage interdisciplinary teams.304
There are also considerable challenges associated with the poor scalability process of R&D. This means that costs and prolonged lead times for new product development represent a major barrier for start-ups and SMEs, making nanotechnology less attractive to investors.305
Nanotechnology may produce new materials with harmful effects on humans and the environment. Just as the many potential benefits of using man-made nanomaterials are being discovered, many of the potential risks are not fully understood. In order to manage any possible risks, businesses, regulators and community members must undertake risk identification, management and mitigation processes.
Figure 6.1: Regulation of nanomaterials
Source: Image provided by the Department of Innovation, Industry, Science and Research
Equally important, intellectual property rights may become an issue as commercialisation progresses and nanotechnology matures. There is already a very wide range of patent claims that could act as a barrier for new entrants to the industry.306
As much of the research activity is happening in universities, cultural differences between universities and firms may inhibit technology transfer processes and stall the achievement of significant outcomes. Strong collaboration and linkages between organisations and people involved in nanotechnology research and production are crucial to overcome these cultural differences and optimise the evolution of the industry to bring nano products from university or government research to the market.
304 OECD (2010) The impacts of nanotechnology on companies, OECD, Paris.305 Ibid306 Ibid
Identifyhazards (s)
Develop regulations/
Establish risk control plans
Risk assessmentlevel of exposure,hazards
Monitor and review

Australian Innovation System
Report 2
011
126
The Australian Government is committed to addressing the challenges associated with developing nanotechnology in the areas of health, safety, measurement capability, environment and regulatory impacts. It also recognises the need to engage with the community to both increase public understanding of the technology and to increase the understanding of technology developers and government about the public’s concerns and aspirations. The Government has initiatives in place that aim to promote the responsible uptake of nanotechnology, in particular through the National Enabling Technologies Strategy307 and Commercialisation Australia.308 Australia is not alone in addressing these issues. The international nature of the challenges provides an opportunity to create new networks and work collaboratively. Through forums such as the OECD and the International Organization for Standardization (ISO), Australia is actively engaging to develop internationally consistent protocols and terminology. Australia’s participation in the OECD Working Party on Manufactured Nanomaterials has enabled Australian researchers to participate in developing international solutions.
A strong illustration of the opportunities and the challenges presented by nanotechnology is presented by carbon nanotubes. When carbon is burnt in helium gas, carbon nanotubes form part of the soot. The tubes are only a few nanometres in diameter, but can be a few millimetres long. They have extraordinary strength and can conduct electricity and heat. The CSIRO is spinning carbon nanotubes into yarn opening up many new possibilities for their uses. It is early days in the research, but possible applications for carbon nanotube yarn might include bullet-proof materials and energy storage.309 But research has shown that some forms of carbon nanotubes may present risks if inhaled. The CSIRO and other Australian government organisations are undertaking research to better understand the risks presented by carbon nanotubes and to support their safe handling in the workplace.
The Australian Biotechnology Sector
Biotechnology refers to the use of living organisms, or their products, to modify human health and the human environment and generate industrially useful products and processes.
Australia is home to around 470 biotechnology companies310, ranging from start-ups to more developed companies who are selling products in Australia and overseas. The vast majority of Australian biotechnology companies fall within the human therapeutics and diagnostics markets; however biotechnology is also used by Australian companies in industrial processing, agriculture and environmental processes. The sector includes a large number of research-intensive SMEs. Many are spin-outs from universities, other publicly funded research agencies and not-for-profit research organisations.
Data from the Australian Stock Exchange311 shows that although the global financial crisis adversely affected the Australian biotechnology sector, it was able to recover and ended 2010 on a high. Many Australian biotechnology firms are reaching critical milestones such as entering or completing phase II312 and phase III313 trials , filing applications to the US Food and Drugs Administration, and taking products to other international markets.
Australia’s biotechnology strengths include a world-class science base and infrastructure to support R&D, a culture of collaboration, and a transparent and efficient regulatory system. Moreover, Australia is one of the least costly countries in the industrialised world to set up a business314. While Australia’s geographical remoteness from major markets, such as the USA, has historically made international partnerships challenging, our proximity to the strongly growing Asian region is an advantage.
There are a number of opportunity areas for biotechnology-related investments at both the research or commercialisation stage for biomedical (pharmaceuticals and regenerative medicine), agriculture (see earlier case studies in this report) and industrial biotechnology.
307 www.innovation.gov.au/nets308 www.commercialisationaustralia.gov.au/ 309 http://technyou.edu.au/wp-content/uploads/2010/09/0253_TECH-6p-A4-Brochure_3LowRes.pdf310 Thorburn L & Hopper K (2008) BioIndustry review of Australia: A review of the year just gone and predictions on the year ahead, Australasian Biotechnology
17(1): 14-17311 BBI can be accessed at www.innovation.gov.au/biotech_indicators.312 Phase II clinical trials include initial assessment of drug performance, dosing requirements and efficacy.313 Phase III clinical trials include definitive assessment of the drug efficiency, performance and safety.314 KPMG International (2008) Competitive Alternatives, www.CompetitiveAlternatives.com; and http://www.austrade.gov.au/Invest/Why-Australia/Cost-
Competitive-Location/Cost-Competitive-Location/default.aspx

Chapter 6
: Emerging opportunities
and challenges
127
Some examples include:
Regenerative medicine: The Australian Regenerative Medicine Institute, when at full capacity, will be one of the world’s largest regenerative medicine and stem cell research centres. Its research is looking to prevent or reverse conditions such as neurodegenerative disorders, diabetes and arthritis.315
Biodiscovery: Australia’s exceptional biodiversity offers great opportunities for biodiscovery. Australian researchers can access large numbers of unique compounds and organisms which may be used in drugs, insecticides, herbicides or industrial enzymes. One example is the work by the Australian Institute of Marine Sciences in exploring Australia’s marine biodiversity for attributes with potential commercial application.316 To ensure that the biological resources are used in ecologically sustainable and ethical manner, Australia is a signatory to the Convention of Biological Diversity, and has a nationally consistent approach for access to, and utilisation of, its biodiversity317.
Industrial biotechnology enables the development of both environmentally and economically sustainable manufacturing processes. Opportunities are likely to increase in areas such as biomaterials for medical products, biopolymers and a range of materials derived from alternative sources such as waste products and biomass. These technologies have significant potential to reduce industrial greenhouse gas emissions by replacing petrochemical feedstocks. For example, biomass can be used in the manufacturing of commodities such as fuels, chemicals and plastics. There is an increasing global market for biofuels, and other bio-based materials such as bioplastics. Australia’s large and technologically advanced local mining industry provides a sound platform for the development of bio-mining, the use of micro-organisms to extract metal from ores.318
Many of the challenges faced by the Australian biotechnology sector are shared with other high-tech sectors. Start-up biomedical companies often face difficulties in attracting investment due to the lengthy development time of their products before they become commercially viable, referred to as the commercialisation ‘valley of death.’ This is particularly the case in Australia as the amount of available venture capital for early-stage, high risk companies is relatively small (see Chapter 3). Any potential restrictions to securing intellectual property, such as patents, may affect biotech companies negatively, as patents are often their sole assets, and thus central to attracting pre-commercial investments. Attracting and retaining highly skilled senior managers in companies is an additional challenge.
Biotechnology may also pose new health, safety or environmental risks and raise ethical concerns. For example, the use of Genetically Modified Organisms or GMOs in food production has improved crop yields; however, it has also raised community concerns. Governments face challenges in developing robust regulatory frameworks for new biotechnologies to effectively manage risks and address community views concerns without imposing unnecessary restrictions on researchers and industries.319
Federal and state governments have established initiatives to address some of the challenges faced by the biotech sector. Federal initiatives to support R&D and commercialisation include Commercialisation Australia, the Innovation Investment Follow-on Fund and the R&D Tax Concession/Credit. Enterprise Connect offers advice and support to eligible SMEs, including access to specialised business advisors. Examples of state initiatives to support the biotech sector include the Victorian Biotechnology Strategic Development Plan320, Bio Innovation South Australia,321 the Queensland BioCapital Fund,322 and NSW Department of Primary Industries323.
The sector also benefits from investments in science and research capabilities: One-third of the current 42 Cooperative Research Centres are involved in some aspect of biotechnology. The National Collaborative Research Infrastructure Strategy and the Future Industries Initiative both contribute to expanding national biotechnology capabilities, while Super Science Fellowships provide funding for early career scientists.
315 For further information see http://www.armi.org.au 316 For further information see http://www.aims.gov.au317 For further information see http://www.environment.gov.au/biodiversity/publications/access/nca/pubs/nca.pdf. The Western Australian Government is
currently drafting bioprospecting legislation to standardise the State’s access to the sharing of biological resources in WA. 318 For further information see http://www.innovation.gov.au/Industry/Biotechnology/IndustrialBiotechnology/Pages/default.aspx319 Department of Innovation, Industry, Science and Research (2010) National Enabling Technology Strategy Australian Government, p3320 See http://www.vicbioportal.org/Biotechnology-in-Victoria/Victorian-Government-Policy-and-Programs/Biotechnology-Strategic-Development-Plan-
Policy-Framework.aspx 321 http://www.bioinnovationsa.com.au322 http://www.qbf.qic.com.au323 http://www.industry.nsw.gov.au

Australian Innovation System
Report 2
011
128
In 2007, the Government released an Industrial Biotechnology Strategy324 focussed on increasing awareness of the benefits that industrial biotechnology can offer Australian manufacturing industries. The strategy is currently being further developed to take into account increased international attention on the environmental advantages and feedstock security offered by the use of biomass and biorefinery processes.
Smart Infrastructure
Smart infrastructure is where communications technologies are combined with hard infrastructure to make more efficient use of resources. Smart infrastructure offers potential gains for the transport, energy, communications, water and construction sectors where physical infrastructure is a critical framework condition for innovation. Smart infrastructure encompasses networked infrastructure that uses sensors and communications technologies to improve the efficiency of infrastructure and the associated services being delivered without being embedded into the infrastructure itself.
Examples of smart infrastructure includes: smart meters for gas, water and electricity which communicate consumption to the utility provider for monitoring and billing325; smart electricity grids which improve grid reliability and better utilise energy; transport systems which optimise traffic flows; smart water networks which improve irrigation productivity in agriculture; smart buildings; and a variety of new information services based on data gathered by sensor networks.
Smart infrastructure has the potential to transform the way we live and work. For example, technology is opening up ways to use new and existing transport infrastructure more efficiently. This will result in better traffic flows, lower energy consumption, and greater reliability of the system while delivering improved productivity, sustainability and liveability from our transport networks and for our cities. Smart Infrastructure is also part of the digital economy – the global network of economic and social activities that are enabled by information and communications technologies, such as the internet, mobile and sensor networks. The benefits of smart infrastructure highlighted at the ThinkFuture Smart Infrastructure Conference 2010326, include:
› Improvement on the abatement of Australia’s greenhouse gas emissions, through both more efficient energy use and significant reductions in congestions on our roads;
› Reduction in road traffic delays, and improved reliability of rail services, which will have both environmental and social benefits;
› Greater efficiency of water use both by industry and household consumers;
› Improvement in consumer choice regarding when and how to use their energy and water;
› Further social benefits of greater utilisation of tele-presence allowing employees to work from home;
› Supporting other smart infrastructure such as e-health, and better education services; and
› Faster identification of faults in both energy and water supply, and therefore faster repair.
Emerging uses of smart infrastructure enabled by information and communication technologies can assist in the management of resources, infrastructure and energy use. Such uses may also result in economic and productivity benefits that flow on from the adoption of smart technologies and systems in different parts of the economy. A study by Access Economics estimates that adopting smart technologies in electricity, irrigation, health, transport and broadband could add more than 70,000 jobs to the economy by 2014 and increase gross domestic product (GDP) by 1.5% over the next decade.327 Information and Communication Technology (ICT) has the potential to increase innovation by speeding up the diffusion of innovation, enabling networking among organisations, reducing geographic limitations and increasing efficiency in communication. OECD analysis shows that the probability of innovation significantly increases with the intensity of ICT use.328 Consistent with these international findings, innovating Australian businesses are much more likely to use information technology compared to non-innovators (Chart 6.1).
324 For further information about the strategy and related documents see http://www.innovation.gov.au/Industry/Biotechnology/IndustrialBiotechnology/Pages/IndustrialBiotechnologyStrategy.aspx [Accessed 20 April 2011]
325 A smart meter identifies consumption in more detail than a conventional meter. Smart meters communicate consumption information via a network back to the local utility for monitoring and billing purposes. They may also allow continuous measurement, time-of-day pricing information, and two-way communication between the device and the energy provider.
326 See ThinkFuture, Smart Infrastructure Conference 2010, Summary paper, p2 & 4 http://www.aph.gov.au/house/committee/itrdlg/smartinfrastructure/thinkfuture/Summary_Paper.pdf
327 Access Economics (2009) The economic benefits of intelligent technologies, p. 37 http://www.accesseconomics.com.au/publicationsreports/getreport.php?report=201&id=257
328 OECD (2010) Measuring Innovation: A new perspective, OECD, Paris, p84

Chapter 6
: Emerging opportunities
and challenges
129
Chart 6.1: Australian business use of information technology by innovation status, 2008–09
Source: ABS (2010) Selected characteristics of Australian Business, 2008-09. cat. no. 8167.0
Governments around the world are increasingly adopting smart infrastructure policies to enhance competitiveness in the more sustainable economies of the future. The OECD is encouraging its members to develop expertise in smart infrastructure to assist in the short-run economic recovery from the global financial crises and lay the foundations for future growth. Smart electricity networks (smart grids) are seen to be of particular importance with the OECD describing smart grids as ’an innovation with the potential to revolutionise the transmission, distribution and conservation of energy’329. Just as the internet has spurred new innovations, applications and technologies, so will smart grids.
Additionally, the OECD states that sensor and sensor network applications show particular promise for tackling environmental challenges in energy, transport, industrial applications, precision agriculture and smart buildings. It has found that minimum standards of energy efficiency coupled with sensor technology can be a major factor in reducing electricity use and greenhouse gas emissions.330
The Digital Economy: Future Directions paper331 provides some examples of smart infrastructure initiatives in Australia. It is anticipated that the successful demonstration of smart infrastructure will result in significant flow-on innovation and technology uptake across Australia.
Examples of Smart Infrastructure projects are:
› Smart Grid, Smart City initiative in Newcastle, NSW;332
› CSIRO and the National ICT Australia (NICTA) Water Management initiative;333
› NICTA’s Traffic Management initiative334; and
› NICTA, SAP, and the Germany’s Fraunhofer Research Institute logistics initiative to launch the future logistics living lab in Sydney.335
329 Chapter 6 “Smart Sensor Networks for Green Growth” In, OECD (2010) OECD Information Technology Outlook 2010, OECD, Paris330 OECD (2010) OECD Information Technology Outlook 2010, OECD, Paris, p8331 Australian Government (2009) Australia’s Digital Economy: Future Directions, Department of Broadband, Communication and the Digital Economy,
Canberra,. www.dbcde.gov.au/digital_economy/final_report [Accessed 30 May 2011]332 http://www.ret.gov.au/energy/energy%20programs/smartgrid/pages/default.aspx [Accessed 20 April 2011]333 http://www.csiro.au/science/smart-sensors-monitoring-water-quality.html; http://research.ict.csiro.au/research/labs/autonomous-systems/sensor-
networks/csiros-smart-sensor-network-technology; and http://www.nicta.com.au/research/project_list/completed_projects/water_information_networks [Accessed 20 April 2011]
334 http://www.nicta.com.au/research/projects/smart_transport_and_roads/star_projects/starsense [Accessed 20 April 2011]335 For Further information see http://www.austrade.gov.au/Invest/Investor-Updates/110318-Companies-from-around-the-world-join-Australian-research-
lab [Accessed 20 April 2011]
97
62 63
41
86
28
35
18
0
20
40
60
80
100
Businesses withinternet access
Per
cent
age
of r
espo
nden
ts
Businesses witha web presence
Businesses whichplaced orders via
the internet or web
Businesses whichreceived orders viathe internet or web
Innovation-active businesses
Non Innovation-active businesses

Australian Innovation System
Report 2
011
130
Opportunities for the development and use of smart infrastructure in Australia will continue to emerge as new platforms for innovation including those provided by the National Broadband Network are progressed. The Australia’s Digital Economy: Future Directions paper outlined some of the key initiatives that are designed to pilot and promote smarter use of technology to manage our environment and infrastructure.336
The Realising Our Broadband Future Forum that was held in December 2009 provided the opportunity for government, industry and the community to collaborate in developing a pathway to fulfil the vision of a ubiquitous, high-speed broadband-enabled digital economy including the opportunities and challenges related to smart infrastructure.337 Key areas where smart infrastructure can be used include:
› Smarter traffic control systems;
› Water management systems;
› Energy efficiency; and
› Teleworking.338
For Australia to realise the many benefits and opportunities emerging technical, behavioural and funding challenges will need to be addressed and new services introduced. The key challenges for the sector were also highlighted by a Parliamentary inquiry in March 2010339 and ThinkFuture conference participants340 and included:
› Challenges posed by current regulatory environments across the sectors and the need for a national approach;
› A need for greater collaboration between industry players and across sectors;
› The need to prove the benefits of smart infrastructure and the requirement for greater investment in research and development and in skills for smart infrastructure;
› A need for a stronger focus on consumer engagement to promote the benefits of smart infrastructure; and
› Issues surrounding the collection, management and generation of data, including privacy concerns.
The Government’s National Broadband Network (NBN) initiative will allow all Australians, no matter where they live, to participate equally in the digital economy and the “sensor revolution”. Tasmania will lead Australia in access to this new digital economy. Construction for Stage 2 has commenced and will pass 11,500 homes, with switch-on anticipated in March 2012. Planning is underway for Stage 3 which covers Burnie, Devonport, Launceston and part of Hobart (90,000 premises in total) and construction is scheduled to commence following completion of Stage 2. This first-starter advantage and critical mass of connections offers Tasmania the opportunity to attract ICT investment and to develop, test and demonstrate new applications, services and business models to the rest of Australia and beyond.
The goal of the Digital Futures Strategy (DFS), announced by the Tasmanian Government in August 2010, is to leverage the NBN to create an innovative, sustainable and vibrant Tasmanian digital economy. The strategy aims to prepare business and the community for the digital economy, and to assist the ICT industry, both local ICT research organisations and ICT businesses, to exploit opportunities for the development of NBN-capable applications, services and technologies. To achieve successful outcomes a coordinated approach is being undertaken between state projects, the recently announced Australian Government’s Digital Enterprise and Digital Hub programs and eLearning and eHealth agendas, Tasmanian ICT research organisations, Tasmanian peak industry bodies and NBN Co.
Global Engagement and the Australian Innovation System – collaboration or competition
Australia’s share in the production of the world’s knowledge (as measured by scientific publication output) is relatively high given our population size341 (Chapter 2). But at only 3.2% it is clear the majority of ideas and opportunities will arise internationally. Therefore, it is important that Australia keep pace with the rest of world in order to maintain its economic prosperity by enhancing its participation in global knowledge networks342. As global supply chains shift to where large markets emerge, multinational enterprises place a
336 See Australia’s Digital Economy: Future Directions; final report, pp29-31 available at http://www.dbcde.gov.au/digital_economy/future_directions_of_the_digital_economy/australias_digital_economy_future_directions [Accessed 20 April 2011]
337 For further information see http://www.broadbandfuture.gov.au/streams.html#smart-infrastructure [Accessed 20 April 2011]338 Access Economics, Impacts of teleworking under the NBN. July 2010. http://www.dbcde.gov.au/__data/assets/pdf_file/0018/130158/
ImpactsofteleworkingundertheNBN.pdf [Accessed 20 April 2011]339 See http://www.aph.gov.au/house/committee/itrdlg/smartinfrastructure/thinkfuture.htm [Accessed 13 April 2011]340 ThinkFuture Smart Infrastructure Conference 2010, Summary paper pp4-6. See http://www.aph.gov.au/house/committee/itrdlg/smartinfrastructure/
thinkfuture.htm [Accessed 13 April 2011]341 Science Watch – Annual Ranking of the Top 20 countries according to the research output and citation performers 2000-Aug 31 2010. 342 Cutler T (2008) Venturous Australia: Building Strength in innovation, Report of the Review of the National Innovation System, Australian Government

Chapter 6
: Emerging opportunities
and challenges
131
premium on broad innovation capabilities at the firm level in these regions. This section explores what are the opportunities and challenges of engagement with large, emerging markets such as China and India from both a national and business perspective.
The emergence of China and India brings with it many challenges and opportunities for the Australian innovation system. China and India have become significant trading partners for Australia343. They have strong and extensive markets, strong purchasing power and are developing world class research capabilities. As a medium-sized, developed economy, Australia will face huge challenges to compete in terms of scale. Market size, improving R&D and design/engineering capacity and cheap talent are key factors driving investment decisions in innovative activities.
Large investment in business, infrastructure and innovation are taking place in the Asia-Pacific region and China is leading this growth globally. Using R&D expenditure as a proxy for innovation investments, Chart 6.2 shows the massive 21% per annum growth rate of China’s gross expenditure on research and development (GERD), a rate which more than doubles its own average annual GDP growth344, and more than triples the OECD’s annual GERD growth.
Chart 6.2: Annual growth rate of gross expenditure in research and development by country, 2000–2008345
Source: OECD (2010) OECD Fact book, OECD, Paris
Research and development spending in Asia surpassed European Union levels in 2005 and will probably overtake US levels in the next five years, largely due to China’s increased investment in research and development.346 In the last decade, China has become one of the world’s leading producers of high quality science. China is vigorously developing world-class research capabilities with rapidly increasing budgetary support. China now invests the third highest amount on research and development in the world (Chart 6.3). Chinese Government policies emphasise a long term commitment to science and research excellence.347
Experienced researchers are becoming harder to find in the U.S. and Europe as Asian emigrant scientists return to more attractive opportunities at home348. At the same time, industrial R&D organisations are increasingly establishing R&D facilities throughout Asia to take advantage of lower labour costs and larger pools of skilled scientists and engineers. Large proportions of multinationals corporations are choosing China and India as preferable locations for innovation investments349.
343 China and India are both ranked in the top 10 two way trading partners with China our top partner. Source http://www.dfat.gov.au/publications/trade/trade_at_a_glance_2010.html#sect02 [Accessed 20 April 2011]
344 World Bank Statistical data http://devdata.worldbank.org/AAG/chn_aag.pdf [Accessed 20 April 2011]345 Similar trends are observed in the annual growth of R&D expenditure, as indicated in the report Similar trends are observed in the annual growth of R&D expenditure, as indicated in the report Examining the Characteristics of Innovation Firms in
Australia. Palangkaraya. A, et al. (2010) 346 Maiden M (11 December 2010) West must rise to the challenge as China sets the pace on many fronts The Age347 See http://www.innovation.gov.au/Science/InternationalCollaboration/Pages/CollaborationwithChina.aspx [Accessed 9 May 2011]348 Battelle (2010) 2011 Global R&D Funding Forecast. Available from http://www.battelle.org/aboutus/rd/2011.pdf [Accessed 6 May 2011]349 Boston Consulting Group report Innovation 2010 A Return to Prominence – and the Emergence of a New World Order Available at http://www.bcg.com/
documents/file42620.pdf [Accessed 6 may 2011]
20.8
15.4
12.1 11.8 11.3 10.6 10.1 9.9
8.3 7.5 7.3
6.0 5.6 5.5 5.3 5.1 4.9 4.8 4.6 4.2 3.4 3.3
0
5
10
15
20
25
Chi
na
BR
ICS
Spai
n
Kor
ea
Indi
a
Rus
sian
Fed
erat
ion
Irel
and
Aus
tral
ia
Aus
tria
Bra
zil
Den
mar
k
Finl
and
Swed
en
Tota
l OEC
D
Japa
n
Uni
ted
Stat
es
Ger
man
y
Ital
y
Can
ada
Uni
ted
Kin
gdom
Bel
gium
Fran
ce
Per
cent
age

Australian Innovation System
Report 2
011
132
The global innovation environment is seeking more innovation, science, engineering and managerial skills. Managerial skills in particular represent an important challenge for many Australian firms competing globally. The recent report ‘Management Matters in Australia’350 pointed out that ‘comparing Australian management performance internationally reveals that the top 27% of Indian and Chinese manufacturers are better managed than half of Australian manufacturing firms. With these countries fast becoming global economic powerhouses, we can expect the proportion of relatively better-managed Indian and Chinese firms to increase.
Chart 6.3: Gross expenditure in research and development (GERD) and gross domestic product (indicated by size of the bubble) in selected countries, 2008
Source: OECD Fact book 2010
The reliance on foreign-born skilled labour is set to rise further as the innovation skills base shifts toward Asia, notably China where there has been a significant increase in interest in these fields (Chapter 4). Immigration will be a short term solution to this shortage of innovation skills, however in the longer term Australia will require greater investment in innovation skills and capabilities351,352.
In post secondary education, China’s share of global university enrolments has more than doubled to 15%. Like other Asian countries it is specialising in science and engineering courses and is investing heavily to develop its leading universities to be the best in the world. Richard Levin353, President of Yale University recently said “…China and India … seek to expand the capacity of their systems of higher education [with China, in the last decade, doubling the number of universities from 1,022 to 2,263 at the present time] and aspire simultaneously to create a limited number of world-class universities to take their places among the best. While this seems an ambitious agenda, for China in particular, which has built the largest higher education sector in the world in just a decade, there is a will and commitment of resources to make it possible.”
350 Green R (2009) Management matters in Australia: Just how productive are we? Findings from the Australian Management Practices and Productivity global benchmarking project. Report Commissioned by DIISR, November 2009
351 Gilman D (September 2010) The new geography of global innovation Global Markets Institute Goldman Sachs Available from http://www2.goldmansachs.com/ideas/global-markets-institute/featured-research/innovation-doc.pdf [Accessed 14 April 2011]
352 See also Gittins R (2011) Making People employable is the key. Sydney Morning Herald, May 4.353 Richard Levin quoted in an article by Jessica Shepherd ( February 2010) China’s top universities will rival Oxbridge, say Yale President http://www.guardian.
co.uk/education/2010/feb/02/chinese-universities-will-rival-oxbridge [Accessed 15 April 2011]
Gro
ss E
xpen
ditu
re o
n R
&D
, $B
illio
n
0
United States, $14.3Tr
China, $7.9TrJapan, $4.4Tr
India, $3.3Tr
Germany, $2.9Tr
Russian Federation, $2.3Tr
Denmark, $0.2Tr
UK, $2.2Tr
France, $2.1Tr
Spain, $1.4Tr
Korea, $1.3Tr
Sweden, $0.3Tr
Finland, $0.2Tr
Australia, $1.3Tr
Brazil, $2.0Tr
Canada, $1.3Tr
Netherlands, $0.7Tr
500
400
300
200
100

Chapter 6
: Emerging opportunities
and challenges
133
Although these trends show some of the features of the environment that Australia is (and will be) facing for collaboration, networking and competition there are a number of equally important framework conditions creating opportunities and challenges for global business engagement. In the case of China, for example, understanding culture, the nature of relationships, the workings of the Government, the needs for talent and skills and issues such as perceptions of quality, intellectual property and finance are fundamental steps for business to engage this market successfully. 354
While internationally culture influences business relationships, the difference about operating in China is the level, depth, and saturation point to which this occurs.355 In China, culture affects program and product development, human resources, manufacturing, marketing and sales, intellectual property, quality issues, servicing and speed to market, to name just a few. The cultural dimension is central to the execution of business strategy, and to achieving return on investment in China. Interestingly, these particular cultural characteristics of the Chinese market, together with technological advances such as internet based communication, open opportunities for a new breed of global SMEs or micro-multinationals. Global SMEs have flexibility and capacity to adopt new and effective business models for engaging with China.356
The Government recognises the importance of enhancing Australian understanding of China in a global context and to this end has supported the establishment of a new Australian Centre for China in the World at the Australian National University (ANU) as part of the broader Commonwealth-ANU strategic relationship. Government support for the centre includes a foundation grant of $35 million and $18.1 million for the centre’s new building on the ANU campus. The centre will be an integrated, world-leading institution for Chinese Studies, producing innovative and high-quality research, widely disseminating this research, and providing postgraduate and other training activities. The Centre will take a broad holistic view and engage multidisciplinary expertise in areas including Chinese thought, culture, history, politics, society, environment, economics, and foreign and strategic policy. The Centre will also disseminate its research to the Australian Public Service.
Outside of the Australian Government other initiatives are taking place that aim to strengthen Australia’s engagement with China and India. The Queensland research and development investment strategy 2010–2020357 aims to build critical mass through development of international partnerships, including with India and China. The University of Queensland (UQ) Confucius Institute established in 2010 as a partnership between UQ, Tianjin University and the Office of Chinese Language Council International (Hanban) in China exemplifies this commitment. The UQ Confucius Institute is a science and technology focused institute that aims to facilitate academic and student exchange between UQ, Chinese Universities and research organisations and to combine the learning of Chinese language and culture with studies in science, engineering and technology. The promotion of science and technology collaboration between Australia and China and the encouragement of high-level forums, governments and corporate visits between the two countries are also important objectives of the institute.
354 ABF (2009) Engaging China: the realities for Australian business, Australian Business Foundation, Sydney355 Ibid.356 See the case studies in ABF (2009) Engaging China: the realities for Australian business, Australian Business Foundation, Sydney357 The 10 year Strategy provides focus to integrate departmental R&D investments on a whole-of-government basis and sets out what the Queensland
Government wishes to achieve from R&D investments over the next ten years, and identifies the strategies and actions required to get there. http://www.chiefscientist.qld.gov.au/research-and-development/investment-strategy.aspx
Professor Lu YongXiang and Senator the Hon. Kim Carr at the 30th anniversary of the Australia-China science collaboration, 18th November 2010. Image provided by Id Photographics, Irene Dowdy © Australian Academy of Science.

Australian Innovation System
Report 2
011
134
The Australian Government also recognises the benefits of trade liberalisation, including the negotiation of comprehensive bilateral and multilateral Free Trade Agreements (FTAs) which cover all sectors of the economy. Australia is currently negotiating an FTA with China and has finalised a feasibility study on a possible FTA with India. Comprehensive FTAs with China and India would reduce barriers for innovative new companies to enter overseas markets, allow for greater business-to-business and business-to-government collaboration, facilitate the free flow of information, and provide significant economic benefits.
To tackle the increasing globalisation of the generation of knowledge, Australian organisations will need to strategically decide who and how to collaborate with others – internally and globally (Chapter 4). As already noted, Australia needs to focus on and expand its areas of expertise in order to take a lead in emerging global markets, especially those of its regional partners, China and India.
There are opportunities for Australian researchers and industry to form partnerships to take advantage of the fact that many Asian countries, China and India in particular, currently have significant investment capital available. While Australia cannot compete on scale, we can focus on our strengths and the priority areas for engagement and collaboration with these economies (for instance, energy, water, agriculture and health, as well as the emerging areas of interest – biotechnology, medical devices, engineering design and animal health358). The new directions for Austrade (detailed in Chapter 3), the new Australia China Research Fund and the Australia India Strategic Research Fund are examples where the Australian Government is helping to establish collaborative innovation partnerships with Asia (detailed in Chapter 4 and below). In 2009–10 five Cooperative Research Centres (CRCs) reported commercial, research and educational alliances with seven organisations from India, and twelve reported commercial, research and educational alliances with 26 organisations from China.
Specialisation is one of the strategic choices that middle size countries such as Australia are facing. Specialisation means build world class capabilities and focus resources where Australian organisations can add value and differentiation.
Case Studies
The following case studies provide some insights into what is happening in the four areas of focus for this chapter. Additional case studies can be found in the case study companion to this report.
Zeobond’s ECO-CEMENT
According to the International Energy Agency, the manufacture of Portland cement produces about 0.9 kilograms of CO2 for every kilogram of cement. Around 5% of global CO2 emissions result from this process, making it one of the more polluting activities undertaken by mankind. One of the most promising alternatives to common Portland cement is geopolymer cement. Australia is now among the world leaders in research and commercialisation of geopolymer cement. Along with University of Melbourne researchers, CSIRO found that geopolymer technology reduces greenhouse gas emissions by 80% compared to Portland cement, because high temperature calcining (ore breakdown) is not needed. Geopolymer cement also has increased fire and chemical resistance. Even better, they can be manufactured from industrial waste stock, like the vast amounts of fly ash that are produced from coal combustion. If these waste streams reduce over time, geopolymers can be made from very commonly available materials, such as clays.
358 Working group on Asia (June 2006) Strengthening Australia’s position in the New World Order – Report to PMSEIC Available from http://www.chiefscientist.gov.au/wp-content/uploads/20060602-Asias-scientific-and-economic-growth-opportunities-for-Australia.pdf {Accessed 14 April 2011]
E-Crete uses waste fly ash and slag to achieve a comparable cement for an 80 per cent emissions reduction. Image provided by Zeobond.

Chapter 6
: Emerging opportunities
and challenges
135
Ceramic filters used at Radford Meats. Image provided by the Department of Innovation, Industry, Science and Research.
After almost two decades of development, private Melbourne-based company Zeobond Pty Ltd was formed in 2006 by researchers from the University of Melbourne to commercialise geopolymer cement. They created a new product called E-Crete which forms at room temperature, requires no kiln and uses fly ash as the main feedstock. The product looks similar to and performs in the same ways as concrete. It can also be used in most cases where concrete is used today, such as in ready-mix applications including house slabs, foot paths, driveways, and in pre-cast products such as bricks, blocks, pavers and panels. Zeobond laid the first test slab of E-Crete in 2007 and along with two other products are now being manufactured and used around Australia. Zeobond is also expanding into developing international markets where cement production is rapidly growing to meet infrastructure needs.
Life cycle analysis studies show that E-Crete produces 80–90% less carbon dioxide than traditional Portland cements for only 10% more cost than Portland cement, using existing supply chains. According to the Massachusetts Institute of Technology, approximately 2.35 billion tons of Portland cement is made each year. If carbon dioxide emissions in the global cement manufacturing sector can be reduced by even 10% this would accomplish one-fifth of the Kyoto Protocol 2012 goal of an average 5.2% reduction in developed country carbon dioxide emissions from 1990 levels. Zeobond’s successes shows that Australian research and development can punch above its weight in creating potentially world-changing eco-innovations.
New filters recycle 90% of company’s waste water
Drought and the fundamental need to stay in business have brought on a radical reengineering effort at Radford Meats in Warragul, Victoria. The company has gone through several transformations since opening in 1946, but the most recent will work to keep it in business, as well as help the environment. Water is essential in an abattoir and, with the assistance of the Australian Government, Radford has replaced its old water supply system with ultrafiltration technology – a red meat industry first. The ultrafiltration system is expected to recycle up to 90% of the water used at Radfords.
‘In drought conditions, using mains water in the volume required was not a viable option. We quickly realised that water recycling was our best option. Our previous system was fed by a natural spring on the company’s land and we realised we needed to do something when the spring began running dry up to once a week,’ Mr Radford said.
Before the ultrafiltration system was installed, waste water was pumped into the pasture from the settling ponds at the site. The new system will re-use the waste water and in a complementary development, we have modified our refrigeration plant to capture all defrost water that was previously wasted. Feeding the cold defrost water back into the system also greatly improves the energy efficiency of our cooling towers. Injecting this ‘pure’ water dilutes the overall effluent stream, reducing the load on the ultrafiltration system, and providing further energy savings.
Radford Meats has installed ceramic filters. The system filters waste to a microscopic level – less than 0.01 micron metres. Many people have shown interest in following the success of the system. Mr Radford believes that if each meat processor in Australia adopted an ultrafiltration system, up to 13 gigalitres of water could be saved each year.
‘We have tested and refined the system to adopt it to our needs and find ways to send as much of the water we use through the system. We are confident it will help us to keep growing.’ 359
359 For more information see AusIndustry: http://www.ausindustry.gov.au/CustomerStories/Documents/Radford_Meats.pdf and www.radfordmeats.com/ [Accessed27 May 2011]

Australian Innovation System
Report 2
011
136
The Western Australian State Agricultural Biotechnology Centre
The Western Australian State Agricultural Biotechnology Centre (SABC)360 is the major centre for agricultural biotechnology in WA. Led by Professor Michael Jones, this Murdoch University centre provides state-of-the-art facilities in molecular research and biotechnology for researchers of WA-based universities as well as the Department of Agriculture and Food WA. Operating under a “Research Hotel” model the SABC promotes collaborative research between different groups and also supports the incubation of start-up Ag-Biotech companies in WA, such as Saturn Biotech and Nemgenix. The income gained from researchers and the services provided, covers maintenance and running costs of equipment and facilities, such as OGTR and AQIS-approved laboratories, ‘Next generation’ DNA sequencing and mass spectrometers; yet provides access in a cost-effective and equitable manner.
The major research focus at the SABC is on molecular activities that involve or promote primary production of commercial livestock, crop plants or microbes, or their subsequent processing for added value. Because of its inclusive nature, the SABC also supports some research in biomedical sciences and environmental biotechnology.
SABC researchers have an outstanding track record of outcomes of benefit to the agricultural industry. These include:
› Provision of co-located, state-of-the art, well run platform technologies for all WA researchers;
› Averaging 50 current PhD students and 30 Honours students;
› Major advances in introgressing resistance to Russian Wheat Aphid in Australian wheat germplasm;
› First transcriptome sequence of a root lesion nematode;
› Significant plant virus research, including 7 new full length sequences of plant viruses, and identification of a new class of virus;
› Plant breeding support leading to improved crop varieties (molecular markers, yield, resistance to diseases and pests, better quality, variety ID, diagnostics);
› Improved productivity and health of livestock; and
› Biomedical diagnostics.
Bio-fortification of bananas for East Africa: planning for success and public acceptance
QUT researchers361 are on track to providing East Africa with access to disease-free bananas within the next two years. The bio-fortification project will ensure the future survival of the population’s staple food and improve its nutritional value.
The project has been funded by $10 million in grants from the Bill and Melinda Gates Foundation. Professor James Dale and his 13-strong research team are identifying and diagnosing the different viruses infecting East African Highland bananas, and micro-propagating varieties of bananas that are high in micronutrient content and disease free.
Ugandans are the largest consumers of bananas in the world and eat on average nearly one kilogram per person per day. Banana diseases have the potential to threaten the basis of their food supply and have a devastating effect on the banana industry. QUT scientists have been successfully researching methods to improve the nutrient content of the East African Highland banana through genetic improvement for the past 18 months.
Research partners include:
› National Agricultural Research Organisation Uganda;
› Kenyan Agricultural Research Institute;
› Mikocheni Agricultural Research Institute; and
› Africa Harvest Biotechnology Foundation International.
360 For more information see http://www.sabc.murdoch.edu.au/ [Accessed 27 May 2011]361 For further information see http://www.eurekalert.org/pub_releases/2006-12/quot-fbf121806.php [Accessed 27 May 2011] and http://www.labonline.com.
au/news/4649-Funding-boost-for-banana-research [Accessed 27 May 2011]

Chapter 6
: Emerging opportunities
and challenges
137
NETS PACE
In 2010, the Department of Innovation, Industry Science and Research, as part of the National Enabling Technology Strategy, worked with Kristin Alford and her team at foresight consultancy Bridge8 Pty Ltd362 to improve and promote the AccessNano363 education resource with various small projects.
In January 2010, Bridge8 attracted 15 educators through the Australian Science Teacher Association (ASTA) network to attend a free workshop in Melbourne on AccessNano. The provision was that on return to their state or territory, the attendees would host their own workshop to assist other teachers in delivering this resource in schools. All but one attendee realised their promise to deliver a workshop to their schools between February and May 2010. The workshops were well received with 94% of attendees rating the experience as ‘beneficial’ to ‘highly beneficial’. Furthermore, six of the original 15 teachers have committed to delivering additional workshops throughout the year at no extra charge to the Department.
By tapping into the enthusiasm these professionals possess, the Department benefited with additional work beyond the teachers’ initial commitment, allowing the dissemination of information on nanotechnology to continue at no extra cost, and encouraging a culture of collaboration to continue this dissemination process.
Bridge8 brings broad knowledge from its consultancy projects and expertise to inform opportunities for this resource and approaches to teaching, including the development of animations and support for teacher networks.
The Department of Innovation continues to work with Bridge8 to develop the AccessNano resource and new channels to distribute its content to assist in supporting this resource, including an education blog (http://science-education.govspace.gov.au) and YouTube channel (www.youtube.com/user/AccessNanoOrg).
The NBN and the Health Care Challenge
Dr Ian Oppermann, Director of the CSIRO ICT Centre is heading up a project with the CSIRO’s Australian ehealth Research Centre (AEHRC) which aims to use information and communication technologies to build a sustainable healthcare system for Australia.364
With access to high speed reliable communication opened up by the national rollout of the NBN, in conjunction with the development of easy to use/smart technologies, ehealth opens new mechanisms for healthcare service delivery in traditional healthcare facilities, community settings and in private homes.
The sustainability of health services in Australia requires a whole of system approach to service delivery. With health expenditure now in excess of $110 billion, health accounts for over 9% of Australia’s annual GDP. Dr Oppermann believes that against this backdrop the NBN has the ability to fundamentally change service delivery models in health services, human services and smart infrastructure services. Symmetric data rates (where upload rates are the same as down load rates) will mean users can contribute to content creation helping to:
› Develop new cost-effective services to meet the demands of the health service providers and users;
› Respond to the complexity of health services provided and required; and
› Ensure greater access, irrespective of location and circumstance – house bound metropolitan to rural and remote locations.
Pilots of health services that are being enabled by new/smart technologies are taking place across the country. Smithton in Tasmania has seen the use of existing broadcasting infrastructure (namely analogue TV channels) to transmit information to those who live beyond current broadband networks; Armidale in northern New South Wales has had specialist health care delivered to remotely located patients; and the Pilbara in WA has trailed screening and early detection across a number of medical conditions, facilitated by video data transfer with Perth-based specialists.
362 See http://www.ausnano.net/index.php?page=groups&group=5213 [Accessed 27 May 2011]363 See http://www.accessnano.org/ [Accessed 27 May 2011]364 For further information: http://www.csiro.au/science/healthcare-revolution-through-ehealth-innovation.html; and http://aehrc.com/media/pr-090428-
cardiac-patients-trial-home-based-rehabilitation.html
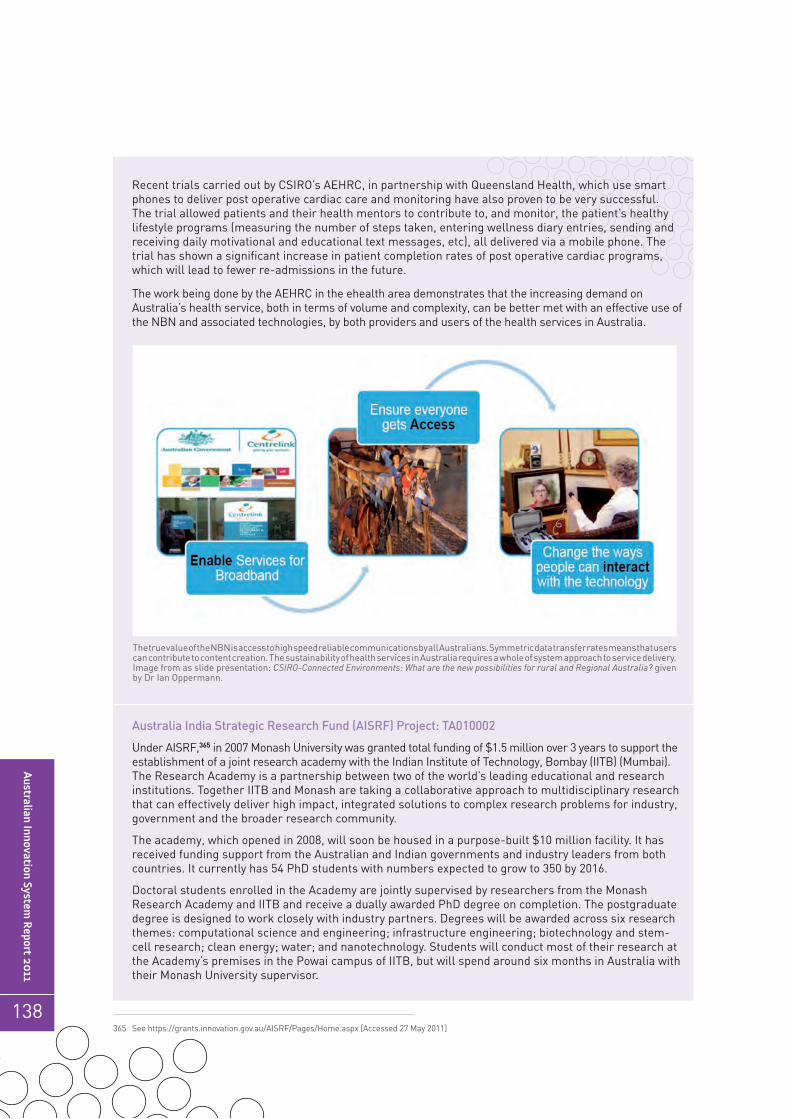
Australian Innovation System
Report 2
011
138
Recent trials carried out by CSIRO’s AEHRC, in partnership with Queensland Health, which use smart phones to deliver post operative cardiac care and monitoring have also proven to be very successful. The trial allowed patients and their health mentors to contribute to, and monitor, the patient’s healthy lifestyle programs (measuring the number of steps taken, entering wellness diary entries, sending and receiving daily motivational and educational text messages, etc), all delivered via a mobile phone. The trial has shown a significant increase in patient completion rates of post operative cardiac programs, which will lead to fewer re-admissions in the future.
The work being done by the AEHRC in the ehealth area demonstrates that the increasing demand on Australia’s health service, both in terms of volume and complexity, can be better met with an effective use of the NBN and associated technologies, by both providers and users of the health services in Australia.
Australia India Strategic Research Fund (AISRF) Project: TA010002
Under AISRF,365 in 2007 Monash University was granted total funding of $1.5 million over 3 years to support the establishment of a joint research academy with the Indian Institute of Technology, Bombay (IITB) (Mumbai). The Research Academy is a partnership between two of the world’s leading educational and research institutions. Together IITB and Monash are taking a collaborative approach to multidisciplinary research that can effectively deliver high impact, integrated solutions to complex research problems for industry, government and the broader research community.
The academy, which opened in 2008, will soon be housed in a purpose-built $10 million facility. It has received funding support from the Australian and Indian governments and industry leaders from both countries. It currently has 54 PhD students with numbers expected to grow to 350 by 2016.
Doctoral students enrolled in the Academy are jointly supervised by researchers from the Monash Research Academy and IITB and receive a dually awarded PhD degree on completion. The postgraduate degree is designed to work closely with industry partners. Degrees will be awarded across six research themes: computational science and engineering; infrastructure engineering; biotechnology and stem-cell research; clean energy; water; and nanotechnology. Students will conduct most of their research at the Academy’s premises in the Powai campus of IITB, but will spend around six months in Australia with their Monash University supervisor.
365 See https://grants.innovation.gov.au/AISRF/Pages/Home.aspx [Accessed 27 May 2011]
The true value of the NBN is access to high speed reliable communications by all Australians. Symmetric data transfer rates means that users can contribute to content creation. The sustainability of health services in Australia requires a whole of system approach to service delivery. Image from as slide presentation: CSIRO-Connected Environments: What are the new possibilities for rural and Regional Australia? given by Dr Ian Oppermann.

Chapter 6
: Emerging opportunities
and challenges
139
China connection
In September 2010 Professor Jinghai Li, Vice-President of the Chinese Academy of Sciences (CAS), and Professor Rongqiao He from the Chinese Academy of Sciences’ Institute of Biophysics (IPB; a CAS institute in Beijing) visited the Queensland Brain Institute (QBI) at The University of Queensland (UQ), joining QBI Director Professor Perry Bartlett to officially open the Queensland node of the QBI-IBP Joint Laboratory of Neuroscience and Cognition.366 The launch of the Beijing node of the joint laboratory followed in November 2010. The establishment of this world-first joint neuroscience laboratory with China consummates the strong relationship between the two institutes, harnessing their synergies in neuroscience.
Understanding how functions such as attention, learning and memory are regulated in the healthy brain, as well as in disease or injury, is one of the major challenges facing modern neuroscientists. This initiative brings together expertise and advanced technologies in cellular and molecular systems, imaging and protein chemistry to address these issues, with the long term goal of developing new approaches to treat neurological and mental disease.
The joint laboratory will focus on research into:
› The brain’s attention processing system – specifically selective attention in learning and memory, a hallmark of many debilitating psychiatric and neurological conditions;
› The production of new brain cells and neurons, known as neurogenesis, and its role in learning and memory; and
› The brain’s synaptic circuits in learning and memory, as well as in anxiety and depression.
Understanding the fundamental mechanisms of brain function is the first step towards producing appropriate therapeutic treatments for dementia, depression, schizophrenia and other disorders. Research within the joint laboratory has already attracted $3.25m in grant, fellowship and matching funding.
366 See http://www.qbi.uq.edu.au/100926-unique-research-laboratory-established-between-brisbane-and-beijing [Accessed 2011]

Australian Innovation System
Report 2
011
140
ABBREVIATIONS
ABC Australian Broadcasting Corporation
ABS Australian Bureau of Statistics
ACBI Australian Centre for Broadband Innovation
ACERA Australian Centre of Excellence for Risk Analysis
ACG Australian Competitive Grant
ACIAR Australian Centre for International Agricultural Research
ACRE Australian Centre for Renewable Energy
ADHD Attention deficit hyperactivity disorder
AEHRC Australian e-Health Research Centre
AFFRIC Australian Future Fibres and Research Innovation Centre
AIDS Acquired immune deficiency syndrome
AIS Aboriginal Interpreter Service
AISRF Australia-India Strategic Research Fund
AMT Australian Membrane Technologies Pty Ltd
ANSTO Australian Nuclear Science and Technology Organisation
ANU Australian National University
ANZSIC Australian New Zealand Standard Industry Classification System
APS Australian Public Service
APSC Australian Public Service Commission
APSII Australian Public Sector Innovation Indicators
ARC Australian Research Council
ARIES Australian Research Institute for Environment and Sustainability
ASRP Australian Space Research Program
AusAID Australian Agency for International Development
BCS Business Characteristics Survey
BERD Business expenditure on research and development
BSL Brotherhood of St Laurence
CAP Classroom Access Project
CAS Chinese Academy of Sciences
CCS Community Contact Service
CDFI Community development financial institution
CEI Clean Energy Initiative
CfCG Centre for Green Chemistry
CMA Catchment Management Authority
COS Colac Otway Shire
CRC Cooperative Research Centre
CRN Collaborative Research Networks
CSIF Critical Skills Investment Fund
CSIRO Commonwealth Scientific and Industrial Research Organisation
DAFF Department of Agriculture, Fisheries and Forestry
DEEDI Department of Employment, Economic Development and Innovation, Queensland
DEEWR Department of Education, Employment and Workplace Relations
DIISR Department of Innovation, Industry, Science and Research
DPI Department of Primary Industries, Victoria
DSC Dye Solar Cell
DSE Department of Sustainability and Environment , Victoria
EPI Environmental Performance Index

141
Abbreviations
ERA Excellence in Research for Australia
ESI Essential Science Indicators
EU European Union
FaHCSIA Department of Families, Housing, Community Services and Indigenous Affairs
FASES Finding Australia’s Social Enterprise Sector
FDI Foreign direct investment
FTA Free trade agreement
FY Financial year
GBAORD Government budget appropriations or outlays on research and development
GCF Green Chemical Futures
GCI Global Competitiveness Index
GERD Gross expenditure on research and development
GDP Gross domestic product
GFC Global financial crisis
GIS Geographic information system
GNI Gross national income
GOVERD Government expenditure on research and development
GPI Global Competitiveness Index
GRA Global Research Alliance
GST Goods and services tax
HDI Human Development Index
HDR Higher degree by research
HERD Higher education expenditure on research and development
HIV Human immunodeficiency virus
ICP Innovation Commercialisation Program
ICT Information and communication technology
IDCSA Integrated Design Commission of South Australia
IIF Innovation Investment Fund
IIFF Innovation Investment Follow-on Fund
IKEN Innovation and Knowledge Exchange Network
IMF International Monetary Fund
IP Intellectual property
ISO International Organization for Standardization
JSTCC European Union Joint Science and Technology Cooperation
KBEE Knowledge Based Bioeconomy
LPG Liquefied petroleum gas
MAA Media Access Australia
MAV Municipal Association of Victoria
MFP Multifactor productivity
MoU Memorandum of understanding
MRI Medical Research Institute
MW Megawatt
NBN National Broadband Network
NCVER National Centre for Vocational Education Research
NESTA National Endowment for Science and Technology and the Arts
NICTA National ICT Australia
NIP Non-profit institution
NMB Nano-particulate membrane bioreactor
NOAA National Oceanic and Atmospheric Administration
NPI Non-profit institution
NSW DPI NSW Department of Primary Industries
OECD Organization for Economic Co-operation and Development

Australian Innovation System
Report 2
011
142
PCT Patent Cooperation Treaty
PFRA Publicly funded research agencies
PFRO Publicly funded research organisation
PISA Programme for International Student Assessment
PNPRD Private non-profit research and development
PPP Purchasing power parity
R&D Research and development
RCA Revealed comparative advantage
REVC Renewable energy venture capital
RIBG Research Infrastructure Block Grants
RTA Roads and Traffic Authority
S&E Science and engineering
SCATS Sydney Coordinated Adaptive Traffic System
SEDIF Social Enterprise Development and Investment Funds
SET Science, engineering and technology
SImPLE Simple Image Preview: Live Environment
SME Small and medium enterprise
SRE Sustainable Research Excellence
SRI Socially responsible investment
STI Science and Technology Initiative
STaR Smart Transport and Roads Project
TAFE Technical and Further Education
TAS Tailored Advisory Service
TC Transparent costing
TCF Textile, clothing and footwear
TEA Total early-stage entrepreneurial activity
TERI The Energy and Resources Institute
TFP Total factor productivity
TKC Technology and Knowledge Connect
TPER Technology Partnerships Equipment Register
TTO Technology Transfer Office
UB University of Ballarat
UNEP United Nations Environmental Programme
UNSW University of New South Wales
UOW University of Wollongong
USA United States of America
VC Venture capital
VET Vocational education and training
VSA Victoria’s Science Agenda
WA-OIGC WA Organic and Isotope Geochemistry Centre
WEF World Economic Forum
WIIN Workshops Industry Intelligence and Networking
WIPO World Intellectual Property Organization
WLAN Wireless local area networking

Appendix 1: Science, R
esearch and Innovation B
udget tables
143
APPENDIX 1Science, Research and Innovation Budget tables
Table 1: Summary of Australian Government support for science, research and innovation through the budget and other appropriations – actual cost in year incurreda,b
Ref. no.a
2002–03
$m
2003–04
$m
2004–05
$m
2005–06
$m
2006–07
$m
2007–08
$m
2008–09
$m
2009–
10$m
Estimated Actual
2010–11$m
Budget Estimate 2011–12
$m
INTRAMURAL EXPENDITURE ON SCIENCE, RESEARCH AND INNOVATIONC
Australian Government Research Activities
CSIRO 1 532.1 568.6 577.1 593.9 610.1 663.1 675.8 714.8 730.3 724.9
Defence Science and Technology Organisation
2 283.4 293.9 314.4 349.1 406.0 401.0 374.9 403.2 444.4 433.7
Other R&D Activities 3 451.2 574.8 498.3 480.8 499.6 581.8 572.5 603.7 621.2 602.2
Sub-total 1,266.7 1,437.4 1,389.8 1,423.9 1,515.7 1,645.9 1,623.2 1,721.7 1,796.0 1,760.8
EXTRAMURAL EXPENDITURE ON SCIENCE, RESEARCH AND INNOVATIONC
Business Enterprise Sector
Industry R&D Tax Incentivesd 4 587.0 665.0 729.0 867.0 960.0 1,096.0 1,434.0 1,713.0 1,705.0 1,770.0
Other R&D Support 5 148.3 219.5 175.0 191.1 212.2 233.8 179.0 63.5 35.0 6.0
Other Innovation Support 6 264.7 266.9 223.7 242.4 255.1 267.3 285.4 568.4 433.2 482.6
Sub-total 999.9 1,151.4 1,127.7 1,300.5 1,427.3 1,597.1 1,898.4 2,344.9 2,173.2 2,258.6
Higher Education Sector
Australian Research Council 7 298.3 399.6 480.9 544.4 570.3 571.8 585.9 652.8 708.7 810.2
Performance Based Block Funding
8 1,237.2 1,332.5 1,333.0 1,382.8 1,394.9 1,386.2 1,402.9 1,508.3 1,655.7 1,772.4
Other R&D Support 9 437.7 445.1 3.1 132.7 8.3 9.7 15.2 198.3 218.8 156.1
Sub-total 1,973.2 2,167.1 1,816.9 2,060.0 1,973.5 1,967.7 2,004.0 2,359.5 2,583.2 2,738.7
Multisectore
National Health and Medical Research Council and Other Health
10 291.6 365.7 380.6 674.9 962.6 618.6 936.8 896.4 1,211.7 1,347.1
Cooperative Research Centres 11 148.6 201.8 194.5 208.1 189.3 211.9 182.3 178.9 172.6 165.2
Rural 12 204.5 226.3 225.7 234.0 238.5 241.4 245.7 228.8 265.0 240.7
Energy and the Environment 13 33.1 62.3 40.7 46.0 75.6 87.6 192.4 257.9 292.1 436.8
Other Science Support 14 49.5 61.6 74.8 95.8 174.9 178.2 185.4 384.3 583.5 436.0
Sub-total 727.3 917.7 916.2 1,258.8 1,640.9 1,337.8 1,742.6 1,946.2 2,525.0 2,625.9
Total Australian Government Support 4,967.2 5,673.6 5,250.7 6,043.2 6,557.3 6,548.5 7,268.1 8,372.3 9,077.3 9,384.0
Notes:a. The financial data presented in this table are an aggregate of the expenditure data sourced from Tables 2, 3 and 4. Reference numbers in
Column 2 identify their respective disaggregated source data in Tables 2, 3 and 4.b. A breakdown of the total expenditure by portfolio is summarised in the table below. Tax measures are included in the relevant policy
portfolio rather than Treasury. c. A definition of the expenditure categories may be found at www.innovation.gov.au/AboutUs/FinancialInformationLegislation/
BudgetInformation/Pages/default.aspx. d. The amounts indicated for Industry R&D Tax Incentives are estimates only.e. ‘Multisector’ includes programs that may be accessed by several sectors, including Australian Government agencies.

Australian Innovation System
Report 2
011
144
Portfolio Summary
Portfolio
2002–03
$m
2003–04
$m
2004–05
$m
2005–06
$m
2006–07
$m
2007–08
$m
2008–
09$m
2009–
10$m
Estimated Actual
2010–11$m
Budget Estimate 2011–12
$m
Agriculture, Fisheries And Forestry 217.2 247.3 250.3 262.9 264.4 265.4 264.5 255.9 290.0 255.8
Attorney-General 5.9 6.2 6.0 5.6 7.3 9.6 9.5 8.8 9.4 7.9
Broadband, Communications and the Digital Economy
10.3 11.3 17.2 23.5 24.0 26.8 27.3 25.4 25.9 25.0
Climate Change and Energy Efficiency 3.2 3.6 6.9 6.7 9.4 12.0 18.5 11.8 15.9 24.3
Defence 283.4 293.9 314.7 349.4 406.3 403.5 386.0 417.2 463.1 456.3
Education, Employment and Workplace Relations
585.0 585.0 154.9 165.2 166.6 167.7 170.1 171.1 174.2 178.9
Families, Housing, Community Services and Indigenous Affairs
0.0 0.0 0.0 0.0 0.0 0.1 0.4 0.3 0.3 0.1
Foreign Affairs and Trade 41.3 41.2 42.8 46.4 51.3 56.8 56.1 72.8 98.1 96.2
Health and Ageing 291.6 365.7 380.6 674.9 962.6 620.7 941.1 898.4 1,213.7 1,349.1
Human Services 0.0 0.0 0.0 0.0 0.0 0.0 0.0 2.0 2.0 2.0
Infrastructure and Transport 1.8 1.9 1.9 2.2 7.1 9.1 7.0 3.4 5.0 4.2
Innovation, Industry, Science and Research
3,297.5 3,852.7 3,827.4 4,238.0 4,335.5 4,615.5 4,939.6 5,983.1 6,253.4 6,413.1
Prime Minister and Cabinet 1.0 1.2 1.8 3.0 3.0 6.5 6.2 5.6 5.1 3.9
Resources, Energy and Tourism 88.8 96.9 102.6 113.6 131.5 168.2 250.7 328.7 349.0 392.3
Sustainability, Environment, Water, Population and Communities
140.2 166.6 143.5 151.8 188.4 186.5 191.2 187.8 172.2 174.9
Total 4,967.2 5,673.6 5,250.7 6,043.2 6,557.3 6,548.5 7,268.1 8,372.3 9,077.3 9,384.0

Appendix 1: Science, R
esearch and Innovation B
udget tables
145
Table 2: Australian Government Research Activities – Budget Expendituresa
Portfolio / ActivityRef. no.a
2002–03
$m
2003–04
$m
2004–05
$m
2005–06
$m
2006–07
$m
2007–08
$m
2008–09
$m
2009–
10$m
Estimated Actual
2010–11$m
Budget Estimate 2011–12
$m
AGRICULTURE, FISHERIES AND FORESTRY
Australian Animal Health Laboratory
3 6.1 6.2 6.8 6.9 7.0 7.2 7.1 7.2 7.3 7.4
DEFENCE
Defence Science and Technology Organisationb
2 283.4 293.9 314.4 349.1 406.0 401.0 374.9 403.2 444.4 433.7
FOREIGN AFFAIRS AND TRADE
Australian Centre for International Agricultural Research
3 41.3 41.2 42.8 46.4 51.3 56.8 56.1 72.8 98.1 96.2
HEALTH AND AGEING
Australian Radiation Protection and Nuclear Safety Agency
3 0.0 0.0 0.0 0.0 0.0 2.1 4.3 2.0 2.0 2.0
INNOVATION, INDUSTRY, SCIENCE AND RESEARCH
Australian Astronomical Observatoryc
3 3.9 4.0 4.1 4.6 4.7 4.8 4.9 9.0 10.2 10.3
Australian Institute of Aboriginal and Torres Strait Islander Studiesd
3 1.8 1.8 1.9 1.9 1.8 1.8 2.1 2.0 2.4 2.2
Australian Institute of Marine Science
3 24.3 22.1 22.5 23.1 24.5 26.6 27.6 30.4 30.9 31.2
Australian Nuclear Science and Technology Organisatione
3 173.2 290.4 196.4 158.5 141.6 185.7 174.7 175.2 189.7 173.1
CSIRO 1 532.1 568.6 577.1 593.9 610.1 663.1 675.8 714.8 730.3 724.9
RESOURCES, ENERGY AND TOURISM
Geoscience Australia 3 88.8 96.9 100.9 107.4 125.4 145.0 139.0 130.6 116.2 112.9
SUSTAINABILITY, ENVIRONMENT, WATER, POPULATION AND COMMUNITIES
Antarctic Division 3 84.6 85.5 86.5 94.6 99.6 105.5 104.6 116.9 101.6 102.4
Bureau of Meteorology Research Activities
3 9.7 10.1 11.0 11.7 12.8 12.6 19.9 22.6 27.8 31.3
Great Barrier Reef Marine Park Authority
3 4.1 3.9 4.0 4.9 4.8 4.8 3.4 3.0 2.6 2.6
Supervising Scientist Divisionf 3 8.0 7.1 7.8 7.5 11.1 11.2 11.0 12.4 11.8 11.7
Total 1,261.2 1,431.8 1,376.2 1,410.6 1,500.7 1,628.3 1,605.5 1,702.1 1,775.3 1,741.9
Notes:a. The financial data have been supplied and confirmed by the departments and agencies responsible for administering the programs listed
in the Table. Reference numbers in Column 2 reconcile agency expenditures with their respective sector aggregates in Table 1. b. DSTO expenditures shown here are for direct expenses on the research program and exclude costs associated with overheads and
administrative support provided by other Defence Groups. c. Reported separately prior to the 2011–12 Science, Research and Innovation Budget Tables as the Anglo-Australian Observatory and the
Anglo-Australian Telescope Board. d. In the 2011–12 tables, AIATSIS figures for all years have been re-cast to exclude overheads and other non-appropriation figures.e. The fluctuations in the years 2007–08 onwards are timing issues relating to several large equity projects and two special purpose expense
areas: disposition of spent fuel and ANSTOs decommissioning program. f. Formerly referred to as the Environmental Research Institute of the Supervising Scientist. From 2006–07, total Divisional expenses have
been assessed as supporting research and innovation.

Australian Innovation System
Report 2
011
146
Figure 1: Percentage breakdown of Australian Government support for science, research and innovation by sector of performance in 2011–12
Higher Education Sector29.2%
Australian GovernmentResearch Activities
18.8%
BuinessEnterprise Sector
24.1%
Multisector28.0%

Appendix 1: Science, R
esearch and Innovation B
udget tables
147
Table 3: R&D Granting Programs and other support for science, research and innovation through the Budgeta
ProgramRef. no.a
2002–03
$m
2003–04
$m
2004–05
$m
2005–06
$m
2006–07
$m
2007–08
$m
2008–09
$m
2009–
10$m
Estimated Actual
2010–11$m
Budget Estimate 2011–12
$m
AGRICULTURE, FISHERIES AND FORESTRY
Carbon Farming Initiative 12 0.0 0.0 0.0 0.0 0.0 0.0 0.0 0.0 0.3 2.3
Centres of Excellence – Biosecurity Risk Analysis and Research
14
0.0
0.0
0.4
1.7
1.7
1.7
1.7
1.7
1.7
1.7
National Food Industry Strategy 6 0.9 3.0 3.4 2.4 2.3 0.0 0.0 0.0 0.0 0.0
Climate Change Research Program
13 0.0 0.0 0.0 0.0 0.0 0.0 10.0 15.0 15.0 6.2
Food Innovation Grants – National Food Industry Strategy
6
1.9
8.9
10.8
15.4
13.1
13.1
0.0
0.0
0.0
0.0
Forest Industry Climate Change Research Fund
5 0.0 0.0 0.0 0.0 0.0 0.0 0.0 3.5 1.3 0.0
Land and Water Research 12 11.9 12.2 12.5 12.5 12.8 13.0 13.0 6.7 0.0 0.0
National Weeds and Productivity Research Program
12 0.0 0.0 0.0 0.0 0.0 0.0 3.1 4.1 4.0 4.0
New Industries Development Program
6 4.0 3.2 3.5 2.6 2.0 2.3 0.2 0.0 0.0 0.0
Regional Food Producers/Seafood Industry Innovation and Productivity
12 0.0 0.0 0.0 0.0 0.0 0.0 0.0 3.0 5.5 5.8
Rural Industries R&D Corporation 12 14.9 14.8 14.6 14.9 14.9 13.4 13.3 14.0 13.7 13.8
ATTORNEY-GENERAL
Australian Institute of Criminology Research Program
3 5.5 5.6 5.4 4.9 6.7 9.0 9.0 8.4 9.0 7.4
BROADBAND, COMMUNICATIONS AND THE DIGITAL ECONOMY
ICT Centre of Excellence 14 10.3 11.3 17.2 23.5 24.0 26.8 27.3 25.4 25.9 25.0
CLIMATE CHANGE AND ENERGY EFFICIENCY
Australian Climate Change Science Program
13 0.0 0.0 6.7 6.6 8.3 8.3 8.8 7.8 7.8 7.8
Bilateral Climate Change Partnerships Programb
13 0.0 0.0 0.2 0.1 1.1 1.2 6.5 0.0 0.0 0.0
Carbon Farming Initiative 13 0.0 0.0 0.0 0.0 0.0 0.0 0.0 0.0 4.0 12.5
National Carbon Accounting System
13 3.2 3.6 0.0 0.0 0.0 2.5 3.2 0.0 0.0 0.0
National Carbon Accounting Toolbox
13 0.0 0.0 0.0 0.0 0.0 0.0 0.0 4.0 4.0 4.0
DEFENCE
Asia Pacific Civil Military Centre of Excellence Research and Lessons Learnt
14
0.0
0.0
0.0
0.0
0.0
0.0
0.0
0.6
1.1
1.2
Defence Materiel Organisation – Capability Technology Demonstrator – Extension Program
14
0.0
0.0
0.0
0.0
0.0
2.2
10.9
10.4
10.5
10.6
Defence Materiel Organisation – Defence Industry Innovation Centre
14
0.0
0.0
0.0
0.0
0.0
0.0
0.0
2.8
4.6
4.8
Jet Fuel Exposure Syndrome Study
14 0.0 0.0 0.0 0.0 0.0 0.0 0.0 0.0 0.3 1.9
EDUCATION, EMPLOYMENT AND WORKPLACE RELATIONS
Bond University – Grant for Clinical Education and Research Centre Building
9 0.0 0.0 0.0 0.0 0.0 0.0 2.5 0.0 0.0 0.0

Australian Innovation System
Report 2
011
148
ProgramRef. no.a
2002–03
$m
2003–04
$m
2004–05
$m
2005–06
$m
2006–07
$m
2007–08
$m
2008–09
$m
2009–
10$m
Estimated Actual
2010–11$m
Budget Estimate 2011–12
$m
Bond University – Grant for Health Science and Medicine Building
9 0.0 0.0 0.0 4.5 0.0 0.0 0.0 0.0 0.0 0.0
FAMILIES, HOUSING, COMMUNITY SERVICES AND INDIGENOUS AFFAIRS
ARC Linkage Grants – FaHCSIA Cash Contributions
9 0.0 0.0 0.0 0.0 0.0 0.1 0.4 0.3 0.3 0.1
HEALTH AND AGEING
Adult Stem Cell Research Centre 10 0.0 0.0 0.0 0.0 5.0 5.0 5.0 5.0 0.0 0.0
Attacking Lung Cancer 10 0.0 0.0 0.0 0.0 0.0 0.0 0.0 0.9 2.4 1.5
Australian National Preventive Health Agency Research Fund
10 0.0 0.0 0.0 0.0 0.0 0.0 0.0 0.0 0.0 8.8
Cancer Clinical Trials 10 0.0 0.0 0.0 0.0 5.2 5.4 5.5 5.5 5.5 5.6
Cancer Data 10 0.0 0.0 0.0 0.0 0.0 0.0 0.0 0.4 0.4 0.4
Cancer Research 10 0.0 0.0 0.0 3.0 5.1 5.7 5.9 4.4 4.4 4.4
Cooperative Research Centre for Aboriginal and Torres Strait Islander Health
10 0.0 0.2 0.2 0.2 0.2 0.2 0.2 0.2 0.2 0.2
Health Sciences – Australian Longitudinal Study on Women’s Healthc
10 0.9 1.7 1.1 1.4 1.4 1.4 1.4 1.3 2.4 3.1
Indigenous Public Health Workforce Capacity Building Project, Uni of Melbourne (ONEMDA) and Deakin University Institute of Koori Education
10 0.0 0.0 0.2 0.2 0.2 0.2 0.3 0.3 0.3 0.3
Investing in Hearing Researchd 10 0.0 0.0 0.0 0.0 0.0 0.5 1.2 1.4 3.0 2.3
Jigsaw Foundation – Support for Craniofacial Surgery
10 0.0 0.0 0.0 0.0 0.0 0.0 0.0 0.0 5.0 5.0
Medical Research Infrastructure Projects
10 0.0 31.2 0.0 215.0 435.8 0.0 64.8 100.7 223.8 201.5
National Cancer Plan – Boost Cancer Research
10 0.0 0.0 0.0 0.0 0.0 0.0 5.0 5.2 5.0 0.0
National Centre for Immunisation Research and Surveillance
10 0.2 0.2 0.2 0.3 0.3 0.3 0.7 0.7 0.8 0.8
National Illicit Drug Strategy Research
10 0.0 0.0 0.2 0.2 0.7 0.5 0.3 0.5 0.0 0.0
National Public Health Communicable Disease Control – Research Centres
10 0.0 0.0 0.0 8.2 8.2 8.5 8.9 9.0 9.2 9.2
NHMRC Research Grantse 10 290.5 332.4 378.2 424.6 471.7 560.7 699.3 707.1 766.3 791.7
Pandemic Vaccine Accelerated Development
10 0.0 0.0 0.0 2.0 2.5 2.5 0.0 0.0 0.0 0.0
Primary Care Policy, Innovation and Research
10 0.0 0.0 0.0 14.6 14.2 16.4 14.6 16.3 15.5 15.8
Priority Medical Research 10 0.0 0.0 0.0 0.0 5.0 5.0 5.0 5.9 0.9 0.9
Support for Diabetes Research 10 0.0 0.0 0.2 4.9 6.8 6.0 9.8 4.4 0.0 0.0
Two Dedicated Prostate Cancer Research Centres
10 0.0 0.0 0.0 0.0 0.0 0.0 3.0 2.0 3.0 3.5
University of Melbourne’s ONEMDA VicHealth Koori Health Unit
10 0.0 0.0 0.2 0.2 0.2 0.2 0.2 0.2 0.2 0.2
HUMAN SERVICES
Human Services Delivery Research Alliance
3 0.0 0.0 0.0 0.0 0.0 0.0 0.0 2.0 2.0 2.0
INFRASTRUCTURE AND TRANSPORT

Appendix 1: Science, R
esearch and Innovation B
udget tables
149
ProgramRef. no.a
2002–03
$m
2003–04
$m
2004–05
$m
2005–06
$m
2006–07
$m
2007–08
$m
2008–09
$m
2009–
10$m
Estimated Actual
2010–11$m
Budget Estimate 2011–12
$m
Air Cargo X-Ray Trials 14 0.0 0.0 0.0 0.0 4.9 3.8 0.0 0.0 0.0 0.0
Funding to Transport Certification Australia – Intelligent Access Program
14 0.0 0.0 0.0 0.0 0.0 0.0 0.0 0.0 1.5 0.7
Joint Liquids, Aerosols and Gels Trial
14 0.0 0.0 0.0 0.0 0.0 0.0 0.0 0.0 0.2 0.0
Liquids, Aerosols and Gels Screening Technology Trials
14 0.0 0.0 0.0 0.0 0.0 0.9 3.5 0.0 0.0 0.0
Low Volume Roads Research 14 0.0 0.0 0.0 0.0 0.0 1.6 0.6 0.3 0.1 0.0
Payments to Austroads/ARRB Transport Research Ltd.
14 1.8 1.9 1.9 2.2 2.2 2.8 2.9 3.1 3.2 3.4
INNOVATION, INDUSTRY, SCIENCE AND RESEARCH
Australia-China Science and Research Fund
14 0.0 0.0 0.0 0.0 0.0 0.0 0.0 0.0 0.0 2.0
Australian National University Research Infrastructure Projects
9 0.0 0.0 0.0 125.0 0.0 0.0 0.0 0.0 0.0 0.0
Australian Space Science Program
14 0.0 0.0 0.0 0.0 0.0 0.0 0.0 5.8 11.2 12.2
Australian National Stem Cell Centre
5 3.6 4.6 5.8 7.1 6.5 6.0 5.5 5.0 4.5 0.0
Australian Synchrotron Contribution
14 0.0 0.0 0.0 0.0 50.0 0.0 0.0 0.0 0.0 0.0
Automotive Competitiveness Investment Scheme
6 134.8 128.7 130.4 145.7 168.9 178.4 202.4 233.8 108.0 0.0
Automotive Transformation Scheme
6 0.0 0.0 0.0 0.0 0.0 0.0 0.0 0.0 50.8 185.3
Biotechnology Innovation Fundf 6 11.9 13.4 0.0 0.0 0.0 0.0 0.0 0.0 0.0 0.0
Building Information Technology Strengths – Advanced Networks Program
6 8.8 6.6 8.0 7.0 5.0 0.0 0.0 0.0 0.0 0.0
Building Information Technology Strengths – Incubators
6 16.1 11.6 12.6 10.6 5.0 3.5 0.0 0.0 0.0 0.0
Clean Business Australia – Climate Ready Program
6 0.0 0.0 0.0 0.0 0.0 0.0 15.9 37.6 16.3 8.5
Collaborative Research Network Program
9 0.0 0.0 0.0 0.0 0.0 0.0 0.0 0.0 8.7 18.6
Commercial Ready Programf 5 0.0 0.0 152.1 163.4 172.1 186.0 132.3 41.3 5.7 2.0
Commercialisation Australiag 6 0.0 0.0 0.0 0.0 0.0 0.0 0.0 2.3 25.0 56.2
Commercialising Emerging Technologies (COMET)
6 11.4 8.7 7.9 8.4 9.7 14.0 13.5 11.2 6.1 0.0
Commonwealth Serum Laboratories (CSL) – Commonwealth assistance
6 0.0 0.0 0.0 0.0 0.0 0.0 0.0 0.0 9.3 10.6
Commonwealth Strategic Relationship with ANU
Australian National Institute for Public Policy
9 0.0 0.0 0.0 0.0 0.0 0.0 0.0 0.0 1.7 1.5
Building the Centre on China in the World
9 0.0 0.0 0.0 0.0 0.0 0.0 0.0 0.0 10.1 8.0
Building the National Security College
9 0.0 0.0 0.0 0.0 0.0 0.0 0.0 0.0 0.1 0.2
Centre on China in the World 9 0.0 0.0 0.0 0.0 0.0 0.0 0.0 0.0 35.0 0.0

Australian Innovation System
Report 2
011
150
ProgramRef. no.a
2002–03
$m
2003–04
$m
2004–05
$m
2005–06
$m
2006–07
$m
2007–08
$m
2008–09
$m
2009–
10$m
Estimated Actual
2010–11$m
Budget Estimate 2011–12
$m
National Security College 9 0.0 0.0 0.0 0.0 0.0 0.0 0.0 0.0 0.1 0.1
Sir Roland Wilson Foundation 9 0.0 0.0 0.0 0.0 0.0 0.0 0.0 0.0 7.0 0.0
Cooperative Research Centres (CRC)
11 148.6 201.8 194.5 208.1 189.3 211.9 182.3 178.9 172.6 165.2
European Molecular Biology Laboratory Partner Facility
14 0.0 0.0 0.0 0.0 0.0 0.0 0.0 2.0 2.0 2.0
Enterprise Connect 6 0.0 0.0 0.0 0.0 0.0 0.2 0.3 1.0 1.1 1.1
Establishment of an ICT-enabled Research Laboratory – Commonwealth Assistance
6 0.0 0.0 0.0 0.0 0.0 0.0 0.0 0.0 0.7 2.3
Green Car Innovation Fund 6 0.0 0.0 0.0 0.0 0.0 0.0 0.0 108.1 62.9 136.4
Industry Cooperative Innovation Program
6 0.0 0.0 0.0 1.9 3.7 4.5 5.2 4.2 1.4 0.0
Industry Innovation Program (includes R&D Start Grants)f
5 115.5 132.8 0.0 0.0 0.0 0.0 0.0 0.0 0.0 0.0
Information Technology Online (ITOL)
6 2.3 2.2 1.9 2.2 1.3 0.0 0.0 0.0 0.0 0.0
Innovation Access Program – Industry (IAccP)f
5 5.0 11.0 2.1 0.0 0.0 0.0 0.0 0.0 0.0 0.0
Innovation Investment Fund including Innovation Investment Follow-on Fundg
6 24.7 17.6 19.6 14.7 12.3 12.1 8.1 121.8 99.3 34.5
Intermediary Access Program (Pilot)
6 0.0 0.0 0.0 0.0 1.0 3.0 0.0 0.0 0.0 0.0
International Education and Training (Australia-India Strategic Research Fund)
6 0.0 0.0 0.0 0.0 0.0 2.1 6.9 5.6 7.4 11.1
International Science Linkages 14 7.6 7.6 9.3 10.2 11.1 11.4 11.7 10.1 12.3 0.0
Cairns Institute Tropical Innovation Hub – Contribution
9 0.0 0.0 0.0 0.0 0.0 0.0 0.0 0.0 15.0 4.5
Major National Research Facilitiesh
14 25.0 38.5 42.3 42.2 0.0 0.0 0.0 0.0 0.0 0.0
Motor Vehicle Producer R&D Scheme
5 0.0 0.0 0.0 6.7 12.0 15.0 15.9 12.7 22.5 0.0
National Collaborative Research Infrastructure Strategyi
14 0.0 0.0 0.0 13.1 78.2 120.6 102.8 104.1 107.1 0.0
National Enabling Technologies Strategy
6 0.0 0.0 0.0 0.0 0.0 0.0 0.0 0.9 0.4 0.4
National Measurement Institute 3 0.0 0.0 8.0 8.0 8.0 8.5 8.5 9.0 9.5 9.5
Pharmaceutical Industry Investment Program
5 16.4 59.3 0.4 0.0 0.0 0.0 0.0 0.0 0.0 0.0
Pharmaceutical Partnerships Program
5 0.0 0.0 4.2 12.4 21.6 26.9 25.3 0.0 0.0 0.0
Competitive Pre-Seed Fundg 6 4.2 6.4 6.7 12.5 8.8 11.1 6.9 13.1 10.6 0.0
R&D Start Loans program 5 7.8 11.8 10.4 1.5 0.0 0.0 0.0 0.0 0.0 0.0
Shipbuilding Innovation Scheme 6 8.7 7.0 2.9 0.0 0.0 0.0 0.0 0.0 0.0 0.0
Small-Scale Mammalian Cell Production Facility
5 0.0 0.0 0.0 0.0 0.0 0.0 0.0 1.0 1.0 4.0
Société Internationale de Télécommunications Aéronautiques
6 1.7 0.3 0.0 0.0 0.0 0.0 0.0 0.0 0.0 0.0
Software-Engineering Australia 6 2.0 1.1 0.0 0.0 0.0 0.0 0.0 0.0 0.0 0.0
Technology Diffusion Program 6 12.9 4.2 0.0 0.0 0.0 0.0 0.0 0.0 0.0 0.0
Test-It 6 0.4 0.0 0.0 0.0 0.0 0.0 0.0 0.0 0.0 0.0
PRIME MINISTER AND CABINET
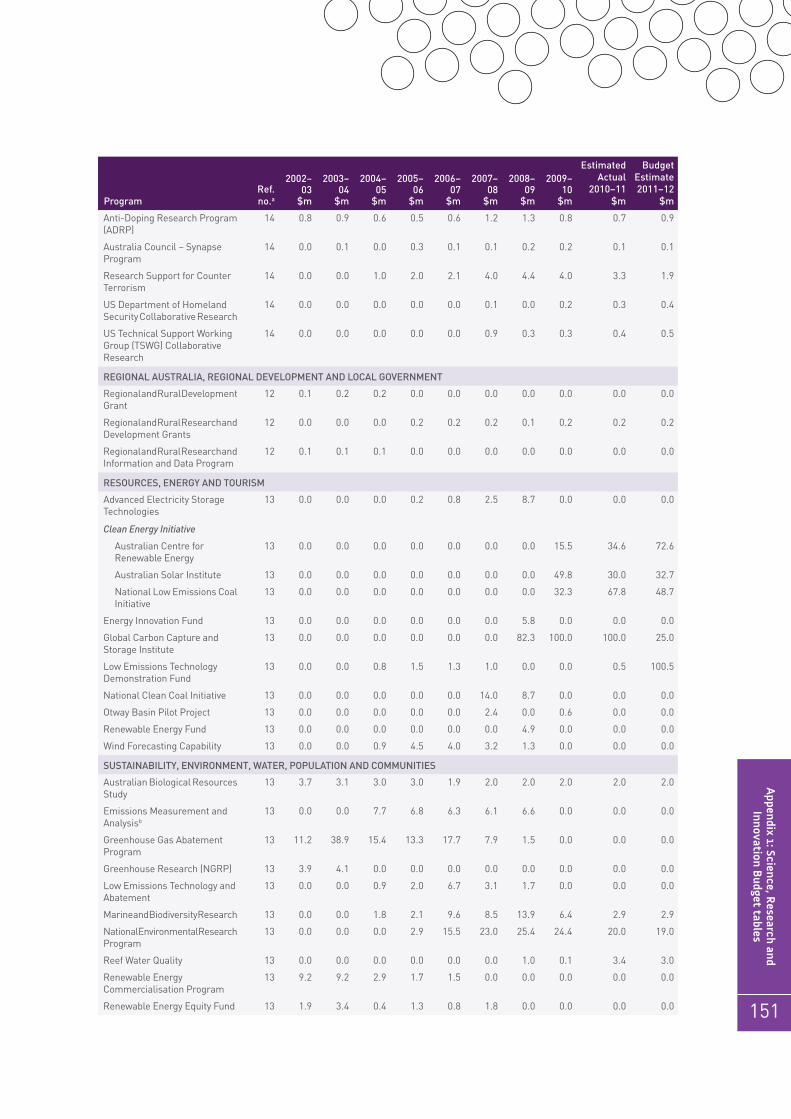
Appendix 1: Science, R
esearch and Innovation B
udget tables
151
ProgramRef. no.a
2002–03
$m
2003–04
$m
2004–05
$m
2005–06
$m
2006–07
$m
2007–08
$m
2008–09
$m
2009–
10$m
Estimated Actual
2010–11$m
Budget Estimate 2011–12
$m
Anti-Doping Research Program (ADRP)
14 0.8 0.9 0.6 0.5 0.6 1.2 1.3 0.8 0.7 0.9
Australia Council – Synapse Program
14 0.0 0.1 0.0 0.3 0.1 0.1 0.2 0.2 0.1 0.1
Research Support for Counter Terrorism
14 0.0 0.0 1.0 2.0 2.1 4.0 4.4 4.0 3.3 1.9
US Department of Homeland Security Collaborative Research
14 0.0 0.0 0.0 0.0 0.0 0.1 0.0 0.2 0.3 0.4
US Technical Support Working Group (TSWG) Collaborative Research
14 0.0 0.0 0.0 0.0 0.0 0.9 0.3 0.3 0.4 0.5
REGIONAL AUSTRALIA, REGIONAL DEVELOPMENT AND LOCAL GOVERNMENT
Regional and Rural Development Grant
12 0.1 0.2 0.2 0.0 0.0 0.0 0.0 0.0 0.0 0.0
Regional and Rural Research and Development Grants
12 0.0 0.0 0.0 0.2 0.2 0.2 0.1 0.2 0.2 0.2
Regional and Rural Research and Information and Data Program
12 0.1 0.1 0.1 0.0 0.0 0.0 0.0 0.0 0.0 0.0
RESOURCES, ENERGY AND TOURISM
Advanced Electricity Storage Technologies
13 0.0 0.0 0.0 0.2 0.8 2.5 8.7 0.0 0.0 0.0
Clean Energy Initiative
Australian Centre for Renewable Energy
13 0.0 0.0 0.0 0.0 0.0 0.0 0.0 15.5 34.6 72.6
Australian Solar Institute 13 0.0 0.0 0.0 0.0 0.0 0.0 0.0 49.8 30.0 32.7
National Low Emissions Coal Initiative
13 0.0 0.0 0.0 0.0 0.0 0.0 0.0 32.3 67.8 48.7
Energy Innovation Fund 13 0.0 0.0 0.0 0.0 0.0 0.0 5.8 0.0 0.0 0.0
Global Carbon Capture and Storage Institute
13 0.0 0.0 0.0 0.0 0.0 0.0 82.3 100.0 100.0 25.0
Low Emissions Technology Demonstration Fund
13 0.0 0.0 0.8 1.5 1.3 1.0 0.0 0.0 0.5 100.5
National Clean Coal Initiative 13 0.0 0.0 0.0 0.0 0.0 14.0 8.7 0.0 0.0 0.0
Otway Basin Pilot Project 13 0.0 0.0 0.0 0.0 0.0 2.4 0.0 0.6 0.0 0.0
Renewable Energy Fund 13 0.0 0.0 0.0 0.0 0.0 0.0 4.9 0.0 0.0 0.0
Wind Forecasting Capability 13 0.0 0.0 0.9 4.5 4.0 3.2 1.3 0.0 0.0 0.0
SUSTAINABILITY, ENVIRONMENT, WATER, POPULATION AND COMMUNITIES
Australian Biological Resources Study
13 3.7 3.1 3.0 3.0 1.9 2.0 2.0 2.0 2.0 2.0
Emissions Measurement and Analysisb
13 0.0 0.0 7.7 6.8 6.3 6.1 6.6 0.0 0.0 0.0
Greenhouse Gas Abatement Program
13 11.2 38.9 15.4 13.3 17.7 7.9 1.5 0.0 0.0 0.0
Greenhouse Research (NGRP) 13 3.9 4.1 0.0 0.0 0.0 0.0 0.0 0.0 0.0 0.0
Low Emissions Technology and Abatement
13 0.0 0.0 0.9 2.0 6.7 3.1 1.7 0.0 0.0 0.0
Marine and Biodiversity Research 13 0.0 0.0 1.8 2.1 9.6 8.5 13.9 6.4 2.9 2.9
National Environmental Research Program
13 0.0 0.0 0.0 2.9 15.5 23.0 25.4 24.4 20.0 19.0
Reef Water Quality 13 0.0 0.0 0.0 0.0 0.0 0.0 1.0 0.1 3.4 3.0
Renewable Energy Commercialisation Program
13 9.2 9.2 2.9 1.7 1.5 0.0 0.0 0.0 0.0 0.0
Renewable Energy Equity Fund 13 1.9 3.4 0.4 1.3 0.8 1.8 0.0 0.0 0.0 0.0

Australian Innovation System
Report 2
011
152
ProgramRef. no.a
2002–03
$m
2003–04
$m
2004–05
$m
2005–06
$m
2006–07
$m
2007–08
$m
2008–09
$m
2009–
10$m
Estimated Actual
2010–11$m
Budget Estimate 2011–12
$m
VETERANS’ AFFAIRS
Australian War Memorial – Official Histories
3 0.0 0.0 0.3 0.3 0.3 0.2 0.2 0.2 0.2 0.0
TOTAL 946.4 1,165.3 1,112.2 1,609.6 1,890.6 1,618.9 1,861.7 2,130.5 2,256.3 2,156.9
Notes:a. The financial information has been supplied and confirmed by the departments and agencies responsible for administering the
programs listed in the Table. Reference numbers in Column 2 reconcile program expenditures with their respective sector aggregates in Table 1. Departmental expenses attributable to the administration of programs are excluded from the data in accordance with the recommendations of the Frascati Manual (2002, OECD).
b. Funding for this item is not reported in 2009-10 as it does not have a separate funding allocation.
c. The Australian Longitudinal Study on Women’s Health was originally funded from within the Women’s Health Program and then through existing resources of the health portfolio until 2003. From 2004 - 05, funding for the study was provided by a new measure called Australian Longitudinal Study on Women’s Health. The $1.7m in 2003-04 includes $0.8m from the Office for the Status of Women. In December 2010 an additional $5.3 million over the next three years in funding was announced to support the Australian Longitudinal Study on Women’s Health that will help continue to build the evidence base on women’s health. The additional funding will enable a new younger cohort of women to be added to the study, providing valuable information on the changes and challenges to women’s health over time across a broader range of age groups.
d. This item includes contributions from the Department of Human Services.
e. Following a review of the comparability of historical data before and after NHMRC’s separation from the Department of Health and Ageing in 2006, NHMRC has revised its reported grant payments to improve the consistency and accuracy of reported payments for health and medical research, as reported in NHMRC’s Annual Report Financial Statements note on ‘Special Accounts’ net of GST.
f. From 1 July 2004, funding for Biotechnology Innovation Fund, R&D Start Grants and part of the IAP - Industry were combined with the new Commercial Ready funding to form a single program.
g. Programs provide support for commercialisation activities, including proof of concept activities.
h. The National Collaborative Research Infrastructure Strategy (NCRIS) Program is a successor to the Major National Research Facilities (MNRF).
i. The National Collaborative Research Infrastructure Strategy (NCRIS) Program is a successor to the Systemic Infrastructure Initiative.

Appendix 1: Science, R
esearch and Innovation B
udget tables
153
Table 4: R&D Granting Programs and other support for science, research and innovation through special appropriations and other measuresa
ProgramRef. no.a
2002–03
$m
2003–04
$m
2004–05
$m
2005–06
$m
2006–07
$m
2007–08
$m
2008–09
$m
2009–
10$m
Estimated Actual
2010–11$m
Budget Estimate 2011–12
$m
AGRICULTURE, FISHERIES AND FORESTRYb
Dairy Australia Limited 12 0.0 15.4 14.5 15.4 16.0 18.3 19.2 19.6 22.0 17.6
Fishing Industry Research 12 25.5 27.9 31.7 32.8 28.0 14.9 21.4 16.3 17.1 16.3
Grains 12 39.2 39.2 35.1 35.1 35.8 37.5 42.2 50.1 61.1 55.6
Horticulture Research 12 30.2 30.0 30.0 32.9 34.0 36.2 32.4 40.2 44.8 41.0
Meat Research 12 26.3 28.5 35.6 36.3 37.6 45.0 42.8 42.0 56.9 46.7
Other Rural Research 12 40.1 41.9 37.7 37.8 47.6 50.8 45.9 22.3 28.6 26.2
Wool Research 12 16.2 16.2 13.7 16.2 11.6 12.1 12.2 10.3 10.8 11.3
ATTORNEY-GENERAL
Australian Institute of Criminology – Criminology Research Grant Programc
9 0.4 0.6 0.6 0.6 0.6 0.6 0.5 0.5 0.4 0.5
EDUCATION, EMPLOYMENT AND WORKPLACE RELATIONS
Estimate of Other Research and Research Training Support Sourced from the Australian Governmentd
9 434.3 434.7 0.0 0.0 0.0 0.0 0.0 0.0 0.0 0.0
National Institutes Program – ANU Componente
8 150.7 150.3 154.9 160.7 166.6 167.7 167.5 171.1 174.2 178.9
HEALTH AND AGEING
Health and Hospitals Fund 10 0.0 0.0 0.0 0.0 0.0 0.0 105.8 25.0 163.3 291.9
INNOVATION, INDUSTRY, SCIENCE AND RESEARCH
Australian Research Council 7 298.3 399.6 480.9 544.4 570.3 571.8 585.9 652.8 708.7 810.2
Clean Energy Initiative 13 0.0 0.0 0.0 0.0 0.0 0.0 0.0 0.0 0.0 100.0
Education Investment Fund – Super Science
Super Science – Future Industriesf
14 0.0 0.0 0.0 0.0 0.0 0.0 10.0 109.0 119.0 120.5
Super Science – Marine and Climateg
14 0.0 0.0 0.0 0.0 0.0 0.0 8.0 59.0 116.0 114.4
Super Science – Space Science and Astronomy
14 0.0 0.0 0.0 0.0 0.0 0.0 0.0 20.0 20.0 27.5
Education Investment Fund – Round 1
Institute of Photonics 9 0.0 0.0 0.0 0.0 0.0 0.0 0.2 18.6 9.8 0.1
New Horizons – Monash University Project
9 0.0 0.0 0.0 0.0 0.0 0.0 0.4 8.0 11.5 58.0
Education Investment Fund – Round 2
Australian Institute for Innovative Materials
9 0.0 0.0 0.0 0.0 0.0 0.0 0.0 27.8 16.0 0.0
Building the Sydney Institute of Marine Science
9 0.0 0.0 0.0 0.0 0.0 0.0 0.0 10.5 6.0 3.0
Centre for Climate Change and Energy Research
9 0.0 0.0 0.0 0.0 0.0 0.0 0.0 40.0 0.0 0.0
Centre for Neural Engineering
9 0.0 0.0 0.0 0.0 0.0 0.0 0.0 3.9 10.2 3.4
Institute for Marine and Antarctic Studies
9 0.0 0.0 0.0 0.0 0.0 0.0 0.0 45.0 0.0 0.0

Australian Innovation System
Report 2
011
154
ProgramRef. no.a
2002–03
$m
2003–04
$m
2004–05
$m
2005–06
$m
2006–07
$m
2007–08
$m
2008–09
$m
2009–
10$m
Estimated Actual
2010–11$m
Budget Estimate 2011–12
$m
La Trobe Institute for Molecular Sciences
9 0.0 0.0 0.0 0.0 0.0 0.0 0.0 14.4 34.2 15.5
National Centre for Synchrotron Science
9 0.0 0.0 0.0 0.0 0.0 0.0 0.0 18.0 15.8 3.0
Smart State Medical Research Centre
14 0.0 0.0 0.0 0.0 0.0 0.0 0.0 0.0 55.0 0.0
Education Investment Fund – Round 3
AuScope Australian Geophysical Observing System
14 0.0 0.0 0.0 0.0 0.0 0.0 0.0 0.0 7.3 6.8
Australian Future Fibres Research and Innovation Centres
14 0.0 0.0 0.0 0.0 0.0 0.0 0.0 0.0 3.5 15.0
Green Chemical Futures 14 0.0 0.0 0.0 0.0 0.0 0.0 0.0 0.0 0.9 4.3
Indian Ocean Marine Research Centre
14 0.0 0.0 0.0 0.0 0.0 0.0 0.0 0.0 1.5 8.5
National Imaging Facility 14 0.0 0.0 0.0 0.0 0.0 0.0 0.0 0.0 34.6 5.6
The Australian Institute for Nanoscience
14 0.0 0.0 0.0 0.0 0.0 0.0 0.0 0.0 7.1 26.1
Education Investment Fund – Sustainability Round
Newcastle Institute for Energy and Resources
9 0.0 0.0 0.0 0.0 0.0 0.0 0.0 0.0 13.8 12.1
Retrofitting for Resilient and Sustainable Buildings
9 0.0 0.0 0.0 0.0 0.0 0.0 0.0 0.0 10.1 15.0
Sustainable Energy for SKA 14 0.0 0.0 0.0 0.0 0.0 0.0 0.0 0.0 12.7 23.1
Funding for higher education research promotionh
9 2.4 2.4 2.5 2.2 2.2 3.5 5.6 5.7 5.3 5.5
Funding for research and research training provided under HESA (2003)
Australian Postgraduate Awards
9 87.1 89.5 91.2 93.1 94.1 96.6 101.4 151.1 183.0 218.9
Commercialisation Training Scheme
9 0.0 0.0 0.0 0.4 5.5 5.5 5.5 5.6 5.7 2.9
Institutional Grants Scheme 8 286.4 285.2 290.6 296.1 302.0 308.1 311.3 157.3 0.0 0.0
International Postgraduate Research Scholarship
9 16.7 17.8 18.1 18.5 18.4 19.2 19.4 19.8 20.2 20.7
Joint Research Engagement Program
9 0.0 0.0 0.0 0.0 0.0 0.0 0.0 160.6 323.7 332.5
Regional Protection Scheme 8 3.2 5.8 3.0 3.1 6.2 3.2 1.6 0.0 0.0 0.0
Research Infrastructure Block Grants
8 136.7 160.6 183.0 199.9 203.9 206.0 210.2 214.6 218.5 224.5
Research Training Scheme 8 528.0 541.9 552.2 562.6 573.9 585.4 591.5 603.9 615.1 631.8
Sustainable Research Excellence in Universities
9 0.0 0.0 0.0 0.0 0.0 0.0 0.0 30.0 121.0 165.2
Systemic Infrastructure Initiativei
8 28.4 71.4 39.9 48.7 29.7 0.0 0.0 0.0 0.0 0.0
Giant Magellan Telescope 14 0.0 0.0 0.0 0.0 0.0 0.0 0.0 24.6 19.4 15.1
Mount Stromlo Observatory Reconstruction
9 0.0 7.3 0.0 0.0 0.0 0.0 0.0 0.0 0.0 0.0
Support from the Federation Fund

Appendix 1: Science, R
esearch and Innovation B
udget tables
155
ProgramRef. no.a
2002–03
$m
2003–04
$m
2004–05
$m
2005–06
$m
2006–07
$m
2007–08
$m
2008–09
$m
2009–
10$m
Estimated Actual
2010–11$m
Budget Estimate 2011–12
$m
Commonwealth Technology Port
6 8.0 0.0 0.0 0.0 0.0 0.0 0.0 0.0 0.0 0.0
Institute of Molecular Bioscience
9 0.5 0.0 0.0 0.0 0.0 0.0 0.0 0.0 0.0 0.0
National Marine Science Centre
9 0.1 0.0 0.0 0.0 0.0 0.0 0.0 0.0 0.0 0.0
Tax incentives programs j
Early Stage Venture Capital Limited Partnershipsk
6 0.0 0.0 0.0 0.0 0.0 1.0 5.0 9.0 15.0 18.0
New R&D Tax Incentives – refundablel
4 0.0 0.0 0.0 0.0 0.0 0.0 0.0 0.0 900.0 1,210.0
New R&D Tax Incentives – non refundable
4 0.0 0.0 0.0 0.0 0.0 0.0 0.0 0.0 750.0 790.0
Pooled Development Fundsj 6 7.0 9.0 7.0 9.0 12.0 11.0 10.0 9.0 8.0 7.0
Premium Tax Concession for Additional R&D (175%)m
4 85.0 100.0 130.0 225.0 290.0 300.0 370.0 470.0 130.0 60.0
R&D Refundable Tax Offsetl 4 182.0 235.0 229.0 242.0 235.0 206.0 339.0 567.0 0.0 0.0
R&D Tax Concession – interim transition measure
4 0.0 0.0 0.0 0.0 0.0 0.0 0.0 41.0 0.0 0.0
R&D Tax Concession (125%) 4 320.0 330.0 370.0 400.0 435.0 590.0 725.0 635.0 -75.0 -290.0
Venture Capital Limited Partnershipsk
6 3.0 35.0 9.0 10.0 10.0 11.0 11.0 11.0 11.0 11.0
SUSTAINABILITY, ENVIRONMENT, WATER, POPULATION AND COMMUNITIES
National Oceans Officen 14 3.9 1.3 2.1 0.0 0.0 0.0 0.0 0.0 0.0 0.0
VETERANS’ AFFAIRS
Australian Centre for Post-Traumatic Mental Health
9 0.0 0.0 0.0 0.0 0.0 0.0 0.0 0.0 0.0 0.9
Centre for Military and Veterans’ Health
9 0.0 0.0 0.0 0.0 0.0 0.0 0.0 0.0 0.0 0.3
Department of Veterans’ Affairs Applied Research Program
9 0.0 0.0 0.0 0.0 0.0 0.0 0.0 0.0 2.0 2.0
Family Study Research 9 0.0 0.0 0.0 0.0 0.0 0.0 0.0 0.0 0.0 1.1
TOTAL 2,759.6 3,076.5 2,762.4 3,022.9 3,166.1 3,301.4 3,800.9 4,539.6 5,045.7 5,485.2
Notes:a. The financial information has been provided and confirmed by the departments responsible for administering the programs listed in the
table. Reference numbers in Column 2 reconcile program expenditures with their respective sector aggregates in Table 1. Departmental expenses attributable to the administration of programs are excluded from the data in accordance with the recommendations of the Frascati Manual (2002, OECD).
b. The R&D expenditures for wool, meat, other rural research, fish, horticulture and grains sectors exclude that component of Australian Government outlays funded from industry levies. Industry Contributions - Rural Research Levies (estimated proportion of levies attributable to research purposes – $m) are presented in the table below.
c. Prior to 2011–12, this program was funded from Budget appropriations.
d. Following the 2002 Review of Higher Education, the Australian Government announced a package of new higher education policies, to be implemented between 2004 and 2008. The legislation to give effect to the reform package, the Higher Education Support Act 2003 (HESA), was passed by Parliament on 5 December 2003. As a result, this estimate is no longer consistent with the implementation of the new funding arrangements for higher education institutions under the provisions of the HESA and has not been included from 2004–05 onwards.
e. This item refers to funds for research and research training provided to the Institute of Advanced Studies (IAS) of the Australian National University (ANU) through the ANU’s operating grant. This was initially referred to as the ANU Institute of Advanced Studies Block Funding. The name has been updated to reflect the current DEEWR program name.
f. This includes funding for nuclear science facilities which are the responsibility of the Australian Nuclear Science Techology Organisation.
g. This includes funding for tropical marine research facilities which are the responsibility of the Australian Institute of Marine Science, as well as funding for the replacement of the National Marine Research Facility, which is the responsibility of CSIRO.
h. Includes all supplementary funding to the Learned Academies.
i. The Systemic Infrastructure Initiative has been replaced by the National Collaborative Research Infrastructure Strategy. For an explanation on the disaggregation of the Research Infrastructure Block Grants program and the Research Training Scheme reported in this table, see notes on p.37, Portfolio Budget Statements 2008–09 – Budget Related Paper No. 1.14 – Innovation, Industry, Science & Research Portfolio.

Australian Innovation System
Report 2
011
156
j. This data is based on estimates of revenue forgone as published in the Taxation Expenditures Statement 2010 (TES) and earlier issues. The TES estimates, particularly in later years, are revised each year as more data come to hand. Thus, the series here will be revised in the future. The data relates to the financial year when companies undertake the activity for which they subsequently claim a concession or deduction, i.e. they are the estimated costs to revenue that would have occurred if companies had made the tax claim in the same financial year in which the expenditure was incurred. Thus, the data presented in this table are brought forward by one year with respect to that published in the TES, since the TES data series reports data in the year in which revenue is forgone by the Government (normally, the year after expenditure is undertaken by companies). This will bring the time series into alignment with (1) business expenditure on R&D as reported by the Australian Bureau of Statistics, (2) R&D expenditure data as reported by companies registered for the 125% rate, and (3) times series for R&D program data in Tables 2 and 3 above.
k. The PDF,VCLP and ESVCLP programs are venture capital tax concession programs. The funds are registered under the respective legislation and the fund manager has responsibility for raising funds from the capital markets (both domestic and overseas). These fund managers use commercial decisions to make eligible investments – normally to Australian investee companies. The investments are normally held for several years and depending on the program and the sale of investments can result in profits being made. Any associated returns for profits are reflected in either the PDF being provided with concessional tax rate of 15% tax rate or there is flow through tax treatment of the ESVCLP/VCLP to the respective manager and the fund manager is taxed on capital account. Caution needs to be exercised when analysing these figures with investments made by PDFs in any given year.
l. Treasury has advised that ‘...the calculation of the R&D Tax Offset given in the table is the sum of the ATO’s administered payments for the Offset and the calculation of the tax expenditure in the 2010 Tax Expenditure Statement produced by the Treasury. This calculation is only a proxy for the benefit provided to taxpayers by this measure rather than an exact representation. An exact calculation cannot be constructed as taxpayers future tax positions cannot be calculated at this point. The future tax positions is integral to calculating the value of deductions forgone by receiving the Offset.’
m. Supplementing the pre-existing 125% tax concession for Industrial R&D and with effect from 1 July 2001. A 175% incremental (Premium) R&D Tax Concession for companies undertaking additional R&D was introduced.
n. This program has been administered as part of the Marine Research program since 2004–05.
Industry Contributions – Rural Research Levies
SECTOR
2002–03
$m
2003–04
$m
2004–05
$m
2005–06
$m
2006–07
$m
2007–08
$m
2008–09
$m
2009–10
$m
Estimated Actual
2010–11$m
Budget Estimate 2011–12
$m
Fish 5.0 6.1 2.0 5.7 5.7 0.8 0.2 0.8 0.2 0.2
Grains
Wheat 39.4 41.4 41.5 41.5 27.6 40.4 31.1 45.2 46.3 49.2
Other Grains 25.6 28.2 25.7 25.9 23.2 36.4 30.8 30.2 36.4 35.6
Horticulture 22.4 25.3 26.5 26.5 16.8 18.8 18.7 21.4 21.5 20.1
Meat 19.4 20.5 21.1 21.8 22.1 30.6 34.8 35.5 36.2 35.2
Wool 62.6 40.4 40.4 42.0 46.5 45.1 41.7 35.3 40.5 42.5
Other Rural Research
Chicken Meat 1.1 1.1 1.1 1.1 1.4 1.0 1.1 1.5 1.3 1.3
Cotton 7.2 3.4 3.5 4.1 4.2 2.0 2.2 3.4 6.2 7.3
Dairying 12.9 16.3 31.0 31.0 31.0 28.0 27.3 28.3 29.5 28.7
Dried Fruita 0.6 0.0 0.0 0.0 0.0 0.0 0.0 0.0 0.0 0.0
Egg Industry 0.5 5.3 4.4 4.4 4.1 0.8 0.9 1.1 1.5 2.1
Forestry 3.0 3.8 3.8 3.8 3.6 4.6 5.2 5.1 5.5 5.2
Grape and Wine 7.8 7.7 7.9 7.9 13.2 9.9 12.5 12.1 12.8 11.9
Honey 0.2 0.2 0.2 0.2 0.5 0.3 0.3 0.4 0.3 0.3
Pig Industry 13.3 13.3 13.5 13.5 12.1 3.2 4.0 3.7 4.7 4.9
Sugar 5.3 5.5 5.5 5.5 5.1 4.8 4.5 4.1 3.8 3.8
Rural Industries R&D Corporation 0.0 0.0 2.6 3.0 4.9 0.8 0.4 1.8 2.4 4.2
TOTAL 226.3 218.5 230.8 237.9 222.0 227.4 215.8 230.0 249.0 252.6
Notes:a. This levy is now combined with the Horticulture levy.

Appendix 1: Science, R
esearch and Innovation B
udget tables
157
Table 5: Australian government support for science, research and innovation by socio-economic objectivea
Socio-economic objective b,c
2002–03
$m
2003–04
$m
2004–05
$m
2005–06
$m
2006–
07$m
2007–08
$m
2008–
09$m
2009–
10$m
Estimated Actual
2010–11$m
Budget Estimate 2011–12
$m
% of 2011–12 Expend-
iture%
Exploration and exploitation of the earth
299.6 317.6 330.8 354.6 385.9 419.6 439.2 534.2 472.1 496.6 5.3
Environment 141.0 188.1 172.5 184.4 205.7 233.1 234.5 387.8 397.7 395.1 4.2
Exploration and exploitation of space
4.7 5.7 5.1 4.9 4.7 4.8 6.2 53.8 48.3 46.7 0.5
Transport, telecommunication and other infrastructure
71.6 89.8 103.4 118.8 121.5 126.6 141.1 193.0 308.2 345.3 3.7
Energy 120.4 133.0 151.1 191.6 213.5 255.8 385.2 463.7 510.8 544.4 5.8
Industrial production and technology
1,090.0 1,260.1 1,235.0 1,353.6 1,446.6 1,583.6 1,698.1 1,956.8 1,790.3 1,923.0 20.5
Health 408.7 511.2 521.9 833.3 1,123.3 833.6 1,148.3 1,138.0 1,484.1 1,627.4 17.3
Agriculture 377.5 436.6 444.8 480.1 491.6 514.6 535.0 553.5 602.8 552.7 5.9
Educationd 10.6 13.9 15.9 16.6 17.5 19.3 20.4 21.4 23.2 27.0 0.3
Culture, recreation, religion and mass mediad
77.7 72.7 72.5 86.3 107.9 121.1 148.5 184.3 93.2 104.5 1.1
Political and social systems, structures and processesd
88.7 106.1 121.5 128.1 132.3 149.2 179.4 229.9 267.3 315.5 3.4
General advancement of knowledge: R&D financed from General University Funds (GUF)
1,520.8 1,606.9 1,178.0 1,347.5 1,233.8 1,224.0 1,240.9 1,342.9 1,542.2 1,607.1 17.1
General advancement of knowledge: R&D financed from other sources than GUF
448.2 611.6 553.8 558.9 628.8 617.9 652.7 828.5 1,029.6 905.1 9.6
Defence 307.7 320.3 344.4 384.4 444.0 445.5 438.6 484.3 507.5 493.6 5.3
TOTAL 4,967.2 5,673.6 5,250.7 6,043.2 6,557.3 6,548.5 7,268.1 8,372.3 9,077.3 9,384.0 100.0
Notesa. Table 5 represents the total Commonwealth support for science, research and innovation through the Budget and other appropriations
allocated by broad socio-economic objective (SEO) categories, classified according to the Nomenclature for the Analysis of Science Budgets (NABS) 2007 SEO classification. The allocation of Budget funds corresponds to the primary intention of the funder. Hence, the allocation according to the SEO categories may vary from that reported in the R&D surveys of the Australian Bureau of Statistics (ABS).
b. The socio-economic objective (SEO) nomenclature is in accordance with the OECD’s Nomenclature for the Analysis and Comparison of Scientific programs and Budgets (NABS) 2007 for reporting Government Budget Appropriations or Outlays on R&D (GBAORD), and reflects the recommendations of the Frascati Manual (6th edition, 2002, OECD).
c. Figures previously reported against the NABS 1992 SEO category of ‘Other civil research’ prior to 2006–07 have been allocated across NABS 2007 categories 01-13.
d. Under the NABS 1992 SEO classification, these socio-economic objectives were combined as ‘Social structures and relationships’.


