28
Australian Pellet Export Outlook David Smith – Senior Executive Forestry Operations
Australian Pellet Export OutlookDavid Smith – Senior Executive Forestry Operations

• Overview of Australia’s potential for Biomass supply
• Australia’s current and proposed Pellet production
• Potential for pellet supply from Existing Plantations & Dedicated short rotation coppice Plantations in South Eastern Australia
PRESENTATIONOVERVIEW

50,000ha
WILLMOTT FORESTSPLANTATION ESTATE

RESOURCEAmount
(Mt/year)
2010 Electricity generation
(MW)
Electricity generation
potential (MW)
BAGASSE 11 250 1,000BLACK LIQUOR 0 50 60FOREST PRODUCTS & RESIDUES 23 NA 1,500MSW / C & I / C & D 33 NA 930AGRICULTURAL CEREAL CROP WASTE 30ENERGY CROPS - OTHER 8
TOTALS 104 300 3,490
• Australia has considerable potential to generate new electricity production from biomass resources
• Most of the potential electricity generation will come from forest products & residues
• Pellet production in the short and medium term will focus on forestry residues, particularly from plantations
AUSTRALIANBIOMASS RESOURCES
Perth
Hobart
Adelaide
Melbourne
Sydney
Darwin
Brisbane
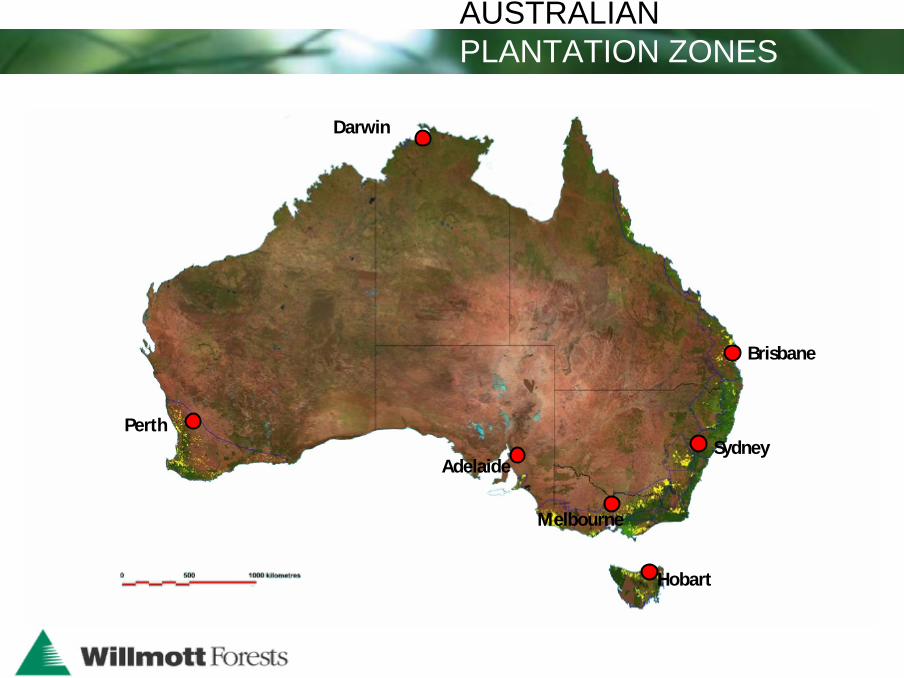
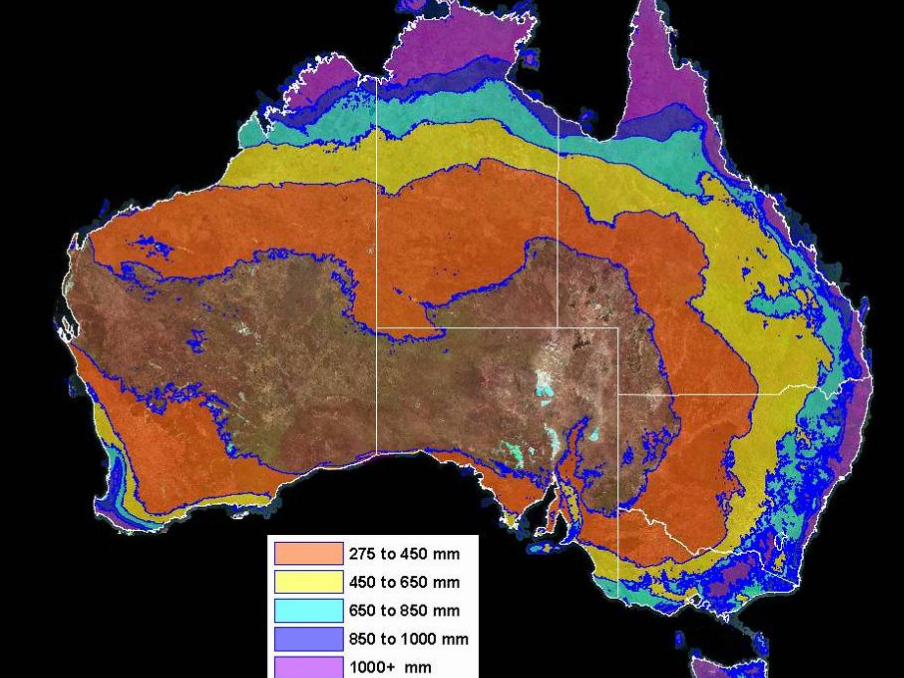
AUSTRALIAN PLANTATION ZONES

Australia has:
• 8 times the arable farmland of the UK
• 10 times the arable farmland of Japan
• 30 times the arable farmland of South Korea
• 62 times the arable farmland area of the Netherlands
CountryTotal Land Area
(km2)
Total arable farmland area
(km2)
% Arable of Total Land
AreaAustralia 7,618,000 468,000 6%United Kingdom 242,000 55,660 23%Netherlands 34,000 7,480 22%Japan 364,485 7,480 12%South Korea 96,920 15,507 16%
AUSTRALIANBIOMASS RESOURCES

• Australia has 163 million hectares of native forest producing 10M m3 of logs per annum
• Australia’s plantation estate comprises 1 million hectares of hardwood plantations and 1 million hectares of softwood plantations
• From this two million hectares of plantation 20 million m3 of logs are produced per annum, increasing to 30 million m3 per annum by 2014
AUSTRALIANFOREST OVERVIEW
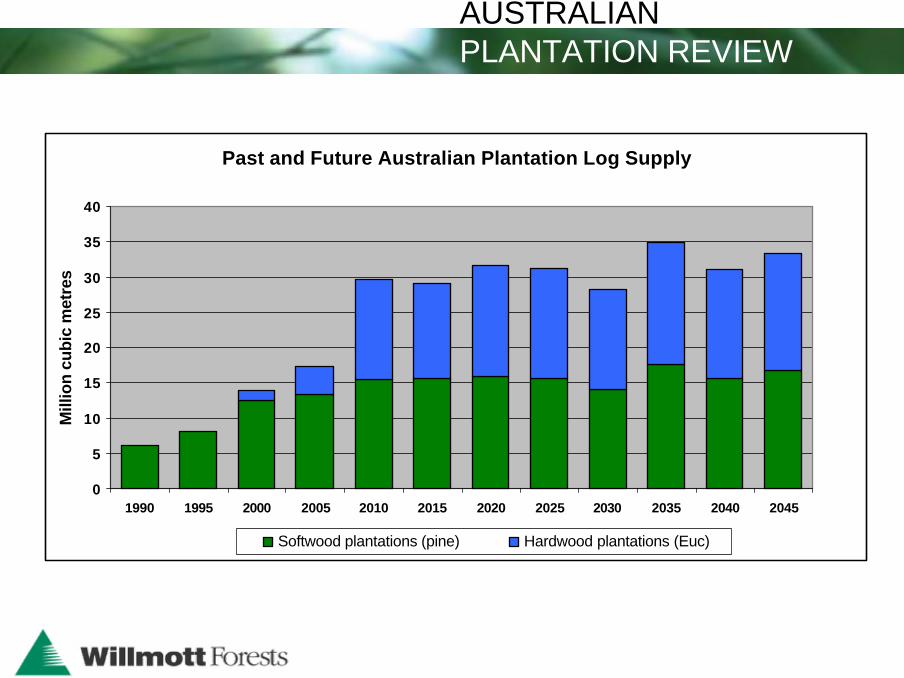
Past and Future Australian Plantation Log Supply
0
5
10
15
20
25
30
35
40
1990 1995 2000 2005 2010 2015 2020 2025 2030 2035 2040 2045
Mill
ion
cubi
c m
etre
s
Softwood plantations (pine) Hardwood plantations (Euc)
AUSTRALIANPLANTATION REVIEW
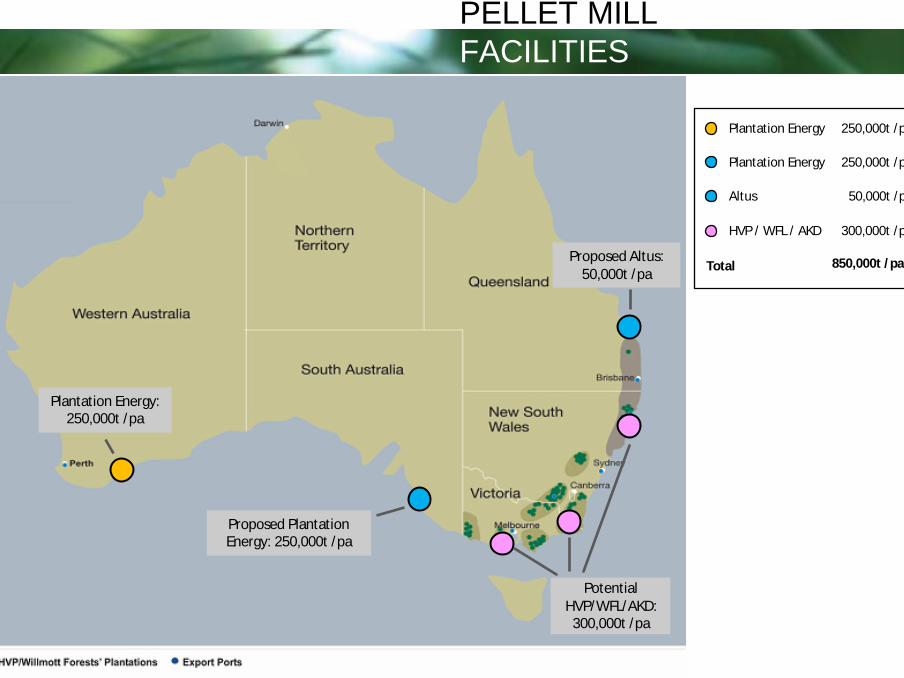
250,000t /pa500,000t /pa550,000t /pa850,000t /pa
Plantation Energy
Plantation Energy: 250,000t /pa
Proposed Plantation Energy: 250,000t /pa
Proposed Altus: 50,000t /pa
Potential HVP/WFL/AKD:
300,000t /pa
250,000t /pa
Plantation Energy 250,000t /pa
Altus 50,000t /pa
HVP / WFL / AKD 300,000t /pa
Total
PELLET MILLFACILITIES

50,000ha
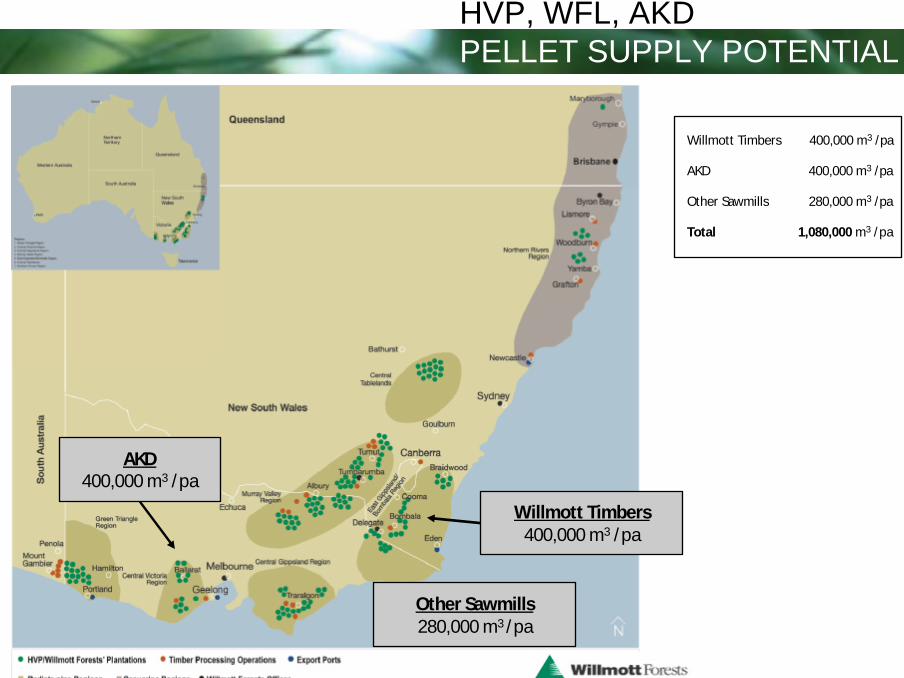
HVP, WFL, AKD PELLET SUPPLY POTENTIAL
Forests NSWSoftwood 231,000haHardwood 54,000ha
Forests NSWSoftwood 231,000haHardwood 54,000ha
Various CompaniesEucalyptus 71,000ha
Various CompaniesEucalyptus 71,000ha
AKDSoftwood 7,000ha
AKDSoftwood 7,000ha
Hancock Victorian PlantationsPine Softwood 136,000haEucalypt 24,000ha
Hancock Victorian PlantationsPine Softwood 136,000haEucalypt 24,000ha
Willmott ForestsPine Softwood 50,000ha
Willmott ForestsPine Softwood 50,000ha
Willmott ForestsBiomass 3,000haWillmott ForestsBiomass 3,000ha
Forests NSW 285,000ha
Various 71,000ha
AKD 7,000ha
HVP 160,000ha
Total
Willmott Softwood 50,000ha
Willmott Biomass 3,000ha
53,000ha213,000ha220,000ha505,000ha576,000ha

50,000ha
HVP, WFL, AKD PELLET SUPPLY POTENTIAL

50,000ha
HVP, WFL, AKD PELLET SUPPLY POTENTIAL
400,000ha
AKD400,000 m3 /pa
AKD400,000 m3 /pa
Other Sawmills280,000 m3 /pa
Other Sawmills280,000 m3 /pa
Willmott Timbers400,000 m3 /pa
Willmott Timbers400,000 m3 /pa
Willmott Timbers 400,000 m3 /pa
AKD 400,000 m3 /pa
Other Sawmills 280,000 m3 /pa
Total 800,000ha1,080,000 m3 /pa
HVP, WFL, AKD PELLET SUPPLY POTENTIAL

HVP, WFL, AKD PELLET SUPPLY POTENTIAL
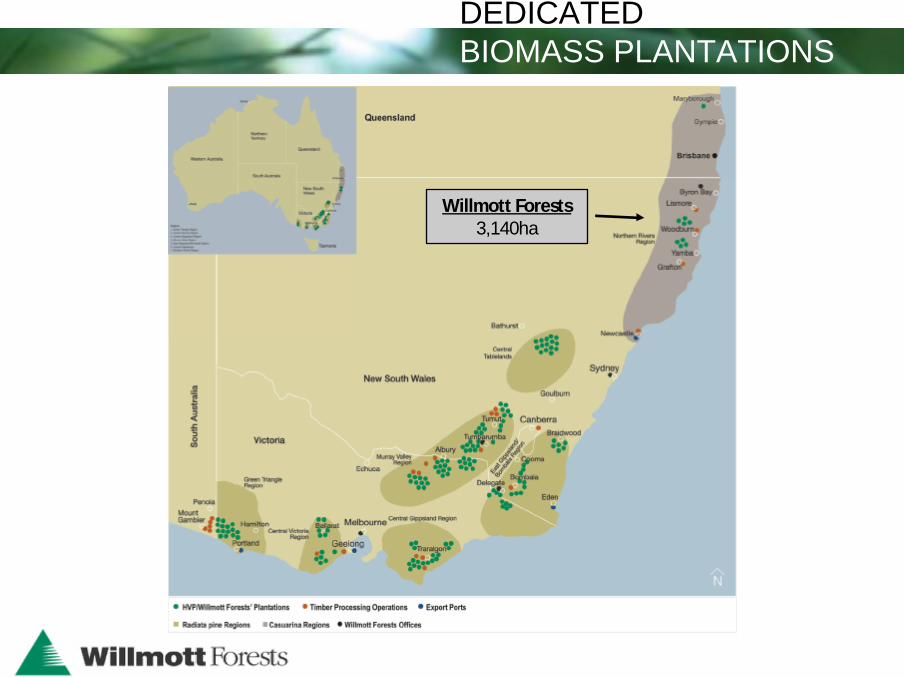
Willmott Forests3,140ha
Willmott Forests3,140ha
DEDICATEDBIOMASS PLANTATIONS
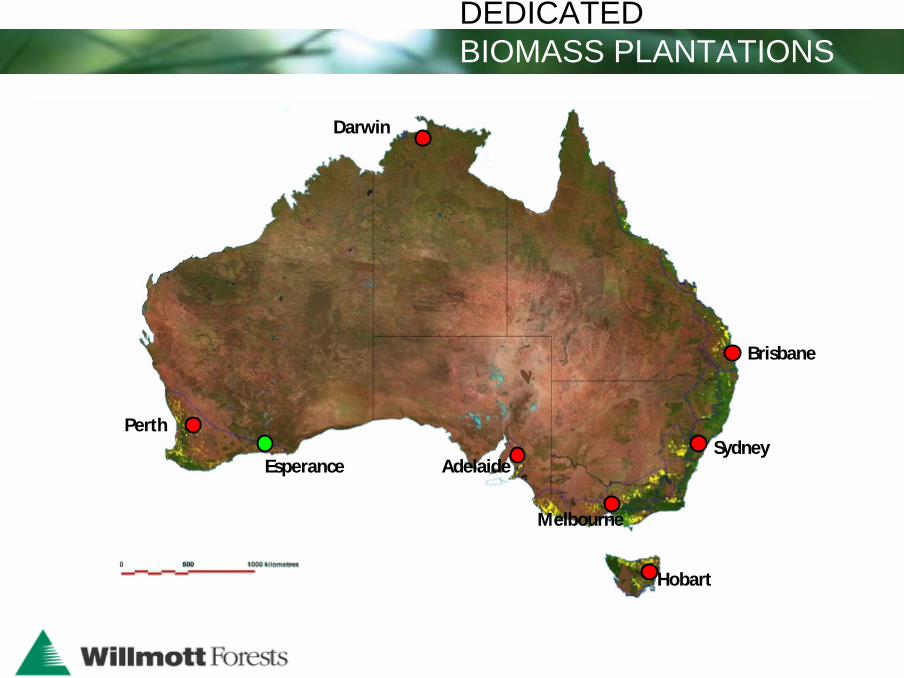
What have we learnt about dedicated biomass plantation development?
• Must be located near processing and/or export ports (eg 50-70km)
• Trade off between land prices and productivity (marginal land better)
• Land needs to be flat and easy to cultivate
DEDICATEDBIOMASS PLANTATIONS

• Scale required: 10,000 to 20,000 hectares depending upon productivity
• Up-front costs offset through tax deductions and carbon off-sets
In short – Australia has significant potential for dedicated biomass plantations
DEDICATEDBIOMASS PLANTATIONS
Perth
Hobart
Adelaide
Melbourne
Sydney
Darwin
Brisbane
Esperance
DEDICATEDBIOMASS PLANTATIONS

EUCALYPTUSCASUARINA
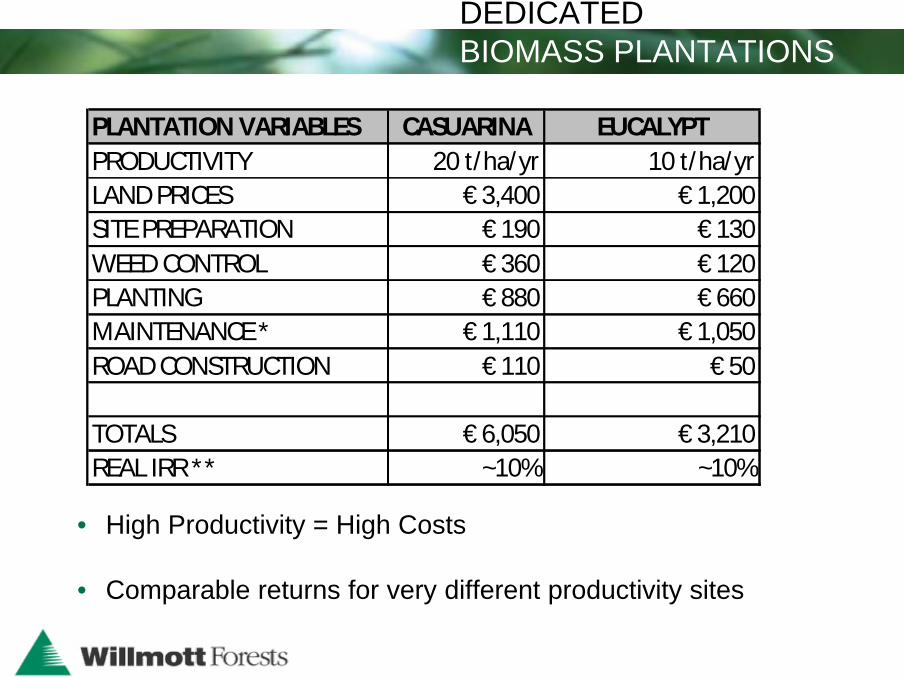
• High Productivity = High Costs
• Comparable returns for very different productivity sites
PLANTATION VARIABLES CASUARINA EUCALYPTPRODUCTIVITY 20 t/ha/yr 10 t/ha/yrLAND PRICES € 3,400 € 1,200SITE PREPARATION € 190 € 130WEED CONTROL € 360 € 120PLANTING € 880 € 660MAINTENANCE * € 1,110 € 1,050ROAD CONSTRUCTION € 110 € 50
TOTALS € 6,050 € 3,210REAL IRR ** ~10% ~10%
DEDICATEDBIOMASS PLANTATIONS
DEDICATEDBIOMASS PLANTATIONS
• Australian pellet production still in its infancy – 125,000 t/pa at present
• A further 850,000 t/pa of pellet production being assessed
• Currently minimal domestic pellet demand with production focused on export
• Potential for European / Asian purchasers to deal directly with large plantation owners
• Large potential for dedicated biomass plantation development
SUMMARY
David Smith – Senior Executive Forestry Operations
Ph: +61 3 9696 1355
Mob: +61 418 332 780

David Smith – Senior Executive Forestry Operations
Ph: +61 3 9696 1355
Mob: +61 418 332 780
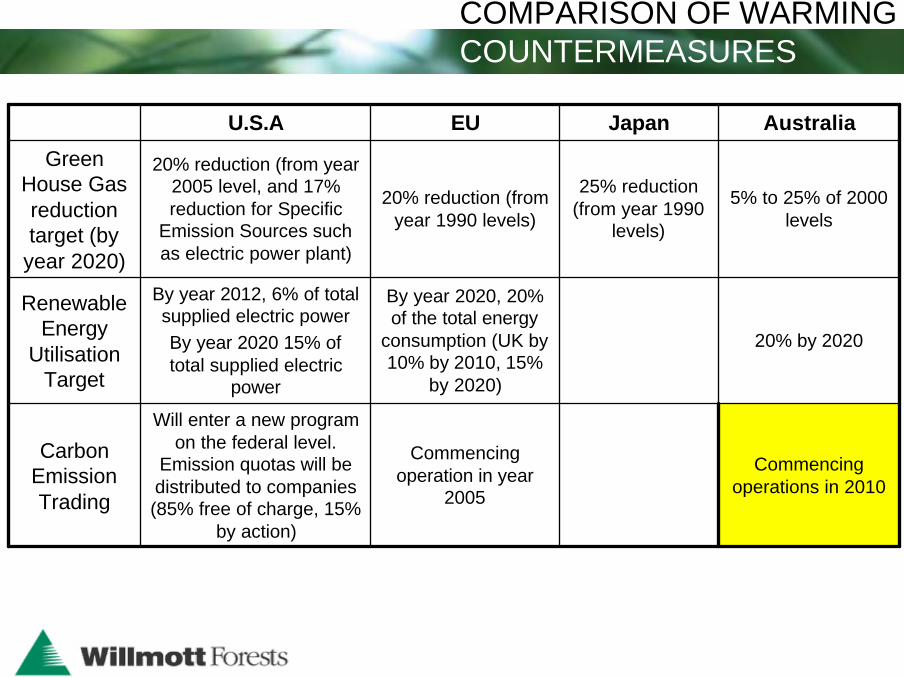
U.S.A EU Japan Australia
Green House Gas reduction target (by
year 2020)
20% reduction (from year 2005 level, and 17% reduction for Specific
Emission Sources such as electric power plant)
20% reduction (from year 1990 levels)
25% reduction (from year 1990
levels)
5% to 25% of 2000 levels
Renewable Energy
Utilisation Target
By year 2012, 6% of total supplied electric powerBy year 2020 15% of total supplied electric
power
By year 2020, 20% of the total energy
consumption (UK by 10% by 2010, 15%
by 2020)
20% by 2020
Carbon Emission Trading
Will enter a new program on the federal level.
Emission quotas will be distributed to companies (85% free of charge, 15%
by action)
Commencing operation in year
2005
Commencing operations in 2010
COMPARISON OF WARMINGCOUNTERMEASURES
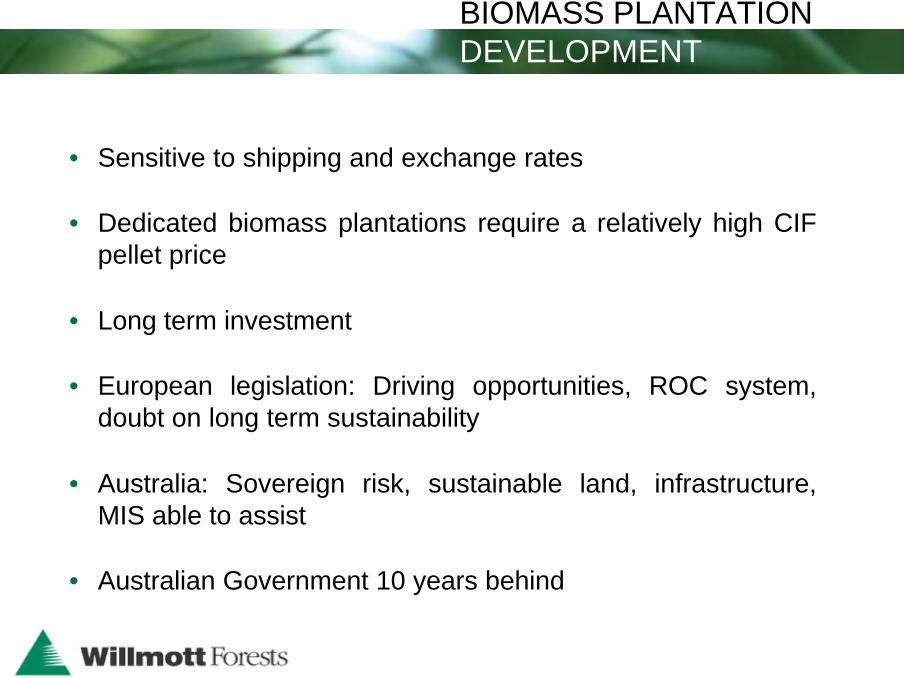
• Sensitive to shipping and exchange rates
• Dedicated biomass plantations require a relatively high CIF pellet price
• Long term investment
• European legislation: Driving opportunities, ROC system, doubt on long term sustainability
• Australia: Sovereign risk, sustainable land, infrastructure, MIS able to assist
• Australian Government 10 years behind
BIOMASS PLANTATIONDEVELOPMENT
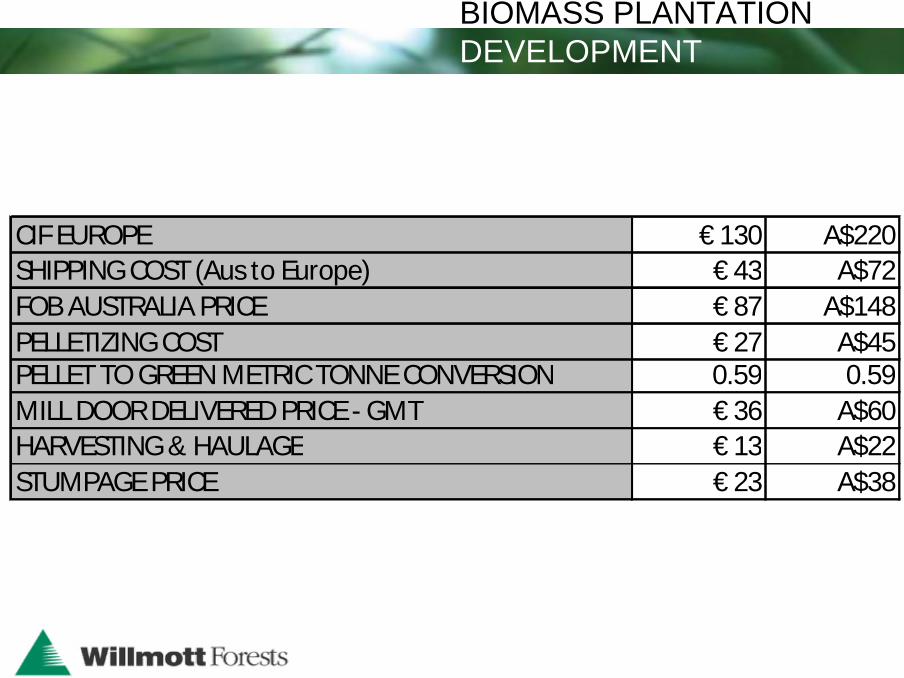
CIF EUROPE € 130 A$220SHIPPING COST (Aus to Europe) € 43 A$72FOB AUSTRALIA PRICE € 87 A$148PELLETIZING COST € 27 A$45PELLET TO GREEN METRIC TONNE CONVERSION 0.59 0.59MILL DOOR DELIVERED PRICE - GMT € 36 A$60HARVESTING & HAULAGE € 13 A$22STUMPAGE PRICE € 23 A$38
BIOMASS PLANTATIONDEVELOPMENT


