81
Australian Pharmaceutical Industries Limited 2010 Annual Report For the year ended 31 August 2010

Australian Pharmaceutical Industries Limited 2010 Annual Report
For the year ended 31 August 2010

� ��
� � � �
� �
� � � �
� �
� �
Australian Pharmaceutical
Industries Limited
ABN 57 000 004 320
11 Grand Avenue
Camellia, New South Wales 2142
885 Mountain Highway
Bayswater, Victoria 3153
www.api.net.au

On 19th April 2010 API turned one
hundred, celebrating a century
of supporting and promoting
health, beauty and community.
API’s story is one of change and
growth, but with a continued
underlying theme of being
focused on the consumer.
The original Managing Director
and Chairman, David J Williams,
founded API in 1910, (then known
as the Chemists’ Co-operative
Company of New South Wales
Limited), based on the goal of
creating a consumer demand.
The story unfolds as follows...
The RIch TAPesTRy of ouR hIsToRy
One evening, one hundred years ago, three pharmacists
sat down to a friendly game of cards. In the course of
conversation, David Williams shared with his fellow
pharmacists that a supplier had offered him a significant
discount if he purchased a high volume product in a
quantity that was somewhat larger than usual. His colleagues
Edgar Schofield and James Constable were immediately
interested and each provided Williams with five pounds to
purchase any other equally appealing offer on their behalf.
The success of this
initial transaction
excited the
interest of other
pharmacists,
and the buying
group grew, until
eventually it was
realised that a
proper organisation
was needed to
handle the growing
business. Through
a local Sydney
publication, the
Pharmaceutical Press, pharmacists were invited to attend
a meeting on 22nd February 1910 to discuss the idea of
forming and promoting a cooperative society. The two
principles of the association were to:
• buy goods for members at the maximum discount, and
• promote a series of proprietary medicines that members
could recommend, and so create consumer demand.
A General Meeting led to the decision to register the
association as a limited liability Company on 19th April 1910.
The Company was called ‘the Chemists’ Co-operative
Company of New South Wales Limited’.
Over the years the Chemists’
Co-operative Company of
New South Wales Limited went
through two name changes,
to The Wholesale Drug
Company Limited in August
1922, and on 8th September
1971 a further change to
Australian Pharmaceutical
Industries Limited.
It was in the 1980s that API
moved into pharmacy banner
brands including API Health
Care, Value Plus (NSW), Green
Spot (QLD) and Thrift Chemists.
The 1990s were a time of
considerable growth and
change for API with a number of development strategies
being implemented in the later part of the decade, including
the commencement of the Pharmacist Advice and
Chemworld Chemist banner groups, and the 1997 listing on
the Australian Stock Exchange. In 1998, API reached the
significant milestone of $1billion in revenue after 88 years of
trading. This continued positive trend in growth led to the
geographical expansion of operations into South Australia,
and Western Australia, creating a truly national business.
In the twenty-first century,
changes within the pharmacy
industry propelled API to
further focus on the needs of
consumers and patients, and
following a number of brand
acquisitions, API evolved from
a pure wholesaler to a health,
beauty and lifestyle company.
These acquisitions included
the Soul Pattinson Chemist
brand in 2000; Hospital
Supplies of Australia (HSA) in 2001; and the Zuellig Pharma
brands which included Propharma, Halas Dental and PSM
Manufacturing, with
facilities in New Zealand
in 2002. As part of a
strategy to become
more focused on the
consumer, New Price
Retail was acquired in
2004. New Price Retail
owned the brands of
Priceline, Priceline
Pharmacy, Price
Attack and House.
1910 — 2010
API Celebrates its Centenary
API founder and original
Managing Director, David
J Williams
A pharmacy in the early 1900s
Thrift Chemist pharmacist and
pharmacy assistant in the 1980s
The shopfront of Soul Pattinson Chemist in
the Pitt St mall in the late 1800s
John Matthews, API Chairman in
1997, opens the new Distribution
Centre in South Australia with
Deputy Premier, Graham
Ingerson
The Uhlmann B1240 blistering machine
packing over-the-counter products at
API Consumer Brands in Auckland, New
Zealand

ABN 57 000 004 320 Australian Pharmaceutical Industries Limited
Over the last few years, API has concentrated its focus on
health and beauty, and sold a number of non-core assets.
In 2005, API sold Propharma and Halas Dental, and also
transferred HSA into the CH2 (Clifford Hallam) joint venture in
which API has a 45.3% shareholding. This was followed by the
sale of Price Attack and House in 2007, and the integration of
the Chemworld Chemist banner into other pharmacy brands.
Continuing the focus on health, in 2007 a strategic alliance
was created between API and Australia’s market leading
generic medicines manufacturer, Alphapharm. This
arrangement provides API’s customers with the most
comprehensive and competitive generics offer in the fastest
growing segment of the pharmaceutical market.
In 2008, after 26 years, Priceline had grown to over 290
stores, of which more than 100 were Priceline Pharmacies.
The brand had established a strong reputation in the
beauty market with its core categories being colour
cosmetics (in which the brand had established itself as a
national leader), hair care and skin care. In addition to
Priceline’s continued success in the beauty segment, the
brand also recognised the continued growth of Priceline
Pharmacy, and sought to capitalise on the integration of
health through its pharmacy stores.
Following extensive research, Priceline began to reposition
the brand. From this research, it was evident Priceline’s
target market was women, and the brand implemented a
number of changes to support this direction. Key initiatives
to attract Priceline’s target customer included:
• changing the look and feel of stores, with pink replacing
red as the store’s main colour
• focused merchandise ranges to support the health and
beauty focus
• changes to marketing and in-store layouts.
These changes represent a health and beauty brand for
the future and Priceline continues to conduct research and
refine the offer to capitalise on the brand’s unique position
in the market.
In 2009, API made some significant changes to the supply
chain that supports distribution of products into pharmacies
and Priceline stores across the country. Integration of the
wholesale and retail supply chains commenced with the
consolidation of the Rowville and Dandenong Distribution
Centres into what is now known as the Melbourne Distribution
Centre located in Dandenong, Victoria. A brand new site
was built in Bundamba, in the Queensland region of Ipswich,
replacing the previous site in Richlands. Both the Dandenong
and Bundamba sites are equipped with state of the art
automated technology that significantly improve API’s
efficiency in delivering products to stores and pharmacies.
API TodAy
One hundred years on, API is one of
Australia’s leading health and beauty
companies with a continued focus on
growth. Current plans include the active
recruitment of new stores to add to our network
and the continued development of Priceline’s incredibly
successful Clubcard program. Clubcard is one of Australia’s
largest customer loyalty programs and continues to go from
strength to strength, with membership now in excess of 3.3
million members.
In our network* we have 331
Priceline stores and pharmacies,
90 Soul Pattinson Chemists,
70 Pharmacist Advice pharmacies
and over 120 members in our API
Member Premium program. API also
has relationships with approximately
4,000 pharmacies across Australia.
As we move into 2011 we complete our centenary year, and
through these growth plans we will continue our journey to be
the leading mass market health and beauty retailer and the
best franchise partner in Australia.
*As at 30 November 2010
ABN 57 000 004 320 Australian Pharmaceutical Industries Limited
Soul Pattinson Chemist in the
Pitt Street mall, Sydney
Pharmacist Advice pharmacy in
Doveton, Victoria
Automated conveyors inside the Brisbane Distribution Centre in Bundamba,Queensland
Priceline store today

Annual Report 2010 1
Contents
1 Chairman’s and CEO’s report 2
2 Directors’ report 4
3 Auditor’s Independence Declaration 20
4 Income statement 21
5 Statement of comprehensive income 22
6 Statement of financial position 23
7 Statement of cash flows 24
8 Statement of changes in equity 25
9 Notes to the consolidated financial statements 26
10 Directors’ declaration 68
11 Independent audit report 69
12 Shareholder information 71
13 Corporate directory 76
The Directors present
their report together with
the financial report of
Australian Pharmaceutical
Industries Limited (‘the
Company’) and of the
consolidated entity, being
the Company and its
controlled entities, for the
year ended 31 August
2010 and the auditor’s
report thereon.

We are delighted to update you on
your Company’s 100th year of
operation, being the 12 months to
31 August 2010. As you may well be
aware API was first established as the
Chemists’ Co-operative Company of
New South Wales Ltd in April 1910.
In recent years, you will recall that we
have reported that your Board and
Management team have:
1. set about rebuilding the business
and returning it to a sustainable
position; and
2. then consolidating operations in
line with the endorsed strategy
oveRvIew
We are pleased to advise shareholders
that the Company has again reported
increased revenue and profit, and
signaled its entry into a focused
growth phase. This comes as we are
positioned to realise unique
opportunities for the Priceline retail
network and potential alliances
through the Clubcard loyalty program.
Importantly, we have confirmed our
status as one of Australia’s leading,
mass market health and beauty
retailers and the country’s leading
pharmaceutical wholesaler.
Over the reporting period, we have
had volatile external market
conditions, an incredibly tight credit
market, and unforeseen and random
events that have occupied
management time. Despite these
factors, we are happy to report
continued growth and improvement in
key business metrics.
For the Group, revenue increased by
4.6% to $3.71 billion and net profit after
tax increased by 23.6% to $22.6 million,
while at the same time we continued
to invest in Revitalise (the Company’s
supply chain initiative), the Priceline
brand and the Clubcard customer
loyalty program.
During the year, the Group’s
securitisation program was
restructured and brought back on
balance sheet. The $300 million
program was reduced to $275 million
and was extended to May 2013. The
$100 million program was reduced to
$70 million and extended to May 2012.
The Board and management team
remain diligent on the consistent
improvement in our Occupational
Health & Safety performance, along
with the community’s expectation in
environmental compliance.
May we also welcome Gerry Masters
as a director to the API Board. Gerry
brings extensive retail experience to
the Board and we are looking forward
to his contribution. Gerry stands for
election at the next Annual General
Meeting.
You will have also noted that your
Directors declared a 1.5 cent fully
franked final dividend for the full year.
This brings the total fully franked
dividend paid for the year to 2.5 cents,
an increase of 25% on last year.
PRIceLIne
The underlying performance of the
retail business unit was reasonable
despite the difficult retail trading
environment. We however, continue to
demonstrate strength in the mass
health and beauty market.
Consumers remain extremely cautious
in their spending patterns, largely
because of increased interest rate
speculation and we have also seen
that the impact of the Government’s
stimulus package has normalized
during the year.
For the year under review, total sales
for the retail business increased by
4.7% on the previous year, while
comparable store growth rose by
1.4%, against sales in the health and
beauty category which nationally
grew by only 1.1% for the year.
Our retail business continues to grow
because of the fundamental strength
of our Priceline Clubcard customer
loyalty program. No other retailer in
our sector has a comparable offering,
with our Clubcard program now
having more than 3.2 million members
with increasing loyalty and sales.
We currently have 331 Priceline stores
across Australia. We opened 24 stores
over the year – 21 of which were new
franchised stores.
Our Clubcard members and our
customers benefit from our consistent
investment in the Priceline brand
through innovative marketing
programs and in-store refurbishments
and upgrades.
Given the soundness of the
Company’s fundamentals it was timely
to initiate a growth strategy that would
focus resources on the Priceline retail
network and our Clubcard customer
loyalty program.
Management has been in formative
discussions with pharmacists around
the country to test an innovative
network development program for
Priceline. Initial signs are encouraging
with a detailed market offer to be
released later this year and an outline
as to its success provided at our next
half year announcement.
We have also received approaches
from leading Australian and
international businesses seeking to
partner with Priceline for the marketing
of appropriate goods and services to
our Clubcard membership base. This
has resulted in us recently signing a
Heads of Agreement with AIA
Insurance, a global provider of
financial services products, to market
to our 3.2 million Clubcard members.
This is an exciting initiative and we
expect to announce additional
partners in coming months.
section 1
Chairman’s and CEO’s Report
Annual Report 2010 Australian Pharmaceutical Industries Limited2

PhARmAcy
The Pharmacy business unit once again
demonstrated its ability to grow
earnings, manage working capital and
produce cash. We are delighted to
continue as the number one
pharmaceutical distributor in the
country.
Revenue growth of 4.7% was recorded
for the year, and deliberate and
planned activity with customers
returned an improved EBIT margin.
In addition, we have seen strong
momentum across our brand offers
with growth in membership numbers,
overall member satisfaction and
performance metrics. Our brands, Soul
Pattinson, Pharmacist Advice and our
Premium Member Program have all
grown their positions through the year,
providing pharmacists with real
choices.
Our partnership with Alphapharm,
Australia’s leading generic
manufacturer and marketer continues
to remain strong with both parties
constructively working together
wherever possible.
The execution of the Fifth Community
Pharmacy Agreement essentially
maintains the status quo in terms of the
viability of the community pharmacy
sector. Importantly, the Community
Service Obligation (CSO) structure
remains in place and the current level
of funding is supported.
The impact of reforms to the
Pharmaceutical Benefits Scheme (PBS)
announced this year is significant.
The Memorandum of Understanding
recently adopted by Government, is
calculated to cost the wholesale sector
in the order of $220 million between
2010-2015. This equates to $8,800 per
pharmacy per year over the five year
term of the agreement.
This level of income recovery for the
wholesale sector is material but
manageable. If the CSO pool is not
supplemented then we will adopt
measures at our disposal including
expense control and discount
reductions for pharmacists. We will work
with our customers through this change
seeking their support and consistent
implementation.
new ZeALAnd
A solid business performance by our
Consumer Brands business in New
Zealand was unfortunately offset by a
number of unforeseen events.
A plant flooding that led to the
temporary closure of the facility, and
changes mandated by Pharmac
through the Medicines & Medical
Devices Safety Authority list, all
combined to a reduction in earnings.
Management must be commended
for it’s handling of these unforeseen
circumstances and the recovery to
normal operations following the plant
closure.
In addition, we are delighted to
continue to work closely with
Blackmores as it’s New Zealand Sales
and marketing agent in growing their
business.
suPPLy chAIn
During the year, we closed our Rowville
and Richlands Distribution Centres
resulting in the consolidation of
distribution into our Melbourne
Distribution Centre, and the opening of
our new Brisbane Distribution Centre.
The changes to our network in satisfying
the potential for our future growth are
extensive and have not been without
impact. We thank all involved and
particularly our customers during the
transition.
LookIng foRwARd
API’s 101st year of operation promises
to be more exciting than any that has
gone before us.
Now that the business is generating
pleasing growth and sustainable profit,
we are poised to realise the savings of
our Revitalise supply chain
transformation. Through Clubcard, we
have an extremely powerful tool to
drive consumer sales and brand
loyalty.
Through our focused, network
development strategy, we can expect
growth in the Priceline pharmacy retail
network. This will drive increased
volume and scale through the business,
inevitably improving outcomes for
customers, suppliers and consumers
alike.
Our ambition is to build on our
reputation for being Australia’s leading,
mass market health and beauty retailer
and the country’s leading
pharmaceutical wholesaler.
In summary, we wish to thank our
Board, executive team and employees
for their continued dedication and
contributions to the success of your
Company.
Peter Robinson
Chairman
stephen Roche
Managing Director/CEO
ABN 57 000 004 320 Australian Pharmaceutical Industries Limited
Annual Report 2010 3
section 1

dIRecToRs
The directors of the Company at any time during or since the end of the financial year are:
section 2
Directors’ report
mr Peter R. Robinson, B.com, fAIcd
Chairman
Non-executive director.
Director since 5 May 2000.
Appointed Chairman 8 July 2003.
Mr Robinson joined Washington H
Soul Pattinson and Company Limited
in 1978 and was appointed a
director of Washington H Soul
Pattinson and Company Limited in
1984. Mr Robinson is also Chairman of
Clover Corporation Limited and a
director of New Hope Corporation
Limited. Mr Robinson resigned as a
director of SP Telemedia Limited in
April 2008.
Mr Robinson is also a non-executive
director of KH Foods Limited -
appointed 2008 (company delisted
2009).
mr Robert d. millner, FAICD
Non-executive director.
Director since 5 May 2000.
Member of the Remuneration
Committee since 2 October 2007.
Mr Millner is the Chairman of
Washington H Soul Pattinson and
Company Limited and has been a
non-executive director of
Washington H Soul Pattinson and
Company Limited since 1984.
Mr Millner is also Chairman of
Brickworks Limited, BKI Investment
Company Limited, Choiseul
Investments Limited, Souls Private
Equity Limited, New Hope
Corporation Limited and Milton
Corporation Limited.
Mr Millner is a director of TGB
Telecom Limited.
The hon dr michael R. wooldridge,
BSc, MBBS, MBA, LLD
Independent non-executive director.
Director since 1 February 2006.
Member of the Remuneration
Committee since 2 October 2007.
Appointed Lead Independent
Director 2 December 2008.
Dr Wooldridge was Australia’s
Federal Minister for Health from 1996
to 2001. Dr Wooldridge is an
Honorary Fellow of the Australasian
Faculty of Public Health Medicine.
Dr Wooldridge is Chairman of Prime
Trust Ltd, and a director of Cogstate
Ltd, and a former director of Dia-B
Tech Limited.
ms e. carol holley, B.A, FCA, FAICD
Independent non-executive director.
Director since 19 December 2006.
Appointed Chair of the Audit and
Risk Committee on 19 December
2006.
Ms Holley is a non-executive director,
Chair of the Audit and Finance
Committee and a member of the
Governance Committee for Job
Futures Ltd. She is also a non-
executive director of Defence
Housing Australia.
Ms Holley is also Chair of the Risk
Management and Audit and Risk
Committees for NSW Department of
Housing, NSW Police and NSW
Department of Planning, Northern
Sydney Central Coast Health and a
member of the Audit and Risk
Committee of the NSW Department
of Human Services .
Ms Holley was a non-executive
director and chair of Resource
Pacific Holdings Ltd until February
2008.
mr stephen P. Roche, B.Bus, GAICD
Executive director.
Managing Director and Chief
Executive Officer since 14 August
2006.
Mr Roche joined API in March 2005.
Previously he was Group General
Manager, Health Services for Mayne
Group Limited with responsibility for
pharmacy distribution, pathology
and other business units. Previous
roles included Chief Operating
Officer, Healthcare Services for FH
Faulding & Co and a number of
management roles at CSR.
mr miles L. hampton, BEc (Hons),
FCIS, FCPA, FAICD
Independent non-executive director.
Director since 7 August 2007.
Member of the Audit and Risk
Committee since 7 August 2007.
Appointed Chair of the
Remuneration Committee on 2
September 2008.
Mr Hampton was previously
Managing Director of publicly listed
Roberts Limited for 20 years prior to
his resignation in 2006, and was
previously a director of Hobart Water
and Impact Fertilisers Pty Ltd.
Mr Hampton is currently a director of
MyState Limited, Tasman Farms
Limited, Forestry Tasmania, and The
Van Diemen’s Land Company.
4 Annual Report 2010 Australian Pharmaceutical Industries Limited

ms Lee Ausburn M.Pharm, B.Pharm,
Dip.Hosp.Pharm, GAICD
Independent non-executive director.
Director since 7 October 2008.
Member of the Audit and Risk
Committee since 7 October 2008.
Ms Ausburn is a pharmacist with
experience in retail and hospital
pharmacy and in academia. She
joined the pharmaceutical industry
with Merck Sharp and Dohme
(Australia) Pty Ltd in 1983 and most
recently was Vice President, Asia, for
Merck and Co Inc with responsibility
for the company’s operations across
Asia.
Ms Ausburn is a board member of the
Clinical Excellence Commission and
Agency for Clinical Innovation, NSW
Health and Vice President, Pharmacy
Faculty Foundation, University of
Sydney.
mr gerard J. masters
Independent non-executive director.
Director since 7 September 2010.
Mr Masters has had extensive
experience in retailing. Until early 2006,
he spent more than 33 years with the
Coles Myer Group. This included a 10
year period as Managing Director of
Bi Lo, Coles and then the total
Supermarkets Group which was Coles
Myer’s largest and most profitable
business. His most recent role until his
resignation in 2009, was as the
Managing Director and CEO of The
Reject Shop Limited.
comPAny secReTARy
Mr Peter Sanguinetti has been
Company Secretary and General
Counsel since November 2007. Mr
Sanguinetti BJuris, LLB, has extensive
experience and was previously
Company Secretary and General
Counsel of Kodak (Australasia) Pty Ltd
for 9 years, responsible for legal and
company secretarial activities for the
Kodak group across Asia. Mr
Sanguinetti was also a non-executive
director of HPAL Limited (listed ASX)
from January 2005 to November 2007.
On 2 June 2009, Ms Genevieve
Browne was appointed an Alternate
Company Secretary. Ms Browne BSc
(Hons), LLB(Hons) is a qualified lawyer
and supports the Company Secretary
as necessary.
section 2
dIRecToRs’ meeTIngs
The number of directors’ meetings (including meetings of committees of directors) and number of meetings attended by
each of the directors of the Company during the period were:
directors’ directors’ Audit and Risk Remuneration
Board meetings committee meetings committee meetings committee meetings
Number Number Number Number Number Number Number Number
Director attended held* attended held* attended held* attended held*
Mr P R Robinson** 19 20 4 6 – – – –
Mr R D Millner 18 20 – – – – 1 2
Dr M R Wooldridge 20 20 4 6 – – 2 2
Ms E C Holley 18 20 6 6 3 4 – –
Mr S P Roche** 19 20 6 6 – – – –
Mr M Hampton 19 20 – – 4 4 2 2
Ms L Ausburn 19 20 – – 4 4 – –
Mr G Masters*** – – – – – – – –
* Number of meetings held during the time the director held office or was a member of the committee during the period.
** All Directors who are not members of Committees are invited to attend Committee Meetings. Mr Robinson and Mr Rocheattended all Audit and Risk and Remuneration Committee meetings by invitation.
*** Appointed 7 September 2010
5Annual Report 2010
ABN 57 000 004 320 Australian Pharmaceutical Industries Limited

section 2
Directors’ report continued
coRPoRATe goveRnAnce
sTATemenT
The Board recognises the importance
of a strong governance framework
and culture throughout the
organisation. During the year ended 31
August 2010, it continued to build on
and enhance the established
corporate governance framework.
The roles and responsibilities of the
Board are set out in the Board Charter.
This is located on the Company’s
website (www.api.net.au). To assist with
the execution of its responsibilities, the
Board has established a Remuneration
Committee and an Audit and Risk
Committee. Both committees have
documented charters, which are also
available through the Company
website.
Under ASX Listing Rules and the ASX
Corporate Governance Council’s
“Principles of Good Corporate
Governance and Best Practice
Recommendations” (the principles)
the consolidated entity is required to
disclose in its annual report the extent
of its compliance with the Principles.
The Directors have implemented
internal control processes for
identifying, evaluating and managing
significant risks to the achievement of
the Company’s objectives. These
internal control processes cover
financial, operating and compliance
risks.
The Directors have received and
considered the annual control
certification by the Chief Executive
Officer and the Chief Financial Officer
in accordance with the Principles
relating to financial and operating risks.
Material associates, which API does
not control, are not dealt with for the
purposes of this statement. Throughout
the reporting period, and at the date
of signing of this annual report the
consolidated entity was in compliance
with the Principles in all material
respects.
Also available on the Company’s
website are the following policies:
• Code of Conduct and Ethics;
• Continuous Disclosure;
• Share Trading;
• Director Nomination, Selection
and Induction; and
• Shareholder Communication
Policy.
The key initiatives completed or in
progress during the current year,
include:
• Financial policies and procedures
are continually reviewed and
updated where appropriate by
management, prior to review and
approval by the Audit and Risk
Committee;
• An employee Code of Conduct
and Ethics is in place and is
available on the Company’s
website. This is planned to be
reviewed over each year, and re-
communicated to all employees;
and
• A broader review of all corporate
governance policies undertaken to
ensure alignment with ASX
Corporate Governance Council
recommendations including the
amendments to the 2nd edition of
the Corporate Governance
Principles and Recommendations
in relation to diversity,
remuneration, trading policies and
briefings which are to apply from 1
January 2011.
The Board has continued the process
of review and renewal including:
• The appointment of Mr Gerard
Masters as an additional Non-
executive independent director;
and
• The Board continues to be
comprised of a majority of
independent directors, the Board
Committees have independent
Chairpersons and a majority of
independent directors.
The Board confirms that the Company
adheres to all of the ASX
Recommendations other than the
Chairman being a director of the
Company’s major shareholder.
BoARd of dIRecToRs
Role of the Board
The Board’s primary role is the
protection and enhancement of long-
term shareholder value.
To fulfil this role, the Board is responsible
for the overall corporate governance
of the consolidated entity including
formulating its strategic direction,
approving and monitoring capital
expenditure, setting remuneration,
appointing, removing and creating
succession policies for directors and
senior executives, establishing and
monitoring the achievement of
management’s goals and ensuring the
integrity of internal control and
management information systems. It is
also responsible for approving and
monitoring financial and other
reporting.
The Board has delegated responsibility
for operation and administration of the
consolidated entity to the Managing
Director and executive management.
Responsibilities are delineated by
formal authority delegations.
Board Processes, including Induction
and contact with the Business
To assist in the execution of its
responsibilities, the Board has
established a Remuneration
Committee and an Audit and Risk
Committee. These committees have
written charters. The Board has also
established a framework for the
management of the consolidated
entity including a system of internal
control, a business risk management
process and the establishment of
appropriate ethical standards.
The Board currently holds eleven
scheduled meetings each year, as well
as other meetings to address any
special matters that may arise.
The agenda for meetings is prepared
in conjunction with the Chairman, the
Managing Director and the Company
Secretary. Standing items include the
Managing Director’s report (which
includes updates on key projects),
financial reports, strategic matters,
governance and compliance.
6 Annual Report 2010 Australian Pharmaceutical Industries Limited

Papers are circulated in advance.
Executives are regularly involved in
Board discussions, by invitation.
The consolidated entity has a formal
process to educate new directors
about the nature of the business,
current issues, the corporate strategy
and the expectations of the
consolidated entity concerning
performance of directors. Directors
also have the opportunity to visit
business operations and meet with
management, employees and other
stakeholders, to gain a better
understanding of business operations.
Directors are given access to
continuing education opportunities to
update and enhance their skills and
knowledge.
Independent Professional Advice and
Access to company information
Each director has the right of access
to all relevant Group information and
to the consolidated entity’s executives
and, subject to prior consultation with
the Chairman, may seek independent
professional advice from a suitably
qualified adviser at the Group’s
expense. A copy of the advice
received by the director is to be
made available to all other members
of the Board.
composition of the Board
The names of the directors of the
Company in office at the date of this
report are set out in the beginning of
the Directors’ Report.
The composition of the Board is
determined using the following
principles:
• A minimum of three directors, with
a broad range of expertise in the
industries in which the Company
operates and government
regulation of those industries, or in
significant aspects of accounting
and finance and risk
management;
• A majority of non-executive
directors;
• A non-executive director as
Chairman;
• Enough directors to serve on
various committees without
compromising their ability to
discharge their responsibilities; and
• Re-election of directors every
three years (except for the
Managing Director).
Independence of directors
The ASX Recommendations define an
independent director as a director
who is not a member of management
(a non-executive director) and who:
• Is not a substantial shareholder of
the Company or an officer of, or
otherwise associated, directly or
indirectly, with a substantial
shareholder;
• Has not within the last three years
been employed in an executive
capacity by the Company or
another group member, or been a
director after ceasing to hold any
such employment;
• Within the last three years has not
been a principal or employee of a
material1 professional adviser or a
material1 consultant to the
Company or another group
member;
• Is not a material1 supplier or
customer of the Company or
another group member, or an
officer of or otherwise associated
directly or indirectly, with a
material1 supplier or customer;
• Has no material1 contractual
relationship with the Company or
another group member other than
as a director of the Company;
and
• Is free from any interest and any
business or other relationship
which could, or could reasonably
be perceived to, materially1
interfere with the director’s ability
to act in the best interests of the
consolidated entity.
1 The Board considers, ‘material’, in this context,
where any director-related business relationship
has represented, or is likely in future to represent
the lesser of at least 10% of the relevant segment’s
or the director-related business revenue. The Board
considered the nature of the Company’s
competition, alternative available services or
supplies and the size and nature of each director-
related business relationship, in arriving at this
threshold.
The Board confirms that all directors
meet the stated requirements for
independence as set out in the ASX
Recommendations, except that Mr
Robinson and Mr Millner are directors
of the Company’s major shareholder,
Washington H Soul Pattinson and
Company Limited. The Board does not
consider that this relationship impacts
their ability to bring an independent
mind and judgement to the Board.
They are subject to re-election every
three years by shareholders at the
AGM.
nomination, Appointment and
Retirement of directors
The Board is responsible for succession
planning, identification and
appointment of new Board members
and regularly reviews Board
membership. The Board oversees the
appointment and induction process
for directors and committee
members, and the selection,
appointment and succession planning
process of the Company’s Managing
Director. The Board considers the
appropriate skill mix, personal
qualities, expertise and diversity of
Board and committee positions,
based on the broad criteria outlined
above (see “Composition of the
Board”). The Board identifies potential
candidates with advice from an
external consultant. Directors
appointed by the Board must stand
for election by shareholders at the
Company’s next annual general
meeting.
The Board also conducts an annual
review of the performance of the
Managing Director and the senior
executives reporting directly to him
and the results are discussed at a
Board meeting.
The Board undertakes an annual self
assessment of its collective
performance. The self assessment:
section 2
7Annual Report 2010
ABN 57 000 004 320 Australian Pharmaceutical Industries Limited

section 2
Directors’ report continued
• Compares the performance of the
Board with the requirements of the
Board’s charter;
• Sets forth the goals and objectives
of the Board for the upcoming
year; and
• Effects any improvements to the
Board’s charter deemed necessary
or desirable.
The Chairman annually assesses the
performance of individual directors
and where necessary meets privately
with each director to discuss this
assessment. The Chairman’s
performance is reviewed by the Board.
The Managing Director does not
participate in the review process for
appointment of non-executive
directors, nor in the review of his own
performance by the Board.
RemuneRATIon commITTee
The Remuneration Committee has a
documented charter approved by the
Board. The Committee reviews and
makes recommendations to the Board
on remuneration packages and
policies applicable to the Managing
Director, senior executives and non-
executive directors. It is also
responsible for share schemes, senior
executive incentive programs and a
range of employment related matters.
The members of the Remuneration
Committee during the year were:
Mr M L Hampton – (Chair)
Independent non-executive
– appointed 2 September 2008;
Mr R D Millner
– Non-executive
– appointed 2 October 2007; and
Dr M R Wooldridge
– Independent non-executive
– appointed 2 October 2007.
The Managing Director is invited to
Remuneration Committee meetings, as
required, to discuss senior executives’
performance and remuneration
packages.
The Remuneration Committee formally
meets twice a year and otherwise as
required.
AudIT And RIsk commITTee
The Audit and Risk Committee has a
documented charter, approved by the
Board. The Committee’s objective is to
advise on the establishment and
maintenance of a framework of
internal control and appropriate
ethical standards for the management
of the consolidated entity.
The members of the Audit and Risk
Committee during the year ended 31
August 2010 were:
Ms E C Holley (Chair)
– Independent non-executive
– appointed 19 December 2006;
Mr M L Hampton
– Independent non-executive
– appointed 7 August 2007; and
Ms L Ausburn
– Independent non-executive
– appointed 7 October 2008.
The external auditor, the Managing
Director and Chief Financial Officer,
are invited to the Audit and Risk
Committee meetings at the discretion
of the Committee.
The Audit and Risk Committee’s
charter provides procedures for the
selection and appointment of the
external auditor, and for the rotation of
external audit engagement partners.
The responsibilities of the Audit and Risk
Committee include reporting to the
Board on:
• Reviewing the annual and half-
year financial reports and other
financial information distributed
externally. This includes considering
the appropriateness of new
accounting policies to ensure
compliance with Australian
Accounting Standards and
generally accepted accounting
principles;
• Assessing corporate risk assessment
processes;
• Monitoring non-audit services
provided by the external auditor
for consistency with maintaining
the external auditor’s
independence. Each reporting
period, the external auditor
provides an independence
declaration in relation to the year
end audit or half year review;
• Providing advice to the Board in
respect of whether the provision of
the non-audit services by the
external auditor is compatible with
the general standard of
independence of auditors imposed
by the Corporations Act 2001;
• Reviewing remuneration and
effectiveness of performance of
the external auditor;
• Assessing the adequacy of the
internal control framework and the
Company’s Code of Conduct
Policy;
• Assessment of compliance with
internal controls to ensure prompt
and appropriate rectification of
any deficiencies or breakdowns
identified; and
• Monitoring the procedures to
ensure compliance with the
Corporations Act 2001, the ASX
Listing Rules and all other
regulatory requirements.
The Audit and Risk Committee reviews
the performance of the external
auditors on an annual basis and
normally meets with them during the
year to:
• Discuss the external audit plans,
identifying any significant changes
in structure, operations, and
internal controls or accounting
policies likely to impact the
financial statements and to review
the fees proposed for the audit
work to be performed;
• Review the annual, half-year and
preliminary final reports prior to
lodgement with the ASX, and any
significant adjustments required as
a result of the auditor’s findings,
and to recommend Board
approval of these documents, prior
to announcement of results; and
• As required, organise, review and
report on any special reviews or
investigations deemed necessary
by the Board.
8 Annual Report 2010 Australian Pharmaceutical Industries Limited

RIsk mAnAgemenT
overview of the Risk management
system
The Board oversees the establishment,
implementation, and annual review of
the Company’s Risk Management
System. Management has established
and implemented the Risk
Management System for assessing,
monitoring and managing all risks,
including material business risks for the
Group (including sustainability risk).
managing director and chief
financial officer Assurances
The Managing Director and Chief
Financial Officer provide an
assurance to the Board in respect of
the annual and half yearly financial
reports. The Managing Director and
the Chief Financial Officer have given
assurances with respect to this report
that :
• The financial reporting risk
management and associated
compliance and controls have
been assessed and found to be
operating efficiently and
effectively in all material respects;
• The operational and other
compliance risk management
processes have also been
assessed and found to be
operating efficiently and
effectively in all material respects;
• The Consolidated entity’s books
and records have been
adequately maintained; and
• The Consolidated entity’s financial
statements and notes required by
the accounting standards, for
external reporting, give a true and
fair view of the financial position
and performance and comply
with the accounting standards
(and any further requirements in
the Corporations Regulations),
and applicable ASIC Class Orders.
Risk Profile
Material risks to the operations of the
consolidated entity arise from matters
including actions by existing and
emerging competitors, government
policy changes, compliance with
government regulation, environment,
occupational health and safety,
property, pharmacy guarantee
arrangements, Pharmacists or
pharmacy groups failing to honour
contractual obligations including
trading terms, and the purchase,
development and use of information
systems.
The Board has the overall responsibility
for the Consolidated entity’s risk
management and internal control
framework, with delegation to the
Audit and Risk Committee to oversee
the process and then report back to
the Board the status of material risks.
The Consolidated entity’s internal
compliance and control systems are
designed to ensure effective and
efficient operations, including
financial reporting and compliance
with laws and regulations, with a view
to identifying, assessing and
managing risk across the
Consolidated entity’s business
activities. The internal control systems
which have been adopted by the
Consolidated entity aim to develop a
culture which is able to identify,
communicate and manage material
risk.
The Consolidated entity has a full time
Risk and Internal Audit Manager to
continuously review risk management
and compliance with internal controls.
This role will be supplemented with
assistance from an external
accounting firm specialising in risk
management, as necessary.
KPMG assists the Board by providing
the external audit service.
Quality and Integrity of Personnel
The Consolidated entity recognises
the importance of training and
development, appropriate
remuneration and incentives and
regular performance reviews. It also
encourages an environment of co-
operation and constructive dialogue
with employees and senior
management. A formal succession
plan is being finalised to ensure
competent and knowledgeable
employees fill senior positions when
retirements or resignations occur.
Succession planning is supported by a
Leadership Development Program
which identifies high calibre
employees and prepares them for
future leadership roles.
financial reporting
Monthly results are reported against
budgets approved by the directors
and revised forecasts for the year are
prepared regularly.
environmental regulation
The consolidated entity’s operations
are subject to environmental
regulation under Commonwealth,
State and New Zealand government
legislation in relation to its
manufacture of pharmaceutical
products, retail stores and
pharmaceutical distribution facilities.
Pharmaceutical and toiletries product
manufacture – manufacturing plants
operate under licence requirements
relating to waste disposal, water and
air pollution.
Wholesale distribution – distribution
facilities operate under licence
requirements relating to waste
disposal, water and air pollution.
The Board believes that the
consolidated entity has adequate
systems in place for the management
of its environmental requirements and
is not aware of any significant breach
of these environmental requirements
as they apply to the consolidated
entity.
conflict of Interest
Directors must keep the Board
advised, on an ongoing basis, of any
interest that could potentially conflict
with those of the Company. The Board
has developed procedures to assist
directors to disclose potential conflicts
of interest.
Where the Board believes that a
conflict exists for a director on a Board
matter, the director concerned does
not receive the relevant Board papers
and is not present at the meeting
section 2
9Annual Report 2010
ABN 57 000 004 320 Australian Pharmaceutical Industries Limited

section 2
Directors’ report continued
whilst the item is considered. Details of
director related entity transactions with
the Company and consolidated entity
are set out in Note 27.
code of conduct and ethics
The consolidated entity has advised
each director, manager and
employee that they must comply with
the Code of Conduct and Ethics. The
Code, which is available on the
Company’s intranet and website,
covers the following:
• Aligning the behaviour of the
Board and management with the
Code of Conduct and Ethics by
maintaining appropriate core
Company values and objectives;
• Usefulness of financial information
by maintaining appropriate
accounting policies and practices
and disclosure;
• Fulfilling responsibilities to customers
and consumers by maintaining
high standards of product quality,
service standards, commitments to
fair value, and safety of goods
produced;
• Employment practices such as
occupational health and safety,
employment opportunity, the level
and structure of remuneration, and
conflict resolution;
• Responsibilities to community, such
as environmental protection
policies, supporting the community
activities and sponsorships and
donations;
• Responsibilities to the individual,
such as privacy, use of privileged or
confidential information, and
conflict resolution;
• Fair dealing; and
• Compliance with laws and
reporting suspected breaches of
laws.
Trading in company securities by
directors and employees
The key elements of the Company’s
Share Trading Policy are:
• Identification of those restricted
from trading – directors, officers
and employees may acquire
shares in the Company:
– during the period of fourteen
days after the Annual General
Meeting;
– during the period of 60 days
following the issue of the annual
results and half yearly results;
– during the period of 60 days
following the release of a
prospectus by API relating to the
issue of shares in the Company;
and
– provided they are not in
possession of price sensitive
information not yet released to
the market.
• Raising the awareness of legal
prohibitions;
• Requiring details to be provided of
intended trading in the Company’s
shares; and
• Identification of processes for
unusual circumstances where
discretions may be exercised in
cases such as financial hardship.
Directors are prohibited from using
margin loans to finance the purchase
of shares in the Company or from
trading in any financial product issued
or created over the Company’s shares.
The policy also details the insider
trading provisions of the Corporations
Act. The Company’s policy is
promoted to all directors, officers and
employees through publication on the
Company’s intranet and website.
communIcATIon wITh
shARehoLdeRs
The Company has a Shareholder
Communication Policy which is
designed to:
• Promote effective communication
with existing and potential
shareholders;
• Ensure ready access to
understandable information about
the Company including the
existence of this policy; and
• Encourage shareholders to
participate at Annual General
Meetings.
In addition, the Company has a
comprehensive Continuous Disclosure
Policy which includes identifying
matters that may have a material
effect on the price of the Company’s
securities, notifying them to the ASX,
posting them on the Company’s
website and issuing media releases.
In summary, the Continuous Disclosure
Policy operates as follows:
• The Company’s management is
responsible for monitoring and
recognising events which may
have a material effect on the price
or value of the Company’s
securities and reporting these
events to the Managing Director,
Chief Financial Officer, or
Company Secretary; and
• The Managing Director, Chief
Financial Officer and Company
Secretary are responsible for
interpreting the Company’s policy
and where necessary informing the
Board. The Company Secretary is
responsible for all communications
with ASX. These matters are
advised to ASX as they are
discovered.
The Company’s Shareholder
Communication Policy and
Continuous Disclosure Policy are
promoted to all directors, officers and
employees through publication in the
Company’s intranet and website.
In addition:
• The full annual financial report is
available on the Company’s
website and printed copies are
made available to shareholders
who elect to receive a copy. This
information includes relevant
information about the operations
of the consolidated entity during
the year, changes in the state of
affairs and details of future
developments;
• The half-yearly report contains
summarised financial information
10 Annual Report 2010 Australian Pharmaceutical Industries Limited

and a review of the operations of
the consolidated entity during the
period. The half-year reviewed
financial report is lodged with the
Australian Securities and
Investments Commission and the
ASX;
• All announcements made to the
market, and related information
(including information provided to
analysts or the media during
briefings), are placed on the
Company’s website after they are
released to the ASX; and
• The external auditor is requested
to attend the Annual General
Meeting to answer any questions
concerning the audit and the
content of the auditor’s report.
RemuneRATIon RePoRT -
AudITed
This Remuneration Report forms part of
the directors’ Report.
For the purposes of this Remuneration
Report, key management personnel
have authority and responsibility for
planning, directing and controlling the
activities of the consolidated entity,
and includes directors of the
Company and senior executives. Key
management personnel comprise the
directors of the Company and
executives of the Company and
consolidated entity including the five
most highly remunerated executives
of the Company and the
consolidated entity as defined by
Section 300A of the Corporations Act.
Remuneration Policies and Principles -
Audited
Remuneration levels are set to attract
and retain appropriately qualified and
experienced directors and senior
executives. The Remuneration
Committee obtains independent
advice on the appropriateness of
remuneration packages, given trends
in comparative companies locally.
The Committee reviews the
remuneration of directors and senior
executives annually.
non-executive directors
Under the Company’s Constitution,
the maximum aggregate
remuneration available for division
among the non-executive directors is
to be determined by the shareholders
in a general meeting. The maximum
aggregate is currently fixed at
$595,000. This amount (or part of it) is
divided among the non-executive
directors as determined by the Board.
Directors’ fees cover all Board and
Board committee activities.
Superannuation is paid for non-
executive directors at the statutory
prescribed rate.
Non-executive directors do not
receive performance-related
remuneration.
Under the Board’s Retirement
Scheme, which was approved by
shareholders at the 1994 Annual
General Meeting, retiring non-
executive directors are paid on a
pro-rata basis up to 10 years service to
a maximum of three times the
average annual remuneration in the
three years preceding retirement. The
retirement benefit is capped at
$220,000 per director and applies only
to directors appointed prior to 9
September 2003. The directors have
agreed to freeze this benefit at 31
August 2009.
Details of directors’ remuneration are
set out below:
executive director and senior
executives
Remuneration packages include a
mix of:
• Fixed remuneration; and
• Performance linked remuneration.
Fixed remuneration
Fixed remuneration consists of base
remuneration (which is calculated on
a total cost basis and includes any FBT
charges related to employee benefits
including motor vehicles) as well as
employer contributions to
superannuation funds.
Remuneration levels are reviewed
annually by the Remuneration
Committee through a process that
considers individual segment and
overall performance of the
consolidated entity. In addition,
external consultants provide analysis
and advice to ensure that senior
executives’ remuneration is
competitive in the market place. A
senior executive’s remuneration is also
reviewed on promotion.
Performance linked remuneration
Performance linked remuneration
includes both short-term and long-
term incentives and is designed to
reward executive directors and senior
executives for meeting or exceeding
their financial and personal
objectives. The short-term incentive
(STI) is an ‘at risk’ bonus provided in
the form of cash, while the long-term
incentive (LTI) is provided as
performance rights over ordinary
shares of the Company under the
rules of API’s Long Term Incentive Plan.
Short-term incentive (‘STI’) bonus
Each year the Remuneration
Committee sets the KPI’s (key
performance indicators) for the
executive director and senior
executives. The KPI’s generally include
measures relating to the consolidated
entity, the relevant segment and the
individual. They include financial,
people, customers, strategic and risk
measures. These measures are chosen
as they directly align the individual’s
reward to the KPI’s of the
consolidated entity and to its strategy
and performance.
The financial performance objectives
are profit and funding benchmarks
compared to budgeted amounts.
The non-financial objectives vary with
position and responsibility and include
measures such as achieving strategic
outcomes, safety and environmental
performance, customer satisfaction
and staff development. Financial and
non-financial objectives each
account for varying percentages of
the maximum STI, depending upon
the executive’s role.
section 2
11Annual Report 2010
ABN 57 000 004 320 Australian Pharmaceutical Industries Limited

section 2
Directors’ report continued
At the end of the financial year, the
Remuneration Committee assesses the
actual performance of the
consolidated entity, the relevant
segment and individual against the
KPI’s set at the beginning of the
financial year. For each key
management personnel, a
percentage of the pre-determined
maximum amount is awarded
depending on results. This method of
assessment was chosen as it provides
the Remuneration Committee with an
objective assessment of the
individual’s performance.
The Remuneration Committee
recommends the cash incentive to be
paid to the individuals for approval by
the Board.
Long-term incentive (‘LTI’) bonus
The Remuneration Committee has
responsibility for API’s Long Term
Incentive Plan. This plan was
established during the year ended 30
April 2006. The Remuneration
Committee is responsible for
determining awards to be granted
under the Plan, as well as overseeing
administration of the Plan. Part of this
administration is the determination of
the performance conditions
associated with each grant which are
summarised over the page.
The LTI plan envisages a performance
right being issued to an executive. A
performance right is a right to be
provided with a fully paid ordinary
share in the Company. Under the LTI
Plan, shares can either be purchased
on market on behalf of the
participant, or new shares issued by
the Company.
If any vesting condition is satisfied
through the achievement of a
performance criteria (as described
below), a participant has
approximately 6 months from that
time to exercise it and be provided
with a share in API.
Performance conditions will be tested
only once, and any performance
rights that do not meet the
performance conditions will lapse and
will not be re-tested.
At 10 August 2007, performance rights
were granted in two tranches under
the same terms and conditions. The
performance period of the first
tranche (the 2006 grant) and second
tranche (the 2007 grant) ended on 28
February 2009 and 28 February 2010,
respectively without vesting any
performance rights.
The 2007 grant (granted at 10 August
2007) expired on 28 February 2010
without any vesting of the
performance rights.
2008 grant:
At 31 March 2009, performance rights
(the 2008 grant) were granted with a
performance period commencing 1
September 2008 and ending 31
August 2011. The performance
conditions for the exercise of
performance rights will be assessed on
31 October 2011.
The performance conditions for the
performance rights are designed to
take account of absolute and relative
measures, being:
• the Consolidated entity’s total
shareholder return (TSR)
performance relative to the total
shareholder return performance of
a comparator group of ASX listed
companies; and
• the Consolidated entity’s earnings
per share (EPS) relative to an EPS
growth target determined by the
Board.
The comparator group of ASX listed
companies for the TSR performance
condition are:
• Austereo Group Limited
• Invocare Limited
• Sigma Pharmaceuticals Limited
• Boom Logistics Limited
• iSOFT Group Limited (formerly IBA
Health Limited)
• Speciality Fashion Group Limited
• Crane Group Limited
• Pacific Brands Limited
• Spotless Group Limited
• G.U.D. Holdings Limited
• Pharmaxis Ltd
For any participant, one half of the
total performance rights granted will
be assessed against the TSR measure
and the other half will be assessed
against the EPS measure.
The TSR performance condition has
the effect that:
• none of the performance rights
subject to the TSR performance
condition may be exercised at the
end of the performance period,
unless API’s TSR performance is at
least above the median level
when compared against the
comparative group;
• if API’s TSR is at or above the 75th
percentile, all the performance
rights subject to this condition can
be exercised; and
• if the TSR is at the 51st percentile,
50% of the performance rights
subject to this condition can be
exercised; if the TSR is between the
51st and 75th percentile, the
number of TSR rights that will
become exercisable will be
calculated on a straight line basis
between the two levels.
The EPS performance condition has
the effect that:
• none of the performance rights
subject to the EPS performance
condition may be exercised unless
API’s actual EPS performance over
the performance period results in
EPS that is equivalent to at least
10% per annum compound EPS
growth over the 3 year period; and
• if API’s actual EPS performance
results in EPS over the performance
period that is equivalent to being
at or above 15% per annum
compound EPS growth over the
same period, all the performance
rights subject to this condition can
be exercised; and
• if the EPS performance is at the
EPS target pool (which results from
a 10% per annum compounding
rate over three years) 50% of the
rights will vest. If the EPS
performance is between 10% and
12 Annual Report 2010 Australian Pharmaceutical Industries Limited

15% per annum compounding
rates, the number of EPS rights that
become exercisable will be
calculated on a straight line basis
between the two levels.
The EPS target pool is a number that is
arrived at by applying a compound
growth rate figure to the EPS in the
base year for three years. This then
gives a number against which API’s
actual EPS performance can be
measured.
In order for the 2008 EPS grant to vest
API’s EPS must reach 7.85 cents per
share (target or 50% vesting) and 8.97
cents per share (stretch or 100%
vesting) at the end of 31 August 2011.
2009 grant:
At 12 May 2010, further performance
rights (the 2009 grant) were granted
with a performance period
commencing 1 September 2009 and
ending 31 August 2012. The
performance condition, being API’s
return on equity (‘ROE’) for the
exercise of performance rights will be
assessed on 31 October 2012.
The performance condition for the
performance rights is designed to
take account of an absolute
measure, being the Consolidated
entity’s return on equity (ROE) over the
performance period for the 2009
grant.
The Performance Condition is based
on the actual ROE achieved by the
consolidated entity during the three
year period commencing at the
beginning of the performance period
when compared to the target
amount of ROE set by the Board for
the same period (“Target ROE”), in
both cases, when expressed as a
percentage created by dividing the
net profit after tax for the relevant
financial year by the total number of
ordinary shares in Australian
Pharmaceutical Industries Limited on
issue at the end of the relevant
financial year. The amount of the
Target ROE may be varied by the
Board in its absolute discretion.
The ROE performance condition has
the effect that:
• if a cumulative ROE of 21.1% is
achieved for the three year period
ending 31 August 2012, then 50% of
the Rights will vest;
• if a cumulative ROE of 25.3% is
achieved for the three year period
ending 31 August 2012, then 100%
of the Rights will vest; and
• if the cumulative ROE is between
these two levels, then the number
of rights that vest will be calculated
on a straight line proportional basis.
Service contracts
The Company has entered into
service contracts with key
management personnel. These
contracts outline the components of
remuneration paid to them but do not
prescribe how remuneration levels are
modified from year to year.
Remuneration levels are reviewed
each year to take into account cost-
of-living changes, any change in the
scope of the role performed, and any
other changes required to meet the
principles of the Company’s
remuneration policy outlined earlier.
Mr Stephen Roche, the Company’s
Managing Director and CEO, has a
contract of employment with the
Company dated 27 September 2006.
The contract continues until the
employment is terminated in
accordance with the contract.
The contract states the following in
respect of cessation of his
employment:
• Mr Roche may resign from the
Company by giving three months
written notice;
• The Company may summarily
terminate Mr Roche’s employment
in specified circumstances with
immediate effect and no
termination benefits will apply
other than accrued entitlements;
and
• The Company may terminate Mr
Roche’s employment by the giving
of twelve months written notice
and may make a termination
payment in lieu of notice of up to
twelve months fixed remuneration.
Mr Roche is subject to a twelve month
non-compete restriction after
cessation of his employment.
Mr Roche’s service contract has no
fixed term.
Other key management personnel
have employment contracts with
differing lengths of time, between 6
and 12 months, by which they or the
consolidated entity must advise each
other in the event of an intended
separation. The Company may
summarily terminate the employment
in specified circumstances with
immediate effect.
Key management personnel are
subject to a non-compete restriction
of up to twelve months after cessation
of employment.
section 2
13Annual Report 2010
ABN 57 000 004 320 Australian Pharmaceutical Industries Limited

section 2
Directors’ report continued
dIRecToRs’ And execuTIve offIceRs’ RemuneRATIon (comPAny And consoLIdATed) - AudITed
Details of the nature and amount of each major element of remuneration of each director of the Company, each of the
five named Company executives and relevant group executives who receive the highest remuneration and other key
management personnel are:
dIRecToRs $ $ $ $ $ $ $ $ $ % %
non-executive
mr P R Robinson
31 August 2010 135,457 – – 135,457 12.192 – – – 147,659 – –
31 August 2009 127,000 – – 127,000 11,430 22,000 – – 160,430 – –
mr R d millner
31 August 2010 55,467 – – 55,467 4,992 – – – 60,459 – –
31 August 2009 52,000 – – 52,000 4,680 15,600 – – 72,280 – –
mr m R wooldridge
31 August 2010 66,133 – – 66,133 5,952 – – – 72,085 – –
31 August 2009 59,500 – – 59,500 5,355 – – – 64,855 – –
ms e c holley
31 August 2010 76,800 – – 76,800 6,912 – – – 83,712 – –
31 August 2009 72,000 – – 72,000 6,480 – – – 78,480 – –
mr m L hampton
31 August 2010 66,133 – – 66,133 5,952 – – – 72.085 – –
31 August 2009 62,000 – – 62,000 5,580 – – – 67,580 – –
ms L Ausburn
31 August 2010 55,467 – – 55,467 4,992 – – – 60,459 – –
31 August 2009 46,913 – – 46,913 4,222 – – – 51,135 – –
executive
mr s P Roche – Managing Director/CEO
31 August 2010 819,566 196,000 10,191 1,025,757 14,584 88,684 – 39,816 1,168,841 20 3
31 August 2009 776,969 187,500 140 964,609 13,864 – – 13,077 991,550 20 1
execuTIves
mr J meiliunas – General Manager Change Management (separated 15 September 2010)
31 August 2010 327,297 – – 327,297 14,584 13,639 342,000 *(11,803) 685,717 (2) (2)
31 August 2009 328,255 49,350 1,440 379,045 13,864 38,010 – 5,476 436,395 13 1
mr R vincent – Group General Manager Pharmacy
31 August 2010 434,566 62,000 16,294 512,860 14,584 45,979 – 21,385 594,808 14 4
31 August 2009 537,445 120,000 61,265 718,710 13,864 – – 6,834 739,408 17 1
mr P sanguinetti – Company Secretary and Chief Legal Counsel
31 August 2010 306,514 37,440 – 343,954 14,584 – – 15,242 373,780 14 4
31 August 2009 289,830 53,438 2,754 346,022 13,864 – – 10,769 370,655 17 3
mr g fallet – Chief Financial Officer (appointed 7 September 2009)
31 August 2010 381,574 61,800 – 443,374 14,584 – – 22,337 480,295 18 5
31 August 2009 – – – – – – – – – – –
mr m Langham – General Manager, Priceline (key management person from 1 May 2008)
31 August 2010 352,241 40,800 – 393,041 14,584 12,964 – 17,543 438,132 13 4
31 August 2009 330,302 51,300 – 381,602 13,864 30,904 – 8,413 434,783 14 2
mr P hourihan – Group General Manager Supply Chain (appointed 3 Aug 2009, separated 3 Sept 2010)
31 August 2010 430,416 – – 430,416 14,584 – 225,000 – 670,000 – –
31 August 2009 34,628 – – 34,628 1,205 – – – 35,833 – –
foRmeR execuTIves
mr P smith – Group General Manager (separated 6 September 2009)
31 August 2009 – – – – – – – – – – –
31 August 2008 411,768 30,000 17,928 459,696 13,813 6,796 398,230 (32,992) 845,543 – (4)
mr A killick – Chief Financial Officer (appointed 4 February 2008 – separated 16 October 2009)
31 August 2009 49,745 – – 49,745 2,410 – 29,710 – 81,865 – –
31 August 2008 386,768 60,000 – 446,768 13,967 – – – 460,735 13 –
Postemployment
super-annuation
contributions
Otherlongterm
Termin-ation
payments
EquityValue ofOptions& RightsTotal
short Term
Non-monetary
benefits
Short-termincentives
Salary& Fees
Proportion ofremunerationperformance
relatedTotal
Value ofoptions asproportion
of remuner-ation (%)
* Refer footnote (iv) below
(i) Retirement benefits for non-executive directors are included on an accrualbasis. They are paid on a pro rata basis up to 10 years service to a maximum ofthree times the average annual remuneration in the three years precedingretirement. The retirement benefit is capped at $220,000 and does not apply todirectors first appointed after 9 September 2003. On 31 August 2009 the directorsagreed to freeze this benefit. Other long term benefits shown for the ExecutiveDirector and Executives are the amounts charged against profits for the year foraccrued Long Service Leave Entitlements.
(ii) Subsequent to signing the year ended 31 August 2008 and 31 August 2009
financial statements, the Board resolved to award short term incentive paymentsto the Executive Director, senior and middle managers. Those payments weremade during the year ended 31 August 2009 and 31 August 2010, respectively.
(iiiI) The value of performance rights is calculated at grant date using the MonteCarlo Simulation model and Black-Scholes Option Pricing model. The value isallocated to each reporting period evenly over the performance period.
(iv) Negative values shown in “Equity Value of Options and Rights” aboverepresent the value of forfeitures resulting from these executives exiting theCompany and/or forfeiture due to failure to meet performance conditions.
14 Annual Report 2010 Australian Pharmaceutical Industries Limited
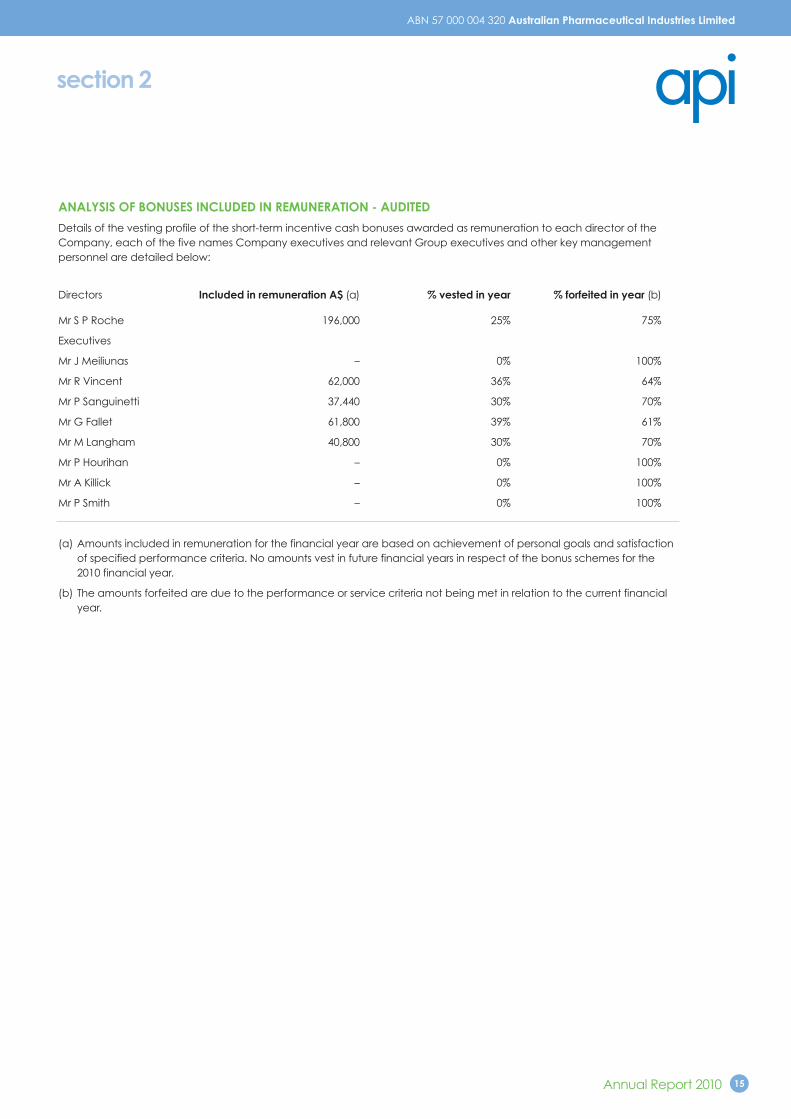
AnALysIs of Bonuses IncLuded In RemuneRATIon - AudITed
Details of the vesting profile of the short-term incentive cash bonuses awarded as remuneration to each director of the
Company, each of the five names Company executives and relevant Group executives and other key management
personnel are detailed below:
Directors Included in remuneration A$ (a) % vested in year % forfeited in year (b)
Mr S P Roche 196,000 25% 75%
Executives
Mr J Meiliunas – 0% 100%
Mr R Vincent 62,000 36% 64%
Mr P Sanguinetti 37,440 30% 70%
Mr G Fallet 61,800 39% 61%
Mr M Langham 40,800 30% 70%
Mr P Hourihan – 0% 100%
Mr A Killick – 0% 100%
Mr P Smith – 0% 100%
(a) Amounts included in remuneration for the financial year are based on achievement of personal goals and satisfaction
of specified performance criteria. No amounts vest in future financial years in respect of the bonus schemes for the
2010 financial year.
(b) The amounts forfeited are due to the performance or service criteria not being met in relation to the current financial
year.
section 2
15Annual Report 2010
ABN 57 000 004 320 Australian Pharmaceutical Industries Limited

execuTIve offIceRs
Mr P Sanguinetti 111,400 1 September 2008 0% 0% 31 August 2011
127,400 1 September 2009 0% 0% 31 August 2012
Mr J Meiliunas 39,500 1 May 2007 0% 100% 31 August 2010
122,100 1 September 2008 0% 100% 31 August 2011
Mr R Vincent 46,900 1 May 2007 0% 100% 31 August 2010
151,800 1 September 2008 0% 0% 31 August 2011
178,000 1 September 2009 0% 0% 31 August 2012
Mr M Langham 20,600 1 May 2007 0% 100% 31 August 2010
121,400 1 September 2008 0% 0% 31 August 2011
145,500 1 September 2009 0% 0% 31 August 2012
Mr P Hourihan 179,400 1 September 2009 0% 100% 31 August 2012
Mr G Fallet 159,500 1 September 2009 0% 0% 31 August 2012
• The performance rights granted on 10 August 2007 lapsed on 28 February 2010 without vesting.
• Performance rights were granted on 31 March 2009 with a performance period commencing 1 September 2008 and ending 31 August
2011 (the 2008 grant). The performance conditions for the exercise of performance rights will be assessed on 31 Oct 2011. The fair value of
the performance rights is dependent upon the TSR or EPS performance conditions which apply to one half of the performance rights each
and is $0.22 and $0.36 respectively.
• Further performance rights were granted on 12 May 2010 with a performance period commencing on 1 September 2009 and ending 31
August 2012 (the 2009 grant). The performance condition for the exercise of performance rights will be assessed on 31 Oct 2012. The fair
value of the performance rights is dependent upon the ROE performance condition for the entire grant and is $0.42 per share.
The performance rights were provided at no cost to the recipient.
(A) The % forfeited in the year represents the reduction from the maximum number of performance rights available to vest due to the
performance criteria not being achieved.
sPecIfIc Bonus And eQuITy RemuneRATIon AnALysIs – AudITed
Analysis of Performance Rights over equity Instruments granted as compensation
Details of the vesting profile of performance rights awarded as remuneration to each key management person are
detailed below.
Performance Rights granted
% vested % forfeited financial
Performance in the in the period in which
execuTIve dIRecToR number period commences period period(A) grant vests
Mr S Roche 87,500 1 May 2007 0% 100% 31 August 2010
279,600 1 September 2008 0% 0% 31 August 2011
330,900 1 September 2009 0% 0% 31 August 2012
section 2
Directors’ report continued
16 Annual Report 2010 Australian Pharmaceutical Industries Limited

PRIncIPAL AcTIvITIes
The principal activities of the consolidated entity during the
course of the financial period were:
• the wholesale distribution of pharmaceutical and allied
products;
• retail operations of the brands Priceline and Priceline
Pharmacy;
• manufacture of pharmaceutical medicines and
consumer toiletries;
• the distribution of pharmaceutical and medical
consumable products to hospitals, through its associate
CH2 Pty Ltd, in which the Company holds a 45.3% stake;
and
• finance origination and retail services to pharmacists,
including the retail banners of Soul Pattinson, and
Pharmacist Advice.
RevIew And ResuLTs of oPeRATIons
For the year ended 31 August 2010, the income statement
shows a consolidated net profit from ordinary activities of
$22.646 million (31 August 2009: $18.320 million profit) after an
income tax expense of $13.022 million (31 August 2009:
$8.459 million expense).
The Consolidated entity reported for the year ended 31
August 2010, revenue of $3,713 million, and earnings before
interest, tax, depreciation and amortisation of $67.547
million. API’s associate (see note 12), over which API did not
have direct operational control, accounted for profit of
$0.637 million (31 August 2009: $0.713 million loss). Excluding
associate, API would have recorded a profit after tax of
$22.009 million.
The profit before income tax amounted to $35.668 million,
compared to a $26.779 million profit for the year ended 31
August 2009.
For the year ended 31 August 2010, the consolidated entity’s
total net assets were $591.175 million (31 August 2009:
$432.740 million).
sIgnIfIcAnT chAnges In The sTATe of AffAIRs.
There were no significant changes in the nature of the
activities of the consolidated entity during the period.
dIvIdends
A dividend was paid during the year ended 31 August 2010
in respect of the year ended 31 August 2009. The dividend
was at the rate of two cents per share, fully franked. The
dividend totalled $5.147 million and was paid on 11
December 2009.
section 2
In considering the consolidated entity’s performance and
the benefits for shareholder wealth, the Remuneration
Committee has regard to a range of indicators in respect
of senior executive remuneration and linked these to the
previously described short and long term incentives.
The following table presents these indicators over
6 periods, spanning 1 May 2005 to 31 August 2010, showing
the impact of the Company’s performance on shareholder
wealth, taking into account dividend payments, share price
changes and returns of capital during the financial years:
31 August 31 August 31 August 30 August 30 April 30 April
2010*** 2009** 2008 2007* 2007 2006
Net profit/(loss) after tax ($thousand) $22,646 $18,320 $15,213 ($2,598) ($11,485) $20,374
Dividends paid – cents per share 2.50 2.00 1.00 0.00 3.00 9.25
Share price at $0.43 $0.75 $0.69 $1.85 $2.20 $2.48
* Four month financial period.
** Dividend paid 11 December 2009.
*** Dividend payable 15 December 2010.
The Remuneration Report concludes at this point
conseQuences of PeRfoRmAnce on shARehoLdeRs’ weALTh - AudITed
17Annual Report 2010
ABN 57 000 004 320 Australian Pharmaceutical Industries Limited
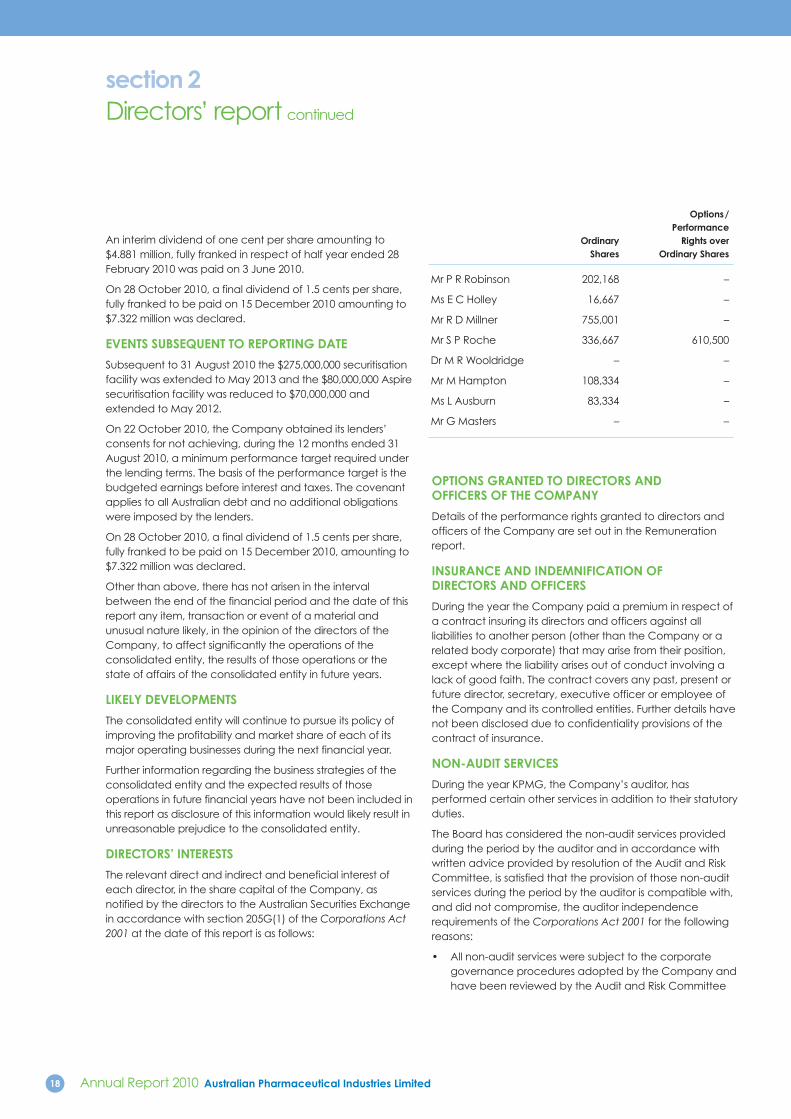
An interim dividend of one cent per share amounting to
$4.881 million, fully franked in respect of half year ended 28
February 2010 was paid on 3 June 2010.
On 28 October 2010, a final dividend of 1.5 cents per share,
fully franked to be paid on 15 December 2010 amounting to
$7.322 million was declared.
evenTs suBseQuenT To RePoRTIng dATe
Subsequent to 31 August 2010 the $275,000,000 securitisation
facility was extended to May 2013 and the $80,000,000 Aspire
securitisation facility was reduced to $70,000,000 and
extended to May 2012.
On 22 October 2010, the Company obtained its lenders’
consents for not achieving, during the 12 months ended 31
August 2010, a minimum performance target required under
the lending terms. The basis of the performance target is the
budgeted earnings before interest and taxes. The covenant
applies to all Australian debt and no additional obligations
were imposed by the lenders.
On 28 October 2010, a final dividend of 1.5 cents per share,
fully franked to be paid on 15 December 2010, amounting to
$7.322 million was declared.
Other than above, there has not arisen in the interval
between the end of the financial period and the date of this
report any item, transaction or event of a material and
unusual nature likely, in the opinion of the directors of the
Company, to affect significantly the operations of the
consolidated entity, the results of those operations or the
state of affairs of the consolidated entity in future years.
LIkeLy deveLoPmenTs
The consolidated entity will continue to pursue its policy of
improving the profitability and market share of each of its
major operating businesses during the next financial year.
Further information regarding the business strategies of the
consolidated entity and the expected results of those
operations in future financial years have not been included in
this report as disclosure of this information would likely result in
unreasonable prejudice to the consolidated entity.
dIRecToRs’ InTeResTs
The relevant direct and indirect and beneficial interest of
each director, in the share capital of the Company, as
notified by the directors to the Australian Securities Exchange
in accordance with section 205G(1) of the Corporations Act
2001 at the date of this report is as follows:
oPTIons gRAnTed To dIRecToRs And offIceRs of The comPAny
Details of the performance rights granted to directors and
officers of the Company are set out in the Remuneration
report.
InsuRAnce And IndemnIfIcATIon of dIRecToRs And offIceRs
During the year the Company paid a premium in respect of
a contract insuring its directors and officers against all
liabilities to another person (other than the Company or a
related body corporate) that may arise from their position,
except where the liability arises out of conduct involving a
lack of good faith. The contract covers any past, present or
future director, secretary, executive officer or employee of
the Company and its controlled entities. Further details have
not been disclosed due to confidentiality provisions of the
contract of insurance.
non-AudIT seRvIces
During the year KPMG, the Company’s auditor, has
performed certain other services in addition to their statutory
duties.
The Board has considered the non-audit services provided
during the period by the auditor and in accordance with
written advice provided by resolution of the Audit and Risk
Committee, is satisfied that the provision of those non-audit
services during the period by the auditor is compatible with,
and did not compromise, the auditor independence
requirements of the Corporations Act 2001 for the following
reasons:
• All non-audit services were subject to the corporate
governance procedures adopted by the Company and
have been reviewed by the Audit and Risk Committee
options/
Performance
ordinary Rights over
shares ordinary shares
Mr P R Robinson 202,168 –
Ms E C Holley 16,667 –
Mr R D Millner 755,001 –
Mr S P Roche 336,667 610,500
Dr M R Wooldridge – –
Mr M Hampton 108,334 –
Ms L Ausburn 83,334 –
Mr G Masters – –
section 2
Directors’ report continued
18 Annual Report 2010 Australian Pharmaceutical Industries Limited

to ensure they do not impact the integrity and
objectivity of the auditor; and
• The non-audit services provided do not undermine the
general principles relating to auditor independence as
set out in APES 110 Code of Ethics for Professional
Accountants, as they did not involve reviewing or
auditing the auditor’s own work, acting in a
management or decision making capacity for the
Company, acting as an advocate for the Company,
or jointly sharing risks and rewards.
Details of the amounts paid to the auditor of the
Company, KPMG, and its related practices for audit and
non-audit services provided during the period are set out
below.
section 2
Amounts Paid to Auditor year ended year ended
In AUD 31 August 2010 31 August 2009
Audit services
KPMG Australia
– Audit and review of financial reports 521,864 475,000
Overseas KPMG firms
– Audit and review of financial reports 32,200 40,000
554,064 515,000
other services
Auditors of the Company
KPMG Australia
– Other assurance services 64,137 –
– Taxation services – 30,780
Overseas KPMG offices
– Taxation services 41,914 14,317
Total 660,115 560,097
Lead Auditor’s Independence declaration
The Lead Auditor’s Independence Declaration is set out on page 20 and forms part of the Directors’ report for the financial
year ended 31 August 2010.
Rounding off of Amounts
The Company is of a kind referred to in ASIC Class Order 98/100 dated 10 July 1998 and in accordance with that Class Order,
amounts in the financial report and the Directors’ report have been rounded off to the nearest thousand dollars, unless
otherwise stated.
Dated at Sydney, 15 November 2010
Signed in accordance with a resolution of the directors:
Peter R. Robinson
Director
19Annual Report 2010
ABN 57 000 004 320 Australian Pharmaceutical Industries Limited

LeAd AudIToR’s IndePendence decLARATIon undeR secTIon 307c of The coRPoRATIons AcT 2001
To: the directors of Australian Pharmaceutical Industries Limited
I declare that, to the best of my knowledge and belief, in relation to the audit for the financial year ended 31 August 2010 there
have been:
• no contraventions of the auditor independence requirements as set out in the Corporations Act 2001 in relation to the audit;
and
• no contraventions of any applicable code of professional conduct in relation to the audit.
KPMG
Paul mcdonald
Partner
Melbourne, 15 November 2010
section 3
Auditor’s Independence Declaration
20 Annual Report 2010 Australian Pharmaceutical Industries Limited

consolidated
yearended yearended
31 August 31 August
In thousands of AUD Note 2010 2009
Revenue 3 3,713,312 3,549,734
Cost of sales (3,338,186) (3,180,802)
gross profit 375,126 368,932
Other income and (expense) 3 3,710 6,081
Warehousing and distribution expenses (113,284) (98,412)
Marketing and sales expenses (152,629) **(156,936)
Administration and general expenses (63,922) (70,604)
Result from operating activities 49,001 **49,061
Financial income 12,081 3,776
Financial expenses (26,051) (25,345)
net financing costs 5 (13,970) (21,569)
Share of profit/(loss) of associates 12 637 (713)
Profit before tax 35,668 **26,779
Income tax expense 6 (13,022) **(8,459)
Profit for the period 22,646 **18,320
Attributable to:
Equity holders of the Company 22,646 **18,320
Profit for the period 22,646 **18,320
earnings per share (cents per share):
Basic earnings per share from continuing operations 7 5.1 *6.2
Diluted earnings per share from continuing operations 7 5.1 *6.2
* Earnings per share restated for the entitlement offers announced on 21 October 2009 and completed on 17 November 2009.
**Restated due to the change in accounting policy (refer to note 1(b)(i) for further details).
Notes to the financial statements are annexed.
section 4
Income statement
21Annual Report 2010
ABN 57 000 004 320 Australian Pharmaceutical Industries Limited

section 5
Statement of comprehensive income
consolidated
yearended yearended
31 August 31 August
In thousands of AUD Note 2010 2009
Profit after income tax for the period 22,646 *18,320
Foreign exchange translation differences (1,291) (84)
Effective portion of changes in fair value of cash flow hedges, net of tax – (397)
other comprehensive expense for the period, net of Income tax (1,291) (481)
Total comprehensive income for the period attributable to equity holders of the company 21,355 *17,839
Notes to the financial statements are annexed.
*Restated due to the change in accounting policy (refer to note 1(b)(i) for further details).
22 Annual Report 2010 Australian Pharmaceutical Industries Limited

consolidated
As at As at
31 August 31 August
In thousands of AUD Note 2010 2009
Assets
Cash and cash equivalents 26 29,431 5,856
Trade and other receivables 8 700,278 251,348
Inventories 9 322,148 *290,348
Total current assets 1,051,857 547,552
Trade and other receivables 8 73,759 147,511
Investments accounted for using the equity method 12 24,304 23,667
Deferred tax assets 13 9,646 *14,346
Property, plant and equipment 14 128,285 112,307
Intangible assets 15 197,092 200,073
Total non-current assets 433,086 497,904
Total assets 1,484,943 1,045,456
Liabilities
Trade and other payables 16 659,123 564,809
Loans and borrowings 17 201,161 1,140
Employee benefits 18 13,507 13,560
Provisions 19 2,631 2,587
Income tax payable 11 3 9,133
Total current liabilities 876,425 591,229
Trade and other payables 16 10,544 9,318
Loans and borrowings 17 490 6,097
Employee benefits 18 3,621 3,322
Provisions 19 2,688 2,750
Total non-current liabilities 17,343 21,487
Total liabilities 893,768 612,716
net assets 591,175 432,740
equity
Share capital 566,461 419,499
Reserves (5,052) (3,907)
Retained earnings 29,766 *17,148
Total equity 591,175 432,740
Notes to the financial statements are annexed.
*Restated due to the change in accounting policy (refer to note 1(b)(i) for further details).
section 6
Statement of financial position
23Annual Report 2010
ABN 57 000 004 320 Australian Pharmaceutical Industries Limited

section 7
Statement of cash flows
consolidated
yearended yearended
31 August 31 August
In thousands of AUD Note 2010 2009
Receipts from customers 4,024,829 3,880,082
Payments to suppliers and employees (3,943,954) (3,846,322)
cash generated from operations 80,875 33,760
Interest received 4,654 3,776
Financing costs paid (26,051) (25,345)
Income taxes paid (16,128) (632)
net cash from operating activities 26 43,350 11,559
cash flows from investing activities
Proceeds from sale of stores, property, plant and equipment 80 8,760
Acquisition of property, plant and equipment (33,651) (43,456)
Deferred consideration received 9,600 182
Repayment of loan from associate 10,000 -
Repayment of loan from employee 86 -
Payment for intangibles (842) (161)
net cash from investing activities (14,727) (34,675)
cash flows from financing activities
Proceeds from issue of shares, net of share issue costs 145,660 -
Disinvestment of securitised receivable (139,782) (10,000)
Payment of finance lease liabilities (882) (1,363)
Dividends paid (10,028) (2,573)
net cash from financing activities (5,032) (13,936)
Net increase in cash and cash equivalents 23,591 (37,052)
Cash and cash equivalents at beginning of period 5,856 42,906
Effect of exchange rate fluctuations on cash held (16) 2
cash and cash equivalents at the end of the period 26 29,431 5,856
Notes to the financial statements are annexed.
24 Annual Report 2010 Australian Pharmaceutical Industries Limited
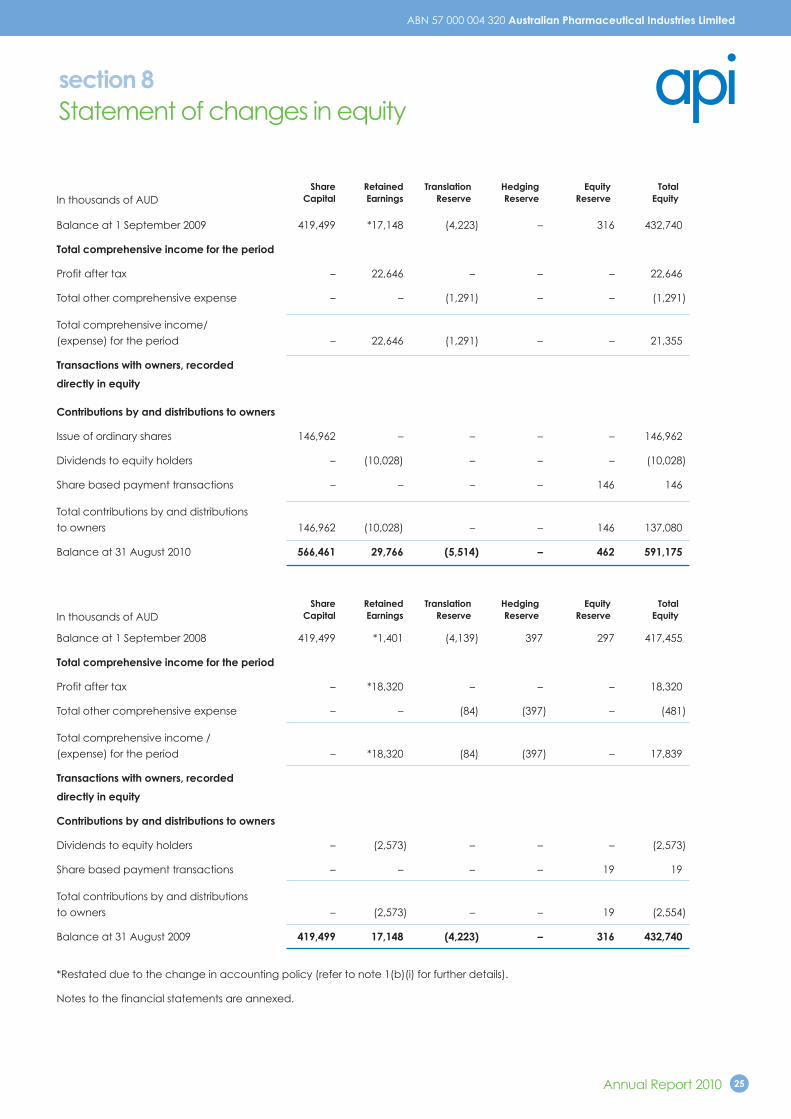
section 8
Statement of changes in equity
share Retained Translation hedging equity Total
In thousands of AUD capital earnings Reserve Reserve Reserve equity
Balance at 1 September 2009 419,499 *17,148 (4,223) – 316 432,740
Total comprehensive income for the period
Profit after tax – 22,646 – – – 22,646
Total other comprehensive expense – – (1,291) – – (1,291)
Total comprehensive income/
(expense) for the period – 22,646 (1,291) – – 21,355
Transactions with owners, recorded
directly in equity
contributions by and distributions to owners
Issue of ordinary shares 146,962 – – – – 146,962
Dividends to equity holders – (10,028) – – – (10,028)
Share based payment transactions – – – – 146 146
Total contributions by and distributions
to owners 146,962 (10,028) – – 146 137,080
Balance at 31 August 2010 566,461 29,766 (5,514) – 462 591,175
share Retained Translation hedging equity Total
In thousands of AUD capital earnings Reserve Reserve Reserve equity
Balance at 1 September 2008 419,499 *1,401 (4,139) 397 297 417,455
Total comprehensive income for the period
Profit after tax – *18,320 – – – 18,320
Total other comprehensive expense – – (84) (397) – (481)
Total comprehensive income /
(expense) for the period – *18,320 (84) (397) – 17,839
Transactions with owners, recorded
directly in equity
contributions by and distributions to owners
Dividends to equity holders – (2,573) – – – (2,573)
Share based payment transactions – – – – 19 19
Total contributions by and distributions
to owners – (2,573) – – 19 (2,554)
Balance at 31 August 2009 419,499 17,148 (4,223) – 316 432,740
*Restated due to the change in accounting policy (refer to note 1(b)(i) for further details).
Notes to the financial statements are annexed.
25Annual Report 2010
ABN 57 000 004 320 Australian Pharmaceutical Industries Limited

section 9
Notes to the consolidated financial statements
(a) Reporting entity
Australian Pharmaceutical Industries Limited (the
‘Company’) is a company domiciled in Australia whose
shares are publicly traded on the Australian Stock
Exchange. The summarised information from the
Company’s financial statements are included in note 10.
The consolidated financial report of the Company
included herein comprises the Company and its
subsidiaries (together referred to as the ‘consolidated
entity’) and the consolidated entity’s interest in
associates and jointly controlled entities.
The financial report was authorised for issue by the
directors on 15 November, 2010.
(b)statement of compliance and Basis ofPreparation
The financial report is a general purpose financial report
which has been prepared in accordance with Australian
Accounting Standards (‘AASBs’) adopted by the
Australian Accounting Standards Board (‘AASB’) –
including Australian Interpretations and the Corporations
Act 2001. The financial report of the consolidated entity
also complies with International Financial Reporting
Standards (IFRS) and interpretations adopted by the
International Accounting Standards Board.
The financial report is presented in Australian dollars,
which is the Company’s and consolidated entity’s
functional currency.
The financial report is prepared on the historical cost basis
except that derivative financial instruments are stated as
their fair value.
The consolidated entity is of a kind referred to in ASIC
Class Order 98/100 dated 10 July 1998 and in
accordance with that Class Order, amounts in the
financial report and Directors’ Report have been
rounded off to the nearest thousand dollars, unless
otherwise stated.
The preparation of a financial report in conformity with
Australian Accounting Standards requires management
to make judgements, estimates and assumptions that
affect the application of policies and reported amounts
of assets and liabilities, income and expenses. Actual
results may differ from these estimates. The estimates and
underlying assumptions are reviewed on an ongoing
basis. Revisions to accounting estimates are recognised in
the period in which the estimate is revised and in future
periods.
In particular, information about significant areas of
estimation, uncertainty and critical judgements in
applying accounting policies that have the most
significant effect on the amount recognised in the
financial statements include:
• Intangibles - measurement of recoverable amount
of cash generating units;
• Employee benefits - measurement of defined benefit
obligations and share based payments;
• Provisions - measurement of recoverable amount of
receivables and inventory; and
• Financial instruments – measurement of recoverable
amount of financial assets and fair value of
derivatives.
The accounting policies set out below have been applied
consistently to all periods presented in the consolidated
financial report by all entities in the consolidated entity.
Issued standards not early adopted
The following standards, amendments to standards and
interpretations have been identified as those which may
impact the entity in the period of initial application. They are
available for early adoption at 31 August 2010 but have not
been applied in preparing this financial report.
• AASB 124 Related Party Disclosures (revised December
2009) simplifies the related party disclosures. These
amendments, which will become mandatory for the
Group’s 31 August 2012 financial statements are not
expected to have any impact on the financial
statements; and
• AASB 9 Financial Instruments includes requirements for the
classification and measurement of financial assets
resulting from the first part of Phase 1 of the project to
replace AASB 139 Financial Instruments:Recognition and
Measurement. AASB 9 will become mandatory for the
Group’s 31 August 2014 financial statements.
Retrospective application is generally required, although
there are exceptions, particularly if the entity adopts the
standard for the year ending 31 August 2012 or earlier.
The Group has not yet determined the potential effect of
the standard.
changes in accounting policies
(i) Treatment of advertising & promotion materials
The consolidated entity has adopted AASB 2008-5
Amendments to Australian Accounting Standards
arising from the Annual Improvements Project (AASB 8-
5) which became effective for the accounting periods
commencing on or after 1 January 2009. Adopting this
standard requires the consolidated entity to expense
advertising and promotional materials upon control
passing to the buyer. Prior to adoption of this standard
the consolidated entity initially capitalised advertising
and promotional expenditure and then expensed such
costs as utilised. Therefore, the consolidated entity has
changed its accounting policy with respect to
advertising and promotional materials to comply with
AASB 2008-5.
In accordance with AASB 108 Accounting Policies,
Changes in Accounting Estimates and Errors, the
consolidated entity has restated the prior year
balances.
1. sIgnIfIcAnT AccounTIng PoLIcIes
26 Annual Report 2010 Australian Pharmaceutical Industries Limited

The change in accounting policy had the following impact
on the company and consolidated financial statements:
year ended
In thousands of AUD 31 August 2009
Income statement for the year ended
31 August 2009
Increase/(decrease) in Marketing and
sales expense 397
Increase/(decrease) in Income tax expense (119)
Decrease in Profit after tax 278
Recognised income and expense for the
year ended 31 August 2009
Decrease in Profit for the period 278
statement of financial position as at 31 August
Increase/(decrease) in Inventory (2,554)
Increase/(decrease) in Deferred tax assets 766
Increase/(decrease) in Retained earnings (1,788)
The adjustment to retained earnings for the Company and
consolidated entity at 1 Sept 2008 was a decrease of
$1,509,000, related to the year ended 31 August 2009. The
change in accounting policy had negligible impact per
share on basic and diluted earnings per share for the year
ended 31 August 2009.
(ii) Determination and presentation of operating segments
As a result of consolidated entity adopting AASB 8
Operating Segments, which became effective for the
accounting periods commencing on or after 1 January
2009, the segment information is determined and
presented on the same basis as information that is
internally provided to the CEO, the chief operating
decision maker of the consolidated entity. The new
accounting policy in respect of operating segment
disclosures is presented in note 2.
(iii) Presentation of financial statements
The consolidated entity applies revised AASB 101
Presentation of Financial Statements which became
effective for the financial periods commencing on or
after 1 January 2009. As a result, the financial statements
as of and for the year ended 31 August 2010 include a
Consolidated Statement of Comprehensive Income
(which replaces the Consolidated Statements of
Recognised Income and Expense) and a Consolidated
Statement of Changes in Equity.
(iv) Business combinations
The group has adopted revised AASB 3 Business
Combinations (2008) and amended AASB 127
Consolidated and Separate Financial Statements (2008)
for business combinations occurring in the financial year
starting 1 September 2009. The change in accounting
policy has been applied prospectively and had no
impact on the earning per share as no business
combination has occurred in the current financial year.
(c) going concern basis of accounting
In preparing the Financial Report, the Directors made an
assessment of the ability of the consolidated entity to
continue as a going concern, which contemplates the
continuity of business operations, realisation of assets and
settlement of liabilities in the ordinary course of business.
As stated in note 29, at 31 August 2010 the consolidated
entity had breached certain loan covenants and
classified loans as current liabilities on the basis that the
loan facilities were due to expire within 12 months of the
balance date. Subsequent to the end of the financial
year the consolidated entity obtained a waiver from its
major financier for the covenant breaches and re-
negotiated the bank facilities. These new facilities have
maturity dates more than 12 months from balance date
and are subject to the consolidated entity continuing to
comply with certain covenants.
Based on budgeted trading results and cash flows, the
directors believe that the consolidated entity will
continue to meet its debt covenants. However, the
trading and cash flow budgets are necessarily based on
best-estimate assumptions that may or may not occur as
expected and are subject to influences and events
outside the control of the Consolidated Entity.
Should the ability of the consolidated entity to realise
sufficient cash flows from trading operations be restricted,
the consolidated entity will institute additional measures
to preserve cash. These may include (but are not limited
to) drawing down committed but undrawn debt facilities,
and restriction of capital and operating expenditures.
In addition to the foregoing, the consolidated entity has
long term loans to certain pharmacy customers (refer
note 21) and has guaranteed the bank facilities of some
pharmacy customers (refer note 23). The obligations
under these guarantees and the recovery of the loans is
dependent on the trading results and cash flows of the
pharmacy customers and the value of collateral held
over the receivables.
After making enquiries, and considering the uncertainties
described above, the directors have a reasonable
expectation that the consolidated entity has adequate
resources to continue to operate and meet its obligations
as they fall due for the foreseeable future. For these
reasons, they continue to adopt the going concern basis
in preparing the Consolidated Financial Report.
(d) Issued standards early adopted
The consolidated entity has elected to apply AASB 2009-5
Further Amendments to Australian Accounting Standards
arising from the Annual Improvements Project to the
annual reporting period beginning 1 September 2009.
section 9
sIgnIfIcAnT AccounTIng PoLIcIes continued
27Annual Report 2010
ABN 57 000 004 320 Australian Pharmaceutical Industries Limited

section 9
Notes to the consolidated financial statements continued
There are no changes resulting from the adoption of this
standard except for excluding segment assets and
liabilities.
(e) Basis of consolidation
(i) Subsidiaries
Subsidiaries are entities controlled by the Company.
Control exists when the Company has the power,
directly or indirectly, to govern the financial and
operating policies of an entity so as to obtain benefits
from its activities. In assessing control, potential voting
rights that presently are exercisable or convertible are
taken into account. The financial statements of
subsidiaries are included in the consolidated financial
statements from the date that control commences
until the date that control ceases. Investments in
subsidiaries are carried at their cost, less any
impairment, in the Company’s financial statements.
(ii) Associates
Associates are those entities for which the
consolidated entity has significant influence, but not
control, over the financial and operating policies. The
consolidated financial statements include the
consolidated entity’s share of the total recognised
gains and losses of associates on an equity
accounted basis, from the date that significant
influence commences until the date that significant
influence ceases. When the consolidated entity’s
share of losses exceeds its interest in an associate, the
consolidated entity’s carrying amount is reduced to
nil and recognition of further losses is discontinued
except to the extent that the consolidated entity has
an obligation or has made payments on behalf of an
associate.
In the Company’s financial statements, investments in
associates are carried at cost.
(iii) Transactions Eliminated on Consolidation
Intra-group balances and any unrealised gains and
losses or income and expenses arising from intra-
group transactions, are eliminated in preparing the
consolidated financial statements.
Unrealised gains arising from transactions with
associates and jointly controlled entities are
eliminated to the extent of the consolidated entity’s
interest in the entity with adjustments made to the
“Investment in associates” and “Share of associates
net profit” accounts.
Unrealised losses are eliminated in the same way as
unrealised gains, but only to the extent that there is no
evidence of impairment.
Gains and losses are recognised as the contributed
assets are consumed or sold by the associates and
jointly controlled entities or, if not consumed or sold by
the associate or jointly controlled entity, when the
consolidated entity’s interest in such entities is
disposed of.
(f) foreign currency
(i) Foreign Currency Transactions
Transactions in foreign currencies are translated to the
functional currencies of the consolidated entity
companies at the foreign exchange rate ruling at the
date of the transaction. Monetary assets and liabilities
denominated in foreign currencies at the balance
sheet date are translated to the functional currency
at the foreign exchange rate ruling at that date.
Foreign exchange differences arising on translation
are recognised in the income statement in other
income and expense. Non-monetary assets and
liabilities that are measured in terms of historical cost
in a foreign currency are translated using the
exchange rate at the date of the transaction. Non-
monetary assets and liabilities denominated in foreign
currencies that are stated at fair value are translated
to Australian dollars at foreign exchange rates ruling
at the dates the fair value was determined.
(ii) Financial Statements of Foreign Operations
The assets and liabilities of foreign operations,
including goodwill and fair value adjustments arising
on consolidation, are translated to Australian dollars
at foreign exchange rates ruling at the balance sheet
date. The revenues and expenses of foreign
operations are translated to Australian dollars at rates
approximating to the foreign exchange rates ruling at
the dates of the transactions. Foreign exchange
differences arising on translation are recognised
directly in a separate component of equity.
In respect of all foreign operations, any differences
that have arisen after 1 May 2004, the date of
transition to AIFRS, are presented as a separate
component of equity. Differences arising prior to 1
May 2004 have been transferred to retained earnings.
(g) financial Instruments
(i) Non-derivative Financial Instruments
Non-derivative financial instruments comprise
investments in equity and debt securities, trade and
other receivables, cash and cash equivalents, loans
and borrowings, and trade and other payables.
Non-derivative financial instruments are recognised
initially at fair value plus, for instruments not measured
at fair value through profit or loss, any directly
attributable transaction costs, except as described
below. Any financial instruments subject to material
deferred settlement terms are recognised at their
present value discounted using an interest rate that
reflects the credit risk applicable to the counterparty
equivalent to the extent of any underlying security.
The unwinding of discounting is recognised in net
finance costs. Subsequent to initial recognition non-
derivative financial instruments are measured as
described below.
A financial instrument is recognised if the
consolidated entity becomes a party to the
sIgnIfIcAnT AccounTIng PoLIcIes continued
28 Annual Report 2010 Australian Pharmaceutical Industries Limited

contractual provisions of the instrument. Financial
assets are derecognised if the consolidated entity’s
contractual rights to the cash flows from the financial
assets expire or if the consolidated entity transfers the
financial asset of another party without retaining
control or substantially all risks and rewards of the
asset. Regular purchases and sales of financial assets
are accounted for at trade date, i.e. the date that
the consolidated entity commits itself to purchase or
sell the asset. Financial liabilities are derecognised if
the consolidated entity’s obligations specified in the
contract expire or are discharged or cancelled.
Cash and cash equivalents comprise cash balances
and call deposits. Bank overdrafts that are repayable
on demand and from an integral part of the
consolidated entity’s cash management are included
as a component of cash and cash equivalents for the
purpose of the statement of cash flows.
Held to Maturity Investments
If the consolidated entity has the positive intent and
ability to hold debt securities to maturity, then they
are classified as held-to-maturity. Held-to-maturity
investments are measured at amortised cost using the
effective interest method, less any impairment losses.
Other
Other non-derivative financial instruments are
measured at amortised cost using the effective
interest method, less any impairment losses.
(ii) Derivative Financial Instruments
The consolidated entity sometimes holds derivative
financial instruments to hedge its interest rate and
foreign currency risk exposures.
Embedded derivatives are separated from the host
contract and accounted for separately if the
economic characteristics and risks of the host
contract and the embedded derivative are not
closely related, a separate instrument with the same
terms as the embedded derivative would meet the
definition of a derivative, and the combined
instrument is not measured at fair value through profit
or loss.
Derivatives are recognised initially at fair value;
attributable transaction costs are recognised in profit
or loss when incurred. Subsequent to initial
recognition, derivatives are measured at fair value,
and changes therein are accounted for as described
below.
Cash Flow Hedges
Changes in the fair value of the derivative hedging
instrument designated as a cash flow hedge are
recognised directly in other comprehensive income to
the extent that the hedge is effective. To the extent
that the hedge is ineffective, changes in fair value are
recognised in profit or loss.
If the hedging instrument no longer meets the criteria
for hedge accounting, expires or is sold, terminated or
exercised, then hedge accounting is discontinued
prospectively. The cumulative gain or loss previously
recognised in other comprehensive income remains
there until the forecast transaction occurs. When the
hedged item is a non-financial asset, the amount
recognised in equity is transferred to the carrying
amount of the asset when it is recognised. In other
cases the amount recognised in other comprehensive
income is transferred to profit or loss in the same
period that the hedged item affects profit or loss.
(iii) Ordinary Shares
Incremental costs directly attributable to issue of
ordinary shares and share options are recognised as a
deduction from equity, net of any related income tax
benefit.
dividends
Dividends are recognised as a liability in the period in
which they are declared.
(iv) De-recognition of Financial Assets and Liabilities
A financial asset (or where applicable, a part of a
financial asset or part of a group or similar financial
assets) is derecognised when:
• the rights to receive cash flows from the asset
have expired;
• the consolidated entity retains the right to receive
cash flows from the asset, but has assumed an
obligation to pay them in full without material
delay to a third party; or
• the consolidated entity has transferred its rights to
receive cash flows from the asset and either (a)
has transferred substantially all the risks and
rewards of the asset, or (b) has neither transferred
nor retained substantially all the risks and rewards
of the asset, but has transferred control of the
asset.
A financial liability is derecognised when the
obligation under the liability is discharged, cancelled
or expired. When an existing financial liability is
replaced by another from the same lender on
substantially different terms, or the terms of an existing
liability are substantially modified, such an exchange
or modification is treated as a de-recognition of the
original liability and the recognition of a new liability.
The difference in the respective carrying amounts is
recognised in profit and loss.
For the year ended 31 August 2009, the consolidated
entity’s investment in its securitisation program was
classified as a non-current interest bearing note
receivable. The note receivable is carried at
amortised cost using the effective interest rate
method.
For the year ended 31 August 2010, the consolidated
entity’s receivables sold under any of the securitisation
programs, as well as related liability to the buyer, have
not been derecognised as risks and rewards are no
section 9
sIgnIfIcAnT AccounTIng PoLIcIes continued
29Annual Report 2010
ABN 57 000 004 320 Australian Pharmaceutical Industries Limited

longer transferred to the buyer.
(v) Financial guarantees
Financial guarantees are initially recognised at fair
value. The fair value is amortised as an expense
through the income statement over the life of the
guarantee. Subsequent to initial measurement, the
guarantee is measured at the higher of the amortised
balance of the guarantee or the value of the
guarantee determined in accordance with AASB137
Provisions, Contingent assets and liabilities. The
provision would be measured to at the present value
of any expected payment to which the consolidated
entity has an obligation to meet. The face value of all
guarantees issued by the consolidated entity is
presented in Note 23.
(h) Property, Plant and equipment
(i) Recognition and Measurement
Items of property, plant and equipment are stated at
cost less accumulated depreciation and impairment
losses. The cost includes expenditures that are directly
attributable to the acquisition of the asset. The cost of
self-constructed assets includes the cost of materials,
direct labour, any other costs directly attributable to
bringing the asset to a working condition for its
intended use, and the costs of dismantling and
removing the items and restoring the site on which
they are located. Purchased software that is integral
to the functionality of the equipment is capitalised as
part of that equipment.
Where parts of an item of property, plant and
equipment have different useful lives, they are
accounted for as separate items of property, plant
and equipment.
(ii) Disposal of property, plant and equipment
Property, plant and equipment is derecognised when
scrapped or disposed of. For store sales, a disposal is
considered to have taken place when the significant
risks and rewards of ownership have passed to the
acquirer, there is no continuing involvement in the
asset and it is probable that the economic benefits
associated with the disposal will flow to the
consolidated entity. The proceeds are recognised at
the fair value of consideration received and a gain or
loss on disposal is recognised equal to the difference
between this amount and the carrying value of the
asset disposed of.
(iii) Subsequent Costs
The consolidated entity recognises in the carrying
amount of an item of property, plant and equipment
the cost of replacing part of such an item when that
cost is incurred if it is probable that the future
economic benefits embodied within the item will flow
to the consolidated entity and the cost of the item
can be measured reliably. All other costs are
recognised in profit and loss as an expense as
incurred.
(iv) Depreciation
Depreciation is charged to profit and loss on a
straight-line basis over the estimated useful lives of
each part of an item of property, plant and
equipment. Land is not depreciated.
The estimated useful lives in the current and
comparative periods are as follows:
• buildings 40 years
• plant and equipment 3-15 years
• fixtures and fittings 3-10 years
The residual value, the useful life and the depreciation
method applied to an asset are reassessed at least
annually.
(i) Intangible Assets
(i) Goodwill
Business combinations prior to 1 may 2004
Goodwill is included on the basis of its deemed cost,
which represents the amount recorded under
previous GAAP.
Business combinations since 1 may 2004
All business combinations are accounted for by
applying the purchase method. Goodwill represents
the excess of the cost of the acquisition over the fair
value of the net identifiable assets acquired.
Goodwill is stated at cost less any accumulated
impairment losses. In respect of associates, the
carrying amount of goodwill is included in the carrying
amount of the investment in the associate.
Negative goodwill arising on an acquisition is
recognised directly in profit or loss.
(ii) Brand Names
Brand names acquired are included in the financial
statements at cost less impairment losses.
Brand names are not amortised as the directors
believe the useful lives of these assets are considered
indefinite at this point of time. The consolidated
entity’s brand names have an unlimited legal life and
based on industry experience it is rare for leading
brand names to disappear or become commercially
or technically obsolete. If an event occurs which
results in an impairment of the value of a brand name
then the difference between recoverable amount
and carrying value is charged against profit and loss
in the year in which the event occurred.
Independent valuations of brand names are
obtained during the year of acquisition. Expenditure
incurred in developing, maintaining and enhancing
brand names is charged against profit and loss in the
year in which it is incurred. The brand names held by
the consolidated entity are considered to have an
indefinite useful life and accordingly are not
amortised.
sIgnIfIcAnT AccounTIng PoLIcIes continued
section 9
Notes to the consolidated financial statements continued
30 Annual Report 2010 Australian Pharmaceutical Industries Limited

(iii) Research and Development
Expenditure on research activities, undertaken with
the prospect of gaining new technical knowledge
and understanding, is recognised in the income
statement as an expense as incurred.
Expenditure on development activities, whereby
research findings are applied to a plan or design for
the production of new or substantially improved
products and processes, is capitalised if the product
or process is technically and commercially feasible
and the consolidated entity has sufficient resources to
complete development. The expenditure capitalised
includes the cost of materials, direct labour and
appropriate proportion of overheads. Other
development expenditure is recognised in profit and
loss as an expense as incurred. Capitalised
development expenditure is stated at cost less
accumulated amortisation and impairment losses.
(iv) Other Intangible Assets
Other intangible assets that are acquired by the
consolidated entity are stated at cost less
accumulated amortisation and impairment losses.
(v) Subsequent Expenditure
Subsequent expenditure is capitalised only when it
increases the future economic benefits embodied in
the specific asset to which it relates. All other
expenditure is expensed as incurred.
(vi) Amortisation
Amortisation is charged to the income statement on
a straight-line basis over the estimated useful lives of
intangible assets unless such lives are indefinite. Other
intangible assets are amortised from the date they
are available for use. The estimated useful lives in the
current and comparative periods are as follows:
• capitalised software
development expenses 2-5 years
(j) Inventories
Inventories are stated at the lower of cost and net
realisable value. Net realisable value is the estimated
selling price in the ordinary course of business, less the
estimated costs of completion and selling expenses.
The cost of inventories is based on the first-in first-out
principle and includes expenditure incurred in acquiring
the inventories and bringing them to their existing
location and condition net of any rebates or trade
discounts received or receivable. In the case of
manufactured inventories and work in progress, cost
includes an appropriate share of overheads based on
normal operating capacity.
(k) Impairment
(i) Financial Assets
A financial asset is considered to be impaired if
objective evidence indicates that one or more
events have had a negative effect on the estimated
future cash flows of that asset.
Objective evidence that financial assets (including
equity securities) are impaired can include default or
delinquency by a debtor, restructuring of an amount
due to the Group on terms that the Group would not
consider otherwise, indications that a debtor or issuer
will enter bankruptcy, the disappearance of an
active market for a security. In addition, for an
investment in an equity security, a significant or
prolonged decline in its fair value below its cost is
objective evidence of an impairment.
An impairment loss in respect of a financial asset
measured at amortised cost is calculated as the
difference between its carrying amount, and the
present value of the estimated future cash flows
discounted at the original effective interest rate,
including cash flows from the realisation of security
held, if applicable. An impairment loss in respect of
an available-for-sale financial asset is calculated by
reference to its current fair value.
Individually significant financial assets are tested for
impairment on an individual basis. The remaining
financial assets are assessed collectively in groups
that share similar credit risk characteristics. In assessing
collective impairment the Group uses historical trends
of the probability of default, timing of recoveries and
the amount of loss incurred, adjusted for
management’s judgement as to whether current
economic and credit conditions are such that the
actual losses are likely to be greater or less than
suggested by historical trends.
All impairment losses are recognised in profit or loss.
An impairment loss is reversed if the reversal can be
related objectively to an event occurring after the
impairment loss was recognised. For financial assets
measured at amortised cost and available-for-sale
financial assets that are debt securities, the reversal is
recognised in profit or loss. For available-for-sale
financial assets that are equity securities, the reversal
is recognised directly in equity.
(ii) Non-Financial Assets
The carrying amounts of the consolidated entity’s
non-financial assets, other than inventories and
deferred tax assets, are reviewed at each reporting
date to determine whether there is any indication of
impairment. If any such indication exists then the
asset’s recoverable amount is estimated. For goodwill
and intangible assets that have indefinite lives or that
are not yet available for use, recoverable amount is
estimated at each reporting date.
section 9
sIgnIfIcAnT AccounTIng PoLIcIes continued
31Annual Report 2010
ABN 57 000 004 320 Australian Pharmaceutical Industries Limited

An impairment loss is recognised if the carrying
amount of an asset or its cash-generating unit
exceeds its recoverable amount. A cash-generating
unit is the smallest group of assets that generates cash
flows that largely are independent from other assets
and groups. Impairment losses are recognised in profit
or loss. Impairment losses recognised in respect of
cash-generating units and then to reduce the
carrying amount of the other assets in the unit (group
of units) on a pro rata basis.
The recoverable amount of an asset or cash-
generating unit is the greater of its value in use and its
fair value less costs to sell. In assessing value in use, the
estimated future cash flows are discounted to their
present value using
a pre-tax discount rate that reflects current market
assessments of the time value of money and the risks
specific to the asset.
An impairment loss in respect of goodwill is not
reversed. In respect of other assets, impairment losses
recognised in prior periods are assessed at each
reporting date for any indications that the loss has
decreased or no longer exists. An impairment loss is
reversed if there has been a change in the estimates
used to determine the recoverable amount. An
impairment loss is reversed only to the extent that the
asset’s carrying amount does not exceed the carrying
amount that would have been determined, net of
depreciation or amortisation, if no impairment loss
had been recognised.
(l) Leased Assets
Leases in terms of which the consolidated entity
assumes substantially all the risks and rewards of
ownership are classified as finance leases. Upon initial
recognition the leased asset is measured at an
amount equal to the lower of its fair value and the
present value of the minimum lease payments.
Subsequent to initial recognition, the asset is
accounted for in accordance with the accounting
policy applicable to that asset.
Other leases are operating leases, the leased assets
are not recognised in the consolidated entity’s
balance sheet.
(m) employee Benefits
(i) Defined Contribution Superannuation Funds
Obligations for contributions to defined contribution
superannuation funds are recognised as an expense
in profit and loss as incurred.
(ii) Defined Benefit Superannuation Funds
The consolidated entity’s net obligation in respect of
defined benefit pension plans is calculated by
estimating the amount of future benefit that
employees have earned in return for their service in
the current and prior periods; that benefit is
discounted to determine its present value, and the fair
value of any plan assets is deducted.
The discount rate is the yield at the balance sheet
date on Commonwealth government bonds that
have maturity dates approximating the terms of the
consolidated entity’s obligations. The calculation is
performed by a qualified actuary using the projected
unit credit method.
When the benefits of a plan are improved, the portion
of the increased benefit relating to past service by
employees is recognised as an expense in the income
statement on a straight-line basis over the average
period until the benefits become vested. To the extent
that the benefits vest immediately, the expense is
recognised immediately in the profit and loss.
All actuarial gains and losses as at 1 May 2004, the
date of transition to AIFRSs, were recognised. In
respect of actuarial gains and losses that arise
subsequent to 1 May 2004 in calculating the
consolidated entity’s obligation in respect of a plan,
to the extent that any cumulative unrecognised
actuarial gain or loss exceeds 10 per cent of the
greater of the present value of the defined benefit
obligation and the fair value of plan assets, that
portion is recognised in the income statement over
the expected average remaining working lives of the
active employees participating in the plan. Otherwise,
the actuarial gain or loss is not recognised.
When the calculation results in plan assets exceeding
liabilities to the consolidated entity, the recognised
asset is limited to the net total of any unrecognised
actuarial losses and past service costs and the present
value of any future refunds from the plan or
reductions in future contributions to the plan.
Past service cost is the increase in the present value of
the defined benefit obligation for employee services
in prior periods, resulting in the current period from the
introduction of, or changes to, post-employment
benefits or other long-term employee benefits. Past
service costs may either be positive (where benefits
are introduced or improved) or negative (where
existing benefits are reduced).
(iii) Long-term Service Benefits
The consolidated entity’s net obligation in respect of
long-term service benefits, other than defined benefit
superannuation funds, is the amount of future benefit
that employees have earned in return for their service
in the current and prior periods. The obligation is
calculated using expected future increases in wage
and salary rates including related on-costs and
expected settlement dates, and is discounted using
the rates attached to the Commonwealth
Government bonds at the balance sheet date which
have maturity dates approximating to the terms of
the consolidated entity’s obligations.
sIgnIfIcAnT AccounTIng PoLIcIes continued
section 9
Notes to the consolidated financial statements continued
32 Annual Report 2010 Australian Pharmaceutical Industries Limited

(iv) Wages, Salaries, Annual Leave and Non-monetary
Benefits
Liabilities for employee benefits for wages, salaries,
annual leave and sick leave that are expected to be
settled within 12 months of the reporting date
represent present obligations resulting from
employees’ services provided to reporting date, are
calculated at undiscounted amounts based on
remuneration wage and salary rates that the
consolidated entity expects to pay as at reporting
date including related on-costs, such as workers
compensation insurance and payroll tax. Non-
accumulating non-monetary benefits, such as cars
and free or subsidised goods and services, are
expensed based on the net marginal cost to the
consolidated entity as the benefits are taken by the
employees.
(v) Share-based Payment Transactions
Share Performance Rights granted to employees are
recorded at fair value and recognised as an expense
with a corresponding increase in equity. The fair value
is initially measured at grant date and spread over
the period during which the employees become
unconditionally entitled to payment. The fair value of
the Share Performance Rights is measured based on
the Monte Carlo Simulation formula for the EPS and
TSR performance hurdles and Black-Scholes Option
Pricing model for the ROE performance hurdle, taking
into account the terms and conditions upon which
the instruments were granted.
(n) Provisions
A provision is recognised in the balance sheet when the
consolidated entity has a present legal or constructive
obligation as a result of a past event, and it is probable
that an outflow of economic benefits will be required to
settle the obligation. Provisions are determined by
discounting the expected future cash flows at a pre-tax
rate that reflects current market assessments of the time
value of money and, where appropriate, the risks specific
to the liability.
(i) Onerous leases
A provision for onerous leases is recognised when the
expected benefits to be derived by the Group from a
lease contract are lower than the unavoidable cost
of meeting its obligations under the lease contract.
The provision is measured at the present value of the
lower of the expected cost of terminating the lease
contract and the expected net cost of continuing
with the lease contract.
(ii) Dismantling and Make Good
The provision is the best estimate of the present value
of the expenditure required to complete dismantling
and make good obligations on property leases at the
reporting date, based on current lease contracts.
Future dismantling and make good costs are
reviewed annually and any changes are reflected in
the present value of the dismantling and make good
provision at the end of the reporting period.
The amount of the provision for future dismantling is
capitalised and is depreciated over the useful life.
Make good costs are provided for over the lease
term as the make good obligation arises. The
unwinding of the effect of discounting on the
provision is recognised as a finance cost.
(iii) Provision for Clubcard
The provision for Clubcard points in the Retail Division
is based upon the expected cost to the consolidated
entity on redemption of Clubcard vouchers. A
redemption rate is then applied based on historical
experience.
(o) Revenue
(i) Goods Sold and Services Rendered
Revenue from the sale of goods is recognised in the
income statement when the significant risks and
rewards of ownership have been transferred to the
buyer, usually when goods are delivered to
manufacturing and wholesale customers or the point
of sale for retail customers.
Revenue from services represents fees (including
licence and franchise fees), commissions earned and
Community Service Obligation income earned after
meeting government obligations, and is recognised
as it accrues.
No revenue is recognised if there are significant
uncertainties regarding recovery of the consideration
due, the costs incurred or to be incurred cannot be
measured reliably, there is a risk of return of goods, or
there is continuing management involvement with
the goods. Revenue is recognised net of returns,
allowances, trade discounts and volume rebates.
(ii) Loyalty Card
A provision for loyalty card deferred revenue is
recognised as a reduction in sales revenue when the
underlying products or services are sold. The deferred
revenue is based on historical loyalty card data and
a weighting of all possible outcomes against their
associated probabilities. Revenue is then earned
when loyalty card awards are redeemed.
(p) expenses
(i) Operating Lease Payments
Payments made under non-cancellable operating
leases are recognised in profit and loss on a straight-
line basis over the term of the lease. Lease incentives
received are recognised as an integral part of the
total lease expense and spread over the lease term.
(ii) Finance Lease Payments
Minimum lease payments are apportioned between
the finance charge and the reduction of the
outstanding liability. The finance charge is allocated
to each period during the lease term so as to
produce a constant periodic rate of interest on the
remaining balance of the liability.
section 9
sIgnIfIcAnT AccounTIng PoLIcIes continued
33Annual Report 2010
ABN 57 000 004 320 Australian Pharmaceutical Industries Limited

(iii) Net Financing Costs
Net financing costs comprise interest payable on
borrowings calculated using the effective interest
method, ancillary costs incurred in connection with
the arrangement of borrowing, the expense
associated with unwinding of the discount on
provisions and the income associated with unwinding
the discount on receivables, lease finance charges,
interest receivable on funds invested, dividend
income and gains and losses on hedging instruments
that are recognised in profit and loss. The cost of
debtor securitisation arrangements and the cost of
other arrangements that bring forward cash receipts
are also recorded as a finance cost. Interest income is
recognised in the income statement as it accrues,
using the effective interest method. Dividend income
is recognised in the income statement on the date
the entity’s right to receive payments is established.
The interest expense component of finance lease
payments is recognised in the income statement
using the effective interest method.
(q) Income Tax
Income tax on the profit or loss for the year comprises
current and deferred tax. Income tax is recognised in the
income statement except to the extent that it relates to
items recognised directly in equity, in which case it is
recognised in equity.
Current tax is the expected tax payable on the taxable
income for the year, using tax rates enacted or
substantively enacted at the balance sheet date, and
any adjustment to tax payable in respect of previous
years.
Deferred tax is recognised using the balance sheet liability
method, providing for temporary differences between
the carrying amounts of assets and liabilities for financial
reporting purposes and the amounts used for taxation
purposes. The following temporary differences are not
provided for: initial recognition of goodwill, the initial
recognition of assets or liabilities that affect neither
accounting nor taxable profit, and differences relating to
investments in subsidiaries to the extent that they will
probably not reverse in the foreseeable future. The
amount of deferred tax provided is based on the
expected manner of realisation or settlement of the
carrying amount of assets and liabilities, using tax rates
enacted or substantively enacted at the balance sheet
date.
A deferred tax asset is recognised only to the extent that it
is probable that future taxable profits will be available
against which the asset can be utilised. Deferred tax
assets are reduced to the extent that it is no longer
probable that the related tax benefit will be realised.
Additional income taxes that arise from the distribution of
dividends are recognised at the same time as the liability
to pay the related dividend.
Tax consolidation
The Company and its wholly-owned Australian resident
entities have formed a tax-consolidated group with effect
from 1 May 2003 and are therefore taxed as a single
entity from that date. The head entity within the tax-
consolidated group is Australian Pharmaceutical
Industries Limited.
Current tax expense/income, deferred tax liabilities and
deferred tax assets arising from temporary differences of
the members of the tax-consolidated group are
recognised in the separate financial statements of the
members of the tax-consolidated group using the
‘separate taxpayer within group’ approach by reference
to the carrying amounts of assets and liabilities in the
separate financial statements of each entity and the tax
values applying under tax consolidation.
Any current tax liabilities (or assets) and deferred tax
assets arising from unused tax losses of the subsidiaries is
assumed by the head entity in the tax-consolidated
group and are recognised as amounts payable
(receivable) to (from) other entities in the tax-
consolidated group in conjunction with any tax funding
arrangement amounts (refer below). Any difference
between these amounts is recognised by the Company
as an equity contribution or distribution.
The Company recognises deferred tax assets arising from
unused tax losses of the tax-consolidated group to the
extent that it is probable that future taxable profits of the
tax-consolidated group will be available against which
the asset can be utilised.
Any subsequent period adjustments to deferred tax assets
arising from unused tax losses as a result of revised
assessments of the probability of recoverability is
recognised by the head entity only.
nature of Tax funding Arrangements and Tax sharing
Arrangements
The head entity, in conjunction with other members of the
tax-consolidated group, has entered into a tax funding
arrangement which sets out the funding obligations of
members of the tax-consolidated group in respect of tax
amounts. The tax funding arrangements require
payments to/from the head entity equal to the current
tax liability (asset) assumed by the head entity and any
tax-loss deferred tax asset assumed by the head entity,
resulting in the head entity recognising an inter-entity
receivable (payable) equal in amount to the tax liability
(asset) assumed. The inter-entity receivable (payable) is
at call.
Contributions to fund the current tax liabilities are payable
as per the tax funding arrangement and reflect the timing
of the head entity’s obligation to make payments for tax
liabilities to the relevant tax authorities.
The head entity in conjunction with other members of the
tax-consolidated group, has also entered into a tax
sharing agreement. The tax sharing agreement provides
sIgnIfIcAnT AccounTIng PoLIcIes continued
section 9
Notes to the consolidated financial statements continued
34 Annual Report 2010 Australian Pharmaceutical Industries Limited

for the determination of the allocation of income tax
liabilities between the entities should the head entity
default on its tax payment obligations. No amounts have
been recognised in the financial statements in respect of
this agreement as payment of any amounts under the
tax sharing agreement is considered remote.
(r) operating segment
As of 1 September 2009, the group determined and
presents operating segments based on the information
that is internally provided to the CEO who is the Group’s
chief operating decision maker. This change in
accounting policy is due to the adoption of AASB 8
Operating Segments. Previously operating segments
were determined and presented in accordance with
AASB 114 Segment Reporting.
Comparative information has been re-presented in
conformity with the transitional requirements of such
standard. Since the change in accounting policy only
impacts presentation and disclosures, there is no impact
on the consolidated results.
An operating segment is a component of the group that
engages in business activities from which it may earn
revenues and incur expenses, including revenues and
expenses that relate to the transactions with any of the
Group’s other components. All operating segments’
operating results are regularly reviewed by the Group’s
CEO to make decisions about resources to be allocated
to the segment and assess its performance and for which
discrete financial information is available.
Segment results that are reported to the CEO include
items directly attributable to a segment as well as those
that can be allocated on a reasonable basis.
Unallocated items comprise mainly corporate costs,
finance costs and income tax.
Segment capital expenditure is the total costs incurred
during the period to acquire property, plant and
equipment and intangible assets other than goodwill.
(s) non-current Assets held for sale anddiscontinued operations
On initial classification as held for sale, non-current assets
and disposal groups are recognised at the lower of
carrying amount and fair value less costs to sell.
(t) goods and services Tax
Revenue, expenses and assets are recognised net of the
amount of goods and services tax (GST), except where
the amount of GST incurred is not recoverable from the
taxation authority. In these circumstances, the GST is
recognised as part of the cost of acquisition of the asset
or as part of the expense.
Receivables and payables are stated with the amount of
GST included. The net amount of GST recoverable from,
or payable to, the ATO is included as a current asset or
liability in the balance sheet.
Cash flows are included in the statement of cash flows on
a gross basis. The GST components of cash flows arising
from investing and financing activities which are
recoverable from, or payable to, the ATO are classified as
operating cash flows.
(u) earnings per share
The consolidated entity presents basic and diluted
earnings per share (EPS) data for its ordinary shares. Basic
EPS is calculated by dividing the profit or loss attributable
to ordinary shareholders of the Company by the
weighted average number of ordinary shares
outstanding during the period. Diluted EPS is determined
by adjusting the profit or loss attributable to ordinary
shareholders and the weighted average number of
ordinary shares outstanding for the effects of all dilutive
potential ordinary shares, which comprise share
performance rights granted to employees.
2. oPeRATIng segmenTs
For internal reporting and risk management purposes, the
consolidated entity is divided into three reportable
segments as described below. The reportable segments
offer different products and services, and are managed
separately because they require different operational
and marketing strategies. For each of the reportable
segments, the CEO reviews internal management reports
on at least a monthly basis. The following summary
describes the operations in each of the group’s
reportable segments:
Pharmacy distribution
Australia – Distribution of pharmaceutical and medical
products to pharmacies, provider of retail services to
pharmacy customers.
Retailing
Australia – The purchase and sale of various health,
beauty and lifestyle products within the retail industry in
Australia.
manufacturing
New Zealand – Manufacturer and owner of rights of
pharmaceutical medicines and consumer toiletries.
The majority of manufacturing operations are located in
New Zealand.
The comparative information has been presented in
conformity with the requirements of AASB 8 Operating
Segments.
section 9
sIgnIfIcAnT AccounTIng PoLIcIes continued
35Annual Report 2010
ABN 57 000 004 320 Australian Pharmaceutical Industries Limited

distribution Retailing manufacturing eliminations consolidated
Australia Australia new Zealand
In thousands of AUD Aug-10 Aug-09 Aug-10 Aug-09 Aug-10 Aug-09 Aug-10 Aug-09 Aug-10 Aug-09
Revenue
External Revenue 2,887,866 2,757,290 624,801 622,484 40,164 42,501 – – 3,552,831 3,422,275
External Services 81,247 59,775 79,234 67,684 – – – – 160,481 127,459
Inter–segment revenue** – – – – 8,947 11,920 (8,947) (11,920) – –
Total segment Revenue 2,969,113 2,817,065 704,035 690,168 49,111 54,421 (8,947) (11,920) 3,713,312 3,549,734
Reportable
segment Profit 49,641 49,543* 9,808 17,952 1,338 2,369 – – 60,787 69,864*
Depreciation and
amortisation 9,591 9,102 7,696 5,853 1,259 1,193 – – 18,546 16,148
Capital expenditure
including intangibles 16,400 9,963 17,311 32,285 782 1,208 – – 34,493 43,456
*Restated due to the change in accounting policy (refer to note 1(b)(i) for further details).
** All sales between segments are conducted on an arm’s length basis.
2. oPeRATIng segmenTs continued
Reconciliations of reportable segment Profit yearended yearended
31 August 31 August
In thousands of AUD 2010 2009
Profit/(Loss)
Total profit for reportable segments 60,787 *69,864
Unallocated amounts
Corporate (11,786) (20,803)
Net Financing costs (13,970) (21,569)
Share of profit/(loss) of equity accounted investees 637 (713)
consolidated profit before tax 35,668 26,779
*Restated due to the change in accounting policy (refer to note 1(b)(i) for further details).
section 9
Notes to the consolidated financial statements continued
36 Annual Report 2010 Australian Pharmaceutical Industries Limited
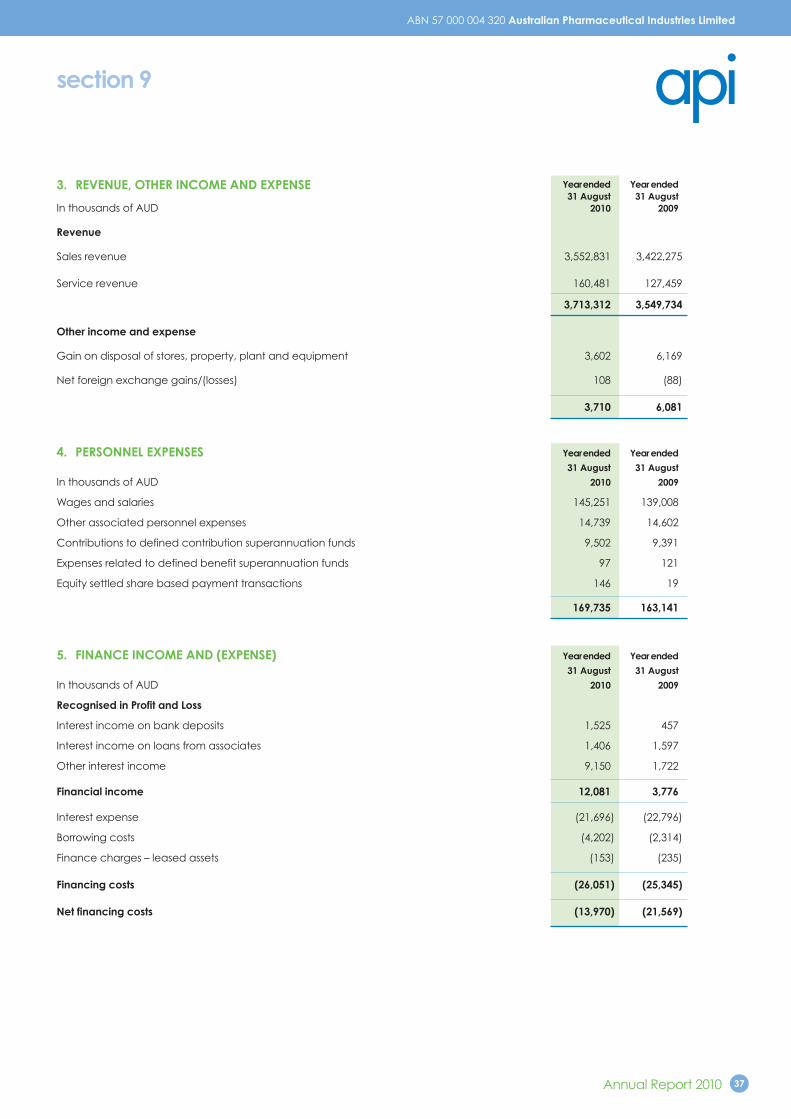
section 9
yearended yearended
31 August 31 August
In thousands of AUD 2010 2009
Revenue
Sales revenue 3,552,831 3,422,275
Service revenue 160,481 127,459
3,713,312 3,549,734
other income and expense
Gain on disposal of stores, property, plant and equipment 3,602 6,169
Net foreign exchange gains/(losses) 108 (88)
3,710 6,081
3. Revenue, oTheR Income And exPense
4. PeRsonneL exPenses yearended yearended
31 August 31 August
In thousands of AUD 2010 2009
Wages and salaries 145,251 139,008
Other associated personnel expenses 14,739 14,602
Contributions to defined contribution superannuation funds 9,502 9,391
Expenses related to defined benefit superannuation funds 97 121
Equity settled share based payment transactions 146 19
169,735 163,141
5. fInAnce Income And (exPense) yearended yearended
31 August 31 August
In thousands of AUD 2010 2009
Recognised in Profit and Loss
Interest income on bank deposits 1,525 457
Interest income on loans from associates 1,406 1,597
Other interest income 9,150 1,722
financial income 12,081 3,776
Interest expense (21,696) (22,796)
Borrowing costs (4,202) (2,314)
Finance charges – leased assets (153) (235)
financing costs (26,051) (25,345)
net financing costs (13,970) (21,569)
37Annual Report 2010
ABN 57 000 004 320 Australian Pharmaceutical Industries Limited

6. Income TAx exPense yearended yearended
31 August 31 AugustRecognised in the Income statement 2010 2009
In thousands of AUD
current tax expense
Current year 6,619 13,282
Adjustments for prior years 400 124
7,019 13,406
deferred tax expense
Current year-origination and reversal of temporary differences 4,827 (4,947)
Adjustment for prior years 1,176 –
6,003 (4,947)
Total income tax expense in income statement 13,022 8,459
numerical reconciliation between tax expense and pre-tax net profit
Profit before tax 35,668 26,779
Income tax using the domestic corporation tax rate of 30% (2009:30%) 10,701 8,034
Increase in income tax expense due to:
Share of associates net (profits)/losses (191) 214
Effect on deferred tax assets of changes in New Zealand tax law
– Tax depreciation no longer allowed on buildings 763 –
– Reduction in New Zealand tax rate from 30% to 28% 17 –
Non–deductible expenses 206 273
Other 2 138
Decrease in income tax expense due to:
Tax incentives (52) (319)
Other – (5)
11,446 8,335
Benefit of previously unrecognised tax losses 1,576 124
Income tax expense on pre–tax net profit 13,022 8,459
deferred tax recognised directly in equity
Relating to costs of issue of shares (1,303) –
7. eARnIngs PeR shARe yearended yearended
31 August 31 August
In thousands of AUD 2010 2009
Profit/(Loss) attributable to ordinary shareholders 22,646 *18,320
Basic weighted average number of ordinary shares for the period 440,943 257,346
Effect of potential ordinary shares on issue 2,821 1,227
diluted weighted average number of ordinary shares for the period 443,764 258,573
In cents
Basic earnings per share 5.1 *6.2
In cents
Diluted earnings per share 5.1 *6.2
*Prior period earnings per share have been restated with an adjustment factor of 1.14 as a result of the entitlement offer
made on 21 October 2009. Prior period earnings per share have been additionally restated due to the change in
accounting policy (refer to note 1(b)(i) for further details).
section 9
Notes to the consolidated financial statements continued
38 Annual Report 2010 Australian Pharmaceutical Industries Limited

section 9
7. eARnIngs PeR shARe continued
weighted Average number of ordinary shares yearended yearended
31 August 2010 31 August 2009
In thousands of AUD
Ordinary shares outstanding at beginning of the year 257,346,455 257,346,455
Institutional Offer and Placement 98,603,898 –
Retail Entitlement Offer 84,992,970 –
440,943,323 257,346,455
8. TRAde And oTheR ReceIvABLes
As at As at
In thousands of AUD 31 August 2010 31 August 2009
current
Trade receivables 658,395 222,073
Provision for impairment (14,000) (10,776)
644,395 211,297
Amounts receivable as deferred consideration 8,540 11,709
Other receivables and prepayments 47,266 28,304
Trade receivables due from associates 77 38
700,278 251,348
non-current
Loans to associates 5,927 15,808
Loans to employees 144 221
Loans receivable from pharmacy customers 66,402 51,895
Provision for impairment – (3,158)
Pension asset 1,286 1,245
Interest bearing notes – securitised receivables – 81,500
73,759 147,511
Due to the restructure of the securitisation program during the year, the consolidated entity now more directly assumes risks
and rewards of the receivables collection performance. Hence, at 31 August 2010 the consolidated entity has securitised
receivables recognised on the balance sheet. (Unrecognised securitised receivables as at 31 August 2009: $407,813,000).
9. InvenToRIes As at As at
In thousands of AUD 31 August 2010 31 August 2009
Raw materials and consumables 3,042 3,500
Work in progress 239 242
Finished goods 323,924 292,771
Less: provision for obsolescence and shrinkage (5,057) (6,165)
322,148 *290,348
*Restated due to the change in accounting policy (refer to note 1(b)(i) for further details).
39Annual Report 2010
ABN 57 000 004 320 Australian Pharmaceutical Industries Limited

10. summARIsed PARenT enTITy fInAncIALs
As at As at
In thousands of AUD 31 August 2010 31 August 2009
Current assets 425,786 *197,206
Total assets 1,133,713 *777,078
Current liabilities 540,423 310,052
Total liabilities 546,747 346,422
Equity
Share capital 566,461 419,499
Reserves 462 316
Retained earnings 20,043 *10,842
Profit after tax 19,228 12,204
Other comprehensive expense – (397)
Total comprehensive income 19,228 11,807
Capital commitments of the parent entity at year end 1,319 –
Details of any guarantees and contingencies of the parent entity are included in note 23.
* Restated due to the change in accounting policy (refer to note 1(b)(i) for further details).
11. cuRRenT TAx AsseTs And LIABILITIes
The current tax liability for the consolidated entity of $3,000 (current tax liability 31 August 2009: $9.133 million) represents the
amount of income taxes payable in respect of current and prior financial periods. In accordance with the Australian tax
consolidation legislation, the Company as the head entity of the Australian tax consolidated group has assumed the current
tax liability (asset) initially recognised by the members in the Australian consolidated tax group.
12. InvesTmenTs AccounTed foR usIng The eQuITy meThod
Investments in Associates
In the financial statements of the Company, investments in associates are accounted for at cost. The consolidated entity
accounts for investments in associates using the equity method.
The consolidated entity has the following investments in associates:
ownership
Reporting 31 August 31 August
venture Principal Activities country date 2010 2009
CH2 Holdings Pty Ltd Hospital supplies distribution Australia 30 June 45.3 % 45.3%
section 9
Notes to the consolidated financial statements continued
40 Annual Report 2010 Australian Pharmaceutical Industries Limited
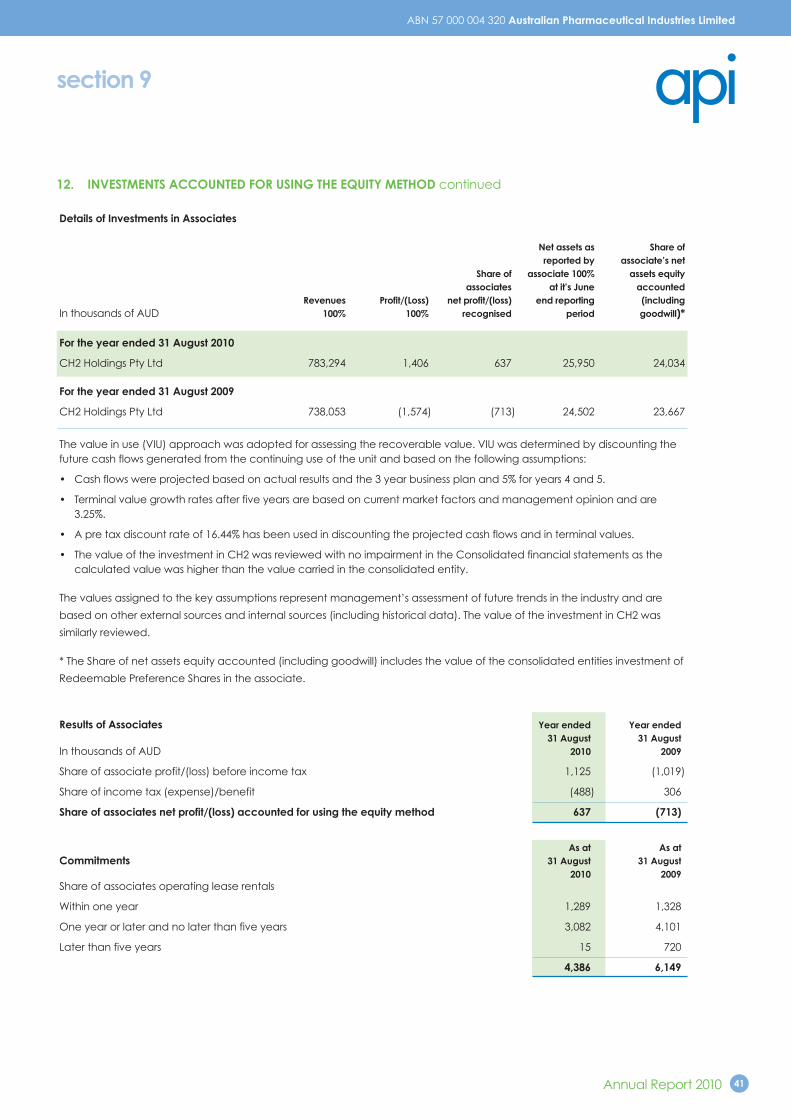
section 9
details of Investments in Associates
net assets as share of
reported by associate’s net
share of associate 100% assets equity
associates at it’s June accounted
Revenues Profit/(Loss) net profit/(loss) end reporting (including
In thousands of AUD 100% 100% recognised period goodwill)*
for the year ended 31 August 2010
CH2 Holdings Pty Ltd 783,294 1,406 637 25,950 24,034
for the year ended 31 August 2009
CH2 Holdings Pty Ltd 738,053 (1,574) (713) 24,502 23,667
The value in use (VIU) approach was adopted for assessing the recoverable value. VIU was determined by discounting the
future cash flows generated from the continuing use of the unit and based on the following assumptions:
• Cash flows were projected based on actual results and the 3 year business plan and 5% for years 4 and 5.
• Terminal value growth rates after five years are based on current market factors and management opinion and are
3.25%.
• A pre tax discount rate of 16.44% has been used in discounting the projected cash flows and in terminal values.
• The value of the investment in CH2 was reviewed with no impairment in the Consolidated financial statements as the
calculated value was higher than the value carried in the consolidated entity.
The values assigned to the key assumptions represent management’s assessment of future trends in the industry and are
based on other external sources and internal sources (including historical data). The value of the investment in CH2 was
similarly reviewed.
* The Share of net assets equity accounted (including goodwill) includes the value of the consolidated entities investment of
Redeemable Preference Shares in the associate.
Results of Associates year ended year ended
31 August 31 August
In thousands of AUD 2010 2009
Share of associate profit/(loss) before income tax 1,125 (1,019)
Share of income tax (expense)/benefit (488) 306
share of associates net profit/(loss) accounted for using the equity method 637 (713)
As at As at
commitments 31 August 31 August
2010 2009
Share of associates operating lease rentals
Within one year 1,289 1,328
One year or later and no later than five years 3,082 4,101
Later than five years 15 720
4,386 6,149
12. InvesTmenTs AccounTed foR usIng The eQuITy meThod continued
41Annual Report 2010
ABN 57 000 004 320 Australian Pharmaceutical Industries Limited

In thousands of AUDLeased capital
Land and Plant and Plant and works in
cost Buildings equipment equipment Progress Total
Balance at 1 september 2008 12,430 122,038 9,923 10,720 155,111
Additions** – 6,203 1,126 36,127 43,456
Reclassification of assets – 12,164 93 (12,257) –
Disposals – (7,685) (399) (121) (8,205)
Effect of movement in foreign exchange (13) (13) – (5) (31)
Balance at 31 August 2009 12,417 132,707 10,743 34,464 190,331
Additions** – – – 34,388 34,388
Reclassification of assets – 66,279 991 (64,773) *2,497
Transfer of assets to intangibles – – – (1,490) (1,490)
Disposal – (6,795) (1,169) – (7,964)
Effect of movement in foreign exchange (173) (285) – (14) (472)
Balance at 31 August 2010 12,244 191,906 10,565 2,575 217,290
13. defeRRed TAx AsseTs And LIABILITIes
Recognised deferred Tax Assets and Liabilities
Deferred tax assets and liabilities are attributable to the following:
consolidated Assets Liabilities net
31 August 31 August 31 August 31 August 31 August 31 August
In thousands of AUD 2010 2009 2010 2009 2010 2009
Property, plant and equipment – – (5,207) (1,076) (5,207) (1,076)
Intangible assets – – (148) (148) (148) (148)
Unrealised foreign exchange losses 158 130 – – 158 130
Employee benefits 4,859 4,848 – – 4,859 4,848
Provisions 11,684 10,374 – – 11,684 10,374
Costs of equity raising* – – (1,303) – (1,303) –
Other items – 20 (658) – (658) 20
Tax loss carried forward 261 198 – – 261 198
Tax assets / (liabilities) 16,962 15,570 (7,316) (1,224) 9,646 14,346
* Recognised in equity
As at 31 August 2010, the Company considers it probable that future taxable profits will be available against which tax losses
can be utilised.
14. PRoPeRTy, PLAnT And eQuIPmenT
change in deferred Tax Asset
In thousands of AUD 31 August 2010 31 August 2009
Balance at 1 September 14,346 9,399
Recognised in income statement (6,003) 4,947
Recognised directly in equity 1,303 –
Balance as at 31 August 9,646 14,346
section 9
Notes to the consolidated financial statements continued
42 Annual Report 2010 Australian Pharmaceutical Industries Limited

section 9
14. PRoPeRTy, PLAnT And eQuIPmenT continued
In thousands of AUDLeased capital
depreciation and impairment lossesLand and Plant and Plant and works in
Buildings equipment equipment Progress Total
Balance at 1 september 2008 (1,890) (62,270) (6,081) – (70,241)
Depreciation charge for the period (365) (11,529) (1,402) – (13,296)
Disposals – 4,473 1,021 – 5,494
Effect of movements in foreign exchange – 19 – – 19
Balance at 31 August 2009 (2,255) (69,307) (6,462) – (78,024)
Depreciation charge for the period (357) (13,314) (1,174) – (14,845)
Reclassification of assets – (1,220) – – *(1,220)
Disposals – 4,741 70 – 4,811
Effect of movements in foreign exchange 16 257 – – 273
Balance at 31 August 2010 (2,596) (78,843) (7,566) – (89,005)
carrying amounts
At 1 September 2008 10,540 59,768 3,842 10,720 84,870
At 31 August 2009 10,162 63,400 4,281 34,464 112,307
At 31 August 2010 9,648 113,063 2,999 2,575 128,285
* Represent stores development costs, previously recognised in Other receivables and prepayments.
** Includes the capitalisation of interest of $1.304 million (31 August 2009:$1.076 million) within Capital Works in Progress.
Financing costs are expensed in the income statement except where they relate to the financing of projects under
construction, where they are capitalised up to the date of commissioning.
15. InTAngIBLe AsseTs
In thousands of AUDBrand development
goodwill names software costs Total
cost
Balance at 1 september 2008 93,268 99,000 17,226 583 210,077
Other acquisitions – – 161 – 161
Disposals – – – (4) (4)
Effect of movements in foreign exchange (60) – – (31) (91)
Balance at 31 August 2009 93,208 99,000 17,387 548 210,143
Transfer from assets – – 1,490 – 1,490
Effect of movements in foreign exchange (761) – – (15) (776)
Balance at 31 August 2010 92,447 99,000 18,877 533 210,857
43Annual Report 2010
ABN 57 000 004 320 Australian Pharmaceutical Industries Limited

In thousands of AUD
15. InTAngIBLe AsseTs continued
Amortisation and impairment lossesBrand development
goodwill names software costs Total
Balance at 1 september 2008 – – (7,032) (217) (7,249)
Amortisation for the period – – (2,744) (108) (2,852)
Disposal – – – 2 2
Effect of movements in foreign exchange – – – 29 29
Balance at 31 August 2009 – – (9,776) (294) (10,070)
Amortisation for the period – – (3,595) (106) (3,701)
Effect of movements in foreign exchange – – – 6 6
Balance at 31 August 2010 – – (13,371) (394) (13,765)
carrying amounts
At 1 September 2008 93,268 99,000 10,194 366 202,828
At 31 August 2009 93,208 99,000 7,611 254 200,073
At 31 August 2010 92,447 99,000 5,506 139 197,092
Amortisation and Impairment charge
The amortisation charge was recognised within administration and general expenses in the income statement.
Impairment tests for cash generating units containing goodwill and Brand names
The following cash generating units have significant carrying amounts of goodwill and brand names:
goodwill
In thousands of AUD As at As at
31 August 2010 31 August 2009
Australian pharmaceutical distribution 29,418 29,418
Australian retail 35,664 35,664
New Zealand manufacturing 27,365 28,126
92,447 93,208
For all cash generating units containing goodwill, the value in use (VIU) approach was adopted for assessing the recoverable
value of non-financial assets. VIU was determined by discounting the future cash flows generated from the continuing use of
the unit and based on the following assumptions:
• Cash flows were projected based on actual results and the 5 year business plan.
• Terminal value growth rates for each individual CGU after five years are based on current market factors and management
opinion and are 3%.
• A pre tax discount rate of 14% has been used in discounting the projected cash flows and in terminal values.
The values assigned to the key assumptions represent management’s assessment of future trends in the industry and are based
on other external sources and internal sources (including historical data).
section 9
Notes to the consolidated financial statements continued
44 Annual Report 2010 Australian Pharmaceutical Industries Limited

sensitivity to changes in assumptions
With regard to the assessment of the value of the CGUs, management believe that no reasonably possible change in any of
the above key assumptions would cause the carrying value of the CGUs to exceed their recoverable amount, with the
exception of the New Zealand Manufacturing CGU. The recoverable amount based on the value in use calculation supports
its carrying amount. Management recognises that the cash flow projections, discount and growth rates used to calculate
value in use may vary to what they have estimated. Management notes the value in use estimate for the New Zealand
Manufacturing CGU is particularly sensitive in the following areas:
• An increase by 0.5% in the discount rate used will result in an impairment loss of $1.048 million (pre-tax);
• A decrease by 0.5% in the terminal growth rate will result in an impairment loss of $0.345 million (pre-tax);
• A decrease by 10% in the cash flows will result in an impairment loss of $2.553 million (pre-tax).
Brand names
In thousands of AUD As at As at
31 August 2010 31 August 2009
Australian pharmaceutical distribution
- Soul Pattinson brand name 37,500 37,500
Australian retail
- Priceline brand name 61,500 61,500
99,000 99,000
The recoverable amount of the Priceline brand was determined by reference to the value in use approach using the relief from
royalty method. The relief from royalty method is generally used for brand name valuations and it has been undertaken using a
discounted cash flow approach due to the availability of forecast cash flows for each of the brand names.
The valuation of Soul Pattinson (SP) brand has been completed as part of Australian Pharmacy Distribution CGU as
predominant economic benefits of the SP brand have been realised in Pharmacy Distribution business. Additionally, the cash
flows derived from the SP brand cannot be separated from the cash flows derived from the wholesale distribution business and
banner group operations.
16. TRAde And oTheR PAyABLes year ended year ended
31 August 31 August
In thousands of AUD 2010 2009
current
Trade payables and accrued expenses 659,123 564,809
non-current
Other payables 10,544 9,318
section 9
15. InTAngIBLe AsseTs continued
45Annual Report 2010
ABN 57 000 004 320 Australian Pharmaceutical Industries Limited

17. LoAns And BoRRowIngs
This note provides information about the contractual terms of the
consolidated entity’s interest-bearing loans and borrowings. As at As at
31 August 31 August
In thousands of AUD 2010 2009
current liabilities
Customer deposits – unsecured 7 8
Finance lease liabilities 974 1,132
Securitisation of trade receivables* 195,375 –
Bank term loan 4,805 –
201,161 1,140
non–current liabilities
Bank term loan – 4,885
Finance lease liabilities 490 1,212
490 6,097
financing facilities
Bank overdraft - unsecured 12,376 12,442
Bank term loan - unsecured 6,000 6,000
Standby letters of credit 100 100
Cash advance facility - unsecured 89,000 136,500
Securitisation of trade receivables * 355,000 400,000
462,476 555,042
facilities utilised at reporting date
Bank overdraft – unsecured – –
Bank term loan – unsecured 4,805 4,885
Standby letters of credit – –
Cash advance facility – unsecured – –
Securitisation of trade receivables * 195,375 332,813
200,180 337,698
facilities not utilised at reporting date
Bank overdraft – unsecured 12,376 12,442
Bank term loan – unsecured 1,195 1,115
Standby letters of credit 100 100
Cash advance facility – unsecured 89,000 136,500
Securitisation of trade receivables * 159,625 67,187
262,296 217,344
*The securitisation facility was not recognised in the balance sheet at 31 August 2009, as it resulted in a de-recognition of trade
receivable balances. The securitisation facilities were amended in May 2010 and the consolidated entity now directly assumes
the risks and rewards of the receivables collection performance resulting in the consolidated entity having securitised
receivables recognised on the balance sheet from the date of the amendment.
Refer to Note 29 which outlines lender’s consent for not achieving a minimum performance requirement under the lending
terms.
section 9
Notes to the consolidated financial statements continued
46 Annual Report 2010 Australian Pharmaceutical Industries Limited

Bank overdraft
The Company is a guarantor to a bank facility agreement which provides a total overdraft facility of $12,376,000 (31 August
2009: $12,442,000) to entities in the Australian Pharmaceutical Industries Limited Group. The facility is subject to set off
arrangements between the Group companies. Interest on bank overdrafts is charged at prevailing market rates. The bank
overdraft is repayable on demand and subject to annual review.
standby Letter of credit
The standby letter of credit facility is available to be drawn down over the next year and is subject to annual review.
finance Lease facility
The consolidated entity’s lease liabilities are secured by the leased assets. In the event of default, the assets revert to the lessor.
cash Advances
The consolidated cash advance facilities total $89,000,000. The borrowings are unsecured. Interest is based on the Australian
Financial Markets Association’s bank-bill reference rate (BBSY) plus a margin charged by the lender.
Bank Term Loan
The consolidated entity’s term loan facility of $6,000,000 is unsecured. Interest is based on the New Zealand bench mark bank
bill reference rate plus margin charged by the lender.
securitisation
Refer Note 21.
finance Lease Liabilities
Finance lease liabilities of the consolidated entity are payable as follows:
minimum minimum
Lease Lease
Payments Interest Principal Payments Interest Principal
31 August 31 August 31 August 31 August 31 August 31 August
In thousands of AUD 2010 2010 2010 2009 2009 2009
Less than one year 1,040 66 974 1,260 128 1,132
Between one and five years 521 31 490 1,273 61 1,212
1,561 97 1,464 2,533 189 2,344
The consolidated entity lease plant and equipment under finance leases expiring within five years. At the end of the lease
term the consolidated entity has the option to purchase the leased equipment at a price considered to be a bargain
purchase option.
Under the terms of the lease agreements no contingent rents are payable.
18. emPLoyee BenefITs As at As at
31 August 31 August
2010 2009In thousands of AUD
Liability for long service leave 4,684 4,328
Liability for annual leave 8,823 9,232
13,507 13,560
non-current
Liability for long service leave 3,621 3,322
section 9
17. LoAns And BoRRowIngs continued
47Annual Report 2010
ABN 57 000 004 320 Australian Pharmaceutical Industries Limited

18. emPLoyee BenefITs continued
(a) defined Benefit Plan
The consolidated entity makes contributions to a defined benefit superannuation fund that provides defined
benefit amounts for employees upon retirement.
31 August 31 August
In thousands of AUD 2010 2009
Fair value of fund assets - funded 2,191 2,214
Present value of funded obligations (2,010) (2,013)
Present value of net fund assets 181 201
Unrecognised actuarial losses 1,105 1,044
Recognised asset for defined benefit obligations (see below) 1,286 1,245
movements in the net asset for defined benefit obligations recognised in the balance sheet
Net defined benefit asset at beginning of the period 1,245 1,225
Contributions received 138 141
Expense recognised in the income statement (97) (121)
Net defined benefit asset at end of the period 1,286 1,245
changes in the present value of the defined benefit obligation
Opening defined benefit obligation 2,013 1,959
Service cost – recognised in the income statement 112 176
Interest cost – recognised in the income statement 87 92
Actuarial (gains)/losses 38 (108)
Benefits paid (240) (106)
Closing defined benefit obligation 2,010 2,013
changes in the fair value of fund assets
Opening fair value of fund assets 2,214 2,451
Expected return – recognised in the income statement 173 191
Actuarial ( losses)/gains (94) (463)
Contributions by employer (net of tax) 138 141
Benefits paid (240) (106)
Closing fair value of fund assets 2,191 2,214
section 9
Notes to the consolidated financial statements continued
48 Annual Report 2010 Australian Pharmaceutical Industries Limited

(b) defined contribution superannuation funds
In addition to the contributions to the defined benefit plan outlined above, the consolidated entity makes contributions to
various defined contribution superannuation funds. The amount recognised as expense was $9,502,000 for the year ended 31
August 2010 (year ended 31 August 2009: $9,391,000).
(c) share Based Payments
Share performance rights
The consolidated entity granted equity settled performance rights that entitle key management personnel and senior
employees to receive shares in the Company if defined performance conditions are achieved.
At 10 August 2007, performance rights were granted in two tranches under the same terms and conditions. The performance
period of the first tranche (the 2006 grant) and second tranche (the 2007 grant) ended on 28 February 2009 and 28 February
2010, respectively without vesting any performance rights.
On 31 March 2009, performance rights were granted with a performance period commencing 1 September 2008 and ending
31 August 2011(2008 grant). The performance conditions for the exercise of performance rights will be assessed on 31 October
2011.
The performance conditions for the performance rights noted above are designed to take account of absolute and relative
measures being the Company’s total shareholder return (TSR) performance relative to the total shareholder return
performance of a comparator group of ASX-listed companies, the Company’s earnings per share (EPS) relative to an EPS
growth target determined by the Board. For the 2008 grant, one half of the total performance rights granted will be assessed
against the TSR measure and the other half will be assessed against the EPS measure.
At 12 May 2010, further performance rights (the 2009 grant) were granted with a performance period commencing 1
September 2009 and ending 31 August 2012. The performance condition, being API’s return on equity (‘ROE’) for the exercise
of performance rights will be assessed on 31 October 2012.
Performance conditions will be tested once only, and any performance rights that do not meet the performance conditions
will lapse and will not be re-tested.
The terms and conditions of the grants are as follows. All performance rights are settled by physical delivery of shares:
section 9
Performance rights to key
management personnel and senior
employees at 31 August 2010 –
Performance period to Aug 2011
Three years of service, TSR above the
50th percentile and an increase of 10%
compound growth in EPS over the
performance period
1,011,800 3 years
Performance rights to key
management personnel and senior
employees at 31 August 2010 –
Performance period to Aug 2012
Three years of service and cumulative
ROE with a minimum of 21.08%
permitting exercise of 50% of the rights
and 25.3% achievement to exercise
100% of the rights and proportionate
between these two levels.
1,398,600
2,410,400
3 years
grant date / employee entitled vesting conditions
number of
instruments
contractual life of
Performance Rights
18. emPLoyee BenefITs continued
49Annual Report 2010
ABN 57 000 004 320 Australian Pharmaceutical Industries Limited

The number of performance rights outstanding in the period is as follows:
number of number of
performance rights performance rights
In thousands of performance rights 31 August 2010 31 August 2009
Outstanding at the beginning of the period 1,541 693
Forfeited/Lapsed during the period (530) (762)
Exercised during the period – –
Granted during the period 1,399 1,610
Outstanding at the end of the period 2,410 1,541
Exercisable at the end of the period – –
Fair value of performance rights key management Personnel and senior manager
and assumptions 31 August 2010
Performance period 1 may 1 may 1 sept 1 sept 1 sept
commences and 2007 2007 2008 2008 2009
performance condition TsR ePs TsR ePs TsR
Grant date 30 April 07 30 April 07 31 March 09 31 March 09 12 May 10
Fair value at measurement date $0.95 $1.97 $0.22 $0.36 $0.42
Share price $1.97 $1.97 $0.39 $0.39 $0.45
Exercise price – – – – –
Expected volatility (expressed as
weighted average) 27% 27% 40% 40% 40%
Performance Rights life (expressed as
weighted average life) 3yrs 3yrs 3yrs 3yrs 3yrs
Expected dividends 3.6% 3.6% 2.5% 2.5% 3.0%
Risk-free interest rate (based on national
government bonds) 6.2% 6.2% 3.40% 3.40% 4.78%
The expected volatility is based on the historic volatility (calculated based on the weighted average expected life of the
share performance rights), adjusted for any expected changes to future volatility due to publicly available information.
Share performance rights are granted under a service condition and, for grants to key management personnel and, senior
executives market and non-market performance conditions apply. Non-market performance conditions are not taken into
account in the grant date fair value measurement of the services received.
employee expenses
In thousands of AUD 31 August 2010 31 August 2009
Performance rights granted in 2007 – equity settled (5) (100)
Performance rights granted in 2008 – equity settled (45) 119
Performance rights granted in 2009 – equity settled 196 –
Total expense recognised as employee costs 146 19
(c) share Based Payments continued
section 9
Notes to the consolidated financial statements continued
50 Annual Report 2010 Australian Pharmaceutical Industries Limited

19. PRovIsIons
directors Provision Provision
retirement for for onerous
In thousands of AUD scheme dismantling leases other Total
Balance at 1 September 2009 351 1,962 1,073 1,951 5,337
Provisions made during the year – 1,331 – 8,963 10,294
Provisions used during the year – (811) (213) (8,855) (9,879)
Provision reversed during the year – – (530) – (530)
Unwind of discount – 97 – – 97
Balance at 31 August 2010 351 2,579 330 2,059 5,319
current – 343 229 2,059 2,631
non–current 351 2,236 101 – 2,688
351 2,579 330 2,059 5,319
directors Retirement scheme
Retirement benefits for non-executive directors are included on an accrual basis. They are paid on a pro-rata basis up to
10 years service to a maximum of three times the average annual remuneration in the three years preceding retirement.
The retirement benefit is capped at $220,000 per director and applies only to directors appointed prior to 9 September 2003.
On 31 August 2009 the directors agreed to freeze this benefit.
dismantling
The Group provides for the estimated costs to cover its obligations to lessors to restore premises to the condition that existed
when leases of real property were entered into.
onerous leases
On 2 July 2007 the consolidated entity acquired the Making Life Easy-Mobility and Independent Living Superstores Pty Ltd
(“MLE”) business. MLE, at the date of acquisition, was committed to a plan to phase out its retail operations and had
recognised a provision of $3,354,000 to allow for the costs of closure of retail outlets and write down of fixed assets.
The consolidated entity has reassessed the remaining obligation for the discounted future lease payments. The obligation
at 31 August 2010 is $330,000.
other
Other consists only of provision for Clubcard points in the Retail Division which are convertible quarterly by customers in the
form of gift vouchers. The provision is based upon the expected cost to the consolidated entity on redemption of Clubcard
vouchers. A redemption rate is applied based on historical experience and is updated quarterly.
20. cAPITAL And ReseRves
share capital ordinary shares
In thousands of shares 31 August 2010 31 August 2009
Shares on issue at the beginning of the period – fully paid 257,346 257,346
Add: Issue of ordinary shares-fully paid 230,770 –
Shares on issue at the end of the period – fully paid 488,116 257,346
section 9
51Annual Report 2010
ABN 57 000 004 320 Australian Pharmaceutical Industries Limited

ordinary shares
On 21 October 2009, the Company announced an equity raising via a fully underwritten accelerated non-renounceable
entitlement offer (Entitlement Offer) of 2 fully paid API ordinary shares for every 3 API ordinary shares and institutional
placement up to 59.205 million fully paid API ordinary shares (Placement), at an offer price of $0.65 per share.
The $150.000 million raised consisted of $78.240 million from the Placement and $71.240 million from the Entitlement Offers.
Capital raising and share issue costs attributed to this transaction amounted to $4.340 million and these costs were applied
against the $150.000 million raised. Consequently from this capital raising, the shares on issue during the year ended 31 August
2010 increased by 230,769,428.
Holders of ordinary shares are entitled to receive dividends as declared from time to time and are entitled to one vote per share
at shareholders meetings. In the event of a winding up of the Company, ordinary shareholders rank after all other creditors and
are fully entitled to any proceeds of liquidation.
Translation reserve
The translation reserve comprises all foreign exchange differences arising from the translation of the financial statements of
foreign operations where their functional currency is different to the presentation currency of the reporting entity, as well as from
the translation of liabilities that hedge the Company’s net investment in a foreign subsidiary.
equity reserve
The equity reserve relates to share-based payment transactions measured at fair value.
hedging reserve
The hedging reserve comprises the effective portion of the cumulative net change in the fair value of cash flow hedging
instruments relating to hedged transactions that have not yet occurred.
dividends
During the current year the Company recognised the following dividends.
$5.147 million was paid on 11 December 2009 in respect of earnings for the year ended 31 August 2009, and was at the rate of
2 cents per share, fully franked.
An interim dividend in respect of half year ended 28 February 2010 amounting to $4.881 million paid on 3 June 2010 was also
recognised during the current year. It was at the rate of 1 cent per share, fully franked.
On 28 October 2010 a final dividend of 1.5 cents per share, fully franked to be paid on 15 December 2010, amounting to $7.322
million was declared.
dividend franking Account The company
In thousands of AUD 31 August 2010 31 August 2009
30 per cent franking credits available to shareholders
of the Company for subsequent financial years 17,144 17,049
The above available amounts are based on the balance of the dividend franking account at year-end adjusted for:
(a) Franking credits that will arise from the payment of the current tax liabilities;
(b) Franking debits that will arise from the payment of dividends recognised as a liability at the year end;
(c) Franking credits that will arise from the receipt of dividends recognised as receivables by the tax consolidated group at the
year end;
(d) Franking credits that the entity may be prevented from distributing in subsequent years; and
(e) Franking debits that will arise from receipt of the current income tax receivable.
The ability to utilise the franking credits is dependent upon there being sufficient available profits to declare dividends. The
future reduction in the dividend franking account of dividends proposed after the balance sheet date but not recognised as a
liability at year end is $3,137,888 (31 August 2009: $2,025,828).
20. cAPITAL And ReseRves continued
section 9
Notes to the consolidated financial statements continued
52 Annual Report 2010 Australian Pharmaceutical Industries Limited

21. fInAncIAL InsTRumenTs
fInAncIAL RIsk mAnAgemenT
overview
The consolidated entity has exposure to the following risks from its use of financial instruments:
• Credit risk
• Liquidity risk
• Market risk
The Board of Directors has overall responsibility for the establishment and oversight of the consolidated entity’s risk management
framework. The Board has established an Audit and Risk Committee, which is responsible for developing and monitoring the
consolidated entity’s risk management policies. The Committee reports regularly to the Board of Directors on its activities.
The consolidated entity’s risk management policies are established to identify and analyse the risks faced by the consolidated
entity, to set appropriate risk limits and controls, and to monitor risks and adherence to limits. Risk management policies and
systems are reviewed regularly to reflect changes in market conditions and the consolidated entity’s activities.
The Audit and Risk Committee oversees how management monitors compliance with the risk management policies and
procedures and reviews the adequacy of the risk management framework in relation to the risks. The Audit and Risk Committee
is assisted in its oversight by Internal Audit. Internal Audit undertakes both regular and ad hoc reviews of risk management
controls and procedures, the results of which are reported to the Audit and Risk Committee.
credit risk
Credit risk is the risk of financial loss to the consolidated entity if a customer or counterparty to a financial instrument fails to meet
its constructive obligations, and arises principally from the consolidated entity’s receivables from customers and financial
guarantees.
Trade and other receivables
The consolidated entity’s exposure to credit risk is mainly influenced by the individual characteristics of each customer.
The consolidated entity has established a credit policy under which new customers are analysed individually for credit
worthiness including using external ratings, where available. Purchase limits are established for each customer, which represents
the maximum open amount available and limits are reviewed on a needs-basis. Customers that fail to meet the benchmark
credit worthiness may transact with the consolidated entity only on a prepayment basis.
In monitoring customer credit risk, customers are grouped by state and reviewed monthly. “High risk” customers are placed on
“credit hold”, with orders manually released as appropriate.
Goods sold under some customer arrangements are subject to retention of title clauses, so that in the event of non-payment the
consolidated entity may have a secured claim.
The consolidated entity establishes an allowance for impairment that represents its estimate of incurred losses in respect of trade
and other receivables and investments. The main component of this allowance is a specific loss component that relates to
individually significant exposures (after consideration of any collateral held).
Guarantees
In prior years, the consolidated entity provided financial guarantees in respect of pharmacy customers and franchisees. These
guarantees were subject to strict controls over their approval, including obtaining security. Generally, the Board has established
a practice of not approving any new guarantees. Only one new guarantee has been made during the two years ended 31
August 2010. The guarantees outstanding are further described in the contingencies note 23.
Liquidity risk
Liquidity risk is the risk that the consolidated entity will not be able to meet its financial obligations as they fall due. The
consolidated entity’s approach to managing liquidity is to ensure, as far as possible, that it will always have sufficient liquidity to
meet its liabilities when due, under both normal and stressed conditions.
The Company and consolidated entity have varying borrowing levels based on seasonal requirements of the business. Any
obligations can be met by the unused facilities.
section 9
53Annual Report 2010
ABN 57 000 004 320 Australian Pharmaceutical Industries Limited

market risk
Market risk is the risk that changes in market prices, such as foreign exchange rates and interest rates, will affect the
consolidated entity’s income or the value of its holdings of financial instruments. The objective of market risk management is to
manage and monitor market risk exposures within acceptable parameters, whilst optimising the return on risk.
Currency risk
The consolidated entity had no material exposure to foreign currency risk on sales and purchases that are denominated in a
currency other than the respective functional currencies of the consolidated entity companies.
Interest rate risk
The consolidated entity is exposed to interest rate risk as a consequence of its financing facilities. The consolidated entity
adopts a policy that up to 80% of its exposure to the changes in interest rates on its long term variable rate borrowings relating
to the securitised trade receivables may be hedged on a fixed rate basis.
capital management
The Board’s policy is to maintain a strong capital base so as to maintain investor, creditor and market confidence and to sustain
future development of the business.
The Board seeks to maintain a balance between the higher returns that might be possible with higher levels of borrowings and
the advantages and security afforded by a sound capital position.
There were no changes in the consolidated entity’s approach to capital management during the period.
The consolidated entity has entered into a securitisation program, whereby the consolidated entity has access to funds as a
result of the securitisation of current trade receivables. There are two separate programs which have limits of $275,000,000 and
$80,000,000 respectively (31 August 2009: $300,000,000 and $100,000,000), respectively. As part of these programs, the program
provider charges a monthly variable interest rate plus margin based on the drawn down portion of this program. Settlement of
the funds is monthly and daily respectively. These agreements expire in April 2010. Subsequent to 31 August 2010 the
$275,000,000 facility was extended to May 2013 and the $80,000,000 facility was reduced to $70,000,000 and extended to May
2012. Refer to note 29 for further information regarding lending covenants.
At 31 August 2010, $160,000,000 and $35,374,652 respectively were drawn down on these programs by the consolidated entity
(31 August 2009: $300,000,000 and $32,813,135, respectively), The trade receivables and loans and borrowings relating to these
transactions are recognised on the balance sheet from May 2010 when the securitisation facilities were amended.
The amounts drawn down under the securitisation facility accrue finance charges at the prevailing market rate. For the year
ended 31 August 2010 the weighted average rate was 5.97% (31 August 2009: 5.34%).
Securitisation facilities were amended in May 2010. Prior to these facility amendments, the consolidated entity was required to
invest in the securitisation program. At 31 August 2010 there was no investment in interest bearing note receivable in the
program (31 August 2009: $81,500,000 consolidated entity).
credit Risk
Exposure to credit risk
The Consolidated entity’s exposure to credit risk as at the reporting date was in relation to the carrying amounts of current and
non current trade receivables (note 8) other receivables (note 8), cash deposits and the amount disclosed in respect of
contingent liabilities arising from financial guarantees provided to pharmacy customers (note 23).
During the year the consolidated entity’s securitisation facilities were amended resulting in the consoliated entity now assuming
the full risk of collection of trade receivables (refer note 17).
Concentrations of credit risk
Concentrations of credit risk arise from customers that have similar characteristics and are affected in a similar manner where
there are changes in economic, regulatory or other conditions. In this regard, the economic entity has a significant
concentration of credit risk associated with the pharmacy and retail industries in Australia.
In addition, the consolidated entity has specific exposure in respect of a pharmacy group that represents 12.4% of total credit
risk exposure from Trade receivables and Loans receivable from Pharmacy customers.
21. fInAncIAL InsTRumenTs continued
section 9
Notes to the consolidated financial statements continued
54 Annual Report 2010 Australian Pharmaceutical Industries Limited

55Annual Report 2010
21. fInAncIAL InsTRumenTs continued
Trade Receivables
Details of the ageing of Trade receivables and the impairment losses recorded at the reporting date are set out below:
In thousands of AUD 31 August 2010 31 August 2009
Not past due 570,605 539,999
Past due 0-30 days 20,773 27,468
Past due 31+ days 67,017 62,419
Sub-total 658,395 629,886
Securitisation – (407,813)
Impairment (14,000) (10,776)
644,395 211,297
The movement in the provision for impairment losses in respect of Trade receivables was as follows:
In thousands of AUD 31 August 2010 31 August 2009
Balance at start of year 10,776 5,796
Amounts provided during the year 7,301 6,409
Transfer from Non-current Provision for Impairment 3,248 –
Amounts written off during the year (7,325) (1,429)
Balance at end of year 14,000 10,776
Loans receivable from Pharmacy customers
Historically, the Consolidated entity has provided financial assistance to certain pharmacy customers in the form of long term
loans. The loan agreements include an annual interest rate of up to 10% and full repayment due in approximately three years.
These balances have been classified as non current assets. During the year $8.000 million was extended to pharmacy
customers by restructuring a current trade receivable to a non-current loan receivable.
The movement in the provision for impairment losses in respect Loans receivable from pharmacy customers are set out below:
In thousands of AUD 31 August 2010 31 August 2009
Balance at start of year 3,158 –
Amounts provided during the year 90 3,158
Transfer to Current Provision for Impairment (3,248) –
Balance at end of year – 3,158
The Consolidated entity seeks to obtain collateral wherever long term funding arrangements are agreed to. This collateral
may include personal guarantees and formal charges over pharmacy assets. The security held by the Consolidated entity
over pharmacy assets is generally in the form of a second-ranking charge after the security held by the pharmacist’s
financiers.
section 9
ABN 57 000 004 320 Australian Pharmaceutical Industries Limited

56
Provisions for impairment
In determining the provision for impairment for both Trade receivables and Loans receivable from Pharmacy customers,
the directors have taken into account the value of collateral held, the history of collections and overdues of individual
debtors, the risks associated with general trading conditions and the specific circumstances of individual pharmacy
debtors. Where appropriate, advice from independent valuation experts has been obtained to support the valuation
of assets held as collateral for long term and past-due debts.
The determination of the impairment provisions is necessarily based on a number of best-estimate assumptions and is subject
to inherent uncertainties based on information available at balance date. These uncertainties include general economic
and trading conditions, the valuation of assets held as security (and the priority rights of other financiers over those assets),
the regulatory environment and other factors impacting the pharmacy industry.
Liquidity Risk
The following are the contractual maturities of financial liabilities, including interest payments and excluding the impact of
netting arrangements.
carrying contract 1 year more than
In thousands of AUD amount cash flows or less 1-2 years 2-5 years 5 years
31 August 2010
non-derivative financial liabilities
Finance lease liabilities 1,464 1,561 1,040 316 205 –
Customer deposits 7 7 7 – – –
Trade and other payables 669,667 669,667 659,123 7,217 3,323 4
Bank term loan 4,805 4,805 4,805 – – –
675,943 676,040 664,975 7,533 3,528 4
31 August 2009
non-derivative financial liabilities
Finance lease liabilities 2,344 2,533 1,260 929 344 –
Customer deposits 8 8 8 – – –
Trade and other payables 574,127 574,127 564,809 5,847 2,506 965
Bank term loan 4,885 4,885 – 4,885 – –
581,364 581,553 566,077 11,661 2,850 965
21. fInAncIAL InsTRumenTs continued
section 9
Notes to the consolidated financial statements continued
Annual Report 2010 Australian Pharmaceutical Industries Limited

Interest Rate Risk
Effective Interest Rates and Repricing Analysis
IIn respect of income-earning financial assets and interest-bearing financial liabilities, the following table indicates their effective interest rates
at the balance sheet date and the periods in which they reprice.
31 August 2010 31 August 2009
consolidated effective more effective more
interest 1 year 1–2 2–5 than 5 interest 1 year 1–2 2–5 than 5
In thousands of AUD Note rate Total or less years years years rate Total or less years years years
Cash and
cash equivalents 26 4.00% 29,431 29,431 – – – 2.50% 5,856 5,856 – – –
Loans to associates* 8 6.25% 5,927 – 2,287 3,640 – 8.07% 15,808 – 15,808 – –
Loans receivable from
pharmacy customers* 8 8.36% 66,402 – – 66,402 – 8.02% 51,895 – – 51,895 –
Interest bearing notes – – – – – – – 5.34% 81,500 – 81,500 – –
Securitised trade
receivables 17 5.97% (195,375) (195,375) – – – – – – – – –
Finance lease liabilities* 17 6.90% (1,464) (974) (295) (195) – 6.90% (2,344) (1,132) (1,187) (25) –
Bank overdrafts and
term loan 17 6.55% (4,805) (4,805) – – – 3.58% (4,885) (4,885) – – –
Customer deposits* 17 – – – – – – 3.25% (8) (8) – – –
Employee Loans 8 6.65% 144 90 – – 54 5.85% 221 86 – – 135
(99,740) (171,633) 1,992 69,847 54 148,043 (83) 96,121 51,870 135
* Fixed rate income earning financial assets and interest bearing financial liabilities. Remaining balances are variable rates.
foreign currency Risk
The consolidated entity had no material exposure to foreign currency risk on sales and purchases that are denominated in a currency other
than the respective functional currencies of the consolidated entity companies.
The Company has a New Zealand denominated long term inter-company receivable designated as a hedge of the Company’s investment
in its subsidiary in New Zealand. The carrying amount of the loan at 31 August 2010 was $28,518,000 (31 August 2009 was $29,312,000).
fair value sensitivity analysis for fixed rate instruments
The consolidated entity does not account for any fixed rate financial assets and liabilities at fair value through profit and loss, and the
consolidated entity does not designate derivatives (interest rate swaps) as hedging instruments under a fair value hedge accounting model.
Therefore a change in interest rates at reporting date would not affect profit and loss unless any hedges became ineffective.
section 9
21. fInAncIAL InsTRumenTs continued
57Annual Report 2010
ABN 57 000 004 320 Australian Pharmaceutical Industries Limited

cash flow sensitivity analysis for variable rate instruments
A strengthening by 100 basis points in interest rates at the reporting date would have increased (or in the event of a
commensurate weakening, decreased) profit or loss and equity by the amounts shown below for the consolidated entity.
This analysis assumes that all other variables remain constant.
In thousands of AUD 31 August 2010 31 August 2009
consolidated
Interest expense 1,954 3,328
fair values
The fair values of financial assets and liabilities are not materially different from the carrying amounts shown in the balance
sheet.
estimation of fair values
The following summarises the major methods and assumptions used in estimating the fair values of financial instruments
reflected in the table.
Loans and Borrowings
Fair value is calculated based on discounted expected future principal and interest cash flows.
finance Lease Liabilities
The fair value is estimated as the present value of future cash flows, discounted at market interest rates for homogeneous
lease agreements. The estimated fair values reflect change in interest rates.
Trade and other Receivables / Payables
For receivables / payables with a remaining life of less than one year, the notional amount is deemed to reflect the fair value.
All other receivables / payables are discounted to determine the fair value.
Interest rates used for determining fair value
The entity uses the government yield curve as of the year end, plus an adequate constant credit spread, to discount financial
instruments. The interest rates used are as follows:
31 August 2010 31 August 2009
Loans and borrowings 5.0% - 7.0% 3.5% - 5.5%
Leases 6.0% - 7.0% 6.0% - 7.0%
Receivables 6.0% - 10.0% 3.5% - 4.5%
22. commITmenTs
operating leases - leases as lessee
Non-cancellable operating lease rentals are payable as follows:
In thousands of AUD 31 August 2010 31 August 2009
Less than one year 40,486 54,254
Between one and five years 90,994 167,413
More than five years 42,930 56,807
174,410 278,474
The consolidated entity leases property and plant under non-cancellable operating leases expiring from two to fifteen years.
Leases generally provide the consolidated entity with a right of renewal at which time all terms are renegotiated.
During the year ended 31 August 2010, $53,241,000 was recognised by the consolidated entity as an expense in the profit
and loss in respect of operating leases (31 August 2009: $54,812,000).
21. fInAncIAL InsTRumenTs continued
section 9
Notes to the consolidated financial statements continued
58 Annual Report 2010 Australian Pharmaceutical Industries Limited
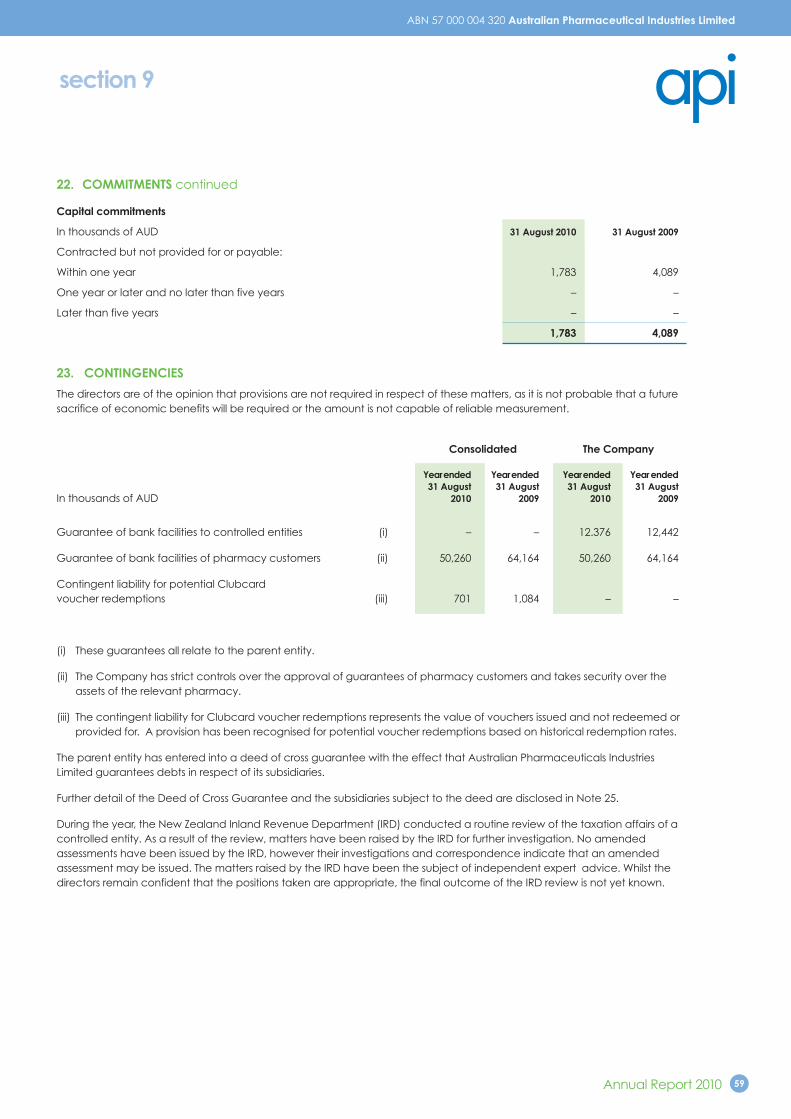
capital commitments
In thousands of AUD 31 August 2010 31 August 2009
Contracted but not provided for or payable:
Within one year 1,783 4,089
One year or later and no later than five years – –
Later than five years – –
1,783 4,089
23. conTIngencIes
The directors are of the opinion that provisions are not required in respect of these matters, as it is not probable that a future
sacrifice of economic benefits will be required or the amount is not capable of reliable measurement.
consolidated The company
yearended yearended yearended yearended
31 August 31 August 31 August 31 August
In thousands of AUD 2010 2009 2010 2009
Guarantee of bank facilities to controlled entities (i) – – 12.376 12,442
Guarantee of bank facilities of pharmacy customers (ii) 50,260 64,164 50,260 64,164
Contingent liability for potential Clubcard
voucher redemptions (iii) 701 1,084 – –
(i) These guarantees all relate to the parent entity.
(ii) The Company has strict controls over the approval of guarantees of pharmacy customers and takes security over the
assets of the relevant pharmacy.
(iii) The contingent liability for Clubcard voucher redemptions represents the value of vouchers issued and not redeemed or
provided for. A provision has been recognised for potential voucher redemptions based on historical redemption rates.
The parent entity has entered into a deed of cross guarantee with the effect that Australian Pharmaceuticals Industries
Limited guarantees debts in respect of its subsidiaries.
Further detail of the Deed of Cross Guarantee and the subsidiaries subject to the deed are disclosed in Note 25.
During the year, the New Zealand Inland Revenue Department (IRD) conducted a routine review of the taxation affairs of a
controlled entity. As a result of the review, matters have been raised by the IRD for further investigation. No amended
assessments have been issued by the IRD, however their investigations and correspondence indicate that an amended
assessment may be issued. The matters raised by the IRD have been the subject of independent expert advice. Whilst the
directors remain confident that the positions taken are appropriate, the final outcome of the IRD review is not yet known.
22. commITmenTs continued
section 9
59Annual Report 2010
ABN 57 000 004 320 Australian Pharmaceutical Industries Limited

24. consoLIdATed enTITIes
Note ownership interest
31 August 2010 31 August 2009
Parent entity
Australian Pharmaceutical Industries Limited
subsidiaries
Thrift Chemist Merchandising Pty Limited 100 100
Australian Pharmaceutical Industries (Queensland) Pty Limited (iii) 100 100
API Victoria Pty Limited (iii) 100 100
Soul Pattinson (Manufacturing) Pty Limited 100 100
API Financial Services Australia Pty Limited (ii),(iii) 100 100
Pharma-Pack Pty Limited 100 100
API (Canberra) Pty Limited 100 100
Canberra Pharmaceutical Supplies Trust 100 100
Stevens KMS Equities Limited (i) 100 100
API Healthcare Nominees (NZ) Limited (i) 100 100
API Healthcare Holdings (NZ) Unit Trust (i) 100 100
API Healthcare Holdings (NZ) Limited (i) 100 100
Priceline (NZ) Pty Ltd (i) 100 100
PAF (New Zealand) Ltd (i) 100 100
The Medicine Shoppe Limited (i) 100 100
PSM Healthcare Limited (i) 100 100
Pharmaceutical Sales and Marketing Ltd (i) 100 100
Garrett Investments Limited (i) 100 100
Healthcare Manufacturing Group Limited (i) 100 100
Synapse Finance Pty Ltd (iii) 100 100
New Price Retail Finance Pty Ltd (iii) 100 100
New Price Retail Pty Ltd 100 100
Pricemart Pty Ltd (iv) – 100
New Price Retail Services Pty Ltd 100 100
You Pay Less Pty Ltd 100 100
PAF (Priceline) Pty Ltd 100 100
Priceline Unit Trust 100 100
Second Priceline Unit Trust 100 100
Priceline Proprietary Limited (iii) 100 100
Making Life Easy - Mobility and Independent Living Superstores Pty Ltd 100 100
MLE Unit Trust 100 100
(i) These controlled entities are incorporated in New Zealand and carry on business predominantly in New Zealand.
All other controlled entities are incorporated and carry on business predominantly in Australia.
(ii) Converted from a public to proprietary company on 18 March 2009.
(iii) These controlled entities have each entered into a Deed of Cross Guarantee with Australian Pharmaceuticals Industries
Limited in respect of relief granted from specific accounting and financial reporting requirements in accordance with
ASIC Class Order 98/1418.
(iv) Deregistered 25 November 2009.
All subsidiaries have a balance date equivalent to the parent entity.
section 9
Notes to the consolidated financial statements continued
60 Annual Report 2010 Australian Pharmaceutical Industries Limited

25. deed of cRoss guARAnTee
Pursuant to ASIC Class Order 98/1418 (as amended) dated 13 August 1998, the wholly-owned subsidiaries listed below are
relieved from the Corporation Act 2001 requirements for preparation, audit and lodgement of financial reports, and directors
reports.
It is a condition of the Class Order that the Company and each of the subsidiaries enter into a Deed of Cross Guarantee.
The effect of the Deed is that the Company guarantees to each creditor payment in full of any debt in the event of winding
up of any of the subsidiaries under certain provisions of the Corporations Act 2001. If a winding up occurs under other
provisions of the Act, the Company will only be liable in the event that after six months any creditor has not been paid in full.
The subsidiaries have also given similar guarantees in the event that the Company is wound up.
The subsidiaries subject to the Deed are:
• API Financial Services Australia Pty Ltd
• API Victoria Pty Ltd
• Australian Pharmaceutical Industries (Queensland) Pty Ltd
• New Price Retail Finance Pty Ltd
• Priceline Pty Ltd
• Synapse Finance Pty Ltd
A condensed consolidated income statement and consolidated balance sheet comprising the Company and controlled
entities which are party to the Deed, after eliminating all transactions between parties to the Deed of Cross Guarantee, at 31
August 2010 is set out as follows:
summarised statement of comprehensive Income and Retained Profits
closed group
year ended year ended
In thousands of AUD 31 August 2010 31 August 2009
Profit before tax 29,991 *20,030
Income tax expense (9,271) (1,636)
Profit after tax 20,720 18,394
Other comprehensive income – (397)
Total comprehensive income for the period 20,720 17,997
Retained earnings at beginning of the year 22,436 *7,328
Profit after tax 20,720 18,394
Share of associate loss 637 (713)
Dividends recognised during the year (10,028) (2,573)
Retained profits at end of the year attributable to equity holders 33,765 22,436
*Restated due to the change in accounting policy (refer to note 1(b)(i) for further details).
section 9
61Annual Report 2010
ABN 57 000 004 320 Australian Pharmaceutical Industries Limited

summarised statement of financial Position
closed group
As at As at
In thousands of AUD 31 August 2010 31 August 2009
Assets
Cash and cash equivalents 9,196 13,477
Trade and other receivables 505,908 95,334
Inventories 190,865 *177,691
Total current assets 705,969 286,502
Trade and other receivables 239,015 304,794
Investments 128,506 128,506
Investments accounted for using the equity method 24,304 23,667
Deferred tax assets 1,449 *3,141
Property, plant and equipment 78,739 60,180
Intangible assets 115,528 117,633
Total non-current assets 587,541 637,921
Total assets 1,293,510 924,423
Liabilities
Trade and other payables 479,160 459,567
Loans and borrowings 196,356 1,053
Employee benefits 8,168 7,101
Income tax payable 36 9,136
Total current liabilities 683,720 476,857
Trade and other payables 4,860 651
Loans and borrowings 490 1,518
Employee benefits 2,014 2,041
Provisions 1,738 1,105
Total non-current liabilities 9,102 5,315
Total liabilities 692,822 482,172
net assets 600,688 442,251
equity
Share capital 566,461 419,499
Reserves 462 316
Retained earnings 33,765 *22,436
Total equity 600,688 442,251
*Restated due to the change in accounting policy (refer to note 1(b)(i) for further details).
25. deed of cRoss guARAnTee continued
section 9
Notes to the consolidated financial statements continued
62 Annual Report 2010 Australian Pharmaceutical Industries Limited

26. ReconcILIATIon of cAsh fLows fRom oPeRATIng AcTIvITIes
year ended year ended
In thousands of AUD 31 August 2010 31 August 2009
cash flows from operating Activities
Profit/(loss) for the period 22,646 18,320
Adjustments for:
Depreciation 14,845 13,296
Amortisation 3,701 2,852
Foreign exchange (gains)/losses (108) 88
Share of (profit)/ loss of associates net of dividends received (637) 713
Net (Gain)/loss on sale of stores, property, plant and equipment (2,706) (5,221)
Equity-settled share-based payment expenses 146 19
Finance cost 13,970 21,569
Income tax expense 13,022 8,459
(Increase)/decrease in trade and other receivables (47,719) (21,173)
Decrease/(increase) in inventories (31,800) (23,566)
Increase/(decrease) in trade and other payables 96,024 16,651
(Decrease)/increase in provisions and employee benefits (509) 1,753
80,875 33,760
Net interest paid (21,397) (21,569)
Income taxes paid (16,128) (632)
net cash from operating Activities 43,350 11,559
As at As at
In thousands of AUD 31 August 2010 31 August 2009
Cash and cash equivalents 29,431 5,856
Bank overdrafts repayable on demand – –
cash and cash equivalents in the statement of cash flows 29,431 5,856
27. ReLATed PARTIes
key management personnel compensation
The key management personnel compensation included in ‘personnel expenses’ is as follows
year ended year ended
In AUD 31 August 2010 31 August 2009
Short-term employee benefits 3,981,911 4,150,493
Post employment benefits 306,756 249,363
Termination benefits 596,710 398,230
Share based payments 104,520 11,578
4,989,897 4,809,664
section 9
63Annual Report 2010
ABN 57 000 004 320 Australian Pharmaceutical Industries Limited

Individual directors and executives compensation disclosures
Information regarding individual directors and executives compensation and some equity instruments
disclosures as required by Corporations Act S300A and Corporations Regulations 2M.3.03 are provided
in the Remuneration Report section of the Directors’ Report.
Apart from the details disclosed in this note, no director has entered into a material contract with the
Company or the Group since the end of the previous financial year and there were no material
contracts involving directors’ interests existing at year-end.
Loans to key management Personnel
A loan totalling $91,453 made to Mr J Meiliunas was outstanding at 31 August 2010. Interest accrued
during the year ended 31 August 2010 on this loan was $5,327. Interest on shareholder loans is
payable at prevailing market rates, currently 6.65%.
All loans are secured by shares in the consolidated entity and are repayable on termination of
employment, or earlier at the borrower’s discretion.
No amounts have been written down or recorded as allowances, as the balances are considered
fully collectable.
Mr Meiliunas repaid his loan in full upon his separation from the Company on 15 September 2010.
other key management Personnel transactions with the company or its controlled entities
Certain members of key management personnel are directors of an associate entity (as discussed in
Note 12) that result in them having influence over the financial or operating policies of that entity.
The associate transacted with the Company or its subsidiaries in the reporting period. The terms and
conditions of the transactions with that party were no more favourable than those available, or which
might reasonably be expected to be available, on similar transactions to non-related entities on an
arm’s length basis.
Certain directors of the Company have entered into transactions with the Company and its
controlled entities during the financial year. These transactions may include purchasing of inventories
from the Company or its controlled entities. All transactions with the directors are on the same terms
and conditions as those entered into by other entities, employees or customers and are trivial or
domestic in nature.
27. ReLATed PARTIes continued
section 9
Notes to the consolidated financial statements continued
64 Annual Report 2010 Australian Pharmaceutical Industries Limited

27. ReLATed PARTIes continued
movements in shares
The movement during the reporting period in the number of ordinary shares of the Company, held directly, indirectly or
beneficially, by each key management person, including their personally related parties is as follows:
held at held at
In shares 1 september 2009 Purchases sales 31 August 2010
directors
Mr P R Robinson 67,300 134,868 – 202,168
Mr M Hampton 65,000 43,334 – 108,334
Ms E C Holley 10,000 6,667 – 16,667
Mr R D Millner 411,000 344,001 – 755,001
Mr S P Roche 70,000 266,667 – 336,667
Ms L Ausburn 50,000 33,334 – 83,334
executives
Mr J Meiliunas 292,609 – – 292,609
Mr P Smith 242,607 20,000 (235,407) 27,200
Mr R Vincent – – – –
Mr P Sanguinetti 5,000 3,334 – 8,334
Mr A Killick – – – –
Mr G Fallet – – – –
Mr M Langham – – – –
Mr P Hourihan – – – –
The movement during the previous reporting period in the number of ordinary shares of the Company, held directly,
indirectly or beneficially, by each key management person, including their personally related parties is as follows:
held at held at
In shares 1 september 2008 Purchases sales 31 August 2009
directors
Mr P R Robinson 67,300 – – 67,300
Mr M Hampton 35,000 30,000 – 65,000
Ms E C Holley 10,000 – – 10,000
Mr R D Millner 211,000 200,000 – 411,000
Mr S P Roche 70,000 – – 70,000
Ms L Ausburn – 50,000 – 50,000
executives
Mr J Meiliunas 289,293 292,609 (289,293) 292,609
Mr P Smith 242,607 – – 242,607
Mr R Vincent – – – –
Mr P Sanguinetti 5,000 – – 5,000
Mr A Killick – – – –
Mr M Langham – – – –
Mr P Hourihan – – – –
section 9
65Annual Report 2010
ABN 57 000 004 320 Australian Pharmaceutical Industries Limited

options and rights over equity instruments
The movement during the reporting period in the number of options over ordinary shares in Australian Pharmaceutical
Industries Limited held directly or beneficially, by each key management person, including their related parties, is as follows:
vested vested and
held at granted as other held at during exercisable
1 sept 09 compensation exercised changes* 31 Aug 10 the year at 31 Aug 10
directors
Mr S P Roche 367,100 330,900 – (87,500) 610,500 – –
executives
Mr J Meilliunas 161,600 – – (161,600) – – –
Mr R Vincent 198,700 178,000 – (46,900) 329,800 – –
Mr P Sanguinetti 111,400 127,400 – – 238,800 – –
Mr M Langham 142,000 145,500 – (20,600) 266,900 – –
Mr P Hourihan – 179,400 – (179,400) – – –
Mr G Fallet – 159,500 – – 159,500 – –
vested vested and
held at granted as other held at during exercisable
1 sept 08 compensation exercised changes* 31 Aug 09 the year at 31 Aug 09
directors
Mr S P Roche 175,000 279,600 – (87,500) 367,100 – –
executives
Mr J Meilliunas 77,000 122,100 – (37,500) 161,600 – –
Mr R Vincent 68,700 151,800 – (21,800) 198,700 – –
Mr P Sanguinetti – 111,400 – – 111,400 – –
Mr A Killick – 125,000 – (125,000) – – –
Mr M Langham 38,600 121,400 – (18,000) 142,000 – –
Mr P Hourihan – – – – – – –
* Other changes represent options that expired or were forfeited during the year.
No options held by key management personnel are vested but not exercisable at 31 August 2009 or 2010.
No shares were granted during the period to directors or senior executives.
Messrs R D Millner, and P R Robinson are directors of Washington H Soul Pattinson and Company Limited. Washington H Soul
Pattinson and Company Limited holds 120,214,969 shares (31 August 2009: 63,380,228 shares) in the Company at year end 31
August 2010.
During the year, further performance rights or options were issued by the Company to key management personnel and
certain senior executives. Share rights forfeited by and issued to key management personnel have been disclosed in the
Remuneration Report contained within the Directors Report of this report.
27. ReLATed PARTIes continued
section 9
Notes to the consolidated financial statements continued
66 Annual Report 2010 Australian Pharmaceutical Industries Limited

non key management Personnel disclosures
Associates
During the year ended 31 August 2010, associates purchased goods from the consolidated entity in the amount of
$1,190,673 (year ended 31 August 2009: $978,365) and at 31 August 2010 associates owed the consolidated entity $77,331
(31 August 2009: $38,000). Transactions with associates are priced on an arm’s length basis. Non-current loans to associates
of $5,927,781 (31 August 2009: $15,808,000) are unsecured, and bear interest at market rates. Interest revenue brought to ac-
count by the Company and consolidated entity in relation to these loans during the year to 31 August 2010 was $652,000
(August 2009: $771,000).
No dividends were received from associates during the period ended 31 August 2010 nor for the period ended 31 August
2009.
During the year ended 31 August 2010, $10,000,000 was received from associates against the non-current loan principal.
28. AudIToRs’ RemuneRATIon
consolidated
year ended year ended
In AUD 31 August 2010 31 August 2009
Audit services
Auditors of the Company
KPMG Australia:
Audit and review of financial reports 521,864 475,000
Overseas KPMG Firms:
Audit and review of financial reports 32,200 40,000
554,064 515,000other services
Auditors of the Company
KPMG Australia:
Other assurance services 64,137 –
Taxation services – 30,780
Overseas KPMG offices:
Taxation services 41,914 14,317
660,115 560,097
29. suBseQuenT evenTs
Subsequent to 31 August 2010 the $275,000,000 securitisation facility was extended to May 2013 and the $80,000,000 Aspire
securitisation facility was reduced to $70,000,000 and extended to May 2012.
On 22 October 2010, the Company obtained its’ lender’s consents for not achieving, during the 12 months ended 31 August
2010, a minimum performance target required under the lending terms. The basis of the performance target is the
budgeted earnings before interest and taxes. The covenant applies to all Australian debt and no additional obligations were
imposed by the lenders.
On 28 October 2010, a final dividend of 1.5 cents per share, fully franked to be paid on 15 December 2010, amounting to
$7.322 million was declared.
section 9
67Annual Report 2010
ABN 57 000 004 320 Australian Pharmaceutical Industries Limited

section 10
Directors’ declaration
dIRecToRs’ decLARATIon
1 In the opinion of the directors of Australian Pharmaceutical Industries Limited (‘API’):
(a) the financial statements and notes set out on pages 21 to 67, and the Remuneration
Report set out on pages 11 to 17 in the Directors’ Report, are in accordance with the
Corporations Act 2001, including:
(i) giving a true and fair view of the financial position of the consolidated entity as at
31 August 2010 and of their performance, for the financial period ended on that
date; and
(ii) complying with Australian Accounting Standards (including Australian Accounting
Interpretations) and the Corporations Regulations 2001;
(b) the financial report also complies with International Financial Accounting Standards as
disclosed in note 1(b); and
(c) there are reasonable grounds to believe that the API will be able to pay its debts as
and when they become due and payable.
There are reasonable grounds to believe that API and the controlled entities identified in
note 24 will be able to meet any obligations or liabilities to which they are or may become
subject to by virtue of the Deed of Cross Guarantee between the Company and those
controlled entities pursuant to ASIC Class Order 98/1418
2 The directors have been given the declarations by the chief executive officer and chief
financial officer for the financial period ended 31 August 2010 pursuant to Section 295A of
the Corporations Act 2001.
Dated at Sydney, 15 November 2010
Signed in accordance with a resolution of the directors:
Peter R. Robinson
Director
68 Annual Report 2010 Australian Pharmaceutical Industries Limited

Independent auditor’s report to the members of Australian Pharmaceutical Industries Limited
RePoRT on The fInAncIAL RePoRT
We have audited the accompanying financial report of Australian Pharmaceutical Industries Limited (the
Company), which comprises the consolidated statement of financial position as at 31 August 2010, and
consolidated income statement and consolidated statement of comprehensive income, consolidated
statement of changes in equity and consolidated statement of cash flows for the year ended on that date,
a description of significant accounting policies and other explanatory notes 1 to 29 and the directors’
declaration of the Group comprising the Company and the entities it controlled at the year’s end or from
time to time during the financial year.
Directors’ responsibility for the financial report
The directors of the Company are responsible for the preparation of the financial report that gives a true and
fair view in accordance with Australian Accounting Standards (including the Australian Accounting
Interpretations) and the Corporations Act 2001 and for such internal control as the directors determine is
necessary to enable the preparation of the financial report that is free from material misstatement whether
due to fraud or error. In note 1 (b), the directors also state, in accordance with Australian Accounting
Standard AASB 101 Presentation of Financial Statements, that the financial statements of the Group comply
with International Financial Reporting Standards.
Auditor’s responsibility
Our responsibility is to express an opinion on the financial report based on our audit. We conducted our audit
in accordance with Australian Auditing Standards. These Auditing Standards require that we comply with
relevant ethical requirements relating to audit engagements and plan and perform the audit to obtain
reasonable assurance whether the financial report is free from material misstatement.
An audit involves performing procedures to obtain audit evidence about the amounts and disclosures in the
financial report. The procedures selected depend on the auditor’s judgement, including the assessment of
the risks of material misstatement of the financial report, whether due to fraud or error. In making those risk
assessments, the auditor considers internal control relevant to the entity’s preparation of the financial report
that gives a true and fair view in order to design audit procedures that are appropriate in the circumstances,
but not for the purpose of expressing an opinion on the effectiveness of the entity’s internal control. An audit
also includes evaluating the appropriateness of accounting policies used and the reasonableness of
accounting estimates made by the directors, as well as evaluating the overall presentation of the financial
report.
We performed the procedures to assess whether in all material respects the financial report presents fairly, in
accordance with the Corporations Act 2001 and Australian Accounting Standards (including the Australian
Accounting Interpretations), a true and fair view which is consistent with our understanding of the Group’s
financial position and of it’s performance.
We believe that the audit evidence we have obtained is sufficient and appropriate to provide a basis for our
audit opinion.
section 11
Independent audit report
69Annual Report 2010
ABN 57 000 004 320 Australian Pharmaceutical Industries Limited

section 11
Independent audit report continued
Independent auditor’s report to the members of Australian Pharmaceutical Industries
Limited continued
Independence
In conducting our audit, we have complied with the independence requirements of the Corporations
Act 2001.
Auditor’s opinion
In our opinion:
(a) the financial report of the Group is in accordance with the Corporations Act 2001, including:
(i) giving a true and fair view of the Group’s financial position as at 31 August 2010 and of its
performance for the year ended on that date; and
(ii) complying with Australian Accounting Standards (including the Australian
Accounting Interpretations) and the Corporations Regulations 2001.
(b) the financial report also complies with International Financial Reporting Standards as disclosed in
note 1 (b).
RePoRT on The RemuneRATIon RePoRT
We have audited the Remuneration Report included in the directors’ report for the year ended 31
August 2010. The directors of the Company are responsible for the preparation and presentation of the
remuneration report in accordance with Section 300A of the Corporations Act 2001. Our responsibility is
to express an opinion on the remuneration report, based on our audit conducted in accordance with
auditing standards.
Auditor’s opinion
In our opinion, the remuneration report of Australian Pharmaceutical Industries Limited for the year
ended 31 August 2010, complies with Section 300A of the Corporations Act 2001.
KPMG
Paul mcdonald
Partner
Melbourne,
15 November 2010
70 Annual Report 2010 Australian Pharmaceutical Industries Limited

Asx AddITIonAL InfoRmATIon
Additional information required by the Australian Stock Exchange Limited Listing Rules and not disclosed
elsewhere in this report is set out below.
shareholdings as at 18 october 2010
substantial shareholders
The number of shares held by substantial shareholders and their associates are set out below:
Washington H Soul Pattinson and Company Limited 120,214,969 ordinary shares
J P Morgan Nominees Australia Limited 55,571,695 ordinary shares
SL Nominees Pty Ltd 44,734,167 ordinary shares
National Nominees Limited 40,919,101 ordinary shares
Citicorp Nominees Pty Limited 32,852,431 ordinary shares
HSBC Custody Nominees (Australia) Limited 25,052,942 ordinary shares
voting rights
The voting rights attaching to the ordinary shares, as set out in clause 16 of the Company’s Constitution, are:
(a) on a show of hands:
(i) if a member has appointed two proxies, neither of those proxies may vote;
(ii) a member who is present and entitled to vote and is also a proxy, attorney or representative of
another member has one vote; and
(iii) subject to paragraphs (a)(i) and (a)(ii), every individual present who is a member, or a proxy, attorney
or representative of a member, entitled to vote has one vote;
(b) on a poll every member entitled to vote who is present in person or by proxy, attorney or representative:
(i) has one vote for every fully paid share held; and
(ii) subject to paragraph (c), in respect of each partly paid share held has a fraction of a vote equal to
the proportion which the amount paid bears to the total issue price of the share; and
(c) unless:
(i) permitted under the Listing Rules; and
(ii) otherwise provided in the terms on which shares are issued,
in calculating the fraction of a vote which the holder of a partly paid share has, the Company must
not count an amount:
(iii) paid in advance of a call; or
(iv) credited on a partly paid share without payment in money or money’s worth being made to the
Company.
section 12
Shareholder information
71Annual Report 2010
ABN 57 000 004 320 Australian Pharmaceutical Industries Limited

section 12
Shareholder information continued
on-market share buy-back
There is no current on-market share buy-back.
Distribution of Shareholders as at 18 October 2010
Category
Ordinary Shares Number of Shareholders
1 – 1,000 1,614
1,001 – 5,000 2,937
5,001 – 10,000 1,250
10,001 – 100,000 1,955
100,001 and over 278
8,034
The number of shareholders holding less than a marketable parcel at 18 October 2010 was 1,265 (12 October 2009: 869)
stock exchange
The Company is listed on the Australian Stock Exchange. The Home Exchange is Sydney.
other Information
Australian Pharmaceutical Industries Limited, incorporated and domiciled in Australia, is a publicly listed company limited
by shares.
Twenty largest shareholders as at 8 october 2010*number of ordinary Percentage of
name shares held capital held
Washington H Soul Pattinson and Company Limited 120,214,969 24.63
J P Morgan Nominees Australia Limited 56,602,812 11.60
SL Nominees Pty Ltd 44,734,167 9.17
National Nominees Limited 38,732,723 7.94
Citicorp Nominees Pty Limited 31,899,198 6.54
HSBC Custody Nominees (Australia) Limited 26,133,883 5.35
Dancetown Pty Limited 13,388,430 2.74
RBC Dexia Investor Services Australia Nominees Pty Ltd (BKCUST A/c) 5,494,225 1.13
Cogent Nominees Pty Limited 3,490,575 0.72
Merrill Lynch (Australia) Nominees Pty Limited (Berndale A/c) 3,122,804 0.64
Citicorp Nominees Pty Limited (CFSIL Cwlth Aust SHS 23 A/c) 1,726,985 0.35
Hallam Drainage Pty Ltd 1,300,000 0.27
RBC Dexia Investor Services Australia Nominees Pty Ltd (Piselect A/c) 1,274,236 0.26
Citicorp Nominees Pty Limited (CFSIL Cwlth Aust SHS 17 A/c) 1,266,913 0.26
Queensland Investment Corporation 1,129,389 0.23
Farjoy Pty Ltd 1,038,510 0.21
Merrill Lynch (Australia) Nominees Pty Limited 1,034,183 0.21
Michael Kelaher 750,000 0.15
McNeil Nominees Pty Limited 750,000 0.15
Third Exar Pty Ltd (Andrews Super Fund A/c) 750,000 0.15
354,834,002 72.70
* As shown on the register, beneficial holdings may differ.
72 Annual Report 2010 Australian Pharmaceutical Industries Limited

shareholder communications
Enquiries or notifications by shareholders
regarding their shareholdings or dividend
should be directed to API’s share registry:
Registries Limited
Level 7
207 Kent Street
Sydney NSW 2000
GPO Box 3993
Sydney NSW 2001
Telephone 1300 737 760
International +61 2 9290 9600
Facsimile 1300 653 459
Shareholders can also send queries to the share
registry via email: [email protected]
You can access information about your API
shareholding and download forms via the
internet by visiting: www.registries.com.au
section 12
73Annual Report 2010
ABN 57 000 004 320 Australian Pharmaceutical Industries Limited

section 12
Shareholder information continued
dividends
If you wish your dividends to be paid directly to a bank,
building society or credit union account in Australia contact
the share registry or visit the website of Registries at
www.registries.com.au for an application form. The
payments are electronically credited on the dividend
payment date and confirmed by payment advices sent
through the mail to the shareholder’s registered address.
All instructions received remain in force until amended or
cancelled in writing.
Tax file number (Tfn), Australia Business number
(ABn or exemption)
You are strongly advised to lodge your TFN, ABN or
exemption with the share registry. If you choose not to lodge
these details, then API is obliged to deduct tax at the highest
marginal rate (plus the Medicare levy) from the unfranked
portion of any dividend. Certain pensioners are exempt from
supplying their TFN’s. You can confirm whether you have
lodged your TFN, ABN or exemption via the Registries
website.
uncertificated forms of shareholdings
Two forms of uncertificated holdings are available to API
shareholders:
Issuer sponsored holdings:
This type of holding is sponsored by API and provides
shareholders with the advantages of uncertificated holdings
without the need to be sponsored by any particular
stockbroker.
Broker sponsored holdings (‘chess’):
Shareholders may arrange to be sponsored by a stockbroker
(or certain other financial institutions) and are required to
sign a sponsorship agreement appointing the sponsor as
their ‘controlling participant’ for the purposes of CHESS.
This type of holding is likely to attract regular stock market
traders or those shareholders who have their share portfolio
managed by a stockbroker.
Shareholders communicating with the share registry should
have their Security Holder Reference Number (SRN) at hand
or Holder Identification Number (HIN) as it appears on the
Issuer Sponsored/ CHESS statements or dividend advices.
For security reason, shareholders should keep their Security
Holder Reference Numbers confidential.
Annual Report mailing List
Shareholders (whether Issuer or Broker Sponsored) wishing to
receive the Annual Report should advise Registries in writing
so that their names can be added to the mailing list.
Shareholders are able to update their preference via the
Registries website. Shareholders can also elect to receive
the Annual report by e-mail or by accessing the Company
website.
change of Address
Shareholders who are Issuer Sponsored should notify any
change of address to the share registry promptly in writing
quoting their Security Holder Reference Number, previous
address and new address. Application forms for Change of
Address are also available for download via the Registries
website. Broker Sponsored (CHESS) holders must advise their
sponsoring broker of the change.
share Trading and Price
API shares are traded on the Australian Stock Exchange
Limited (‘ASX’). The stock code under which they are traded
is ‘API’ and the details of trading activity are published in
most daily newspapers under that abbreviation.
off-market share Transfers
Stamp duty on transfer of listed shares was abolished on 1
July 2001. Share transfers dated after 1 July 2001 should be
forwarded directly to Registries at the address noted above.
Information on API
API has an internet site featuring news items, announcements,
corporate information and a wide range of product and
service information. API’s internet address is www.api.net.au
The Annual Report is the main source of information for
shareholders. Other sources of information include:
• Interim results
• Annual results
• The Annual General Meeting - the Chairman and the
Managing Director address the meeting
• ASX announcements
74 Annual Report 2010 Australian Pharmaceutical Industries Limited

section 12
75Annual Report 2010
ABN 57 000 004 320 Australian Pharmaceutical Industries Limited
financial calendar*
Half year end 28 February 2011
Half year profit announcement 27 April 2011
Year end 31 August 2011
Full year profit announcement 27 October 2011
Annual General Meeting 17 January 2012
* Timing of events is subject to change
Requests for publications and other enquiries about API’s
affairs should be communicated to:
Company Secretary
Australian Pharmaceutical Industries Limited
885 Mountain Highway
Bayswater VIC 3153
Enquiries can also be made via email by accessing
www.api.net.au – “contact us”

Annual Report 2010 Australian Pharmaceutical Industries Limited76
section 13
Corporate directory
offices and officers
company secretary
Mr Peter Sanguinetti B.Juris, LLB
Principal Registered Office
Australian Pharmaceutical Industries Limited
11 Grand Avenue
Camellia NSW 2142
Telephone: (02) 8844 2000
Facsimile: (02) 8844 2400
Location of share Registry
Registries Limited
Level 7
207 Kent Street
Sydney NSW 2000
GPO Box 3993
Sydney NSW 2001
Telephone: 1300 737 760
International: +61 2 9290 9600
Facsimile: 1300 653 459
E-mail: [email protected]

Australian Pharmaceutical
Industries Limited
ABN 57 000 004 320
11 Grand Avenue
Camellia, New South Wales 2142
885 Mountain Highway
Bayswater, Victoria 3153
www.api.net.au


