+ All Categories
Home > Documents > Australian Real Estate Stock Reactions to FIRB Regulation ...

Australian Real Estate Stock Reactions to FIRB Regulation ...

Date post: 10-Dec-2021
Category:
Upload: others
View: 2 times
Download: 0 times
Share this document with a friend
52
Claremont Colleges Scholarship @ Claremont CMC Senior eses CMC Student Scholarship 2017 Australian Real Estate Stock Reactions to FIRB Regulation Changes Henry Wei Claremont McKenna College is Open Access Senior esis is brought to you by Scholarship@Claremont. It has been accepted for inclusion in this collection by an authorized administrator. For more information, please contact [email protected]. Recommended Citation Wei, Henry, "Australian Real Estate Stock Reactions to FIRB Regulation Changes" (2017). CMC Senior eses. 1637. hp://scholarship.claremont.edu/cmc_theses/1637
Transcript

Claremont CollegesScholarship @ Claremont

CMC Senior Theses CMC Student Scholarship

2017

Australian Real Estate Stock Reactions to FIRBRegulation ChangesHenry WeiClaremont McKenna College

This Open Access Senior Thesis is brought to you by Scholarship@Claremont. It has been accepted for inclusion in this collection by an authorizedadministrator. For more information, please contact [email protected].

Recommended CitationWei, Henry, "Australian Real Estate Stock Reactions to FIRB Regulation Changes" (2017). CMC Senior Theses. 1637.http://scholarship.claremont.edu/cmc_theses/1637

CLAREMONT McKENNA COLLEGE

Australian Real Estate Stock Reactions to FIRB Regulation Changes

SUBMITTED TO

Professor David Bjerk

BY

Henry T. Wei

for

SENIOR THESIS

Spring 2017

April 24, 2017

Abstract

This study analyzes the share price reactions of real estate development and

building/construction materials corporations in relation to FIRB rule changes. It appears

companies as a whole were indifferent to the rule changes; however individual securities

returns were wildly different. These findings suggest that the FIRB rule changes had a

mixed effect on different corporations possibly based on their exposure to the Australian

real estate market.

Acknowledgments

First and foremost, I would like to thank my parents. We may have not agreed on

things throughout my life, but I know you guys always had my best interest and heart.

Your support has made all of this possible.

I would also like to thank Professor Bjerk on agreeing to be my reader, despite not

having any experience in my field of study. A special thanks to Professor Burdekin,

without your advice this thesis would not be possible. Your guidance helped me

overcome many of the obstacles I faced throughout the writing process.

I would also like to thank my girlfriend Sara Stevens, she was my true ECON 180

professor. You pushed me to follow every deadline, despite my best efforts to avoid

them.


Table of Contents

Acknowledgments

Abstract

I. Introduction………………………………………………………………………..1

II. Background………………………………………………………………………..5

a. FIRB…………………………………………………………………….....5

b. Australian-Chinese Economic Relations………………………………….7

III. Empirical Approach……………………………………………………………….8

a. Testing for Short-Term Returns…………………………………………...9

b. Testing for Long-Term Returns………………………………………….11

IV. Data………………………………………………………………………………13

V. Results……………………………………………………………………………15

a. Testing for Short-Term Returns………………………………………….15

b. Testing for Long-Term Returns………………………………………….20

VI. Conclusion……………………………………………………………………….21

References………………………………………………………………………………..23

Figures and Tables……………………………………………………………………….27

Appendix…………………………………………………………………………………37


1  

I. Introduction

During the past few years, there has been a growing concern about the

affordability of housing in Australia. From 2011 to 2016, Australian property prices have

grown by 35%, Sydney by 57.3% and Melbourne by 50.7% (Australian Bureau of

Statistics 2016), and are often cited as the least affordable in the world (Demographia

2016). Popular Australian media have portrayed the growing number of foreign real

estate investors as the primary reason for the growth in real estate prices (Wong 2017).

These claims are not baseless; diagram 1 shows Chinese investment has grown from 4

billion Australian dollars in 2011 to 24.35 billion in 2015. Specifically, Chinese

investment has increased from 10% of total real estate investment to 25.1% in the same

timeframe. Additionally, per a study by the National Australian Bank, at its peak, foreign

buyers accounted for 15.7% of new home purchases in the third quarter of 2015 and 9%

of total demand for established properties (NAB 2016). These numbers do not include all

the illegal and alternative methods available to overseas investors, underestimating the

figures above. These facts appear to present a correlation between the growth in housing

prices and the increase in foreign investment, especially in Melbourne and Sydney, which

are home to four-fifths of all foreign investment (Gauder Houssard & Orsmond 2014).

2  

Diagram 1

However, Chinese investment is not the only cause of Australia’s rapid growth in

housing prices. First, many Australian cities face major supply constraints that boost

prices. Most Australian cities are built along the coast and along mountain ranges, which

restricts the construction of new housing units outward (Richards 2008). Along with

geographic constraints to supply, the country has installed policies to limit the outward

expansion of cities to curtail ‘urban sprawl,’ resulting in boosted prices. In Australian

cities, zoning laws have contributed to inflating housing prices by prescribing certain

tracts of land to be high or low (Kulish, Richards and Gillitzer 2012).

On the demand side, in the 1970’s, Australian housing markets were heavily

regulated. In the mid-1980s, there was a decision to deregulate the housing market

ultimately causing interest rates to lower in the 1990s. The deregulated housing market

and the low-interest rate environment have been some of the many factors behind the

(In Millions)

2,421  4,093  4,187  5,932 12,406 

24,349 17,241 

31,670 43,154 

31,525 

48,011 

63,309 

439 

5,750 

11,060 

14,450 

14,533 

9,244 

$20,101 

$41,513 

$58,401 $51,907 

$74,950 

$96,902 

0

25,000

50,000

75,000

100,000

2010 2011 2012 2013 2014 2015

Total Real Estate Investment in Australia

China Other Foregin Nations Domestic

Source: FIRB

3  

increase in domestic Australian housing demand (Stapledon 2016). Accompanied by the

low-interest rates and deregulation, Australia is currently experiencing a migration shift

in its largest cities, boosting major city prices. Structural changes in the economy have

moved away from labor-intensive industrial production towards a centrally located

knowledge-based economy, where the migration is centralized. The changes in the

econommmy has created a migration shift from the urban fringe towards the cities (Yates

2016).

While most Australians place the blame on Chinese buyers, the legislative

framework has modeled the public's concerns by attempting to curtail foreign investment

to keep Australian housing prices lower and push out housing supply. Under Australian

laws, foreign nationals are not allowed to purchase existing dwellings, but rather they

must purchase new dwellings (FIRB Factsheet 2015). With Chinese money still looking

to go abroad to Australia, many residential housing builders have built housing

specifically for Chinese buyers (Wong 2017). The restraints on spending has created a

dichotomy between not only the prices of new dwellings and existing dwellings but also

the purchasers of these homes. Foreign nationals often purchase homes above the average

home price, whereas first-time domestic homebuyers bought homes below the average

home price (Gauder Houssard & Orsmond 2014). Thanks to the pre-existing legislative

framework, this may have pushed out the supply of housing, benefiting Australian

citizens.

The legislative framework for foreign investment relies on on, what sets Australia

apart from other countries, a government body called the Foreign Investment Review

4  

Board, otherwise known as the FIRB. The FIRB’s role is to review foreign investments

and prevent any investment that may be against Australia’s national interest (FIRB About

2017). The FIRB evaluates investments in business acquisitions, agribusiness, media

business, commercial and agricultural land, mining tenements, and most importantly, for

the purposes of this study, real estate. The FIRB changes, mentioned above, were

announced on Saturday, May 2, 2015, by Prime Minister Tony Abbott and Treasurer Joe

Hockey while making a joint announcement confirming a raft of changes to the foreign

investments rules that would be implemented on December 1st, 2015. The changes

implemented focused on tightening foreign investment rules already in place. The new

changes included streamlining the process for finding violators by putting detection under

one agency, the Australian Tax Office, and increasing fines and jail time for violators.

More importantly, the new rules implemented fees for new foreign investment

applications. These fees can range from AUD$5,000 to AUD$100,000, depending on the

value of the property (McCullough Robertson 2015).

Overall, with the legislative framework, Australian housing prices have

experienced a dramatic increase during the past decade due to numerous factors.

Endogenous factors include the lack of brownfield and greenfield development areas in

Melbourne and Sydney. The lack of readily available land to develop can lead to a supply

constraint pushing prices up. Exogenously, clear increase in investment abroad,

especially from Chinese nationals, has pushed demand out as well. These developments

mirror other English-speaking countries such as the United States, the United Kingdom,

and Canada, specifically, in such cities as Palo Alto, Los Angeles, New York, London,

and Vancouver. The major difference between other major English speaking developed

5  

nations and Australia is the FIRB and the legislative framework that it enforces. This

study will explore the effect of the new FIRB regulatory framework on the Australian

real estate market through an event study of Australian public equities.

II. Background

II(a) FIRB

Australia’s Foreign Investment Review Board, otherwise known as the FIRB, is a

non-statutory body established in 1976 to advise the Treasurer and the Government on

Australia’s Foreign Investment Policy and its administration. Their role is to review

foreign investments and prevent any investment that may be against Australia’s national

interest (FIRB About). The FIRB will evaluate investments in business acquisitions,

agribusiness, media business, commercial and agricultural land, mining tenements, and

most importantly for the purposes of this study, real estate. Under the FIRB’s legislative

framework, a foreign national can only purchase new dwellings, and can only buy an

established dwelling under special circumstances. The purpose behind Australia’s

legislative framework is to channel foreign investments into new dwellings to create

additional jobs in the construction industry, increase government revenues from stamp

duties and other taxes, and increase Australia’s housing supply (FIRB About).

Individual foreign investment in real estate has been on the FIRB’s agenda since

the 1980s. Initially, in 1976, the FIRB did not consider real estate acquisitions by

foreigners. However, by 1982, purchases of real estate by foreign nationals came under

the FIRB’s authority. Through the 1960’s and 1970’s, Australia experienced its most

restrictive environment for business development. The Australian government has

6  

recognized a 30 percent decline in capital productivity during that period due to the

restrictive nature of the regulatory environment. The restrictive setting was due to a wave

of economic nationalism that perceived foreign investment as a loss of sovereignty and

foreign acquisitions to mean a loss of jobs (Foreign Investment Policy in Australia). The

Australian government recognized these flaws in their self-harmful legislative framework

and sought to liberalize the system to encourage foreign investment. For example, in

1999 ‘Advanced-off-the-plan certificates’ were introduced, which allowed developers to

pre-approve the sale of up to 50 percent of development to foreign investors. In 2008,

temporary residents no longer needed FIRB approval to purchase real estate. However,

by 2009, sections of the housing industry were reporting increasing real estate prices

(Rogers Lee & Yan 2015). In result, following in 2010, the rising concerns of housing

affordability and the anti-foreign investment rhetoric in Australian media led to re-

tightening of restrictions (Wong 2017).

The most recent legislation was announced in 2015 and was enforced at the

beginning of 2016 under the Foreign Acquisitions and Takeovers Regulation 2015 and

the Foreign Acquisitions and Takeovers Fees Imposition Regulation 2015. The new

legislation had three parts. One was to streamline the process for finding and prosecuting

violators of existing FIRB rules by putting all relevant information under one

organization, the Australian Tax Office. The second was to increase the penalties and

fines for violators, including jail time. The third was to impose an application fee for

foreign investors from A$5,000 to A$100,000. The new regulation also imposed a cap on

the amount an individual foreigner can purchase interests in “advanced off the plan”

developments to A$3 million, down from A$5 million.

7  

II(b) Chinese Australian Economic Relations

Australia has been one of the many beneficiaries of China’s economic growth.

Since 2009, China has become an increasingly important trade partner for Australia. In

2013 to 2014, China accounted for roughly one-third of all export dollars in the fiscal

year and accounted for eighty percent export of dollar growth during the same period

(Australian Trade Commission 2015). In result, in December 2015, the Australian and

Chinese government announced the China-Australia Free Trade Agreement, CHAFTA.

CHAFTA eliminated customs duties, incorporated non-tariff measures, and introduced

many other policies to encourage trade between the two nations (CHAFTA 2015).

China’s increased role in Australia’s export market along with CHAFTA have made

Australia more vulnerable to fluctuations in the Chinese market.

The link between shocks in the Chinese economy and the Australian economy has

been shown at the macroeconomic level. It has been shown that shocks to Chinese M2

have significance effects on the Australian economy (Burdekin & Tao 2016). For

instance, Australia avoided a technical recession because of China’s two-year fiscal

stimulus in the wake of the 2008 financial crisis, and the ensuing slowdown in world

trade. China accelerated already existing infrastructure plans and built up a strategic

stockpile of raw materials. China’s increase demand for raw materials led to a boom for

Australian GDP, and without the increased stimulus, Australia would have experienced

three straight quarters of negative growth in real GDP (Day 2011).

As the link between the Chinese and Australian grew stronger, so has Chinese

immigration to Australia. For instance, more and more Chinese students are flocking to

8  

Australian universities. In 2016, 196,315 Chinese students attended Australian

undergraduate and graduate institutions, representing approximately 27% of the

international population in Australia (Australian Government 2017). Chinese tourism has

experienced a similar trend. Chinese visitors increased from 100,000 in the year 2000 to

one million in January 2016, with an average annual growth rate of 18 percent since

2010. Chinese visitors spent A$ 1.5 billion in 2015 and spent A$7.7 billion in 2015. The

increase in Chinese tourism is not by accident. Australian tourism executives

aggressively target Chinese tourists through marketing, distribution, and partnership

strategies (Tourism Australia 2016). China’s growing economic ties are some of the

many reasons why Chinese nationals have increased their investment in Australian real

estate. (Rogers & Co 2015)

III. Empirical Approach:

The goal of this analysis is to test if the announcement of FIRB rule changes

affected the stock performance of relevant real estate development and

building/construction materials companies. To accomplish this, I utilize two empirical

processes, an event study, and an OLS regression, to determine if the rule changes

affected short-term and long-term returns.

I reason increased restrictions on foreign direct investment in real estate will

decrease construction activity in Australia. Such decreased construction activity would

hurt the top and bottom line growth for all real estate development and

construction/building material companies. Therefore, I hypothesize there will be a

negative spike in stock price returns for all Australian companies that have high

9  

exposure to the real estate market relative to normal market returns, or negative long-

term returns relative to normal market returns.

Method (A) Testing for Short-Term Effects on Returns

To test for short-term effects on Australian real estate development and

building/construction materials companies, I use an event study. An event study aims to

examine the impact of positive and negative news on investor reactions in the stock

market. Brown and Warner (1984) find event study results are consistent across altered

conditions like smaller samples and longer event periods. The efficient market

hypothesis states that at any given time and in a liquid market, security prices fully

reflect all available information (Morning Star 2017). Using the efficient market

hypothesis, the stock market is efficient enough to determine the impact of the FIRB

rules changes in relation to relevant corporations’ future earnings.

Specifically, in this thesis, an index of real estate development and

building/construction materials companies share price reactions in response to the FIRB

rule change was assessed. These reactions are measured through calculating the

abnormal returns relative to the Australian stock market while controlling for lagged

effects. In this study, to perform the regression for the distributed lag model, I need to

consider relevant construction companies and an index that reflect normal equity

performance in Australia. The index I use for market returns will be the All Ordinaries

Index. The All Ordinaries Index is the oldest index of shares in Australia and is made of

the 500 largest companies listed on the Australian Securities Exchange (S&P 2017). In

my regressions, I use two separately made indices that weight each stock by market cap

10  

within the index. The two indices are a compilation of representative Australian real

estate development and building/construction materials companies. One index contains

the seven largest equities by market capitalization in the sector, and the other index

contains all relevant public companies. I reason that companies of different size have

different exposure to foreign direct investment, and the FIRB rule has different effects

on corporate profits.

This event study is performed through STATA in reference to Kim (2015). The

event dates assessed on May 2nd, 2015, the date of the rule change announcement. The

event window is the minimum number of observations before and after the event date and

the estimation window is the minimum number of observations before the event window.

In this thesis, event windows of ±1 and ±2 days and estimation windows of 15, 30, and

45 days were applied to the two indices to assess the immediate share price responses.

Before the abnormal returns analysis, it is necessary to estimate the normal

performance of the indices’ share price, which is completed through using a market

model that assumes a linear relationship between the daily returns of the index and the

All Ordinaries index. The equation is as follows:

Rft = αf + βfRmkt + eft

Where Rft is the daily return of the real estate development and construction materials

index at time t, αf is the intercept, βf is the coefficient of Rmkt which is the daily return of

the All Ordinary index, and eft is the error for the construction equity index.

Thus, the dependent variable in this model is the daily return of the index and the

independent variable is the daily return of the All Ordinaries index. The normal

11  

benchmark performance is the return around the event window that would have followed

in the absence of any shift.

After estimating normal performance, abnormal returns are calculated by simply

subtracting the predicted normal return from the actual return for the dates within the

event window. The equation is as follows:

ARft = Rft - α̂f - β̂fRmkt

Then cumulative abnormal returns were computed by adding all the abnormal

returns for the index. Under the null hypothesis in which the event’s effects are

insignificant, the abnormal return should normally be determined with a zero conditional

mean and conditional variance. The significance of the abnormal returns is calculated by

dividing the cumulative abnormal return ΣARft by the standard deviation of ARft. The

statistical significance was determined at the 90%, 95%, and at the 99% level which

corresponds to absolute statistical values of 1.64, 1.96, and 2.58.

Method (B) Testing for Long-Term Effects on Returns

The event study method above looks at short-term changes in stock prices to see

the market reaction to different incidents. In this case, it is possible that the market does

not react rapidly to the information. Rather, the effect of a new policy or law can be

spread out over time. When looking at figures 1 through 10, there is a dip in stock price

for both indices and the individual securities examined in methodology 1. The dip in

stock price may be due to the lag in response of the stock market. I reason that the

existence of the longstanding FIRB and the pre-existing rules will not make investor

sentiment change. Only the new regulations could affect overall corporate earnings.

12  

Even, if the new FIRB rules did affect corporate earnings, then it’s effect could emerge

gradually over time, rather than immediately. To account for this possibility, I will

employ an ordinary least squares multivariate regression to determine whether an

association exists between the returns of a composite of real estate development

companies and the announcement and enforcement of new FIRB rule changes, when

controlling for returns of the overall Australian stock market returns. I regress four

separate indices that were used in the event study against the corresponding lag

dependent variables. Two of the four indices were re-used from method 1, and the other

indices were the first two indices removing Lend Lease Group, the largest real estate

development company in Australia. I remove Lend Lease Group because its size may

bias the results, as its returns will be weighted more than all other companies. The lags

are determined using the likelihood ratio test. I use the likelihood ratio test because it is

the most forgiving methodology for determining lags. I then use the All Ordinaries Index

as the proxy for normal market returns to see test if the effect of the new FIRB

regulations affected the market over time rather than in the window.

Using the methodology above and the simple Ordinary Least Squares regression,

the following econometric model is specified as:

Index Returnsi,t = β1 All Ordinariesi,t + β2 Index returnsi,t-1 + … + βn Index returnsi,t-n +

Dn + εi,t

Where Index returns represent the daily return of the composite of publicly traded

Australian real estate development companies, All Ordinaries represents the daily return

of the All Ordinaries Index, i.e., the daily return of the Australian stock market and the

13  

lags represent the lag dependent variables determined by the likelihood ratio test. For the

dummy, I use it to account for any changes in return to the indices relative to the All

Ordinaries Index. I use three different regressions to run the dummy variable. One

dummy variable is “turned on” day of the announcement. I refer to this dummy as

dummy 1. The next regression, the dummy is “turned on” for a three-day “window”, the

day before the announcement, the day of the announcement, and the day after the

announcement. I refer to this dummy as dummy 2. In the last regression, the dummy is

“turned on” for perpetuity after the announcement. In the regression, I refer to this

dummy as dummy 3.

Since the FIRB rule changes not only include changes in foreign direct investment

in real estate but also in investment in other parts of the economy, it is possible that the

new rule changes will depress the entire market and not just the real estate sector. To

account for this, I will also run an OLS regression of the All Ordinaries index regressed

upon lags of its returns and the same dummy variables for the regressions mentioned

above. This regression will test if there is any effect on the market as a whole from the

aforementioned rule changes.

IV. Data

The daily returns of the four separate indices were all drawn from Capital IQ as

daily returns weighted by their market capitalization. The two event dates were assigned

based on the announcement of the event and the date that it had announced that the rules

were to be enforced.

14  

The two indices will be referred to as Index 1 and Index 2. In Index 1, the public

companies I include are Boral Limited (BLD), Stockland Corporation (SGP), LendLease

Group (LLC), CSR Limited (CSR), Mirvac Group (MGR), Adelaide Birghton (ABC),

Sunland Group (SDG), and Villa World (ltd). These equity companies are picked from a

list of the top residential homebuilders in Australia (Resolute Equipment 2016) and a list

of the top building and construction material companies in Australia (Barron’s 2017)

Index 2 is comprised of 14 different companies; the companies mentioned above and

AVJennings Limited (AVJ), Axiom Properties Limited (AXI), Brickworks Limited

(BKW), Cedar Woods Properties Limited (CWP), Devine Limited (DVN), Finbar Group

Limited (FRI), and Velocity Property Group Limited (VP7). These additional companies

are found using a Capital IQ screen. The criteria for the company are as follows; they

must be public companies, their primary source of revenue is through real estate

development or supplying construction materials, must be geographically based in

Australia, and must be listed on the ASX (Australian Stock Exchange).

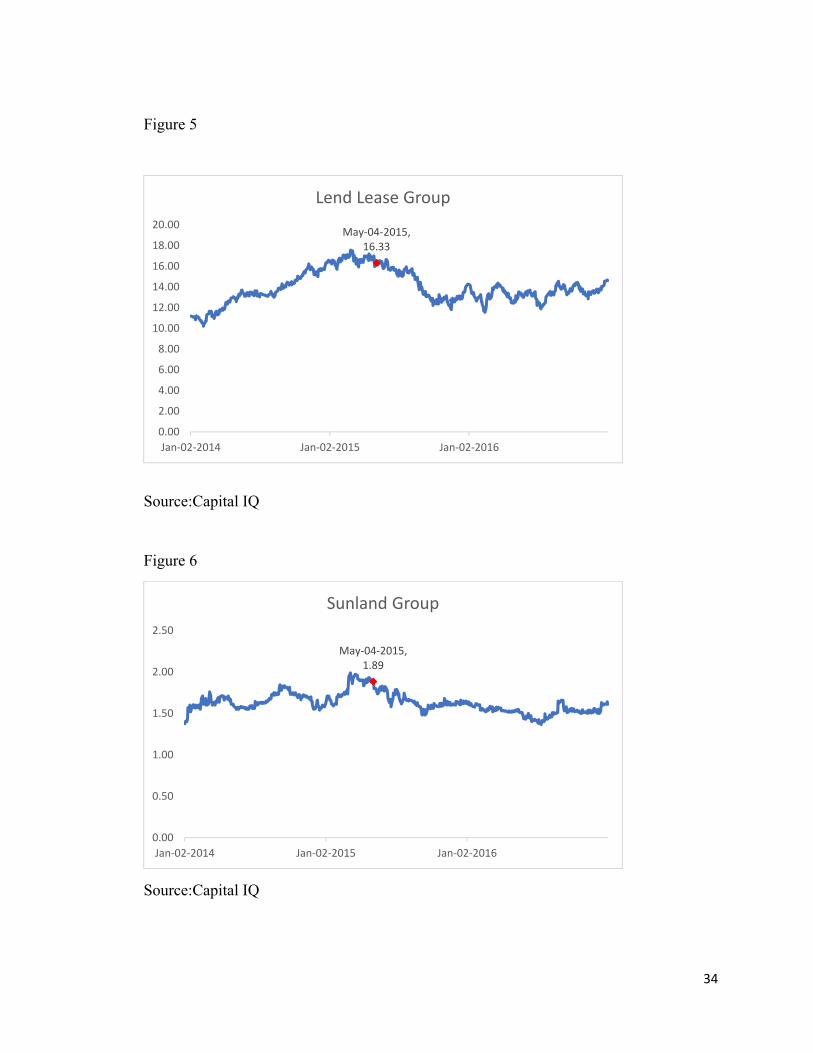
Lend Lease Group (LLC), Sunland Group Limited (SDG), and Villa World Limited

(VLW) were specifically chosen because they were the three largest public real estate

development firms based on market capitalization in Australia. I exclude two larger

companies than SDG and VLW, Peet Limited (PPC) and Aveo Group (AOG). These

two companies are intentionally excluded because their main focus is the development

of retirement communities, and since this study’s focuses on residential real estate, they

were not seen as relevant companies for this analysis. Finally, BLD was added because

it was one of the largest building and construction material businesses in Australia, and

therefore would also be affected by a drop in construction activity.

15  

Only selecting publicly traded firms limits the scope of the study. A 2016 study of

the top 10 construction firms by the value of contracts, the study included many

construction companies that are private and therefore cannot be included in the survey

(Resolute Equipment 2016). The limit on a number of companies that can be included in

this study leads to a restrained sample size. Although not possible, the study would be

greatly enhanced if data on the value of private firms was available.

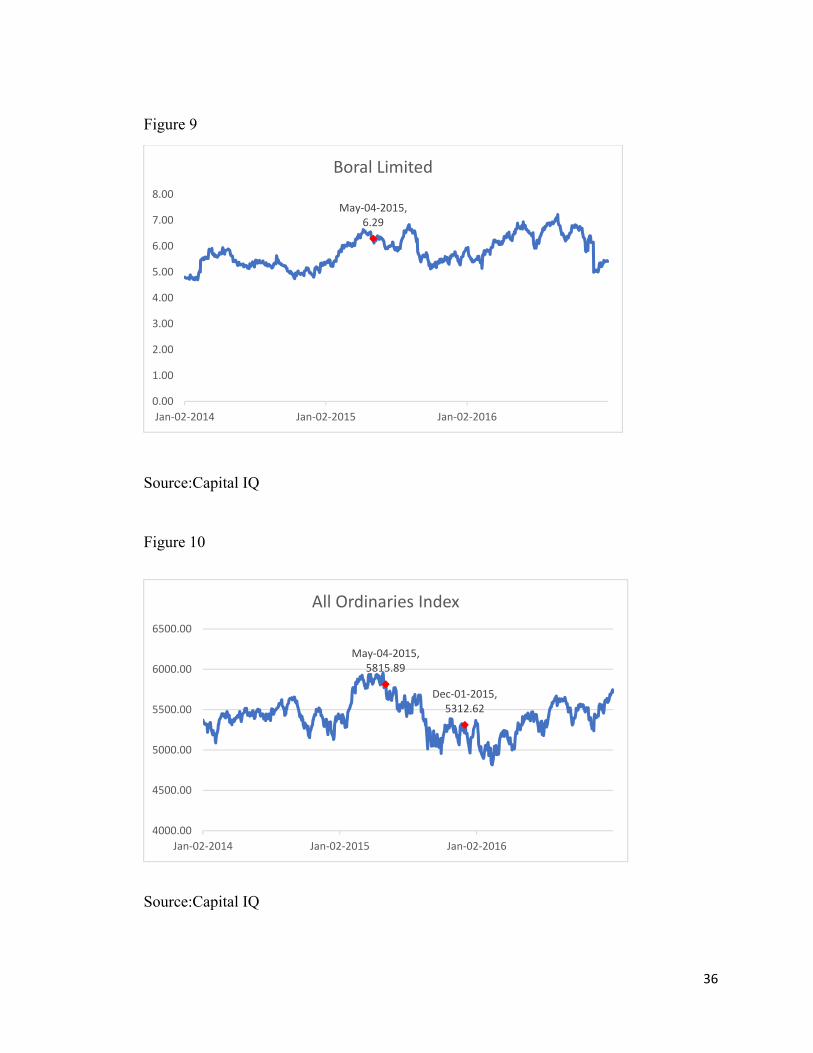
The event date for the indices to be regressed upon is May 4th, 2015. The new rule

changes were announced on May 2nd, 2015 (Vendor Finance 2015). I select May 4th,

because May 2nd was a Saturday, and the first day Australian market could react to the

news would be the next closest trading day.

The regressions for method two are based on May 4th, 2015, for reasons mentioned

above, and December 1st, 2015. December 1st, 2015 is the date in which the FIRB

announced the new regulations were to be enforced (Vendor Finance 2015).

V. Results

Method (A) Testing for Short Term Effect on Returns

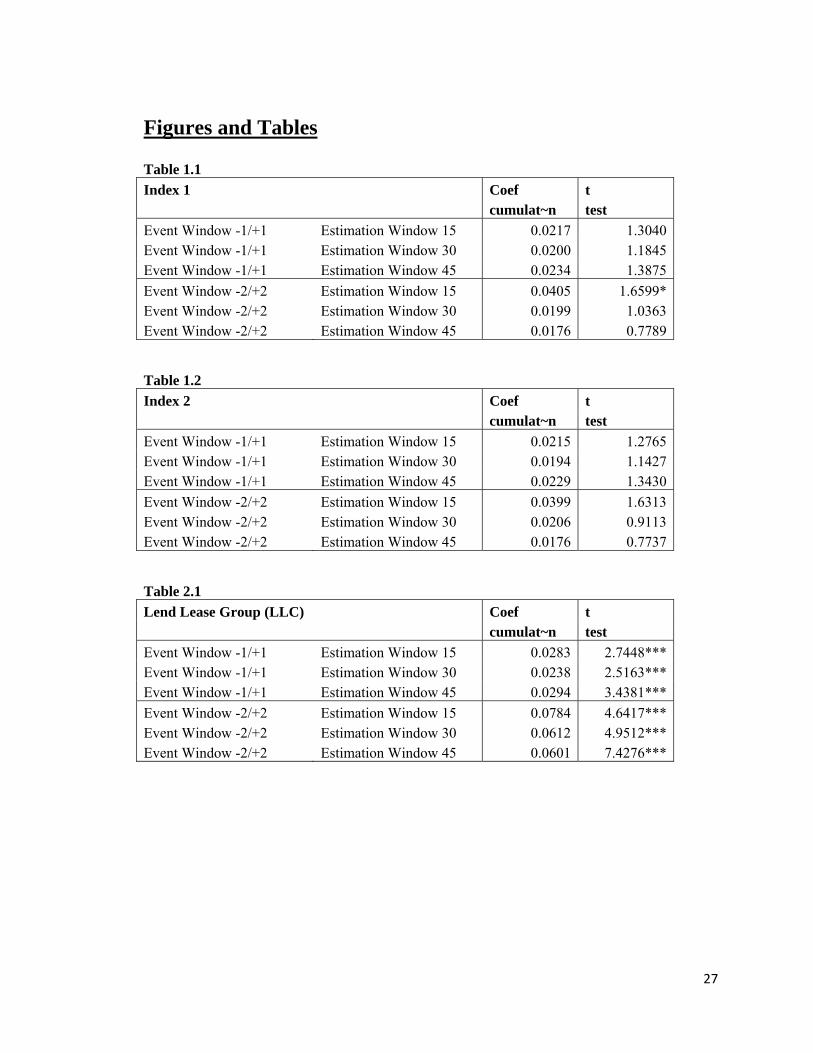
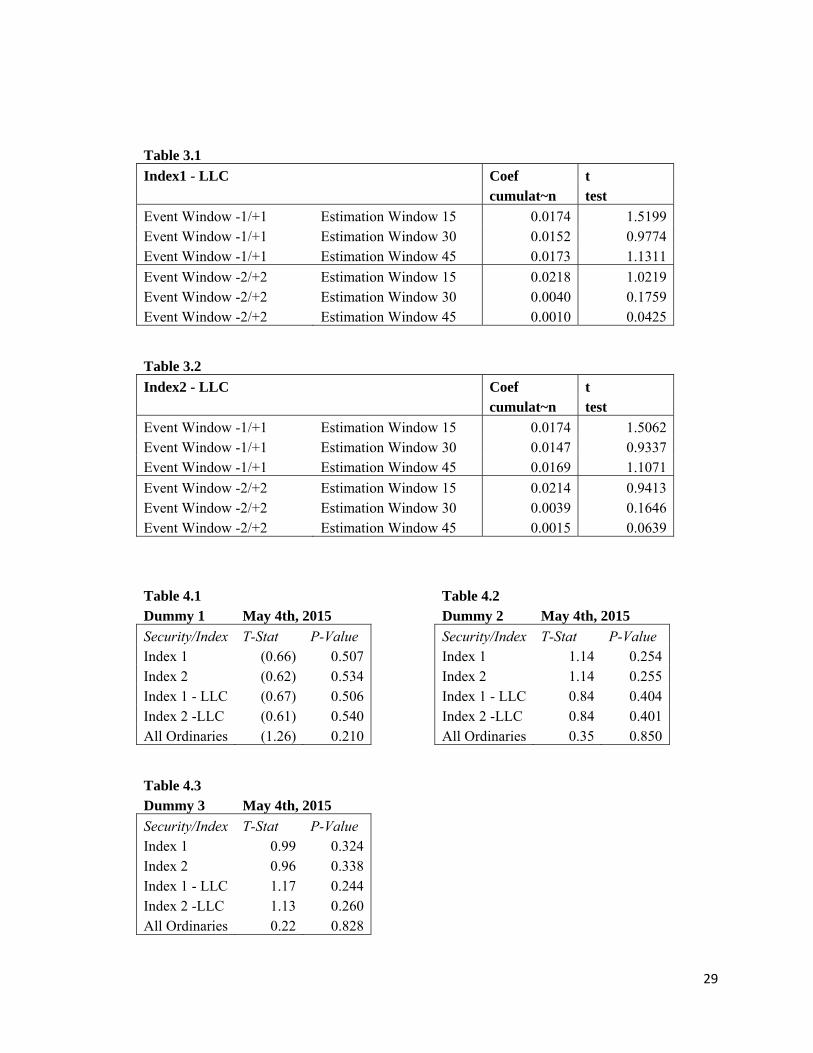
Tables 1.1 through 3.2 display my findings. The left-hand side of each table

displays which iteration of the model is run. An event date set at plus or minus one or two

days with either an event window of 15, 30, or 45 days creates six possible iterations per

index or stock. On the right-hand side are two columns, one of which is cumulat~n,

which stands for the cumulative abnormal return relative to the All Ordinaries Index. If

cumulat~n is positive, that means the index or stock had a positive abnormal return

16  

relative to the All Ordinaries Index, and if the value is negative, the index or stock had a

negative abnormal return. The next column contains the t test. A t-test assesses whether

the means of two groups are statistically different from each other. The statistical

significance was determined at the 90%, 95%, and at the 99% level which corresponds to

absolute statistical values of 1.64, 1.96, and 2.58.

Table 1.1 presents the findings for the six different iterations for my first basket of

stocks, which I refer to as index 1. Of the six, only one iteration produces significant

results at the 90% significance level, the 15-day estimation window set at plus or minus

two days. However, the significance is lost at the 30 and 45 window. The iteration

produces a positive result, which goes against my hypothesis. The positive return means

the market reacted positively to the FIRB rule changes.

Table 1.2 also presents the findings for index 2’s returns. The reaction for index

2’s return to the announcement of the FIRB rule change is assessed. As can be seen in

table 1.2, none of the iterations produced significant effects.

The findings of table 1.1 and 1.2 together suggest little to no correlation between

the change in the FIRB rules and the stock price performance of real estate development

and building material companies in Australia. Although there may have been a positive

effect on raw returns, the connection is weak at best. However, when the analysis was

decomposed into individual stock returns, results varied.

Table 2.1 shows the results for Lend Lease Group. As can be seen in Table 2.1

there are positive results at the 99% significant level for both event windows and at every

estimation window except for plus or minus one day, 30-day window, where it is at the

17  

95% significance level. These results suggest a positive and significant effect of the FIRB

rule changes on the returns of the company. The results of Table 2.1 go against my

hypothesis, as results are positively significant. These results suggest that the investor

sentiment believed that the resulting rule changes would help the corporate profits of the

company.

However, when looking at other individual securities in tables 2.2, 2.3, and 2.4,

results are in line with my hypothesis. There is a negatively significant return at the 99%

significance window for Sunland Group (SGP) when the estimation windows are set at

plus or minus one day. Returns are negatively significant at the 99% significance for

every iteration except for the 45-day estimation window, where it is significant at the

95% significance level. Results for Villa World Limited (VLW) are statistically

significant only when set at plus or minus one day. In the 15-day estimation window, it is

significant at the 99% significance level and was significant at the 95% significance level

in the 30 and 45 day-estimation levels. However, when set at plus or minus one day,

results were insignificant. For Boral Limited (BLD), every iteration is negatively

significant when set at both plus or minus one and two days at the 99% significance level.

These results produce a clear negative boost on stock performance in relation to the All

Ordinaries index.

When looking at Mirvac Group (MRG), iterations are mixed but insignificant.

When looking at the plus or minus one-day event window, all iterations are positive and

insignificant. When the event window is widened to plus or minus two-day event

window, iterations remained insignificant, however, were now negative. As the most

18  

diversified company in my group, the results make sense that returns are insignificant

from the rest of the group.

After running the analysis on different individual public equities, I determine that

it is possible that the Lend Lease Group is simply an outlier. The Lend Lease Group is the

largest construction company by market capitalization. It also secures substantially more

building contracts than any other group in Australia. In 2015 alone, the Lend Lease group

secured A$4.9 billion in construction contracts, nearly double its next closest competitor,

who secured A$2.85 billion (Resolute Equipment 2016). Lend Lease Group’s size comes

with it geographic diversity, and it is projects in America, which may have protected it in

the eyes of investors from potential decreases in spending from Chinese nationals in

Australia (Lend Lease Group 2017). Regardless of the possible reasons for Lend Lease

Group’s positive returns and significance, its size causes it to have a high weight in the

indices, and therefore could be biasing the results upward. As a result, I remove Lend

Lease Group from the two indices and re-ran the event window. As can be seen in Table

3.1 and 3.2, without Lend Lease Group in the study, all results are still positive but results

remained insignificant at every iteration and additionally, the 15-day estimation window

set at plus or minus two days lost its significance.

For each security, returns could be wildly different from the returns of the All

Ordinaries index. However, once brought together as a whole, the returns of the real

estate development and building materials companies became more in line with the

index. The results could be interpreted in several different ways. One possible

explanation is investor sentiment did not change due to the announcement of regulations.

19  

They believed that the regulations would not affect total construction activity because

either foreign direct investment from Chinese nationals was not large enough to affect the

construction activity or the regulations were not robust enough to stem the tide of

investment. Therefore, the vast changes in the different individual securities are a result

of happenstance changes in microeconomic factors unrelated to the FIRB. As a result,

when evaluated as a whole, the returns of the entire sector fall in line with the returns of

the rest of the Australian equities market.

Another reason could be the changes in the FIRB affected individual securities

differently. The individual securities selected are not a representative sample, as shown

by the fact that I did not run a regression with each individual security in my index.

However, the companies that have significant results have different profiles. For instance,

Villa World Limited has a market capitalization around A$220 million, and Sunland

Group Limited has a market capitalization around A$200 million, whereas Lend Lease

Group market capitalization of 6.7 billion (Capital IQ 2017). These differences in market

capitalizations are due to the amount of construction, geographic diversity, and diversity

in different projects. This means the companies have varying abilities to react to changes

in rules to foreign direct investment. Each company’s individual exposure to Chinese

direct investment affects their stock price, and therefore, only companies with high

exposure should have their earnings decrease. If only a trivial amount companies have

high exposure, once indexed, those changes will be dispersed into normal market returns.

20  

Method (B) Testing for Long-Term Effect on Returns

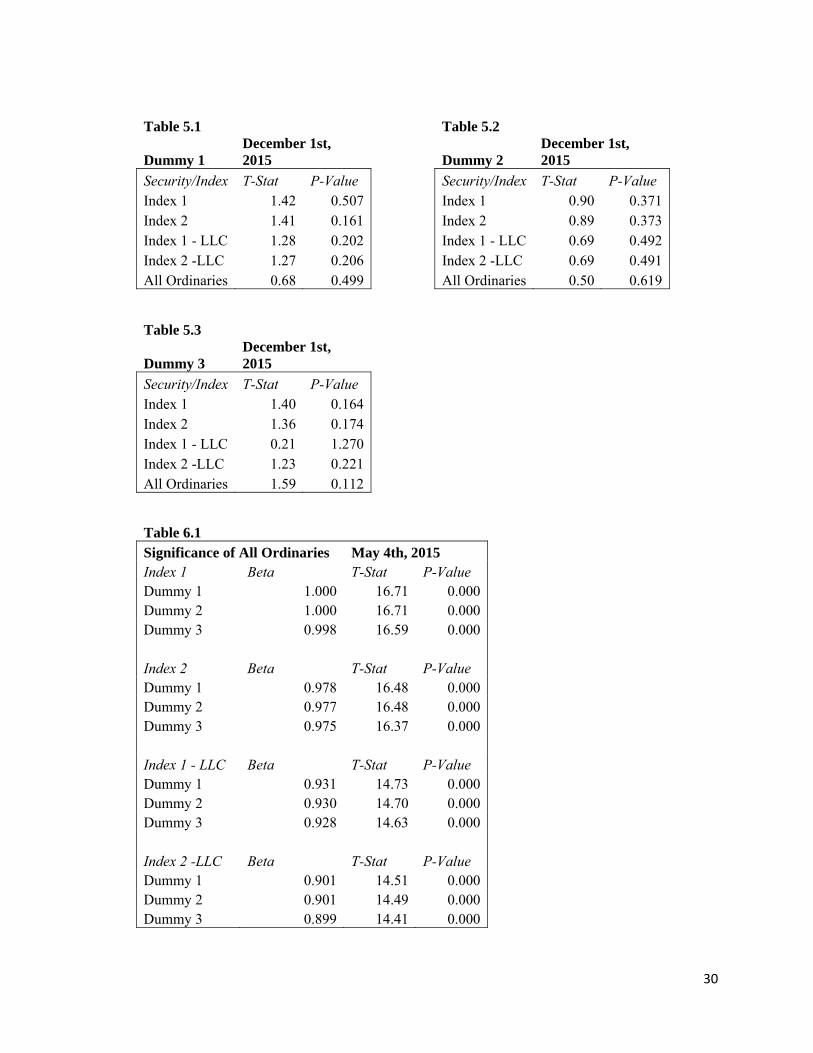
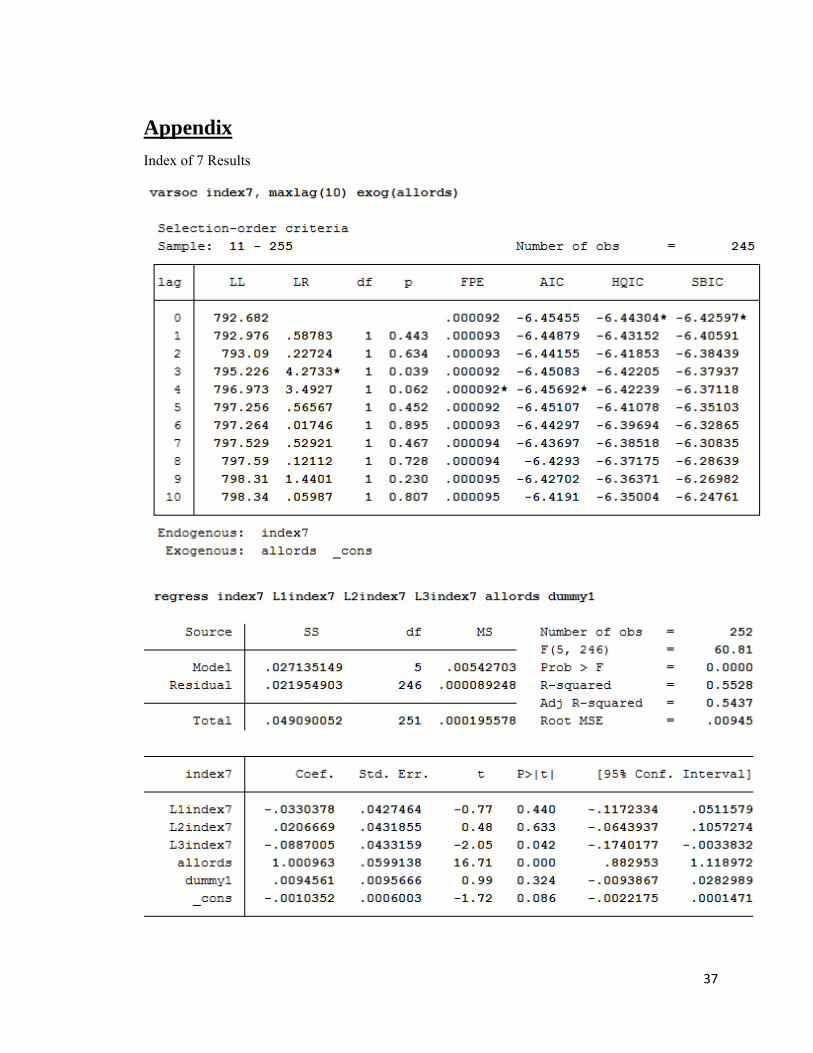
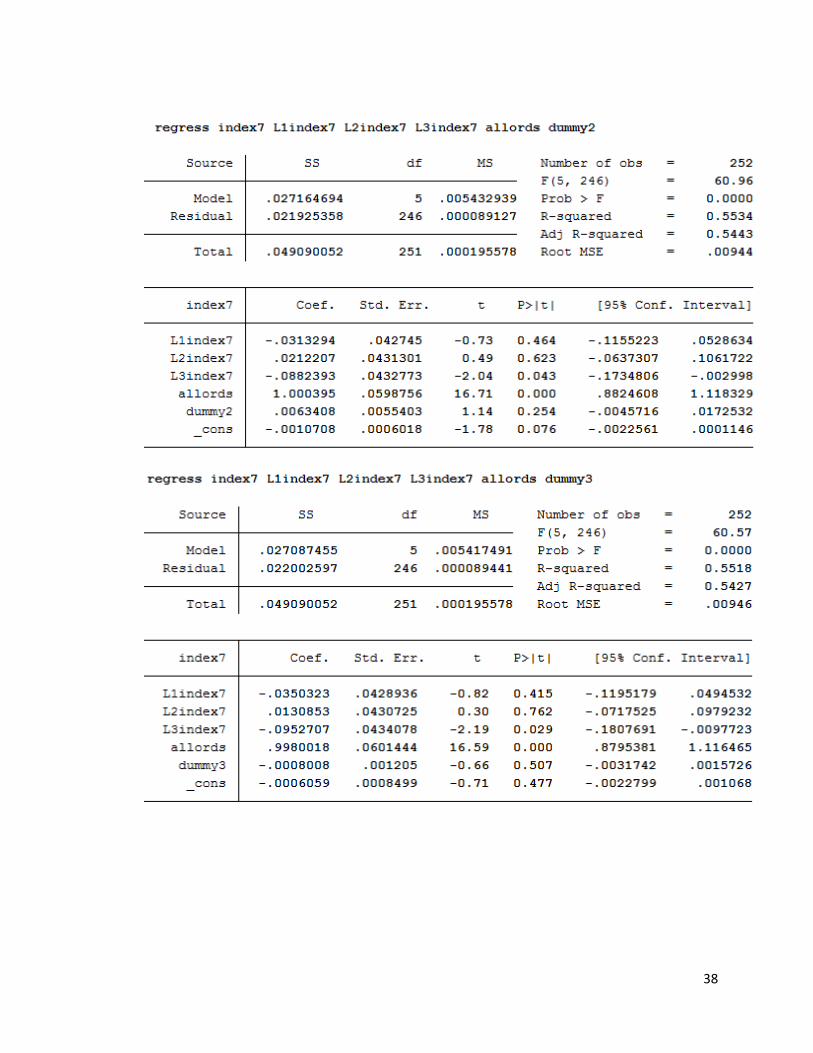
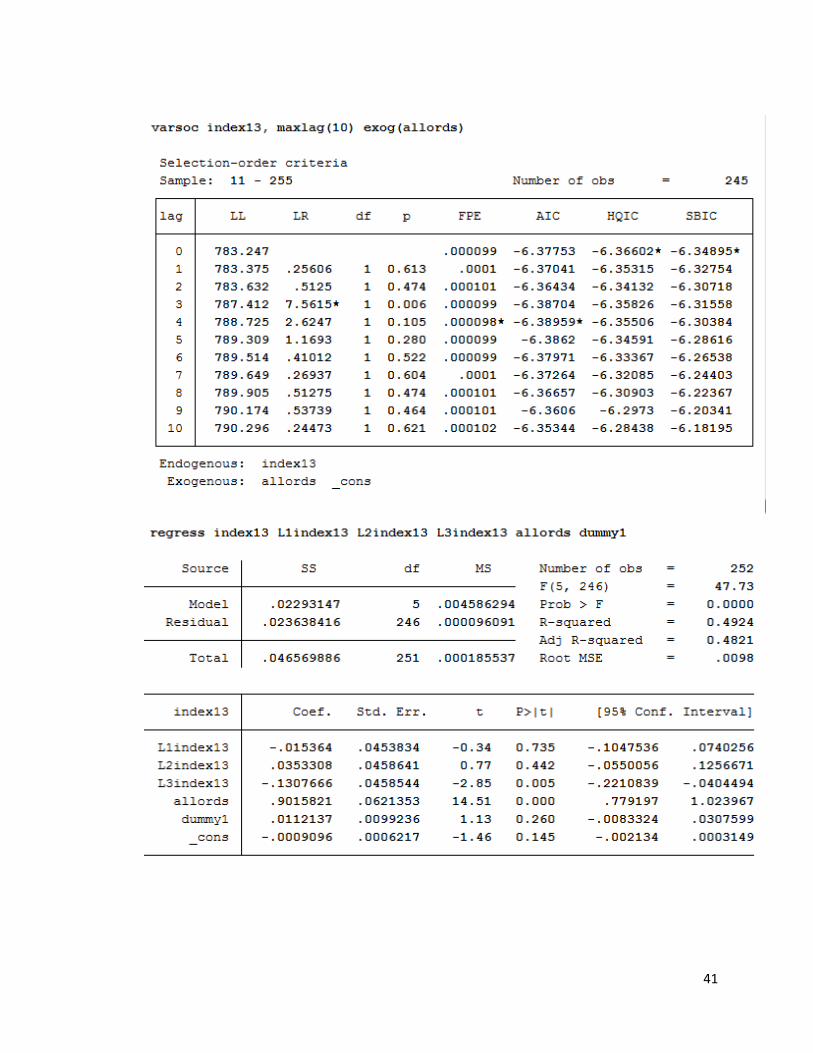
Tables 4.1 through 5.3 display my results for the OLS regression. Each table

displays the results for each index and the All Ordinaries index, the t-statistic, and a p-

value. A t-test assesses whether the means of two groups are statistically different from

each other and p-value evaluates how well the sample data support the argument that the

null hypothesis is true. It measures how compatible my data is with the null hypothesis. A

high p-value means I accept the null and a low p-value means I reject the null. My null

hypothesis is that the FIRB rule changes were immediately priced in and there is no

effect on the market. As one can see in Tables 4.1 through 5.3, after running the OLS

regression on the separate indices to see if the FIRB rule changes had any lasting effect

on the market, I find no significant results for any of the dummies.

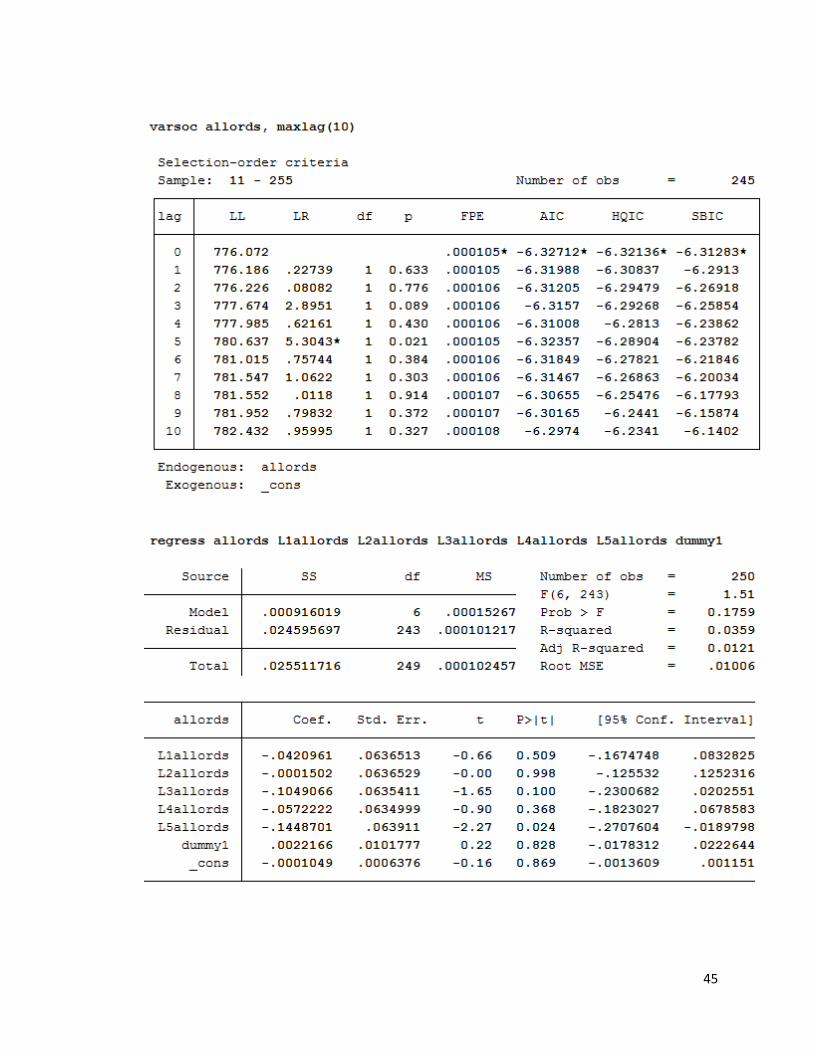
Table 6.1 and 6.2 examine the independent variable of the All Ordinaries Index in

each of the regressions. Each table displays the beta, t-stat, and p-value of the All

Ordinaries index. Beta value is a measure of how strongly each predictor variable

influences the criterion (dependent) variable, one can see the beta for the All Ordinaries

Index was typically very high, around .88 to 0.9, and it is always significant at either the

95% or 99% confidence level in all the regression. With a beta, so close to one and with

99% significance, although the real estate development and building materials equity

returns were down, the entire Australian equity market was also concurrently falling.

When looking at the All Ordinaries section in tables 4.1 through 5.3, the second

regression with all three dummy variables is not significant either. These results say the

Australian equity market did not react to either the announcement or the enforcement of

21  

the new FIRB rules. These results tell us that there is no lasting effect of the FIRB rule

changes on either the real estate development sector or the Australian equity market.

IV. Conclusion

This thesis aims to determine the share price reactions for the real estate

development and building/construction materials sector in Australia based on the rule

changes on foreign direct investment. By comparing the returns of a composite of

companies and individual securities to the returns of the overall Australian equities

market, this study finds that as a group, the Australian real estate development and

building/construction materials sector was not affected by the FIRB rule changes.

However, as individual securities, share price reactions are negative and significant for

many smaller real estate developers and one large building and construction material

company. These results are in line with my hypothesis that companies in that sector

would face negative reactions. One outlier company is Lend Lease Group, which

experienced positive and significant returns in relation to the All Ordinaries market. Lend

Lease Group’s positive returns go against my hypothesis and further research would be

required to identify why their returns are positive. Given more resources, an event study

of all different sectors within real estate, such as REITs would be regressed as well. Also,

event studies with securities placed into different buckets based on size, geographic

presence, diversity, and most importantly exposure to Chinese investment could be made

to see what type of real estate development companies were affected more by the rule

changes.

22  

The OLS regression of the Australian real estate development companies and

construction/building materials companies along with a regression of the All Ordinaries

Index against itself result in no significance. Therefore, there is no lasting effect of the

FIRB rule changes on the Australian equities markets. This suggests the FIRB rule

changes were priced into the Australian securities at the date of the announcement.

Overall, the results offer some support that the FIRB rule changes harmed

possibly smaller less diversified real estate development companies, but the overall

perception for the sector remained unchanged. The FIRB rule changes were not just

isolated to residential real estate and it is possible, because the beta for the All Ordinaries

Index is so high, the entire market was affected by the FIRB rule changes and therefore,

the market depressed as well, making differentiating the returns of the real estate

development sector and the overall equity market indistinguishable.

23  

References

Australia. Australian Trade Commission. TRADE AND INVESTMENT NOTE: HOW DEPENDENT ARE AUSTRALIAN EXPORTS ON CHINA? February 2015. http://www.austrade.gov.au/ArticleDocuments/5720/TINHow-dependent-are-Australian-exports-to-China.pdf.aspx.

Australia, Tourism. "Australia Welcomes Record One Million Visitors from China."

Markets - Tourism Australia. Accessed April 23, 2017. http://www.tourism.australia.com/news/market-regions-greater-china-17742.aspx.

Brown, Stephen J., and Jerold B. Warner. "Using Daily Stock Returns." Journal of

Financial Economics 14, no. 1 (1985): 3-31. doi:10.1016/0304-405x(85)90042-x. Burdekin, Richard C.K., and Ran Tao. "Chinese Influences on the Australian

Macroeconomy." December 2016. Cadman, Emily, and Kimberley Painter. "Runaway Australian Property Market Shows

First Signs of Cooling." Bloomberg.com. December 20, 2016. Accessed April 23, 2017. https://www.bloomberg.com/news/articles/2016-12-20/runaway-australian-property-market-shows-first-signs-of-cooling.

Day, Creina. "China's Fiscal Stimulus and the Recession Australia Never Had: Is a

Growth Slowdown Now Inevitable?" Agenda: A Journal of Policy Analysis and Reform 18, no. 1 (April 17, 2011).

"Efficient Market Hypothesis." Efficient Market Hypothesis. Accessed April 23, 2017.

http://www.morningstar.com/InvGlossary/efficient_market_hypothesis_definition_what_is.aspx.

Equipment, Resolute. "Top 10 Biggest Construction Companies in Australia." Resolute-

equipment.com. Accessed April 23, 2017. http://www.resolute-equipment.com/96-top-10-biggest-construction-companies-in-australiasthash-bhxuclpn-dpuf/.

"Foreign Investment Policy in Australia — A Brief History and Recent Developments,."

Australia Department of the Treasury. "Foreign Investment Reforms Factsheet: Residential Real Estate." Australian

Government. Accessed April 23, 2017. doi:10.15396/eres2000_095. "Foreign Investment Review Board." Commonwealth of Australia - Coat of Arms.

Accessed April 23, 2017. http://firb.gov.au/.

24  

"Foreign Investment Review Board." Commonwealth of Australia - Coat of Arms. Accessed April 23, 2017. http://firb.gov.au/about/.

"FREE TRADE AGREEMENT BETWEEN THE GOVERNMENT OF AUSTRALIA

AND THE GOVERNMENT OF THE PEOPLE’S REPUBLIC OF CHINA." Government of Australia People’s Republic of China, 20 December 2015

Gauder, Maurice, Claire Houssard, and David Orsmond. "Foreign Investment in

Residential Real Estate." Reserve Bank of Australia, June 2014. Hartwhich, Oliver. "3th Annual Demographia International Demographia International

Housing Affordability Survey: 2017 Rating Middle-Income Housing Affordability." The New The New Zealand Initiative, 2016.

Heaton, Andrew. "Home Builders Cash in on Housing Construction Boom." Sourceable.

September 25, 2015. Accessed April 23, 2017. https://sourceable.net/australias-top-residential-builders/.

"Http://www.mccullough.com.au/icms_docs/216508_FIRB_changes_announced.pdf."

McCullough Robertson, May 4, 2015. Accessed April 23, 2017. http://www.mccullough.com.au/icms_docs/216508_FIRB_changes_announced.pdf.

International Student Data 2016. Accessed April 23, 2017.

https://internationaleducation.gov.au/research/International-Student-Data/Pages/InternationalStudentData2016.aspx#Pivot_Table.

Kim, MJ. "Money Craving in China and Korea: Football Club Performance and the Share

Prices of Owning Corporations." CMC Senior Theses, 2015. http://scholarship.claremont.edu/cmc_theses/1044.

Kulish, Mariano, Anthony Richards, and Christian Gillitzer. "Urban Structure and

Housing Prices: Some Evidence from Australian Cities*." Economic Record 88, no. 282 (2012): 303-22. doi:10.1111/j.1475-4932.2012.00829.x.

Lui, Kevin. "Are Housing Prices in Australia Finally Starting to Cool?" Fortune.com.

December 21, 2016. Accessed April 23, 2017. http://fortune.com/2016/12/20/australia-housing-prices-property-market-cooling/.

"NAB RESIDENTIAL PROPERTY SURVEY Q4-2016." NAB Behavioural & Industry

Economics, January 24, 2017. Accessed April 23, 2017. http://business.nab.com.au/wp-content/uploads/2017/01/nab-residential-property-survey-Q42016.pdf.

"PROJECTS." GLO. Accessed April 23, 2017. http://www.lendlease.com/us/projects/.

25  

"Residential Property & Foreign Investment Changes." Vendor Finance Association of

Australia. May 06, 2015. Accessed April 23, 2017. http://vendorfinance.asn.au/firb-property/.

"Residential Property Price Indexes: Eight Capital Cities." Australian Bureau of

Statistics. December 2016. Accessed April 24, 2017. http://www.abs.gov.au/ausstats/[email protected]/mf/6416.0.

Richards, Anthony, Dr. "Some Observations on the Cost of Housing in Australia."

Reading, Outlook Conference, The Melbourne Institute, Melbourne, Australia, March 27, 2008.

Rogers, Dallas, Chyi Lin Lee, and Ding Yan. "The Politics of Foreign Investment in

Australian Housing: Chinese Investors, Translocal Sales Agents and Local Resistance." Housing Studies 30, no. 5 (2015): 730-48. doi:10.1080/02673037.2015.1006185.

Rogers Lecturer in Urban Studies, Western Sydney University, Dallas. "Australia's

Housing Affordability Problem Explained in Five Historical Steps." The Conversation. April 23, 2017. Accessed April 23, 2017. https://theconversation.com/australias-housing-affordability-problem-explained-in-five-historical-steps-64794.

Shane, Daniel. "Aussie Property: Be Wary of These 5 Stocks." Barron's. February 27,

2017. Accessed April 23, 2017. http://www.barrons.com/articles/aussie-property-be-wary-of-these-5-stocks-1488250198.

"S&P Dow Jones Indices." All Ordinaries (AUD) - S&P Dow Jones Indices. Accessed

April 23, 2017. https://us.spindices.com/indices/equity/all-ordinaries. Stapledon, Nigel. "The Inexorable Rise in House Prices in Australia since 1970: Unique

or Not?" Australian Economic Review 49, no. 3 (2016): 317-27. doi:10.1111/1467-8462.12176.

Wong, Alexandra. "Transnational Real Estate in Australia: New Chinese Diaspora,

Media Representation and Urban Transformation in Sydney's Chinatown." International Journal of Housing Policy 17, no. 1 (2016): 97-119. doi:10.1080/14616718.2016.1210938.

Wong, Alexandra. "Transnational Real Estate in Australia: New Chinese Diaspora,

Media Representation and Urban Transformation in Sydney's Chinatown." International Journal of Housing Policy 17, no. 1 (2016): 97-119. doi:10.1080/14616718.2016.1210938.

26  

Yates, Judith. "Why Does Australia Have an Affordable Housing Problem and What Can Be Done About It?" Australian Economic Review 49, no. 3 (2016): 328-39. doi:10.1111/1467-8462.12174.

27  

Figures and Tables Table 1.1

Index 1 Coef t cumulat~n test

Event Window -1/+1 Estimation Window 15 0.0217 1.3040 Event Window -1/+1 Estimation Window 30 0.0200 1.1845 Event Window -1/+1 Estimation Window 45 0.0234 1.3875

Event Window -2/+2 Estimation Window 15 0.0405 1.6599*Event Window -2/+2 Estimation Window 30 0.0199 1.0363 Event Window -2/+2 Estimation Window 45 0.0176 0.7789

Table 1.2

Index 2 Coef t cumulat~n test

Event Window -1/+1 Estimation Window 15 0.0215 1.2765 Event Window -1/+1 Estimation Window 30 0.0194 1.1427 Event Window -1/+1 Estimation Window 45 0.0229 1.3430

Event Window -2/+2 Estimation Window 15 0.0399 1.6313 Event Window -2/+2 Estimation Window 30 0.0206 0.9113 Event Window -2/+2 Estimation Window 45 0.0176 0.7737

Table 2.1

Lend Lease Group (LLC) Coef t cumulat~n test

Event Window -1/+1 Estimation Window 15 0.0283 2.7448***Event Window -1/+1 Estimation Window 30 0.0238 2.5163***Event Window -1/+1 Estimation Window 45 0.0294 3.4381***

Event Window -2/+2 Estimation Window 15 0.0784 4.6417***Event Window -2/+2 Estimation Window 30 0.0612 4.9512***Event Window -2/+2 Estimation Window 45 0.0601 7.4276***

28  

Table 2.2

Sunland Group (SDG) Coef t cumulat~n test

Event Window -1/+1 Estimation Window 15 (0.0518) (12.2241)***Event Window -1/+1 Estimation Window 30 (0.0232) (28.3599)***Event Window -1/+1 Estimation Window 45 (0.0156) (8.0618)***

Event Window -2/+2 Estimation Window 15 (0.0514) (2.9004)***Event Window -2/+2 Estimation Window 30 (0.0487) (2.7921)***Event Window -2/+2 Estimation Window 45 (0.0467) (2.15)**

Table 2.3 Villa World Limited (VLW) Coef t cumulat~n test

Event Window -1/+1 Estimation Window 15 (0.0535) (2.902)***Event Window -1/+1 Estimation Window 30 (0.0473) (2.3706)**Event Window -1/+1 Estimation Window 45 (0.0477) (2.4185)**

Event Window -2/+2 Estimation Window 15 (0.0322) (0.9611)Event Window -2/+2 Estimation Window 30 (0.0193) (0.5462)Event Window -2/+2 Estimation Window 45 (0.0201) (0.5732)

Table 2.4

Boral Limited (BLD) Coef t cumulat~n test

Event Window -1/+1 Estimation Window 15 (0.0640) (7.6649)***Event Window -1/+1 Estimation Window 30 (0.0471) (4.3927)***Event Window -1/+1 Estimation Window 45 (0.0407) (4.9589)***

Event Window -2/+2 Estimation Window 15 (0.0823) (6.2272)***Event Window -2/+2 Estimation Window 30 (0.0684) (7.3946)***Event Window -2/+2 Estimation Window 45 (0.0436) (3.1379)***

Table 2.5

Mirvac Group (MGR) Coef t cumulat~n test

Event Window -1/+1 Estimation Window 15 0.0056 0.5912 Event Window -1/+1 Estimation Window 30 0.0058 0.7331 Event Window -1/+1 Estimation Window 45 0.0013 0.1784

Event Window -2/+2 Estimation Window 15 (0.0091) (1.2002)Event Window -2/+2 Estimation Window 30 (0.0049) (0.5505)Event Window -2/+2 Estimation Window 45 (0.0091) (1.2002)

29  

Table 3.1

Index1 - LLC Coef t cumulat~n test

Event Window -1/+1 Estimation Window 15 0.0174 1.5199 Event Window -1/+1 Estimation Window 30 0.0152 0.9774 Event Window -1/+1 Estimation Window 45 0.0173 1.1311

Event Window -2/+2 Estimation Window 15 0.0218 1.0219 Event Window -2/+2 Estimation Window 30 0.0040 0.1759 Event Window -2/+2 Estimation Window 45 0.0010 0.0425

Table 3.2

Index2 - LLC Coef t cumulat~n test

Event Window -1/+1 Estimation Window 15 0.0174 1.5062 Event Window -1/+1 Estimation Window 30 0.0147 0.9337 Event Window -1/+1 Estimation Window 45 0.0169 1.1071

Event Window -2/+2 Estimation Window 15 0.0214 0.9413 Event Window -2/+2 Estimation Window 30 0.0039 0.1646 Event Window -2/+2 Estimation Window 45 0.0015 0.0639

Table 4.1 Table 4.2 Dummy 1 May 4th, 2015 Dummy 2 May 4th, 2015

Security/Index T-Stat P-Value Security/Index T-Stat P-Value Index 1 (0.66) 0.507 Index 1 1.14 0.254 Index 2 (0.62) 0.534 Index 2 1.14 0.255 Index 1 - LLC (0.67) 0.506 Index 1 - LLC 0.84 0.404 Index 2 -LLC (0.61) 0.540 Index 2 -LLC 0.84 0.401 All Ordinaries (1.26) 0.210 All Ordinaries 0.35 0.850

Table 4.3 Dummy 3 May 4th, 2015

Security/Index T-Stat P-Value Index 1 0.99 0.324 Index 2 0.96 0.338 Index 1 - LLC 1.17 0.244 Index 2 -LLC 1.13 0.260 All Ordinaries 0.22 0.828

30  

Table 5.1 Table 5.2

Dummy 1 December 1st, 2015 Dummy 2

December 1st, 2015

Security/Index T-Stat P-Value Security/Index T-Stat P-Value Index 1 1.42 0.507 Index 1 0.90 0.371 Index 2 1.41 0.161 Index 2 0.89 0.373 Index 1 - LLC 1.28 0.202 Index 1 - LLC 0.69 0.492 Index 2 -LLC 1.27 0.206 Index 2 -LLC 0.69 0.491 All Ordinaries 0.68 0.499 All Ordinaries 0.50 0.619

Table 5.3

Dummy 3 December 1st, 2015

Security/Index T-Stat P-Value Index 1 1.40 0.164 Index 2 1.36 0.174 Index 1 - LLC 0.21 1.270 Index 2 -LLC 1.23 0.221 All Ordinaries 1.59 0.112

Table 6.1 Significance of All Ordinaries May 4th, 2015 Index 1 Beta T-Stat P-Value Dummy 1 1.000 16.71 0.000 Dummy 2 1.000 16.71 0.000 Dummy 3 0.998 16.59 0.000 Index 2 Beta T-Stat P-Value Dummy 1 0.978 16.48 0.000 Dummy 2 0.977 16.48 0.000 Dummy 3 0.975 16.37 0.000 Index 1 - LLC Beta T-Stat P-Value Dummy 1 0.931 14.73 0.000 Dummy 2 0.930 14.70 0.000 Dummy 3 0.928 14.63 0.000 Index 2 -LLC Beta T-Stat P-Value Dummy 1 0.901 14.51 0.000 Dummy 2 0.901 14.49 0.000 Dummy 3 0.899 14.41 0.000

31  

Table 6.2 Significance of All Ordinaries December 1st, 2015 Index 1 Beta T-Stat P-Value Dummy 1 0.979 16.58 0.000 Dummy 2 0.986 16.74 0.000 Dummy 3 0.986 16.77 0.000 Index 2 Beta T-Stat P-Value Dummy 1 0.962 16.47 0.000 Dummy 2 0.970 16.64 0.000 Dummy 3 0.968 16.67 0.000 Index 1 - LLC Beta T-Stat P-Value Dummy 1 0.902 15.07 0.000 Dummy 2 0.908 15.23 0.000 Dummy 3 0.907 15.25 0.000 Index 2 -LLC Beta T-Stat P-Value Dummy 1 0.882 15.00 0.000 Dummy 2 0.888 15.15 0.000 Dummy 3 0.887 15.17 0.000

32  

Figure 1

Source:Capital IQ

Figure 2

Source:Capital IQ

May‐04‐2015, 135.90

Dec‐01‐2015, 111.54

80.00

90.00

100.00

110.00

120.00

130.00

140.00

150.00

Jan‐02‐2014 Jan‐02‐2015 Jan‐02‐2016

Index 1

May‐04‐2015, 134.95

Dec‐01‐2015, 110.60

80.00

90.00

100.00

110.00

120.00

130.00

140.00

150.00

Jan‐02‐2014 Jan‐02‐2015 Jan‐02‐2016

Index 2

33  

Figure 3

Source:Capital IQ

Figure 4

Source:Capital IQ

May‐04‐2015, 124.38

Dec‐01‐2015, 105.64

80.00

90.00

100.00

110.00

120.00

130.00

140.00

Jan‐02‐2014 Jan‐02‐2015 Jan‐02‐2016

Index 1 ‐ LLC

May‐04‐2015, 123.71

Dec‐02‐2015, 103.70

80.00

90.00

100.00

110.00

120.00

130.00

140.00

Jan‐02‐2014 Jan‐02‐2015 Jan‐02‐2016

Index 2 ‐ LLC

34  

Figure 5

Source:Capital IQ

Figure 6

Source:Capital IQ

May‐04‐2015, 1.89

0.00

0.50

1.00

1.50

2.00

2.50

Jan‐02‐2014 Jan‐02‐2015 Jan‐02‐2016

Sunland Group

May‐04‐2015, 16.33

0.00

2.00

4.00

6.00

8.00

10.00

12.00

14.00

16.00

18.00

20.00

Jan‐02‐2014 Jan‐02‐2015 Jan‐02‐2016

Lend Lease Group

35  

Figure 7

Source:Capital IQ

Figure 8

Source:Capital IQ

May‐04‐2015, 2.21

0.00

0.50

1.00

1.50

2.00

2.50

3.00

Jan‐02‐2014 Jan‐02‐2015 Jan‐02‐2016

Villa World Limited

May‐04‐2015, 2.04

0.00

0.50

1.00

1.50

2.00

2.50

Jan‐02‐2014 Jan‐02‐2015 Jan‐02‐2016

Mirvac Group

36  

Figure 9

Source:Capital IQ

Figure 10

Source:Capital IQ

May‐04‐2015, 6.29

0.00

1.00

2.00

3.00

4.00

5.00

6.00

7.00

8.00

Jan‐02‐2014 Jan‐02‐2015 Jan‐02‐2016

Boral Limited

May‐04‐2015, 5815.89

Dec‐01‐2015, 5312.62

4000.00

4500.00

5000.00

5500.00

6000.00

6500.00

Jan‐02‐2014 Jan‐02‐2015 Jan‐02‐2016

All Ordinaries Index

37  

Appendix

Index of 7 Results

38  

39  

40  

Index of 7 – LLC

41  

42  

Index of 7 – LLC

43  

44  

All Ordinaries Index

45  

46  


Recommended