42
Australia’s changing energy & environmental policy context, and it’s implications for the Built Environment FBE Course ‘Energy and the Built Environment’ Iain MacGill
Australia’s changing energy & environmental policy context, and it’s implications for the Built EnvironmentFBE Course ‘Energy and the Built Environment’
Iain MacGill
2
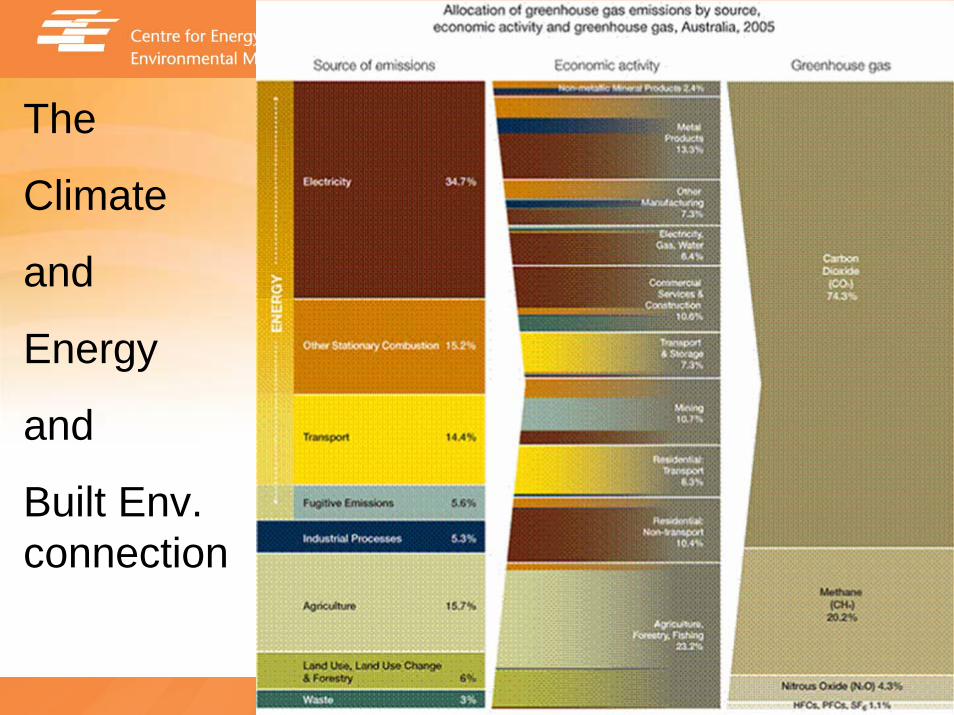
The
Climate
and
Energy
and
Built Env. connection
3
CEEM established …– to formalise growing interest + interactions between UNSW
researchers in Engineering, Business, Social Sciences, Environmental Sciences…
– through UNSW Centre providing Australian research leadership in interdisciplinary design, analysis + performance monitoring of energy + environmental markets, associated policy frameworks
– in the areas ofEnergy markets
– spot, ancillary services and derivative markets, retail markets– Primary focus on the Australian NEM
Energy related environmental markets– Eg. National Emissions Trading, MRET, Energy Efficiency Certificate
Trading, Renewable energy subsidies…Broader policy frameworks and instruments to achieve desired societal energy and environmental outcomes: eg. EE policies
4
CEEM Research program areasEnvironmental market design– emissions trading and its interactions with energy markets
Distributed Energy– Load management, energy efficiency and distributed generation
opportunities, the challenges of behavioural changeRenewable energy– Facilitating the integration of renewable energy into the National
Electricity MarketElectricity industry restructuring – with a focus on retail market design
Technology Assessments for our sustainable energy options– EE, Renewables, Carbon Capture and Storage, Nuclear
Market governance– the strengths and weaknesses of market mechanisms; oversight,
regulation
5
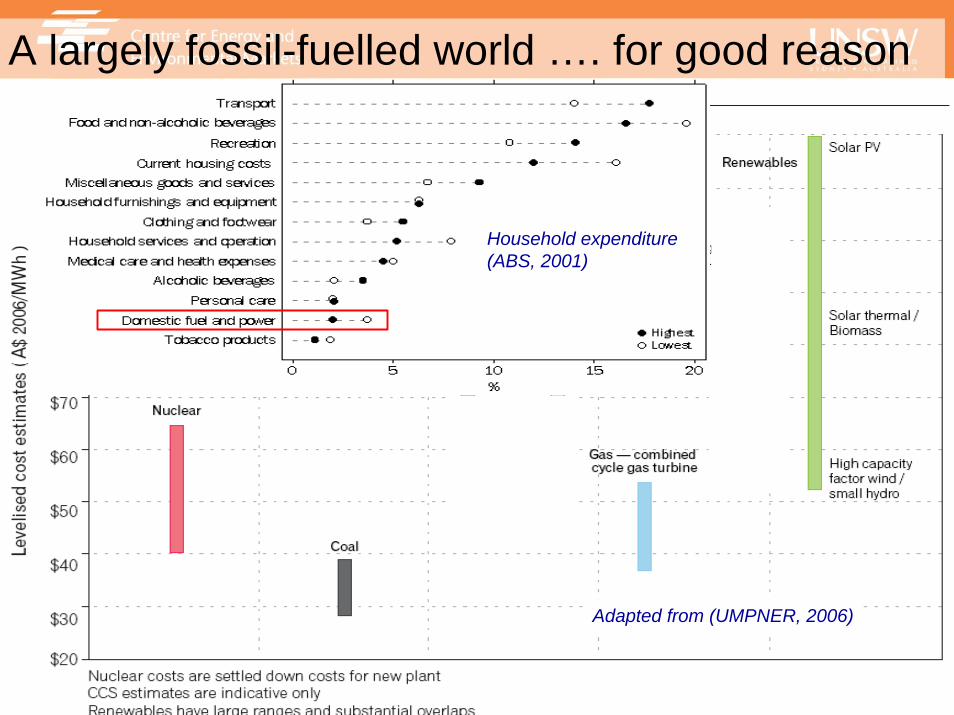
A largely fossil-fuelled world …. for good reason
Adapted from (UMPNER, 2006)
Household expenditure (ABS, 2001)
6
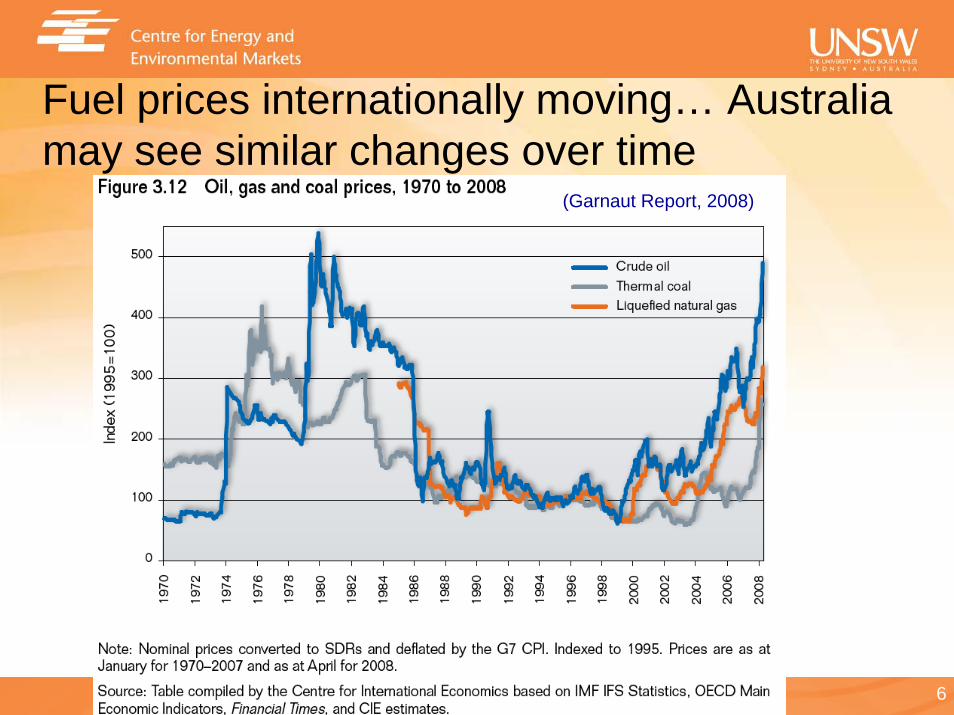
Fuel prices internationally moving… Australia may see similar changes over time
(Garnaut Report, 2008)
7
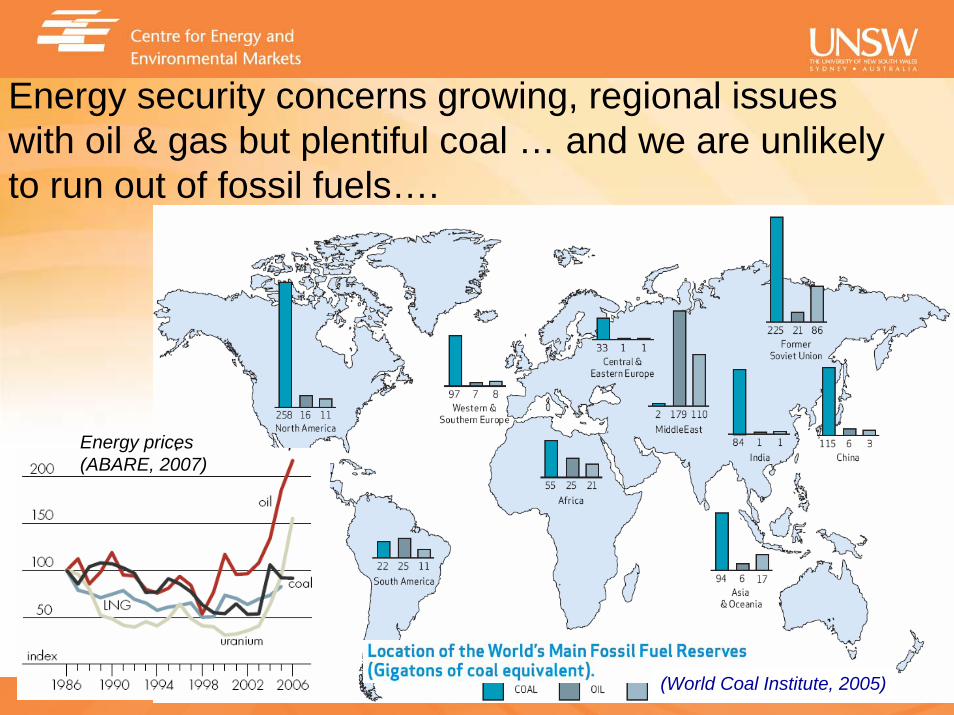
Energy security concerns growing, regional issues with oil & gas but plentiful coal … and we are unlikely to run out of fossil fuels….
(World Coal Institute, 2005)
Energy prices (ABARE, 2007)

8
….before global warming concerns dominate. The challenge – stabilisation…
(FAR WGIII, 2007)
Current levels
Note we can’t afford to burn
avail. oil & gas, let alone coal
9
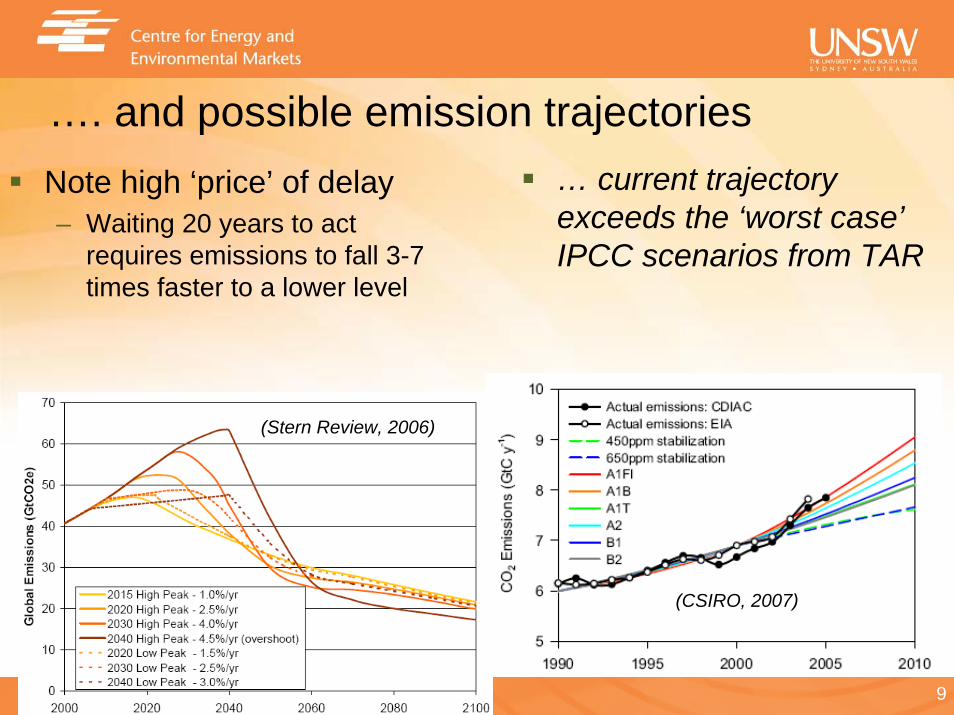
…. and possible emission trajectoriesNote high ‘price’ of delay– Waiting 20 years to act
requires emissions to fall 3-7 times faster to a lower level
… current trajectory exceeds the ‘worst case’IPCC scenarios from TAR
(Stern Review, 2006)
(CSIRO, 2007)
10
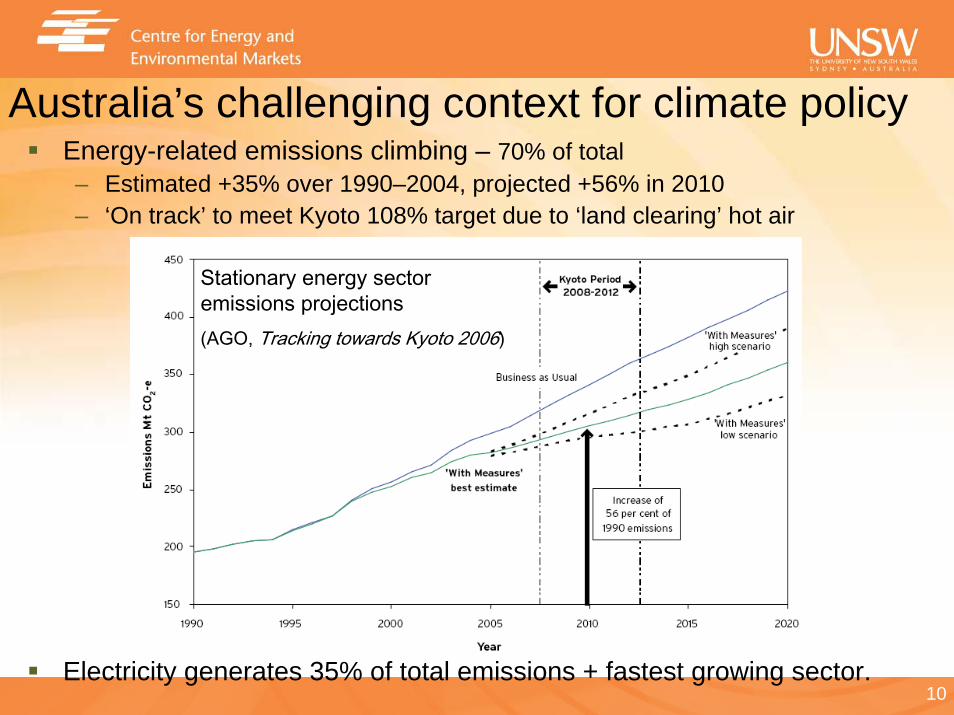
Australia’s challenging context for climate policyEnergy-related emissions climbing – 70% of total– Estimated +35% over 1990–2004, projected +56% in 2010– ‘On track’ to meet Kyoto 108% target due to ‘land clearing’ hot air
Electricity generates 35% of total emissions + fastest growing sector.
Stationary energy sector emissions projections(AGO, Tracking towards Kyoto 2006)
11
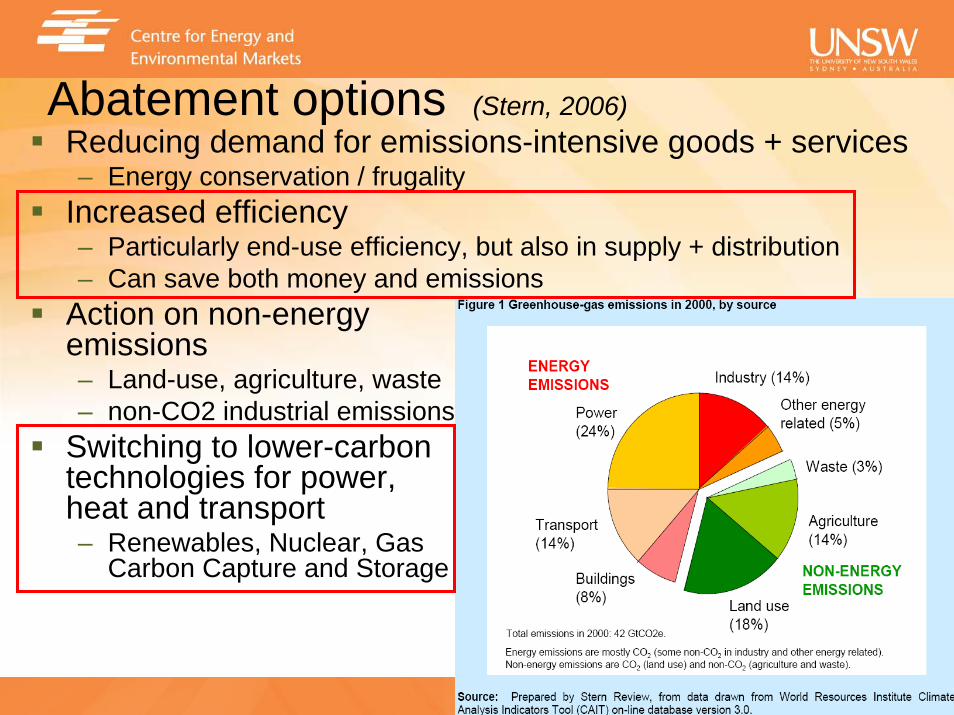
Abatement options (Stern, 2006)Reducing demand for emissions-intensive goods + services– Energy conservation / frugality
Increased efficiency– Particularly end-use efficiency, but also in supply + distribution– Can save both money and emissions
Action on non-energy emissions– Land-use, agriculture, waste– non-CO2 industrial emissions
Switching to lower-carbon technologies for power, heat and transport– Renewables, Nuclear, Gas
Carbon Capture and Storage
12
Key drivers in assessing our energy optionsTheir ability to contribute to large, rapid and sustained globalemission reductions while maintaining energy security– Technical status
unproven => mature; niche => widespread– Delivered benefits
GHG emission reductions, flexibility, dispatchability– Present costs where known – + possible future costs– Potential scale of deployment
possible physical, technical + cost constraints– Potential speed of deployment
time and effort required to achieve scale– Other possible societal outcomes
eg. other environmental impacts, energy security implications
13
Key perspectives wrt these driversScientific– eg. impact of physical resource limits on potential scales of deployment
Engineering and Design– wrt our ability to develop socio-technical systems; eg. engineering
limitations to speed particular technology industries can grow, our abilities to integrate our options into sustainable solutions
Economic – in the ‘social welfare’ sense; eg. direct & externality costs of options
Commercial– role of commercial market ‘settings’ in driving individual decision
making in areas like technology innovationSocietal – including social expectations and governance required to deliver these
including policy, mechanisms, measures and regulation: eg. social acceptability of nuclear power

14
Technology – the “art of knowing and doing”‘Orgware’ has most vital role– The framework in which key markets (energy + ETS) operate– Appropriate frameworks require high levels of coordination– Markets will often fail to create appropriate framework themselves
often actively work against such frameworks as a (temporary) source of competitive advantage – eg. Credit Crisis
(taken from www.iiasa.net)
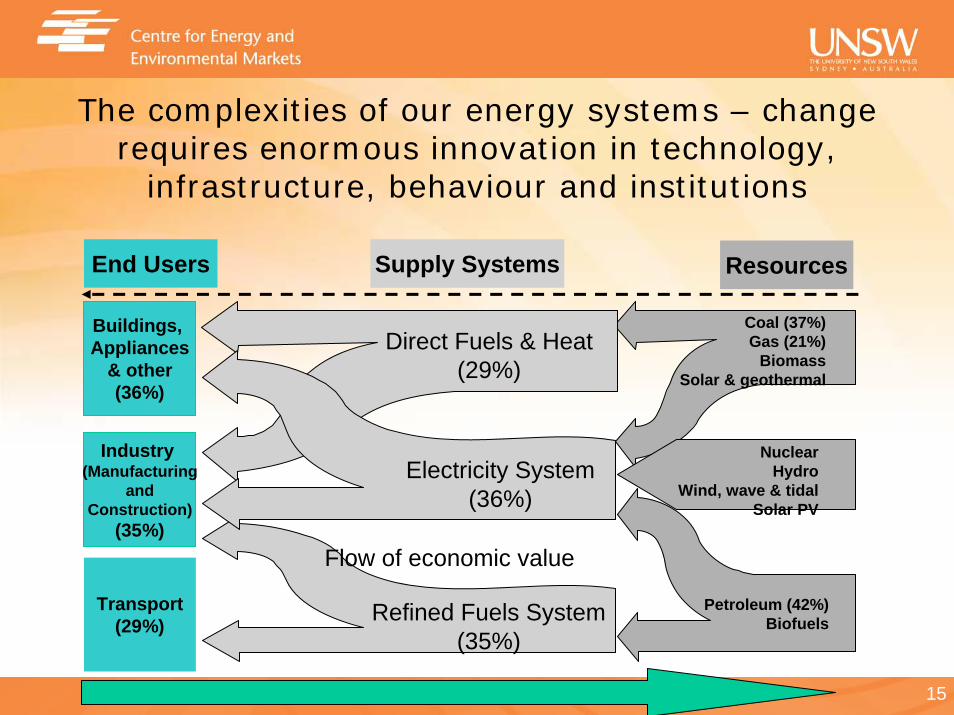
15
Transport(29%)
Buildings, Appliances
& other(36%)
Industry (Manufacturing
andConstruction)
(35%)
End Users Supply Systems Resources
Coal (37%)Gas (21%)
BiomassSolar & geothermal
Petroleum (42%)Biofuels
NuclearHydro
Wind, wave & tidalSolar PV
Direct Fuels & Heat(29%)
Refined Fuels System(35%)
Electricity System(36%)
Flow of economic value
The complexities of our energy systems – change requires enormous innovation in technology,
infrastructure, behaviour and institutions
16
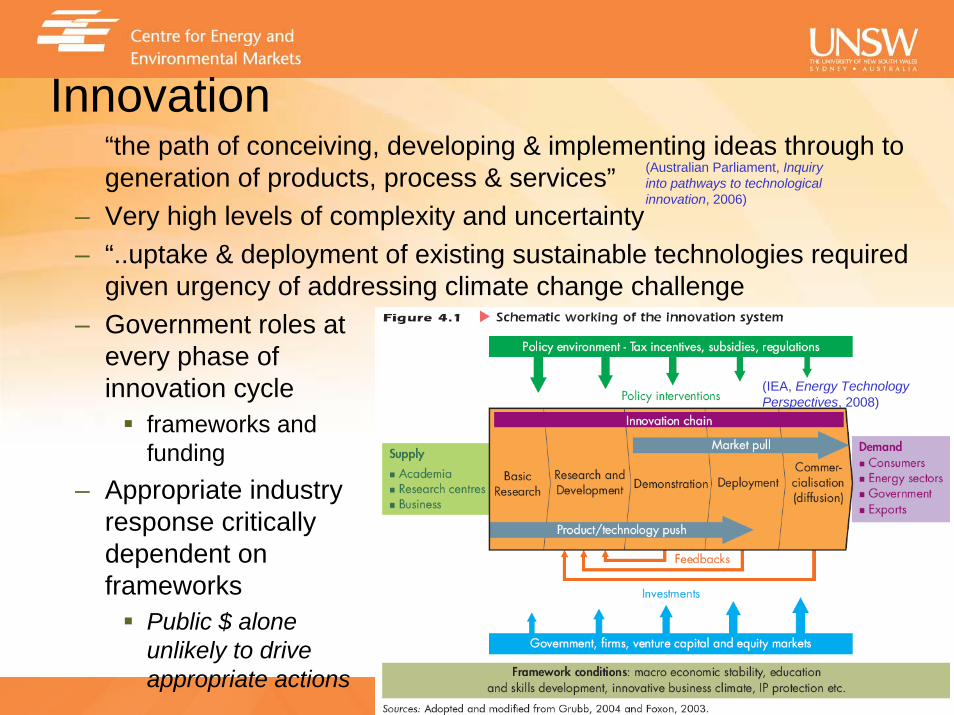
Innovation“the path of conceiving, developing & implementing ideas through to generation of products, process & services”
– Very high levels of complexity and uncertainty– “..uptake & deployment of existing sustainable technologies required
given urgency of addressing climate change challenge – Government roles at
every phase of innovation cycle
frameworks andfunding
– Appropriate industryresponse criticallydependent onframeworks
Public $ alone unlikely to drive appropriate actions
(taken from www.iiasa.net)(IEA, Energy Technology Perspectives, 2008)
(Australian Parliament, Inquiry into pathways to technological innovation, 2006)
17
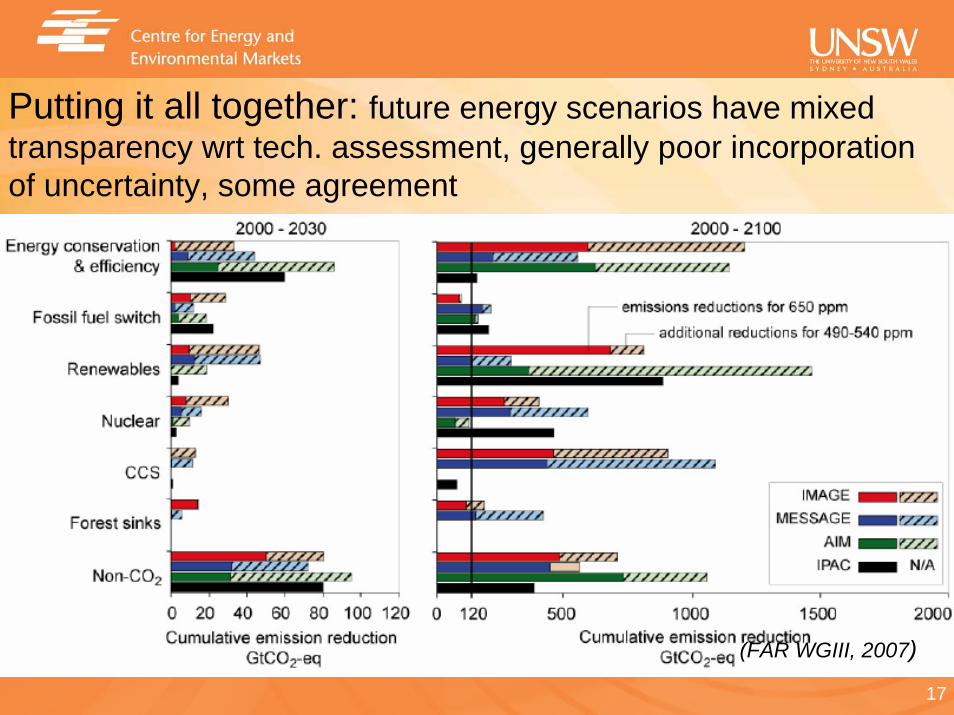
Putting it all together: future energy scenarios have mixed transparency wrt tech. assessment, generally poor incorporation of uncertainty, some agreement
(FAR WGIII, 2007)
18
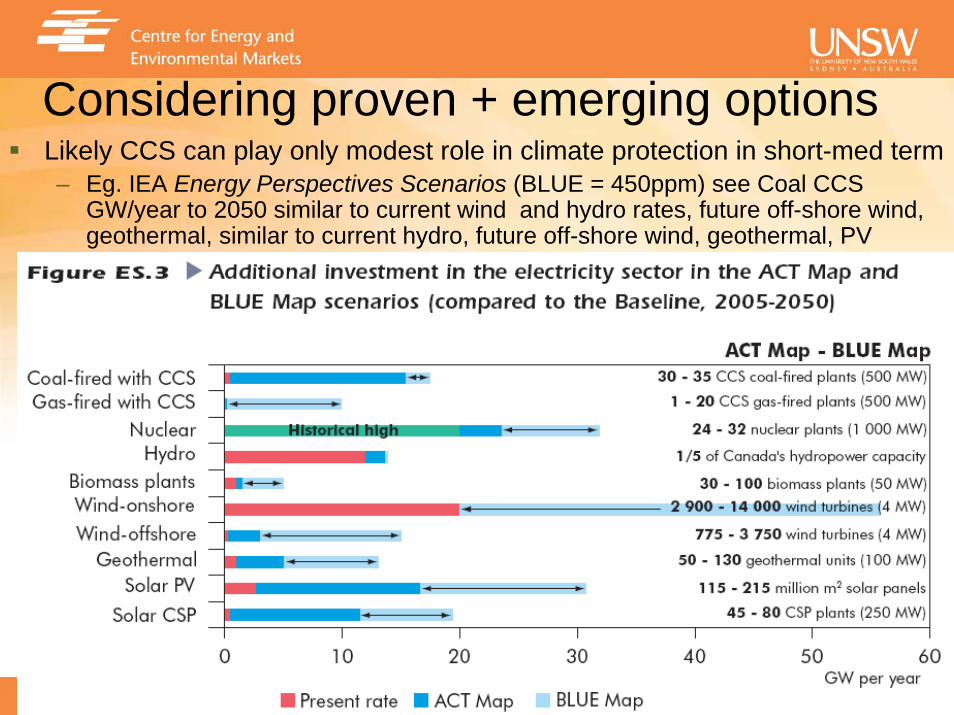
Considering proven + emerging optionsLikely CCS can play only modest role in climate protection in short-med term– Eg. IEA Energy Perspectives Scenarios (BLUE = 450ppm) see Coal CCS
GW/year to 2050 similar to current wind and hydro rates, future off-shore wind, geothermal, similar to current hydro, future off-shore wind, geothermal, PV
19
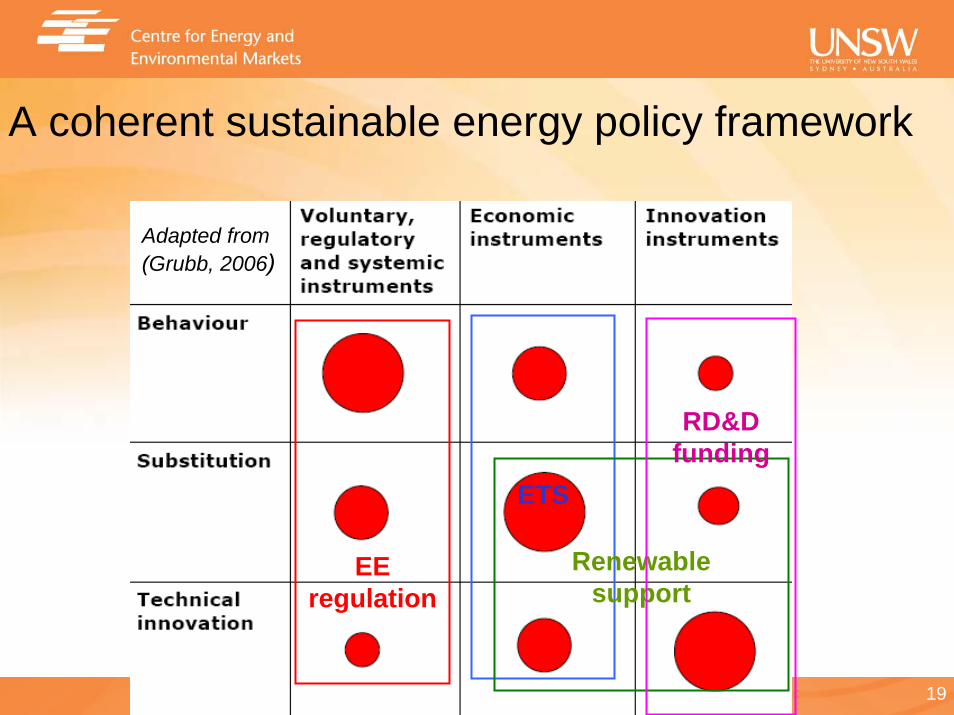
A coherent sustainable energy policy framework
Adapted from (Grubb, 2006)
ETS
Renewable support
EE regulation
RD&D funding

20
R&D and DemonstrationGenerally falling public RD&D energy funding over last 3 decades - $ & % of total funding) although now changingPrivate RD&D difficult to estimate – greater than public funding but low wrt turnover (power sector $$ order of magnitude less than electronics and pharmaceuticals)
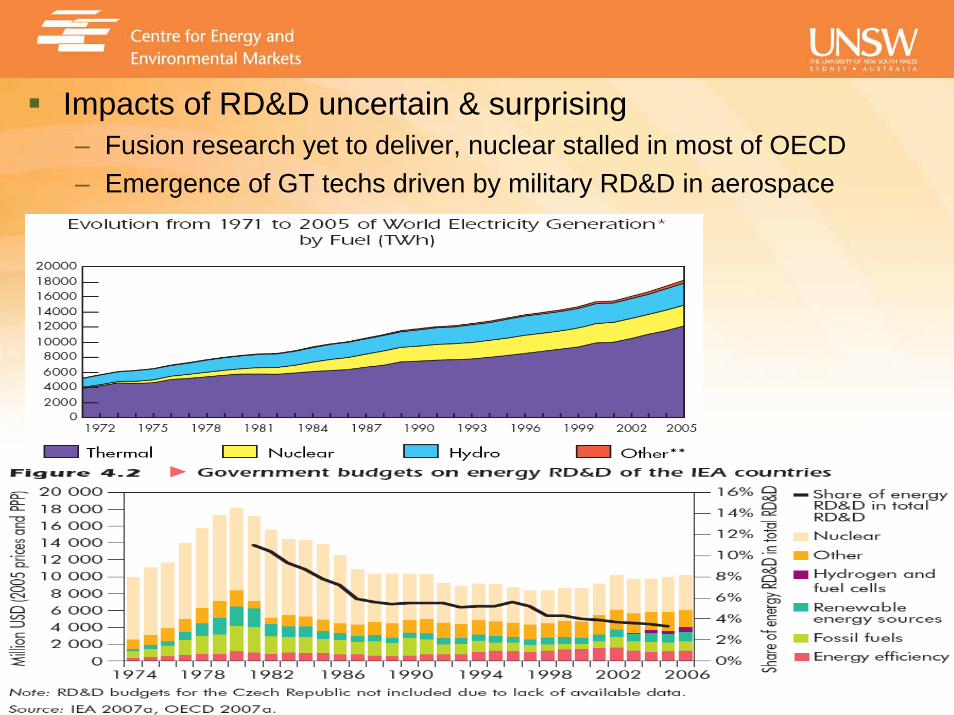
21
Impacts of RD&D uncertain & surprising– Fusion research yet to deliver, nuclear stalled in most of OECD– Emergence of GT techs driven by military RD&D in aerospace
22
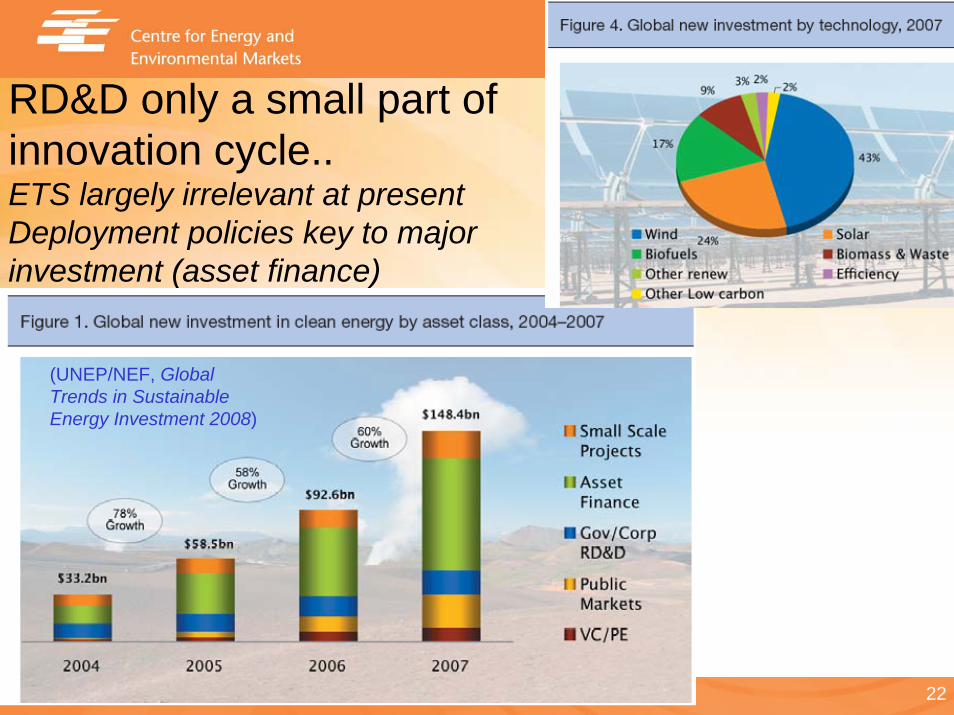
RD&D only a small part of innovation cycle.. ETS largely irrelevant at presentDeployment policies key to major investment (asset finance)
(UNEP/NEF, Global Trends in Sustainable Energy Investment 2008)
23
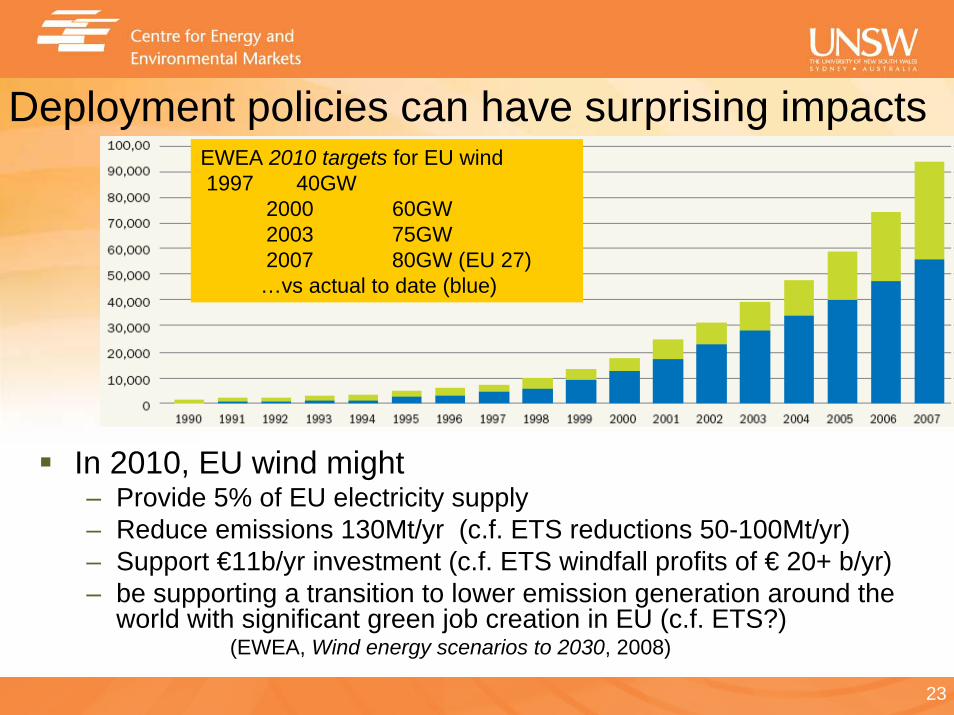
Deployment policies can have surprising impacts
In 2010, EU wind might– Provide 5% of EU electricity supply– Reduce emissions 130Mt/yr (c.f. ETS reductions 50-100Mt/yr)– Support €11b/yr investment (c.f. ETS windfall profits of € 20+ b/yr)– be supporting a transition to lower emission generation around the
world with significant green job creation in EU (c.f. ETS?)(EWEA, Wind energy scenarios to 2030, 2008)
EWEA 2010 targets for EU wind1997 40GW
2000 60GW2003 75GW2007 80GW (EU 27)…vs actual to date (blue)
24
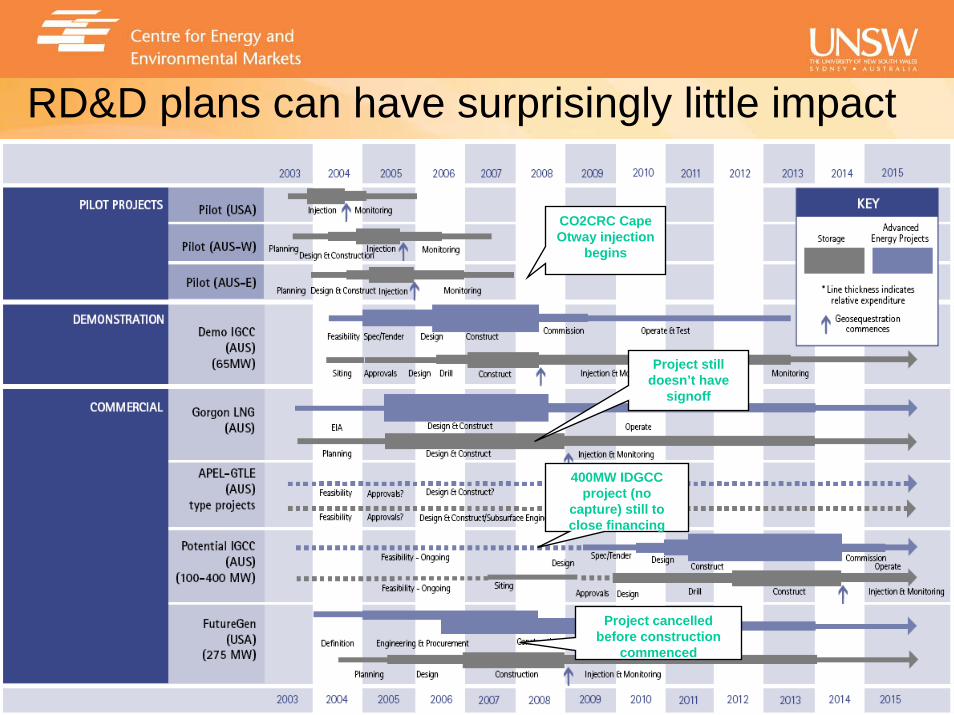
RD&D plans can have surprisingly little impact
CO2CRC Cape Otway injection
begins
Project cancelled before construction
commenced
400MW IDGCC project (no
capture) still to close financing
Project still doesn’t have
signoff
25
What policy role can ETS play?ETS only effective wrt its ability to drive changes, operational but especially investment, in markets that drive physical emissions – most importantly energy marketsIn theory, assuming idealised markets, – universal ETS only policy required– any additional climate change policies can only increase the cost of meeting the
cap while not changing its environmental effectivenessIn practice, emissions trading markets + energy markets they have to drive – suffer from wide range of market failures– may struggle to appropriately ‘price’ uncertainties about future– Established by political process inevitably involving compromises that reduce
effectivenessETS contribution to policy mix – Major role is for driving substitution – if it can’t do this, try another approach
Will still require other policies to drive behaviour + technology innovation – In theory, highly compatible with other policies including market-based
Prices of ETS and/or other policies adjust wrt changing marginal costs
26
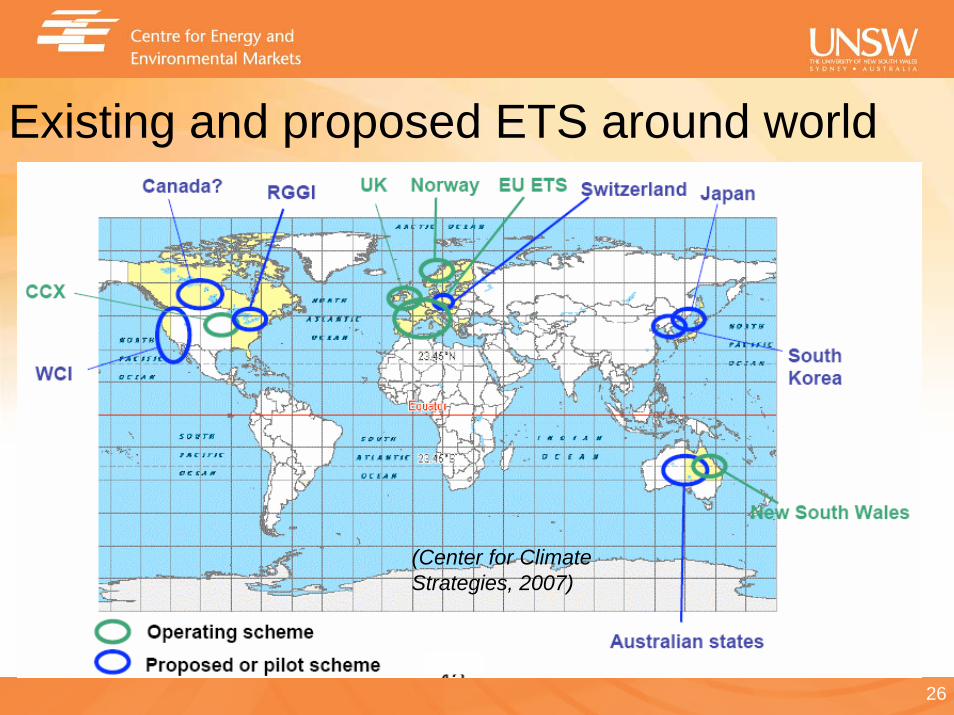
Existing and proposed ETS around world
Regional Greenhouse Gas Initiative (RGGI)
(Center for Climate Strategies, 2007)
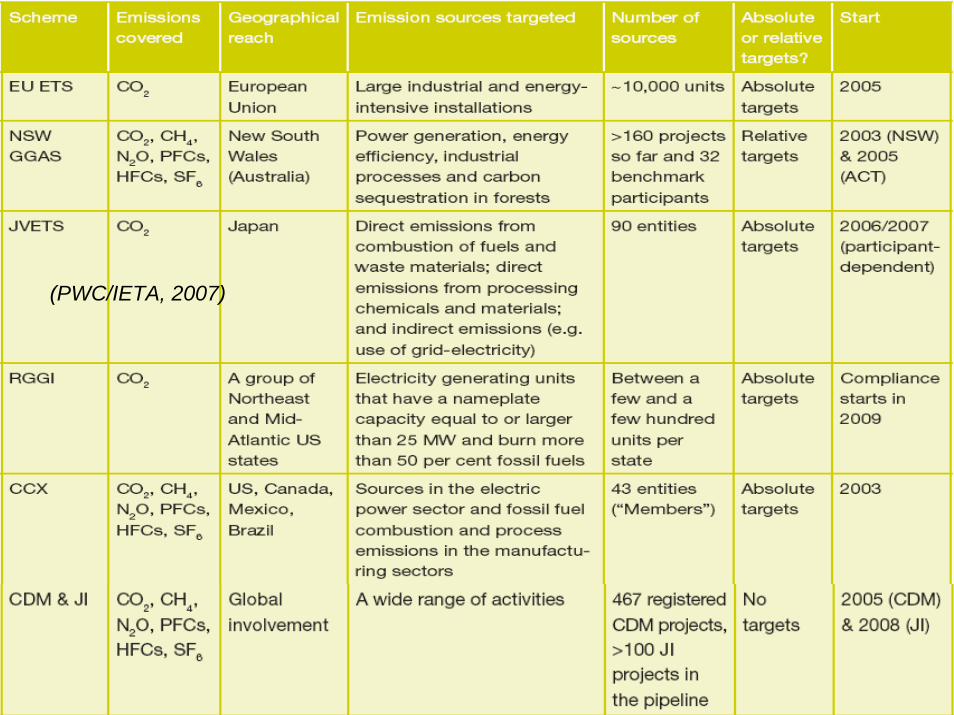
27
(PWC/IETA, 2007)
28
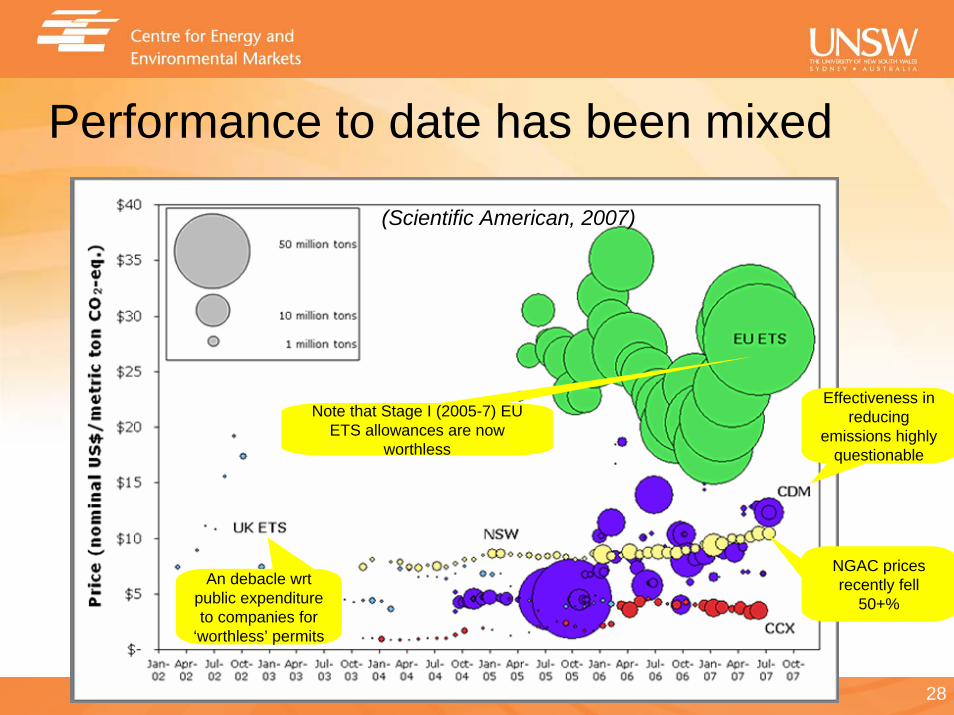
Performance to date has been mixed
Note that Stage I (2005-7) EU ETS allowances are now
worthless
NGAC prices recently fell
50+%
(Scientific American, 2007)
An debacle wrtpublic expenditure to companies for
‘worthless’ permits
Effectiveness in reducing
emissions highly questionable
29
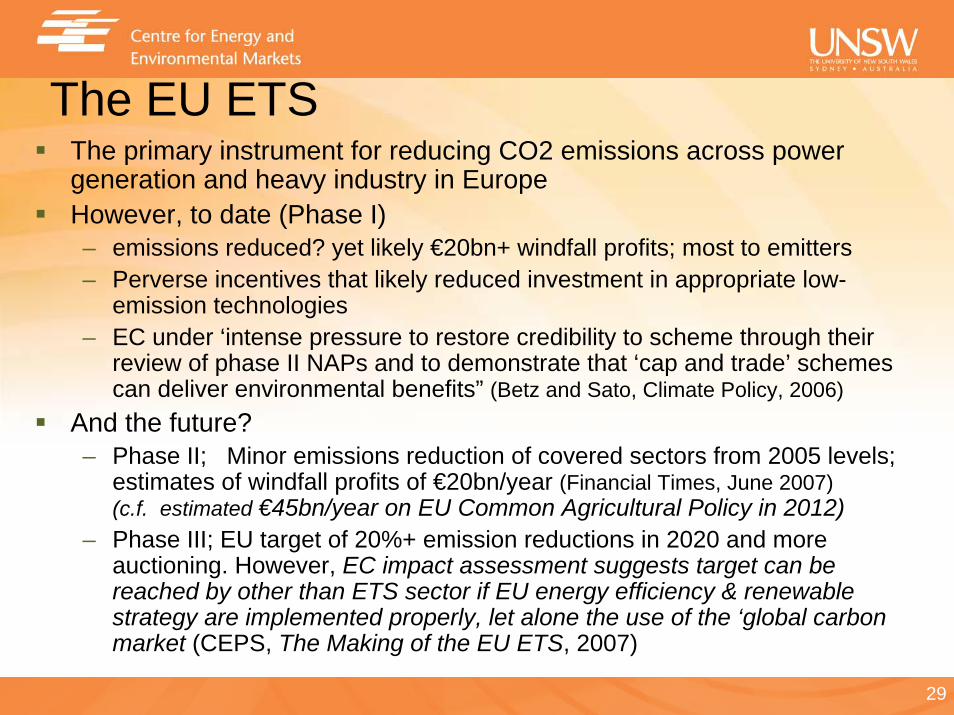
The EU ETSThe primary instrument for reducing CO2 emissions across power generation and heavy industry in EuropeHowever, to date (Phase I)– emissions reduced? yet likely €20bn+ windfall profits; most to emitters– Perverse incentives that likely reduced investment in appropriate low-
emission technologies– EC under ‘intense pressure to restore credibility to scheme through their
review of phase II NAPs and to demonstrate that ‘cap and trade’ schemes can deliver environmental benefits” (Betz and Sato, Climate Policy, 2006)
And the future?– Phase II; Minor emissions reduction of covered sectors from 2005 levels;
estimates of windfall profits of €20bn/year (Financial Times, June 2007)(c.f. estimated €45bn/year on EU Common Agricultural Policy in 2012)
– Phase III; EU target of 20%+ emission reductions in 2020 and more auctioning. However, EC impact assessment suggests target can be reached by other than ETS sector if EU energy efficiency & renewable strategy are implemented properly, let alone the use of the ‘global carbon market (CEPS, The Making of the EU ETS, 2007)

30
Outcomes of existing Australian policy framework
energy-related emissions +56% 1990–2010 (BAU + 66%)Considerable overall uncertainty– 2003 inventory +/-5%– 2010 emissions scenarios
range 102-115% (Kyoto +108%)
Note that expected ETS impacts not included
Some key policy measures
0
2
4
6
8
10
12
14
16
18
20
EE Renewables GHG abatement
Proj
ecte
d A
bate
men
t (M
tCO
2/yr
)
MEPS
Building Standards
Greenhouse challenge
Greenpower
MRET NSW GGAS
VIC EPA
QLD 13%GGAP
Questionable?
Very unlikely
31
Federal Government policy developmentEmission Trading System by 2010. Detailed design finalised by end 2008. Mandatory Renewables Target of 20% by 2020, 45,000GWh. Scheme design finalised end 2008Demonstration and commercialisation funding– $500M Renewable Energy Fund intended to develop,
commercialise and deploy renewable energy. – $500M under National Clean Coal Fund to finance deployment of
clean coal technologiesA wide range of Energy Efficiency policies and measures– Equipment and building energy and emission performance
measuring, information and regulationOngoing NEM restructuring
numerous diverse State Government policy efforts
32
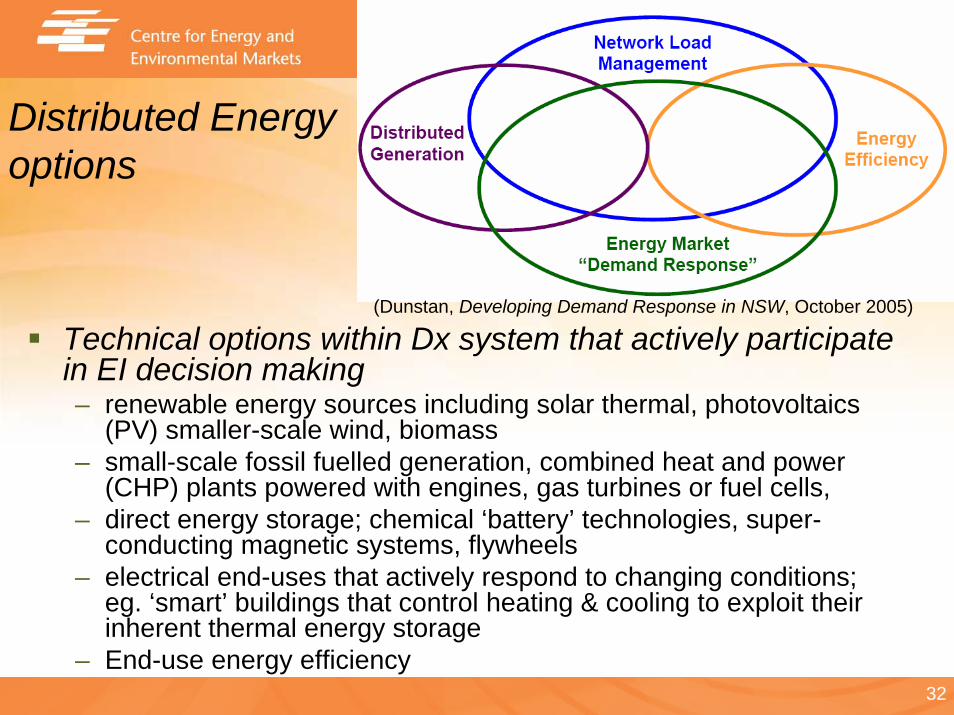
Distributed Energy options
Technical options within Dx system that actively participate in EI decision making– renewable energy sources including solar thermal, photovoltaics
(PV) smaller-scale wind, biomass– small-scale fossil fuelled generation, combined heat and power
(CHP) plants powered with engines, gas turbines or fuel cells,– direct energy storage; chemical ‘battery’ technologies, super-
conducting magnetic systems, flywheels – electrical end-uses that actively respond to changing conditions;
eg. ‘smart’ buildings that control heating & cooling to exploit their inherent thermal energy storage
– End-use energy efficiency
(Dunstan, Developing Demand Response in NSW, October 2005)

33
DE’s complex yet promising characteristicsConceptual complexities
– Demand side participation… beyond consuming energy and paying bills
– Controllable loads… controlled with respect to evolving industry objectives
– Energy efficiencyDifficult to define in useful ways
– Generation, storage or demandCan be technically near entirely fungible wrt overall industry operation
– Decision makersEnd-users, retailers or Network Service Providers
Potentially valuable characteristics– Some highly cost-effective alternatives to centralised supply and associated
network options– Environmental benefits from use of renewable energy resources or highly efficient
fossil-fuel use (eg. Cogeneration)– Opportunities for greater end-user engagement in achieving desired energy
servicesHowever, generally limited role played to date in most electricity industries around the world
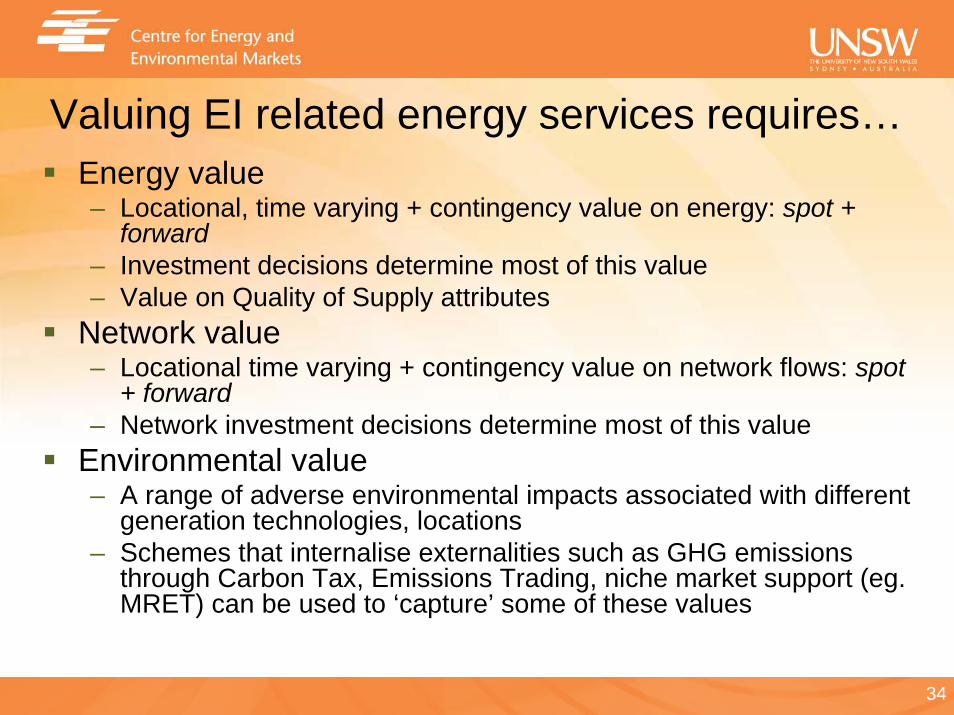
34
Valuing EI related energy services requires…Energy value– Locational, time varying + contingency value on energy: spot +
forward– Investment decisions determine most of this value– Value on Quality of Supply attributes
Network value– Locational time varying + contingency value on network flows: spot
+ forward– Network investment decisions determine most of this value
Environmental value– A range of adverse environmental impacts associated with different
generation technologies, locations– Schemes that internalise externalities such as GHG emissions
through Carbon Tax, Emissions Trading, niche market support (eg. MRET) can be used to ‘capture’ some of these values
35
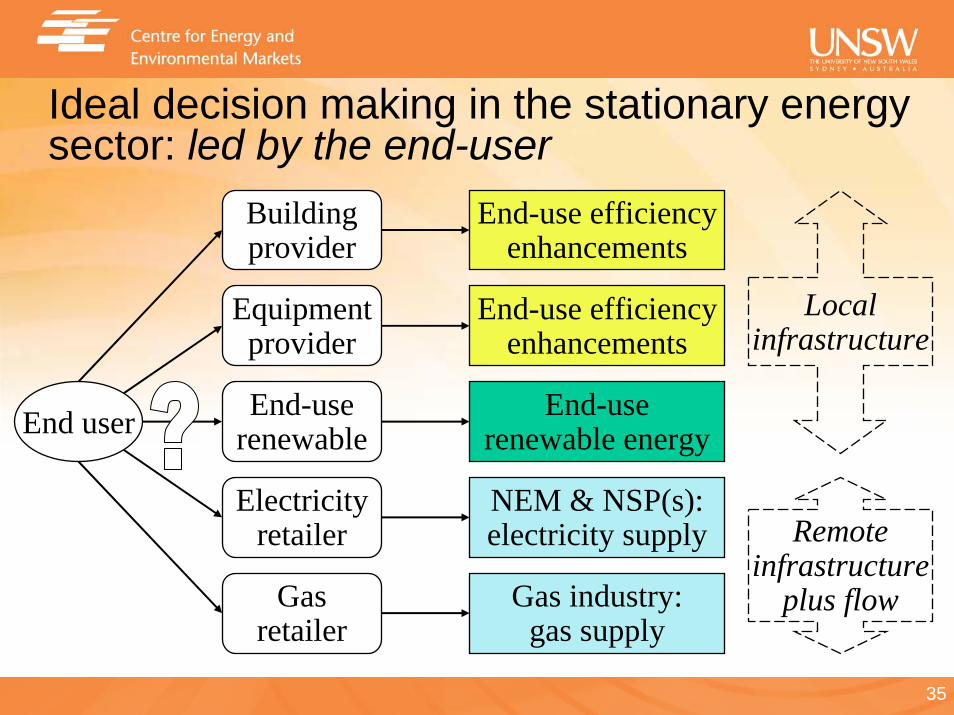
Ideal decision making in the stationary energy sector: led by the end-user
End user End-userenewable
Electricityretailer
Equipmentprovider
Gasretailer
Buildingprovider
End-userenewable energy
End-use efficiencyenhancements
End-use efficiencyenhancements
NEM & NSP(s):electricity supply
Gas industry:gas supply
Localinfrastructure
Remoteinfrastructure
plus flow
36
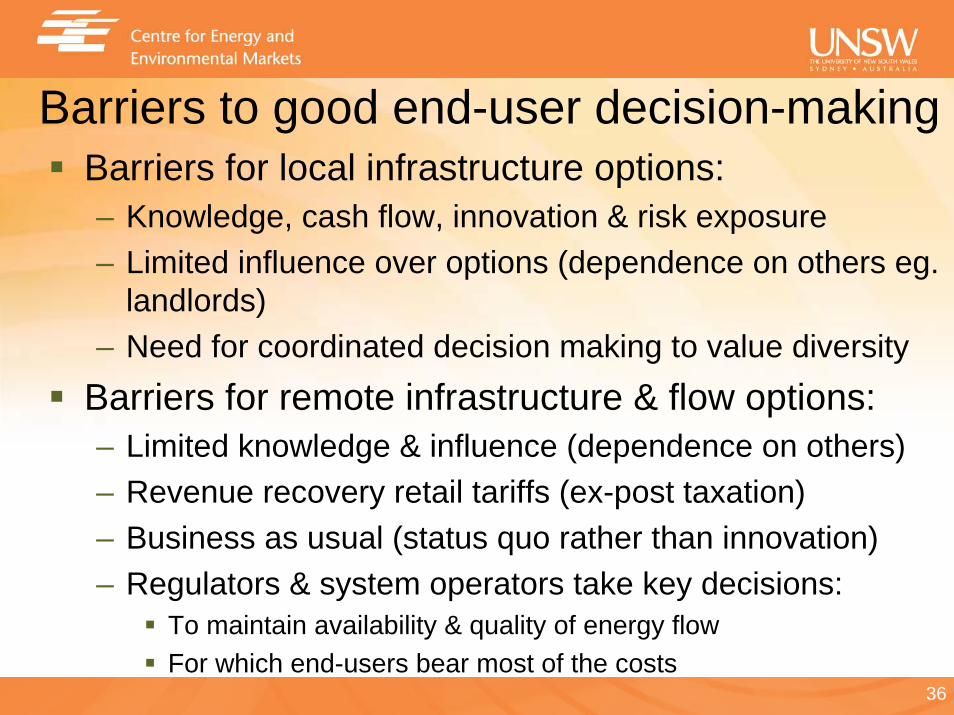
Barriers to good end-user decision-makingBarriers for local infrastructure options:– Knowledge, cash flow, innovation & risk exposure– Limited influence over options (dependence on others eg.
landlords)– Need for coordinated decision making to value diversity
Barriers for remote infrastructure & flow options:– Limited knowledge & influence (dependence on others)– Revenue recovery retail tariffs (ex-post taxation)– Business as usual (status quo rather than innovation)– Regulators & system operators take key decisions:
To maintain availability & quality of energy flowFor which end-users bear most of the costs
37
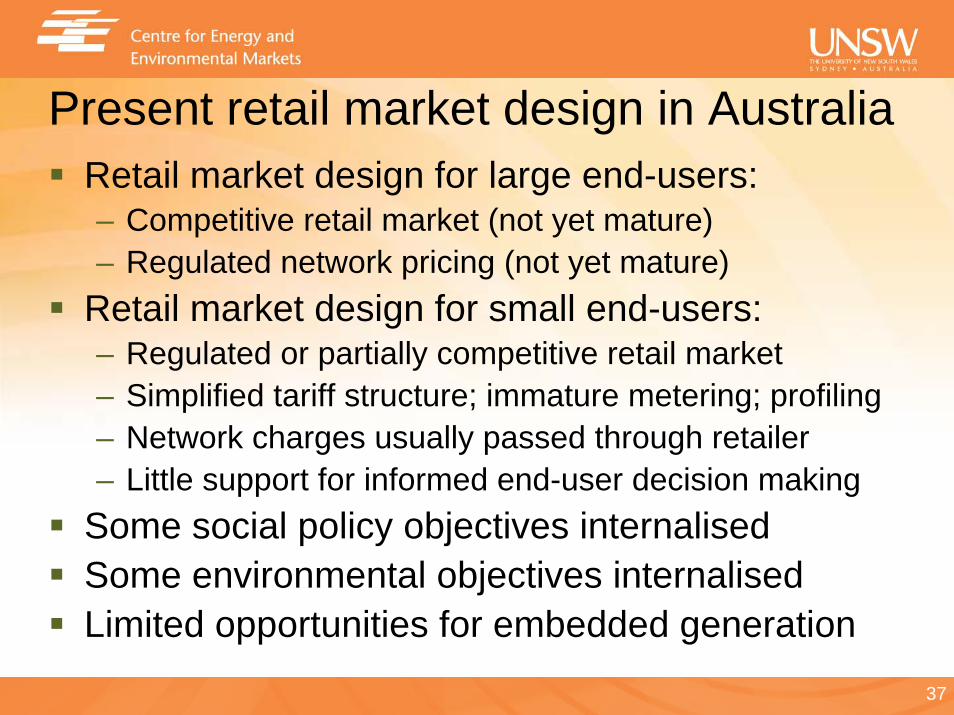
Present retail market design in AustraliaRetail market design for large end-users:– Competitive retail market (not yet mature)– Regulated network pricing (not yet mature)
Retail market design for small end-users:– Regulated or partially competitive retail market– Simplified tariff structure; immature metering; profiling– Network charges usually passed through retailer – Little support for informed end-user decision making
Some social policy objectives internalised Some environmental objectives internalisedLimited opportunities for embedded generation
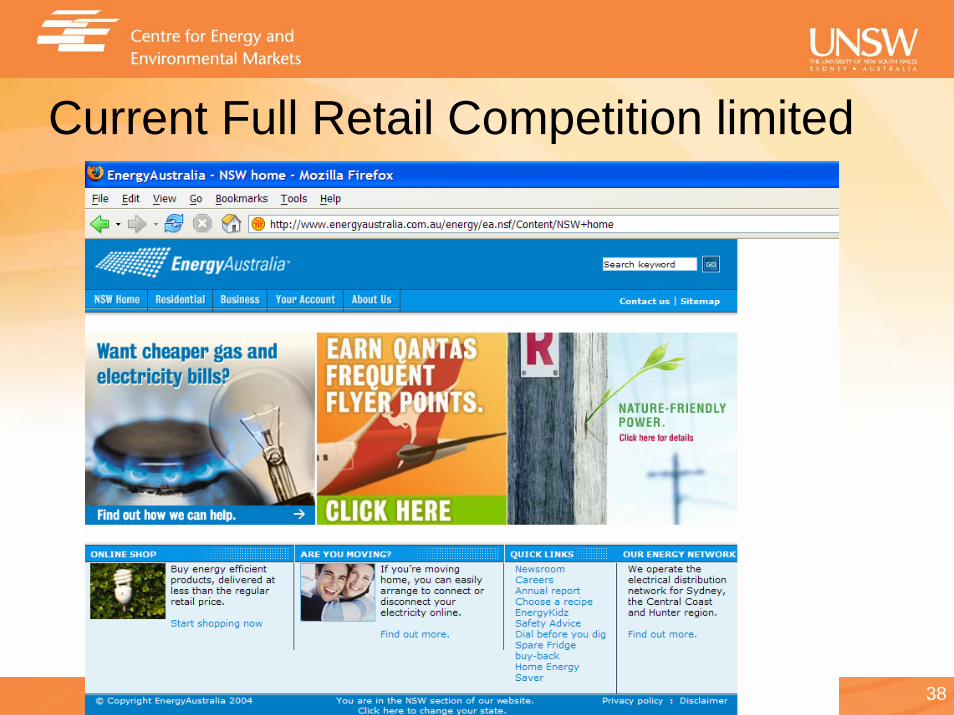
38
Current Full Retail Competition limited
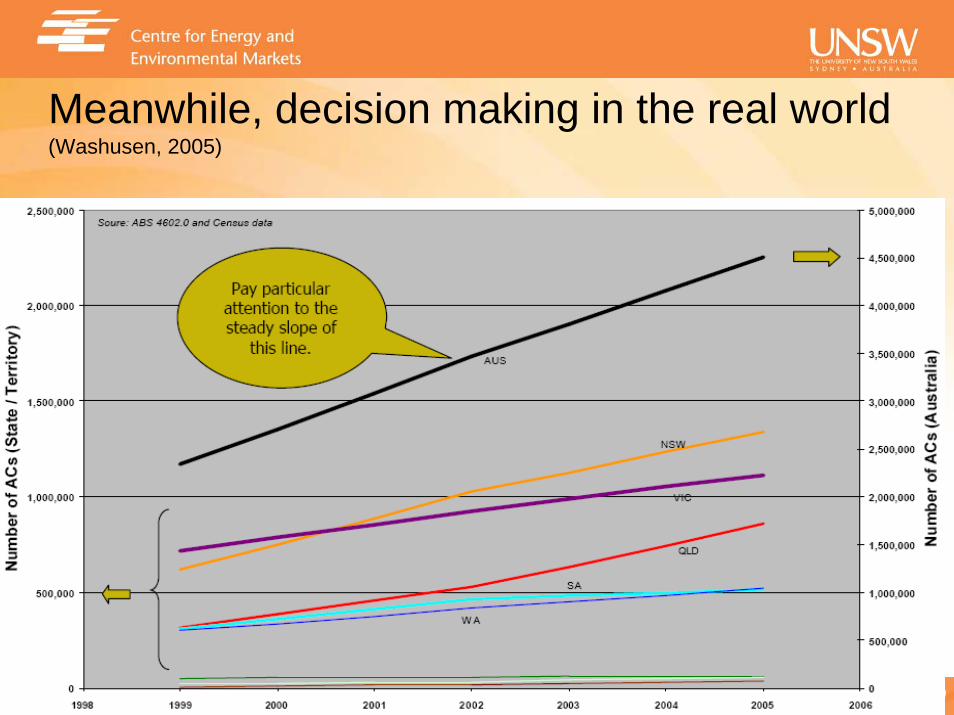
39
Meanwhile, decision making in the real world (Washusen, 2005)
40
CommercialPhysical
CommercialPhysical
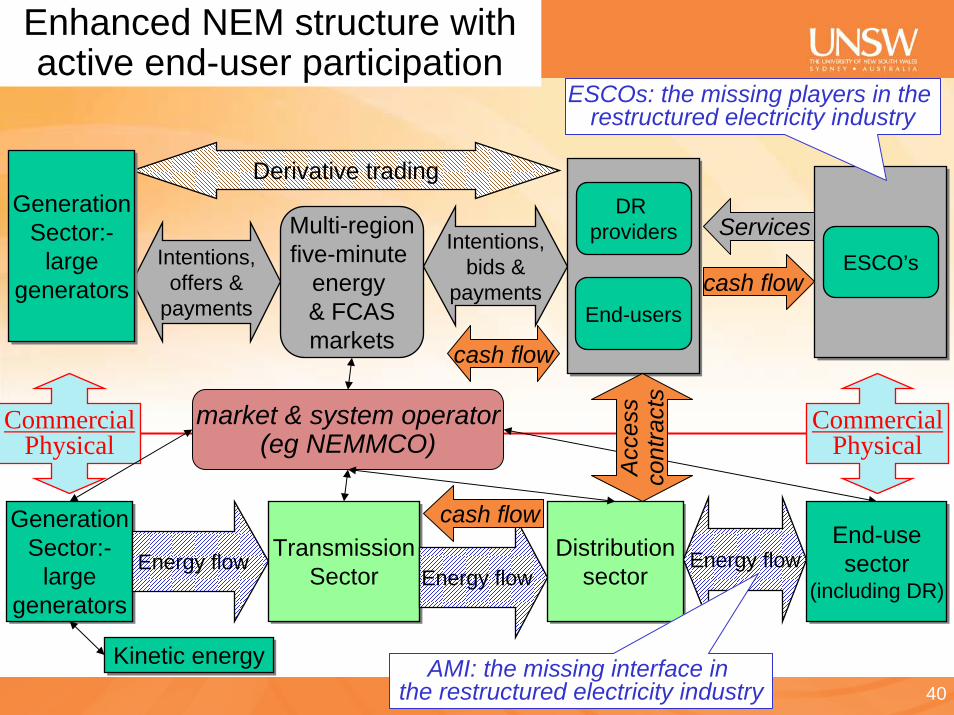
Enhanced NEM structure with active end-user participation
GenerationSector:-
largegenerators
GenerationSector:-
largegenerators
TransmissionSector
TransmissionSectorEnergy flow
Derivative trading
Distributionsector
DistributionsectorEnergy flow
Multi-regionfive-minute
energy & FCASmarkets
Intentions,offers &
payments
Intentions,bids &
payments
End-usesector
(including DR)
End-usesector
(including DR)Energy flow
End-users
DR providers
GenerationSector:-
largegenerators
GenerationSector:-
largegenerators
market & system operator(eg NEMMCO)
cash flow
Kinetic energyKinetic energy
cash flow
Acc
ess
cont
ract
s
ESCO’scash flow
Services
ESCOs: the missing players in the restructured electricity industry
AMI: the missing interface in the restructured electricity industry

41
General principles to guide policy effortsWhat exists is possible– existing off-the-shelf energy efficiency, gas & renewables have
demonstrated capabilities in reducing emissions & understood costs. What doesn’t yet exist may or may not be possible– and while these options should be pursued, shouldn’t be relied upon –
eg. waiting for CCS or emerging renewables before taking action high risk
It takes time to commercialise technologies– additional money can shorten but generally can’t eliminate such delays
It takes yet more time to develop industrial, infrastructure andinstitutional capacities – Key to taking technologies from niche applications to widespread
deployment. – The Built Environment is one of the key infrastructures that needs to be
transformed in order to achieve energy and environmental goals
42
Many of our publications are available at:www.ceem.unsw.edu.au
Thank you… and questions


