32
AUSTRALIA’S ECONOMIC TRANSFORMATION AGL’s role in a changing society and economy
AUSTRALIA’S ECONOMIC
TRANSFORMATIONAGL’s role in a changing
society and economy

AGL ENERGY LIMITED ABN 74 115 061 375
Contents
1. Introduction 2
2. Energy customers of the future 4
2.1 Population and Demographics 4
2.2 Urbanisation and household structure 8
2.3 New energy technologies 10
2.4 Implications for energy usage 12
3. Australia’s changing industrial mix 15
3.1 Australia’s economy 15
3.2 Case study: Food and agribusiness 18
3.3 Case Study: Mining and resources 21
3.4 Case study: Services 24
4. Closing remarks 28
5. End notes 30
About this Report
This report explores how AGL Energy Limited (AGL) and the broader energy industry may change between 2016 and 2050 and adapt to meet the evolving needs of Australian energy consumers, industries and communities. This report is not intended to provide a forecast of the future, but represents a range of potential scenarios that may eventuate with technology advancements and population changes.

Between 2016 and 2050 Australia may experience profound changes to our population, the way we live and how we work. With this in mind, AGL is already preparing to meet the energy needs of Australia’s future homes and businesses.
AUSTRALIA’S ECONOMIC TRANSFORMATIONAGL’s role in a changing society and economy
1
2 AUSTRALIA’S ECONOMIC TRANSFORMATION
INTRODUCTION
1.
Between now and 2050, Australia’s population and economy are likely to change. Together with evolving technology, community expectations and a need to reduce greenhouse gas emissions, energy companies of the future are likely to be different to those of today. While reliable and affordable energy supplies will continue to underpin the prosperity of our communities, the sources of energy, and the business models that supply it, will evolve to reflect changes to society.
INTRODUCTION
2
KPMG1 has identified nine major global forces currently taking shape that will drive business within the public and private sector over the coming decades. These ‘megatrends’ are:
• Demographics: an ageing global population;
• Rise of the individual: education, health and technology are growing wealth and empowering individuals;
• Enabling technology: opportunities arising from information and communications technology advancements;
• Economic interconnectedness: international trade and capital flows;
• Public debt: a constraint on government policy options, requiring new ways of delivering public services;
• Economic power shift: emerging economies rebalancing global power structures;
• Climate change: unpredictable environmental changes require mitigation and adaptation;
• Resources stress: increased pressure on essential natural resources including water, food, arable land and energy;
• Urbanisation: a growing proportion of the world’s population living in cities.
The World Economic Forum2 has reported that over the next ten years, the greatest global risks are water crises, failure of climate change mitigation and adaptation, extreme weather events, food crises and profound social instability. Within the Asia-Pacific region, the greatest risks are predicted to be natural catastrophes, water crises, extreme weather events, unemployment or underemployment and failure of national governance.
These global megatrends, risks, and government responses to them will significantly influence Australia’s economy and its energy sector for the foreseeable future. This report explores Australia’s population and industry mix to 2050, and the role that AGL and the broader energy sector can play in supporting households and industry over this period. Importantly nothing in this report should be considered a definitive ‘forecast’ of the future. Instead, the report is designed to provide some insights into how the energy sector may need to evolve as societies and industries change. Section 2 considers how demographic changes may be reflected in home energy use and section 3 looks at how Australia’s economic value may be created in the future, and provides case studies on high-potential industry sectors.

33
To develop this report, we interviewed a range of AGL’s key stakeholders - including from within AGL’s own business, environmental groups, consumer representatives, industry associations, analysts and regulators – and asked where they considered AGL’s major challenges and opportunities to lie, over the long term. The key trends that emerged from their responses were:
• Australia’s industrial landscape is changing. The resources boom is ending, heavy industry is closing, and new opportunities are opening in food; niche, high-tech and value-added manufacturing; as well as in services like health and education. It is not clear whether the skills and jobs from ‘old’ industries can effectively transition to the ‘new’ ones, and training young people for the jobs of the future, including in science and technology is important.
• Decarbonisation is a growing, global trend that will drive transformation of the energy sector for decades. Australia’s reliance on fossil fuels for both export and domestic use is expected by some stakeholders to decline, and the use of renewable energy is predicted to increase. Communities that depend on coal mining and power generation for employment may need assistance during this transition.
• Energy technologies are evolving and costs are expected to drop over time to give energy users more choice and control in how they generate, use and share energy. Renewable technologies, distributed generation, battery storage, energy efficiency and electric vehicles, along with new digital platforms and services may change the structure of the energy sector completely.
• Energy customers (like the broader population) will undergo a generational change but will continue to expect access to reliable and affordable energy supplies. Energy companies that provide excellent service, and which can simplify the growing market complexity for customers will be successful. There is some concern that a growing gap between the wealthiest and poorest households will increase energy hardship.
• Companies like AGL have a leadership role to play throughout this change, including to explain and simplify energy market complexities, invest in low-emissions and emerging consumer technologies, and to work with governments and the community to develop energy policy that will enhance Australia’s prosperity over the long term.
AGL was established in 1837 and since that time has evolved to meet the changing needs of energy customers. In 1841 AGL lit the first gas street lamp in Sydney, and today is Australia’s largest electricity generator, the largest ASX listed operator and developer of renewable energy, and provides energy solutions to 3.7 million homes and businesses across Eastern Australia, including electricity supply, gas supply, rooftop solar and energy management. To continue to be successful into the future, AGL will need to tailor offerings to meet the changing needs of individual residential and commercial customers and use innovation to drive sustainability and productivity throughout the Australian economy. Given these uncertainties, AGL is preparing for a range of potential futures.

4 AUSTRALIA’S ECONOMIC TRANSFORMATION
2.1 POPULATION AND DEMOGRAPHICSAustralia’s population is growing and changing and over time, and the values, expectations and preferences of Australian communities will reflect these changes. Understanding the changing needs of our customers will be central to AGL’s continued success so that we can provide products and services that meet their energy needs and add value by increasing comfort and convenience.
Population growthAustralia’s population is expected to continue to grow, increasing by more than 50% by mid-century. Medical advancements mean that Australians are living longer, which, along with overseas migration and a fairly stable birth rate, is expected to drive growth in Australia’s population, from around 24.4 million people in 2016 to 37.6 million in 20503. Australia’s infrastructure, including its energy systems, will therefore need to serve a greater number of households and businesses.
Generational change and ageingIn 2016, millennials (born between 1982 and 2000) are the largest generational group in Australia (having overtaken the baby boomers in around 20064, as shown in Figure 1). Millennials will remain a major force throughout the next 40 years, remaining the largest generational group well into the 2030s, when the ‘digital natives’ (born 2001 to 2020) and then the ‘post digital natives’ (born 2021 to 2040) will represent greater shares of the population.
ENERGY CUSTOMERS OF THE FUTURE
ENERGY CUSTOMERS OF THE FUTURE
2.
By 2050,
OVER 75%
of adults making household purchasing
decisions will be millennials or younger.
Derived from: Australian Bureau of Statistics (2012), 3222.0 Population Projections, Australia, Series B. Figures may not sum to 100% due to rounding.
Figure 1: Generational makeup of Australian population 2016 and 2050
0% 0% 0% 0%
Oldest Generation (pre-1924)
Silent Generation (1925-1945)
Baby Boomers (1946-1964)
Generation X (1965-1981)
Millennials (1982-2000)
Digital Natives (2001-2020)
Post Digital Natives (2021-2040)
Beyond (Post 2041)
20%
25%
30%
15%
10%
5%
0%20502016
<1%
9%
21%23%
27%
20%
4%
13%
22%
26%24%
12%
Perc
enta
ge o
f pop
ulat
ion
5
By 2050, over three quarters of the population aged over 20 (and therefore likely to be making household purchasing decisions, for example, relating to energy supply) will have been born after 1982, and around half will have been born after 2000. In an increasingly connected world, these customers may be most comfortable accessing products and services, making purchases, accessing information, working and interacting with one another via digital platforms. Exponential growth in the volume of data collected, together with advanced analytical capabilities may be used to create ‘smart’ offerings tailored to anticipate and service the needs of individual customers. Artificial intelligence and technological advancements will enable automation of services that seamlessly blend the digital and physical worlds.
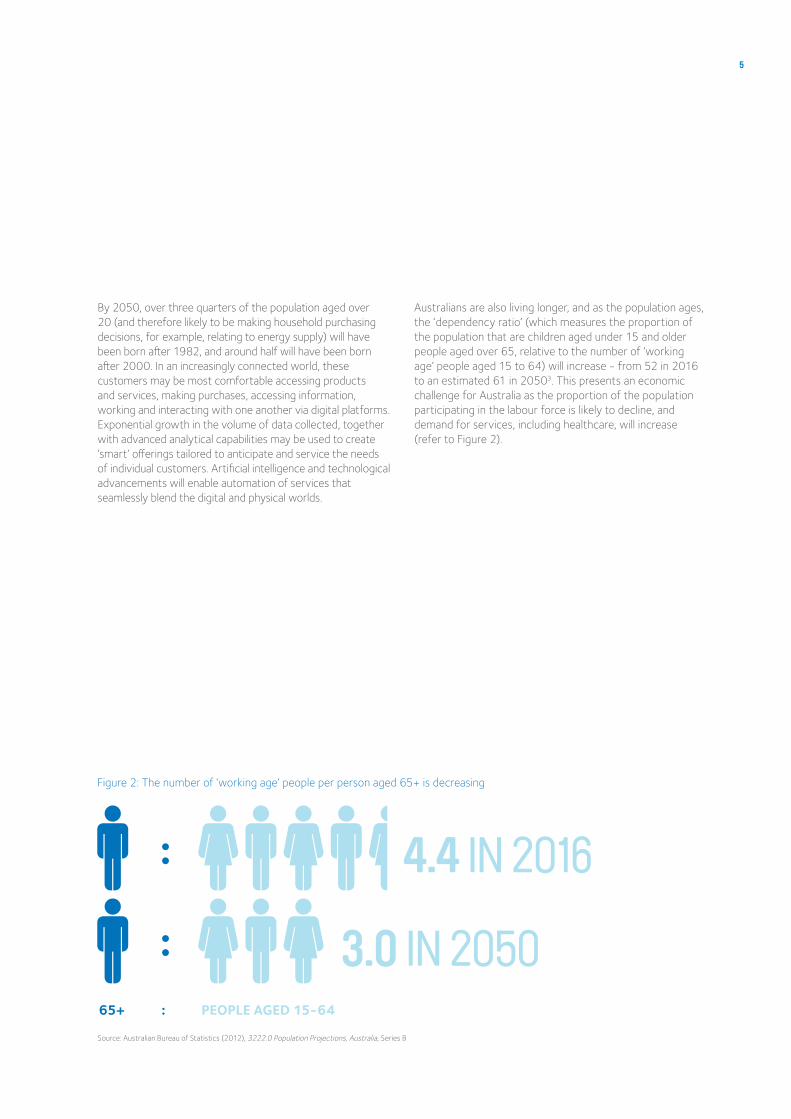
Australians are also living longer, and as the population ages, the ‘dependency ratio’ (which measures the proportion of the population that are children aged under 15 and older people aged over 65, relative to the number of ‘working age’ people aged 15 to 64) will increase - from 52 in 2016 to an estimated 61 in 20503. This presents an economic challenge for Australia as the proportion of the population participating in the labour force is likely to decline, and demand for services, including healthcare, will increase (refer to Figure 2).
Source: Australian Bureau of Statistics (2012), 3222.0 Population Projections, Australia, Series B
Figure 2: The number of ‘working age’ people per person aged 65+ is decreasing
65+ :
: 4.4 IN 2016
: 3.0 IN 2050PEOPLE AGED 15-64

6 AUSTRALIA’S ECONOMIC TRANSFORMATION
The ageing of Australia’s population is likely to be most pronounced in areas outside of capital cities where over one quarter of the population is expected to be over the age of 65 by 2050, and 5% will be over the age of 85, as shown in Figure 3. Companies such as AGL will increasingly be required to work with our suppliers, customers and employees on innovative solutions that improve productivity as the proportion of the population in the workforce declines.
ENERGY CUSTOMERS OF THE FUTURE
Source: Australian Bureau of Statistics (2012), 3222.0 Population Projections, Australia, Series B
100%80%60%40%20%0% 100%80%60%40%20%0%
2016
Australian Population Total
Capital Cities Outside of Capital Cities
2050
2016
2050
2016
2050
100%80%60%40%20%0%
2.013.165.918.9
4.216.762.017.1
1.811.967.518.7
3.815.463.817.1
2.215.762.819.3
5.320.557.117.1
Under 15 years 15–64 years 65–84 years 85 years and over
Percentage of population
Figure 3: Australia’s ageing population
Cultural DiversityThe proportion of Australia’s population born overseas has been increasing for the last 15 years, and currently stands at 28%5. England and New Zealand are currently the largest groups of overseas-born residents, representing 4.2% and 2.6% of all Australian residents. There has also been fairly rapid growth in the number of Chinese- and Indian- born residents from a low base, since the early 2000s, with these groups now comprising 2.0% and 1.8% of the population (respectively). Over half of all migrants to Australia are aged 15 to 29 years old6, indicating that migration will be an important source of skills and workers as the population ages. Under all population projection scenarios compiled by the Australian Bureau of Statistics, overseas migration continues to drive Australian population growth to 2050, outpacing natural increases (i.e. local births less deaths) and by 2050, around one in three Australian residents could be overseas born.
Census data shows that the number of Australians with at least one parent born overseas is increasing, standing at 46% in 2011, up from 44% in 2006. Accordingly, in future, Australia is likely to have a more ethnically and culturally diverse population.
In an increasingly connected global economy, Australia has the advantage of being one of the most culturally diverse countries in the OECD, and one of the most multi-lingual, with around 2.1 million Australian workers speaking an Asian language and 1.3 million speaking a European language in addition to English7. This diversity reflects the underlying diversity of the population, and in future, companies like AGL will need to leverage the diversity of its workforce to develop and deliver products and services for a more diverse customer base. Accordingly, it is critical that companies such as AGL continue to drive improvements in cultural and gender workplace diversity.

7
Employment and living standardsOn average, future Australians are projected to be wealthier and enjoy a higher living standard than today. The Australian Government has forecast that real Gross National Income (GNI) per person (i.e. the purchasing power of Australian incomes) will increase in real terms from $66,400 in 2015 to $117,300 by 20556. Growth is, however, expected to be slower than in the past (an annual growth rate of 1.4% to 2055, compared to an average growth rate of 1.9% per annum over the past 40 years), reflecting a decline in the terms of trade since their peak in 2011, and lower workforce participation due to an ageing population. Unlike the recent past, when GNI growth per person was largely driven by resources exports during the mining boom, future improvements are expected to be primarily due to improvements in labour productivity.
With Australians living longer and healthier lives than in the past, retaining and harnessing the skills and knowledge of the older population within the workforce and community represents a significant opportunity. Projections from Treasury suggest that participation rates for older workers will increase: for people aged 60 to 64, the proportion remaining in the workforce is expected to rise from 55% today to 68% in 2055, and for those aged over 65, participation rates are expected to increase from 13% to 17%6. Trends towards greater female participation are also expected to continue, and participation rates for women in every age bracket are projected to be higher in 2050 than today (although still generally lower than for men).
Conversely, young people may spend more time in training and education at the beginning of their careers, entering the workforce slightly later than today4. As the population ages, the average number of hours worked is projected to fall slightly, as a greater proportion of workers are employed part-time.
The very nature of work undertaken by Australians may change radically over the coming decades as a result of technological and economic changes. Some commentators predict that workplaces will become more flexible, and that businesses may rely more on outsourcing to specialist contractors and consultants (who may be self-employed). It may become the norm for workers to have a ‘portfolio career’, with multiple jobs and employers at the same time4. The trend towards tele-working may continue, with IBISWorld projecting that up to one in four people may work at least partially from home by 20508.
It has been estimated that as many as 40% of current Australian jobs face a high probability of being replaced by automation in the next ten to 15 years, with jobs that involve low levels of social interaction, creativity, mobility or dexterity most at risk9. Groups such as unskilled youth and workers unable to develop new skills (such as those made redundant from traditional manufacturing roles) may require targeted assistance to ensure that they do not become caught in a cycle of disadvantage that prevents them from fully participating in the workforce and society more generally.
On the other hand, by 2050 many thousands of Australians may be employed in new jobs and industries that have not yet been created. It is likely that employment in this ‘new economy’ will become increasingly service-driven and knowledge-based. To be successful, workers will need to be equipped with new kinds of transferable skills that allow them to navigate complex careers across a range of industries and professions. These ‘enterprise skills’ include problem solving, creativity, financial literacy, digital literacy, critical thinking, teamwork, and communication and are different from technical skills which are specific to a particular task, or industry. It has been observed that demand for these skills, and the salaries they command, are already increasing10.
8 AUSTRALIA’S ECONOMIC TRANSFORMATION
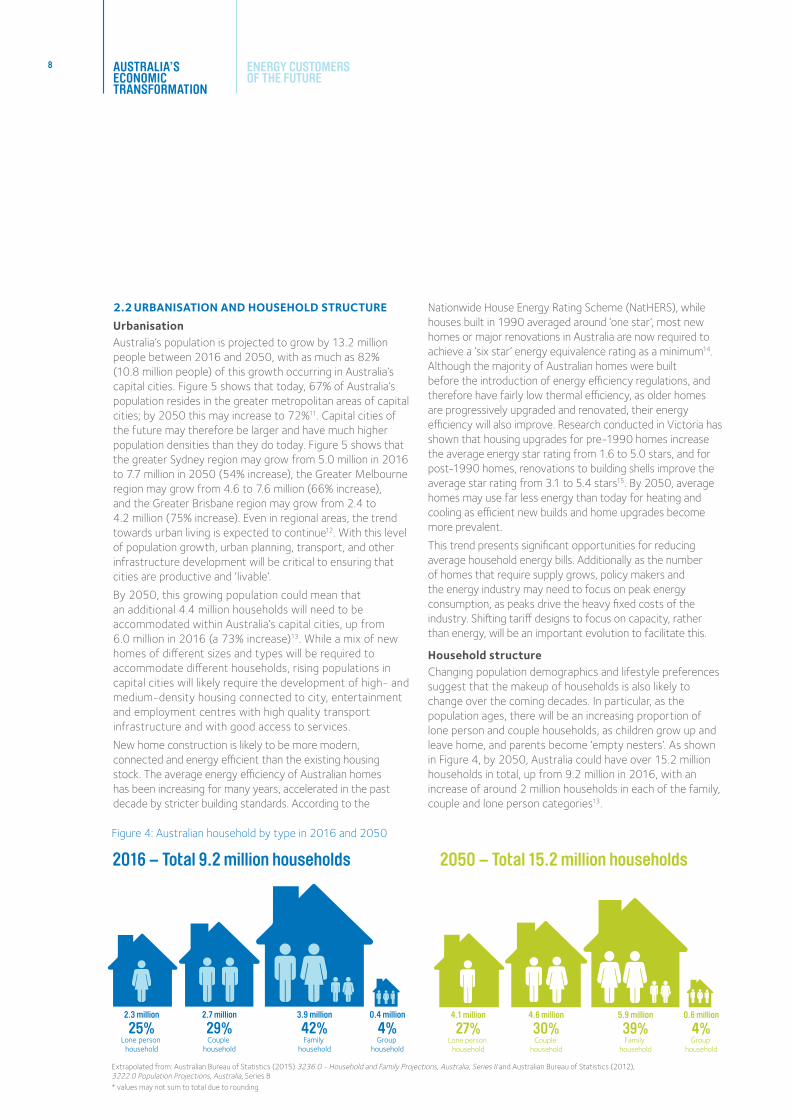
2.2 URBANISATION AND HOUSEHOLD STRUCTUREUrbanisationAustralia’s population is projected to grow by 13.2 million people between 2016 and 2050, with as much as 82% (10.8 million people) of this growth occurring in Australia’s capital cities. Figure 5 shows that today, 67% of Australia’s population resides in the greater metropolitan areas of capital cities; by 2050 this may increase to 72%11. Capital cities of the future may therefore be larger and have much higher population densities than they do today. Figure 5 shows that the greater Sydney region may grow from 5.0 million in 2016 to 7.7 million in 2050 (54% increase), the Greater Melbourne region may grow from 4.6 to 7.6 million (66% increase), and the Greater Brisbane region may grow from 2.4 to 4.2 million (75% increase). Even in regional areas, the trend towards urban living is expected to continue12. With this level of population growth, urban planning, transport, and other infrastructure development will be critical to ensuring that cities are productive and ‘livable’.
By 2050, this growing population could mean that an additional 4.4 million households will need to be accommodated within Australia’s capital cities, up from 6.0 million in 2016 (a 73% increase)13. While a mix of new homes of different sizes and types will be required to accommodate different households, rising populations in capital cities will likely require the development of high- and medium-density housing connected to city, entertainment and employment centres with high quality transport infrastructure and with good access to services.
New home construction is likely to be more modern, connected and energy efficient than the existing housing stock. The average energy efficiency of Australian homes has been increasing for many years, accelerated in the past decade by stricter building standards. According to the
Nationwide House Energy Rating Scheme (NatHERS), while houses built in 1990 averaged around ‘one star’, most new homes or major renovations in Australia are now required to achieve a ‘six star’ energy equivalence rating as a minimum14. Although the majority of Australian homes were built before the introduction of energy efficiency regulations, and therefore have fairly low thermal efficiency, as older homes are progressively upgraded and renovated, their energy efficiency will also improve. Research conducted in Victoria has shown that housing upgrades for pre-1990 homes increase the average energy star rating from 1.6 to 5.0 stars, and for post-1990 homes, renovations to building shells improve the average star rating from 3.1 to 5.4 stars15. By 2050, average homes may use far less energy than today for heating and cooling as efficient new builds and home upgrades become more prevalent.
This trend presents significant opportunities for reducing average household energy bills. Additionally as the number of homes that require supply grows, policy makers and the energy industry may need to focus on peak energy consumption, as peaks drive the heavy fixed costs of the industry. Shifting tariff designs to focus on capacity, rather than energy, will be an important evolution to facilitate this.
Household structureChanging population demographics and lifestyle preferences suggest that the makeup of households is also likely to change over the coming decades. In particular, as the population ages, there will be an increasing proportion of lone person and couple households, as children grow up and leave home, and parents become ‘empty nesters’. As shown in Figure 4, by 2050, Australia could have over 15.2 million households in total, up from 9.2 million in 2016, with an increase of around 2 million households in each of the family, couple and lone person categories13.
ENERGY CUSTOMERS OF THE FUTURE
Extrapolated from: Australian Bureau of Statistics (2015) 3236.0 - Household and Family Projections, Australia, Series II and Australian Bureau of Statistics (2012), 3222.0 Population Projections, Australia, Series B* values may not sum to total due to rounding
Figure 4: Australian household by type in 2016 and 2050
2016 – Total 9.2 million households
2.3 million
25%Lone person
household
2.7 million
29%Couple
household
3.9 million
42%Family
household
0.4 million
4%Group
household
2050 – Total 15.2 million households
4.1 million
27%Lone person
household
4.6 million
30%Couple
household
5.9 million
39%Family
household
0.6 million
4%Group
household

9
Figure 5: Australia’s population 2016 and 2050
Source: Australian Bureau of Statistics (2012), 3222.0 Population Projections, Australia, Series B
WA
2.8
Total state population (millions)
Capital city population (millions)
2.2
SA
1.71.3
QLD
5.02.4
Australia Total
24.4m16.3mNSW
7.75.0
VIC
6.04.6
NT0.30.1
ACT0.4
TAS0.50.2
20162016
Australia Total
37.6m27.1m
WA
5.5
Total state population (millions)
Capital city population (millions)
4.6SA
2.21.8
QLD
8.24.2
NSW
10.77.7
VIC
9.37.6
NT
0.40.2
ACT0.7
TAS0.60.3
2050

1 0 AUSTRALIA’S ECONOMIC TRANSFORMATION
2.3 NEW ENERGY TECHNOLOGIESNew technologies will no doubt play a central role in the way that Australians produce and consume energy into the future. By making use of modern technologies and the insights that they provide, electricity supply can be more efficient, safe, reliable, affordable and environmentally sustainable than it is today.
AGL has established its New Energy division to test and commercialise business models that make use of new distributed energy technologies. While it is impossible to predict which technologies are likely to be widely used in 2050, AGL is developing its capability to understand the technological horizon, rapidly develop and trial new products and services, and to create ‘energy ecosystems’ for customers which empower them to monitor, control and automate their energy choices.
Distributed generationAustralia already has some of the highest penetration levels of solar PV globally, and in some states, as many as one in four households generate their own solar power. Since 2007, around 4.7 GW of small-scale solar has been installed across over 1.5 million Australian rooftops. As technology costs have declined, average system sizes have increased, and now stand at just under 5 kW. In 2015, small-scale solar was estimated to have comprised approximately 2.4% of total Australian electricity supplies16.
The uptake of rooftop PV is expected to continue to grow. As technology costs decline, solar will become financially attractive for many more households and businesses, regardless of technology subsidies. It has been estimated that Australia could have as many as 5.3 million rooftops that are suitable for solar, but without installations17. Bloomberg New Energy Finance predicts that by 2040 Australia’s rooftop solar PV installations could increase to 37 GW, an eight-fold increase on today’s capacity, including 14 GW of commercial and industrial installations. By 2040 in this scenario, around half of all residential buildings would have rooftop solar, and 18% of generation would occur ‘behind the meter’ (around 50 TWh)18. By 2050, solar penetration could be approaching 100% of suitable rooftops. New technology breakthroughs could further accelerate this uptake.
Energy storage and electric vehiclesEnergy storage technologies, such as lithium-ion batteries can help to resolve the intermittency of some renewable technologies (such as solar or wind, which are only produced when the sun is shining or the wind is blowing), by enabling energy production to be stored until it is needed later. Energy storage installed at the household or local-grid levels can allow distributed solar generation to be stored and used during nights or other peak-demand times. The Climate Council estimates that battery storage can almost double a household’s self-consumption of solar PV (i.e. by installing a 4 kWh battery with a 5 kW solar system, a household can increase its consumption of self-generated solar power from around 30 to 60%)19.
Home energy battery storage is not considered to be economically viable for most customers at current technology prices, however, costs have been falling rapidly and are expected to continue to do so as production volumes increase – with projections showing the technology may become economically viable during the 2020s. From this time, battery storage is expected to grow quickly, including in Australia where it can be paired with high solar penetration rates. Bloomberg New Energy Finance predicts that by 2040 Australian energy storage capacity could reach 33 GWh, with the majority installed in residential properties. According to these estimates, it may be economically viable for households to install up to 10 kWh of storage with rooftop solar by the early 2020s18.
The falling technology costs of battery storage are also expected to reduce the costs of electric vehicles, making them cost-competitive with conventional petroleum-fuelled vehicles, and leading to accelerated uptake. A range of electric vehicles are already available to consumers, and while adoption rates are currently very low, uptake is expected to grow. Energeia estimates that by 2035 Australia could have four million electric vehicles, representing 22% of the passenger vehicle fleet20 - which could increase electricity demand by around 10 TWh, or about 5%. In addition to reducing greenhouse gas emissions, electric vehicles can also reduce Australia’s growing reliance upon imported petroleum fuels, increasing national energy security and terms of trade, and boosting domestic economic growth and jobs creation. ClimateWorks suggests that under a deep decarbonisation scenario, demand for electricity across Australia may increase by 143% to 2050, primarily due to electrification - where emissive energy combustion in a range of sectors such as transport, would be replaced with low-emissions electricity21.
ENERGY CUSTOMERS OF THE FUTURE

1 1
Home energy management and local energy tradingDistributed energy technologies and the integration of information and communication technologies are opening up new possibilities in home energy monitoring and management, and are facilitating new opportunities for local communities to share and trade energy. The installation of digital meters, and the emergence of ‘smart’ household appliances that can be operated remotely are providing greater control of energy consumption, including through home automation, and can also facilitate greater demand response, allowing customers to more actively participate in energy markets.
In future, energy markets may become multi-directional, with customers making choices about how and when they produce, use, store and trade energy with each other based on dynamic market signals. Within local ‘microgrids’, community solar and storage resources may be shared or traded using peer-to-peer platforms.
During FY2016, AGL has partnered with research institutions, networks and technology providers to trial new technologies and product offerings, including demand response using ‘smart’ air conditioners, and ‘virtual net metering’ which allows solar generation to be produced and consumed at different locations. In 2016 AGL also invested in a minority stake in Sunverge Energy, a leading American energy storage and management company. These investments enhance our business’ capability in energy storage and related services, and as technology availability and uptake increase, will inform AGL’s development of new product offerings.
Digital services As populations grow wealthier, the proportion of consumer spending on services and experiences (as opposed to products) is expected to rise. CSIRO predicts that in the future, consumers will increasingly expect personalised services that meet their unique needs, while still being delivered to the population en masse. Income growth will provide higher levels of discretionary expenditure for experiences and services, with on-demand and instant delivery taken for granted. Consumers may also increasingly seek ethical and other ‘feel good’ outcomes from their purchases22.
These forecasts may be equally true for energy customers, in which case suppliers of energy products and services would need to provide a personalised offering, combining different technological options to suit individual circumstances, to maximise the convenience, comfort and control for customers. Environmental and social issues may become more relevant, and customers could increasingly expect their energy
supplies to be sustainable, as well as affordable, reliable and tailored to their lives and personal preferences. Organising and analysing data to better understand the needs of customers, and using these insights to develop innovative products, will be key to maintaining a competitive advantage.
A significant challenge in maintaining customer relevance and trust will be ensuring that the use of data reflects community expectations about personal privacy, and protecting customer information from cyber-attacks and security breaches. Globally, cyber-attacks on businesses are already increasing, with the PricewaterhouseCoopers survey of global state information security finding that the frequency of detection of data breaches against retail and consumer products companies increased by 154% in 2015 compared to the previous year23.
AGL has begun to prepare for this future by investing in market leading digital innovations, such as the AGL mobile app. Using the app, customers can track energy usage based on data sourced from their home’s digital meter, in near real-time. Usage can be broken down for comparison by day, week, month or year, and alerts can be set based on projected final bill values. Customers can better track and understand their energy costs, and if desired, change their usage patterns ahead of time to reduce their bill. The app also features AGL’s Solar Command service, which monitors the output from rooftop solar systems in real time, and which uses proprietary algorithms to conduct a solar health diagnostic to assess whether solar systems are working optimally, and provide notifications if systems are underperforming. A recent survey by CHOICE found that a quarter of installed systems have experienced failures or underperformance24.
The My AGL IQ service allows customers to track their usage and compare the energy performance of their home to similar homes in the local area, and to set and track goals to reduce energy usage with tips and advice tailored to their household circumstances.
As well as developing new online portals and communication channels, with the introduction of AGL Anytime, customers can now telephone AGL contact centres 24 hours a day, 7 days a week, at whatever time is convenient for them.

1 2 AUSTRALIA’S ECONOMIC TRANSFORMATION
2.4 IMPLICATIONS FOR ENERGY USAGEChanging household demographics and technological advancements have implications for the ways customers use energy in their homes. Today, different family types use different volumes of energy, and at different times, reflecting the number of people living in the home, and their lifestyle patterns – for example, whether one or both adults in a two parent family work on weekdays. Figure 6 shows average weekday electricity ‘load profiles’ for working couples without children, working parents with children, families with a stay-at-home parent, and pensioners and other concession holders.
Households where one or more people are typically at home tend to have less ‘peaky’ demand patterns in the mornings and evenings, and more consistent consumption throughout the day. Households where all residents typically leave the home (e.g. for employment) exhibit reasonably high demand early in the morning and in the evening, as residents prepare for work, and return home, but with lower demand during the day. Households with children, on average, consume more energy than the average, while pensioners and families without children consume less.
ENERGY CUSTOMERS OF THE FUTURE
12am 12am6am 12pm 6pm
Aver
age
hous
ehol
d lo
ad (
kW)
Overall average (4.2 MWh p.a.)Working couple no kids (3.7 MWh p.a.) Working parents with kids (5.0 MWh p.a.)
Overall average (4.2 MWh p.a.)
0.5
1.0
1.5
2.0
2.5
12am 12am6am 12pm 6pm
Figure 6 : Weekday electricity usage by di�erent household types
12am
Overall average (4.2 MWh p.a.)Family, parent at home (5.7 MWh p.a.) Concession & pensioners (3.6 MWh p.a.)
Overall average (4.2 MWh p.a.)
12am12am 6am 12pm 6pm
Aver
age
hous
ehol
d lo
ad (k
W)
0.5
1.0
1.5
2.0
2.5
12am 6am 12pm 6pm
Figure 6: Weekday electricity usage by different household types
Source: Simshauser, P. and Downer, D. (2016) On the Inequity of Flat-rate Electricity Tariffs, The Energy Journal, Vol. 37, No. 3. Based on Victorian households

1 3
By 2050, as the population ages, there is expected to be a greater proportion of couple and lone person households. Older workers are expected to remain in the workforce at greater numbers than today, however, they may work fewer hours, and more flexibly than the standard nine-to-five working week. Higher participation rates for women of all age groups may result in a lower proportion of households with stay-at-home parents – or greater flexibility of working hours and increased telecommuting may smooth out some of the current peakiness in energy demand in family households, which arises from standard working hours. Figure 7 shows how changes to technology adoption, work and lifestyle patterns and energy efficiency may change the average demand profile in future for households with children.
Couples and singles may be more likely to reside in apartments or other smaller homes, with less opportunity to install rooftop solar (due to size constraints). These household types may therefore access distributed generation via local community projects, or by using energy trading platforms to purchase excess generation from neighbours.
Across all household types, energy efficient building construction and appliances may reduce average consumption over time, while the adoption of new appliances, particularly electric vehicles may (partially or completely) offset this effect. Home energy management tools may also be employed to spread demand across the day, to reduce demand peaks, improving the utilisation rate of generation and network infrastructure, and reducing the need for new investment in capacity.
Based on: Victorian consumption patterns and solar output for ‘average’ weekdays
Figure 7: Potential changes to home energy use patterns for families with children
12AM 2AM 4AM 6AM 8AM 10AM 12PM 2PM 4PM 8PM 10PM
Current average family household 2050 family household 2050 family household with solar
Indi
cativ
e lo
ad p
rofil
e sh
ape
Figure 7: Potential changes to home energy use patterns for families with children
Net production of energyfrom the home
Changes to work and lifestyle patterns and home energy management tools
reduce peakiness of demand
Improvements in building design and
energy e�ciency reduce overall demand
Potential for battery storage to store excess
solar production for later use
6PM4PM8AM

1 4 AUSTRALIA’S ECONOMIC TRANSFORMATION
Energy hardshipCustomers participating in AGL’s hardship program currently consume an average of 40% more electricity than average households in the broader population, leading to higher bills that are often above their ongoing capacity to pay. It has been estimated that for households in the lowest quintile income bracket, electricity bills can represent 6 to 7% of disposable income25. These households often live in poor-quality or rental housing, have older and less efficient appliances, and do not have access to new technologies (such as solar or energy storage) that can help to reduce bills. Over time, investments in capital-intensive energy technologies and housing efficiency improvements may not be evenly distributed amongst the population, and households experiencing financial hardship may not benefit to the same extent as the average population, causing them to fall further behind.
Demographic research has shown that households within the ‘family formation’ cohort (families with children with the head of household aged 30 to 49) are over represented within AGL’s energy hardship program. These households typically have high energy consumption and lower income per person within the family (as there are more people within the home, and parents undertake child rearing as well as paid work)26. As the nature of work shifts over time, with workers changing jobs more often and with some jobs potentially becoming less secure, income fluctuations may place more households at risk of energy hardship.
A shared responsibility approach to vulnerable customers is required, whereby governments, industry and the community sector work together to target the root causes and address the consequences of financial hardship.
In the energy sector, reform of the energy concessions framework may be required to ensure that it is fit for purpose – with eligibility based on need, providing an adequate level of support, and be easily accessible by those who need it. For example, concessions eligibility based only on customers’ age may not be well-targeted or economically sustainable as the population ages.
Products and services that help customers better manage their energy costs may also help to reduce hardship. For example, digital meters allow more frequent and accurate bills to be issued, in amounts that are more manageable. Energy monitoring tools, such as the AGL mobile app, allow customers to track their energy use and costs to reduce ‘bill shock’, and new financing arrangements for solar (such as power-purchase-agreement models) allow customers to install systems that provide cheaper energy with no upfront costs. Co-investments in social and rental housing to improve energy efficiency can also help to reduce ongoing consumption and bills.
In future, a growing proportion of the ageing population are likely to derive their income from pensions or superannuation (rather than employment). With relatively fixed incomes, these customers may not easily cope with rising energy costs, and may choose to make up-front investments in technologies like solar PV and energy storage to ‘fix’ their energy costs to insulate themselves from the volatility of grid-based energy prices. Other consumers may prefer energy contracts that are pre-paid, or have fixed monthly bills, to keep energy costs under control. As tariffs shift to reflect the heavy fixed costs of capacity, it will also be important to provide customers with tools and options to minimise their peak consumption, as well as total use.
ENERGY CUSTOMERS OF THE FUTURE
1 5
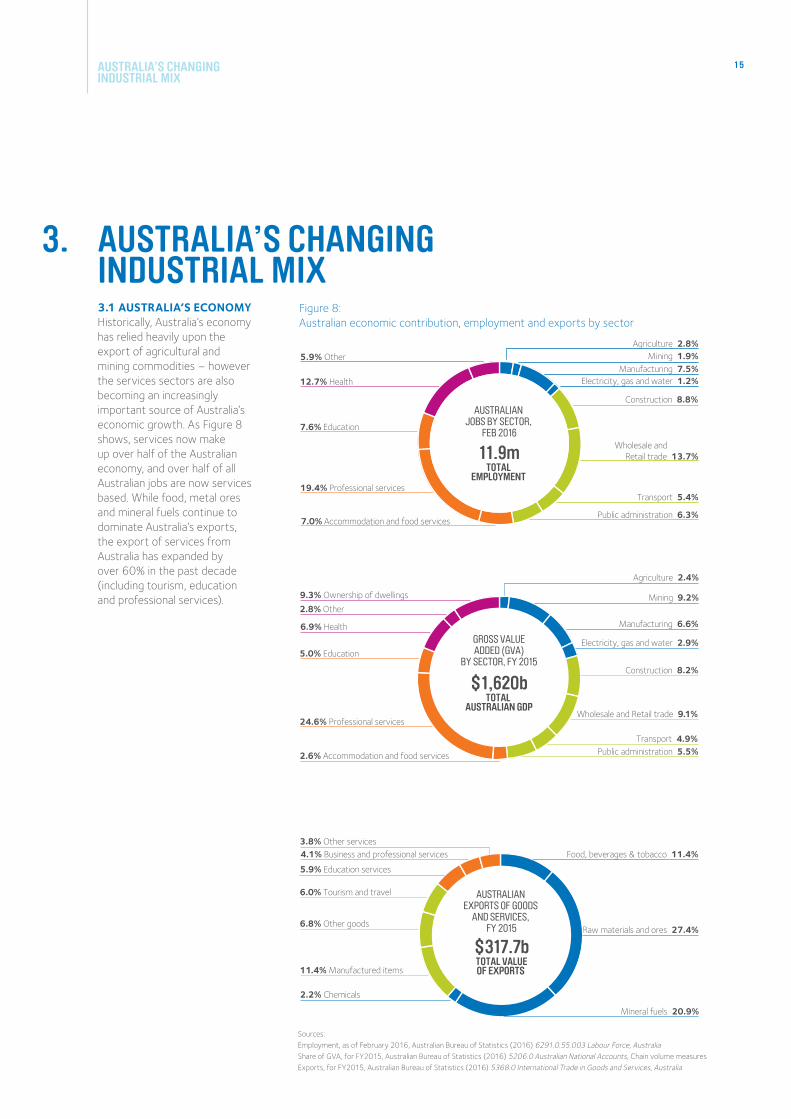
3.1 AUSTRALIA’S ECONOMYHistorically, Australia’s economy has relied heavily upon the export of agricultural and mining commodities – however the services sectors are also becoming an increasingly important source of Australia’s economic growth. As Figure 8 shows, services now make up over half of the Australian economy, and over half of all Australian jobs are now services based. While food, metal ores and mineral fuels continue to dominate Australia’s exports, the export of services from Australia has expanded by over 60% in the past decade (including tourism, education and professional services).
AUSTRALIA’S CHANGING INDUSTRIAL MIX
AUSTRALIA’S CHANGING INDUSTRIAL MIX
3.
Sources:Employment, as of February 2016, Australian Bureau of Statistics (2016) 6291.0.55.003 Labour Force, AustraliaShare of GVA, for FY2015, Australian Bureau of Statistics (2016) 5206.0 Australian National Accounts, Chain volume measuresExports, for FY2015, Australian Bureau of Statistics (2016) 5368.0 International Trade in Goods and Services, Australia
Agriculture 2.8%5.9% Other
12.7% Health
7.6% Education
19.4% Professional services
Mining 1.9%Manufacturing 7.5%
Electricity, gas and water 1.2%
Construction 8.8%
Wholesale and Retail trade 13.7%
Transport 5.4%
Public administration 6.3%7.0% Accommodation and food services
Figure 8 : Australian economic contribution, employment and exports by sector
AUSTRALIAN EMPLOYMENT
BY SECTOR, FEB 2016
AUSTRALIAN JOBS BY SECTOR,
FEB 2016
11.9mTOTAL
EMPLOYMENT
Figure 8: Australian economic contribution, employment and exports by sector
Food, beverages & tobacco 11.4%
Raw materials and ores 27.4%
Mineral fuels 20.9%
2.2% Chemicals
11.4% Manufactured items
6.8% Other goods
6.0% Tourism and travel
5.9% Education services
4.1% Business and professional services 3.8% Other services
Figure 8 : Australian economic contribution, employment and exports by sector
AUSTRALIAN EXPORTS OF GOODS
AND SERVICES, FY 2015
$317.7bTOTAL VALUEOF EXPORTS
2.8% Other
9.3% Ownership of dwellings
6.9% Health
5.0% Education
24.6% Professional services
Mining 9.2%
Manufacturing 6.6%
Electricity, gas and water 2.9%
Construction 8.2%
Wholesale and Retail trade 9.1%
Transport 4.9%Public administration 5.5%2.6% Accommodation and food services
Agriculture 2.4%
Figure 8 : Australian economic contribution, employment and exports by sector
GROSS VALUEADDED (GVA)
BY SECTOR, FY 2015
$1,620bTOTAL
AUSTRALIAN GDP
1 6 AUSTRALIA’S ECONOMIC TRANSFORMATION
Macroeconomic challengesCommonwealth Treasury forecasts show a growing gap between government revenues and expenses over the coming decades. The ageing population will increase demand for services, particularly health, and other non-demographic factors, including higher incomes, wages and technological advancements, are also increasing the costs of providing government services. If these trends continue, the cost of service delivery by the Australian Commonwealth and State Governments may outpace government revenue collection and economic growth. Over the coming decades, average growth in real Gross Domestic Product is forecast to be 2.8%, while real Commonwealth government expenditure is forecast to grow by an average of 3.1% per annum (based on currently legislated policies)6. The NSW government estimates that its revenue will grow by 4.7% annually, while expenditure will grow by 5.3% (nominal values)4.
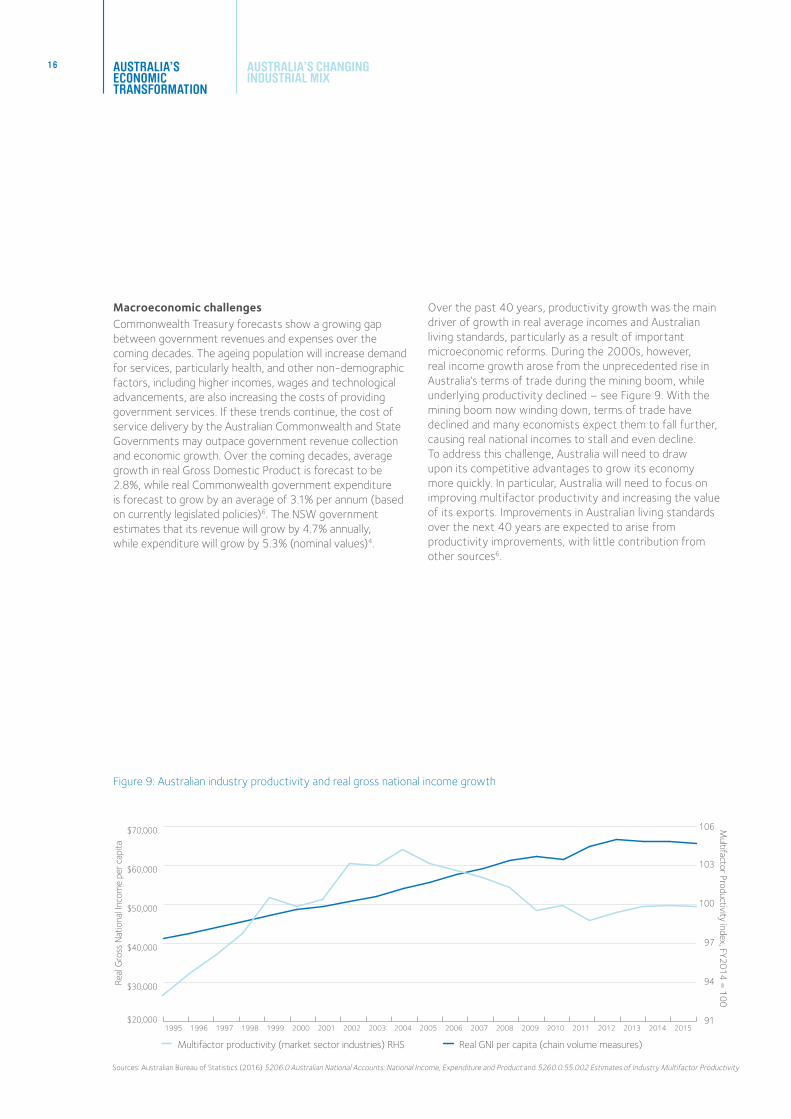
Over the past 40 years, productivity growth was the main driver of growth in real average incomes and Australian living standards, particularly as a result of important microeconomic reforms. During the 2000s, however, real income growth arose from the unprecedented rise in Australia’s terms of trade during the mining boom, while underlying productivity declined – see Figure 9. With the mining boom now winding down, terms of trade have declined and many economists expect them to fall further, causing real national incomes to stall and even decline. To address this challenge, Australia will need to draw upon its competitive advantages to grow its economy more quickly. In particular, Australia will need to focus on improving multifactor productivity and increasing the value of its exports. Improvements in Australian living standards over the next 40 years are expected to arise from productivity improvements, with little contribution from other sources6.
AUSTRALIA’S CHANGING INDUSTRIAL MIX
Sources: Australian Bureau of Statistics (2016) 5206.0 Australian National Accounts: National Income, Expenditure and Product and 5260.0.55.002 Estimates of Industry Multifactor Productivity
Multifactor productivity (market sector industries) RHS Real GNI per capita (chain volume measures)
1995 1996 1997 1998 1999 2000 2001 2002 2003 2004 2005 2006 2007 2008 2009 2010 2011 2012 2013 2014 2015
Real
Gro
ss N
atio
nal I
ncom
e pe
r cap
ita
Multifactor Productivity index, FY2014 = 100
Figure 9: Australian industry productivity and real gross national income growth
$20,000
$30,000
$40,000
$50,000
$60,000
$70,000
91
94
97
100
103
106
Figure 9: Australian industry productivity and real gross national income growth

1 7
Industries where Australia can prosperThere are many industry sectors where global opportunities and Australian advantages overlap. In its assessment of where Australia’s future prosperity may come from, Deloitte has identified that whereas mining represents the ‘current wave’ of Australian prosperity, a new set of ‘fantastic five’ industry sectors have the potential to meet and exceed the current contribution of mining to the Australian economy in the short to medium term – agribusiness, gas, tourism, international education and wealth management. Beyond these, the ‘next wave’ of industries driving Australian prosperity are likely to be largely knowledge and services based, and may include information technology, finance, research and development of new technologies (potentially including clean coal and next-gen solar), medical research, food processing, aged care, community care, health and wellness, retirement living and leisure, logistics, skills and education27. These industries are reasonably well aligned to areas where Australia currently enjoys a productivity advantage relative to other global players (Figure 10).
For the remainder of this report, we consider how changes to some of Australia’s most significant industrial sectors may contribute to economic conditions, and demand for energy and related services. The range of energy products and services that AGL offers to our commercial and industrial customers is evolving to meet their changing requirements, and productivity improvements may be achieved through the application of energy efficiency, renewable energy and energy management at commercial scale.
Source: Australian Trade Commission Why Australia Benchmark report 2016, based on Deloitte Access Economics analysis 2015Note: A score of 110 means Australia is 10% more productive than the average productivity of global competitors in the industry
150%
125%
100%
75%
50%
25%
0%
Prod
uctiv
ity In
dex
Man
ufac
turin
g
Reta
il an
dW
hole
sale
Tran
spor
t an
d lo
gist
ics
Wat
er a
ndW
aste
ser
vice
s
Busi
ness
and
prop
erty
ser
vice
s
ICT
Med
ia
Tele
com
mun
icat
ions
Bank
ing
Wea
lth
Publ
ic A
dmin
istr
atio
n
Con
stru
ctio
n
Inte
rnat
iona
l E
duca
tion
Oth
er E
duca
tion
and
Tra
inin
g
Gas
75 8090
96 98
105 105 105 105 105116 119 120 122 122 124 127 127
142 146
Oil
Tour
ism
Hea
lth
Min
ing
Agrib
usin
ess
Figure 10: Productivity of Australian industry sectors compared with global competitors
With the mining boom winding down, raising
Australian living standards into the future will require a sustained improvement
in our economy’s multifactor productivity
– which can be achieved by capitalising upon
Australia’s competitive advantages.

1 8 AUSTRALIA’S ECONOMIC TRANSFORMATION
3.2 CASE STUDY: FOOD AND AGRIBUSINESS
Food and Agribusiness Overview
Current Importance to Australian economy to 2050
Employment 516,000 jobsas of February 2016, or around 4% of all employed persons in Australia.
Includes agriculture, aquiculture, fishing, food product manufacturing, and support services.
Around the same
Employment is expected to remain at similar levels – growth in production may be offset by improvements in labour productivity including technological improvement.
Share of economy $56.8 billionGVA in 2015, or 4% of Australian GDP.
Includes agriculture, forestry, fishing and the manufacture of food, beverage and tobacco products.
Growing to ~$89.3 billion
CSIRO projects that agricultural prices will trend upwards and that Australian agricultural output will increase by at least 50% by 205028.
Australian Bureau of Agricultural and Resource Economics (ABARES) forecasts real growth of 1.3% per annum to 205029, which would see an increase in real GVA of 55% to $89.3 billion.
IBISWorld estimates that by 2050 agriculture will represent 3.7% of the Australian economy, up from 2.2% in 20118.
Value of exports $36.1 billion
Value of exports in FY2015, or 11% of Australian goods and services exports.
Includes food, live animals, beverages and oils.
Growing to ~$75 billion
ABARES forecasts real growth of 2.1% per annum to 2050, in which case, the real value of agribusiness exports would more than double to $75 billion.
Opportunity and challengesAustralia is a provider of high-quality agricultural produce, so global growth in populations and rising incomes, particularly in Asia, represent a significant opportunity for Australian agribusiness. Demand for food is expected to increase by 77% to 2050, with Asia expected to account for 70% of this growth, and 60% of total demand. By 2030, two thirds of all middle income consumers globally may live in the Asian region30, and much of this growth will come from China.
Australia is well-placed to meet some of this demand, with agriculture estimated to be amongst Australia’s most internationally competitive sectors (with productivity 46% higher than the average productivity of global competitors (see figure 10)), and its geographical proximity to demand centres will reduce transport costs for exporting to Asia.
AUSTRALIA’S CHANGING INDUSTRIAL MIX

1 9
As demand for food rises over the coming decades, agricultural export prices are likely to trend upwards, reversing a long historical decline. ABARES projects that the real value of Australian food exports will increase by an average of 2.1% per annum, driven by substantial increases in the real value of exports of beef, wheat, dairy products, sheep meat and sugar – see Figure 11. China is projected to drive global import demand for beef, wheat, sheep meat and sugar, and India to account for most of the growth in demand for dairy products. With rising export values, the real value of Australian production is projected to increase at an average annual rate of 1.3%29.
In its 2015 Australian National Outlook report, CSIRO found that under certain scenarios, with high agricultural prices, new markets for products, and strong carbon abatement objectives, there could be a substantial upside for the Australian agricultural sector, with land sector incomes as high as $160 billion by 2050. Under this scenario, around a quarter of income would be derived from carbon abatement and biodiversity activities28.
While the Australian agrifood sector is currently dominated by the production and export of bulk commodities, there is significant opportunity to also develop an innovative and consumer-focused food production sector to deliver high value, niche and premium products that capitalise on Australia’s reputation for high-value and safe produce. To deliver on this potential, significant investment will be required to ensure that the sector has the necessary technology, capacity, and human and financial capital. It has been estimated that as much as A$1 trillion of investment will be needed by 2050 in the sector30.
Another challenge is that agriculture has a workforce that is considerably older than other sectors. In 2011, the median age of Australian farmers was 53 years compared to 40 years for other occupations. This is partly due to farmers continuing to work beyond typical retirement age, with 23% farmers aged over 65 (compared to 3% for other occupations)31. Deloitte has reported that Australian farming is on the verge of a workforce crisis, with insufficient agricultural workers to replace those who will leave the industry32.
Meat and fish Dairy Cereals Fruit and Vegetables Sugar Other
Historical Projection
1990 1995 2000 2005 2010 2015 2020 2025 2030 2035 2040 2045 2050
Valu
e of
Aus
tral
ian
Agrif
ood
expo
rts
($m
illion
s)
Figure 11: Australian agrifood exports: historical and projections to 2050
10,000
20,000
30,000
40,000
50,000
60,000
70,000
Derived from: ABARES (2012) Food demand to 2050: Opportunities for Australian agriculture and Australian Bureau of Statistics (2016) 5368.0 International Trade in Goods and Services, Australia
Figure 11: Australian agrifood exports: historical and projections to 2050

2 0 AUSTRALIA’S ECONOMIC TRANSFORMATION
Energy use in the food and agribusiness sectorIn 2014, Australia’s agriculture and food manufacturing sectors consumed 253 petajoules (PJ) of energy, or around 4% of Australia’s total consumption. Agricultural energy consumption is dominated by the use of diesel for farm vehicles and equipment, while food manufacturing consumes significant biomass (bagasse), natural gas and electricity, as well as small amounts of coal and petroleum fuels (Figure 12).
The energy productivity of the Australian agrifood sector is currently $226 million GVA per PJ of net energy consumption, a figure which has increased by 26% in real terms since 1990. Based on estimates from the National Energy Productivity Plan, 52 PJ of cost effective energy efficiencies within the sector could be achieved by 203033, reducing input costs and energy-related greenhouse gas emissions. These results indicate that this sector may be a significant market for energy management services, as farmers and food manufacturers seek to improve their efficiency.
Figure 12 presents historical energy consumption in the sector, as well as projections for future energy use under three scenarios: a ‘business as usual’ scenario based on Bureau of Resources Economics (BREE) estimates34, a scenario where cost effective energy efficiency measures are periodically implemented to 2030 (with the underlying energy productivity trend projected to 2050), and a scenario whereby the sector achieves a 40% improvement in its
energy productivity by 2030, in line with the Commonwealth Government’s objectives (with the trend also projected to 2050). The latter may reflect the requirements for deep reductions in greenhouse gas emissions within the sector over the longer term. By 2050, the difference is substantial, at over 100 PJ between the highest and lowest scenario.
Modern and emerging energy technologies may offer new opportunities for the agrifood business to reduce energy costs, improve efficiency and increase reliability of supply, particularly in remote areas. The electrification of vehicles and equipment, and the use of natural gas vehicles can help to increase efficiency and reduce greenhouse gas emissions (particularly if use is optimized with automation or advanced robotics). Distributed resources including solar PV, energy storage and energy management tools may also offer power backup at times of grid outages.
In 2016, AGL signed a cooperation agreement with peak industry body Dairy Connect to develop energy solutions to cut costs and improve environmental sustainability for dairy farmers, including through the use of energy monitoring with digital metering and renewable energy installations. This is one example of how partnerships and new technologies may deliver better energy solutions for the food and agribusinesses sector in the future.
Coal Petroleum products Natural gas Electricity Solid biofuels
1990 1995 2000 2005 2010
Ener
gy c
onsu
mpt
ion
(PJ)
Figure 12: Agrifood historic energy consumption and scenarios to 2050
50
100
150
200
250
300
350
400
2015 2020 2025 2030 2035 2040 2045 2050
Opportunities for energy e�ciency services
Opportunities for Carbon abatement
Business as usual projection 40% improvement in energy productivity Cost-e�ective e�ciencies implemented
Sources: Historical energy consumption data sourced from Department of Industry and Science (2015) Australian energy statistics Table F1. Business as usual projections based on BREE (2014) Australian Energy Projections to 2049-50. Efficiency and productivity pathways based on Commonwealth Government (2015) National Energy Productivity Plan 2015 – 2030: Boosting competitiveness, managing costs and reducing emissions, pro-rated based on food manufacturing’s share of total manufacturing energy use.
Figure 12: Agrifood historic energy consumption and scenarios to 2050
AUSTRALIA’S CHANGING INDUSTRIAL MIX

2 1
3.3 CASE STUDY: MINING AND RESOURCES
Mining and Resources Overview
Current Importance to Australian economy to 2050
Employment 322,000 jobsas of February 2016, or around 3% of all employed persons in Australia.
Includes mining, manufacturing of metals, and manufacturing of non-metal minerals.
Shrinking
As the mining investment boom winds down, jobs that were created in the construction of new mines and production capacity may not be required during their operation.
By 2050 growth in production volumes and export values may be offset by labour productivity growth, such as through the use of automation and robotics, resulting in employment levels slightly below where they are today.
Share of economy $161.2 billion
GVA in FY2015, or 10% of Australian GDP.
Includes mining, manufacturing of metals, and manufacturing of non-metal minerals.
Shrinking as a share of Australia’s GDP
IBISWorld estimates mining will shrink from 7.3% of the Australian economy in 2011 to 4.4% in 20508.
This would result in average real growth in GVA for mining and resources of up to 1.2% per annum, to around $200-$250 billion in 2050.
Value of exports $157.6 billion
Value of exports in FY2015, or 50% of Australian goods and services exports.
Includes exports of metal ores, coal, petroleum, natural gas, iron, steel and other metal and mineral manufactures.
Growing to over $300 billion
Despite lower commodity prices, Australia is forecast to export higher volumes of key commodities. By 2030, export volumes of iron ore, metallurgical coal and gas may double or more.
By 2050, the value of Australian resource exports could double to over $300 billion*.
* Volumes and prices of key commodities derived from Treasury Working Paper 2014-01, and assumptions from Australia’s 2015 Intergenerational Report were used to extrapolate results to 2050.

2 2 AUSTRALIA’S ECONOMIC TRANSFORMATION
Opportunity and challengesDespite a winding down of the recent mining investment boom, Australia is well positioned to continue to be a major global exporter of minerals and energy resources and products, due to its world class deposits and its proximity to growing Asian demand centres. Over the past decade, the value of Australia’s mining and resource exports have more than doubled to $157.6 billion in 2015 with the majority of these exports going to Asian countries including China, Japan and South Korea7. Substantial mining investment during the boom period has resulted in record export volumes, and mining and energy resources make up around half of all of Australia’s exports of goods and services.
Table 1 shows how Australia ranks globally in terms of commodity resources and production – appearing in the top few countries for several minerals that are projected to experience significant global demand growth in the coming decades, particularly in Asian markets. Demand for minerals tends to increase as populations grow and become wealthier and more urbanised - the intensity of commodity use typically accelerates as an economy starts to develop and invest in infrastructure and manufacturing capacity. Additionally, Australia has significant potential to deliver key commodities that may play critical roles in a high-tech future, including rare earth elements, platinum group elements, cobalt, nickel, chromium, zirconium and copper21.
Based on global demand and supply models, the Australian Government projects that over the long-run, the real prices received for Australia’s key commodity exports are likely to remain elevated compared with prices received in the early 2000s (but lower than the peaks during the mining boom).
This suggests that Australia’s long-run terms of trade may settle at the level observed in 2006 by 20206. However, the outlook for commodity consumption is increasingly uncertain, with economic growth in China slowing and emerging economies showing signs of weakness35.
Australia is a net exporter of energy, and in 2014, exports accounted for 84% of total energy production (on an energy basis). Importantly, Australia exports 85% of its coal production, a figure that BREE forecasts could increase to 90% by 2050. In 2013, the value of energy exports to the Australian economy was over $66 billion, or 21% of all Australian exports – with over half from coal. The value of gas exports is expected to rise in coming decades, with growing global demand and recent Australian investments in new gas production and LNG terminals. The Commonwealth Treasury estimates that the long-term growth rate in Australian LNG export volumes is 2.8% per annum (which would see export volumes almost triple to 2050, in energy terms)36.
However, future demand for Australia’s energy exports is also uncertain. Global demand for coal and gas may depend on international climate change and energy market policies, as nations balance growing demand for energy (particularly in developing nations) with climate change mitigation. Nevertheless, ClimateWorks has estimated that Australian mining can grow substantially, even under a scenario of deep decarbonisation by 2050. Although coal and oil mining would contract by 60% and 30% respectively, the mining of gas, iron ore and other resources could grow substantially, by up to 368% relative to 2012, and the manufacturing of metals could also grow by up to 99%21.
Source: Commonwealth of Australia (2015) Australia’s identified mineral resources 2015, Geoscience Australia* Deloitte Access Economics, as quoted in Deloitte Touche Tohmatsu (2014) Positioning for prosperity? Catching the next wave
Table 1: Australian commodity rankings
AUSTRALIA’S CHANGING INDUSTRIAL MIX
Commodity
Projected global demand growth between
2010 and 2033*
Australian reserves (Economic Demonstrated Resource)
Million tonnesWorld ranking -
Reserves
Australian mine production 2014
Million tonnesWorld ranking -
production
Iron ore 80.5% 54,412 1 735 2
Zinc 73.9% 62.57 1 1.56 2
Nickel 42.2% 19.0 1 0.246 3
Aluminium (Bauxite) 70.4% 6195 2 78.6 1
Copper 63.5% 88.48 2 0.97 6
Lead 78.2% 34.72 1 0.73 2
Gold not estimated 0.009 1 0.0003 2
Uranium not estimated 1.2 1 0.005 3
Coal (black) 56.8% 62,623 4 565 4
2 3
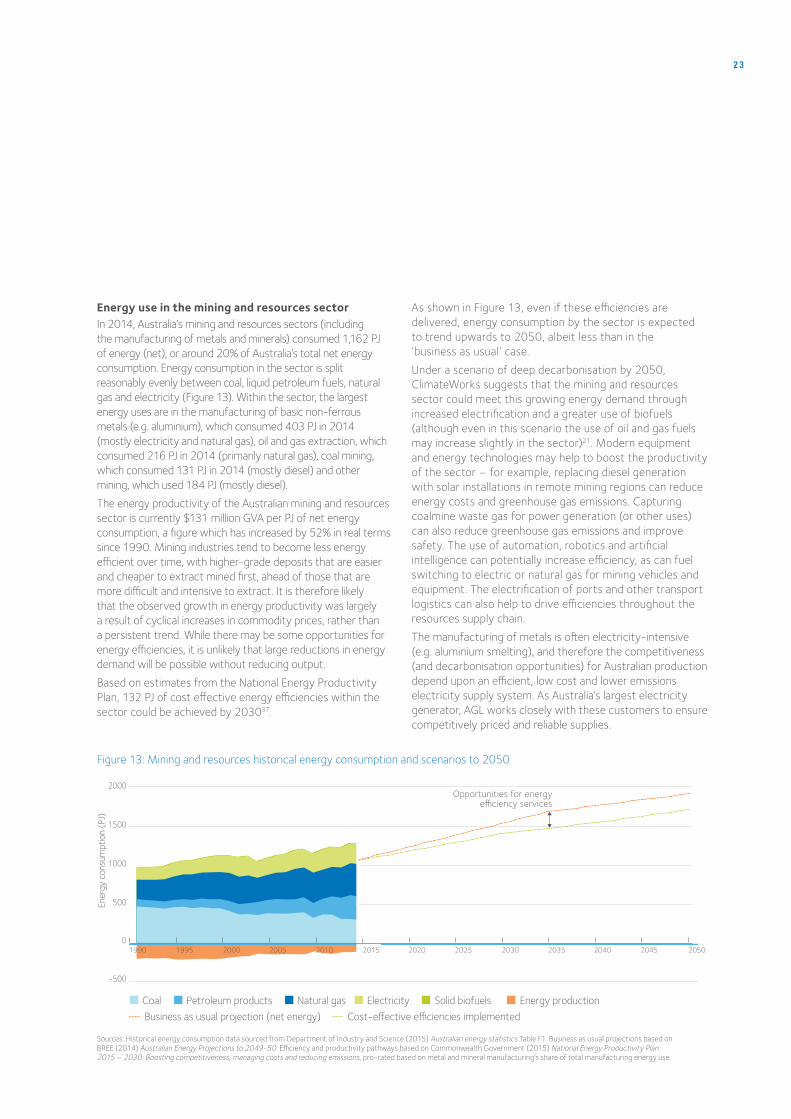
Energy use in the mining and resources sectorIn 2014, Australia’s mining and resources sectors (including the manufacturing of metals and minerals) consumed 1,162 PJ of energy (net), or around 20% of Australia’s total net energy consumption. Energy consumption in the sector is split reasonably evenly between coal, liquid petroleum fuels, natural gas and electricity (Figure 13). Within the sector, the largest energy uses are in the manufacturing of basic non-ferrous metals (e.g. aluminium), which consumed 403 PJ in 2014 (mostly electricity and natural gas), oil and gas extraction, which consumed 216 PJ in 2014 (primarily natural gas), coal mining, which consumed 131 PJ in 2014 (mostly diesel) and other mining, which used 184 PJ (mostly diesel).
The energy productivity of the Australian mining and resources sector is currently $131 million GVA per PJ of net energy consumption, a figure which has increased by 52% in real terms since 1990. Mining industries tend to become less energy efficient over time, with higher-grade deposits that are easier and cheaper to extract mined first, ahead of those that are more difficult and intensive to extract. It is therefore likely that the observed growth in energy productivity was largely a result of cyclical increases in commodity prices, rather than a persistent trend. While there may be some opportunities for energy efficiencies, it is unlikely that large reductions in energy demand will be possible without reducing output.
Based on estimates from the National Energy Productivity Plan, 132 PJ of cost effective energy efficiencies within the sector could be achieved by 203037.
As shown in Figure 13, even if these efficiencies are delivered, energy consumption by the sector is expected to trend upwards to 2050, albeit less than in the ‘business as usual’ case.
Under a scenario of deep decarbonisation by 2050, ClimateWorks suggests that the mining and resources sector could meet this growing energy demand through increased electrification and a greater use of biofuels (although even in this scenario the use of oil and gas fuels may increase slightly in the sector)21. Modern equipment and energy technologies may help to boost the productivity of the sector – for example, replacing diesel generation with solar installations in remote mining regions can reduce energy costs and greenhouse gas emissions. Capturing coalmine waste gas for power generation (or other uses) can also reduce greenhouse gas emissions and improve safety. The use of automation, robotics and artificial intelligence can potentially increase efficiency, as can fuel switching to electric or natural gas for mining vehicles and equipment. The electrification of ports and other transport logistics can also help to drive efficiencies throughout the resources supply chain.
The manufacturing of metals is often electricity-intensive (e.g. aluminium smelting), and therefore the competitiveness (and decarbonisation opportunities) for Australian production depend upon an efficient, low cost and lower emissions electricity supply system. As Australia’s largest electricity generator, AGL works closely with these customers to ensure competitively priced and reliable supplies.
Coal Petroleum products Natural gas Electricity Solid biofuels Energy production
Business as usual projection (net energy) Cost-e�ective e�ciencies implemented
1990 1995 2000 2005 2010
Ener
gy c
onsu
mpt
ion
(PJ)
Figure 13: Mining and resources historical energy consumption and scenarios to 2050
-500
0
500
1000
1500
2000
2015 2020 2025 2030 2035 2040 2045 2050
Opportunities for energy e�ciency services
Sources: Historical energy consumption data sourced from Department of Industry and Science (2015) Australian energy statistics Table F1. Business as usual projections based on BREE (2014) Australian Energy Projections to 2049-50. Efficiency and productivity pathways based on Commonwealth Government (2015) National Energy Productivity Plan 2015 – 2030: Boosting competitiveness, managing costs and reducing emissions, pro-rated based on metal and mineral manufacturing’s share of total manufacturing energy use.
Figure 13: Mining and resources historical energy consumption and scenarios to 2050
Table 1: Australian commodity rankings
2 4 AUSTRALIA’S ECONOMIC TRANSFORMATION
3.4 CASE STUDY: SERVICES
Services Sector Overview
Current Importance to Australian economy to 2050
Employment 6.3 million jobsas of February 2016, or around 52% of all employed persons in Australia.
Includes education, health care, accommodation and food services, business and property services, arts and recreation and other services.
Growing strongly
The NSW government estimates that almost all net job creation since the 1960s has taken place in services sectors, and that these sectors will continue to drive jobs growth to mid-century4.
Share of economy $633.4 billion
GVA in FY2015, or 39% of Australian GDP.
Includes education, health care, accommodation and food services, business and property services, arts and recreation and other services.
Growing to almost $2 trillion
As the population ages, and becomes wealthier, demand for services is expected to increase, particularly in health care. The real value of services in the Australian economy have doubled over the past two decades.
IBISWorld estimates that by 2050 these services could represent 46% of the Australian economy, growing in real terms to almost $2 trillion. Health and social assistance may become Australia’s largest industry sector (by GVA).
Value of exports $63.1 billion
Value of exports in FY2015, or 20% of Australian goods and services exports
Includes tourism, education, business services and other services.
Services are exported when they are provided in Australia for foreign recipients.
Growing
In the past two decades the value of Australia’s services exports have almost trebled, with average annual growth rates around 7%. As global populations become wealthier, particularly in Asia, demand for key export services including tourism and education is forecast to rise.
Opportunity and challengesA combination of local and global factors will shape Australia’s services sectors in the coming decades. According to CSIRO, consumer spending in recent decades has been shifting towards experiences (such as holidays and eating out) and away from durable goods, and this trend is
expected to continue, with experience-oriented spending projected to grow faster than total private consumption to 205028. Increasing wealth and an ageing population are likely to drive demand for high-quality social services, including health care and education.
AUSTRALIA’S CHANGING INDUSTRIAL MIX

2 5
Demand for business and professional services is also likely to grow, as specialist functions are outsourced by businesses and with information and communications technologies becoming increasingly important8. Demand for financial and wealth management services may rise, to support an ageing population deriving a growing share of income from retirement savings.
Services sectors face growing digital disruption as new technologies are harnessed to develop new business models. In its assessment of the top ten sectors that are vulnerable to disruption, the Global Centre for Digital Business Transformation included six service sectors in its list, including media and entertainment, financial services, telecommunications, education, hospitality and healthcare38.
Health and wellnessBy 2050, health care and social assistance is projected to become Australia’s largest sector and employer8. As Australians live longer and healthier lives, demand for health and wellness services will increase. The Australian Government predicts that real healthcare spending per person will double by mid-century6. Productivity improvements within the sector will be critical to ensuring that high-quality healthcare remains affordable and available to all Australians. Advancements may involve using information and communications technologies to deliver services remotely, using analytics to improve diagnostics, ‘personalised medicine’ (based on individual genetics, history and data), early intervention and preventative services, and general sectoral efficiencies.
Education and skillsAs economies become increasingly services-based and knowledge driven, demand for education and training will increase, both domestically and globally. Ensuring that future workforces are equipped with the right skills will be central to Australia’s global competitiveness in the long-term.
In FY2015, teaching foreign students was amongst Australia’s largest export industries, valued at almost $19 billion. Since 1995, education exports have increased eight-fold (a staggering average growth rate of 12% per annum). In 2010, Australia was the third largest provider of education to foreign students (behind the United States and the United Kingdom), holding 6.6% market share27. Education exporters benefit from Australia’s proximity to Asia, being an English-speaking nation, and Australia having a good reputation, both in terms of respected educational and research institutions, and as a safe and stable democracy with attractive lifestyle opportunities. Australia’s rich cultural diversity (as highlighted in Section 2) is also appealing to potential students. Cost-competitiveness relative to other destinations is assisted by a lower Australian dollar. A key challenge will be continuing to attract globally mobile students in this competitive marketplace.
TourismAustralia has long been a popular destination for foreign tourists. In FY2015, tourism exports were valued at over $19 billion and there were over 7 million short-term visitor arrivals in Australia, an increase of 33% relative to 2005 and more than double the level in 199539. As middle class populations, and their disposable incomes grow globally, tourism is projected to be among the world’s fastest-growing industries, with Deloitte forecasting annual growth rates of 4% per annum to the mid-2030s (more than doubling in size over the next two decades)27. Importantly for Australia, many of these new travellers will depart from Asia, particularly China. With a lower Australian dollar, a wide range of natural and man-made attractions, and a coordinated growth strategy pursued by governments and industry, Australian tourism exports are likely to continue to grow.

2 6 AUSTRALIA’S ECONOMIC TRANSFORMATION
Energy use in the services sectorIn 2014, the commercial and services sectors in Australia consumed 300 PJ of energy, or around 5% of Australia’s total net energy consumption. The energy productivity of the commercial and services sector in Australia is much higher than in more energy intensive sectors, currently standing around $2,800 million GVA per PJ of net energy consumption, a figure which has increased by 18% in real terms since 1990. Energy use in the sector is dominated by electricity, which accounts for over 70% (see Figure 14).
Based on estimates from the National Energy Productivity Plan, 104 PJ of cost effective energy efficiencies within the sector could be achieved by 203040. As Figure 14 shows, if these efficiencies are implemented, the commercial and services sectors could significantly outperform the national target to improve energy productivity by 40% in 2030. The wide gap between this scenario and ‘business as usual’ scenario indicates that commercial buildings and offices may represent a large market for future energy efficiency services.
The ‘green buildings’ sector in Australia has grown rapidly since the early 2000s, and the environmental performance of commercial buildings is now an issue of mainstream interest. Research has shown that Green Star certified buildings have lower operating costs, and greater financial returns than other buildings – with outgoings lower by an average of 1.5 %, rental values higher by 5% and sales values higher by 12%41. Green buildings and ‘smart’ infrastructure use innovative engineering and precinct planning to drive efficiencies in resource use, including energy, water and waste across the supply chain (including in the manufacture of construction materials). These buildings therefore require less energy for ventilation, air-conditioning, hot water and lighting. Similar to residential buildings, the average energy efficiency of commercial property stock in Australia will increase over time, as new builds and retrofits incorporate these green building features.
Sources: Historical energy consumption data sourced from Department of Industry and Science (2015) Australian energy statistics Table F1. Business as usual projections based on BREE (2014) Australian Energy Projections to 2049-50. Efficiency and productivity pathways based on Commonwealth Government (2015) National Energy Productivity Plan 2015 – 2030: Boosting competitiveness, managing costs and reducing emissions. Deep decarbonisation pathway based on ClimateWorks (2014) Pathways to deep decarbonisation in 2050: How Australia can prosper in a low carbon world, Technical report. Residential and commercial energy projections have been pro-rated based on current split of energy use. Figure includes energy consumption across all services sectors, wholesale trade, retail trade and pubic administration and security.
Figure 14: Commercial and services energy consumption and scenarios to 2050
1990 1995 2000 2005 2010 2020 2025 2030 2035 2040 2045 2050
Figure 14: Commercial and services energy consumption and scenarios to 2050
Ener
gy c
onsu
mpt
ion
(PJ)
50
100
150
200
250
300
350
400
450
500
Coal Petroleum products Natural Gas Electricity Solid Biofuels Solar
Business as usual projection 40% improvement in energy productivityDeep decarbonisationCost-e�ective e�ciencies implemented
2015
Opportunities for energy e�ciency services
Opportunities for carbon abatement
Opportunities for distributed generation and energy management services
AUSTRALIA’S CHANGING INDUSTRIAL MIX
2 7
A greater use of distributed generation and building energy management products could see also see these buildings meeting more of their own energy needs ‘behind the meter’. A growing proportion of electricity demand is likely to be met by embedded distributed generation – for example, Bloomberg New Energy Finance has predicted that the installation of solar at commercial premises could grow from very low in 2015 to 5 GW by 2040 (or 14% of distributed solar capacity). Under this scenario, distributed solar (across all sectors) would represent a quarter of total generation capacity, and would account for 18% of Australia’s electricity supply. ClimateWorks has found that under a 100% renewable scenario, rooftop solar could provide over 10% of a growing electricity demand by 2050.
The electrification of transport may create significant new demand for electricity, and commercial buildings may need to be fitted with vehicle charging infrastructure to accommodate the preferences of workforces. In future, these buildings may also be able to draw on two-way energy flows from this fleet of mobile energy storage devices for emergency backup, for example during power outages.
Under a scenario of deep decarbonisation by 2050, ClimateWorks suggests that emissions reductions could be achieved in the buildings sector through increased electrification and even greater uptake of energy efficiencies21.
Into the future, AGL will continue to support a strong Australian services sector with the reliable, affordable and sustainable energy supplies and services. A modern and decarbonised energy system will underpin Australia’s future ‘green’ economy, including eco- and sustainable tourism, research and innovation in science and technology, healthier and more liveable cities, and greater efficiencies in the delivery of social services – including health and education. AGL is committed to progressively decarbonising its electricity generation - by 2050, AGL will close all existing coal-fired power stations in its portfolio; we will continue to invest in new renewable energy projects; and we will make available innovative and cost-effective energy solutions for our customers, such as distributed renewable generation, battery storage, and demand management solutions.
This report has examined a range of ways that the Australian economy and community may change between 2016 and 2050, and what this may mean for the supply of, and demand for, energy.
The population is predicted to grow substantially to 37.6 million, particularly within capital cities where an additional 4.4 million households may need to be housed. A range of factors may change average household demand for energy: new buildings and electrical appliances are likely to become more energy efficient over time, new residential developments may include smaller high- and medium- density homes to accommodate a growing number of single and couple households, electric vehicles may increase demand for power and a greater proportion of homes may produce their own electricity with distributed solar PV. In the future, more homes and businesses will be consuming energy and these new connections, along with different consumption and production patterns, may place strain on electricity infrastructure, particularly during peak demand periods.
Using infrastructure more efficiently may help to alleviate this pressure, and reduce the need for new investments – reducing energy costs for all consumers. In recent years the capacity utilization of Australia’s electricity systems has declined – peak demand has grown (or remained high), particularly with the use of air conditioning on hot days, and underlying energy use has declined, with consumers reducing their consumption in response to higher prices, and with of rooftop solar. The average-rate volumetric tariffs that are currently widely used for electricity do not provide customers with signals to reduce their demand during peak times, or to shift consumption to lower demand periods. Transitioning towards more cost-reflective pricing structures, particularly for networks, will improve energy productivity and ensure that all consumers contribute equitably to providing shared energy resources.
A shift towards cost-reflective tariffs also promotes greater customer participation in energy markets, whereby consumers are able to capture the value created in the energy supply chain by different choices, such as how to use energy and if and when to make investments in different technology options. By mid-century the uptake of new energy technologies is projected to increase – which may include solar PV, battery storage, electric vehicles, smart appliances, home energy management and other digital services. Multi-directional energy markets and ecosystems may emerge, with technology enabling customers to produce, use, store, and trade energy with each other effortlessly, based on dynamic market signals using peer-to-peer platforms. New technological combinations may increasingly offer cost-effective alternatives to costly infrastructure upgrades.
In the future, customers will expect energy companies to offer a wide range of products and services that reflect their growing diversity and enable them to select those that suit their individual circumstances. Vibrant and competitive marketplaces will promote innovation in product development and growing choice for customers.
As the economy grows, Australians are expected to become wealthier, with GNI per capita projected to grow by 77% in real terms to 2055. As incomes grow, the proportion of household expenditure spent on services (rather than products) is projected to increase, and this may also prove true for energy, where excellent and personalized customer services may be increasingly valued. Markets for new energy-related services for homes and businesses may emerge, including innovative financing, energy efficiency, management software, technology operation and maintenance and building comfort offerings.
4. CLOSING REMARKS
CLOSING REMARKS
AUSTRALIA’S ECONOMIC TRANSFORMATION
2 8

Australia’s economy is changing, with commercial and social services projected to represent a growing share of economic value, employment and exports, while other sectors such as resources and agriculture may continue to represent a competitive advantage for Australia. The growth of services and a focus on energy productivity and reducing greenhouse gas emissions may reduce the energy intensity of the Australian economy over time, and change the way that businesses source and manage their energy needs. Electrification of transport and equipment, distributed generation, automation and robotics, and advanced ‘green buildings’ may present additional opportunities for optimisation and energy efficiency.
AGL is preparing our business to meet the energy needs of customers, now and into the future. We are committed to providing energy products and services that are reliable, affordable, environmentally sustainable, and that enable greater customer choice and innovation. AGL has established a New Energy division to provide energy services that enhance efficiency and energy productivity, including through the application of distributed energy technologies. We have also invested in market-leading digital services that allow customers to monitor and manage their energy usage to enhance their comfort, convenience and control. While the future is not set, and it is impossible to predict which technologies will ultimately prevail, AGL is developing its technological capabilities to design and trial new product and service offerings, based on our insights into customer needs, values and preferences. By doing this, AGL is poised to create value – both for our customers, and by contributing to greater energy productivity throughout the Australian economy.
2 9

3 0 AUSTRALIA’S ECONOMIC TRANSFORMATION
1. KPMG International (2014) Future State 2030: The global megatrends shaping governments www.kpmg.com/Global/en/IssuesAndInsights/ArticlesPublications/future-state-government/Documents/future-state-2030-v3.pdf accessed 12 June 2016
2. World Economic Forum (2016) The Global Risks Report 2016, 11th Edition, World Economic Forum, Geneva
3. Australian Bureau of Statistics (ABS) (2012) 3222.0 Population Projections, Australia, Series B www.abs.gov.au/AUSSTATS/[email protected]/mf/3222.0 accessed 31 May 2016
4. New South Wales (NSW) Government (2016) NSW Intergenerational Report 2016: Future State NSW 2056, NSW Government, Sydney
5. Australian Bureau of Statistics (2016) 3412.0 Migration, Australia www.abs.gov.au/ausstats/[email protected]/mf/3412.0 accessed 19 April 2016
6. Commonwealth of Australia (2015) 2015 Intergenerational Report Australia in 2055, Australia Treasury, Canberra
7. Australian Trade Commission (Austrade) (2016) Why Australia Benchmark report 2016 www.austrade.gov.au/International/Invest/Resources/Benchmark-Report accessed 20 April 2016
8. IBISWorld (2012) A snapshot of Australia’s digital future to 2050, IBISWorld, commissioned by IBM Australia www-07.ibm.com/au/pdf/1206_AustDigitalFuture_A4_FINALonline.pdf accessed 7 June 2016
9. Committee for Economic Development of Australia (CEDA) (2015) Australia’s future workforce? CEDA, Melbourne
10. Foundation for Young Australians (FYA) (2016) The new basics: Big data reveals the skills young people need for the New Work Order, FYA, Melbourne
11. Derived from ABS (2012) 3222.0 Population Projections, Australia, Series B www.abs.gov.au/AUSSTATS/[email protected]/mf/3222.0 accessed 31 May 2016
12. Commonwealth of Australia (2014) Trends: Infrastructure and Transport to 2030, Department of Infrastructure and Regional Development, Canberra
13. Extrapolated from ABS (2015) 3236.0 - Household and Family Projections, Australia, Series II http://www.abs.gov.au/ausstats/[email protected]/mf/3236.0 accessed 12 June 2016
14. Nationwide House Energy Rating Scheme (NatHERS) Star rating scale overview, www.nathers.gov.au/owners-and-builders/star-rating-scale-overview accessed 19 June 2016
15. Victoria Government (2014) Victorian households energy report, Sustainability Victoria, Melbourne
16. Clean Energy Council (CEC) (2016) Clean Energy Australia Report 2015, CEC, Melbourne
17. Keane, A. (2015) Origin Energy calculates Australia has $4.4 billion of wasted roof space, news.com.au, 4 May 2015 www.news.com.au/finance/money/costs/origin-energy-calculates-australia-has-44-billion-of-wasted-roof-space/news-story/dd18cb3637aeb04d818e503362a0012c accessed 19 June 2016
18. Presentation by Kobad Bhavnagri, 9 July 2015, New Energy Outlook 2015, Bloomberg New Energy Finance, Sydney
19. Climate Council (2015) Powerful potential: battery storage for renewable energy and electric cars www.climatecouncil.org.au/uploads/ebdfcdf89a6ce85c4c19a5f6a78989d7.pdf accessed 13 June 2016
20. Energeia (2015) Review of Alternative Fuel Vehicle Policy Targets and Settings for Australia, Energeia, Prepared for the Energy Supply Association of Australia energeia.com.au/wp-content/uploads/2016/03/Energeia-Report-for-ESAA_-Optimal-AFV-Policy-Targets-and-Settings-for-Australia.compressed.pdf accessed 14 June 2016
21. ClimateWorks Australia (2014) Pathways to deep decarbonisation in 2050: How Australia can prosper in a low carbon world, Technical report, ClimateWorks Australia, Melbourne
22. Commonwealth Scientific and Industrial Research Organisation (CSIRO) (2016) Australia 2030: Navigating our uncertain future www.csiro.au/en/Do-business/Futures/Reports/Australia-2030 accessed 20 May 2016
23. PricewaterhouseCoopers (2016) Turnaround and transformation in cybersecurity: Key findings from The Global State of Information Security® Survey 2016 www.pwc.com/gx/en/issues/cyber-security/information-security-survey/download.html accessed 19 June 2016
24. CHOICE (2015) Solar power survey results www.choice.com.au/home-improvement/energy-saving/solar/articles/solar-power-survey-results accessed 19 June 2016
25. Simshauser, P., Nelson, T. and Doan, T. (2011) The Boomerang Paradox, Part II: Policy prescriptions for reducing fuel poverty in Australia, The Electricity Journal, Volume 24, Issue 2, pp 63-75.
26. Simshauser, P. and Nelson, T. (2014) The Consequences of Retail Electricity Price Rises: Rethinking Customer Hardship, Australian Economic Review, Volume 47, Issue 1, pp 13-43.
27. Deloitte Touche Tohmatsu (2014) Positioning for prosperity? Catching the next wave www2.deloitte.com/au/en/pages/building-lucky-country/articles/positioning-for-prosperity.html accessed 10 December 2015
28. CSIRO (2015) Australian National Outlook 2015: Economic activity, resource use, environmental performance and living standards, 1970–2050 www.csiro.au/nationaloutlook/ accessed 3 June 2016
29. Linehan, V., Thorpe, S., Andrews, N., Kim Y., and Beaini, F. (2012) Food demand to 2050: Opportunities for Australian agriculture, Australian Government Department of Agriculture, Fisheries and Forestry, Australian Bureau of Agricultural and Resource Economics and Sciences (ABARES), Canberra
30. Business Council of Australia (BCA) (2015) Building Australia’s Comparative Advantages: A 21st Century Agrifood Sector, BCA, Melbourne
31. ABS (2012) 4102.0 - Australian Social Trends, December 2012 www.abs.gov.au/AUSSTATS/[email protected]/allprimarymainfeatures/EED42391CD269634CA257B4800143EAC?opendocument accessed 19 June 2016
32. Deloitte Touche Tohmatsu, Agribusiness Bulletin: Farming on the verge of a workforce crisis www2.deloitte.com/au/en/pages/consumer-business/articles/farming-verge-workforce-crisis.html accessed 19 June 2016
33. Commonwealth of Australia (2015) National Energy Productivity Plan 2015 – 2030: Boosting competitiveness, managing costs and reducing emissions, COAG Energy Council, Canberra. Estimates include savings from food manufacturing based on pro-rated energy consumption.
34. Bureau of Resources and Energy Economics (BREE) (2014) Australian Energy Projections to 2049-50, BREE, Canberra
35. Commonwealth of Australia (2016) Resources and Energy Quarterly March 2016, Department of Industry, Innovation and Science, Office of the Chief Economist www.industry.gov.au/Office-of-the-Chief-Economist/Publications/Documents/req/REQ-March-2016.pdf accessed 7 June 2016
36. Bullen, J., Kouparitsas, M. and Krolikowski, M. (2014) Long run forecasts of Australia’s terms of trade, Treasury Working Paper 2014-01, The Treasury Australian Government, Canberra
37. Commonwealth of Australia (2015) National Energy Productivity Plan 2015 – 2030: Boosting competitiveness, managing costs and reducing emissions, COAG Energy Council, Canberra. Estimates include savings from metals and minerals manufacturing based on pro-rated energy consumption.
38. Global Centre for Digital Business Transformation (2015) Digital vortex: How digital disruption is redefining industries www.imd.org/uupload/IMD.WebSite/DBT/Digital_Vortex_06182015.pdf accessed 26 February 2016
39. ABS (2016) 3401.0 Overseas Arrivals and Departures, Australia www.abs.gov.au/ausstats/[email protected]/mf/3401.0/ accessed 14 June 2016
40. Commonwealth of Australia (2015) National Energy Productivity Plan 2015 – 2030: Boosting competitiveness, managing costs and reducing emissions, COAG Energy Council, Canberra. Figure includes energy consumption across all services sectors, wholesale trade, retail trade and pubic administration and security.
41. Australian Trade Commission (Austrade) (2016) Green and Sustainable Building www.austrade.gov.au/greenbuildings/, accessed 19 June 2016
END NOTES
End Notes5.


