WHDE Lesson ALL RIGHTS RESERVED WHDE Population Pyramids: A Case Study AUTHOR INFORMATION Author: Lisa M. Waligora State: Texas GENERAL INFORMATION Lesson Grade Span: Secondary (9-12) Targeted Grade Level/Course: AP Human Geography, World Geography Estimated Time to Complete Lesson: 2 - 50-minute classes FOCUSED QUESTION How and why has the population of South Korea changed in the last 60+ years? STANDARDS (STATE/C3) AP Course Description & Articulation: Unit II. Population and Migration Enduring Understanding: (Students will understand that…) A. Knowledge of the geographic patterns and characteristics of human populations facilitates understanding of cultural, political, economic, and urban systems. Learning Objective: (Students are able to…) Analyze population composition. Essential Knowledge: (Students will know that…) Population pyramids are used to project population growth and decline and to predict markets for goods and services. Enduring Understanding: (Students will understand that…) B. Populations grow and decline overtime and space. Learning Objective: (Students are able to…) Interpret and apply theories of population growth and decline. Essential Knowledge: (Students will know that…) The demographic transition model may be used to explain population change over time and space. Essential Knowledge: (Students will know that…) The epidemiological transition explains causes of changing death rates. C3: D2.Geo.7.9-12. Analyze the reciprocal nature of how historical events and the spatial diffusion of ideas, technologies, and cultural practices have influenced migration patterns and the distribution of human population. Texas Essential Knowledge & Skills (TEKS): 113.43 World Geography Studies (c) Knowledge and Skills
Transcript
WHDE Lesson
ALL RIGHTS RESERVED WHDE
Population Pyramids: A Case Study
AUTHOR INFORMATION
Author: Lisa M. Waligora State: Texas
GENERAL INFORMATION
Lesson Grade Span: Secondary (9-12)
Targeted Grade Level/Course: AP Human Geography, World Geography
Estimated Time to Complete Lesson: 2 - 50-minute classes
FOCUSED QUESTION
How and why has the population of South Korea changed in the last 60+ years?
STANDARDS (STATE/C3)
AP Course Description & Articulation: Unit II. Population and Migration
Enduring Understanding: (Students will understand that…) A. Knowledge of the geographic
patterns and characteristics of human populations facilitates understanding of cultural,
political, economic, and urban systems.
Learning Objective: (Students are able to…) Analyze population composition.
Essential Knowledge: (Students will know that…) Population pyramids are used to project
population growth and decline and to predict markets for goods and services.
Enduring Understanding: (Students will understand that…) B. Populations grow and decline
overtime and space.
Learning Objective: (Students are able to…) Interpret and apply theories of population
growth and decline.
Essential Knowledge: (Students will know that…) The demographic transition model may be
used to explain population change over time and space.
Essential Knowledge: (Students will know that…) The epidemiological transition explains
causes of changing death rates.
C3: D2.Geo.7.9-12. Analyze the reciprocal nature of how historical events and the spatial
diffusion of ideas, technologies, and cultural practices have influenced migration patterns
and the distribution of human population.
Texas Essential Knowledge & Skills (TEKS): 113.43 World Geography Studies
(c) Knowledge and Skills
WHDE Lesson
ALL RIGHTS RESERVED WHDE
(7) Geography. The student understands the growth, distribution, movement, and
characteristics of world population. The student is expected to:
(A) construct and analyze population pyramids and use other data, graphics, and
maps to describe the population characteristics of different societies and to
predict future population trends;
1. Students will interpret population pyramids from South Korea.
2. Students will hypothesize how and why different age and sex groups are changing in
the overall population of the country.
3. Students will compare the changes in population data to stages in the demographic
transition model (DTM).
LESSON OVERVIEW
South Korea experienced a dramatic and sudden shift in economic and demographic
standards during and after the Korean War. Students examining population pyramids for this
same time period recognize and correlate the data in order to explain how the population of
the country changed and how this impacted South Korea’s standing in the DTM.
Remember the key to these lesson plans is that they be transferable.
Write so that a teacher could pick this up and know exactly what to do.
*Note to Teacher: This case study is intended to be used as independent practice in order for
students to show mastery of the following concepts:
1. Population Pyramids
2. Demographic Transition Model (DTM)
3. Epidemiological Transition (ET)
after students have been given introductory notes or information and have a clear
understanding of population pyramids, the DTM and ET. If your curriculum does not include
these last two models, you can edit them out of the assignment easily.
Day 1
5 Minutes
Engage Activity: See, Wonder, Think: Show students two images from the Inchon
area (Slide #3). One is from during the war and the image on the right is a current
picture of Inchon at night. Ask: What is going on in these two photographs?
WHDE Lesson
ALL RIGHTS RESERVED WHDE
Students write down and can later share their observations based on these three
questions.
1. What are three things you see…
2. 2 things you wonder about…
3. 1 thing this image makes you think...
Enrichment: Visual Think Strategies: This strategy is a teacher-facilitated
classroom discussion that is designed to get students to make and support a
conjecture with evidence from the image. The questions are:
1. What's going on in this picture?
2. What do you see that makes you say (Quote back to students
exactly what they tell you they think is going on in the picture)….?
3. What more can we find?
These prompts help students delve deeper as they share their See, Wonder, Think
observations.
7-10 Minutes
Review Prior Knowledge: Whole Class Discussion. Use this time to review and
check for understanding the terms and concepts Population Pyramid,
Demographic Transition Model, and Epidemiological Transition introduced in a
previous lesson.
15-20 Minutes
Guided Practice: Partner activity for up to 15 partner groups. If your classes are
larger than that you can use 3 students, groups of no more than 4 or simply add
questions to the assignment so that each team can share at least one answer to
their Population Pyramid Questions.
Partners will examine and discuss population pyramids for South Korea for the
years 1950, 1960, 1970, 1980, and 1990. (Slides # 6-11) Each pyramid has guiding
questions for critical thinking about what these data sets tell us about the
population of South Korea during these snapshots over time.
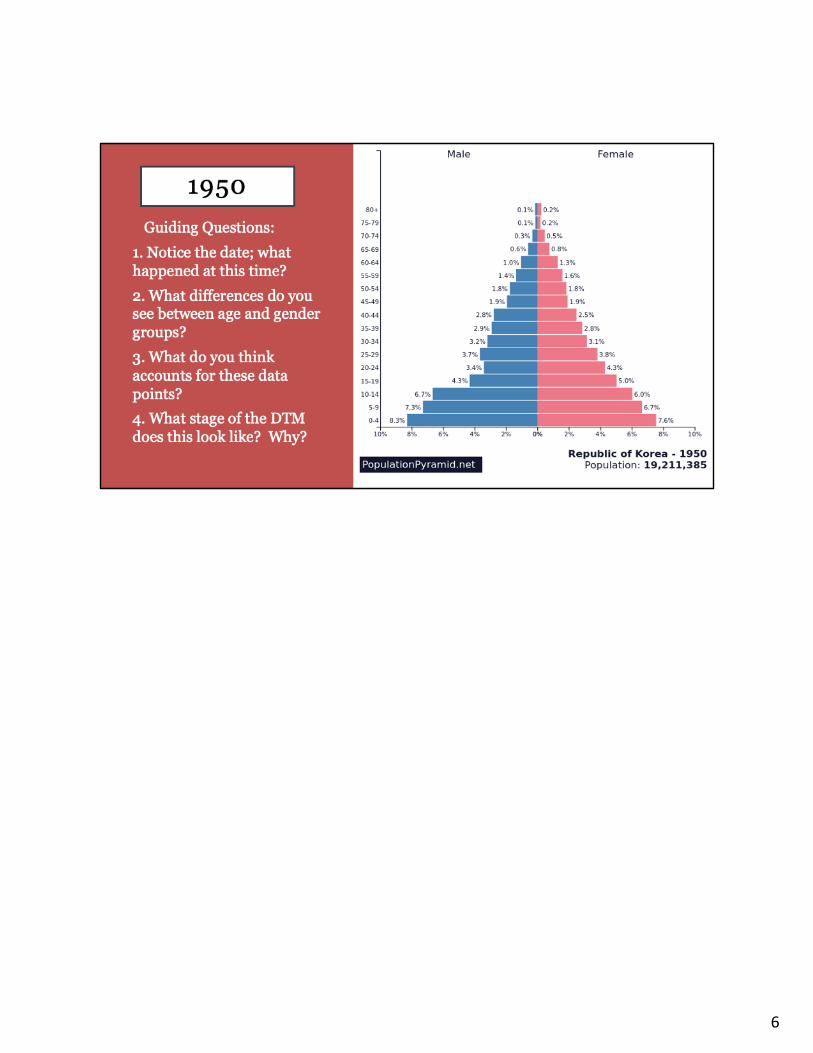
1950 = 1. Korean War starts during this year.
2. Noticeable dent in fighting age men.
3. Answers vary but should reflect war and conflict.
4. Triangular shape which is indicative of DTM stages 1 or 2, etc. Korea
was a developing country emerging from the shadows of WWII and
Japanese occupation and then civil war erupts. Government and
economic instability keep development and recovery down as well
as social and medical services. Infant and child mortality is high, life
expectancy is low.
1960 = 5. Dent in Males of fighting age is becoming less noticeable but there
are still fewer males than females in some age groups while the
opposite is true for other age groups.
POPULATION PYRAMIDS
A Case Study
Lisa M. Waligora, 2018, Korean War Legacy Foundation Lesson
SEE, WONDER, THINK
• As you look at the images on the next slide, be ready to share …• What do you SEE?• What do you WONDER?• What do you THINK?
POPULATION PYRAMIDS, THE DTM, AND ET
• What do you understand about Population Pyramids?• What can Age/Sex Pyramids tell us about a country over space and
time?• How do pyramids correlate to the DTM?• What are the stages of the DTM again?• What kinds of diseases account for the leading causes of death at each
stage of the DTM?• Explain why these causes of death fit each stage.
APPLYING YOUR KNOWLEDGE
• With a shoulder partner, look over the Pop Pyramids for South Korea dated 1950 to 1990.• Discuss and answer each set of questions, 15 in total.• Each partner needs to have answers written down.• Share ideas and findings with class when called upon.
1950• Guiding Questions:1. Notice the date; what happened at this time?2. What differences do you see between age and gender groups?3. What do you think accounts for these data points?4. What stage of the DTM does this look like? Why?
1960• Guiding Questions:5. Are there any noticeable gaps in ages or genders? Why?6. Overall population for each sex and age group has changed. What does that tell you?7. Has the DTM Stage changed? Explain why or why not.
1
2
On Left: Preparing for Battle of Inchon. Located just South west of the city center of Seoul South Korea during the Korean War, 1950-53.On Right: City lights at Night in Incheon. This is the same area today.
3
4
5
6
7
8
9
10
11
12
13
14
15
16
17
18
19
20
POPULATION PYRAMIDS
A Case Study
Lisa M. Waligora, 2018, Korean War Legacy Foundation Lesson
SEE, WONDER, THINK
• As you look at the images on the next slide, be ready to share …• What do you SEE?• What do you WONDER?• What do you THINK?
POPULATION PYRAMIDS, THE DTM, AND ET
• What do you understand about Population Pyramids?• What can Age/Sex Pyramids tell us about a country over space and
time?• How do pyramids correlate to the DTM?• What are the stages of the DTM again?• What kinds of diseases account for the leading causes of death at each
stage of the DTM?• Explain why these causes of death fit each stage.
APPLYING YOUR KNOWLEDGE
• With a shoulder partner, look over the Pop Pyramids for South Korea dated 1950 to 1990.• Discuss and answer each set of questions, 15 in total.• Each partner needs to have answers written down.• Share ideas and findings with class when called upon.
1950• Guiding Questions:1. Notice the date; what happened at this time?2. What differences do you see between age and gender groups?3. What do you think accounts for these data points?4. What stage of the DTM does this look like? Why?
1960• Guiding Questions:5. Are there any noticeable gaps in ages or genders? Why?6. Overall population for each sex and age group has changed. What does that tell you?7. Has the DTM Stage changed? Explain why or why not.
1970• Guiding Questions:8. What is happening to the base of the pyramid? What are your explanations for this phenomenon? 9. Look at the oldest age group. Note your findings and explanations for this age group.10. Determine ET causes of death for South Korea at this time.
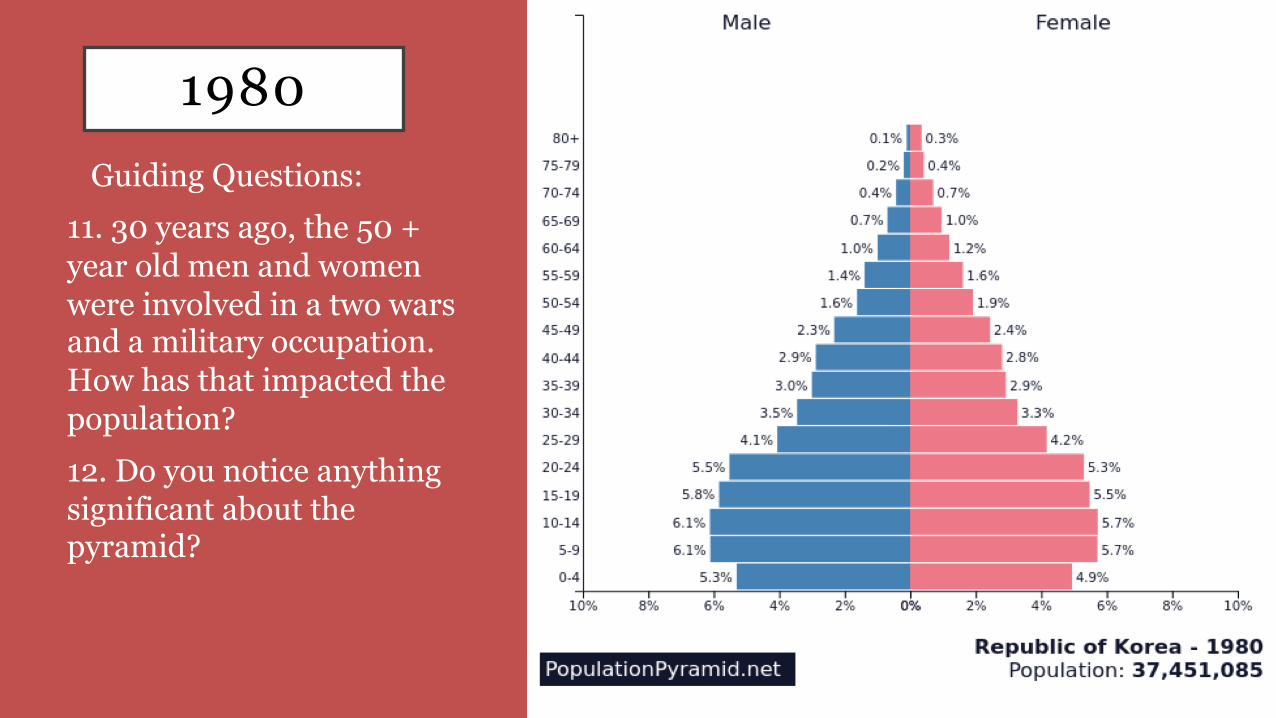
1980• Guiding Questions:11. 30 years ago, the 50 + year old men and women were involved in a two wars and a military occupation. How has that impacted the population?12. Do you notice anything significant about the pyramid?
1990• Guiding Questions:13. Describe what is happening to the pyramid and translate that to what is happening to the country of South Korea during the 1990s.14. What is a significant change in this pyramid?15. What stage of the DTM Does this look like? Why?
FINDINGS
• As partners, share out what you think are your best answers and findings. Each Population Pyramid must be addressed and no repeating! If a group shares something similar to what you and your partner wanted to say, take it off your list.• Write down any interesting ideas you had not thought of that other
teams present.
DAY 2
A Case Study
TO RECAP…
• Entrance Ticket:• On a sticky note write down what you think is happening to the
population of South Korea and why.
ON YOUR OWN
• Look at the Population Pyramids for 2000-2045 on your own.• Write out your answers to the guiding questions as if you are
addressing a World Summit on Population.• Complete the Findings Report in class today.
2000• Guiding Questions:1. What stage of the DTM Does this look like? Why? 2. How do you explain such a dramatic change in the shape of and demographic statistics of South Korea?3. Thinking about the ET,what diseases factor in as the leading causes of death for South Korea?
2010• Guiding Questions:4. Notice the date; what is happening now?5. What differences do you see between age groups and genders?6. What do you think accounts for these data points?7. What stage of the DTM Does this look like? Why?
2045 (PROJECTED)
• Guiding Questions:8. What patterns were in place to make this the projected pyramid in 25 years?9. What is the most significant change?10. What must happen regarding the DTM and ET? Why?
FINDINGS REPORT
• Write out your answers backed with evidence from the Population Pyramids, as well as notes and discussions from yesterday and today. Remember, you are presenting at a World Summit on Population.• Prompts: • 1. What changes has the population of South Korea experienced in the last
60+ years?• 2. How do Pop Pyramids as well as DTM and ET help explain these
particular data points?• 3. What is in store for the future population of South Korea? Explain.• Make sure you use evidence and data from the population pyramids and
the notes and ideas from yesterday and today
DELVING DEEPER…
• What about North Korea? • What kind of and how reliable do you believe data is from North
Korea? Why?• Read & React:
North Korea Census Reveals Poor Demographic and Health Conditions
RESOURCES
Battle of Inchon. (2019, January 06). Retrieved from https://en.wikipedia.org/wiki/Battle_of_InchonFree Photos and images. (n.d.). Retrieved January 8, 2019, from https://www.goodfreephotos.com/south-korea/incheon/night-cityscape-in-incheon-south-korea.jpg.phpNorth Korea Census Reveals Poor Demographic and Health Conditions. (2018, December 20). Retrieved from https://www.prb.org/northkorea-population/Population Pyramids of the World from 1950 to 2100. (2018, December 20). Retrieved from https://www.populationpyramid.net/republic-of-korea/2020/See, Wonder, Think: A Routine for Exploring Works of Art and Other Interesting Things. (n.d.). Retrieved December 6, 2018, from http://www.visiblethinkingpz.org/VisibleThinking_html_files/03_ThinkingRoutines/03c_Core_routines/SeeThinkWonder/SeeThinkWonder_Routine.htmlWhat's going on in this picture? (n.d.). Retrieved December 6, 2018, from https://vtshome.org/
WHDE Lesson
ALL RIGHTS RESERVED WHDE
6. Life expectancy is improving, population growth is slowing down
however, infant and child mortality is still high.
7. The pyramid is still very triangular but for the first time, 0-5 is not
the largest population group.
1970 = 8. The pyramid looks like it is beginning to invert. The base is getting
smaller while child bearing ages appear to be healthier and living
longer.
9. Oldest population groups are not changing, indicating they are not
living any longer. This could be a result of lagging medical care and
recovery from war.
10. Possible causes of death during this time are treatable diseases.
Medical intervention and pharmaceuticals could reduce number of
deaths especially in the elderly age groups. Public health and
sanitation is improving but has not reached all areas and those with
weaker immune systems are at highest risk.
1980 = 11. Answers will vary. Students need to include explanations and
examples in order to prove their points.
12. The birth rate is declining steadily, base of pyramid is still inverting
but there is little to no change at the top of the pyramid.
1990 = 13. The pyramid is becoming rounder and is actually narrower in than
in previous decades. This could mean that birth rates are low and
stable and life expectancy is rising therefore parents do not need to
have multiple children to ensure that any of them survive to
adulthood. This should also indicate that both the economy and
government are become stable and the economy is probably
increasing allowing for more social services.
14. The oldest age group is now at 100+ and while the change is
minimal, older people are living longer.
15. The pyramid is rounder indicating a stage 3 is emerging. South
Korea looks like it is becoming an MDC (more Developed Country).
10+ Minutes
Formative Assessment: Partner/Teams share ideas: As partners, share out what
you think are your best answers and findings. Each Population Pyramid and all
questions must be addressed. If a group shares something similar to what you and
your partner wanted to say, take it off your list.
Day 2
3-5 Minutes Engage Activity: Students write and pass up their notes. Students are encouraged
to share any of their thoughts…
30 – 40+ Minutes
WHDE Lesson
ALL RIGHTS RESERVED WHDE
Independent Practice: Go over directions on PowerPoint and turn students loose
to complete work today. If necessary, work can be completed for homework and
submitted the next class period or electronically to a classroom learning platform.
• Look at the Population Pyramids for 2000-2045 on your own.
• Write out your answers to the guiding questions.
• Complete the Findings Report in class today as if you, the testifying expert on
South Korea’s Population changes, are addressing a World Summit on
Population.
2000, 2010, and 2045 Population Pyramids
10 Guiding Questions will help students think critically about the changes in
demographics, Age/Sex Pyramids, DTM, and ET. Students should be encouraged to
use other demographic vocabulary such as demographic momentum, life
expectancy, demographic statistics, etc. in order to give complete and clear
answers to the Guiding Questions and the Findings Report.
The last 10 questions are deliberately more open ended to encourage critical
thinking and reasoning skills.
It is at the teacher’s discretion if these 10 questions must be submitted for
grading.
*Note: Findings Report is the product of a prior NEH Workshop and is the intellectual property of Lisa M. Waligora.
FORMATIVE ASSESSMENT
List and explain the different formal assessments that will be used to assess
whether or not students achieved the learning goals (target outcomes).
Assessments in Order of Use:
Formative: See, Wonder, Think and VTS, Student Participation and Teacher
Observation
Formative: Whole class discussion as review of major concepts and terms
previously learned, Student Participation and Teacher Observation
Formative: Partner Activity Share: Student Participation and Teacher observation
Formative: Entrance Ticket, Student Participation and Teacher observation
Summative: Independent Activity Findings Report for World Summit on
Population, Rubric
Summative: Enrichment Activity Read & React, Rubric, Extra Credit, etc..
WHDE Lesson
ALL RIGHTS RESERVED WHDE
Please attach rubric as a separate file.
RESOURCE LIST
Battle of Inchon. (2019, January 06). Retrieved from
https://en.wikipedia.org/wiki/Battle_of_Inchon
Free Photos and images. (n.d.). Retrieved January 8, 2019, from
What's going on in this picture? (n.d.). Retrieved December 6, 2018, from
https://vtshome.org/
MODIFICATIONS & EXTENSIONS (OPTIONAL)
MODIFICATIONS
All content maybe modified for length, complexity, course subject, grade level, etc. EXTENSIONS
Option 1:
Similar data for North Korea is understandably difficult to obtain but students who are
interested may certainly make inferences and draw conclusions about what the population
pyramids for North Korea might look like. With these hypothetical ideas regarding the
WHDE Lesson
ALL RIGHTS RESERVED WHDE
population of North Korea, students will also be able to address questions and ideas about
North Korea and the DTM and perhaps even the epidemiological transition (ET), or why
certain population age groups die.
Option 2: Part of PPT
Delving Deeper
What about North Korea?
What kind of and how reliable do you believe data is from North Korea? Why?
Use the linked article to complete a Read & React Assignment:
North Korea Census Reveals Poor Demographic and Health Conditions
*Note: Read & React is the intellectual property of Lisa M. Waligora, edited from an
NEH Workshop lesson.
WHDE Lesson
ALL RIGHTS RESERVED WHDE
Read & React
After reading an assigned text or passage complete this assignment with thoughtful sentences giving examples and explanations. Include academic vocabulary studied in this unit. Heading: Name Class Period Date Space Title (Centered) Space Begin Report (do not indent paragraphs) Space between paragraphs Format: 1 Page, typed, single space, Times New Roman Font, Size 12 Handwritten – approximately 400-450 words. Grammar Expectations: Correct capitalization and basic punctuation is expected. Spell check and grammar check should be used. Please use 3rd person only. Avoid the phrases, ‘In my opinion,…” and “Finally,…” Read & React Requirements: Paragraph 1: (Introduction) Summarize the content of the article or passage. Prove that you understand details such as who, what, when, where, why, and how as they apply to the topic. Paragraph 2: (Based on Reading) As you read the text, explain how the topic relates to Human Geography. Use as many academic vocabulary words as applicable. These terms should be bolded and highlighted every time you use them in this paper. You may refer to any data, evidence, graphs, quotes, etc. found in the article. You may quote or paraphrase this data with in text citations. Explain the facts as you understand them. Avoid drawing conclusions. Remember, you must prove to the reader that you understand the article and any correlations to Human geography you describe. Paragraph 3: (Reactions) What are your thoughts and reactions to what you have read? Potentially, you will be given a series of prompts or sentence starters to help you begin this paragraph. You must also prove that you understand the causes, effects, consequences, unintended or not. Make connections to the units and lenses we have studied in Human Geography. Use your academic vocabulary wisely and explain your reactions to your audience. Do not use 1st person. Prove you understand the topic and the concepts involved. Page 2: (MLA 8 Citations) Page 2 should be your MLA 8 Citations properly documented for the article or text(s)/Sources you have been assigned.
WHDE Lesson
ALL RIGHTS RESERVED WHDE
Findings Report
As an Expert Witness, explain your testimony with thoughtful sentences giving examples and explanations. Include academic vocabulary studied in this unit. Heading: Name Class Period Date Space Title (Centered) Space Begin Report (do not indent paragraphs) Space between paragraphs Format: 1 Page, typed, single space, Times New Roman Font, Size 12 Handwritten – approximately 400-450 words. Grammar Expectations: Correct capitalization and basic punctuation is expected. Spell check and grammar check should be used. Please use 3rd person only. Avoid the phrases, ‘In my opinion,…” and “Finally,…” Findings Report Requirements: Paragraph 1: (Introduction) State the case. What will you be speaking about? Give background information and details such as who, what, when, where, why, and how as they apply to the topic. Paragraph 2: (Findings) What are your findings? You have a series of questions or a scenario. Explain your discoveries in answering these questions. What aspects of Human Geography relate to this topic? Use as many academic vocabulary words as applicable. These terms should be bolded and highlighted every time you use them in this report. You may refer to any data, evidence, graphs, quotes, etc. that you have been given as part of this assignment. You may quote this data or paraphrase it with in text citations. Stick to the facts as you understand them at this point. Avoid drawing any conclusions in this paragraph. The most important thing to remember is that you must prove to the reader that you understand the questions or task and the resources you have been given. Paragraph 3: (Conclusions) Analyze what the information and findings mean. Again you must prove you understand and can explain to someone what your report means to a country, a government, a group of scholars or scientists, school children, a jury, or a journalist, etc. as defined in your assignment. You must know who your audience is and ensure that they will understand your report. Use your academic vocabulary wisely and explain what your findings mean to your audience. Even though you are applying knowledge and drawing a conclusion, do not use 1st person or claim that these findings are your opinion. This is your chance to prove to the reader and the grader that you understand the topic, the concepts involved, and even the questions asked.