Auditory Attraction: Activation of visual cortex by music and sound in Williams syndrome Tricia A. Thornton-Wells 1,2 , Chris J. Cannistraci 2 , Adam Anderson 2,3 , Chai-Youn Kim 4,5 , Mariam Eapen 2,6 , John C. Gore 2,7 , Randolph Blake 4 , and Elisabeth M. Dykens 1,8,§ 1 Vanderbilt Kennedy Center for Research on Human Development, Vanderbilt University, Nashville, TN, 37203 2 Vanderbilt Institute of Imaging Science, Vanderbilt University, Nashville, TN, 37232 3 Department of Biomedical Engineering, Vanderbilt University, Nashville, TN 37232 4 Department of Psychology, Vanderbilt University, Nashville, TN, 37203 5 Department of Psychology, Korea University, Seoul, 136-701, Korea 6 Neuroscience Graduate Program, Vanderbilt University, Nashville, TN 37232 7 Department of Radiology and Radiological Sciences, Vanderbilt University, Nashville, TN 37232 8 Department of Psychology and Human Development, Vanderbilt University, Nashville, TN 37203 Abstract Williams syndrome (WS) is a genetic neurodevelopmental disorder with a distinctive phenotype including cognitive-linguistic features, non-social anxiety, and a strong attraction to music. We performed functional MRI studies examining brain responses to musical and other types of auditory stimuli in young adults with WS and typically-developing controls. In Study 1, the WS group exhibited unforeseen activations of the visual cortex to musical stimuli, and it was this novel finding that became the focus of two subsequent studies. Using retinotopy, color localizers and additional sound conditions, we identified specific visual areas in WS subjects that were activated by both musical and non-musical auditory stimuli. The results, similar to synesthetic-like experiences, have implications for cross-modal sensory processing in typical and atypical neurodevelopment. INTRODUCTION Williams syndrome (WS; OMIM#194050) is a rare neurodevelopmental disorder caused by a hemizygous microdeletion on chromosome 7 (7q11.23), which contains approximately 28 genes(Stromme et al., 2002; Bayes et al., 2003). Hypersociable and unusually empathetic, individuals with WS exhibit relative strengths in expressive language and face processing, and their IQ scores tend to fall in the mild range of intellectual disability(Dykens & Rosner, 1999; Klein-Tasman & Mervis, 2003; Reilly et al., 2004; Bellugi et al., 1999). Their performance on tasks involving visuospatial cognition is often impaired relative to age- matched typically-developing (TD) controls, and some show abnormal sensitivity to loud sounds, aversion to innocuous sounds and attraction to other sounds (Klein et al., 1990; Nigam & Samuel, 1994; Levitin et al., 2005). These auditory symptoms are indicative of a more §Corresponding author. Address for correspondence: Elisabeth M. Dykens, Ph.D., Associate Director, Vanderbilt Kennedy Center for Research on Human Development; Director, Vanderbilt Kennedy University Center of Excellence on Developmental, Disabilities, Professor, Psychology and Human Development, 230 Appleton Place, Peabody Box 40, Nashville, TN 37203, 615-322-8945. NIH Public Access Author Manuscript Am J Intellect Dev Disabil. Author manuscript; available in PMC 2011 March 1. Published in final edited form as: Am J Intellect Dev Disabil. 2010 March ; 115(2): 172–189. doi:10.1352/1944-7588-115.172. NIH-PA Author Manuscript NIH-PA Author Manuscript NIH-PA Author Manuscript
Transcript
Auditory Attraction: Activation of visual cortex by music andsound in Williams syndrome
Tricia A. Thornton-Wells1,2, Chris J. Cannistraci2, Adam Anderson2,3, Chai-Youn Kim4,5,Mariam Eapen2,6, John C. Gore2,7, Randolph Blake4, and Elisabeth M. Dykens1,8,§1Vanderbilt Kennedy Center for Research on Human Development, Vanderbilt University, Nashville,TN, 372032Vanderbilt Institute of Imaging Science, Vanderbilt University, Nashville, TN, 372323Department of Biomedical Engineering, Vanderbilt University, Nashville, TN 372324Department of Psychology, Vanderbilt University, Nashville, TN, 372035Department of Psychology, Korea University, Seoul, 136-701, Korea6Neuroscience Graduate Program, Vanderbilt University, Nashville, TN 372327Department of Radiology and Radiological Sciences, Vanderbilt University, Nashville, TN 372328Department of Psychology and Human Development, Vanderbilt University, Nashville, TN 37203
AbstractWilliams syndrome (WS) is a genetic neurodevelopmental disorder with a distinctive phenotypeincluding cognitive-linguistic features, non-social anxiety, and a strong attraction to music. Weperformed functional MRI studies examining brain responses to musical and other types of auditorystimuli in young adults with WS and typically-developing controls. In Study 1, the WS groupexhibited unforeseen activations of the visual cortex to musical stimuli, and it was this novel findingthat became the focus of two subsequent studies. Using retinotopy, color localizers and additionalsound conditions, we identified specific visual areas in WS subjects that were activated by bothmusical and non-musical auditory stimuli. The results, similar to synesthetic-like experiences, haveimplications for cross-modal sensory processing in typical and atypical neurodevelopment.
INTRODUCTIONWilliams syndrome (WS; OMIM#194050) is a rare neurodevelopmental disorder caused by ahemizygous microdeletion on chromosome 7 (7q11.23), which contains approximately 28genes(Stromme et al., 2002; Bayes et al., 2003). Hypersociable and unusually empathetic,individuals with WS exhibit relative strengths in expressive language and face processing, andtheir IQ scores tend to fall in the mild range of intellectual disability(Dykens & Rosner,1999; Klein-Tasman & Mervis, 2003; Reilly et al., 2004; Bellugi et al., 1999). Theirperformance on tasks involving visuospatial cognition is often impaired relative to age-matched typically-developing (TD) controls, and some show abnormal sensitivity to loudsounds, aversion to innocuous sounds and attraction to other sounds (Klein et al., 1990; Nigam& Samuel, 1994; Levitin et al., 2005). These auditory symptoms are indicative of a more
§Corresponding author. Address for correspondence: Elisabeth M. Dykens, Ph.D., Associate Director, Vanderbilt Kennedy Center forResearch on Human Development; Director, Vanderbilt Kennedy University Center of Excellence on Developmental, Disabilities,Professor, Psychology and Human Development, 230 Appleton Place, Peabody Box 40, Nashville, TN 37203, 615-322-8945.
NIH Public AccessAuthor ManuscriptAm J Intellect Dev Disabil. Author manuscript; available in PMC 2011 March 1.
Published in final edited form as:Am J Intellect Dev Disabil. 2010 March ; 115(2): 172–189. doi:10.1352/1944-7588-115.172.
NIH
-PA Author Manuscript
NIH
-PA Author Manuscript
NIH
-PA Author Manuscript
general heightened sensitivity or reactivity that might be related to increased anxiety, fear andarousal in some persons with WS (Blomberg S et al., 2006; Dykens, 2003).
In addition to the characteristics summarized above, individuals with WS often exhibit adistinct musical phenotype. Individuals with WS show interest in music at an earlier age, spendmore time listening to music, and are more emotionally responsive to music compared tocomparison groups of chronological age-matched subjects with TD, autism or Down syndrome(Levitin et al., 2004). Individuals with WS are also more likely to play a musical instrumentand to take music lessons compared to chronological age-matched subjects with Prader-Willisyndrome or Down syndrome (Dykens et al., 2005). One study showed enhanced skill forrhythmic production, in particular, which is consistent with our observations as well (Levitin,2005). While engaged in musical activities, individuals with WS experience unusually highlevels of emotion (Levitin, 2005), and caregivers report, they seem to use music instinctivelyin a therapeutic manner to reduce anxiety and to increase positive affect (Dykens et al.,2005). In fact, among WS subjects, those who spent more time listening to music had fewerExternalizing symptoms related to aggression and impulsivity, and those who had played amusical instrument for longer had fewer Internalizing symptoms, related to anxiety (asmeasured by Child Behavior Checklist (Achenbach, 1991)) (Dykens et al., 2005).
Intrigued by this strong attraction to music evidenced by people with WS, we set out to measurebrain responses of WS individuals and those of matched controls in response to musicalpassages. From earlier work using brain imaging techniques, we knew that WS tends to beassociated with abnormalities in the corpus callosum (Schmitt et al., 2001; Wang et al.,1992) and the hippocampal formation (Meyer-Lindenberg et al., 2005b), as well as reducedcortical brain volume (Thompson et al., 2005; Reiss et al., 2000) and altered gyral patterns(Gaser et al., 2006; Kippenhan et al., 2005). Moreover, studies using functional MRI (fMRI)have found differential activation patterns between persons with WS and TD controls duringthe performance of tasks involving visuospatial processing (Meyer-Lindenberg et al., 2004),response inhibition (Mobbs et al., 2007), face processing (Mobbs et al., 2004), and socialcognition (Meyer-Lindenberg et al., 2005a).
However, only one previous study examined brain responses in individuals with WS evokedby auditory stimuli including classical music (Levitin et al., 2003). Levitin et al. (2003) foundthat, in WS subjects relative to TD controls, temporal lobe activations were decreased and rightamygdala activations were increased in response to musical stimuli. While results from ourinitial study reported herein showed a similar trend, our measurements also revealed aremarkable pattern of auditory activations in areas of the brain conventionally associated withvisual perception. Those intriguing, unanticipated results were suggestive to us of synesthesia,in which a person sees colors when hearing musical notes (Rizzo & Eslinger, 1989; Ward etal., 2006). Thus, we were motivated to perform two more sets of measurements to morespecifically localize the responses within each subject’s visual cortex and to test whether theseresponses were restricted to music or also extended to other kinds of musical and non-musicalauditory stimuli. The results of these subsequent studies confirm the presence of strong auditoryactivations within extrastriate visual areas. These synesthesia-like activations may well berelated to the vivid visual imagery our participants with WS describe when listening tomusic‥
STUDY 1: Between-groups analysis of brain responses to musical stimuliMethods
Subjects—Participants in Study 1 included 13 individuals with Williams Syndrome (5females), ranging in age from 16 to 33, and 13 TD controls (6 females), ranging in age from17 to 27 (Table 1). TD controls were recruited from the local community using flyers and
Thornton-Wells et al. Page 2
Am J Intellect Dev Disabil. Author manuscript; available in PMC 2011 March 1.
NIH
-PA Author Manuscript
NIH
-PA Author Manuscript
NIH
-PA Author Manuscript
website postings with IRB-approved language. WS participants were recruited through theWilliams Syndrome Music Camp sponsored by the Vanderbilt Kennedy Center for Researchon Human Development, with the assistance of the Vanderbilt Blair School of Music and theNational Williams Syndrome Association. Hence, the WS sample was biased for individualswith a talent for and/or interest in music. Therefore, TD controls were ascertained to have some,but not an extensive, musical background. Specifically, 10 of 13 WS subjects and all TD controlsubjects played one or more musical instruments (Table 1). As assessed by the individually-administered Kaufman Brief Intelligence Test (K-BIT, Kaufman & Kaufman, 1990),individuals with WS had composite IQ scores that ranged from 49 to 91, with a mean of 69and a standard deviation of 14, indicating mild levels of intellectual disability. (See Table 1for verbal and non-verbal K-BIT summary statistics.) All WS participants exhibited thephysical, cognitive and behavioral profile of WS and previously had received a clinicaldiagnosis of WS and confirmatory genetic testing.
To optimize success and minimize anxiety with the MRI procedures, we mailed each WSparticipant an audio CD of the sounds an MRI machine makes while scanning so that he/shecould listen to them prior to attending music camp. While TD control subjects were notprovided such CDs, all subjects would have been exposed to the actual MRI scanner soundsprior to the acquisition of functional scans (since several structural scans precede the firstfunctional scan). Participants also visited the scanner and interacted with imaging staff priorto their scan, and we employed a research assistant with WS who had successfully completedprevious scans with us and could talk to his peers about his experiences. The study protocolwas approved by the Vanderbilt University Medical Center Institutional Review Board. Eachparticipant gave his/her informed assent, and the participant’s parent or guardian gave informedconsent prior to the experiment.
Functional NeuroimagingMRI Data Acquisition: The same data acquisition parameters were used in all three studies.A Philips Achieva 3-Tesla MRI scanner (Philips Healthcare, Inc., Best, The Netherlands) wasused to acquire T1-weighted anatomical volume images (TR = 4.6 msec, TE = 9 msec, 1 × 1× 1 mm voxels, 170 sagittal slices, FOV=256mm) and functional MR images. A total of 31axial slices were acquired parallel to the anterior-posterior (AC–PC) commissural line with animage matrix of 80 × 80 pixels, reconstructed to 128 × 128 pixels, and a FOV of 240mm. Slicethickness was 3.5mm with a 0.35mm gap, resulting in a voxel size of 1.875 × 1.875 × 3.85mm.Functional MR images were recorded using a single-shot T2*-weighted gradient-echo echoplanar sequence that was sensitive to changes in blood oxygen level-dependent (BOLD)contrast with a TR of 2000ms and a TE of 35ms with a SENSE factor of 1.5. In addition, a setof high-resolution T1-weighted images, which were used for coregistration and alignment,were acquired at the same location and with the same slice thickness as the functional scans.
Stimuli and fMRI Experimental Design: For Study 1, we were interested in investigatinghow subjects responded to music with differing emotional valence. Participants passivelylistened to blocks of silence and blocks of instrumental music categorized as upbeat ordownbeat or from an over-rehearsed song (‘Happy Birthday’; see Figure 1) Upbeat musicincluded three 20 sec clips from polka, jazz and new-age genres considered to elicit a positiveaffect. Downbeat music included three 20 sec clips from the modern classical genre consideredto elicit a negative affect. A larger set of song clips was initially selected for each category andwas rated by research staff; those found to elicit the desired affect most consistently werechosen for inclusion. The ‘Happy Birthday’ (HB) song was 20 sec long and was played in abig-band jazz style. The rest condition consisted of 10 seconds of silence. During all conditions,visual stimuli consisted of a black background with a white cross, on which subjects wereinstructed to fixate throughout the functional runs. Two block design runs (230 sec each) were
Thornton-Wells et al. Page 3
Am J Intellect Dev Disabil. Author manuscript; available in PMC 2011 March 1.
NIH
-PA Author Manuscript
NIH
-PA Author Manuscript
NIH
-PA Author Manuscript
conducted. The upbeat and downbeat blocks each consisted of three distinct song clips (3 × 20sec = 60 sec total), whereas the HB block consisted of just one 20 sec presentation of the over-rehearsed song. Therefore, each run consisted of one upbeat block (60 sec), one downbeatblock (60 sec) and one HB block (20 sec), and each of these song blocks was followed by aresting block (10 sec). The presentation order of the song blocks was randomized.
During scanning (in all three studies) the room lights were off and the fixation cross wasprojected via a rear projection system onto a translucent screen placed on the top of the headcoil. Subjects viewed the screen through a double mirror attached to the head coil. Stimuli werecontrolled using E-Prime (Psychological Software Tools, Pittsburgh, PA). Stimuluspresentation was synchronized with the data acquisition by a trigger pulse delivered by thescanner console. We used an MR-compatible pneumatic auditory stimulation systemincorporated into standard Philips headphones for binaural stimulus delivery.
Statistical Analysis—Functional MRI data were preprocessed using slice time correction,3D motion correction, 3D spatial smoothing (6mm FWHM Gaussian kernel; for Study 1 only),linear trend removal, and a high pass filter (3 cycles/time course). Scans with excessive headmotion (>3mm of translation or 3 deg of rotation) were removed from analysis. (Only one runfrom one subject was removed for excessive motion). Functional images were co-registeredwith structural images from the same subject, and all images were transformed to Talairachspace. Brain Voyager QX (Brain Innovation, Maastricht, The Netherlands) was used to performdata preprocessing, as well as GLM and ROI analyses in all three studies (version 1.9) and, inStudy 2, to perform color localizer and retinotopy analyses (version 1.6 and 1.9).
In Study 1, the random-effects general linear model (GLM) was applied to functional MRIdata, which measured changes in BOLD response. Within and between group contrasts wereconducted for each of the musical stimuli conditions (upbeat; downbeat; HB) versus the silentcondition, for the combined conditions (upbeat + downbeat + HB) versus the silent condition,and for upbeat versus downbeat conditions. A priori anatomical regions of interest werespecified based on previous research (Levitin et al., 2003) and analyzed using the Talairach-Tournoux Atlas (TTatlas+tlrc) dataset from AFNI (Cox RW, 1996). Whole brain analysisfocused on areas identified from between-groups statistical maps using a voxel-wisesignificance threshold of 0.005 and a cluster-size threshold of 50 mm3.
ResultsWe conducted a whole-brain analysis looking for areas of differential activation to musiclistening between groups (n=13 per group) at a voxel-wise significance threshold of 0.005. Acluster size threshold of 50 mm3 was employed to reduce false positive rates while maintainingpower to discover moderately sized clusters of activation (Loring et al., 2002; Hayasaka &Nichols, 2003). Within groups, activation patterns were very similar across music conditions;therefore, we report results from the contrast of combined (upbeat+downbeat+HB) musicconditions versus silent fixation. There were 19 significant clusters of differential between-group activation for the combined music conditions versus silent fixation (Table 2). Sixteenof these differential activations were the result of increased activation in the WS group, andthree were the result of increased activation in the TD group. None involved significantdeactivations in the respective contrast group.
Previous studies suggest that attending to auditory stimuli results in hypoactivation of the visualcortex (Laurienti et al., 2002). Therefore, the differential activations in the occipital lobe areasthat are associated with visual processing—cuneus, middle occipital gyrus and lingual gyrus—were highly unexpected. At the within-group level of analysis, increased activation in theseoccipital lobe areas was significant only for the WS group (Figure 2). Inspection of theunderlying distributions of these occipital activations reveals a shift in the mean percent signal
Thornton-Wells et al. Page 4
Am J Intellect Dev Disabil. Author manuscript; available in PMC 2011 March 1.
NIH
-PA Author Manuscript
NIH
-PA Author Manuscript
NIH
-PA Author Manuscript
change from near or below zero (+0.27 to −0.42) for the TD group to approximately one percent(+0.87 to +1.00) in the WS group, with comparable within group variability (Figure 3). Notably,posthoc correlational analyses showed no relationship between measures of musicality andoccipital lobe activations in either group. These highly unusual responses to music listeningin areas of the brain known to be involved in vision motivated our subsequent two studies inWS subjects, in which we aimed to better localize and characterize these activations.
In addition, as seen in a previous report (Levitin et al., 2003), the cerebellum showed increasedbilateral activation in the WS group. There were also a number of other activations in regionsnot previously reported to be associated with auditory perception in the WS group (see Table2). Some of these were in areas related to emotion processing—insula, parahippocampal gyrusand posterior cingulate gyrus—which are consistent with increased emotional experience withmusic for individuals with WS.
We had identified the amygdala as an a priori region of interest (ROI) based on previous fMRIfindings (Levitin et al., 2003). While we did find amygdala activation to music listening, wefound no significant difference in this activation between the WS and TD groups using abetween-groups ROI general linear model (GLM). Two regions involved in audition, thebilateral superior and middle temporal gyri (STG and MTG, respectively), were also selectedas a priori ROIs based on previous findings (Levitin et al., 2003). The STG was activatedbilaterally in both WS (t = 6.95, p < 2 × e−5) and TD (t = 9.34, p < 5 × e−6), and the between-groups ROI GLM was not significant (see Figure 2). Activations in the MTG were moreisolated, primarily to the posterior portions of the gyrus, and only the WS activations weresignificant (t = 5.90, p < 8 × e−5). Once again, using a between-groups ROI GLM, we did notfind significant differences between the WS and TD groups.
In summary, in Study 1, we investigated differences in brain responses to music in individualswith WS versus TD controls. Novel activations in occipital lobe areas related to visualprocessing were found in the WS group. We also found increased activation in areas relatedto emotion processing in the WS group.
STUDY 2: Localization of WS occipital lobe responses to musical stimuliusing color localizer and retinotopyMethods
Subjects—Ten WS participants in Study 1 who showed activations to musical stimuli inoccipital lobe regions were asked to participate in a follow-up study. Of these, six participants(five males) were available for follow-up scans. After their scans, we interviewed participantsabout how they experienced the musical stimuli they heard, as well as other music. Becauseindividuals with WS are highly suggestive and are very eager to please, we used open-ended,non-leading questions regarding how participants experience music (e.g., When you listen tomusic, what happens to you? When you hear that song, how do you feel? What do you thinkabout or imagine when you are listening to music?).
Functional NeuroimagingMusic Stimuli and fMRI Experimental Design: Musical stimuli used in Study 2 consistedof (1) songs and (2) musical notes and chords. Although brain responses to upbeat versusdownbeat music were not consistent across subjects in Study 1, we were still interested inwhether familiarity or preference for the stimuli might be important, or whether auditory stimulidevoid of emotional valence might give similar brain responses. Thus, we had each participantchoose songs he/she liked, and then we, the researchers, picked songs that all participants wouldhear. Song stimuli consisted of three 30 sec song clips selected by the participant (PS songs)
Thornton-Wells et al. Page 5
Am J Intellect Dev Disabil. Author manuscript; available in PMC 2011 March 1.
NIH
-PA Author Manuscript
NIH
-PA Author Manuscript
NIH
-PA Author Manuscript
and three 30 sec song clips selected by the researchers (RS songs). All RS songs wereinstrumental, but for the PS songs, participants were allowed to select any songs, some of whichcontained vocals. We also wanted to test some more basic musical stimuli generally devoid ofemotional valence, so we chose single musical notes and chords. The notes and chords weretwo-second clips of a single note (A, C or E) or chord (A, C or E major), generated electronicallyto simulate either a piano or a guitar, with an equal number of clips from each instrument.There was also a silent rest condition. During all conditions, visual stimuli consisted of a blackbackground with a white cross, on which subjects were instructed to fixate throughout thefunctional runs.
Two block design runs (270 sec each) of song stimuli were conducted (see Figure 4). Each runconsisted of three blocks of PS songs (3 × 30sec = 90 sec total), three blocks of RS songs (3 ×30sec = 90 sec total), and three blocks of rest (3 × 30sec = 90 sec total). Each song blockconsisted of only one song clip. The presentation order of the song blocks was randomized,and a silent block followed every song block.
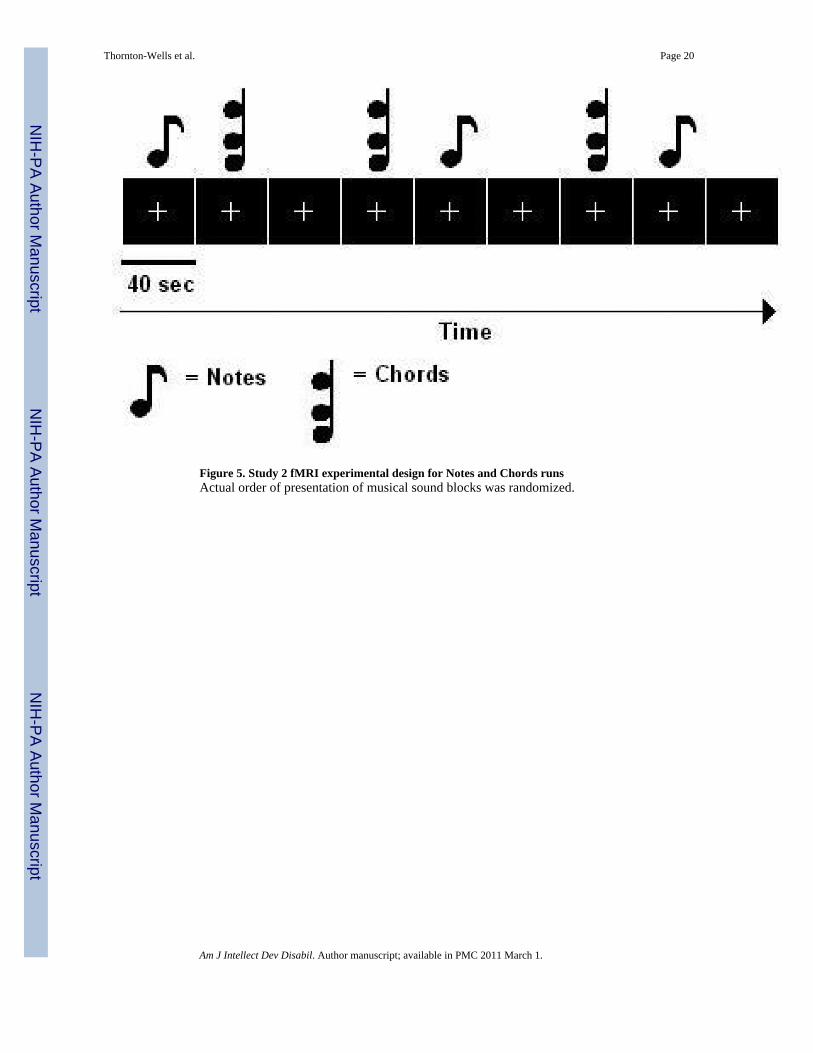
Two block design runs (360 sec each) of notes and chords were also conducted in Study 2 (seeFigure 5). Each music block consisted of 20 clips of the 2 sec long stimuli (40 sec per block).Each run consisted of three blocks of notes (3 × 40 sec = 120 sec), three blocks of chords (3 ×40 sec = 120 sec), and three blocks of silent rest (3 × 40 sec = 120 sec). The presentation orderof the music blocks and the presentation order of the stimuli (notes/chords) within a block wererandomized. A silent block followed every music block.
Retinotopy and Color Localizer Experiments: In Study 2, retinotopically organized visualareas V1, V2, V3, and V4v were identified using conventional phase-encoded retinotopicmapping methods (DeYoe et al., 1996; Engel et al., 1997; Sereno et al., 1994). Functional MRIimages were acquired while participants viewed a slowly rotating, contrast-reversingcheckerboard wedge subtending 22.5 deg in polar angle while fixating on the center cross. Thewedge started at the lower right visual field and slowly rotated counter-clockwise. After 8 sec,the wedge was at the lower vertical meridian and kept rotating counter-clockwise for a fullcycle of 360 deg thereafter (within 64 sec). Each retinotopic mapping run consisted of 4repetitions of this rotation. Each of two color localizer scans lasted 4 min 32 sec, the initial 8sec (4 volumes) of which were discarded prior to analysis to allow MR stabilization.
Color-selective areas were also defined by a conventional color area localizer that contrastsviewing of partially overlapping chromatic rectangles (i.e., chromatic Mondrians) with viewingof achromatic, luminance-varied Mondrians (Howard et al., 1998). Each of two color localizerscans lasted 5 min 4 sec, the initial 8 sec (4 volumes) of which were discarded prior to analysisto allow for MR stabilization. The scan was divided into 6 blocks of chromatic Mondrians and6 blocks of achromatic Mondrians, with interspersed fixation baseline blocks.
Functional MRI data from the retinotopic mapping and color localizer scans were registeredwith the subject’s high-resolution anatomical images, providing a subject-specific mapping ofvisual area regions of interest (ROIs) at the voxel level. These ROIs were used for analyzingthe functional MR images corresponding to the music listening conditions.
Statistical Analysis—A fixed-effects GLM with separate study predictors (for multipleruns) was applied to each subject’s functional MRI data from the music stimuli experiments.Statistical maps of BOLD activation were generated for music conditions, and due to the highlyconstrained nature of our hypothesis to determine whether activations were present withinvisual cortex, we used a slightly more liberal significance threshold of 0.01. Retinotopicallydefined visual areas were identified using cross correlation analysis on the retinotopic mappingdata. Data from two separate functional runs were averaged for statistical analysis. We used
Thornton-Wells et al. Page 6
Am J Intellect Dev Disabil. Author manuscript; available in PMC 2011 March 1.
NIH
-PA Author Manuscript
NIH
-PA Author Manuscript
NIH
-PA Author Manuscript
the predicted hemodynamic signal time course for the first half of a stimulation cycle(corresponding to 180° visual angle in the polar mapping experiment) and shifted this referencefunction successively in time. Sites activated at particular polar angles were identified throughselection of the lag value that resulted in the highest cross-correlation value for a particularvoxel (Muckli et al., 2005). Color-selective regions of interest (ROIs) were defined as theclusters of voxels that showed significantly higher BOLD response (multi-study GLM on twoscans; p < 0.05, FDR corrected) to colored Mondrians than to achromatic Mondrians. Insubjects whose color localizer or retinotopy data did not permit adequate localization, extraefforts were made to identify early visual, including color-selective, areas from each subject’sanatomy. For example, the calcarine sulcus (whose banks are V1 areas) of a subject wasexamined to see if any of voxels activated by auditory stimulation fell on or around this region.It should be noted that each subject had good localization on one or both of the color localizerand retinotopy scans. For Subjects 2 and 5, functional runs using the PS and RS songs wereincomplete and could not be analyzed.
ResultsSince individuals with WS are known to have decreased cortical volume in posterior occipitaland parietal areas, it was important to test whether such differences in anatomy across groups,which can result in poor coregistration of images, was responsible for the novel occipital lobeactivations found in Study 1. Study 2 assessed whether within-subject occipital lobe activationsto music were located in areas related to visual processing, as initially expected from Study 1based on anatomy, and how areas of activation to music related spatially to visual cortical areas.
Within-subject functional ROIs were identified based on color localizer and retinotopy scans.All six subjects with WS showed activation (p < 0.01) to one or more musical conditions inareas that were identified by color localizer, retinotopy and/or anatomy as being visual areas,including V1, V1 and V4v (Table 3). The contrasts involving simple chords consistentlyactivated early visual areas, including color-selective areas, across all six subjects. Contrastsinvolving the participant-selected (PS) or researcher-selected (RS) songs showed activation invisual area ROIs in three of the four subjects for which there were complete data.
We also used more stringent subject-specific ROI GLM analyses to determine whether theactivation across the entire volume of a given visual ROI was significantly different for a musiccondition versus silent fixation. All six subjects had at least one color localizer ROI that wassignificantly activated by either the notes or the chords condition versus silent fixation contrast.In contrast, only one subject had activation to the PS song that was significant by ROI GLManalysis. Figure 6 shows intra-subject activations to the chords condition in visual areasidentified using their respective color localizer ROIs. Table 3 summarizes data from colorlocalizer and retinotopy analyses, indicating which visual areas (denoted by †) were activatedsignificantly (by ROI GLM analysis) to which conditions in which subjects. It should be notedthat hypoactivations, indicating lower BOLD response than during silent fixation, were alsoobserved in visual areas to some conditions in five of six subjects, as would be more typicalof (inhibitory) brain responses to auditory perception tasks (Laurienti et al., 2002).
In summary, Study 2 demonstrated that early visual areas, including color-selective areas, werebeing activated to music in individuals with WS. Notably, visual cortex responses were moreconsistent across subjects for the simple musical stimuli of notes and chords than to songs.
Thornton-Wells et al. Page 7
Am J Intellect Dev Disabil. Author manuscript; available in PMC 2011 March 1.
NIH
-PA Author Manuscript
NIH
-PA Author Manuscript
NIH
-PA Author Manuscript
STUDY 3: Characterization and localization of WS occipital lobe responsesto non-musical stimuliMethods
Subjects—All six participants from Study 2 were asked to participate in a third MRI scanfor Study 3; of these, four (all males) were available to participate. After their scans, participantswere re-interviewed with open-ended questions regarding how they experienced the samesongs involved in Study 2, as well as notes, chords and other music.
Two block design runs (360 sec each) were conducted (see Figure 7). Each sound blockconsisted of 12 clips of the two-second stimuli (12 × 2 sec = 24 sec per block). Each runconsisted of three blocks of notes (3 × 24 sec = 72 sec), three blocks of chords (3 × 24 sec =72 sec), three blocks of human non-word vocalizations (3 × 24 sec = 72 sec), three blocks ofwhite noise (3 × 24 sec = 72 sec), and three blocks of silent rest (3 × 24 sec = 72 sec). Thepresentation order of the sound blocks and the presentation order of the stimuli within a blockwere randomized. A silent rest block followed each repetition of the four sound blocks.
Statistical Analysis—A fixed-effects GLM with separate study predictors was applied toeach subject’s functional MRI data from the sound stimuli experiments. Statistical maps ofBOLD activation were generated for each sound condition, and due to the highly constrainednature of our hypothesis to determine whether activations were present within visual cortex,we used a slightly more liberal significance threshold of 0.01. Each subject’s anatomical imagesfrom Study 3 were co-registered with those from Study 2, and then functional data wereregistered with the subject’s high-resolution anatomical images, providing a subject-specificmapping of visual area regions of interest (ROIs) at the voxel level. These ROIs were used foranalyzing the auditory condition functional MR images.
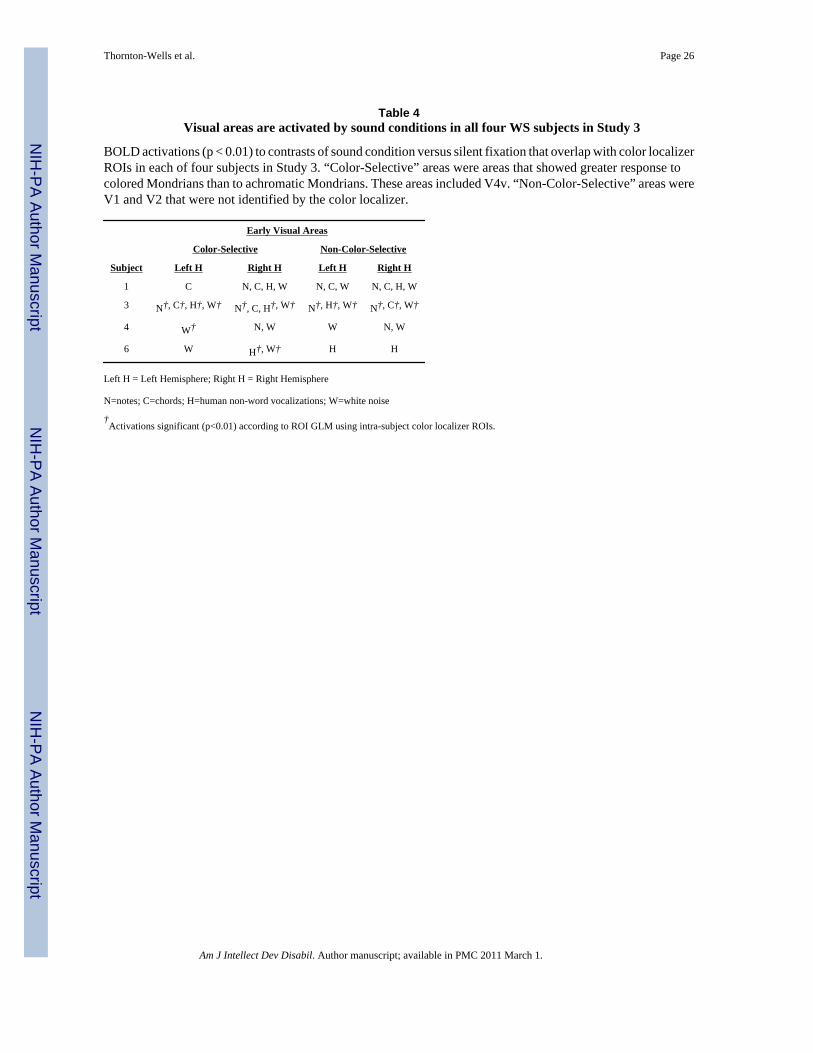
ResultsIn a final study, we assessed whether non-musical auditory stimuli could also elicit activationin areas of the brain involved in visual processing. The same within-subject functional ROIsidentified using color localizer and retinotopy scans in Study 2 were used in Study 3. All foursubjects showed activation (p < 0.01) to one or more sound conditions in areas that wereidentified by color localizer, retinotopy and/or anatomy as being visual areas (Table 4). Brain
Thornton-Wells et al. Page 8
Am J Intellect Dev Disabil. Author manuscript; available in PMC 2011 March 1.
NIH
-PA Author Manuscript
NIH
-PA Author Manuscript
NIH
-PA Author Manuscript
responses to notes and chords were not as consistent as they were in Study 2, perhaps due tolower power (fewer data points) per condition; however, each subject showed activation invisual areas to one or both of these conditions versus silent fixation. Three of four subjectsshowed activation to the human non-word vocalization condition versus silent fixation (Figure6). All four subjects showed activation to the white noise condition versus silent fixation(Figure 6). As in Study 2, hypoactivations, indicating lower BOLD response than during silentfixation, were also observed in early visual areas to some auditory conditions in each of thefour subjects, as would be more typical of (inhibitory) brain responses to auditory perceptiontasks (Laurienti et al., 2002).
DISCUSSIONIn this three-part study we examined the neural correlates of the unique auditory and musicalphenotype of individuals with WS. Previous work focused on differential activation of theamygdala and temporal lobes in music perception in subjects with WS versus TD controls(Levitin et al., 2003). While we did observe a trend toward weaker but more widespreadactivation of temporal lobe areas in WS versus TD, these results were not significant in ourlarger sample using more conservative ROI GLM analyses. Instead, we found compellingevidence that some persons with WS activate occipital and early visual areas in response tomusical and other auditory stimuli. These novel findings have implications for current viewsof cross-modal processing in the general population, and they may help explain the unusuallystrong attraction to music and sounds often seen in people with WS.
At first glance, these cross-sensory activations of visual cortical areas are reminiscent of brainactivations in synesthetic individuals who report seeing colors when listening to musical notes(Rizzo & Eslinger, 1989) or spoken words (Nunn et al., 2002). Indeed, upon repeatedinterviews, our participants with WS reported vivid, detailed, colorful imagery in response tolistening to music, including favorite songs, and these images often contained strong affectiveconnotation (see sample excerpt in Appendix). However, unlike classical synesthesia, subjectswith WS did not describe experiencing the exact same visual sensations in response to specificnotes, chords, or songs; consistent, repeatable sensory experience is another definingcharacteristic of synesthesia. In this respect, the visual experiences of the subjects with WSdepart from that of the classic synesthesia syndrome.
Nonetheless, the finding that simple notes and chords and two types of non-musical stimuli(chosen because they seemed unlikely to produce visual imagery) activated early visual areasstrongly suggests that the responses in WS participants might be stimulus-driven and not—atleast not exclusively—the result of top-down feedback or association pathways. Likewise, thefact that all types of auditory stimuli we presented elicited these responses, albeit to varyingdegrees in different individuals, suggests that they were likely not being filtered for salienceand, therefore, might be the result of bottom-up, or automatic, processes. Thus, it perhaps isworthwhile to consider possible common mechanisms that might underlie both synesthesiaand the phenomenon we observe in individuals with WS. One mechanism posited by the “cross-activation” theory of synesthesia states that functionally distinct brain regions, such as theauditory and visual cortices, possess aberrant neural connections in individuals withsynesthesia, as the result of failure of pruning at some point in development (Maurer, 1993;Baron-Cohen et al., 1993). A second theory posits “disinhibited feedback,” whereby functionalsegregation of brain regions (due to top-down inhibitory processes that strengthen during thecourse of development) is unusually weak in individuals with synesthesia (Grossenbacher &Lovelace, 2001). While these theories are often treated as competing, they need not be mutuallyexclusive; indeed, both of these processes could be at work in the same individual or in a groupthat shares similar sensory phenomena.
Thornton-Wells et al. Page 9
Am J Intellect Dev Disabil. Author manuscript; available in PMC 2011 March 1.
NIH
-PA Author Manuscript
NIH
-PA Author Manuscript
NIH
-PA Author Manuscript
In this vein, growing evidence indicates that cross-modal integration of information from twoor more sensory modalities is the norm rather than the exception and that sensory cortical areasare not as isolated from each other as previously thought. Both animal and human studiessuggest that we all have, to some degree, feedback pathways from areas of the brain that respondto multiple sensory modalities (e.g., auditory and visual) (Calvert et al., 1999; Driver & Spence,2000; Macaluso et al., 2001). At least one study found that synesthetic experience exploits thesame neural connections that enable cross-modal mechanisms, suggesting that these pathwaysare not privileged to synesthetes (Ward et al., 2006). These shared neural connections lendsupport for the disinhibited feedback (reduced top-down inhibition) theory of synesthesiaplaying a role in the unique auditory-visual phenomenon observed in participants with WS.
Our analysis of the underlying distribution of visual activations to sound (Figure 3) lendsfurther support to the idea that cross-modal processing might not be unique to synesthetes butthat there is a wide distribution of ability and that individuals with synesthesia are at one endof the spectrum and that, on average, individuals with WS are also near the end of that spectrumbut to a lesser degree than synesthetes. Activations that extended beyond the boundaries ofvisual areas mapped by retinotopy and color localizer might also implicate associationpathways. While the literature on auditory processing in TD does not include reports of visualactivation to auditory stimuli, most studies simply do not look for them and possibly dismissthem as spurious when they are found, since they do not conform to the dogma that sensorysystems are “hard-wired” and functionally distinct. The literature on auditory processing inpersons with congenital blindness, however, shows extensive plasticity of sensory cortices andthe recruitment of occipital lobe areas for the processing of auditory stimuli (Collignon et al.,2009;Hertrich et al., 2009).
Although under some debate, a developmental approach suggests that multisensory processing,and perhaps synesthesia, might be the norm in infancy, with perceptual systems becoming morespecialized throughout development (Maurer, 1993; Baron-Cohen et al., 1993; Baron-Cohenet al., 1996; Harrison, 2001). It is not clear what developmental features in WS might contributeto altered sensory processing, but one study implicates aberrant neurotrophin nerve growthfactor (NGF) levels. Calamandrei et al. (2000) examined hyperacusis and other auditoryabnormalities in WS and found that while NGF levels were elevated in typically-developingchildren from 2 to 6 years of age, individuals with WS had high NGF levels from 2 to 20 yearsof age, more than 4 times as long as in controls (Calamandrei et al., 2000). This extendedwindow of prolonged, high NGF could be responsible, in part, for the abnormal developmentof cortical regions and/or the white matter tracts that connect them. This would lend supportfor the cross-activation (reduced pruning) theory of synesthesia playing a role in the uniquevisual experience to sound in individuals with WS.
Preliminary findings from diffusion tensor imaging (DTI) studies shed some light on alteredfiber tracts in WS. Marenco et al. recently used DTI to examine white matter architecture inhigh-functioning WS adults and IQ-matched typical controls (Marenco et al., 2007). Subjectswith WS showed increases in longitudinal tracts, coursing along the anterior-posterior axis,and decreases in transverse fibers, coursing right-to-left. Further, compared to controls, thelongitudinal fiber tracts in those with WS, including the inferior longitudinal fasciculus (ILF)that connects the temporal and occipital lobes, had increased fiber coherence (anisotropy),skewness and lattice index values. Also, fiber tracts of WS subjects diverged from those ofcontrols at the junction between the medial temporal and occipital lobes. Hoeft et al. (2007)also found evidence of increased fractional anisotropy (FA) in the ILF, particularly in the rightILF, which the authors suggest might be related to relative strengths in face recognition (Hoeftet al., 2007). Marenco et al. speculate that these findings might be related to the relativelyspared verbal abilities in WS (Marenco et al., 2007). Although it is unclear whether these
Thornton-Wells et al. Page 10
Am J Intellect Dev Disabil. Author manuscript; available in PMC 2011 March 1.
NIH
-PA Author Manuscript
NIH
-PA Author Manuscript
NIH
-PA Author Manuscript
findings will generalize to a WS cohort with more variable IQs, DTI findings may also relateto the unique visual activations to auditory stimuli we are reporting here.
Future studies also should investigate the genetic basis of this unusual cross-sensory‘hyperconnectivity’ in WS. Almost all persons with WS have the same chromosomalmicrodeletion, with the same breakpoints; however, the identification of atypical cases of WSwith shorter or longer deletions, translocations, or inversions has aided in the ongoing attemptsto map specific genes to particular parts of the WS phenotype, including cardiac defects,visuospatial deficits, hypersociability and intellectual disability, in general (Bellugi et al.,1999; Tassabehji et al., 1999; Borg et al., 1995; Frangiskakis et al., 1996; Gray et al., 2006;Morris et al., 2003; Tassabehji et al., 2005; Morris et al., 2003; Doyle et al., 2004; Young etal., 2007). Thus far, no genes in the chromosome 7 deletion region have been associated withdifferences in auditory perception, musicality or affective response to music. Within groupvariability in the cross-modal connectivity or musical phenotype of persons with WS could bedue to other genetic factors or environmental exposures, such as musical training, neither ofwhich has been fully explored in the literature.
Despite the challenge of recruiting adequate numbers of participants with rare disorders suchas WS, Study 1 included a sample size (13 with WS; 13 controls) that represents the largestfMRI study to date on auditory processing in WS. Future studies should strive to increase thesenumbers further and should include a wider range of auditory stimuli, including sounds withpositive or negative emotional valence or those are encountered in everyday life.
The choice of an appropriate control group and matching criteria is very important and oftencontroversial. In the current study, we were primarily interested in understanding howindividuals with WS differ from those with TD. However, it would also be interesting to nowinvestigate these same phenomena in other neurodevelopmental groups, such as Downsyndrome or autism, whose neuropsychological profiles are very different from that of WS.Given the wide range of intellectual disability in our WS group and our choice to use TDcontrols, we did not try match subjects on mental age. Hence, intellectual ability is a potentialconfounder in this study. Finally, although we did not find evidence for a relationship betweenmusicality and cross-modal activity, perhaps other musically-enriched samples such asprofessional musicians or individuals with perfect pitch would show evidence of cross-modalprocessing similar to that seen in WS. Ideally, future studies would try to control for musicalinterest (regardless of talent), as well as for musical talent.
This study is among the first to examine brain responses to music and auditory stimuli in WS.Musicality remains a less-well understood but prominent feature of the WS behavioralphenotype, and findings from this three-part study have led to new hypotheses regarding multi-sensory processing in this population. Not all persons with WS have a passion for music, andit is unclear if only certain subsets of those with WS respond to auditory stimuli with visualactivation. Our ongoing analyses of structural and functional connectivity, especiallyconnections between auditory and visual cortical regions are promising ways to shed light onthis question.
AcknowledgmentsThe authors thank the many individuals with Williams Syndrome and their families for their participation in thisresearch. The authors gratefully acknowledge the efforts of Elizabeth Roof, Rebecca Kossler and Elizabeth Pantinoin organizing and helping conduct the fMRI scans for this project, the statistical consultation provided by Drs. BaxterRogers and Jennifer Blackford and the careful reading of an earlier draft of the manuscript by Drs. Blackford, NicoleDavis and Pat Levitt. This work has been funded in part by the National Institutes of Health through the NIH Roadmapfor Medical Research (T32 MH075883), the National Institute of Child Health and Development (P30 HD15052), theNational Eye Institute (R03 EY014437), and a Vanderbilt University Discovery Grant.
Thornton-Wells et al. Page 11
Am J Intellect Dev Disabil. Author manuscript; available in PMC 2011 March 1.
NIH
-PA Author Manuscript
NIH
-PA Author Manuscript
NIH
-PA Author Manuscript
ReferencesAchenbach, TM. Manual for the Child Behavior Checklist. Burlington, VT: University of Vermont,
Department of Psychiatry; 1991. Ref Type: GenericBaron-Cohen S, Burt L, Smith-Laittan F, Harrison J, Bolton P. Synaesthesia: Prevalence and familiarity.
Perception 1996;25:1073–1079. [PubMed: 8983047]Baron-Cohen S, Harrison J, Goldstein LH, Wyke M. Coloured speech perception: Is synaesthesia what
happens when modularity breaks down? Perception 1993;22:419–426. [PubMed: 8378132]Bayes M, Magano LF, Rivera N, Flores R, Perez Jurado LA. Mutational mechanisms of Williams-Beuren
syndrome deletions. Am J Hum.Genet 2003;73:131–151. [PubMed: 12796854]Belin P, Zatorre R, Lafaille P, Ahad P, Pike B. Voice-selective areas in human auditory cortex. Nature
2000;403:309–312. [PubMed: 10659849]Bellugi U, Lichtenberger L, Mills D, Galaburda A, Korenberg JR. Bridging cognition, the brain and
molecular genetics: evidence from Williams syndrome. Trends Neurosci 1999;22:197–207. [PubMed:10322491]
Blomberg S, Rosander M, Andersson G. Fears, hyperacusis and musicality in Williams syndrome.Research in Developmental Disabilities 2006;27:668–680. [PubMed: 16269236]
Borg I, Delhanty JD, Baraitser M. Detection of hemizygosity at the elastin locus by FISH analysis as adiagnostic test in both classical and atypical cases of Williams syndrome. J.Med.Genet 1995;32:692–696. [PubMed: 8544187]
Calamandrei G, Alleva E, Cirulli F, Queyras A, Volterra V, Capirci O, et al. Serum NGF levels in childrenand adolescents with either Williams syndrome or Down syndrome. Dev.Med.Child Neurol2000;42:746–750. [PubMed: 11104346]
Calvert GA, Brammer MJ, Bullmore ET, Campbell R, Iversen SD, David AS. Response amplificationin sensory-specific cortices during crossmodal binding. Neuroreport 1999;10:2619–2623. [PubMed:10574380]
Collignon O, Voss P, Lassonde M, Lepore F. Cross-modal plasticity for the spatial processing of soundsin visually deprived subjects. Exp.Brain Res 2009;192:343–358. [PubMed: 18762928]
Cox RW. AFNI: Software tools for analysis and visualization of FMRI Data. Computers and BiomedicalResearch 1996;29:162–173. [PubMed: 8812068]
DeYoe EA, Carman GJ, Bandettini P, Glickman S, Wieser J, Cox R, et al. Mapping striate and extrastriatevisual areas in human cerebral cortex. Proc.Natl.Acad Sci.U.S.A 1996;93:2382–2386. [PubMed:8637882]
Doyle TF, Bellugi U, Korenberg JR, Graham J. "Everybody in the world is my friend" hypersociabilityin young children with Williams syndrome. Am.J.Med.Genet.A 2004;124:263–273. [PubMed:14708099]
Driver J, Spence C. Multisensory perception: beyond modularity and convergence. Curr.Biol2000;10:R731–R735. [PubMed: 11069095]
Dykens EM. Anxiety, fears, and phobias in persons with Williams syndrome. Dev.Neuropsychol2003;23:291–316. [PubMed: 12730029]
Dykens EM, Rosner BA. Refining behavioral phenotypes: personality-motivation in Williams andPrader-Willi syndromes. Am.J.Ment.Retard 1999;104:158–169. [PubMed: 10207579]
Dykens EM, Rosner BA, Ly T, Sagun J. Music and anxiety in Williams syndrome: a harmonious ordiscordant relationship? Am J Ment.Retard 2005;110:346–358. [PubMed: 16080773]
Engel SA, Glover GH, Wandell BA. Retinotopic organization in human visual cortex and the spatialprecision of functional MRI. Cereb.Cortex 1997;7:181–192. [PubMed: 9087826]
Frangiskakis JM, Ewart AK, Morris CA, Mervis CB, Bertrand J, Robinson BF, et al. LIM-kinase1hemizygosity implicated in impaired visuospatial constructive cognition. Cell 1996;86:59–69.[PubMed: 8689688]
Gaser C, Luders E, Thompson PM, Lee AD, Dutton RA, Geaga JA, et al. Increased local gyrificationmapped in Williams syndrome. Neuroimage 2006;33:46–54. [PubMed: 16901723]
Gray V, Karmiloff-Smith A, Funnell E, Tassabehji M. In-depth analysis of spatial cognition in Williamssyndrome: A critical assessment of the role of the LIMK1 gene. Neuropsychologia 2006;44:679–685. [PubMed: 16216290]
Thornton-Wells et al. Page 12
Am J Intellect Dev Disabil. Author manuscript; available in PMC 2011 March 1.
NIH
-PA Author Manuscript
NIH
-PA Author Manuscript
NIH
-PA Author Manuscript
Grossenbacher PG, Lovelace CT. Mechanisms of synesthesia: cognitive and physiological constraints.Trends Cogn Sci 2001;5:36–41. [PubMed: 11164734]
Harrison, J. Synaesthesia: The Strangest Thing. Oxford: Oxford University Press; 2001.Hayasaka S, Nichols TE. Validating cluster size inference: random field and permutation methods.
Neuroimage 2003;20:2343–2356. [PubMed: 14683734]Hertrich I, Dietrich S, Moos A, Trouvain J, Ackermann H. Enhanced speech perception capabilities in a
blind listener are associated with activation of fusiform gyrus and primary visual cortex. Neurocase2009;15:163–170. [PubMed: 19241219]
Hoeft F, Barnea-Goraly N, Haas BW, Golarai G, Ng D, Mills D, et al. More is not always better: increasedfractional anisotropy of superior longitudinal fasciculus associated with poor visuospatial abilitiesin Williams syndrome. J Neurosci 2007;27:11960–11965. [PubMed: 17978036]
Howard RJ, ffytche DH, Barnes J, McKeefry D, Ha Y, Woodruff PW, et al. The functional anatomy ofimagining and perceiving colour. Neuroreport 1998;9:1019–1023. [PubMed: 9601660]
Kippenhan JS, Olsen RK, Mervis CB, Morris CA, Kohn P, Meyer-Lindenberg A, et al. Geneticcontributions to human gyrification: sulcal morphometry in Williams syndrome. J.Neurosci2005;25:7840–7846. [PubMed: 16120786]
Klein AJ, Armstrong BL, Greer MK, Brown FR III. Hyperacusis and otitis media in individuals withWilliams syndrome. J Speech Hear.Disord 1990;55:339–344. [PubMed: 2329796]
Klein-Tasman BP, Mervis CB. Distinctive personality characteristics of 8-, 9-, and 10-year-olds withWilliams syndrome. Dev.Neuropsychol 2003;23:269–290. [PubMed: 12730028]
Laurienti PJ, Burdette JH, Wallace MT, Yen YF, Field AS, Stein BE. Deactivation of sensory-specificcortex by cross-modal stimuli. J Cogn Neurosci 2002;14:420–429. [PubMed: 11970801]
Levitin DJ. Musical behavior in a neurogenetic developmental disorder: evidence from WilliamsSyndrome. Ann.N.Y.Acad.Sci 2005;1060:325–334. [PubMed: 16597782]
Levitin DJ, Cole K, Chiles M, Lai Z, Lincoln A, Bellugi U. Characterizing the musical phenotype inindividuals with Williams Syndrome. Child Neuropsychol 2004;10:223–247. [PubMed: 15621847]
Levitin DJ, Cole K, Lincoln A, Bellugi U. Aversion, awareness, and attraction: investigating claims ofhyperacusis in the Williams syndrome phenotype. J.Child Psychol.Psychiatry 2005;46:514–523.[PubMed: 15845131]
Levitin DJ, Menon V, Schmitt JE, Eliez S, White CD, Glover GH, et al. Neural correlates of auditoryperception in Williams syndrome: an fMRI study. Neuroimage 2003;18:74–82. [PubMed: 12507445]
Loring DW, Meador KJ, Allison JD, Pillai JJ, Lavin T, Lee GP, et al. Now you see it, now you don't:statistical and methodological considerations in fMRI. Epilepsy Behav 2002;3:539–547. [PubMed:12609249]
Macaluso E, Frith CD, Driver J. Modulation of human visual cortex by crossmodal spatial attention.Science 2001;289:1206–1208. [PubMed: 10947990]
Marenco S, Siuta MA, Kippenhan JS, Grodofsky S, Chang WL, Kohn P, et al. Genetic contributions towhite matter architecture revealed by diffusion tensor imaging in Williams syndrome. Proc.Natl.AcadSci.U.S.A 2007;104:15117–15122. [PubMed: 17827280]
Maurer, D. Neonatal synaesthesia: Implications for the processing of speech and faces. In: de Boysson-Bardies, B.; de Schonen, S.; Jusczyk, P.; McNeilage, P.; Morton, J., editors. Developmentalneurocognition: Speech and face processing in the first year of life. Dordrecht: Kluwer; 1993.
Meyer-Lindenberg A, Hariri AR, Munoz KE, Mervis CB, Mattay VS, Morris CA, et al. Neural correlatesof genetically abnormal social cognition in Williams syndrome. Nat.Neurosci 2005a;8:991–993.[PubMed: 16007084]
Meyer-Lindenberg A, Kohn P, Mervis CB, Kippenhan JS, Olsen RK, Morris CA, et al. Neural basis ofgenetically determined visuospatial construction deficit in Williams syndrome. Neuron2004;43:623–631. [PubMed: 15339645]
Meyer-Lindenberg A, Mervis CB, Sarpal D, Koch P, Steele S, Kohn P, et al. Functional, structural, andmetabolic abnormalities of the hippocampal formation in Williams syndrome. J.Clin.Invest 2005b;115:1888–1895. [PubMed: 15951840]
Mobbs D, Eckert MA, Mills D, Korenberg J, Bellugi U, Galaburda AM, et al. Frontostriatal DysfunctionDuring Response Inhibition in Williams Syndrome. Biol.Psychiatry 2007;62:256–261. [PubMed:16996488]
Thornton-Wells et al. Page 13
Am J Intellect Dev Disabil. Author manuscript; available in PMC 2011 March 1.
NIH
-PA Author Manuscript
NIH
-PA Author Manuscript
NIH
-PA Author Manuscript
Mobbs D, Garrett AS, Menon V, Rose FE, Bellugi U, Reiss AL. Anomalous brain activation during faceand gaze processing in Williams syndrome. Neurology 2004;62:2070–2076. [PubMed: 15184616]
Morris CA, Mervis CB, Hobart HH, Gregg RG, Bertrand J, Ensing GJ, et al. GTF2I hemizygosityimplicated in mental retardation in Williams syndrome: genotype-phenotype analysis of five familieswith deletions in the Williams syndrome region. Am.J.Med.Genet.A 2003;123:45–59. [PubMed:14556246]
Muckli L, Kohler A, Kriegeskorte N, Singer W. Primary visual cortex activity along the apparent-motiontrace reflects illusory perception. PLoS.Biol 2005;3:e265. [PubMed: 16018720]
Nigam A, Samuel PR. Hyperacusis and Williams syndrome. J Laryngol.Otol 1994;108:494–496.[PubMed: 8027650]
Nunn JA, Gregory LJ, Brammer M, Williams SC, Parslow DM, Morgan MJ, et al. Functional magneticresonance imaging of synesthesia: activation of V4/V8 by spoken words. Nat.Neurosci 2002;5:371–375. [PubMed: 11914723]
Reilly J, Losh M, Bellugi U, Wulfeck B. "Frog, where are you?" Narratives in children with specificlanguage impairment, early focal brain injury, and Williams syndrome. Brain Lang 2004;88:229–247. [PubMed: 14965544]
Reiss AL, Eliez S, Schmitt JE, Straus E, Lai Z, Jones W, et al. IV. Neuroanatomy of Williams syndrome:a high-resolution MRI study. J.Cogn Neurosci 2000;12:65–73. [PubMed: 10953234]
Rizzo M, Eslinger PJ. Colored hearing synesthesia: an investigation of neural factors. Neurology1989;39:781–784. [PubMed: 2725872]
Schmitt JE, Eliez S, Warsofsky IS, Bellugi U, Reiss AL. Corpus callosum morphology of Williamssyndrome: relation to genetics and behavior. Dev.Med.Child Neurol 2001;43:155–159. [PubMed:11263684]
Sereno MI, McDonald CT, Allman JM. Analysis of retinotopic maps in extrastriate cortex. Cereb.Cortex1994;4:601–620. [PubMed: 7703687]
Stromme P, Bjornstad PG, Ramstad K. Prevalence estimation of Williams syndrome. J.Child Neurol2002;17:269–271. [PubMed: 12088082]
Tassabehji M, Hammond P, Karmiloff-Smith A, Thompson P, Thorgeirsson SS, Durkin ME, et al.GTF2IRD1 in craniofacial development of humans and mice. Science 2005;310:1184–1187.[PubMed: 16293761]
Tassabehji M, Metcalfe K, Karmiloff-Smith A, Carette MJ, Grant J, Dennis N, et al. Williams syndrome:use of chromosomal microdeletions as a tool to dissect cognitive and physical phenotypes.Am.J.Hum.Genet 1999;64:118–125. [PubMed: 9915950]
Thompson PM, Lee AD, Dutton RA, Geaga JA, Hayashi KM, Eckert MA, et al. Abnormal corticalcomplexity and thickness profiles mapped in Williams syndrome. J.Neurosci 2005;25:4146–4158.[PubMed: 15843618]
Wang PP, Doherty S, Hesselink JR, Bellugi U. Callosal morphology concurs with neurobehavioral andneuropathological findings in two neurodevelopmental disorders. Arch.Neurol 1992;49:407–411.[PubMed: 1532713]
Ward J, Huckstep B, Tsakanikos E. Sound-colour synaesthesia: to what extent does it use cross-modalmechanisms common to us all? Cortex 2006;42:264–280. [PubMed: 16683501]
Young EJ, Lipina T, Tam E, Mandel A, Clapcote SJ, Bechard AR, et al. Reduced fear and aggressionand altered serotonin metabolism in Gtf2ird1-targeted mice. Genes Brain Behav 2007;7:224–234.[PubMed: 17680805]
Appendix
Sample excerpt from participant interview after Study 2The following is a sample excerpt from one of the WS participant interviews about theirexperience listening to music. I: interviewer. P: participant.
I: ‘She’s gonna make it’ by Garth Brooks. Did you see anything when you heard that song?
Thornton-Wells et al. Page 14
Am J Intellect Dev Disabil. Author manuscript; available in PMC 2011 March 1.
NIH
-PA Author Manuscript
NIH
-PA Author Manuscript
NIH
-PA Author Manuscript
P: Mountain…with stairs on the mountain.
I: So tell me about the mountain. Did it have a color?
P: Orange.
I: All right. So the stairs, what did the stairs look like?
P: Like an escalator.
I: Anything else beside the mountain and the stairs?
P: It had roses on the steps.
I: What color were they?
P: Red.
I: They were red? Anything else can you tell me?
P: It was a wedding type thing.
I: Any people?
P: Just the bride and the bridesmaids were going upstairs.
I: What was the bride wearing?
P: She was wearing a white gown with a silver necklace with a diamond shape
I: What was the diamond shape?
P: The necklace. And she was wearing sandals.
I: Sandals?
P: Yeah, this is kinda weird.
I: So tell me about her sandals.
P: They were crocs.
I: Did the crocs have a color?
P: White, so they could match
I: At least she was matching.
P: Yeah.
Thornton-Wells et al. Page 15
Am J Intellect Dev Disabil. Author manuscript; available in PMC 2011 March 1.
NIH
-PA Author Manuscript
NIH
-PA Author Manuscript
NIH
-PA Author Manuscript
Figure 1. Study 1 fMRI experimental design for a single runActual order of presentation of music blocks was randomized.
Thornton-Wells et al. Page 16
Am J Intellect Dev Disabil. Author manuscript; available in PMC 2011 March 1.
NIH
-PA Author Manuscript
NIH
-PA Author Manuscript
NIH
-PA Author Manuscript
Figure 2. Occipital lobe and temporal lobe / insula activations to music listening in WS > TDContrast of combined musical conditions (Upbeat+Downbeat+HappyBirthday) versus silentfixation. Within-group GLM of WS group (left) and TD control group (center). Between-groups GLM showing activations greater in the WS group versus TD control group (right).Statistical group maps are rendered on a representative single subject anatomical image. Thetop row of images shows activations in the occipital lobe. The bottom row of images showsactivations in the left hemisphere.
Thornton-Wells et al. Page 17
Am J Intellect Dev Disabil. Author manuscript; available in PMC 2011 March 1.
NIH
-PA Author Manuscript
NIH
-PA Author Manuscript
NIH
-PA Author Manuscript
Figure 3. Distribution of occipital lobe activations to music listening by groupContrast of combined musical conditions (Upbeat+Downbeat+HappyBirthday) versus silentfixation. Vertical bars indicate group means.
Thornton-Wells et al. Page 18
Am J Intellect Dev Disabil. Author manuscript; available in PMC 2011 March 1.
NIH
-PA Author Manuscript
NIH
-PA Author Manuscript
NIH
-PA Author Manuscript
Figure 4. Study 2 block design for Song stimuli runsActual order of presentation of sound blocks was randomized.
Thornton-Wells et al. Page 19
Am J Intellect Dev Disabil. Author manuscript; available in PMC 2011 March 1.
NIH
-PA Author Manuscript
NIH
-PA Author Manuscript
NIH
-PA Author Manuscript
Figure 5. Study 2 fMRI experimental design for Notes and Chords runsActual order of presentation of musical sound blocks was randomized.
Thornton-Wells et al. Page 20
Am J Intellect Dev Disabil. Author manuscript; available in PMC 2011 March 1.
NIH
-PA Author Manuscript
NIH
-PA Author Manuscript
NIH
-PA Author Manuscript
Figure 6. Listening to musical and non-musical sounds activates early visual areasIntra-subject activations to chords (Study 2), human non-word vocalizations (Study 3) andwhite noise conditions (Study 3) versus silent fixation in early visual areas identified by colorlocalizer runs. Subjects 2 and 5 did not participate in Study 3.
Thornton-Wells et al. Page 21
Am J Intellect Dev Disabil. Author manuscript; available in PMC 2011 March 1.
NIH
-PA Author Manuscript
NIH
-PA Author Manuscript
NIH
-PA Author Manuscript
Figure 7. Study 3 block design for a sing runActual order of presentation of sound blocks was randomized.
Thornton-Wells et al. Page 22
Am J Intellect Dev Disabil. Author manuscript; available in PMC 2011 March 1.
NIH
-PA Author Manuscript
NIH
-PA Author Manuscript
NIH
-PA Author Manuscript
NIH
-PA Author Manuscript
NIH
-PA Author Manuscript
NIH
-PA Author Manuscript
Thornton-Wells et al. Page 23
Tabl
e 1
Stud
y 1
Subj
ect D
emog
raph
ics,
IQ a
nd M
usic
al E
xper
ienc
e
Age
Sex
Ver
bal I
QN
on-V
erba
l IQ
% S
ubje
cts W
ho H
ave
Play
ed
Sam
ple
Size
Med
ian
(Min
-Max
)M
FM
ean
± SD
Mea
n ±
SDA
t Lea
st 1
Inst
rum
ent
2 or
Mor
eIn
stru
men
ts
WS
1325
(16–
33)
85
80 ±
11
65 (1
9)77
%46
%
TD13
23(1
7–33
)7
611
4 ±
1510
3 ±
1610
0%54
%
Am J Intellect Dev Disabil. Author manuscript; available in PMC 2011 March 1.
NIH
-PA Author Manuscript
NIH
-PA Author Manuscript
NIH
-PA Author Manuscript
Thornton-Wells et al. Page 24
Tabl
e 2
WS
grou
p sh
ows i
ncre
ased
act
ivat
ion
to m
usic
list
enin
g
Sign
ifica
nt c
lust
ers o
f diff
eren
tial a
ctiv
atio
n by
gro
up to
com
bine
d (U
pbea
t + D
ownb
eat +
HB
) mus
ic c
ondi
tions
ver
sus s
ilent
fixa
tion.
Pos
itive
t-te
st v
alue
sin
dica
te a
ctiv
atio
n w
as g
reat
er in
the
WS
grou
p ve
rsus
TD
gro
up; n
egat
ive
t-tes
t val
ues i
ndic
ate
activ
atio
n w
as g
reat
er in
the
TD g
roup
ver
sus W
S gr
oup.
A c
lust
er th
resh
old
of 5
0 m
m3 a
nd a
vox
el-w
ise α
of 0
.005
wer
e us
ed to
cre
ate
the
stat
istic
al m
ap a
nd re
sulti
ng re
gion
s of i
nter
est.
Hem
i-sp
here
Reg
ion(
s)Su
breg
ion(
s)B
rodm
ann
Are
a
Clu
ster
Size
(mm
3 )
Peak
Act
ivat
ion
xy
zt
p
RFr
onta
l Lob
ePr
ecen
tral G
yrus
610
839
−344
3.85
0.00
08
RFr
onta
l Lob
eW
M,
Prec
entra
l Gyr
us6
135
326
363.
740.
002
RLi
mbi
c Lo
beIn
sula
1310
5345
−35
196.
010.
0000
03
RLi
mbi
c Lo
bePo
ster
ior C
ingu
late
3013
512
−47
64.
300.
0003
RTe
mpo
ral L
obe
Supe
rior T
empo
ral G
yrus
1310
856
−41
213.
900.
0007
RTe
mpo
ral L
obe
WM
,Su
perio
r Tem
pora
l Gyr
us13
108
55−4
215
3.32
0.00
3
RTe
mpo
ral L
obe
Infe
rior T
empo
ral G
yrus
3729
745
−65
−84.
840.
0000
7
LTe
mpo
ral L
obe
Supe
rior T
empo
ral G
yrus
3810
8−4
39
−16
3.52
0.00
2
LPa
rieta
l Lob
eW
M,
Infe
rior P
arie
tal L
obe
135
−32
−37
263.
700.
002
RO
ccip
ital L
obe
Cun
eus
1810
814
−68
154.
050.
0005
RO
ccip
ital L
obe
Cun
eus
1810
81
−80
213.
760.
001
LO
ccip
ital L
obe
WM
,M
iddl
e O
ccip
ital G
yrus
243
−34
−82
24.
320.
0003
RC
ereb
ellu
m,
Occ
ipita
l Lob
eD
ecliv
e,Li
ngua
l Gyr
us10
811
−76
−12
3.80
0.00
09
RC
ereb
ellu
mD
ecliv
e9
108
31−5
4−1
33.
330.
003
RC
ereb
ellu
mC
ulm
en27
021
−35
−11
5.36
0.00
002
LLi
mbi
c Lo
bePo
ster
ior C
ingu
late
2313
5−5
−50
23−4
.24
0.00
03
LTh
alam
usM
edia
l Dor
sal N
ucle
us13
5−4
−10
13−4
.51
0.00
02
RTe
mpo
ral L
obe
Infe
rior T
empo
ral G
yrus
2010
862
−25
−15
−3.8
70.
0008
Am J Intellect Dev Disabil. Author manuscript; available in PMC 2011 March 1.
NIH
-PA Author Manuscript
NIH
-PA Author Manuscript
NIH
-PA Author Manuscript
Thornton-Wells et al. Page 25
Table 3Visual areas are activated by musical conditions in all six WS subjects in Study 2
BOLD activations (p < 0.01) to contrasts of musical condition versus silent fixation that overlap with colorlocalizer ROIs in each of six subjects in Study 2. “Color-Selective” areas were areas that showed greater responseto colored Mondrians than to achromatic Mondrians. These areas included V4v. “Non-Color-Selective” areaswere V1 and V2 that were not identified by the color localizer.
Early Visual Areas
Color-Selective Non-Color-Selective
Subject Left H Right H Left H Right H
1 N, C†, RS N, C†, RS N, C† N, C†
2 N†, C† N, C --- N, C†
3 C† C C† C†
4 N†, C†, PS† N N, C†, PS†, RS N, C†
5 N C N, C† C†
6 C C†, RS RS
Right H = Right Hemisphere; Left H = Left Hemisphere
N=notes; C=chords; PS=participant-selected song; RS=researcher-selected song
†Activation significant (p<0.01) according to ROI GLM using subject-specific color localizer ROIs.
--- No early visual ROIs could be identified in this area for Subject 2.
Am J Intellect Dev Disabil. Author manuscript; available in PMC 2011 March 1.
NIH
-PA Author Manuscript
NIH
-PA Author Manuscript
NIH
-PA Author Manuscript
Thornton-Wells et al. Page 26
Table 4Visual areas are activated by sound conditions in all four WS subjects in Study 3
BOLD activations (p < 0.01) to contrasts of sound condition versus silent fixation that overlap with color localizerROIs in each of four subjects in Study 3. “Color-Selective” areas were areas that showed greater response tocolored Mondrians than to achromatic Mondrians. These areas included V4v. “Non-Color-Selective” areas wereV1 and V2 that were not identified by the color localizer.