53
Author: Robert Sweeney April 2021

Author: Robert SweeneyApril 2021

Published by:
CIOB
Fitzwilliam Business Centre
77 Sir John Rogerson’s Quay
Dublin 2
TASC
28 Merrion Square North
Dublin 2
Ireland
Tel: +353 1 616 9050
E-mail: [email protected]
Website: www.tasc.ie
Twitter: @TASCblog
© CIOB 2021 / TASC 2021
The present report does not represent the collective views of CIOB and TASC, but only of the respective authors. The responsibility of CIOB and TASC is limited to approving its publication as worthy of consideration.
With the financial support of the Chartered Institute of Building.
978-1-9993099-2-3
Executive Summary
3
Job quality in the Irish construction sector

Job quality in the Irish construction sector
4
Table of Contents

Foreword
5

ForewordI am delighted that the CIOB has teamed up with TASC to publish this important piece of work. Given the CIOB’s growing policy and research presence in Ireland, it is fitting that we are providing a data-driven study of the state of play in Ireland’s construction sector.
Construction affects everyone, influencing productivity and wellbeing, creating the homes, hospitals, schools, workplaces, and infrastructure essential for a good quality of life. It is therefore important to reflect on the sector itself, so we can continuously improve the quality of life and career prospects of those working in it, now and in the future.
There are encouraging findings in the report. The data shows that construction managers and qualified professionals in the sector are highly paid relative to other sectors. This reflects the important work they do. In addition, the high levels of job satisfaction and autonomy across the construction sector reflect the visible contribution construction makes to society.
Our Charter means that the CIOB acts in the public interest and, as such, we must make sure we tackle the issues raised in this report. The cyclical nature of construction work is the source of many of the challenges facing the sector and, while the report describes a sector that has evolved, there is still a lot of work to be done to improve inclusion and diversity and to open up conversations on other workplace issues, including mental health. We have made six recommendations for policy makers and industry leaders to implement, which will make a start with a targeted approach to addressing the challenges raised in the report.
My hope is that this report will be an aid to policy makers, industry leaders and professionals, academics and students and anyone attempting to understand the changing nature of the construction sector – and help us improve our sector and move it forward.
Caroline Gumble Chief Executive Officer, The Chartered Institute of Building (CIOB)
Job quality in the Irish construction sector
6

Introduction
7
IntroductionThe emergence of Ireland from the financial crisis that began in 2008 has been a long process. Consecutive years of cuts to public spending and increases in income and other taxes depressed economic activity. The construction sector was the hardest hit of all, and was also reeling from the effects of the collapsed housing bubble. The massive shedding of jobs led to a major loss of skills and know-how. People with knowledge built up from years of training and working in the sector could no longer find employment in the country, and so many emigrated. When the economy eventually began to recover, it is not surprising that the sector had a hard time in meeting the demands that were being placed on it.
The arrival of Covid-19 revealed society’s dependence on the less-celebrated sectors of the economy. This is most apparent in the low and less well-paid sectors such as hospitality and care, but it is also true of construction. The lockdowns and restrictions, while justified on public health grounds, have threatened the slow but improving increase in construction of housing and infrastructure in recent years. With much of the workforce required to remain at home, the risk is that the sector is once again ill-equipped to meet the pent-up demand that has been growing.
It is therefore essential that working in construction remains an attractive career. In a world of declining manufacturing employment and the emergence of often precarious and poorly-paid service jobs, construction work offers a realistic path to improve one’s living standards and, at the macro level, facilitate social mobility. This is and has been the case for working class men in particular who, it will be seen, are the traditional entrants into the industry. It is also true of non-nationals, who since the 2000s have comprised a significant share of the workforce. Women, however, remain a minority group, despite advances elsewhere in the world of work. With the world much changed since 2008, and the likelihood of an even more different one post-Covid, the future path of construction work is yet to be tread.
Construction, of course, goes beyond the on-site workforce. It is considered to include all of those who directly contribute toward the making of the built environment. That means not only electricians, block layers, and so on, but architects, engineers and indeed health and safety officers, administrators, and more form part of the sector. A diverse range of occupations work in the sector, though craft occupations or ‘trades’ remain the most prevalent.
Job quality in the Irish construction sector
8

Executive Summary
9

Executive Summary This report is an examination of job quality in the Irish construction sector. Job quality is multi-dimensional, and there are many ways to broach the subject. One aspect of employment is contractual stability. In recent years there has been growth in low paid, less-skilled, unstable service jobs in the wider economy. This can raise job-related stress, inhibit family formation, make access to accommodation difficult, and more. Stability of employment is therefore an important consideration in any assessment of job quality.
We will show that for most of the 2000s the level of precariousness in the construction sector was similar to the rest of the economy. Unsurprisingly, the financial crisis resulted in a steep decline in contractual stability as much of the workforce were made unemployed and firms struggled during the downturn. As the economy has recovered, so has stability of employment in the sector, and construction now has a lower proportion of temporary contracts compared to the rest of the economy. However, the recovery has been incomplete, and solo self-employment seems to be a particular problem.1 The cyclicality of the sector is at the root of many of the problems it faces including productivity, labour shortages, and job stability. We argue that addressing this boom-bust cycle needs to be a policy priority for Government.
Arguably the most important aspect of job quality is pay, which for many is the raison d’etre of employment. But how is the quality of pay to be measured? A simple hourly or annual monetary rate tells us something but doesn’t offer a benchmark against which quality can be assessed. Surely, pay is best assessed against the capacity of an industry and society to deliver it. But do international standards also matter?
We find that pay in the Irish construction industry is, on average, good. Pay is close to but somewhat below the national average wage. This puts Ireland around but slightly above most other EU countries. There is, though, much variation between the occupational groups. White collar construction workers are very well-paid, whereas blue-collar workers are somewhat below EU norms. There are a multitude of forces at play that push wages in different directions. This includes labour market institutions, productivity performance, and more.
If pay and terms were the only constituents of job quality, there would be little need to compensate for the various qualities of a job that make it difficult. In reality, the onerousness or ease of everyday activities make some forms of work more or less desirable, which is sometimes reflected in the pay. The list of in-work aspects of job quality is potentially endless. It could include workplace monotony, frequency of social interactions, quality of social interactions, autonomy, and more.
We favour a parsimonious approach that looks at how certain in-work components of job quality have evolved over time. As with pay and contractual terms, we also compare in work job quality in construction to the wider economy. The list of in-work indicators is certainly not exhaustive - most of are chosen on grounds of being general indicators of job quality while some are selected because of their relevance to construction. Construction workers report higher levels of autonomy than the workforce at large. Construction workers also report higher levels of feeling they are doing something useful in their work. Overall, the survey data suggests that construction provides for meaningful work where skills are applied to produce a tangible product to the benefit of society.
1 Though there is not an agreed upon definition, the bogus self-employed are those whose situation is comparable to that of employees, but who are classified as independent contractors (see Oireachtas, 2019; Revenue, 2019).
Job quality in the Irish construction sector
10
However, there is evidence that those in the sector are under more time pressure since the crisis. As we will show, there is also evidence that the social environment, especially bullying, is a problem, though it is not always reflected in surveys. Furthermore, the sector is still quite homogenous and, although the number of women working in the sector has increased significantly in recent years, there is still work to be done to diversify the labour pool. Construction work remains hazardous compared to other forms of work, though health and safety standards have improved significantly. The picture then is nuanced.
The report is organised as follows. Section 2 provides some context by looking at the boom-bust cycle in Ireland and the attendant skills and labour shortages that followed. Section 3 looks at the demographic make-up of the sector and evolution of contractual terms. Section 4 looks at income and pay, while Section 5 looks at in-work conditions. Section 6 offers some discussion, concluding thoughts, and policy recommendations
Executive Summary
11

Boom, bust, and the construction
workforce
12

Boom, bust, and the construction workforceBoom and bust in the Irish property marketThe Irish housing market and construction sector have undergone much turbulence in the past two to three decades. A cycle of boom and bust has emerged, as in many other countries around the world. This cycle posed major challenges for the stakeholders involved, which includes households, policymakers, firms, and, of course, construction workers.
The first major change occurred in the 1990s which witnessed a massive increase in mortgage credit. The expansion of mortgage credit to new households expanded the pool of buyers who could afford to purchase a home. As the supply of housing is relatively fixed in the short-term, the greater availability of credit led to a large increase in house prices, though it also led to a large expansion in house building. This building, moreover, often took place in inappropriate locations. The increase in credit in this period was first and foremost a result of regulatory changes in the banking system (Sweeney, forthcoming).
These trends can be seen in the figure below. It shows the trajectory of new mortgage loans approved and mortgage debt outstanding, both as a percentage of national income. However, mortgage loans approved relative to national income is converted to an index with 1990 as the base year with value 100. A value of 150 in a given year means that mortgage loans approved (relative to GNI*)2 are 50% greater than in 1990. Mortgage debt outstanding remains as a percentage of national income, whose values can be read from the right-hand axis. The figure also shows housing output – the number of new units built – expressed as an index with 1990 as the base year. Some of the actual housing supply numbers are also shown.
(relative to GNI*) 2 are 50% greater than in 1990. Mortgage debt outstanding remains as a percentage of national income, whose values can be read from the right hand axis. The figure also shows housing output – the number of new units built – expressed as an index with 1990 as the base year. Some of the actual housing supply numbers are also shown.
Figure 1: Boom and bust in the Irish housing market.
Sources: Mortgage loans approved based on CSO, housing output based on CSO and Housing Agency, and mortgage debt outstanding based on Central Bank. National income figure based on GNI* from CSO.
As can be seen both housing output and mortgage lending were quite stable from 1970 to the beginning of the 1990s. Lending then began to accelerate rapidly, increasing four and a half fold by its peak in 2006. Housing output follows a similar trend. As evidenced by an index value of 100 in 1990 to almost 500 in 2006, output in that year was almost five times what it was a decade and a half or so previously. This is well in excess of anything that could be explained by economic fundamentals such as population growth. When the bubble burst, both the supply of housing and credit contracted rapidly. Since the recovery around 2012, housing supply increased only slowly. With a pre-Covid output of just over 20,000 units, however, supply was around historical trends. As we shall discuss later, there is a strong case to be made that a housing shortage continues to exist. Though new mortgage loans approved appears to have rebounded as well, the stock of mortgage loans outstanding has fallen. This is due to the fact that repayments of mortgages have
2 GNI* is a measure of national income commonly used in Ireland instead of GDP. It attempts to strip out the distortions caused by tax shifting of multinationals which inflate GDP in Ireland.
Figure 1: Boom and bust in the Irish housing market.Sources: Mortgage loans approved based on CSO, housing output based on CSO and Housing Agency, and mortgage debt outstanding based on Central Bank. National income figure based on GNI* from CSO.
2 GNI* is a measure of national income commonly used in Ireland instead of GDP. It attempts to strip out the distortions caused by tax shifting of multinationals which inflate GDP in Ireland.
Boom, bust, and the construction workforce
13
As can be seen both housing output and mortgage lending were quite stable from 1970 to the beginning of the 1990s. Lending then began to accelerate rapidly, increasing four and a half fold by its peak in 2006. Housing output follows a similar trend. As evidenced by an index value of 100 in 1990 to almost 500 in 2006, output in that year was almost five times what it was a decade and a half or so previously. This is well in excess of anything that could be explained by economic fundamentals such as population growth. When the bubble burst, both the supply of housing and credit contracted rapidly. Since the recovery around 2012, housing supply increased only slowly. With a pre-Covid output of just over 20,000 units, however, supply was around historical trends. As we shall discuss later, there is a strong case to be made that a housing shortage continues to exist. Though new mortgage loans approved appears to have rebounded as well, the stock of mortgage loans outstanding has fallen. This is due to the fact that repayments of mortgages have outpaced new lending.
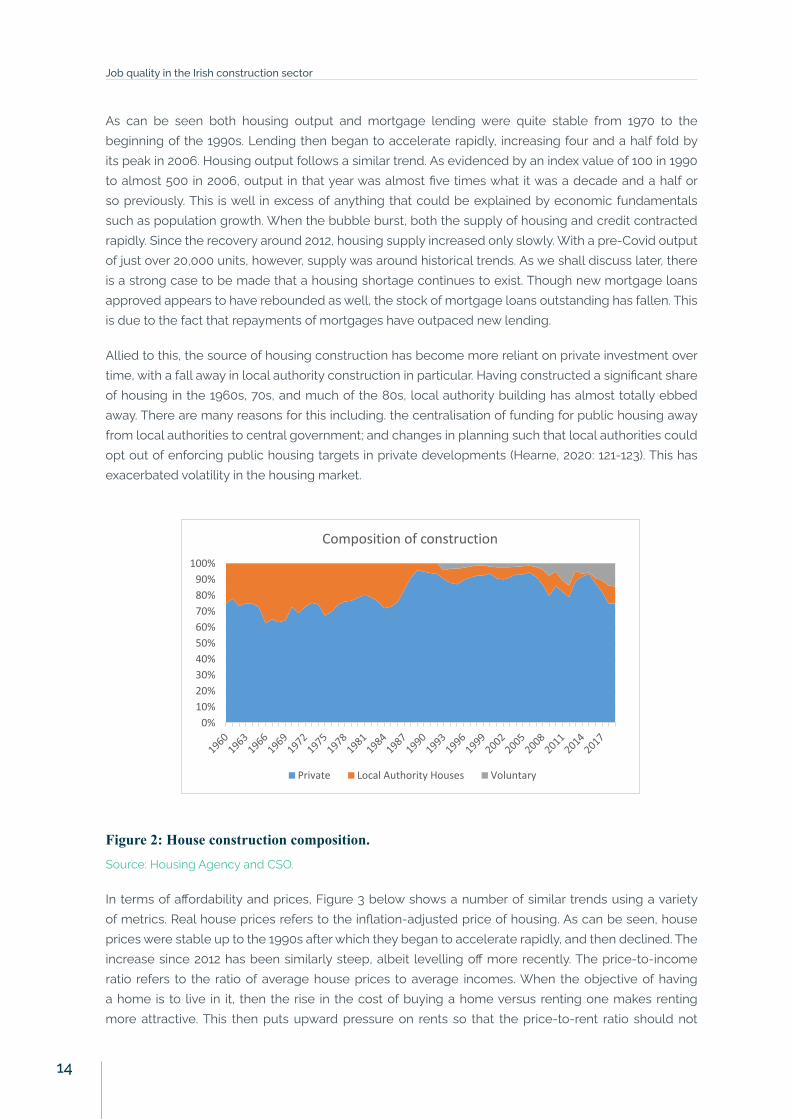
Allied to this, the source of housing construction has become more reliant on private investment over time, with a fall away in local authority construction in particular. Having constructed a significant share of housing in the 1960s, 70s, and much of the 80s, local authority building has almost totally ebbed away. There are many reasons for this including. the centralisation of funding for public housing away from local authorities to central government; and changes in planning such that local authorities could opt out of enforcing public housing targets in private developments (Hearne, 2020: 121-123). This has exacerbated volatility in the housing market.
outpaced new lending.
Allied to this, the source of housing construction has become more reliant on private investment over time, with a fall away in local authority construction in particular. Having constructed a significant share of housing in the 1960s, 70s, and much of the 80s, local authority building has almost totally ebbed away. There are many reasons for this including:. the centralisation of funding for public housing away from local authorities to central government; and changes in planning such that local authorities could opt out of enforcing public housing targets in private developments (Hearne, 2020: 121-123). This has exacerbated volatility in the housing market.
Figure 2: House construction composition.
Source: Housing Agency and CSO.
In terms of affordability and prices, Figure 3 below shows a number of similar trends using a variety of metrics. Real house prices refers to the inflation-adjusted price of housing. As can be seen, house prices were stable up to the 1990s after which they began to accelerate rapidly, and then declined. The increase since 2012 has been similarly steep, albeit levelling off more recently. The price-to-income ratio refers to the ratio of average house prices to average incomes. When the objective of having a home is to live in it, then the rise in the cost of buying a home versus renting one makes renting more attractive. This then puts upward pressure on rents so that the price-to-rent ratio should not change radically over time. If price increases had been driven by a shortage of supply, for instance, one would expect rents to have also increased. During the 2000s house prices increased much faster than rents. In other words, there was a speculative bubble as prices increased much faster than what could be explained by underlying fundamentals. The increase in
0%10%20%30%40%50%60%70%80%90%
100%
Composition of construction
Private Local Authority Houses Voluntary
Commented [JK1]: With the inclusion of the ‘composition of construction’ graph all the figures below are now +1
Figure 2: House construction composition.Source: Housing Agency and CSO.
In terms of affordability and prices, Figure 3 below shows a number of similar trends using a variety of metrics. Real house prices refers to the inflation-adjusted price of housing. As can be seen, house prices were stable up to the 1990s after which they began to accelerate rapidly, and then declined. The increase since 2012 has been similarly steep, albeit levelling off more recently. The price-to-income ratio refers to the ratio of average house prices to average incomes. When the objective of having a home is to live in it, then the rise in the cost of buying a home versus renting one makes renting more attractive. This then puts upward pressure on rents so that the price-to-rent ratio should not
Job quality in the Irish construction sector
14

change radically over time. If price increases had been driven by a shortage of supply, for instance, one would expect rents to have also increased. During the 2000s house prices increased much faster than rents. In other words, there was a speculative bubble as prices increased much faster than what could be explained by underlying fundamentals. The increase in the ratio since 2012 has been more muted than before. McQuinn’s data (2017: 9) indicates the ratio has been essentially flat since the recovery as opposed to the increase shown here. Either way, the greater stability of the house price-to-rent ratio in recent years shows that whatever has been driving the increase in house prices has also been driving the increase in rental prices, suggesting an underlying lack of supply and not the existence of a bubble.
the ratio since 2012 has been more muted than before. McQuinn’s data (2017: 9) indicates the ratio has been essentially flat since the recovery as opposed to the increase shown here. Either way, the greater stability of the house price-to-rent ratio in recent years shows that whatever has been driving the increase in house prices has also been driving the increase in rental prices, suggesting an underlying lack of supply and not the existence of a bubble.
Figure 3: Affordability of Irish housing.
Sources: OECD.
The single most important indicator of housing affordability is the house price-to-income ratio which is also shown as an index number and with some actual values for selected years. Using the Daft nationwide house price average based on its quarterly reports (€257,970), and the CSO figure for average full-time earnings (€48,946), we calculate that house prices were on average 5.3 times national average income in 2019 (CSO, 2020; Daft, 2019a-d). Daft figures are based on asking prices, which track the official residential price index well which is based on sale prices. At the height of the bubble it was over seven times the national average, whereas in 1990 a home would typically cost around four times national average earnings. Although the figure appears to be declining, housing is currently considerably less affordable today than what it was historically, before the explosion of credit in the 1990s.
The price-to-income ratio is preferable to monthly housing costs as a percentage of household income as affordability on this measure can be flattered if the payments are extended over many years. For renters, however, the price-to-income ratio is less relevant. The relevant
Figure 3: Affordability of Irish housing.
Sources: OECD.
The single most important indicator of housing affordability is the house price-to-income ratio which is also shown as an index number and with some actual values for selected years. Using the Daft nationwide house price average based on its quarterly reports (€257,970), and the CSO figure for average full-time earnings (€48,946), we calculate that house prices were on average 5.3 times national average income in 2019 (CSO, 2020; Daft, 2019a-d). Daft figures are based on asking prices, which track the official residential price index well which is based on sale prices. At the height of the bubble it was over seven times the national average, whereas in 1990 a home would typically cost around four times national average earnings. Although the figure appears to be declining, housing is currently considerably less affordable today than what it was historically, before the explosion of credit in the 1990s.
The price-to-income ratio is preferable to monthly housing costs as a percentage of household income as affordability on this measure can be flattered if the payments are extended over many years. For renters, however, the price-to-income ratio is less relevant. The relevant standard for rent affordability is rents not house prices relative to income. Whereas house price affordability improved a little in recent years, this has not been the case for rents, where affordability continued to decline into 2019 (Doval Tedin and Faubert, 2020). The recent crisis has been severe and asymmetric with respect to owners and renters.
Boom, bust, and the construction workforce
15

Labour shortagesThe indicators examined so far point to a boom-bust cycle in property prices, output of building and infrastructure, and affordability, and a construction sector that has substantially recovered since the crisis. A similar picture emerges with the employment numbers. In 2006, construction accounted for around eleven percent of employment, which fell to just over four percent in 2011 and 2012 (CSO, 2020). In 2019, it was just over six percent (ibid.). The ebbs and flows in employment largely therefore reflect those in output. Pre-Covid employment was back in line with international norms while output, recall, was at around its historic levels. Construction employment should be higher if supply is to be increased significantly.
A 2018 study by Technological University of Dublin in conjunction with the Construction Industry Federation (CIF) provides a detailed analysis of skills in the sector (Ó Murchadha and Murphy, 2018). Based on survey evidence, the study notes that apprenticeship training has lagged employment growth in the recovery at most firms. Skills shortages have emerged across the full range of trades, but the problem has been most acute in the so-called wet trades like bricklaying, plastering, painting and decorating, and tiling. Some firms, perhaps due to being smaller, reported a shortage of skilled electricians (ibid. 34). Firms cited financial barriers such as discontinuous demand for work, onerous legislation, and costs of releasing workers to off-site training as reasons for not taking on apprentices. Perhaps the largest reason, however, was a lack of suitable candidates for training, partly driven by emigration (ibid., 8; 23).
The question arises as to whether firms have been able to find and hire workers in the required numbers given the recovery of the sector. A 2019 survey by the Society of Chartered Surveyors Ireland and Price Waterhouse Coopers indicates that skills shortages constituted the single largest factor holding back construction output (PwC-SCSI, 2019). Skills shortages have been identified across a wide range of jobs, in professional and craft occupations alike. The former comprises quantity surveyors and civil engineers and for the latter bricklayers, carpenters, plumbers, and electricians have been found to be in short supply. PWC’s 2018 survey reached the same finding, though shortages of civil engineers were somewhat less acute (PwC-SCSI, 2018). The more common complaint was a lack of skilled subcontractors as opposed to a lack of workers due to emigration (PwC-SCSI, 2017).
Skills Ireland (2020) examines in detail the future skills need of the sector. The perception and reality that the sector is physically demanding is believed to be a deterrent on new entrants into the industry. The image problem of the sector is also cited to be problematic. Demand for carpenters and electricians, the numerically most common craft professions, and elementary or unskilled labour is projected to be highest into the future. Skills Ireland also finds shortages in these and other craft occupations in recently years. In 2020 many of the specific shortages were in professional occupations such as quantity surveyors and engineers. They report that many of the shortages are cyclical and have arisen due to the rapid growth of the sector in recent years (ibid.: 33-34).
Turning to publicly available data, one indicator of a labour shortage is an abundance of job openings not being filled. The so-called vacancy rate is the ratio of the number of job vacancies to the sum of employment and vacancies (potential employment). The higher the number, the greater the difficulty employers are having in filling posts, all else equal. The vacancy rate in construction experienced a steady, upward trajectory from 2008 to Q1 2015 when it stood at 1.2 percent. It then declined sharply before increasing again to 1.5 percent in Q2 2018. Since then, it has been in decline and the latest figures show it to be 0.3 percent, which is similar to the pre-crisis level (CSO, 2020).
Job quality in the Irish construction sector
16

It may seem surprising that the vacancy rate increased in the early years of the crisis. Given that there are many people out of work, one would expect positions to be easily filled. A high vacancy rate in conjunction with high unemployment signals that despite the fact that many people are out of work firms are having trouble filling vacancies as the unemployed do not have the required skills – maybe some skilled workers left the economy. It points to a need to upskill. The simultaneous existence, however, of low unemployment and a high vacancy rate is a clear indication that the pool of workers is not sufficiently large. It points to a need to expand the work pool. The uptick in the vacancy rate in the last few years, then, is a sign of labour shortages which have since been alleviated, whereas the initial increase from 2008-2012 in particular is consistent with a skills, but not people, shortage (see, also, DPER, 2020a: 31).
Conefrey and McIndoe-Calder (2018) analyse post-financial crisis labour flows and trends in Irish construction. They find that there is neither a significant number of unemployed construction workers nor a significant number of construction workers who have dropped out the workforce and are currently residing in Ireland. The decline in the size of the construction workforce, they find, is instead explained by emigration. Certainly, large outward migration is consistent with the skills shortage story in the pre-recovery years. Employers might have had trouble filling roles despite there being widespread unemployment as those skills left the country.
Figure 4: Growth in construction and economy-wide earnings and hours.
Source: CSO.
Finally, Figure 4 shows the growth of hourly earnings and average hours worked in the construction sector and all sectors since 2008. Growth in earnings and average hours worked are indicative of a labour shortage as recruitment difficulties bid-up the wages of existing workers, who are typically asked to work longer hours. 2012, when the economy started to recover, is shown as the base year. Again, selected values of the series are also shown.
As can be seen, the growth in both hourly earnings and hours worked in construction have outstripped the rest of the economy since 2012. Although construction wages lag the rest of the economy by just over two euros, construction earnings have grown by 12.1 percent while hourly earnings in the general economy have grown by 8.6 percent. A similar story is true of hours worked, which have grown by 4.8 percent compared to 2.5 percent for the general economy. That both construction wages and average hours worked have grown is further evidence of shortages in the sector. That these have grown faster than the general economy is evidence of pressures specific to the sector, and not merely a result of the general upturn.
A variety of forms of evidence can therefore be offered to show that the Irish construction sector has suffered from labour and skills shortages since the economic and property sector collapse of 2008/09. This includes surveys of the sector and wage and labour market trends. The divergence between construction and the general economy, though significant, is probably not large enough to be consistent with the survey finding that labour shortages have been the number
Figure 4: Growth in construction and economy-wide earnings and hours.Source: CSO.
Finally, Figure 4 shows the growth of hourly earnings and average hours worked in the construction sector and all sectors since 2008. Growth in earnings and average hours worked are indicative of a labour shortage as recruitment difficulties bid-up the wages of existing workers, who are typically asked to work longer hours. 2012, when the economy started to recover, is shown as the base year. Again, selected values of the series are also shown.
As can be seen, the growth in both hourly earnings and hours worked in construction have outstripped the rest of the economy since 2012. Although construction wages lag the rest of the economy by just over two euros, construction earnings have grown by 12.1 percent while hourly earnings in the general economy have grown by 8.6 percent. A similar story is true of hours worked, which have grown by 4.8
Boom, bust, and the construction workforce
17

percent compared to 2.5 percent for the general economy. That both construction wages and average hours worked have grown is further evidence of shortages in the sector. That these have grown faster than the general economy is evidence of pressures specific to the sector, and not merely a result of the general upturn.
A variety of forms of evidence can therefore be offered to show that the Irish construction sector has suffered from labour and skills shortages since the economic and property sector collapse of 2008/09. This includes surveys of the sector and wage and labour market trends. The divergence between construction and the general economy, though significant, is probably not large enough to be consistent with the survey finding that labour shortages have been the number one issue holding back supply.3 Nevertheless, recruitment problems have undoubtedly played an important role, among other factors. The following section turns its attention to the construction workforce and looks at some of the central issues in job quality.
3 It might be observed that in 2006 housing output was over four times what is was in 2019 while the workforce was only somewhat smaller – Q4 2019 construction employment was around two thirds Q4 2006 (CSO, 2020).
Job quality in the Irish construction sector
18

Job quality: Profile and
contractual terms
19

Job quality: Profile and contractual terms A demographic profile of constructionBefore job quality in construction is considered in detail, it is useful to provide a demographic profile of the sector. As well as being of interest in its own right, it provides insights into the dynamics of working conditions and job quality. What we see is that there is a significant immigrant workforce who are disproportionately represented in less-skilled occupations. The construction sector is, moreover, male-dominated, especially the on-site workforce. Greater diversity, then, would help the sector expand.
An important methodological point relates to how the construction sector should be defined. The standard definition is based on the NACE4 classification of sectors. NACE is, in turn, based on international standards that see construction as ‘economic activity directed to the creation, renovation, repair or extension of fixed assets’ (OECD, 2013; emphasis added). Given the emphasis on direct construction activity, construction activities further down the value chain are excluded. When the net is cast more widely so as to include architects working as consultants (who are defined as service workers), manufacturing firms making building materials, and other downstream activities, the contribution of construction to the economy in terms of output may be more than double than what the conventional statistics indicate (Green, 2020; see also Squicciarini and Asikainen, 2011). Unless otherwise stated, this report utilises the conventional definition of construction worker as per NACE. Nevertheless, it is worth bearing in mind that this definition does not capture those who work in the sector but do not necessarily work on site.
Figure 5 below shows construction employment, male construction employment, and Irish born construction employment as percentages of total employment.5 As can be seen, construction employment grew throughout the 2000s up to the crisis, after which it stabilised. As discussed previously, the pattern of employment reflects the boom and bust cycle, and the size of the workforce is now in line with international norms. The sector is highly masculinised, albeit the latest year of data shows a considerable drop compared to the previous year. In 2019, the sector recorded the highest share of women in construction in at least two decades at 7% of workers compared to 4% in 2000.
The trend in foreign-born workers entering the sector is more marked. In general, one expects construction to have a high share of immigrant workers as construction companies do not have the option of off-shoring parts of the production process to reduce costs, so they instead on-shore foreign labour. Moreover, construction workers need not deal with the public so native language proficiency is not a necessity (Krings et al., 2011). Up until the mid-2000s 92-93% of the workforce were Irish born. This fell to 80% in 2007 which is where it stands at today. These figures may understate the true extent of foreign workers in the sector as the Labour Force Survey only surveys people ‘usually resident’ in the country. As a result, it would not capture those who come and work only for a short period of time, which may be a significant share of the foreign-born workforce. It would also not capture undocumented (i.e.
4 Nomenclature générale des Activités économiques dans les Communautés Européennes or European Classification of Economic Activities.5 Note that construction employment peaked at 13 percent in Figure 4 whereas previously we stated it peaked at 11 percent as per CSO data. This seems to be a result of the methodological change in sector classification in the microdata, whereas CSO produces a consistent series.
Job quality in the Irish construction sector
20
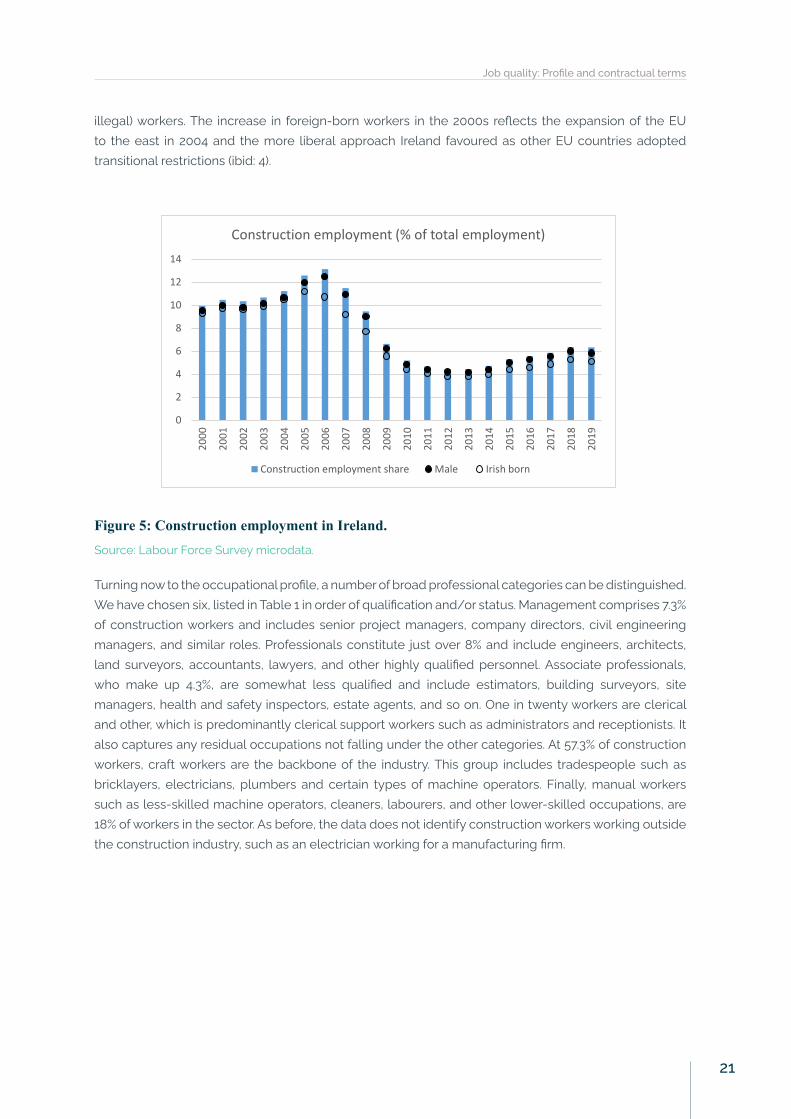
illegal) workers. The increase in foreign-born workers in the 2000s reflects the expansion of the EU to the east in 2004 and the more liberal approach Ireland favoured as other EU countries adopted transitional restrictions (ibid: 4).
compared to 4% in 2000.
The trend in foreign-born workers entering the sector is more marked. In general, one expects construction to have a high share of immigrant workers as construction companies do not have the option of off-shoring parts of the production process to reduce costs, so they instead on-shore foreign labour. Moreover, construction workers need not deal with the public so native language proficiency is not a necessity (Krings et al., 2011). Up until the mid-2000s 92-93% of the workforce were Irish born. This fell to 80% in 2007 which is where it stands at today. These figures may understate the true extent of foreign workers in the sector as the Labour Force Survey only surveys people ‘usually resident’ in the country. As a result, it would not capture those who come and work only for a short period of time, which may be a significant share of the foreign-born workforce. It would also not capture undocumented (i.e. illegal) workers. The increase in foreign-born workers in the 2000s reflects the expansion of the EU to the east in 2004 and the more liberal approach Ireland favoured as other EU countries adopted transitional restrictions (ibid: 4).
Figure 5: Construction employment in Ireland.
Source: Labour Force Survey microdata.
Turning now to the occupational profile, a number of broad professional categories can be distinguished. We have chosen six, listed in Table 1 in order of qualification and/or status. Management comprises 7.3% of construction workers and includes senior project managers, company directors, civil engineering managers, and similar roles. Professionals constitute just over 8% and include engineers, architects, land surveyors, accountants, lawyers, and other highly
0
2
4
6
8
10
12
14
2000
2001
2002
2003
2004
2005
2006
2007
2008
2009
2010
2011
2012
2013
2014
2015
2016
2017
2018
2019
Construction employment (% of total employment)
Construction employment share Male Irish born
Figure 5: Construction employment in Ireland.Source: Labour Force Survey microdata.
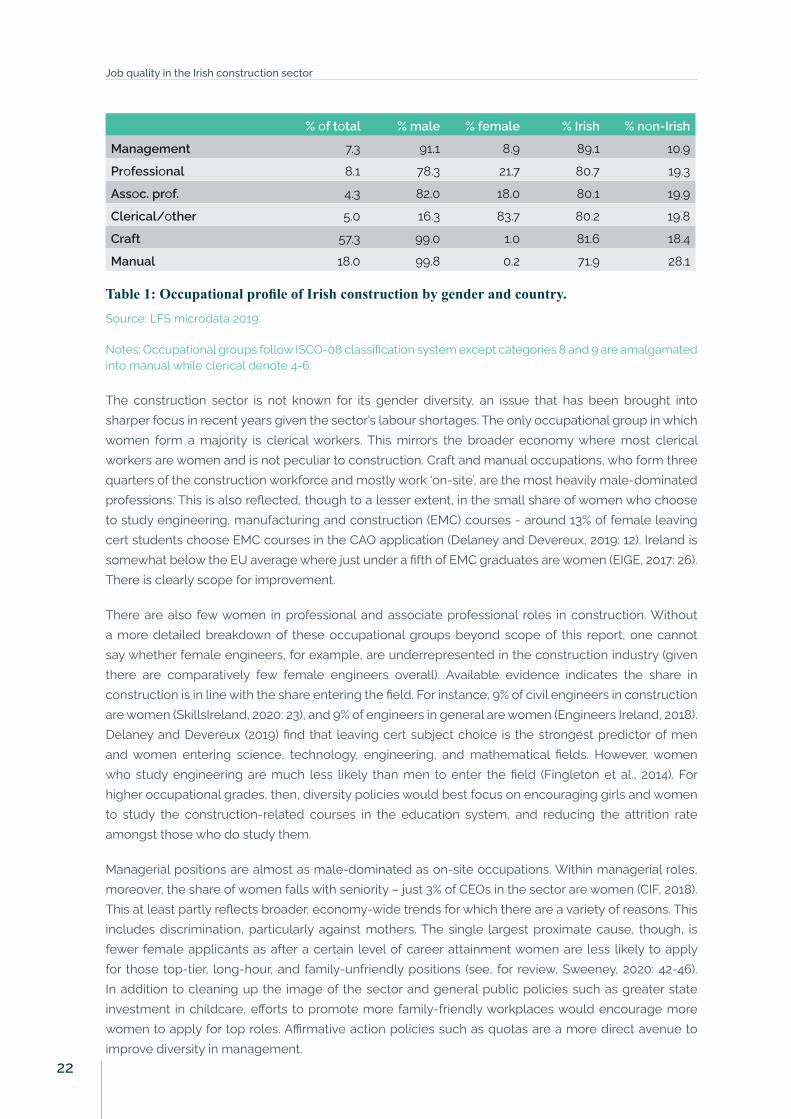
Turning now to the occupational profile, a number of broad professional categories can be distinguished. We have chosen six, listed in Table 1 in order of qualification and/or status. Management comprises 7.3% of construction workers and includes senior project managers, company directors, civil engineering managers, and similar roles. Professionals constitute just over 8% and include engineers, architects, land surveyors, accountants, lawyers, and other highly qualified personnel. Associate professionals, who make up 4.3%, are somewhat less qualified and include estimators, building surveyors, site managers, health and safety inspectors, estate agents, and so on. One in twenty workers are clerical and other, which is predominantly clerical support workers such as administrators and receptionists. It also captures any residual occupations not falling under the other categories. At 57.3% of construction workers, craft workers are the backbone of the industry. This group includes tradespeople such as bricklayers, electricians, plumbers and certain types of machine operators. Finally, manual workers such as less-skilled machine operators, cleaners, labourers, and other lower-skilled occupations, are 18% of workers in the sector. As before, the data does not identify construction workers working outside the construction industry, such as an electrician working for a manufacturing firm.
Job quality: Profile and contractual terms
21
% of total % male % female % Irish % non-Irish
Management 7.3 91.1 8.9 89.1 10.9
Professional 8.1 78.3 21.7 80.7 19.3
Assoc. prof. 4.3 82.0 18.0 80.1 19.9
Clerical/other 5.0 16.3 83.7 80.2 19.8
Craft 57.3 99.0 1.0 81.6 18.4
Manual 18.0 99.8 0.2 71.9 28.1
Table 1: Occupational profile of Irish construction by gender and country.Source: LFS microdata 2019.
Notes: Occupational groups follow ISCO-08 classification system except categories 8 and 9 are amalgamated into manual while clerical denote 4-6.
The construction sector is not known for its gender diversity, an issue that has been brought into sharper focus in recent years given the sector’s labour shortages. The only occupational group in which women form a majority is clerical workers. This mirrors the broader economy where most clerical workers are women and is not peculiar to construction. Craft and manual occupations, who form three quarters of the construction workforce and mostly work ‘on-site’, are the most heavily male-dominated professions. This is also reflected, though to a lesser extent, in the small share of women who choose to study engineering, manufacturing and construction (EMC) courses - around 13% of female leaving cert students choose EMC courses in the CAO application (Delaney and Devereux, 2019: 12). Ireland is somewhat below the EU average where just under a fifth of EMC graduates are women (EIGE, 2017: 26). There is clearly scope for improvement.
There are also few women in professional and associate professional roles in construction. Without a more detailed breakdown of these occupational groups beyond scope of this report, one cannot say whether female engineers, for example, are underrepresented in the construction industry (given there are comparatively few female engineers overall). Available evidence indicates the share in construction is in line with the share entering the field. For instance, 9% of civil engineers in construction are women (SkillsIreland, 2020: 23), and 9% of engineers in general are women (Engineers Ireland, 2018). Delaney and Devereux (2019) find that leaving cert subject choice is the strongest predictor of men and women entering science, technology, engineering, and mathematical fields. However, women who study engineering are much less likely than men to enter the field (Fingleton et al., 2014). For higher occupational grades, then, diversity policies would best focus on encouraging girls and women to study the construction-related courses in the education system, and reducing the attrition rate amongst those who do study them.
Managerial positions are almost as male-dominated as on-site occupations. Within managerial roles, moreover, the share of women falls with seniority – just 3% of CEOs in the sector are women (CIF, 2018). This at least partly reflects broader, economy-wide trends for which there are a variety of reasons. This includes discrimination, particularly against mothers. The single largest proximate cause, though, is fewer female applicants as after a certain level of career attainment women are less likely to apply for those top-tier, long-hour, and family-unfriendly positions (see, for review, Sweeney, 2020: 42-46). In addition to cleaning up the image of the sector and general public policies such as greater state investment in childcare, efforts to promote more family-friendly workplaces would encourage more women to apply for top roles. Affirmative action policies such as quotas are a more direct avenue to improve diversity in management.
Job quality in the Irish construction sector
22
Looking at the share of non-Irish born workers, manual occupations are most likely to use immigrant labour. The share of non-native born craft workers is considerably lower and on a par with more qualified occupations. This may reflect the difficulty that non-Irish workers have in getting their qualifications recognised. Eastern European workers, for instance, may therefore gravitate towards manual occupations (Krings et al.).
Stability and precariousness in construction workThe construction sector is highly cyclical. As property is the largest and most important purchase an individual or household will make, it typically requires a loan from a financial institution. This means that construction is highly reliant on banks’ willingness to lend, which is itself very dependent on the state of the overall economy and level of interest rates. During a downturn construction employment tends to fall more than in other sectors but then tends to increase more during an upturn (Leamer, 2007; Gjerstad and Smith, 2014). This is especially the case in Ireland where state investment in public housing and infrastructure has contributed to as opposed to mitigated construction cyclicality. This greater volatility and cyclicality makes construction a high-risk industry, which is reflected in the contractual arrangements the sector employs.
Another distinctive feature of construction work is its difficulty to be standardised. Given building takes place on distinct tracts of land and the character of each building will vary based on taste and project viability, each undertaking has a one-off character. This limits economies of scale and learning-by-doing. As a result, the construction sector tends to have many small and micro-firms which are often subcontracted by better-resourced firms for large projects. From an employment perspective, the sector relies on regular pools of workers hired and re-hired on temporary contracts and/or as self-employed agents (Nisbet, 2007). Wickham and Bobek’s qualitative analysis (2016) suggests that construction firms are more reliant today than in the past on employment agencies. This is more the case for the less-skilled manual workers than craft workers.
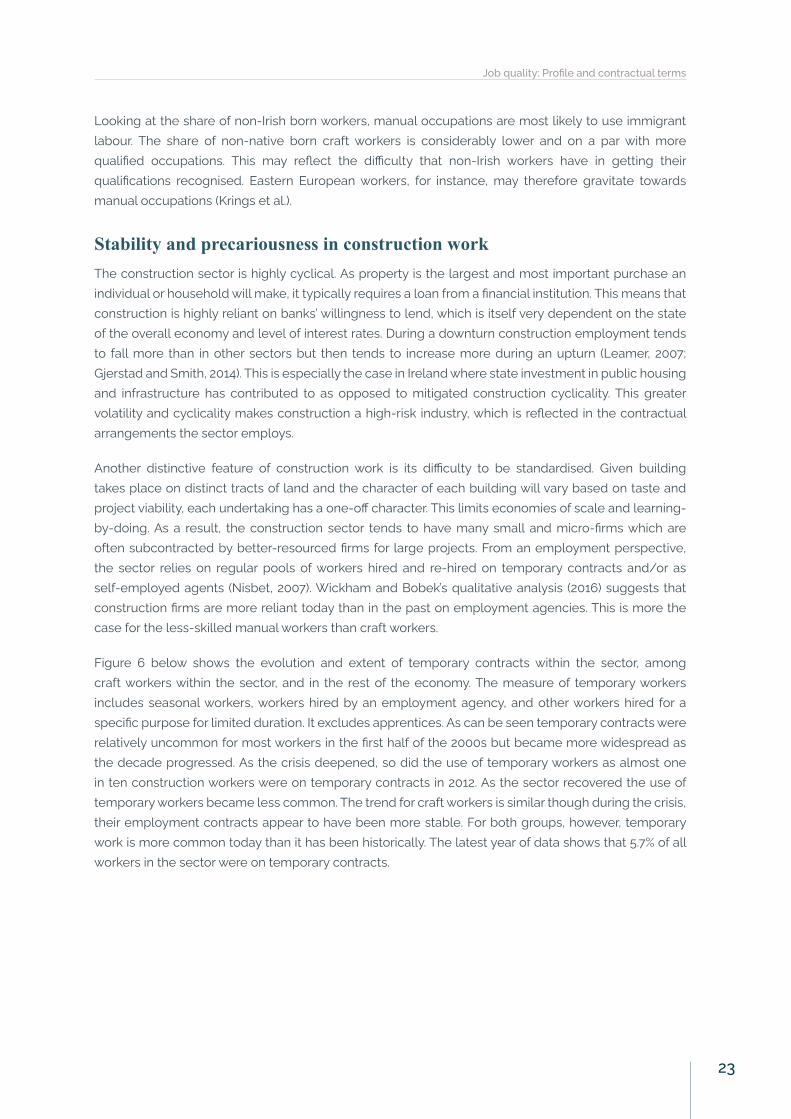
Figure 6 below shows the evolution and extent of temporary contracts within the sector, among craft workers within the sector, and in the rest of the economy. The measure of temporary workers includes seasonal workers, workers hired by an employment agency, and other workers hired for a specific purpose for limited duration. It excludes apprentices. As can be seen temporary contracts were relatively uncommon for most workers in the first half of the 2000s but became more widespread as the decade progressed. As the crisis deepened, so did the use of temporary workers as almost one in ten construction workers were on temporary contracts in 2012. As the sector recovered the use of temporary workers became less common. The trend for craft workers is similar though during the crisis, their employment contracts appear to have been more stable. For both groups, however, temporary work is more common today than it has been historically. The latest year of data shows that 5.7% of all workers in the sector were on temporary contracts.
Job quality: Profile and contractual terms
23

taste and project viability, each undertaking has a one-off character. This limits economies of scale and learning-by-doing. As a result, the construction sector tends to have many small and micro-firms which are often subcontracted by better-resourced firms for large projects. From an employment perspective, the sector relies on regular pools of workers hired and re-hired on temporary contracts and/or as self-employed agents (Nisbet, 2007). Wickham and Bobek’s qualitative analysis (2016) suggests that construction firms are more reliant today than in the past on employment agencies. This is more the case for the less-skilled manual workers than craft workers.
Figure 6 below shows the evolution and extent of temporary contracts within the sector, among craft workers within the sector, and in the rest of the economy. The measure of temporary workers includes seasonal workers, workers hired by an employment agency, and other workers hired for a specific purpose for limited duration. It excludes apprentices. As can be seen temporary contracts were relatively uncommon for most workers in the first half of the 2000s but became more widespread as the decade progressed. As the crisis deepened, so did the use of temporary workers as almost one in ten construction workers were on temporary contracts in 2012. As the sector recovered the use of temporary workers became less common. The trend for craft workers is similar though during the crisis, their employment contracts appear to have been more stable. For both groups, however, temporary work is more common today than it has been historically. The latest year of data shows that 5.7% of all workers in the sector were on temporary contracts.
Figure 6: Temporary contracts in construction.
Source: LFS microdata.
Notes: Because of a change in classification system, the definition of craft worker is somewhat different
0
2
4
6
8
10
1220
00
2001
2002
2003
2004
2005
2006
2007
2008
2009
2010
2011
2012
2013
2014
2015
2016
2017
2018
2019
Temporary contracts (% total)
Construction Craft Rest of economy
Figure 6: Temporary contracts in construction.Source: LFS microdata.
Notes: Because of a change in classification system, the definition of craft worker is somewhat different in 2012 and after compared to pre-2012.
Interestingly, it appears to be changes in the mid-2000s, as much as the financial crisis, that are responsible for the increased prevalence of temporary contracts. If 2006 were used as the starting year temporary contract use would be seen to have reverted to historical norms. The greater use of temporary contracts was an economy-wide phenomenon as the rest of the workforce experienced a similar jump. Moreover, the rest of the economy makes greater use of temporary workers than construction. This is a surprising outcome given that construction given the discontinuous or ‘lumpy’ nature of construction output, which would be reflected in a comparatively high demand for temporary workers.
Another measure of precariousness is the extent to which workers work part-time. As part-time work is a valid form of employment that many workers favour, the figure below looks at workers who are working part-time involuntarily. Because the construction sector is so male-dominated, and men are less likely to work part-time, we would ordinarily expect part-time work, voluntary or involuntary, to be less common than most other sectors. We would also expect part-time work to vary strongly with the economic cycle as employers may prefer to retain the more skilled workers at reduced hours. This may be a more effective way in the long term to reduce costs during a recession than firing and re-hiring when as the economy recovers.
Job quality in the Irish construction sector
24

in 2012 and after compared to pre-2012.
Interestingly, it appears to be changes in the mid-2000s, as much as the financial crisis, that are responsible for the increased prevalence of temporary contracts. If 2006 were used as the starting year temporary contract use would be seen to have reverted to historical norms. The greater use of temporary contracts was an economy-wide phenomenon as the rest of the workforce experienced a similar jump. Moreover, the rest of the economy makes greater use of temporary workers than construction. This is a surprising outcome given that construction given the discontinuous or ‘lumpy’ nature of construction output, which would be reflected in a comparatively high demand for temporary workers.
Another measure of precariousness is the extent to which workers work part-time. As part-time work is a valid form of employment that many workers favour, the figure below looks at workers who are working part-time involuntarily. Because the construction sector is so male-dominated, and men are less likely to work part-time, we would ordinarily expect part-time work, voluntary or involuntary, to be less common than most other sectors. We would also expect part-time work to vary strongly with the economic cycle as employers may prefer to retain the more skilled workers at reduced hours. This may be a more effective way in the long term to reduce costs during a recession than firing and re-hiring when as the economy recovers.
Figure 7: Involuntary part-time work in construction.
Source: LFS microdata.
Notes: Data for 2005 were missing.
0
2
4
6
8
10
12
14
2000
2001
2002
2003
2004
2005
2006
2007
2008
2009
2010
2011
2012
2013
2014
2015
2016
2017
2018
2019
Involuntary part-time (% total)
Construction Craft Rest of economy
Figure 7: Involuntary part-time work in construction. Source: LFS microdata.
Notes: Data for 2005 were missing.
The trajectory of involuntary part-time work is more or less as expected. Comparatively few general construction and craft workers were working part-time pre-crisis, especially at the height of the boom in 2006. Then, during the crisis, involuntary part-time work became more common. Indeed, such work was more common in construction than the rest of the economy given the disproportionate impact the recession had on the sector. Since the economic recovery, involuntary part-time dropped significantly and is current just above what it was in 2000.
Another form of precariousness that is considered very prevalent in construction is so-called bogus self-employment. In and of itself, self-employment need not be an indicator of precariousness. A self-employed person normally has control over their work with significant, if not decisive, control over how the work is done. A problem arises if a nominally self-employed person is contracted who is in reality subordinate like an employee is. This may be done so as to avoid the usual obligations an employer has to his or her employee, such as payment of social insurance. There are generally fewer obligations when a person is defined as an independent contractor. The lengthening of the contracting chain means that fewer workers are employed by the main contractor. For Wickham and Bobek (2016: 46-49), this coupled with the removal of administrative obstacles to designating workers as contractors has led to an increase in bogus self-employment in the Irish construction sector.
Figure 8 shows the share of the workforce that are self-employed without employees. This is how bogus self-employment is typically approximated, but is not the same thing as it also captures workers who are legitimately self-employed. However, if the share of legitimate solo self-employment is relatively constant or slow to change, then large changes in the rate point to increases or decreases in bogus self-employment. As is apparent, solo self-employment was relatively stable in the 2000s and actually fell during the height of the bubble as the labour market tightened. In fact, for much of the early part of that decade, solo self-employment was not much more common in the construction sector compared to the wider economy. The arrival of the recession did much to alter this balance and resulted in a
Job quality: Profile and contractual terms
25
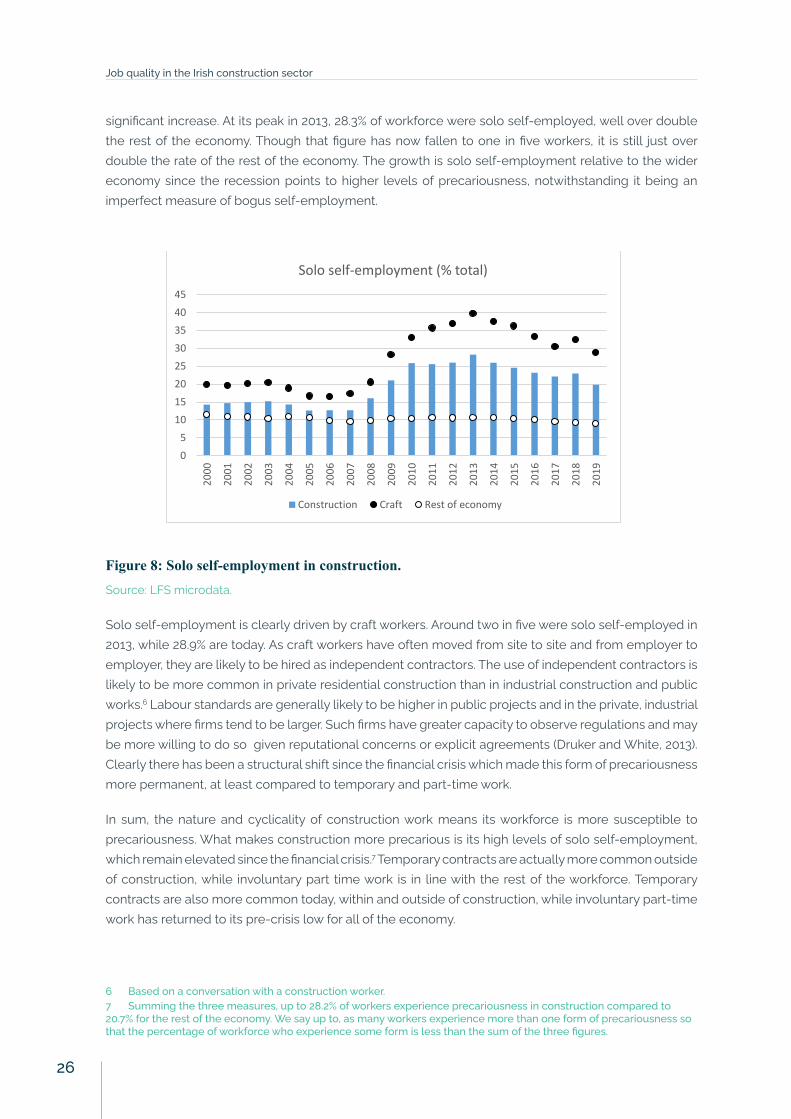
significant increase. At its peak in 2013, 28.3% of workforce were solo self-employed, well over double the rest of the economy. Though that figure has now fallen to one in five workers, it is still just over double the rate of the rest of the economy. The growth is solo self-employment relative to the wider economy since the recession points to higher levels of precariousness, notwithstanding it being an imperfect measure of bogus self-employment.
Figure 8: Solo self-employment in construction.
Source: LFS microdata.
Solo self-employment is clearly driven by craft workers. Around two in five were solo self-employed in 2013, while 28.9% are today. As craft workers have often moved from site to site and from employer to employer, they are likely to be hired as independent contractors. The use of independent contractors is likely to be more common in private residential construction than in industrial construction and public works.6 Labour standards are generally likely to be higher in public projects and in the private, industrial projects where firms tend to be larger. Such firms have greater capacity to observe regulations and may be more willing to do so given reputational concerns or explicit agreements (Druker and White, 2013). Clearly there has been a structural shift since the financial crisis which made this form of precariousness more permanent, at least compared to temporary and part-time work.
In sum, the nature and cyclicality of construction work means its workforce is more susceptible to precariousness. What makes construction more precarious is its high levels of solo self-employment, which remain elevated since the financial crisis. 7 Temporary contracts are actually more common outside of construction, while involuntary part time work is in line with the rest of the workforce. Temporary contracts are also more common today, within and outside of construction, while involuntary part-time work has returned to its pre-crisis low for all of the
6 Based on a conversation with a construction worker. 7 Summing the three measures, up to 28.2% of workers experience precariousness in construction compared to 20.7% for the rest of the economy. We say up to, as many workers experience more than one form of precariousness so that the percentage of workforce who experience some form is less than the sum of the three figures.
05
1015202530354045
2000
2001
2002
2003
2004
2005
2006
2007
2008
2009
2010
2011
2012
2013
2014
2015
2016
2017
2018
2019
Solo self-employment (% total)
Construction Craft Rest of economy
Commented [JK7]: This could really do with a reference for evidence I deleted reference to London Olympics as the Drucker and White citation deals with this explicitly.
Figure 8: Solo self-employment in construction. Source: LFS microdata.
Solo self-employment is clearly driven by craft workers. Around two in five were solo self-employed in 2013, while 28.9% are today. As craft workers have often moved from site to site and from employer to employer, they are likely to be hired as independent contractors. The use of independent contractors is likely to be more common in private residential construction than in industrial construction and public works.6 Labour standards are generally likely to be higher in public projects and in the private, industrial projects where firms tend to be larger. Such firms have greater capacity to observe regulations and may be more willing to do so given reputational concerns or explicit agreements (Druker and White, 2013). Clearly there has been a structural shift since the financial crisis which made this form of precariousness more permanent, at least compared to temporary and part-time work.
In sum, the nature and cyclicality of construction work means its workforce is more susceptible to precariousness. What makes construction more precarious is its high levels of solo self-employment, which remain elevated since the financial crisis.7 Temporary contracts are actually more common outside of construction, while involuntary part time work is in line with the rest of the workforce. Temporary contracts are also more common today, within and outside of construction, while involuntary part-time work has returned to its pre-crisis low for all of the economy.
6 Based on a conversation with a construction worker.7 Summing the three measures, up to 28.2% of workers experience precariousness in construction compared to 20.7% for the rest of the economy. We say up to, as many workers experience more than one form of precariousness so that the percentage of workforce who experience some form is less than the sum of the three figures.
Job quality in the Irish construction sector
26

Job quality: Income and pay
27

Job quality: Income and pay This section looks at income generation through an examination of productivity, labour market institutions, and then pay. Irish construction’s disappointing productivity performance combined with so-called flexible labour market institutions put downward pressure on pay. However, by Irish standards the construction workforce gets a very high share of the income generated by its sector. The result is an overall solid pay performance, especially for white-collar workers but less so for blue-collar workers.
ProductivityProductivity describes the efficiency with which production takes place. The more of a good or service that can be produced with a given set of inputs, the more productive an operation is. It is typically measured in terms of the volume of output a person produces per hour worked. For instance, a hair salon would measure productivity as the number of haircuts produced on average per hour worked by a person. The volume of output is preferred over the monetary value, as to measure output in terms of value would yield higher productivity if prices were increased, independent of any efficiency gains. Similarly, it is important to measure at the individual as opposed to firm level, as to use only firm output per hour could yield higher productivity if a firm hired more workers.
The capacity of any sector to generate income is dependent on a variety of factors. This includes the demand for goods or services it creates, the degree of competition, and the extent of regulation. For instance, the demand for tech products has increased enormously in the last number of years which helps explain why the sector is so profitable. Over the long run, however, it is the capacity of a sector to generate productivity which determines how much income it creates, income which gets distributed to owners and workers.
Productivity in Ireland is high by EU standards, especially in the multinational sector. Ireland’s system of innovation, however, is less geared toward the domestic sector and more towards attracting external investment compared to other countries. For instance, Ireland has historically spent less on R&D and infrastructure than its European peers. Accordingly, the productivity performance of the domestic sector is more modest (Goldrick-Kelly and McDonnell, 2017; Goldrick-Kelly and MacFlynn, 2018).
The previous section discussed some features of construction labour markets which also bears on the sector’s income-generating capacity. McKinsey (2017) highlights a number of factors which contribute to the sector’s low productivity. This includes a non-standardised output, cyclicality, informality, fragmentation, corruption, and poor risk-reward alignments in contracts. McKinsey also point to high dependence on public sector contracts and regulation as holding back productivity. This results in under-investment in skills development, R&D and innovation. Larger firms which manage civil and industrial contracts are more productive than the smaller, specialised entities they subcontract to, but not massively so (ibid.).
A recent analysis of the Irish construction sector echoes many of these points (DPER, 2020b). In addition to high cyclicality, holding back productivity growth at the planning/ pre-production stage are, it is argued, a complex planning system and poor procurement practices. Interestingly, the report also notes a reliance on precarious workers such as agency workers and bogus self-employment as inhibiting productivity (ibid.: 8-9). Other problems include underuse of technology and off-site production, poor
Job quality in the Irish construction sector
28
waste management, and lack of training and upskilling. Indeed, construction R&D spending in Ireland is well below advanced-country norms (DPER, 2020a).
Many of the concerns highlighted are not unique to Ireland, and many consider Ireland to already have a liberal approach to planning (see Cahill, 2018). Nevertheless, Ireland’s underachievement in construction productivity is borne out by the data. Based on output per hour worked, construction productivity in Ireland is below the euro area average – 13th from 23 countries (DPER, 2020a: 40). In contrast, economy-wide productivity is well above average. Because construction productivity lags other sectors in Ireland, one would expect income in Irish construction to be further away from the national average compared to most other countries.
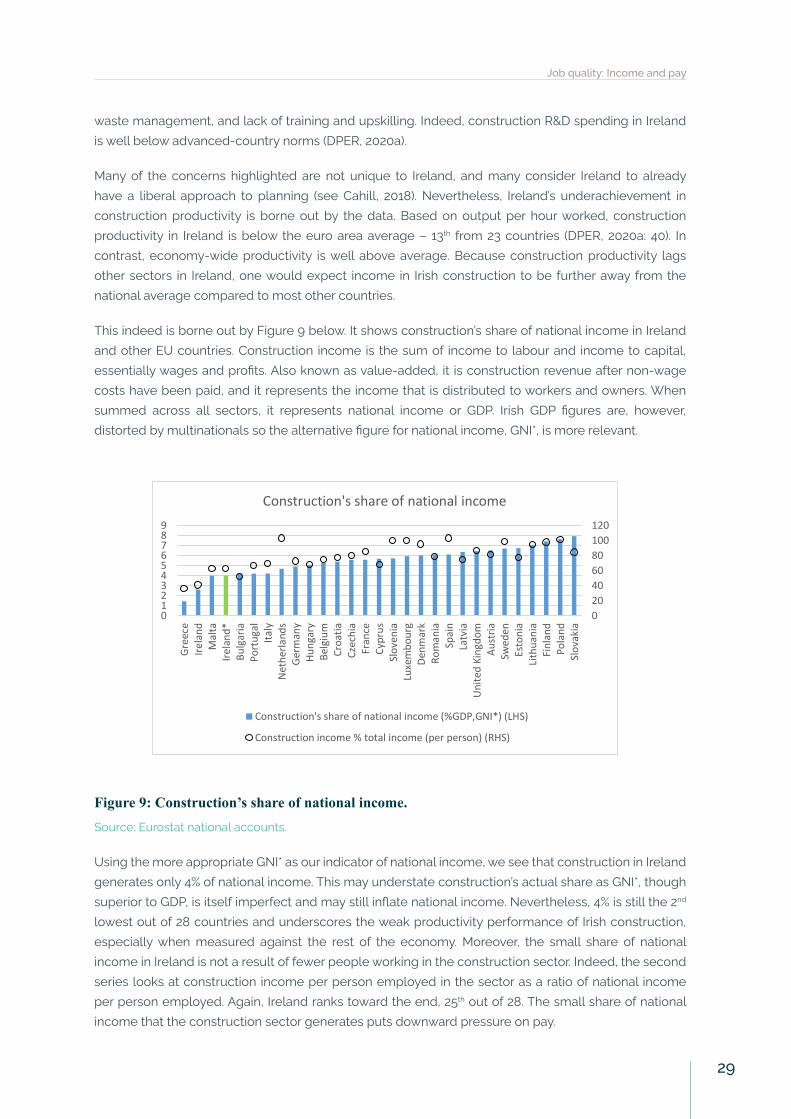
This indeed is borne out by Figure 9 below. It shows construction’s share of national income in Ireland and other EU countries. Construction income is the sum of income to labour and income to capital, essentially wages and profits. Also known as value-added, it is construction revenue after non-wage costs have been paid, and it represents the income that is distributed to workers and owners. When summed across all sectors, it represents national income or GDP. Irish GDP figures are, however, distorted by multinationals so the alternative figure for national income, GNI*, is more relevant.
Figure 9: Construction’s share of national income.
Source: Eurostat national accounts.
Using the more appropriate GNI* as our indicator of national income, we see that construction in Ireland generates only 4% of national income. This may understate construction’s actual share as GNI*, though superior to GDP, is itself imperfect and may still inflate national income. Nevertheless, 4% is still the 2nd lowest out of 28 countries and underscores the weak productivity performance of Irish construction, especially when measured against the rest of the economy. Moreover, the small share of national income in Ireland is not a result of fewer people working in the construction sector. Indeed, the second series looks at construction income per person employed in the sector as a ratio of national income per person employed. Again, Ireland ranks toward the end, 25th out of 28. The small share of national income that the construction sector generates puts downward pressure on pay.
Labour market institutions
If productivity determines the size of the pie it is labour market institutions that determine how the pie is distributed. We saw previously that when labour is in short supply relative to demand, wages tend to be bid up. While supply and demand considerations affect short-term fluctuations in wages, it is institutions which affect how the pie is divided over the medium-to-long run. By this, we mean state labour market policies and how the state, employers, and trade unions interact.
Labour market institutions tend to be more employer-friendly in Ireland than in other EU countries. This is not to say that Ireland has few laws and regulations – it has many. Rather they
020406080100120
0123456789
Gree
ceIre
land
Mal
taIre
land
*Bu
lgar
iaPo
rtug
alIta
lyNe
ther
land
sGe
rman
yHu
ngar
yBe
lgiu
mCr
oatia
Czec
hia
Fran
ceCy
prus
Slov
enia
Luxe
mbo
urg
Denm
ark
Rom
ania
Spai
nLa
tvia
Unite
d Ki
ngdo
mAu
stria
Swed
enEs
toni
aLit
huan
iaFi
nlan
dPo
land
Slov
akia
Construction's share of national income
Construction's share of national income (%GDP,GNI*) (LHS)
Construction income % total income (per person) (RHS)
Figure 9: Construction’s share of national income.Source: Eurostat national accounts.
Using the more appropriate GNI* as our indicator of national income, we see that construction in Ireland generates only 4% of national income. This may understate construction’s actual share as GNI*, though superior to GDP, is itself imperfect and may still inflate national income. Nevertheless, 4% is still the 2nd lowest out of 28 countries and underscores the weak productivity performance of Irish construction, especially when measured against the rest of the economy. Moreover, the small share of national income in Ireland is not a result of fewer people working in the construction sector. Indeed, the second series looks at construction income per person employed in the sector as a ratio of national income per person employed. Again, Ireland ranks toward the end, 25th out of 28. The small share of national income that the construction sector generates puts downward pressure on pay.
Job quality: Income and pay
29
Labour market institutions If productivity determines the size of the pie, it is labour market institutions that determine how the pie is distributed. We saw previously that when labour is in short supply relative to demand, wages tend to be bid up. While supply and demand considerations affect short-term fluctuations in wages, it is institutions which affect how the pie is divided over the medium-to-long run. By this, we mean state labour market policies and how the state, employers, and trade unions interact.
Labour market institutions tend to be more employer-friendly in Ireland than in other EU countries. This is not to say that Ireland has few laws and regulations – it has many. Rather they tend to offer comparatively less economic protection to workers, as Ireland relies more on state transfers than high wages to reduce poverty. Indeed, Ireland has among the highest rates of low pay in the EU. Depending on which index is used, Ireland ranks last or second-to-fourth last among EU countries in terms of protection against dismissal (OECD 2021). At 24.1% of the workforce in 2018, trade union membership is in line with the EU average of 24.5%8. However, only a third of the workforce are covered by collective bargaining agreements compared to an EU-average of 55.4%9 (ibid.). Collective bargaining coverage arguably has a larger effect on pay.
In terms of trade union membership in construction, data at the sector level is patchy but a process of decline is apparent. In 1994, 46.8% of the workforce were unionised and just seven years later in 2004, only 27.1% were (CSO, 2005). The numbers appear to have steadied in the 2000s up until the financial crisis, after which they declined again. In 2008, union density stood at 28.9% while in 2018 the figure was 16.8%. These trends look set to continue into the future as younger workers are less than half as likely to be unionised compared to the broader workforce (NERI, 2020). Though trade union membership in construction is less than the wider economy, it is in line with the rest of the private sector (Walsh, 2018).
The construction sector is subject to the same employment legislation that other sectors are. However, a number of actors come together to set pay at the sectoral level. The Labour Court is a body that hears disputes itself and registers negotiating forums between unions and employers called Joint Labour Councils. More importantly, it has the ability to make recommendations on Sectoral Employment Orders (SEOs). These are documents which set legally-binding minimum rates of pay for different classes of workers. They set minimum standards, help prevent undercutting, not least through the use of foreign workers, though enforcement has been an issue (O’Sullivan, 2021).10 In addition to pay, it sets overtime rates, pensions, and so on. The construction sector has two separate SEOs, which cover different groups craft and manual occupations.
Currently the SEO mandates that craft workers such as bricklayers and carpenters earn €19.44 per hour whereas plumbers earn between €22.73 and €23.60 (WRCa, 2020; WRCb, 2020). Electricians earn between €23.49 and €24.34 (WRCc, 2020). Apprentices earn between a third and 90% of qualified workers and overtime ranges between time and a half and double.
Professional construction occupations do not have formal wage-setting mechanisms like craft and manual workers. Their ability to command higher wages stems from the fact that certain skills and knowledge are difficult to acquire and highly sought after. Supply and demand factors, or market forces, then push up wages up for such groups. Professional groups can also extract more income through
8 This is an average of 23 EU countries, four of which the data related to 2016. 9 An average of 23 countries based mostly on 2016 data.10 It is important to note that SEOs do not only benefit national workers and firms. Previous CIOB work has shown how migrant workers are vulnerable to slave labour in construction supply chains (Crates, 2016)
Job quality in the Irish construction sector
30

anti-competitive practices, such as restricting entry to the profession. Based on a series of analyses by the Competition Authority in the mid-2000s, this does not appear to be prevalent in construction occupations such as architecture and engineering (CA, 2004; 2006).
PayAs already discussed, hourly earnings in construction have increased significantly in recent years. They are close to, but below, economy-wide levels. Figure 10 below shows pay in construction sector in a comparative European context. Pay is measured using full-time equivalent monthly income (see Brandolini et al., 2010; Eurofound, 2015, 2017). While not identical to hourly income, it is very similar. It is monthly income adjusted for working time; so, for part-time workers it is what would be earned in full-time work. The figure considers pay among all construction workers and among white-collar workers as a proportion of average pay across the economy. White collar refers to non-craft and non-manual workers. This group is chosen as the sample size was not large enough to disaggregate construction pay further, such as by management workers. It is based on EU-SILC 2018 which refers to income in the year 2017.
on a series of analyses by the Competition Authority in the mid-2000s, this does not appear to be prevalent in construction occupations such as architecture and engineering (CA, 2004; 2006).
Pay
As already discussed, hourly earnings in construction have increased significantly in recent years. They are close to, but below, economy-wide levels. Figure 10 below shows pay in construction sector in a comparative European context. Pay is measured using full-time equivalent monthly income (see Brandolini et al., 2010; Eurofound, 2015, 2017). While not identical to hourly income, it is very similar. It is monthly income adjusted for working time; so, for part-time workers it is what would be earned in full-time work. The figure considers pay among all construction workers and among white-collar workers as a proportion of average pay across the economy. White collar refers to non-craft and non-manual workers. This group is chosen as the sample size was not large enough to disaggregate construction pay further, such as by management workers. It is based on EU-SILC 2018 which refers to income in the year 2017.
Figure 10: Pay in construction.
Source: EU-SILC 2018 microdata.
What we see is that average construction pay in Ireland is slightly below, but very close to, the national average. This was also found in Figure 3, which is based on a larger, national dataset, albeit it was somewhat more below the national average. Ireland is around or slightly above middle
020406080
100120140160180
Luxe
mbo
urg
Slov
enia
Bulg
aria
Latv
iaSp
ain
Belg
ium
Mal
taPo
rtug
alNe
ther
land
sIta
lyFr
ance
Hung
ary
Denm
ark
Cypr
usRo
man
iaIre
land
Croa
tia UKEs
toni
aGr
eece
Finl
and
Lithu
ania
Swed
enSl
ovak
iaPo
land
Czec
hAu
stria
Construction pay (% national average)
Construction White collar
Figure 10: Pay in construction.Source: EU-SILC 2018 microdata.
What we see is that average construction pay in Ireland is slightly below, but very close to, the national average. This was also found in Figure 3, which is based on a larger, national dataset, albeit it was somewhat more below the national average. Ireland is around or slightly above middle among EU countries in this regard. There is, however, little to separate most countries in the middle – a small increase or decrease in pay would push Ireland up or down several places.
At almost 50% above the average, pay among white-collar construction workers is considerably more than what the typical worker earns. Of course, this gap is partly a function of comparing white-collar (construction) workers with all workers in the economy, regardless of their skill-level. Comparing Ireland to other countries provides a better gauge of how well or poorly paid they are. In only one other
Job quality: Income and pay
31

country, Austria, is the relative pay of white-collar construction workers higher. As a group, construction managers, professionals, associate professionals, and so on are very well-paid in Ireland.
This raises the question of remuneration among craft and manual workers, which we label blue-collar in Figure 11. Using the same pay metrics, we see that the average pay of craft workers is around 80% of the national average. Again, this reveals little as craft workers earn below the national average in all countries except Austria. When compared with the rest of the EU, we see that Ireland is still around the middle group, though slightly below. Manual workers earn about just under 70% the national average. Their pay among European countries is the seventh lowest among 25 countries of available data.
among EU countries in this regard. There is, however, little to separate most countries in the middle – a small increase or decrease in pay would push Ireland up or down several places.
At almost 50% above the average, pay among white-collar construction workers is considerably more than what the typical worker earns. Of course, this gap is partly a function of comparing white-collar (construction) workers with all workers in the economy, regardless of their skill-level. Comparing Ireland to other countries provides a better gauge of how well or poorly paid they are. In only one other country, Austria, is the relative pay of white-collar construction workers higher. As a group, construction managers, professionals, associate professionals, and so on are very well-paid in Ireland.
This raises the question of remuneration among craft and manual workers, which we label blue-collar in Figure 11. Using the same pay metrics, we see that the average pay of craft workers is around 80% of the national average. Again, this reveals little as craft workers earn below the national average in all countries except Austria. When compared with the rest of the EU, we see that Ireland is still around the middle group, though slightly below. Manual workers earn about just under 70% the national average. Their pay among European countries is the seventh lowest among 25 countries of available data.
Figure 11: Blue collar pay in construction.
Source: EU-SILC (2018) microdata.
0
20
40
60
80
100
120
Luxe
mbo
urg
Bulg
aria
Slov
enia
Spai
nPo
rtug
alM
alta UK
Belg
ium
Italy
Latv
iaIre
land
Gree
ceNe
ther
land
sFr
ance
Rom
ania
Lithu
ania
Czec
hCy
prus
Hung
ary
Finl
and
Denm
ark
Esto
nia
Swed
enCr
oatia
Pola
ndAu
stria
Blue collar pay (% national average)
Craft Manual
Figure 11: Blue collar pay in construction.Source: EU-SILC (2018) microdata.
How is it that relative pay in the sector is around or even above EU norms given the low productivity in Irish construction? Recall that productivity in Irish construction is below European norms, but overall productivity across the economy is higher. This, all else equal, would put downward pressure on construction pay when benchmarked against average, economy-wide earnings. One possibility is that the Irish construction workforce captures a higher share of the construction pie. That is, the share of profits (before wages) that construction workers receive, labour’s share of value added, is large. That would then explain the solid performance of construction pay, despite the sector generating a more modest share of national income. This, however, is not the case. At 49.2% in 2018, labour’s share of value added in the sector is at the middling-to-lower end by EU standards – 19th out of 28 countries (Eurostat, 2021).
However, construction’s share of value added is high by Irish standards.11 The ratio of labour’s share of value added in construction to labour’s share in non-construction is 2.17 (ibid.).12 This means that
11 It seems that labour gets a lower share of economy-wide national income and capital a higher share in Ireland than in other countries. This explains why construction’s labour share of value added is modest by EU standards but is high by Irish standards. Irish national income figures, however, are contaminated by profit shifting of the multinational sector (Sweeney P., 2013), which renders cross-country comparisons uncertain. Whatever the respective shares of labour and capital are, it does not, incidentally, result in Ireland being especially income unequal. Overall, income inequality is around the middle by EU standards, due to progressive taxation and transfers. 12 This figure excludes public sectors such as education and health and sectors such as ICT and financial services. Public sectors are excluded because of the difficulties of measuring value added in non-profit organisations, while the latter groups are excluded because of the distortions caused by MNEs in an Irish context.
Job quality in the Irish construction sector
32

construction workers in Ireland get more than twice the share of their sector’s pie than other sectors in Ireland get. This is the highest in the EU (ibid.).13 In other words, despite productivity being low and labour’s share of value added being modest by EU standards, pay is solid because by Irish standards construction workers get a very healthy share of the income generated by their sector. This increases construction pay relative to the economy-wide average.
In sum, much of the innovation and productivity growth in Ireland takes place in industries such as pharmaceuticals, tech, healthcare and other foreign and export-based sectors. Ireland relies a lot on state transfers by European standards and so wages tend to comprise a smaller share of income. Owing to its modest productivity compared to other sectors, construction gets a small share of national income in Ireland. Moreover, Irish construction workers get a somewhat below average share of the construction pie compared by European standards. Both these factors put downward pressure on pay. Nonetheless, construction pay in Ireland is solid compared to average pay. The solid performance is because workers in sector get a large share of the pie by Irish standards. Management and professionals as a group are very well-paid, while blue craft and manual workers are towards the middle and lower ends.
13 This is saying that if we benchmark the share of the pie construction workers get compared to the share of pie non-construction workers get, Ireland is at the top of the class in the EU. If, however, we just look at the share of the pie Irish construction workers get without reference to non-construction workers Ireland is more middle-to-low by EU standards. One reason why the performance of construction workers share may be strong relative to non-construction within Ireland is sectoral bargaining arrangements. However, this needs to be established as high white-collar pay somewhat flatters the average construction pay.
Job quality: Income and pay
33

Job quality: in-work conditions
34
Job quality: in-work conditionsWe now turn to indicators of job quality that go beyond pay and contractual conditions. While pay and contractual terms are central components of job quality, non-monetary aspects of work are also important. As the workplace is where most people spend the majority of their waking life as adults, the intrinsic nature of work and the quality of a job play a central role in a person’s wellbeing. The nature of the work also influences its perceived desirability.
Indicators of job quality are often constructed on the basis of their epidemiological consequences. That is to say, measurable attributes of a job which correlate strongly, either positively or negatively, with some health outcome are more likely to be included in indexes and indicators of job quality. The approach taken here is informed by Eurofound (2017) and especially Sweeney (2020) but modified on the grounds for legibility purposes. It utilises the European Working Conditions Survey (EWCS), a European-wide survey run every four years. Release of the 2020 survey has been postponed due to Covid-19 so the latest year of data is 2015. The analysis generally tries to compare pre and post-crisis trends, though not all questions were available in earlier waves.
AutonomyThe bespoke and complicated problem solving involved in construction work suggests that construction workers should have a comparatively high level of autonomy. As it is very difficult to specify the range of tasks that need to be performed prior to construction work beginning, workers must exercise their own judgement and skill. Bobek and Wickham (2015) venture that construction workers have considerable control over their time, but not on the goals of their work. As they put it ‘the targets are set for them, the sequence of tasks is not’ (Bobek and Wickham, 2015: 13). This certainly makes sense if one considers that the buyer cares much about the specs and aesthetics of a house, but little about they come about.
Figure 12 below looks at a number of measures of job autonomy. The measure is positive in that the more autonomy one has, the better the working environment. The figure shows the proportion of workers who have control over their working time arrangements; are consulted on workplace objectives most or all of the time; participate in workplace improvements most or all of the time; are able to apply their own ideas most or all of the time; and are able to influence decisions important for their work most or all of the time.
Job quality: in-work conditions
35

Figure 12: Autonomy in the construction sector.
Source: ESWC microdata.
What we see is that the construction workforce generally has more autonomy than the rest of the workforce. They exert significant control over working time, they participate in workplace improvements, and are able to apply their own ideas to an unusual degree. They are also able to influence decisions that affect them more than other workers. They are not consulted on workplace objectives any more than other workers. In that case, it is the same as the rest of the workforce.
As most of the indicators are available only for the previous, 2010 wave and not the pre-crisis 2005 wave, less can be said about trends over time. The construction workforce is, however, reporting a higher degree of autonomy in the most recent survey. For the rest of the workforce there is less change. However, construction workers also report greater control over their working time since 2005 when labour markets were considerably tighter.
As already alluded to, the difficulty in specifying beforehand the work involved means that construction projects are prone to not meeting deadlines. This may result in high levels of time pressure on the workforce as they struggle to meet deadlines. A possibility raised by Bobek and Wickham is that time pressure has increased since the financial crisis. In order to cut costs, they argue, contractors may have reduced the amount of people on-site, without commensurate reductions in the workload.
EWCS contains a number of questions on pace of work. One question simply asks, yes or no, whether pace of work is determined by external factors. The five factors are colleagues’ work, customers, performance targets, speed of some machine, and under direct control of the boss. If work pace is determined by three of more of these five factors, we deem the respondent to have
0102030405060708090
100
Workplace autonomy (%workforce)
Construction Rest
Figure 12: Autonomy in the construction sector.Source: ESWC microdata.
What we see is that the construction workforce generally has more autonomy than the rest of the workforce. They exert significant control over working time, they participate in workplace improvements, and are able to apply their own ideas to an unusual degree. They are also able to influence decisions that affect them more than other workers. They are not consulted on workplace objectives any more than other workers. In that case, it is the same as the rest of the workforce.
As most of the indicators are available only for the previous, 2010 wave and not the pre-crisis 2005 wave, less can be said about trends over time. The construction workforce is, however, reporting a higher degree of autonomy in the most recent survey. For the rest of the workforce there is less change. However, construction workers also report greater control over their working time since 2005 when labour markets were considerably tighter.
As already alluded to, the difficulty in specifying beforehand the work involved means that construction projects are prone to not meeting deadlines. This may result in high levels of time pressure on the workforce as they struggle to meet deadlines. A possibility raised by Bobek and Wickham is that time pressure has increased since the financial crisis. In order to cut costs, they argue, contractors may have reduced the amount of people on-site, without commensurate reductions in the workload.
EWCS contains a number of questions on pace of work. One question simply asks, yes or no, whether pace of work is determined by external factors. The five factors are colleagues’ work, customers, performance targets, speed of some machine, and under direct control of the boss. If work pace is determined by three of more of these five factors, we deem the respondent to have control little control over the pace of work. The survey also asks to what extent the worker is working at very high speeds and to what extent s/he is working to tight deadlines. If they spend half or more of their time working at high speeds/under tight deadlines, we deem them to be under time pressure.
Job quality in the Irish construction sector
36

control little control over the pace of work. The survey also asks to what extent the worker is working at very high speeds and to what extent s/he is working to tight deadlines. If they spend half or more of their time working at high speeds/under tight deadlines, we deem them to be under time pressure.
Figure 13. Work pace in construction.
Source: ESWC microdata.
There is evidence of the workforce being under more pressure in terms of work pace. Workers in construction, though not the rest of the economy, have less say over the pace of work in 2015 than in 2005. The pace of work is determined mostly by external factors for just under 47% of the workforce. This is a significant increase since 2005. Perhaps the most telling statistic is that more construction workers now report having to work at very high speeds half or more of the time. This may be a reflection of economy-wide trends as a similar increase is apparent in non-construction workplaces. The economic recovery affected construction more given its previous decline, but the recovery was not confined to the sector. There is a slight decrease in the share of workers who spend half or more of their time working to deadlines, but the change is not that large.
Social environment
The social environment of the construction workplace has often come in for criticism. While the
0
10
20
30
40
50
60
70
80
Littlecontrol '15
Littlecontrol '05
Highspeed '15
Highspeed '05
Deadlines'15
Deadline'05
Work pace
Construction Rest
Figure 13. Work pace in construction.Source: ESWC microdata.
There is evidence of the workforce being under more pressure in terms of work pace. Workers in construction, though not the rest of the economy, have less say over the pace of work in 2015 than in 2005. The pace of work is determined mostly by external factors for just under 47% of the workforce. This is a significant increase since 2005. Perhaps the most telling statistic is that more construction workers now report having to work at very high speeds half or more of the time. This may be a reflection of economy-wide trends as a similar increase is apparent in non-construction workplaces. The economic recovery affected construction more given its previous decline, but the recovery was not confined to the sector. There is a slight decrease in the share of workers who spend half or more of their time working to deadlines, but the change is not that large.
Social environmentThe social environment of the construction workplace has often come in for criticism. While the stereotype of the sector as macho remains, the culture is changing. Nevertheless the culture can result in a variety of behaviours which have a detrimental effect on those working in the sector. Banter, for instance, is not necessarily bad but is sometimes just disguised bullying. Apprentices, in particular, can be vulnerable where bullying can be seen as is a rite of passage (Riggall et al., 2017).
As we shall see, there are difficulties in accurately capturing and measuring an anti-social work environment. Different cultural norms across nationalities, social class, sectors of the economy, and between men and women inject uncertainties when relying on self-reporting in surveys. For instance, workers in Poland and Bulgaria report among the lowest levels of harassment in the EU and Finland and Sweden among the highest (Sweeney, 2020). An alternative approach is to ask indirect questions whereby anti-social behaviour is measured by the researcher’s methodology. A potential drawback is that it is independent of whether the respondent perceives, say, bullying and so omits his or her interpretation of an event.
Job quality: in-work conditions
37

These caveats aside, the EWCS relies on self-reporting. The figure below measures the proportion of workers who report having experienced the following in the last 12 months: discrimination, physical violence, sexual harassment, and bullying/harassment. Discrimination can be either against age, race/ethnicity, nationality, sex, religion, disability, or sexual orientation. For non-discriminatory forms of mistreatment, the yes or no is based on a single question.
stereotype of the sector as macho remains, the culture is changing. Nevertheless the culture can result in a variety of behaviours which have a detrimental effect on those working in the sector. Banter, for instance, is not necessarily bad but is sometimes just disguised bullying. Apprentices, in particular, can be vulnerable where bullying can be seen as is a rite of passage (Riggall et al., 2017).
As we shall see, there are difficulties in accurately capturing and measuring an anti-social work environment. Different cultural norms across nationalities, social class, sectors of the economy, and between men and women inject uncertainties when relying on self-reporting in surveys. For instance, workers in Poland and Bulgaria report among the lowest levels of harassment in the EU and Finland and Sweden among the highest (Sweeney, 2020). An alternative approach is to ask indirect questions whereby anti-social behaviour is measured by the researcher’s methodology. A potential drawback is that it is independent of whether the respondent perceives, say, bullying and so omits his or her interpretation of an event.
These caveats aside, the EWCS relies on self-reporting. The figure below measures the proportion of workers who report having experienced the following in the last 12 months: discrimination, physical violence, sexual harassment, and bullying/harassment. Discrimination can be either against age, race/ethnicity, nationality, sex, religion, disability, or sexual orientation. For non-discriminatory forms of mistreatment, the yes or no is based on a single question.
Figure 14: Social environment in construction.
Source: ESWC microdata.
02468
10121416
Social environment
Construction Rest
Figure 14: Social environment in construction.Source: ESWC microdata.
The survey findings suggest the construction sector has little or no discrimination, bullying, or harassment. No respondents answered affirmative when questioned on their experiences in 2015, albeit some reported discrimination and bullying pre-crisis. This is in contrast to the rest of the workforce. All forms of anti-social behaviour are reported outside of construction. For the rest, the various forms of anti-social behaviour appear to be falling except for discrimination which rose between 2005 and 2015.
The alternative, more plausible explanation is that certain behaviours are more expected and tolerated in the industry, albeit things are changing. Due to the culture of the sector, it is possible that a higher bar must then be passed for a construction worker to identify themselves as subject to mistreatment. In contrast to employees, 15% of employers believe a bullying culture gives rise to mental health problems in Irish construction (CIF, 2020). A CIOB survey of workers in the UK found that 64% of those employed in blue collar occupations experienced stress due to bullying in the previous year (Rees-Evans, 2020). How the question is posed is obviously an important factor in measuring the prevalence of bullying and mistreatment.
Dainty et al. (2004) reports a hostile environment for non-traditional entrants, namely ethnic minorities and women, in the British construction sector. This hostile environment includes exclusive networks and an adversarial culture. Similarly, Caplan et al. (2009) report ethnic discrimination at the recruitment and, indeed, other levels for the UK. Though discrimination and bullying has plausibly declined, it remains a problem.
Physical violence is a more objective experience. It is then more plausible that few workers experience it when that is what they report, as in Figure 12. Part of the reason for the absence of reported sexual
Job quality in the Irish construction sector
38
harassment is that there are so few women in the sector. Given the small sample size of EWCS and the small share of women in the industry, less than a handful of construction respondents are likely to be women in any given year. One cannot therefore make any generalisations about the experience of women in the sector. Other studies report construction has the third highest rate of unwanted sexual attention among all sectors for British women (CCS, 2020). Again in the UK, 22% of women in the sector report that they had experienced sexual harassment (Wawro et al., 2018).14
HealthIt is well-known that the building site is among the more hazardous places to work. Exposures include carrying heavy loads, working in bad weather, vibrations, awkward working positions, and chemical risks. Most firms within construction are small and medium-sized enterprises operating under highly competitive conditions. Unlike the larger firms they have relatively slim profit margins and so have less capacity to address health and safety issues.
The Health and Safety Authority of Ireland provides an annual analysis of workplace injury and illness. In each of the five years of reporting, construction has had the highest rate of non-fatal work-related injuries that lead to a significant absence from work (HAS, 2020). The most common types of accident arise from slips and falls, internal injuries from manual handling of objects (such as a back injury), and injuries arising from loss of control over object, machines, or vehicles. The rate of injury has, however, fallen significantly. In 2004 there were almost 30 injuries per 1000 workers leading to more than four days absence from work. In 2018 the figure was just under 17. For illness, construction is the fifth most hazardous out of 14 sectors listed by HAS. The number of illnesses leading to more than four days of absence has also fallen – from around 18 per 1000 workers in 2018 to 15 between 2014 and 2018 (ibid.: 25).
Construction has the second highest rate of fatal injuries among sectors in Ireland. Like non-fatal injuries and illnesses, the number has fallen significantly in recent years, from 17.4 to 8.2 per 100,000 workers. Injuries mostly happened to older and self-employed workers, where health and safety is more at the discretion of the person. The most common cause was the impact from by a fall from height (HAS, 2020). There is less work on the longer-term health effects of construction in Ireland. In the UK, older construction workers are at elevated risk of respiratory, skin, and musculoskeletal disorders as a result of their work (Stocks et al., 2010).
Cross-country comparisons of health and safety in construction are difficult as for non-fatal accidents and illnesses days taken off work is a key metric. The tendency to take time off is shaped by cultural norms, welfare supports, and the availability leave. Ireland ranks in the middle among EU countries in a standardised measure of non-fatal accident incidence. Implausibly, Eastern European countries appear the safest and Nordic countries the most dangerous (Eurostat, 2021). For instance, Romania has the highest rate of construction fatalities but the lowest incidence rate of non-fatal accidents as measured days of work lost. Ireland has the joint sixth lowest rate of fatal injuries, a more objective measurement (ibid.). Irish building sites are safe by EU standards.
The mental health of construction workers receives less attention. A recent report by the CIOB finds stress to be the most common mental health issue in the UK (Rees-Evans, 2020). A variety of factors can contribute to poor mental wellbeing in the sector as outlined in a recent report by the CIF. In
14 They do not specify the timeframe though they cite another study which reports 31% of US women say sexual harassment is a constant or frequent experience.
Job quality: in-work conditions
39

order of importance according to employers, key factors include work-related stress, unrealistic work targets, long hours, a macho culture, bullying, and more (CIF, 2020). Job uncertainty, working away from home, working in isolation, and, for employers, late payments are also significant (Rees-Evans, 2020) Aside from large companies, most Irish firms do not have a formal mental health policy despite half of employers believing it to be a key cause absenteeism (CIF, 2020). CIOB reports a number of studies that show construction workers are more likely to suffer poor mental health, with males in the sector three times more likely to commit suicide than the typical male (Rees-Evans, 2020: 10-11). Stocks et al. (2010) find a lower incidence of work-related mental health issues among UK construction workers.
Figure 15 below examines perceptions of health and well-being in the construction sector. It examines the percentage of the workforce who feel their health and safety is at risk because of their job, feel exhausted most of the time after work, and who experience stress in their work most of the time.
Figure 15 below examines perceptions of health and well-being in the construction sector. It examines the percentage of the workforce who feel their health and safety is at risk because of their job, feel exhausted most of the time after work, and who experience stress in their work most of the time.
Figure 15: Health and wellbeing in construction
Source: ESWC microdata.
As one would expect, a much higher percentage of construction workers feel their health and safety is at risk because of their job than the rest of the workforce. What is surprising is that the figure has increased despite the fact that, objectively speaking, construction is becoming a safer occupation. It may be that as standards have improved so have expectations of what ought to be done. The change is not large so it may also be sampling anomaly. Also surprising is that construction workers are less likely to report being exhausted at the end of the day. Construction workers reported being stressed due to work in similar numbers to other workers in 2015, though it has increased since 2010. This is unsurprising in light of the reported higher workload discussed above. Moreover, contractual terms were somewhat more precarious in 2015 than in 2010. Perhaps the next wave of the survey will reveal lower reported stress levels.
Discussion
The Irish construction sector today is very different to what it was in the recent past. Direct
05
101520253035404550
Health and well-being in construction
Construction Rest
Figure 15: Health and wellbeing in constructionSource: ESWC microdata.
As one would expect, a much higher percentage of construction workers feel their health and safety is at risk because of their job than the rest of the workforce. What is surprising is that the figure has increased despite the fact that, objectively speaking, construction is becoming a safer occupation. It may be that as standards have improved so have expectations of what ought to be done. The change is not large so it may also be a sampling anomaly. Also surprising is that construction workers are less likely to report being exhausted at the end of the day. Construction workers reported being stressed due to work in similar numbers to other workers in 2015, though it has increased since 2010. This is unsurprising in light of the reported higher workload discussed above. Moreover, contractual terms were somewhat more precarious in 2015 than in 2010. Perhaps the next wave of the survey will reveal lower reported stress levels.
Job quality in the Irish construction sector
40

Discussion
41

DiscussionThe Irish construction sector today is very different to what it was in the recent past. Direct employment now constitutes a much smaller share of total employment and the size of the sector is currently more in line with international norms. The bursting of Ireland’s housing bubble led to large employment losses and much of that labour seems to have left the country. As the economy recovered and along with it the demand for housing and infrastructure, the sector was ill-prepared to meet that demand. The result was acute shortages of skills and labour, where the latter was manifested in construction wages growing faster than the wider economy.
Construction began to get back on track as the labour and skills shortages were gradually addressed. The supply of housing also picked up and from 2017 the house price-to-income ratio improved. The arrival of Covid-19 has, unfortunately, thrown a spanner in the works of that recovery. The lockdowns of 2020 put much construction on hold but the supply of housing for 2020 nevertheless fell only marginally. Important questions are whether the sector is primed to meet the pent-up demand that has been building since before the pandemic, and whether the public sector will re-enter the housing development space.
The most important component of job quality is pay. The comparatively weak productivity performance of Irish construction and the modest share of value-added captured by labour bode poorly on this front. However, in aggregate, construction is well-paid in Ireland. When benchmarked against average pay, construction pay is above EU norms. White collar professionals are very well-paid while craft workers are somewhat below the middle. Less-skilled manual labour pay is toward the lower end by EU standards. Average pay is good despite a disappointing productivity performance and a lower labour share of value-added because, by Irish standards, the construction workforce captures a very healthy share of the income generated by the sector.
So, is construction a financially attractive career? In aggregate, it is. Is it an attractive career for less-skilled workers who comprise most of the construction workforce? Yes, but the answer is more qualified. The Irish economic model is one of comparatively weak protections for less-skilled workers. Transfers by the state supplement income from work to lift people out of poverty to a much greater extent here. This facilitates high levels of wage inequality as less-skilled workers get a smaller share of income generated in their respective industries. However, given construction workers get a very high share of income generated by the sector by Irish standards, craft work in particular is for many a route to higher living standards and social mobility. It is likely to be considerably better-paid job than comparably-skilled and educated work. This is less the case for lower-skilled manual work, though it is still more financially rewarding than work hospitality, retail, and other sectors. On the other hand, blue-collar construction work, both craft and manual, is further away from the average than in other countries. Thus, a would-be teacher or accountant has less incentive to become an electrician in Ireland than most other countries.
The extent of precariousness in the sector says the legacy of the financial crisis still persists. This instability is despite improvements in contractual terms in recent years. Solo self-employment and temporary contracts remain at elevated levels compared to the mid and early 2000s. Temporary contracts are less prevalent in construction whereas solo self-employment is considerably more common. The latter is a problem for craft workers in particular. Involuntary part-time work, which is perhaps more sensitive to the economic cycle than the legal and institutional framework, is essentially back at its pre-crisis level.
Job quality in the Irish construction sector
42
The final component of job quality examined was in-work conditions. The EWCS provides many metrics that can measure non-monetary and non-contractual aspects of construction work. One measure we did not include was whether construction workers believe they are doing something useful. It will come as little surprise that most do. 91% of those working in the sector had a job well done feeling in 2015 and 93% believe they are doing something useful. This compares to 81% and 86% for the rest of the workforce. It is also little surprise that construction work provides for a greater degree of job autonomy than other jobs. However, despite the greater control exerted over their tasks, there is evidence that construction workers are now under more time pressure. At least this was the case in 2015, when the sector was experiencing labour shortages. Construction provides for meaningful work where skills are applied to produce a tangible product to the benefit of society.
The sector has a certain reputation for not having moved with the times. Though self-reporting from the EWCS does not reveal this to be the case, there is evidence nonetheless it is true. Bullying, especially of apprentices, rears its head repeatedly in studies. Discrimination also appears to be a problem. Sexual harassment and similar behaviours were not apparent, primarily because there are so few women in the survey. Improvements in the work environment are desirable in and of themselves but also if the aspiration of a workplace more open to underrepresented groups is to be realised.
One area of that has seen major improvements is the health and safety of the sector. Construction remains one of the most dangerous and hazardous industries to work in and it will probably continue to be so given the nature of the work. Fatal and non-fatal injuries have declined, as has absence due to illness. Compared to other countries, the Irish construction site is a safe place to work. Part a response to societal trends and part related to the culture of the sector, the mental health of workers is receiving growing attention.
This report raises a variety of issues facing the construction sector that need to be addressed by government and industry. While the following recommendations are not exhaustive, they represent a practicable, targeted approach that can be implemented right away in response to the central issues raised by the report.
Discussion
43

Recommendations
44

RecommendationsIssue 1: The cyclicality of the construction sector and the missing agent in house buildingCyclicality is the root cause of many of the issues uncovered by this report: productivity; the pool of labour and the ability to attract new talent; job stability; and working conditions all suffer as a direct result of the construction sector’s perpetual boom-bust cycle. Cyclicality also negatively impacts the sector’s ability to meet housing and infrastructure need during an economic downturn, as well as the sector’s ability to respond and meet demand during an upturn.
As the biggest client of the construction sector, the Government can play a direct role in arresting this cyclicality by providing a clear, long term pipeline of construction ‘projects’. In order to directly address cyclicality and concurrently meet the scale of the housing supply shortfall, Government needs to resuscitate the missing agent of public housing delivery that has ebbed away since the 1980s.
Recommendation 1: As part of its housing policy planning, the Government should assemble and publish a stand-alone, comprehensive pipeline of projects in the local-authority built housing sector. This should be along the same lines as the National Development Plan. However, rather than relying on developer contributions, leasing or acquisition of housing from the open market, the strategy should create local development corporations with land management resources and specific targets for directly constructed social and affordable housing.
Issue 2: ProductivityPerpetual volatility in demand for construction has led firms, particularly SMEs, to curb capital investment; spending on research and development (R&D) brings high fixed costs that are difficult to cut in an economic downturn. Accordingly, lack of available finance is a major stumbling block for SMEs investing in tools that could improve productivity. Creating an Innovation Fund to channel low cost, long-term loans to SMEs for investment in formal R&D would address this, and lead to sector wide improvements in productivity. A similar fund exists in Holland, where the MKB+ (Innovation Fund for SMEs) gives construction firms access to finance to embed innovative new products, services and processes in their business
Recommendation 2: Create an SME Construction Innovation fund to stimulate investment in formal R&D.
Issue 3: The attrition of women between education and the workforceThe report finds that the pool of workers in construction is not sufficiently large, and – despite improvements – the sector is still largely male dominated. Trends in higher education courses show a higher proportion of women studying built environment courses compared to women working in the sector. This suggests a significant attrition rate; there are more women interested in construction occupations than who end up working in the industry. Given that there is an existing interest in the construction sector in this group, a targeted approach to reduce the attrition rate could be one of the most effective tools to encourage more women into the workforce.
Discussion
45
Recommendation 3: Professional bodies, universities and colleges should work together on a targeted approach to create a clear pathway for the cohort of women who study built environment subjects to work in the sector.
Issue 4: Bullying, harassment, and mental health issues in the workplace.The report finds that, while the sector is improving, there are still serious issues that need to be dealt with in terms of health and wellbeing, bullying, and harassment in the workplace. Based on findings from a 2019 survey on mental health in the construction sector, the CIOB is working with MentUp15 to develop a series of tools for employees of construction SMES in Ireland to deal with mental health issues. This model could be extended to encompass bullying and harassment.
Recommendation 4: Professional bodies and industry should work together to create a culture of openness, and to offer employees tools to deal with bullying, harassment, and mental health issues in the workplace.
Issue 5: Contractual stabilityThe report finds that precariousness became more prevalent in the sector as with the onset of the financial crisis, though has since improved. Elevated levels of solo self-employment indicate bogus self-employment remains a problem. Anecdotal evidence suggests hiring workers as nominal contractors is more common in residential construction, which contains more small firms compared to public and industrial construction. There is evidence that construction has become more concentrated in other countries, and so it would be useful to understand to what extent it is large firms with healthy profit margins that hire nominally self-employed, and what extent it is smaller, less profitable entities. One mechanism to reduce such practices is through public procurement which specify acceptable types of employment contracts.
Recommendation 5: Future research to examine which firms utilise workers who are nominally contractors, but are in reality employees. Government to drive enforcement of labour standards in public procurement practices.
Issue 6: Pay of less skilled workers.The report finds that in aggregate pay in the sector is good. Though still better than occupations of comparable education levels, pay among blue-collar and especially less-skilled manual labour is toward the lower end of the ranking among EU countries. Pay can be improved through productivity growth where the gains accrue to less-skilled labour more. It can also be achieved by redistribution between high-skilled workers, who are very well paid in Ireland, and the less-skilled workforce. Finally, it can be achieved by a greater share of value-added going to the workforce.
Recommendation 6: Structures should be put in place to improve the pay of the less-skilled. This can complement other measures, such as improved productivity and investment in R&D and can also be done through the SEO system.
15 MENTUPP (‘Mental Health Promotion and Intervention in Occupational Settings‘) is an EU-funded international research project with the primary aim to improve mental health in the workplace by developing, implementing and evaluating a multilevel intervention targeting mental health difficulties in SMEs in the construction, health and ICT sectors. The secondary aim is to reduce depression and suicidal behaviour at the workplace. MENTUPP consists of 17 global partners with expertise in mental health, suicide prevention, depression, mental illness stigma, implementation science, as well as health economics.
Job quality in the Irish construction sector
46
Recommendations

References
47
ReferencesBobek, A. and Wickham, J. (2015) ‘Employment in the Irish construction sector: A preliminary background report’, ICTU-TASC-FEPS. Available at: https://www.tasc.ie/assets/files/pdf/20150929160711.pdf
Brandolini, A., Rosolia, A., and Torrini, R. (2011) ‘The distribution of employees’ labour earnings in the European Union: data, concepts and first results’, Society for the Study of Economic Inequality, ECINEQ WP – 198.
CA (2004) ‘Competition in professional services: engineers’, Competition Authority of Ireland. Available at: https://www.ccpc.ie/business/wp-content/uploads/ sites/3/2017/ 04/engineers-report.pdf
CA (2006) ‘Competition in professional services: architects’, Competition Authority of Ireland. Available at: https://www.ccpc.ie/business/wp-content/uploads/sites/3/2017/04/architects_report.pdf
Cahill, N. (2018) ‘International approaches to land use, housing and urban development’, NESC. Available at: http://files.nesc.ie/nesc_secretariat_papers/No_14_InternationalApproachestoHousingandUrbanDevelopment.pdf
Caplan, A., Aujla, A., Prosser, S., and Jackson, J. (2009) ‘Race discrimination in the construction industry: A thematic review’ Manchester: Equality and Human Rights Commission.
CCS (2020) ‘Spotlight on women in construction, report, Considerate Constructors Scheme’, Considerate Constructors Scheme. Available at: https://www.ccscheme.org.uk/publications/spotlighton/womeninconstruction/2/#zoom=z
CIF (2018) ‘Women in the construction industry: accurate information is central to all decision making. Available at: https://cif.ie/wp-content/uploads/2018/03/CIF-Membership-Diversity-SURVEY-REPORT.pdf
CIF (2020) ‘Mental health in the construction sector’, Construction Industry Federation.
Conefrey, T. and McIndoe-Calder, T. (2018) ‘Where are Ireland’s construction workers?’, Central Bank of Ireland, Quarterly Bulletin, 02/April 18
Crates, E. (2016) Building a fairer system: tackling modern slavery in construction supply chains, Chartered Institute of Building.
CSO (2005) ‘Quarterly National Household Survey: Union membership 1994 to 2004’, Central Statistics Office. Available at: https://www.cso.ie/en/media/csoie/releasespublications/documents/labourmarket/2004/qnhsunionmembership_1994-2004.pdf
CSO (2020) Statbank. Available at:
https://statbank.cso.ie/px/pxeirestat/Statire/SelectVarVal/saveselections.asp
Daft (2019a) ‘The Daft.ie house price report: an analysis of recent trends in the Irish residential sales market for 2019 Q1’, Daft.ie, report. Available at: https://ww1.daft.ie/report/2019-Q1-houseprice-daftreport.pdf?d_rd=1
Daft (2019b) ‘The Daft.ie house price report: an analysis of recent trends in the Irish residential sales market for 2019 Q2’, Daft.ie, report. Available at: https://ww1.daft.ie/report/2019-Q2-houseprice-daftreport.pdf?d_rd=1
Job quality in the Irish construction sector
48

Daft (2019c) ‘The Daft.ie house price report: an analysis of recent trends in the Irish residential sales market for 2019 Q3 Daft.ie’, report. Available at: https://ww1.daft.ie/report/2019-Q3-houseprice-daftreport.pdf?d_rd=1
Daft (2019d) ‘The Daft.ie house price report: an analysis of recent trends in the Irish residential sales market for 2019 Q4’, Daft.ie, report. Available at: https://ww1.daft.ie/report/2019-Q4-houseprice-daftreport.pdf?d_rd=1
Dainty, A. R., Bagilhole, B. M., Ansari, K. H., and Jackson, J. (2004) ‘Creating equality in the construction industry: An agenda for change for women and ethnic minorities’, Journal of construction research, 5(01), 75-86.
Delaney, J., and Devereux, P. J. (2019) ‘It’s not just for boys! Understanding gender differences in STEM’, Economics of Education Review, 72, 219-238.
Doval Tedin, M.J. and Faubert, V. (2020) ‘Housing affordability in Ireland’, European Commission, Economic brief 061.
DPER (2020a) ‘Build 2020: Construction sector performance and capacity’, Department of Public Expenditure and Reform. Available at: https://www.gov.ie/en/publication/c19a5-build-2020-construction-sector-performance-and-capacity/
DPER (2020b) ‘Economic analysis of productivity in the Irish construction sector’, Department of Public Expenditure and Reform. Available at: https://www.assets.gov.ie/75034/5ea76039-b46b-434d-9b66-ab2936df38f7.pdf
Druker, J. and White, G. (2013) ‘Employment relations on major construction projects: the London 2012 Olympic construction site’, Industrial Relations Journal, 44(5-6), 566-583.
EIGE (2017) ‘Gender segregation in education, training and the labour market: review of the implementation of the Beijing Platform for Action in the EU member states’, European Institute for Gender Equality. Available at: https://data.consilium.europa.eu/doc/document/ST-14624-2017-ADD-2/en/pdf
Engineers Ireland (2018) Engineering 2018: a barometer of the profession in Ireland. Available at: https://www.engineersireland.ie/LinkClick.aspx?fileticket=TMZqm9Og4Zk%3D&portalid=0&resourceView=1
Eurofound (2017) ‘Sixth European Working Conditions Survey – Overview report (2017 update)’, Publications Office of the European Union, Luxembourg.
Eurostat (2021) Statbank: population and social conditions, health and safety at work, details by NACE Rev.2 activity.
Fingleton, A., Loughnane, M., McGuiness, L., McKenna, K. (2014) ‘Towards gender balance in engineering, UCD Engineering Graduate Studies Association’. Available at: https://www.ucd.ie/t4cms/TowardsGenderBalanceinEngineering.pdf
Gjerstad, S. D., and Smith, V. L. (2014) Rethinking housing bubbles: The role of household and bank balance sheets in modeling economic cycles. Cambridge University Press.
Goldrick-Kelly, P. and McDonnell, T. A. (2017) Public Spending in the Republic of Ireland: A Descriptive Overwiew and Growth Implications, Nevin Economic Research Institute, working paper 2017/46.
Goldrick-Kelly, P. and MacFlynn (2018) Productivity on the island of Ireland: a tale of three economies,
References
49

Nevin Economic Research Institute, working paper 2018/57.
Green, B. (2020) ‘The real face of construction: socioeconomic analysis of the true value of the built environment’, Chartered Institute of Building. Available at: https://policy.ciob.org/wp-content/uploads/2020/02/The-Real-Face-of-Construction-2020.pdf
HAS (2020) ‘Annual review of workplace injury, illness and fatality statistics: 2018-2019’, Health and Safety Authority.
Hearne, R. (2020) Housing shock: The Irish housing crisis and how to solve it. Policy Press.
Krings, T., Bobek, A., Moriarty, E., Salamońska, J., and Wickham, J. (2011) ‘From boom to bust: Migrant labour and employers in the Irish construction sector’, Economic and Industrial Democracy, 32(3), 459-476.
Lawless, M., O’Connell, B., and O’Toole, C. (2015) ‘SME recovery following a financial crisis: Does debt overhang matter?’, Journal of Financial Stability, 19, 45-59.
Leamer, E. E. (2007). Housing is the business cycle (No. w13428). National Bureau of Economic Research.
McKinsey (2017) ‘Reinvesting construction: a route to higher productivity’, McKinsey Global Institute. Available at:
https://www.mckinsey.com/~/media/McKinsey/Industries/Capital%20Projects%20and%20Infrastructure/Our%20Insights/Reinventing%20construction%20through%20a%20productivity%20revolution/MGI-Reinventing-Construction-Executive-summary.pdf
McQuinn, K. (2017) ‘Irish house prices: Déjà vu all over again?, Economic and Social Research Institute’, Quarterly Economic Commentary: Special Articles, 85-107.
NERI (2020) ‘Working conditions for construction labourers 2008-2018’, The Nevin Economic Research Institute. Available at: https://www.nerinstitute.net/visualising-our-economy/working-conditions-construction-labourers-2008-2018
Nisbet, P. (2007) ‘Human capital vs. social capital’, International Journal of Social Economics, 34(8): 525-537.
OECD (2013) ‘Glossary of statistical terms: construction, OECD statistics portal’, Organization for Economic Cooperation and Development. Available at: https://stats.oecd.org/glossary/detail.asp?ID=422
OECD (2021) Statbank: labour, employment protection.
Oireachtas (2019) Joint Committee on Employment Affairs and Social Protection debate, Thursday 14 Feb 2019, Houses of the Oireachtas, available at: https://www.oireachtas.ie/en/debates/debate/joint_committee_on_employment_affairs_and_social_protection/2019-02-14/3/
Ó Murchadha, E., and Murphy, R. (2018) ‘Trades and Apprenticeships Skills Survey: the Employers Perspective’, Technological University Dublin. Available at: https://arrow.tudublin.ie/cgi/viewcontent.cgi?article=1019&context=beschrecrep
O’Sullivan, M. (2020) ‘Dispute resolution and wage-setting institutions’, in Wallace, J., Gunnigle, P., O’Sullivan, M., Industrial Relations in Ireland, 5th Edition, Gill and Macmillan: Dublin
PwC-SCSI (2017) ‘SCSI/PwC Construction Survey Report 2017’, Survey by Price Waterhouse Coopers and Society of Chartered Surveyors Ireland. Available at: https://www.pwc.ie/publications/2017/scsi-
Job quality in the Irish construction sector
50

pwc-construction-survey-report.pdf
PwC-SCSI (2018) ‘SCSI/PwC Construction market monitor 2018’, Survey by Price Waterhouse Coopers and Society of Chartered Surveyors Ireland. Available at: https://www.pwc.ie/publications/2018/scsi-pwc-construction-survey-2018.pdf
PwC-SCSI (2019) ‘SCSI/PwC Construction market monitor 2019’, Survey by Price Waterhouse Coopers and Society of Chartered Surveyors Ireland. Available at: https://www.pwc.ie/publications/2019/scsi-pwc-construction-market-monitor-2019.pdf
Rees-Evans, D. (2020) Understanding mental health in the built environment, Chartered Institute of Building. Available at: https://policy.ciob.org/wp-content/uploads/2020/05/Understanding-Mental-Health-in-the-Built-Environment-May-2020-1.pdf
Revenue (2019) Code of practice for determining employment or self-employment status of individuals, Revenue Commissioners, booklet, available at: https://www.revenue.ie/en/self-assessment-and-self-employment/documents/code-of-practice-on-employment-status.pdf
Riggall, M., Skues, J., and Wise, L. (2017) ‘Apprenticeship bullying in the building and construction industry’, Education+ Training, 59(5), 502-515.
Skills Ireland (2020) Building future skills: the demand for skills in Ireland’s built environment sector to 2030. Available at: http://www.skillsireland.ie/all-publications/2020/building-future-skills-report-with-wit-tud-edits-completed-4.pdf
Squicciarini, M. and Asikainen, A. L. (2011) ‘A value chain statistical definition of
construction and the performance of the sector’, Construction Management and Economics, 29:7, 671-693
Stocks, S. J., McNamee, R., Carder, M., and Agius, R. M. (2010) ‘The incidence of medically reported work-related ill health in the UK construction industry’, Occupational and environmental medicine, 67(8), 574-576.
Sweeney, P. (2013) ‘An Inquiry into the Declining Labour Share of National Income and the Consequences for Economies and Societies’, Journal of the Statistical & Social Inquiry Society of Ireland, 42, 109-129
Sweeney, R. (2020) ‘Cherishing All equally 2020: inequality and the care economy’, TASC. Available at: https://www.tasc.ie/assets/files/pdf/cae_2020-report-final.pdf
Sweeney, R. (forthcoming) ‘The fuse that lit it all: risk-weighted capital and the explosion of house markets’.
Walsh, F. (2018) ‘Union membership in Ireland since 2003’, NERI. Available at:
https://www.nerinstitute.net/sites/default/files/events/downloads/2019/frank_walsh_ucd_lmc_22_may_18.pdf
Wawro, M., Horn, J. Raphan, M., and Mick, R. (2018) ‘Why the construction industry needs to focus on sexual harassment’, Conference Presentation, Dorsey. Available at: https://www.dorsey.com/-/media/files/uploads/images/session-1-youtoo-materials.pdf?la=en
Wickham, J. J. R., and Bobek, A. (2016) Enforced Flexibility?: Working in Ireland Today. TASC.
WRC (2020a) ‘Sectoral employment orders: construction sector’, Workplace Relations Commission explanatory post. Available at: https://www.workplacerelations.ie/en/what_you_should_know/hours-
References
51

and-wages/sectoral%20employment%20orders/construction-sector/
WRC (2020b) ‘Sectoral employment orders: mechanical engineering building services contracting sector’, Workplace Relations Commission explanatory post. Available at: https://www.workplacerelations.ie/en/what_you_should_know/hours-and-wages/sectoral%20employment%20orders/mechanical-engineering-building-services-contracting-sector/
WRC (2020c) ‘Minimum rates of pay for workers in the construction and electrical contracting sectors set to rise by 2.7% in the Autumn as Minister Breen gives go ahead for new pay rates following’, Workplace Relations Commission explanatory post. Available at: https://www.workplacerelations.ie/en/news-media/workplace_relations_notices/minimum-rates-of-pay-for-workers-in-the-construction-and-electrical-contracting-sectors-set-to-rise-by-2-7-in-the-autumn-as-minister-breen-gives-go-ahead-for-new-pay-rates-following-labour-court-recommendations.html
Wright, D. B., Eaton, A. A., and Skagerberg, E. (2015). ‘Occupational segregation and psychological gender differences: How empathizing and systemizing help explain the distribution of men and women into (some) occupations.’ Journal of research in personality, 54, 30-39.
Job quality in the Irish construction sector
52

The Chartered Institute of Building (CIOB) is a worldwide professional bodythat represents professionals who work within the built environment.
TASC (Think tank for Action on Social Change) is an independentprogressive think-tank whose core focus is addressing inequality and sustaining democracy.
Design: www.neatdesign.ie
The emergence of Ireland from the financial crisis that began in 2008 has been a long process. The construction sector more than any experienced large losses as many workers were made redundantand emigrated. The loss of labour, skills, and knowledge is among the reasons for our current housingproblems. The arrival of Covid-19 presents further difficulties. It is therefore vital that construction workremains an attractive career open to all.
TASC has partnered with the Chartered Institute of Building to examine job quality in the Irish construction sector. It examines various aspect of job quality including pay, contractual stability, andgeneral working conditions. It explores trends over time, and how Ireland compares to other Europeancountries. Construction remains an important route to higher living standards for many, but challengesremain as the sector modernises.
April 2021


