Page 1
Author’s Accepted Manuscript
Electrosynthesized MIPs for Transferrin:Plastibodies or Nano-Filters?
Xiaorong Zhang, Aysu Yarman, Júlia Erdossy,Sagie Katz, Ingo Zebger, Katharina J. Jetzschmann,Zeynep Altintas, Ulla Wollenberger, Róbert E.Gyurcsányi, Frieder W. Scheller
PII: S0956-5663(18)30017-4DOI: https://doi.org/10.1016/j.bios.2018.01.011Reference: BIOS10204
To appear in: Biosensors and Bioelectronic
Received date: 23 October 2017Revised date: 5 January 2018Accepted date: 7 January 2018
Cite this article as: Xiaorong Zhang, Aysu Yarman, Júlia Erdossy, Sagie Katz,Ingo Zebger, Katharina J. Jetzschmann, Zeynep Altintas, Ulla Wollenberger,Róbert E. Gyurcsányi and Frieder W. Scheller, Electrosynthesized MIPs forTransferrin: Plastibodies or Nano-Filters?, Biosensors and Bioelectronic,https://doi.org/10.1016/j.bios.2018.01.011
This is a PDF file of an unedited manuscript that has been accepted forpublication. As a service to our customers we are providing this early version ofthe manuscript. The manuscript will undergo copyediting, typesetting, andreview of the resulting galley proof before it is published in its final citable form.Please note that during the production process errors may be discovered whichcould affect the content, and all legal disclaimers that apply to the journal pertain.
www.elsevier.com/locate/bios
Page 2
1
Electrosynthesized MIPs for Transferrin: Plastibodies or Nano-Filters?
Xiaorong Zhang1, Aysu Yarman
2, Júlia Erdőssy
3, Sagie Katz
4, Ingo Zebger
4, Katharina J.
Jetzschmann1, Zeynep Altintas
5, Ulla Wollenberger
1, Róbert E. Gyurcsányi
3, Frieder W.
Scheller1*
1. Institute of Biochemistry and Biology, University of Potsdam, Karl-Liebknecht Str. 24-25,
14476 Potsdam, Germany.
2. Faculty of Science, Molecular Biotechnology, Turkish-German University, Sahinkaya Cad.
86, 34820 Beykoz, Istanbul, Turkey.
3. MTA-BME “Lendület” Chemical Nanosensors Research Group, Department of Inorganic
and Analytical Chemistry, Budapest University of Technology and Economics, Szt. Gellért tér
4, H-1111 Budapest, Hungary.
4. Institut für Chemie, PC 14 Technische Universität Berlin, Straße des 17. Juni 135, 10623
Berlin, Germany.
5. Institut für Chemie, TC 8 Technische Universität Berlin, Straße des 17. Juni 124, 10623
Berlin, Germany.
*Corresponding author:
[email protected]
Abstract
Molecularly imprinted polymer (MIP) nanofilms for transferrin (Trf) have been
synthesized on gold surfaces by electro-polymerizing the functional monomer scopoletin in
the presence of the protein target or around pre-adsorbed Trf. As determined by atomic force
microscopy (AFM) the film thickness was comparable with the molecular dimension of the
target. The target (re)binding properties of the electro-synthesized MIP films was evaluated
by cyclic voltammetry (CV) and square wave voltammetry (SWV) through the target-binding
induced permeability changes of the MIP nanofilms to the ferricyanide redox marker, as well
as by surface plasmon resonance (SPR) and surface enhanced infrared absorption
spectroscopy (SEIRAS) of the immobilized protein molecules. For Trf a linear concentration
dependence in the lower micromolar range and an imprinting factor of ~5 was obtained by
Page 3
2
SWV and SPR. Furthermore, non-target proteins including the iron-free apo-Trf were
discriminated by pronounced size and shape specificity. Whilst it is generally assumed that
the rebinding of the target or of cross-reacting proteins exclusively takes place at the polymer
here we considered also the interaction of the protein molecules with the underlying gold
transducers. We demonstrate by SWV that adsorption of proteins suppresses the signal of the
redox marker even at the bare gold surface and by SEIRAS that the treatment of the MIP with
proteinase K or NaOH only partially removes the target protein. Therefore, we conclude that
when interpreting binding of proteins to directly MIP-covered gold electrodes the interactions
between the protein and the gold surface should also be considered.
Keywords:
Molecularly imprinted polymer
Scopoletin
Transferrin
Protein adsorption
Redox marker
1. Introduction
Molecular imprinting of polymers is a technology to create selective recognition sites for a
target molecule in a polymer matrix, i.e., functional monomers are polymerized in
the presence of the template molecule which is subsequently removed. This process leaves
behind cavities in the polymer which are complementary to the shape of the template (Ge and
Turner, 2008). Due to the relevance as biomarkers and pharmaceuticals, proteins attracted the
interest of the molecular imprinting community. However, their instability in organic solvents,
high surface complexity and conformational flexibility make protein imprinting still very
challenging (Whitcombe et al., 2011).
Transferrin (MW 79 kDa, pI 5 - 6) is an iron-transport protein found in biological fluids (de
Jong et al., 1990). The concentration in human serum is around 30 µM (Welch, 1992). The
first molecularly imprinted polymer (MIP) for Trf was presented by the Mosbach group in
Page 4
3
1985: they imprinted a polymer on porous silica support that addressed surface exposed
glycans of the target Trf (Glad et al., 1985). Following this route, Liu’s group introduced
UV-initiated photolithographic molecular imprinting based on boronate affinity as a general
approach for the imprinting of glycoproteins (L. Li et al., 2013). The approach was further
developed by using the boronic acid moiety as an affinity anchor for oriented covalent
immobilization of the template prior surface imprinting (Wang et al., 2014). An approach for
hierarchical imprinting of Trf was developed by Li et al. (Q. Li et al., 2013). Recently a
plasmonic MIP-nanosensor for Trf has been prepared by self-polymerizing dopamine around
the protein which was attached on the surface of gold nanorods (Lv et al., 2016). Rebinding
was quantified by surface-enhanced Raman scattering.
In this work the MIPs were deposited as a thin film on Au electrodes or bare gold SPR chips
by electropolymerization (EP). Template removal and (re)binding was detected by probing the
relevant permeability changes of the MIP film to the redox couple ferri/ferrocyanide using
cyclic voltammetry (CV) and square wave voltammetry (SWV), surface enhanced infrared
absorption spectroscopy (SEIRAS) as well as by surface plasmon resonance (SPR).
Scopoletin (7-hydroxy-6-methoxy-coumarin) was used as the functional monomer
(Gajovic-Eichelmann et al., 2003) and the template was removed by proteinase K digestion.
In order to characterize the influence of the spontaneous adsorption of proteins at the
electrode surface on the signal of the redox marker and on the SEIRA spectra of the
surface-bound protein molecules, the following surface architectures were compared: (i) bare
Au electrode after adsorption of Trf or potentially interfering proteins, (ii) Au electrode after
adsorption of Trf followed by EP, (iii) Au wire and SPR chips after electrosynthesis of MIP
from a solution containing the target Trf and the monomer scopoletin (Fig. 1).
A
Page 5
4
B
Fig. 1. Workflow of MIP preparation. A): in one-step by electropolymerization of
monomer/template mixture. B): in two-steps that involves the pre-adsorption of the target
protein followed by EP of the monomer around the surface-confined targets.
2. Materials and Methods
2.1. Chemicals and reagents
Scopoletin (7-Hydroxy-6-methoxycoumarin), sodium dodecyl sulfate (SDS), hydrogen
peroxide and (11-mercaptoundecyl)tetra-(ethylene glycol) were purchased from Sigma
Aldrich (Steinheim, Germany). Absolute ethanol (≥ 99.8 %), hydrochloric acid, potassium
chloride and sodium hydroxide from VWR (Leuven, Belgium); dipotassium phosphate,
potassium dihydrogen phosphate, potassium hexacyanoferrate (II) trihydrate and ammonia
solution 25 % from Merck (Darmstadt, Germany); sulfuric acid (95 - 98 %), nitric acid (≥
65 %), sodium chloride, potassium hexacyanoferrate (III) and potassium hydroxide from Roth
(Karlsruhe, Germany); disodium hydrogen phosphate dihydrate and Tris from Duchefa
Biochemie (Haarlem, the Netherlands); the proteins holo-Trf, apo-Trf from bovine, albumin
from human serum (HSA), ferritin from equine spleen, urease from jack beans, proteinase K
from Engyodontium album and cytochrome c (cyt c) from equine heart were purchased from
Sigma Aldrich. AT-cut QCM crystals (5 MHz) were purchased from Q-sense (Q-Sense AB,
Sweden). All solutions were prepared with deionized water (DI water) obtained from a water
purification system (Millipore, Eschborn, Germany).
2.2. Electrochemical measurements
Both CV and SWV measurements were carried out with a CHI 440 electrochemical
workstation (CH Instrument, Austin, USA) using a one-compartment three-electrode
electrochemical cell with a volume of 2 mL. Gold wires (Ø 0.5 mm, Goodfellow, Germany)
were used as working electrodes, a spiral platinum wire as the counter electrode and an
Page 6
5
Ag/AgCl system as reference electrode (RE-3V, ALS Co., Japan).
CV and SWV measurements were performed in 5 mM ferri/ferrocyanide in 100 mM KCl. In
CV experiments the potentials were cycled from -0.2 to +0.8 V at a scan rate of 50 mV/s. In
SWV assays the potentials changed from -0.3 to +0.8 V at a frequency of 10 Hz, an amplitude
of 50 mV and a step height of 3 mV. All measurements were carried out at room temperature.
2.3. Workflow of MIP-preparation
Gold wires or gold-covered SPR chips have been used as the transducer of the respective
biomimetic sensor. The Au wire electrodes were cleaned by boiling in 2.5 M KOH for 4 h
followed by storage in concentrated H2SO4 overnight. Before usage, the electrodes were
rinsed with water and kept in 65 % HNO3 for 10 min. After rinsing with DI water again, the
electrodes were ready for use. The SPR chips were integrated in the flow cell and conditioned
by flushing with the buffer solution.
The MIP-layer was deposited by electropolymerizing a solution of 0.5 mM scopoletin on the
Au wire carrying Trf pre-adsorbed from 1 μM Trf. Alternatively, MIPs were synthesized on
SPR-chips or Au-wires using EP of mixtures containing 0.5 mM scopoletin and 1 µM or 10
μM Trf (77 or 770 µg/mL) or 77 µg/mL cyt c in 10 mM NaCl. EP was executed by 30, 50 or
100 pulse pairs starting with 0 V for 5 s and followed by 0.9 V for 1 s. Non-imprinted
polymers (NIPs) were prepared in the same way but without protein. After formation of the
polymer layer, the electrodes were carefully rinsed with DI water and then dried gently under
nitrogen stream.
To remove Trf from the MIP, the template was enzymatically digested followed by intensive
washing to remove the fragments. For the MIPs prepared with 30 EP cycles, the template was
removed by shaking the electrodes at room temperature in a solution containing 100 μg/mL
proteinase K at 300 rpm for 2 h, followed by 3 consecutive washings with phosphate buffered
saline (PBS) for 5 min. For the MIPs prepared with 50 and 100 cycles, the enzymatic
digestion took 4 h followed by overnight shaking in PBS buffer.
The concentration dependence of Trf rebinding was measured after sequential incubation in
0.1, 0.2, 0.5, 1, 2 and 5 μM Trf for 1 h without intermitted template removal. The binding of
other proteins to the MIP or NIP were also evaluated after 1 h incubation.
Page 7
6
2.4. SEIRAS
A nanostructured gold film was chemically deposited on an ATR Silicon prism and
electrochemically cleaned as previously described in (Miyake et al., 2002). This treatment
resulted in island like structures on the gold surface. The prism was then mounted on a
home-made spectro-electrochemical cell. The position of the cell in the Vertex V80s
spectrometer from Bruker was carefully marked and reference spectra (50 mM pH 7
phosphate buffer or H2O) were recorded with 400 scans at a resolution of 4 cm-1
with a photo
conductive, liquid nitrogen cooled mercury cadmium telluride detector. The reference solution
was then exchanged first with 1 µM Trf in 20 mM Tris-HCl, pH 7.5 for an incubation time of
1 h and then with 2 mL of 0.5 mM scopoletin in 10 mM NaCl. For the 15 EP cycles (see
below), an Ag/AgCl reference and a platinum counter electrodes were used, all connected to
an Autolab potentiostat. An IR spectrum was acquired after every 5 cycles. The solution was
then exchanged to 100 μg/mL proteinase K in PBS buffer, pH 7.4. The cell was then removed
from the spectrometer and placed on a shaker for 3.5 h (300 rpm). After mounting the cell
back into the spectrometer, a further solution exchange was carried out (PBS pH 7.4). The cell
was then returned overnight to the shaker. For the rebinding process, the solution was then
exchanged back to a 1 µM Trf solution for a further incubation time of 1 h, followed by
another PBS exchange. For the last step the film was exposed for 5 min to 10 mM NaOH
solution to remove the polymer. A final exchange to PBS was then performed.
2.5. SPR measurements
NIP and MIP microspots were synthesized on gold-covered SPR chip (SPRi-Slide, HORIBA,
France) by microelectrospotting (Bosserdt et al., 2015). An Ag/AgCl wire acting as a counter
electrode was inserted to a spotting needle (d = 500 μm) (HORIBA, France) and the chip
acted as the working electrode. The needle was filled with freshly prepared solution of 0.5
mM scopoletin and various concentrations of Trf in 10 mM NaCl. The electrodes were
connected to a Reference 600 potentiostat (Gamry Instruments, Warminster, PA, USA).
The microelectrospotting was performed using a SPRi-ArrayerTM
(HORIBA, France) by
applying 50 pulse cycles of 0 V for 5 s and 0.9 V for 1 s. The chip was gently shaken in 100
Page 8
7
μg/mL proteinase K overnight to remove the template. It was then washed with PBS three
times for 5 min to remove digested peptide fragments. In order to reduce the non-specific
binding, the chip was incubated in a blocking solution of 1 mM
(11-mercaptoundecyl)tetra(ethylene glycol) (HS-TEG) in PBS buffer for 30 min before SPR
measurement.
Surface plasmon resonance imaging (SPRi) was done by using the system SPRi-PLEX II,
(HORIBA, France). The chip was mounted in to a flow cell (46 μL) and the signal was
monitored in real-time. After stabilization of the baseline in 20 mM Tris-HCl, pH 7.5 (running
buffer), sample solutions of 400 μL were injected into the flow cell at a flow rate of 20
μL/min. For the regeneration 5 mM NaOH was pumped through the flow cell at 20 μL/min
for 10 min followed by 20 mM Tris-HCl, pH 7.5 for another 10 min.
2.6. AFM measurements
The QCM crystals were covered with the polymer layer in a custom-designed electrochemical
cell by applying 50 EP cycles in mixtures containing 0.5 mM scopoletin and 1 µM or 10 μM
Trf in 10 mM NaCl. The template was then removed as described for SPR-chips.
Atomic force microscopy was performed with an EasyScan 2 system from Nanosurf (Liestal,
Switzerland) using a TAP190 GD-G cantilever from Budget Sensors (Sofia, Bulgaria; force
constant: 48 N/m, length: 225 µm). Polymers films electropolymerized onto QCM crystals
were mechanically removed over a 0.8×0.8 µm area by scanning the surface five consecutive
times in contact mode with 2 µN force at 4 µm/s. A 2.5×2.5 µm area centred around the
removed part was then scanned in tapping mode and depth profiles were taken across the
image. The polymer thickness was determined as the difference between the average heights
of segments corresponding to the polymer film and liberated gold surface.
3. Results and discussion
3.1. Non-specific binding of proteins on bare gold electrodes
It is generally accepted that globular proteins adsorb strongly at interfaces: a process which
can result in so-called “surface denaturation” by unfolding of the protein. For protein binding
to metal surfaces chemisorption via cysteine residues has been described (Scheller et al.,
Page 9
8
1976)(Hansen et al., 2003).
The influence of the non-specific binding of proteins to the electrode surface was investigated
by CV and SWV measurements in ferri/ferrocyanide containing solution and by SEIRAS.
These measurements are aimed at separating the contribution of the protein binding to the
MIP and the metal surface of the electrode for the template Trf, but also for ferritin, urease
and human serum albumin, which were further used for cross reactivity studies. The signal of
the redox marker ferricyanide after incubation of the bare gold electrodes in solutions
containing 7.7 µg/mL, 38.5 µg/mL or 77µg/mL of the respective protein are shown in Fig. S1.
Trf and the other proteins strongly suppress the redox marker signal. The result confirms the
validity of target pre-adsorption-based MIP preparation procedure (Fig. 1B) that assumes
surface-target binding as prerequisite of the following EP step for MIP formation. Urease
shows the most effective blocking of the gold surface (indicative of the strongest binding to
the gold, which is assumed to be due to its cysteine-rich domain (Takishima et al., 1988)),
followed in order by HSA, Trf and ferritin.
Because proteinase K was later used for removing the protein template from the MIP its effect
on the ferricyanide signal was also investigated. After incubating the bare electrode in a
solution containing the same concentration of proteinase K which was applied for template
removal the SWV peak was almost completely suppressed (Fig. S2).
SEIRA spectra taken during adsorption of Trf at the Au working electrode coated on Si-prism
displayed the characteristic Amide I and II bands of the surface-bound protein molecules (Fig.
S7). Steady state values of these absorptions were obtained after 40 to 60 minutes i.e. in the
same time frame found already with the redox marker. Treatment of the Trf-loaded
Au-electrode with proteinase K resulted in a considerable degree of protein desorption as
displayed in Fig. S6.
3.2. Preparation of MIPs and NIPs
Scopoletin was deposited from aqueous solution forming an electrically non-conducting and
hydrophilic film with a thickness ranging from 3 to 20 nm, depending on the monomer
concentration and the polymerization method (Dechtrirat et al., 2012)(Bosserdt et al., 2015).
In surface imprinting, the film thickness is crucial for effective template removal and
Page 10
9
rebinding. If the film thickness is considerably smaller than the diameter of the target protein
the polymer can only interact with a restricted part of the protein and the shape recognition is
expected to be less accurate. Conversely, if the film is too thick, the efficiency of protein
exchange will be decreased by contingent entrapment.
To investigate the influence of the polymer film thickness, MIPs and NIPs were prepared with
30, 50 or 100 EP cycles (30 c, 50 c or 100 c, respectively) from 0.5 mM scopoletin and 10 µM
Trf (weight ratio 1 : 8). For all the MIPs the ferri/ferrocyanide signal was completely
suppressed after EP showing that the redox marker was hindered to reach the electrode
surface. In contrast, NIPs prepared with 30 polymerization cycles exhibited a SWV-peak of
120 µA (7.6 mA/cm2) at 200 mV. This is most likely caused by the lower thickness of the NIP
as compared with the MIP due to the missing protein content (Bosserdt et al., 2015). However,
as the number of cycles was further increased the SWV-peak at 200 mV characteristic to the
redox marker gradually diminished (data not shown).
3.3. Template removal and rebinding
We investigated the template removal by enzymatic digestion with proteinase K. After
shaking the MIP-electrode in 100 μg/mL proteinase K for 4 h the diffusion of ferricyanide
was still largely suppressed, suggesting that protein fragments and/or proteinase K molecules
remained at the electrode surface. However, after further shaking in PBS overnight, the
CV-signal was increased dramatically, indicating that adsorbed proteins (Trf, its fragments
and proteinase K) were washed out from MIP film generating free recognition sites on the
electrode surface (Fig. 2).
Page 11
10
-0.2 0.0 0.2 0.4 0.6 0.8
-50
-40
-30
-20
-10
0
10
20
after second TR
after 10 μM Trf rebinding
after EP (30 c)
E (V)
I (μ
A)
after first TR
Fig. 2. CV of a MIP electrode (30 c) after EP, after first TR, after 10 μM Trf rebinding and
after second TR recorded in 10 mM ferricyanide in 100 mM KCl at a scan rate of 50 mV/s.
Repeating this procedure after target rebinding revealed excellent signal reversibility
suggesting that the MIP film is not affected by the template removal procedure. If the same
procedure was carried out without electropolymerization the SWV signal was still 70 - 90 %
smaller than with the bare electrode, this behaviour can largely result from the adsorption of
proteinase K. Given the strong adsorption of the Trf to the gold surface is reasonable to expect
that also in case of the MIP the template removal is incomplete.
MIPs prepared by 30, 50 or 100 EP cycles were compared in terms of template rebinding
performance. After template removal, SWV responses were recorded upon sequential
incubation for 1 h in different concentrations of Trf. For both MIPs (50 c and 100 c) the
relative SWV signal was decreased markedly at low concentrations and approached a steady
value at 2 µM indicating the saturation of the MIPs by the rebinding. However, the MIP
prepared with 30 cycles was not stable enough for repeated measurements. MIP (50 c)
exhibited a linear measuring range between 0.1 and 1 μM Trf whereas the range was 0.1 to 2
μM for MIP (100 c). From the Scatchard plot (Fig. 3 Inset) values for the dissociation
constant Kd of 0.50 μM (50 c) and 0.67 µM (100 c) were determined. The MIP prepared with
50 cycles has a higher sensitivity than MIP (100 c) and was therefore used for further
measurements.
Page 12
11
0 1 2 3 4 5
0
20
40
60
80
100
20 30 40 50 60 70 80 90
80
100
120
140
160
180
200
220
relative signal of redox marker (%)rela
tive s
ignal / T
rf c
oncentr
ation (
%/μ
M)
Trf (μM)
Re
lative
su
pp
ressio
n o
f th
e s
ign
al (%
)
Fig. 3. Concentration dependence for Trf rebinding to the MIP prepared with 50 cycles. Inset:
the Scatchard plot. The data evaluation resulted in a Kd of 0.50 μM.
Furthermore, MIPs were prepared on a SEIRA active gold electrode according to Fig. 1
method B with 15 EP cycles. This in situ technique allows the acquisition of IR spectra during
and/or after each step of the MIP preparation. Since the surface enhancement factor decays
with increasing distance d (1/d6) from the gold surface, this method is ideal for monitoring
events in very close proximity to the gold surface (about 8 nm) (Osawa, 2001). Fig. 4 shows
the absorbance spectra after each step of MIP preparation and removal (left panel). In order to
better visualize the relative changes of the IR spectra, the corresponding difference spectra
were also calculated between the steps (middle panel). In such way, protein absorption and
desorption processes can be qualitatively assessed via the Amide I and Amide II vibrational
bands (marked in blue). After 1 h of incubation with 1 µM Trf, the protein was clearly
absorbed onto the electrode (trace 02), while IR bands characteristic for the monomeric
scopoletin (Bhatt et al., 2011), were hardly detectable in this spectral range (trace 03),
presumably also due to orientation effects, with respect to the surface selection rules of
SEIRAS, only dipole moment changes occurring preferentially perpendicular to the surface
are enhanced and thus detectable (Osawa, 2001). The electrochemical treatment gave rise to
polymer specific bands (marked with asterisks, traces 04 to 06). However, no negative Amide
bands were detected in the difference spectra between these steps, indicating that no protein
loss takes place during EP. After addition of proteinase K a slight increase in the intensity of
the corresponding Amide bands was detectable due to absorption of the proteinase (trace 07).
Page 13
12
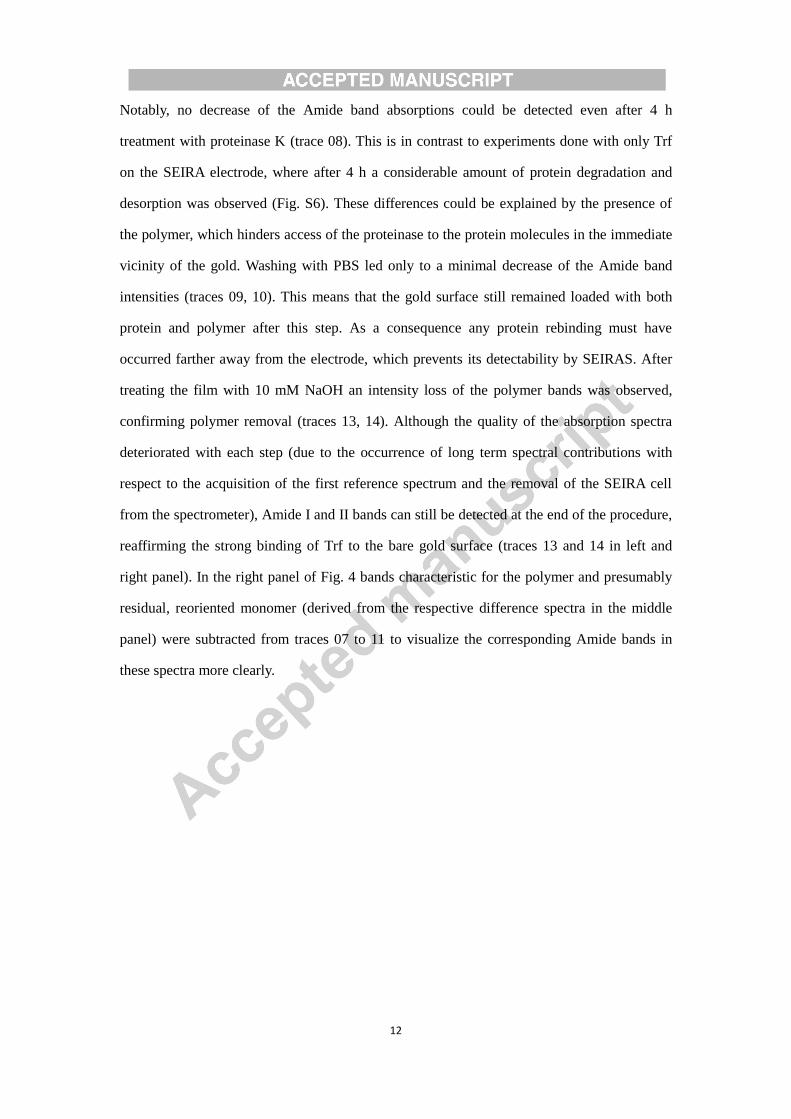
Notably, no decrease of the Amide band absorptions could be detected even after 4 h
treatment with proteinase K (trace 08). This is in contrast to experiments done with only Trf
on the SEIRA electrode, where after 4 h a considerable amount of protein degradation and
desorption was observed (Fig. S6). These differences could be explained by the presence of
the polymer, which hinders access of the proteinase to the protein molecules in the immediate
vicinity of the gold. Washing with PBS led only to a minimal decrease of the Amide band
intensities (traces 09, 10). This means that the gold surface still remained loaded with both
protein and polymer after this step. As a consequence any protein rebinding must have
occurred farther away from the electrode, which prevents its detectability by SEIRAS. After
treating the film with 10 mM NaOH an intensity loss of the polymer bands was observed,
confirming polymer removal (traces 13, 14). Although the quality of the absorption spectra
deteriorated with each step (due to the occurrence of long term spectral contributions with
respect to the acquisition of the first reference spectrum and the removal of the SEIRA cell
from the spectrometer), Amide I and II bands can still be detected at the end of the procedure,
reaffirming the strong binding of Trf to the bare gold surface (traces 13 and 14 in left and
right panel). In the right panel of Fig. 4 bands characteristic for the polymer and presumably
residual, reoriented monomer (derived from the respective difference spectra in the middle
panel) were subtracted from traces 07 to 11 to visualize the corresponding Amide bands in
these spectra more clearly.
Page 14
13
Fig. 4. Left: Absorbance spectra of the different steps of preparation and removal of a MIP on
a SEIRA active gold electrode (according to Fig. 1 method B). Amide I and II bands are
marked in blue, characteristic absorption bands for the polymer are indicated in spectrum 04
by asterisks. Middle: Difference Spectra between the individual steps. For each step, the
spectrum of the previous step was subtracted, thereby only relative spectral change are
displayed. Right: Bands characteristic for the polymer and presumably residual, reoriented
monomer (Hu et al., 2011) were subtracted from traces 07 to 11 to resolve the Amide I and II
bands better in the related spectral region.
3.4. Thickness of the MIP films
In order to measure the film thickness of the MIP films by AFM, these were prepared on
planar gold-coated quartz crystal resonators. The AFM measurements showed a thickness of
14 and 16 nm for MIPs prepared with 1 µM Trf and 10 µM Trf respectively. The thickness of
the template loaded MIP films is comparable with the largest diameter of the target Trf, i.e.,
13.6 nm (Wang et al., 2014). After template removal the average thickness was decreased
only by 1.5 - 2.8 nm, indicating that the polymer layer is resistant to the template removal
procedure (Fig. S5, Table S1).
Page 15
14
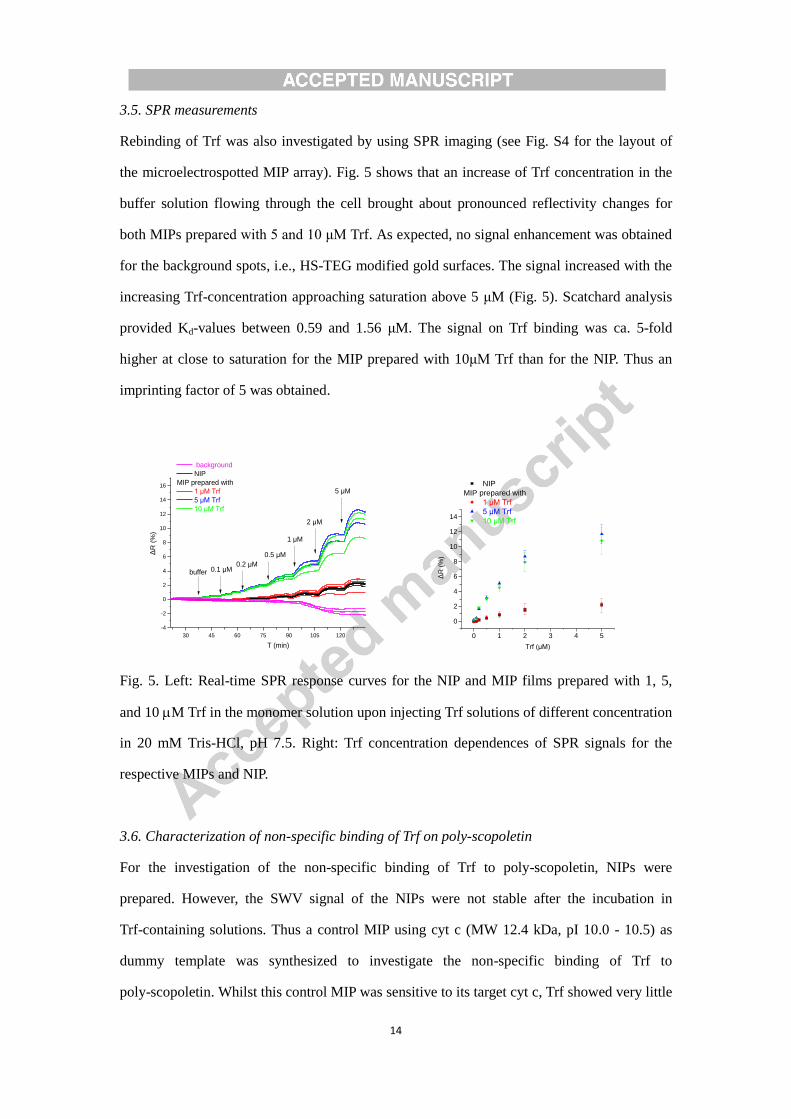
3.5. SPR measurements
Rebinding of Trf was also investigated by using SPR imaging (see Fig. S4 for the layout of
the microelectrospotted MIP array). Fig. 5 shows that an increase of Trf concentration in the
buffer solution flowing through the cell brought about pronounced reflectivity changes for
both MIPs prepared with 5 and 10 μM Trf. As expected, no signal enhancement was obtained
for the background spots, i.e., HS-TEG modified gold surfaces. The signal increased with the
increasing Trf-concentration approaching saturation above 5 μM (Fig. 5). Scatchard analysis
provided Kd-values between 0.59 and 1.56 μM. The signal on Trf binding was ca. 5-fold
higher at close to saturation for the MIP prepared with 10μM Trf than for the NIP. Thus an
imprinting factor of 5 was obtained.
30 45 60 75 90 105 120
-4
-2
0
2
4
6
8
10
12
14
16
background
NIP
MIP prepared with
1 μM Trf
5 μM Trf
10 μM Trf
5 μM
2 μM
1 μM
0.5 μM
0.2 μM0.1 μM
ΔR
(%
)
T (min)
buffer
0 1 2 3 4 5
0
2
4
6
8
10
12
14
ΔR
(%
)
NIP
MIP prepared with
1 μM Trf
5 μM Trf
10 μM Trf
Trf (μM)
Fig. 5. Left: Real-time SPR response curves for the NIP and MIP films prepared with 1, 5,
and 10 M Trf in the monomer solution upon injecting Trf solutions of different concentration
in 20 mM Tris-HCl, pH 7.5. Right: Trf concentration dependences of SPR signals for the
respective MIPs and NIP.
3.6. Characterization of non-specific binding of Trf on poly-scopoletin
For the investigation of the non-specific binding of Trf to poly-scopoletin, NIPs were
prepared. However, the SWV signal of the NIPs were not stable after the incubation in
Trf-containing solutions. Thus a control MIP using cyt c (MW 12.4 kDa, pI 10.0 - 10.5) as
dummy template was synthesized to investigate the non-specific binding of Trf to
poly-scopoletin. Whilst this control MIP was sensitive to its target cyt c, Trf showed very little
Page 16
15
binding, i.e., in the linear concentration range, 0.5 µM Trf showed only 18 % of the response
obtained for cyt c at the same concentration, indicating that the non-specific binding of Trf to
the polymer film is low. The value of non-specific binding is comparable to the imprinting
factor estimated from the SPR experiments.
3.7. Cross-reactivity
In order to test the specificity of the MIP the response to Trf was compared with that for
apo-Trf (iron-free Trf), HSA (MW 66.5 kDa, pI 4.7), ferritin (MW 440 kDa, pI 4.5) and
urease (MW 545 kDa, pI 5.0) at a protein concentration of 77 µg/mL. The main difference
between holo- and apo-Trf is that release of iron leads to a significant change in secondary
structure and an increase of diameter (Wally et al., 2006). The signal for apo-Trf is around 60 %
of the signal for the target holo-Trf (Fig. S3 Left). This lower binding of the larger apo-Trf
reflects the dominating role of the molecular geometry in the binding to the MIP because the
molecular weight is very similar for holo-Trf and apo-Trf.
In contrast, MIPs prepared after Trf pre-adsorption showed for both the target holo-Trf and
the iron-free apo-Trf a weaker binding than the MIPs from the scopoletin-Trf mixture and
almost equal signals for both holo- and apo-Trf (Fig. S3 Right). This behavior might be
explained by (partial) unfolding of the target proteins by the adsorption at the Au surface.
Electropolymerization around the adsorbed protein leads to larger binding cavities in the MIP
layer after template removal. These cavities should be more appropriate for the binding of the
larger apo-Trf than those of the MIP formed from the Trf-scopoletin mixture.
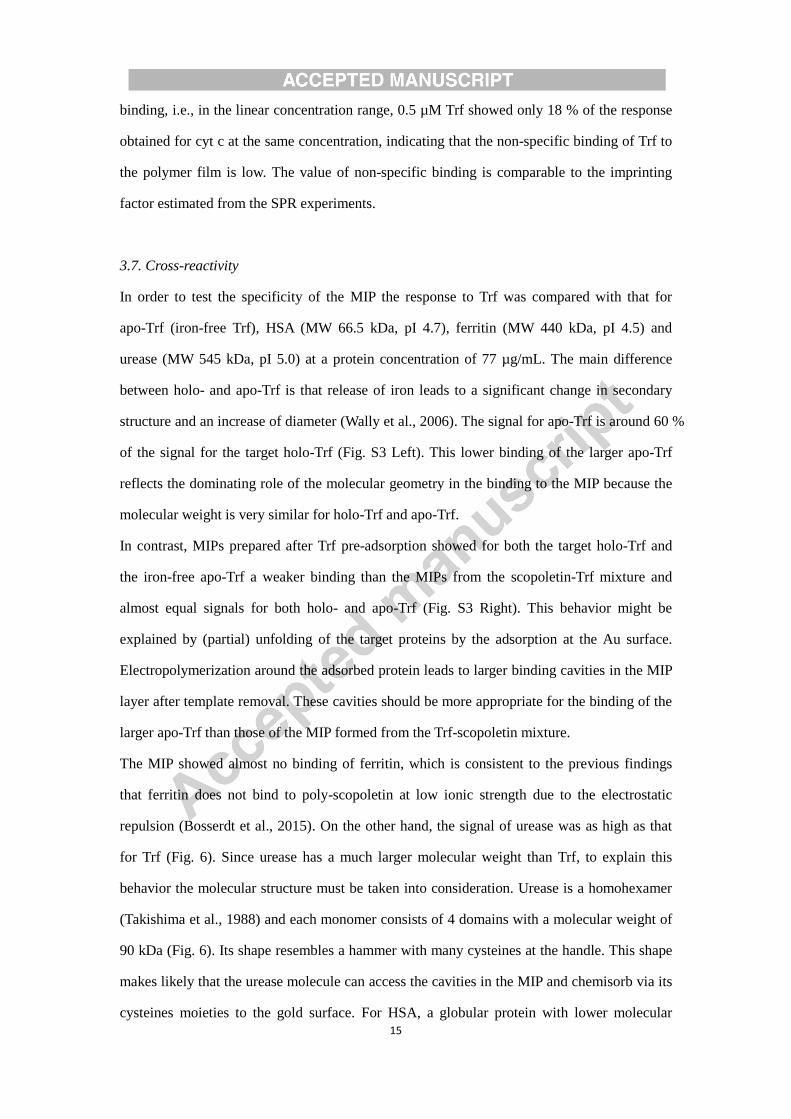
The MIP showed almost no binding of ferritin, which is consistent to the previous findings
that ferritin does not bind to poly-scopoletin at low ionic strength due to the electrostatic
repulsion (Bosserdt et al., 2015). On the other hand, the signal of urease was as high as that
for Trf (Fig. 6). Since urease has a much larger molecular weight than Trf, to explain this
behavior the molecular structure must be taken into consideration. Urease is a homohexamer
(Takishima et al., 1988) and each monomer consists of 4 domains with a molecular weight of
90 kDa (Fig. 6). Its shape resembles a hammer with many cysteines at the handle. This shape
makes likely that the urease molecule can access the cavities in the MIP and chemisorb via its
cysteines moieties to the gold surface. For HSA, a globular protein with lower molecular
Page 17
16
weight than Trf, the signal decrease was almost 50 % as compared with the target (Fig. 6).
Thus in addition to the size and shape also the interaction with the polymer influences the
binding to some degree.
Fig. 6. Relative responses of MIP (EP from monomer-protein mixture containing 10 µM Trf,
50 cycles) to the template holo-Trf (PDB code: 3V83) and to other analytes: Apo-Trf, HSA
(PDB code: 1E78), ferritin (PDB code: 3F32) and urease at 77 µg/mL in 20 mM Tris-HCl, pH
7.5. The cysteine-rich “handle” of urease monomer is shown (PDB code: 3LA4).
4. Conclusions
In this work, a scopoletin-based polymer film for Trf was synthesize by electropolymerization
of a mixture of Trf and scopoletin on a bare gold electrode or around pre-adsorbed transferrin
molecules. The ability of preparing MIPs with pre-adsorbed target protein molecules and the
ineffective template removal from both types of MIPs suggested that the interaction between
the protein and the underlying Au surface is involved in the target binding to the MIP.
The DET and the bioelectrocatalysis achieved by proteins at MIP-covered electrodes is in fact
hardly possible if the respective globular proteins would not approach the surface of the
protein-imprinted electrodes (Bosserdt et al., 2013)(Peng et al., 2016). In the present study the
Page 18
17
chemisorption via SH-groups explains the strong binding of urease to both the bare and the
MIP covered Au-electrode as well as the incomplete removal of Trf from both electrode types
as it is demonstrated by SEIRAS. These “permanently” adsorbed protein molecules make the
overlying polymer cavities “silent” for target rebinding. A clear consequence of this effect is
that the respective MIP nanofilms will have a lower apparent binding capacity and
pronounced cross reactivity for cysteine-rich proteins. For the presented Trf-MIP the linear
measuring range and the Kd for Trf obtained by SWV of a redox marker and SPR are in the
lower micromolar concentration range, i.e. comparable with scopoletin-based MIPs for cyt c
(Bosserdt et al., 2013), concanavalin A (Dechtrirat et al., 2014) and HTHP (Peng et al., 2016)
where a SAM prevents any direct binding to the Au-surface. Thus the binding sites in this
study seem not to be affected significantly by electrode-protein interaction (Table S2). It is
important to realize that even when the target interacts directly with the underlying substrate
(e.g. Au), the role of the MIP layer should not be underestimated as it can still provide shape
selective recognition. The aim of this study was to explore the role of the underlying substrate
in the protein template binding of electrosynthesized surface-imprinted polymers. In this
respect it should be noted that several papers on similar electrochemical MIP-based protein
sensors reported considerable lower limit of detections (LODs) and measuring ranges over
several orders of magnitudes (Table S3). However, the mechanism which leads to the
extremely low LODs and such wide dynamic range has not yet been elucidated on the basis of
a binding model based on typical affinities between protein and MIPs. We believe therefore
that the contribution of the underlying substrate of the surface imprinted protein-MIPs to the
observed protein binding should be carefully considered.
Acknowledgements
The authors would like to thank ERA-Chemistry (2014, 61133; OTKANN117637) for the
financial support. This work is a part of UniCat, the Cluster of Excellence (EXC 314)
coordinated by the Technical University of Berlin within the framework of the German
Excellence Initiative. RGy acknowledges additionally the support of the Lendület program of
the Hungarian Academy of Sciences (LP 2013 - 63).
Page 19
18
References
Bhatt, M.K., Dholwani, K.K., Saluja, A.K., 2011. J. Appl. Pharm. Sci. 1, 138–144.
Bosserdt, M., Erdőssy, J., Lautner, G., Witt, J., Köhler, K., Gajovic-Eichelmann, N., Yarman,
A., Wittstock, G., Scheller, F.W., Gyurcsányi, R.E., 2015. Biosens. Bioelectron. 73, 123–
129.
Bosserdt, M., Gajovic-Eichelman, N., Scheller, F.W., 2013. Anal. Bioanal. Chem. 405, 6437–
6444.
Dechtrirat, D., Gajovic-Eichelmann, N., Bier, F.F., Scheller, F.W., 2014. Adv. Funct. Mater. 24,
2233–2239.
Dechtrirat, D., Jetzschmann, K.J., Stöcklein, W.F.M., Scheller, F.W., Gajovic-Eichelmann, N.,
2012. Adv. Funct. Mater. 22, 5231–5237.
Gajovic-Eichelmann, N., Ehrentreich-Förster, E., Bier, F.F., 2003. Biosens. Bioelectron. 19,
417–422.
Ge, Y., Turner, A.P.F., 2008. Trends Biotechnol. 26, 218–224.
Glad, M., Norrlöw, O., Sellergren, B., Siegbahn, N., Mosbach, K., 1985. J. Chromatogr. A 347,
11–23.
Hansen, A.G., Boisen, A., Nielsen, J.U., Wackerbarth, H., Chorkendorff, I., Andersen, J.E.T.,
Zhang, J., Ulstrup, J., 2003. Langmuir 19, 3419–3427.
Hu, X.-R., He, J.-B., Wang, Y., Zhu, Y.-W., Tian, J.-J., 2011. Electrochim. Acta 56, 2919–
2925.
Jetzschmann, K.J., Jágerszki, G., Dechtrirat, D., Yarman, A., Gajovic-Eichelmann, N., Gilsing,
H.-D., Schulz, B., Gyurcsányi, R.E., Scheller, F.W., 2015. Adv. Funct. Mater. 25, 5178–
5183.
de Jong, G., van Dijk, J.P., van Eijk, H.G., 1990. Clin. Chim. Acta. 190, 1–46.
Li, L., Lu, Y., Bie, Z., Chen, H.-Y., Liu, Z., 2013. Angew. Chemie Int. Ed. 52, 7451–7454.
Li, Q., Yang, K., Liu, J., Zhang, L., Liang, Z., Zhang, Y., 2013. Microchim. Acta 180, 1379–
1386.
Lv, Y., Qin, Y., Svec, F., Tan, T., 2016. Biosens. Bioelectron. 80, 433–441.
Miyake, H., Ye, S., Osawa, M., 2002. Electrochem. commun. 4, 973–977.
Osawa, M., 2001. Surface-Enhanced Infrared Absorption, in: Near-Field Optics and Surface
Page 20
19
Plasmon Polaritons. Springer Berlin Heidelberg, Berlin, Heidelberg, pp. 163–187.
Peng, L., Yarman, A., Jetzschmann, K.J., Jeoung, J.-H., Schad, D., Dobbek, H., Wollenberger,
U., Scheller, F.W., 2016. Sensors 16, 272.
Scheller, F., Prümke, H.-J., Schmidt, H.E., Mohr, P., 1976. Bioelectrochemistry Bioenerg. 3,
328–337.
Takishima, K., Suga, T., Mamiya, G., 1988. Eur. J. Biochem. 175, 151–165.
Wally, J., Halbrooks, P.J., Vonrhein, C., Rould, M.A., Everse, S.J., Mason, A.B., Buchanan,
S.K., 2006. J. Biol. Chem. 281, 24934–24944.
Wang, S., Ye, J., Bie, Z., Liu, Z., 2014. Chem. Sci. 5, 1135–1140.
Welch, S., 1992. Transferrin: The Iron Carrier, 1st ed. CRC Press, Boca Raton.
Whitcombe, M.J., Chianella, I., Larcombe, L., Piletsky, S.A., Noble, J., Porter, R., Horgan, A.,
2011. Chem. Soc. Rev. 40, 1547–1571.
1. Surface-imprinted polyscopoletin MIPs were synthesized for Trf recognition
2. Strong protein adsorption on gold led to incomplete template removal
3. The underlying gold substrate was found to interact with the protein target
4. SEIRAS, SPR and SWV were used to reveal template-MIP interactions


![SupportingInformation FGr Proofs Changes Tracked ACT ACN › 68696 › 2 › nl6b00773_si_001.pdfPotassium ferricyanide (K 3 [Fe(CN) 6], 99.2%, Sigma-Aldrich) and potassium ferrocyanide](https://static.documents.pub/doc/80x56/60bd9152e2d7ae4a706fa268/supportinginformation-fgr-proofs-changes-tracked-act-acn-a-68696-a-2-a-nl6b00773si001pdf.jpg)


