This article was published in an Elsevier journal. The attached copy is furnished to the author for non-commercial research and education use, including for instruction at the author’s institution, sharing with colleagues and providing to institution administration. Other uses, including reproduction and distribution, or selling or licensing copies, or posting to personal, institutional or third party websites are prohibited. In most cases authors are permitted to post their version of the article (e.g. in Word or Tex form) to their personal website or institutional repository. Authors requiring further information regarding Elsevier’s archiving and manuscript policies are encouraged to visit: http://www.elsevier.com/copyright
Transcript
This article was published in an Elsevier journal. The attached copyis furnished to the author for non-commercial research and
education use, including for instruction at the author’s institution,sharing with colleagues and providing to institution administration.
Other uses, including reproduction and distribution, or selling orlicensing copies, or posting to personal, institutional or third party
websites are prohibited.
In most cases authors are permitted to post their version of thearticle (e.g. in Word or Tex form) to their personal website orinstitutional repository. Authors requiring further information
regarding Elsevier’s archiving and manuscript policies areencouraged to visit:
Paths to foreign markets: Does distance to marketaffect firm internationalisation?
Paul D. Ellis
Department of Management & Marketing, Hong Kong Polytechnic University, Hung Hom, Kowloon, Hong Kong
Received 20 January 2007; received in revised form 29 March 2007, 23 May 2007, 30 May 2007;
accepted 4 June 2007
Abstract
An idea widely shared among international business scholars, economists and geographers is that
geographic, cultural and psychic distance to market affects firm internationalisation in a number of ways.
However, evidence for this broad proposition remains inconclusive. This study provides a comprehensive
assessment of four separate hypotheses pertaining to the location of markets, the sequence of market
entry, the rate of international expansion, and the relationship between sequentially-linked markets. In
contrast with previous studies, the analysis is based on a large sample of non-repetitive foreign market
entries (n ¼ 1132) made by diverse exporters in dissimilar locations within a single country (China).
Market entry data thus exhibit substantial variation on the constructs of interest. The results reveal
virtually no support for three traditional hypotheses linking distance to market with the sequence of
markets entered and the rate of foreign expansion. This study challenges the long-held notion that there is
a simple link between distance and market entry sequence. However, this study provides arguably the
first demonstration of the ‘‘near-market effect’’ in the context of low-risk entry modes such as exporting.
Specifically, the results show that consecutive export locations tend to be culturally related suggesting that
exporters are able to transfer learning between similar markets.
r 2007 Elsevier Ltd. All rights reserved.
Keywords: Internationalisation; Foreign market entry; Geography; Psychic distance; China
1. Introduction
Firm internationalisation is the result of managerial decisions pertaining to the locationand control mechanisms of an organisation’s international production and marketing
ARTICLE IN PRESS
www.elsevier.com/locate/ibusrev
0969-5931/$ - see front matter r 2007 Elsevier Ltd. All rights reserved.
activities. This process has been scrutinised in research relating to the selection of foreignmarkets (Brewer, 2001; Davidson, 1983; Dow, 2000; Ellis & Pecotich, 2001), the modes ofcontrol used to enter those markets (Edwards & Buckley, 1998; Kogut & Singh, 1988), andthe timing of market entry (Mitra & Golder, 2002). Much of this extant work is decision-oriented; which market? how? and when? Consequently little is known about whether thecumulative outcomes of these choices describe broader patterns of decision-making. Inshort, do firms’ paths to foreign markets conform to predictable decision-makingtemplates? One possible answer is that expansion patterns are constrained by thecosts of overcoming distance to market, however defined (Benito & Gripsrud, 1992;Davidson, 1980; Ghemawat, 2001; Johanson & Wiedersheim-Paul, 1975; Linmao &Venables, 2001).At first glance the friction of distance seems out of place in this age of global markets
and cheap communications (Cairncross, 2001). But the evidence suggests otherwise. Basedon his extensive analysis of freight expenditures, Hummels (1999) reported that while airtransport prices have fallen dramatically in the post-war era, shipping costs have notdeclined. The link between distance, shipping costs and trade represents one of the moreprominent questions being addressed by economists, geographers and internationalbusiness researchers in recent years (Clark, Dollar, & Micco, 2004; Hummels, 1999;Linmao & Venables, 2001; Mellinger, Sachs, & Gallup, 2000). A typical conclusion fromthis body of work is the one returned by Linmao and Venables (2001). Drawing on theiranalysis of shipping costs from Baltimore, these authors calculated that a 10% increase intransport costs reduces trade volumes by 20%. A similar relationship is expressed inFrankel and Rose’s (2002) statistic that bilateral trade declines about 1% for everypercentage increase in the distance separating a pair of countries. Based on his own readingof Frankel and Rose’s data, Ghemawat (2001, p. 138) concluded, ‘‘The amount of tradethat takes place between countries 5000 miles apart is only 20% of the amount that wouldbe predicted to take place if the countries were 1000 miles apart.’’ These numbers supportthe idea that, ‘‘contrary to popular impression, the world is not getting dramaticallysmaller’’ (Leamer & Levinsohn, 1995, p. 1387), that ‘‘distance still matters’’ (Ghemawat,2001), and that the much-publicised ‘‘death of distance’’ (Cairncross, 2001) has beengreatly exaggerated.If the internationalisation process of the firm reflects a pattern of increasing distance to
market, empirical verification should be a relatively straightforward matter. Yet after some50 years of research few conclusions can be drawn. Geographic distance effects which areoften seen at the macro-level (e.g., Beckerman, 1956; Frankel & Rose, 2002; Leamer, 1974;Linmao & Venables, 2001), are rarely observed at the level of the firm (e.g., Czinkota &Ursic, 1987; Terpstra & Yu, 1988). Cultural and psychological distance effects measured inone country (e.g., Johanson & Wiedersheim-Paul, 1975), do not seem to operate in othercountries (e.g., Ellis, 2000), or even in the same country with a different sample of firms(e.g., Engwall & Wallenstal, 1988). Some of these inconsistencies may be attributed to themixing and matching of dissimilar entry modes. Effects observed in a sample of exporters(e.g., Dow, 2000) may not hold for higher risk expansion activities such as foreign directinvestment where cost savings stemming from internalisation or location advantages comeinto play (e.g., Benito & Gripsrud, 1992). In ventures involving substantial commitmentsof company resources, the marginally increasing costs associated with overcoming distanceto market may not be sufficient to tip the balance in favor of one investment location overanother.
ARTICLE IN PRESSP.D. Ellis / International Business Review 16 (2007) 573–593574
Author's personal copy
A bigger part of the problem may be empirical. In contrast with the well-documentedgravity model which explains trade between nations, at the level of the firm theaccumulated evidence relating to distance effects is highly fragmentary. Aside from a lackof consensus on matters of operationalisation (Combes & Lafourcade, 2005; Dow, 2000),empirical expansion patterns are often sought from samples containing very few firms orvery few market entries. Even when large numbers are involved, firm-level expansionpatterns may be insufficiently spread out to permit meaningful analysis. When two-thirdsof a sample of investors fails to make a second foreign investment, as was the case withBenito and Gripsrud’s (1992) study of Norwegian manufacturers, it is difficult to see howconclusions regarding dynamic patterns of expansion can be drawn.
The aim of this study is to redress some of these shortcomings by examining the effectsof distance on the internationalisation patterns of three diverse groups of Chineseexporters. This study’s contribution is primarily empirical as is warranted by the state ofcurrent research. To increase the chances of detecting distance effects, and to balance aresearch bias favouring relatively high-risk foreign investments, the scope of the study islimited to direct exporting, a low-risk entry mode involving production in the homemarket.
2. Distance to market as a barrier to trade
Firms export to foreign markets to exploit differences arising from geographically-bound comparative advantages (Heckscher, 1919/1949; Ricardo, 1817/1971), to pursue thegains of specialisation afforded by increasing the size of the market (Ethier, 1979; Young,1928), and to better position themselves against foreign and domestic rivals. Alternativemarket choices are evaluated in terms of their comparative rates of return and this impliessome consideration for the costs of expansion (Root, 1994). In the international tradeliterature, these costs have historically been framed in terms of the artificial barriers totrade created by government policy and the natural obstacles of overcoming distance toforeign markets (Hummels, 1999; Leamer, 1974). As such, the widespread reduction intariff barriers from their protectionist highs of the mid-twentieth century has increased therelative importance of transport costs in determining the pattern of world trade (Linmao &Venables, 2001). Clark et al. (2004) find that for many Latin American countries, transportcosts now constitute a greater barrier to US markets than import tariffs. One of the moresignificant factors affecting transport cost is the geographic distance separating exportersfrom importers (Leamer, 1974). For this reason distance-based proxies have been used in anumber of studies measuring transport costs (Clark et al., 2004; Combes & Lafourcade,2005).
In addition to the costs of transporting goods to market, exporters must also deal withthe costs of uncertainty. These costs tend to be greater for international neophytes (Ellis &Pecotich, 2001), in volatile markets (Wong & Ellis, 2002), and in settings where the transferof organisational routines involves tacit, non-codifiable knowledge (Kogut & Zander,1993; Scott & Storper, 2003). In the international business literature much of theuncertainty of foreign expansion has been described in terms of the learning costsassociated with entering culturally unfamiliar markets (Barkema, Bell, & Pennings, 1996;Benito & Gripsrud, 1992). The costs of dealing with differences in language and businesspractices create an economic incentive for firms to initially export to culturally similarmarkets (Davidson, 1983; Johanson & Vahlne, 1990). Hence, distance is defined here in
ARTICLE IN PRESSP.D. Ellis / International Business Review 16 (2007) 573–593 575
Author's personal copy
cultural, or psychic, terms (Benito & Gripsrud, 1992; Dow, 2000; Edwards & Buckley,1998; Johanson & Wiedersheim-Paul, 1975; Mitra & Golder, 2002).The costs of overcoming distance are the costs of moving goods to foreign markets plus
the costs of learning about those markets. The manner in which these costs shape tradepatterns has been the subject of two separate streams of research considered here under thelabels of ‘‘geographic’’ and ‘‘cultural/psychic distance.’’
2.1. Geographic distance
Geography affects trade via the imposition of transport costs incurred in deliveringgoods to distant markets and via the depreciation costs of goods in transit (Clark et al.,2004; Leamer, 1974; Linmao & Venables, 2001). These costs have been quantified byHummels (2001) who estimates that every additional day of ocean transit reduces theprobability of trade between two countries by 1.5% for manufactured goods. The negativecorrelation between trade volumes and the distance separating trading partners can betraced back to Beckerman’s (1956) study of intra-European trade. Since then severalstudies have affirmed the hypothesis that geography is a barrier to trade between nations(e.g., Frankel & Rose, 2002; Hummels, 2001; Leamer, 1974; Linmao & Venables, 2001;Linnemann, 1966). But at the level of the individual firm the effects of geography are lessclear. Terpstra and Yu (1988) found no evidence that geography affected the expansionactivities of US advertising agencies. Neither were Czinkota and Ursic (1987) able toestablish a link between the expansion activities of small and medium-sized USmanufacturers and the physical distance separating them from their foreign markets.However, Davidson (1980) observed a tendency of US multinationals to enter markets thatwere both geographically proximate and culturally similar. In a more recent study, Dow(2000) reported that geographic distance was negatively correlated with the early marketselections of a sample of Australian exporters.
2.2. Cultural/psychic distance
In contrast with their economist-counterparts, business scholars have generallymeasured distance in terms of culture rather than kilometers (Barkema et al., 1996;Benito & Gripsrud, 1992; Dow, 2000; Mitra & Golder, 2002). Work in this tradition can betraced back to early studies done in Scandinavia investigating the trade-constrainingaspects of psychic or cultural distance (Engwall & Wallenstal, 1988; Johanson & Vahlne,1977; Johanson & Wiedersheim-Paul, 1975). Psychic distance is created by ‘‘factorspreventing or disturbing flows of information between firm and market’’ (Johanson &Wiedersheim-Paul, 1975, p. 308). (Psychic distance results from factors affecting the flowof information to the individual whereas cultural distance results from factors affecting theflow of information to the group or country (Sousa & Bradley, 2006). For the sake ofexpository convenience, the two terms will be used interchangeably here.)The greater the psychic distance to a market, the greater the uncertainty and learning
costs associated with entering that market. Psychic distance-based moves accounted forabout 50% of the agency and subsidiary establishments of four Swedish multinationalsrecorded by Johanson and Wiedersheim-Paul (1975). In the case of these firms earlyexpansion activities were largely confined to neighbouring Scandinavian markets of
ARTICLE IN PRESSP.D. Ellis / International Business Review 16 (2007) 573–593576
Author's personal copy
Denmark, Norway and Finland. Only later did these firms move into Western Europeanmarkets and beyond.
Johanson and Wiedersheim-Paul’s (1975) intuitive conclusion—that firm internationa-lisation conforms to a pattern of increasing psychic distance to market—provided thestimulus for a number of follow-up studies many of which have failed to support theoriginal hypothesis. No evidence was found linking cultural distance with the expansionactivities of three Swedish banks (Engwall and Wallenstal (1988), 93 Norwegian companies(Benito & Gripsrud, 1992), nor 19 consumer products firms (Mitra & Golder, 2002).However, in their study of 225 investments made by 13 Dutch firms, Barkema et al. (1996)found that the number of foreign expansions made by a firm was positively correlated withcultural distance, suggesting that market entries are initially made closer to home.
In most of the studies just mentioned cultural distance was operationalised using datataken from Hofstede’s (1980) values survey of IBM employees (Barkema et al., 1996;Benito & Gripsrud, 1992; Mitra & Golder, 2002). This suggests that the results obtainedpertaining to expansion patterns may be undermined by the shortcomings inherent inHofstede’s original conceptualisation and measurement of cultural distance. Theselimitations include the assumptions that cultural distance is stable over time, uniformwithin countries, and symmetrical between countries (Shenkar, 2001). Comparativecountry rankings, such as those performed by Nordstrom and Vahlne (1994), suggest thatassessments of cultural and psychic distance are measuring different things. Based onsubjective ratings provided by 118 Swedish managers, these authors showed that countriesjudged as being culturally close using Hofstede’s metric, were relatively distant when ratedin psychic terms (e.g., the Netherlands dropped from third to eighth place) and vice versa(e.g., Germany rose from twelfth to fifth spot). This observation prompted Nordstrom andVahlne (1994) to redefine psychic distance as the difference between distance-creatingfactors (such as culture and language) and distance-bridging factors (such as internationaltravel).
Taking his cue from Nordstrom (1991), Dow (2000) measured psychic distance byasking a panel of Australian trade commissioners to provide distance estimates for a list of25 export markets. The combined ratings of eight judges were then used in a regressionmodel explaining the frequency with which a given country was among the first fivemarkets entered by a sample of 315 Australian exporters. This model showed that psychicdistance is significantly and negatively correlated with the early market choices. Incontrast, a cultural distance measure based on Hofstede (1980) was found to be acomparatively poor predictor of foreign expansion.
2.3. Distance to market and foreign expansion
In summary, a core proposition underlying much of the research investigating firminternationalisation is that entry into new markets will describe a pattern of successivelybroader steps (Benito & Gripsrud, 1992; Dow, 2000; Engwall & Wallenstal, 1988;Johanson & Wiedersheim-Paul, 1975; Terpstra & Yu, 1988). Initial moves made during theearly and most uncertain stages of internationalisation will tend to be cautious andproximate. As the firm acquires experience more ambitious entries, further afield, will beundertaken. Distance to market has been defined in both spatial and cultural/psychicterms. Yet, and despite decades of work, definitive conclusions on all points are lacking.For every study that finds a result another fails to. Several reasons have been advanced to
ARTICLE IN PRESSP.D. Ellis / International Business Review 16 (2007) 573–593 577
Author's personal copy
explain this state of affairs. Some scholars point to the inconsistent measurement andtesting of distance measures (Dow, 2000). Others attribute the mixed results to unmeasuredeffects of external initiators and the implicit assumption that gaps between buyers andsellers are equidistant (Ellis, 2000, 2006). Still others argue that psychic distance researchhas benefited from the repeated use of Scandinavian companies with the implication thatconditions in this part of the world are idiosyncratic and not generalisable (Sullivan &Bauerschmidt, 1990).1 These concerns define the criteria for which future work on thistopic must be judged.
3. Foreign expansion hypotheses
The proposition that international expansion of the firm will be influenced by the costsassociated with overcoming distance to market leads to four testable predictions pertainingto (i) the location of early markets, (ii) the sequence of the firm’s entry into subsequentmarkets, (iii) the rate of international expansion and (iv) the gaps between sequential pairsof market entries. These predictions, which are not mutually exclusive but capture themain conceptual approaches undertaken by past work, are presented in hypothesis form inTable 1.Much of the existing work investigating international expansion patterns is encapsulated
in the first two hypotheses listed in Table 1. Each has been tested using a mix of geographicand cultural/psychic distance data (Benito & Gripsrud, 1992; Czinkota & Ursic, 1987;Dow, 2000; Engwall & Wallenstal, 1988; Johanson & Wiedersheim-Paul, 1975; Terpstra &Yu, 1988). The mixed results returned by these studies justify the inclusion and retesting ofH1 and H2 here. In contrast with the export-heavy emphasis in the international tradeliterature, most of these firm-level studies have examined patterns of foreign directinvestment. This hints at an opportunity to see whether distance effects observed at themacro-level are evident in the trading decisions made by individual managers.The third and fourth hypotheses have received comparatively little attention in the
literature and require some elaboration. In the Scandinavian view of firm internationalisa-tion, foreign market entry (FME) decisions are shaped by managers’ experientialknowledge, hence the tendency to enter neighbouring countries before expanding outwards(Johanson & Vahlne, 1977, 1990). One testable implication arising from this view is thattentative steps will be followed by more aggressive moves as managers gain experienceoperating in diverse markets, as predicted in H3. A contrary prediction was made byBenito and Gripsrud (1992) who speculated that the expansion rate, or cultural distance tonew investment locations, would diminish with experience. But these authors did notprovide any rationale for why this should happen and their own results were inconclusiveon this point.However, Benito and Gripsrud (1992) did find that the distance between two consecutive
investment locations was highly correlated. This observation supported their conjecturethat the experience gleaned in one market reduces the uncertainty attached to entering
ARTICLE IN PRESS
1Psychic distance effects might be more readily observed in the expansion patterns of Scandinavian firms given
that successive cultural boundaries (Sweden, Scandinavia, Western Europe) coincidentally describe a pattern of
increasing geographic distance. The implicit question is whether Johanson and Wiedersheim-Paul (1975) would
have reached the same conclusions if their four case studies had involved Mexican or Singaporean firms, rather
than Swedish firms.
P.D. Ellis / International Business Review 16 (2007) 573–593578
Author's personal copy
other, similar markets, even if those markets are far from home. This ‘‘near-market’’ effectwas subsequently verified by Barkema et al. (1996) and Mitra and Golder (2002). Barkemaet al. (1996) investigated the pattern of new foreign ventures made within and betweencultural blocks of similar countries and found that firms benefit more from previousexpansions made in other countries within the same block than expansions made acrosscultural blocks. The rationale offered to explain this behaviour was that ‘‘learning effectsare stronger if the cultural context of the new venture resembles more closely the culturewhere the firm expanded previously’’ (Barkema et al., 1996, p. 155). Mitra and Golder(2002) also found that near-market knowledge was a stronger factor influencing theprobability of a new market entry than cultural distance from the home market. Mitra andGolder defined near-market knowledge as ‘‘a firm’s understanding of the culture ofpotential new markets based on knowledge generated from operating in similar markets’’(p. 354).
To summarise, the near-market effect has been demonstrated in three studiesinvestigating the selection of investment locations by Dutch, Norwegian and othermultinational firms (Barkema et al., 1996; Benito & Gripsrud, 1992; Mitra & Golder,2002). These studies highlight the cost-minimising role of knowledge gleaned by amultinational’s subsidiaries in foreign markets on the firm’s subsequent entry into other,culturally similar markets (Mitra & Golder, 2002). However, all three of these studiesfocused on foreign direct investment and measured distance solely in terms of culture.
ARTICLE IN PRESS
Table 1
Internationalisation hypotheses and past findings
Hypothesis Relevant studies and distance measure (with
investment (including equity joint ventures), NS ¼ not supported, MS ¼ mixed support.
P.D. Ellis / International Business Review 16 (2007) 573–593 579
Author's personal copy
No study has yet examined whether the near-market effect can be captured with otherdistance measures and whether it applies to lower-risk entry modes such as exporting.
4. Recording internationalisation patterns: methodology and data
The internationalisation process of the firm has been extensively researched in matureWestern economies such as Scandinavia (Benito & Gripsrud, 1992; Engwall & Wallenstal,1988; Johanson & Wiedersheim-Paul, 1975), Western Europe (Barkema et al., 1996;Sullivan & Bauerschmidt, 1990), North America (Czinkota & Ursic, 1987; O’Grady &Lane, 1996; Terpstra & Yu, 1988) and Australia (Dow, 2000; Ellis & Pecotich, 2001). Thishas resulted in a body of work that under-represents those fast-emerging nations which areleading the world in developing international trade. China is the most notable example ofthis group with export growth rates averaging above 25% annually from 2000–2005. Overthe same period exports as a proportion of national GDP grew from 23% to 34% whileChina’s share of world trade increased from 3.9% to 7.3% (China Statistical Yearbook,2006; World Trade Organization, 2006). In the league of exporting nations China rankedthird in 2005, behind Germany and the United States and ahead of Japan and France.Much of China’s trade exited the country via Hong Kong on the south coast ofGuangdong Province. Although Hong Kong enjoys a high level of political and economyautonomy, its trading position is inextricably entwined with its Chinese hinterland.Consequently, we define the boundaries of the study as mainland China plus Hong Kong.
4.1. Sampling and data collection
The sampling aim of this study was to identify a diverse group of exporters evidencinghigh variation on a number of dimensions including trading experience, the number andvariety of foreign markets entered and languages spoken. An additional aim was to ruleout in advance extraneous sources of influence relating to specific research settings. Theseaims were met by collecting internationalisation data from firms in three Chinese cities;Hong Kong, Shanghai and Xi’an. Economically these cities have little in common. HongKong prospered under Britain’s former colonial administration and has been labelled theworld’s freest economy (Heritage Foundation, 2006). With a nominal GDP per capita ofUS$25,622 in 2005, equivalent to US$36,800 in purchasing power terms, Hong Kong isAsia’s wealthiest society after differences in the cost of living have been taken into account(China Statistical Yearbook, 2006; NationMaster.com, 2006). Situated in the rapidlyindustrialising Yangtze Delta region, Shanghai’s economic ascendancy has seen the citycement its reputation as the pro-business capital of China’s eastern seaboard. Shanghai’snominal GDP per capita of RMB51,474 (equivalent to US$62832) makes it one of the mostprosperous cities in China (China Statistical Yearbook, 2006). In contrast, the city ofXi’an, which is located in central Shaanxi Province, ranks among the second tier of China’sindustrial cities with a per capita GDP of only RMB17,141 (or US$2092) (China StatisticalYearbook, 2005). Lacking easy access to a river- or sea-port Xi’an’s exporters facesignificant impediments to trade. In contrast with Shanghai and Hong Kong where exports
ARTICLE IN PRESS
2Currency conversions were based on the official exchange rates for 2005 listed in the China Statistical
Yearbook (2006, p. 734): USD1 ¼ RMB8.19.
P.D. Ellis / International Business Review 16 (2007) 573–593580
Author's personal copy
per person were worth US$6670 and US$41,592 respectively in 2005, the comparablefigure for Shaanxi Province was just US$827 (China Statistical Yearbook, 2006).
At all three locations—Hong Kong, Shanghai, and Xi’an—data were collected viapersonal interviews with top managers of indigenous manufacturer-exporters. During theinterviews managers were asked to list all their foreign markets and then provide detailedinformation about their firm’s entry into each market (dates of entry, control modes used,key initiators, share of income from each market, etc.). A standard questionnaire was usedat each location. Traditional Chinese and simplified Chinese versions of the questionnairewere back-translated and then pre-tested on three to five managers at each city. Owing tothe descriptive emphasis on the collection of non-sensitive historical data, the only changesrequired after pre-testing were cosmetic.
In Hong Kong, interviews were conducted in Cantonese with the managers of 42manufacturers randomly selected from the Directory of Hong Kong Industries and a Hong
Kong Toy and Games Fair Catalogue. These firms employed on average 39 staff in HongKong and an additional 1327 workers in factories across the border in neighbouringGuangdong Province. In Shanghai and Xi’an, interviews were conducted in Mandarinwith 215 and 101 manufacturers (in various light industries) respectively. The mainlandfirms employed on average 1215 workers, had been in business for an average of 14.4 years,and exported around a third of their total output. In contrast, their Hong Kongcounterparts were older (25.0 years on average) and much more internationalised earning98% of their income from exports.
In the two mainland Chinese cities data collection was conducted by local interviewersoperating out of the Shanghai University of Finance and Economics and Xi’an JiatongUniversity. In both cities the interviewers were personally trained by the author and thensupervised by local colleagues at each university. Incoming questionnaires were reviewedby the field supervisors and then mailed to the author every two weeks. The questionnaireswere then checked again by two independent Chinese research assistants unaffiliated witheither of the interviewing teams in China. These Mandarin-speaking assistants also maderandom phone-calls to more than 70% of the interviewees to verify the collection of data.This follow-up procedure revealed one instance of interviewer-opportunism in Shanghaiand all questionnaires completed by this person were discarded.
For the purposes of analysing expansion patterns across markets, FMEs were countedas discrete events. Where firms had made multiple entries into the same foreign market,only the first entry was counted. Subsequent entries into existing markets will be made withless uncertainty than initial entries into new markets. Distance effects, which include thecosts of overcoming uncertainty, will therefore be stronger for initial entries. The decisionto restrict the sample to non-repetitive FMEs represents a significant departure from thepast practice of treating new and repeated market entries indiscriminately (Barkema et al.,1996; Child et al., 2002; Engwall & Wallenstal, 1988).
At the close of data collection, full descriptive details had been recorded for 313, 828 and333 FMEs made by exporters in Hong Kong, Shanghai and Xi’an respectively. However,293 of the observed FMEs involved indirect exporting which describes the outsourcing offoreign marketing activities to a domestic trade intermediary. As few international businessscholars consider indirect exporting to be anything more than ‘‘exporting by proxy’’, littledifferent from other domestic sales, these FMEs were excluded from the final database.In addition, a small number of FMEs were based on entry modes other than exporting.As the aim of the study was to investigate low-risk entry modes involving production
ARTICLE IN PRESSP.D. Ellis / International Business Review 16 (2007) 573–593 581
Author's personal copy
within the home market, these were also removed from the database. A total of 1132FMEs involving direct exports to around 70 markets were retained for analysis.
4.2. Measurement
Distance to market was operationalised in geographic, cultural and psychic terms.Geographic distance was defined as the shipping distance in nautical miles betweenShanghai and Hong Kong and the closest port in each foreign market. (Exporters fromXi’an were presumed to ship via Shanghai.) Previous studies measuring geographicdistance have relied on great circle measurements (Terpstra & Yu, 1988). However, asshipping routes seldom follow the shortest line between two ports, actual shipping distanceis a more accurate reflection of the costs of trade (Combes & Lafourcade, 2005). Distancedata came from shipping tables maintained by Maritimechain.com (2005).Following conventional practice, cultural distance was calculated using Kogut and
Singh’s (1988) index with data drawn from Hofstede (2001). Specifically, distance scoresfor each foreign market were calculated by combining the deviation between the foreignand home markets over each of four cultural dimensions after factoring in the varianceobserved on each dimension. Although Hofstede’s work is not without its critics(Drogendijk & Slangen, 2006; Shenkar, 2001), few other cultural theories have beensubjected to similarly widespread levels of testing (Nakata & Sivakumar, 2001). Thenumber of replication studies based on Hofstede’s original work is sufficiently great that anAppendix A for the second edition of his book contains entries for 66 different nations.Psychic distance was measured following Dow’s (2000) method with informants in Hong
Kong (n ¼ 54) and mainland China (n ¼ 14) being asked to rate the psychic distance to 42and 55 foreign markets respectively. Following the approach originally devised byNordstrom (1991), managers at both locations were asked to rate a list of foreign marketson a scale from one to 100 with their home market anchored on one. Prior to making theseratings informants were given two Chinese-language definitions of psychic distance takenfrom Johanson and Wiedersheim-Paul (1975) and O’Grady and Lane (1996). Individualcountry ratings were then aggregated and checked for consistency. In the mainlanddataset, four data points (out of 770) were subsequently identified as being outliers (definedhere as being more than 2.5 standard deviations from the mean score for each country) andthese were dropped from the analysis. Three outliers were removed from the Hong Kongsample for similar reasons. Cultural and psychic distance scores for selected countries arepresented for both Hong Kong and China in the Appendix A.3
The dependent variable, entry sequence, was operationalised on the basis of entry dates(year of entry) provided by informants. One shortcoming of this approach becameapparent only during the analysis stage when it was realised that multiple entries within asingle year can make it difficult to untangle the sequence of entry-events. To remedy thissituation, entries reported as occurring within the same year were separated on the basis ofthe proportion of sales going to each market. Markets generating more sales for the firm
ARTICLE IN PRESS
3I am indebted to my graduate student Wong Hui Kan who collected the Hong Kong psychic distance data.
Not surprisingly, cultural distance was significantly correlated with psychic distance for both the Hong Kong
(r ¼ .31, po.05) and mainland China (r ¼ .45, po.01) samples. Yet as can be seen from the Appendix, there are
several examples of countries being ranked relatively high on one index but low on the other (e.g., USA, Pakistan,
New Zealand). Distance scores were also comparable across the two groups of respondents with strong
correlations observed for both cultural (r ¼ .86, po.01) and psychic distance (r ¼ .97, po.01).
P.D. Ellis / International Business Review 16 (2007) 573–593582
Author's personal copy
were deemed to have been entered earlier.4 However, no discrimination was applied tosame-year FMEs resulting from attendance at trade fairs. Given that a firm might generatemultiple leads at a single trade fair, it was assumed that FMEs arising immediately after atrade fair could legitimately be considered simultaneous entries. After making theseadjustments, the mean (and maximum) number of entries for exporters from each studylocation are as follows: Xi’an, 2.95 entries (8); Shanghai, 3.15 entries (9); and Hong Kong,4.10 entries (8).
5. Results
FMEs occur as a result of deliberate actions undertaken by exporters, importers, andmutually-related third parties (e.g., brokers, traders, commission agents, etc.). FMEs mayalso arise serendipitously and as a consequence of chance meetings between potentialexchange partners, such as may happen at an international trade fair (Ellis, 2000; Meyer &Skak, 2002). During the interviews managers were asked to identify the initiation scenariounderlying each FME with five response options offering; (1) we approached them(exporter-initiated), (2) they contacted us (outsider -initiated), (3) we were introduced by amutual associate/acquaintance (outsider-initiated), (4) we met at a trade fair/exhibition(trade fair-initiated) and (5) don’t remember. In Xi’an and Shanghai, trade-fair initiatedFMEs dominated the entry choices accounting for 45% and 39% of each samplerespectively. In Hong Kong, FMEs were more likely to arise as a result of approachesmade by outside parties (60%). Consistent with previous research (Brewer, 2001; Ellis,2000), exporter initiations were found to play a relatively minor role in explaining theexpansion patterns of firms from Xi’an (19% of FMEs), Shanghai (19%), and Hong Kong(10%). Given that our hypotheses are predicated on assumptions pertaining to exporters’experience, and that no predictions are made regarding the experience of outsiders (e.g.,buyers and third parties), the following hypothesis tests were done twice; once for theentire database of FMEs at each location, and then again for those FMEs arising solelyfrom the exporters’ own initiative.
Prior to testing the hypotheses, the mean distance scores for different FMEs were examinedfor each sample. Table 2 reveals two instances where the dispersion of FMEs conforms to thepredicted pattern of increasing distance. (In the Table, the fourth and subsequent FMEs havebeen collapsed into a single category.) In Xi’an, successive entries returned higher psychicdistance means; in Shanghai the same pattern was evident for geographic distance. In themajority of cases the distance means for later FMEs are further than those for first entrieshinting at a possible relationship between distance and expansion sequence.
Across the combined database there were 504 instances of a first (or equal-first) FMEand 628 instances of subsequent entries. To test the hypothesis that early markets tend tobe closer to home, the mean distance scores for the first markets entered were comparedwith the scores for all subsequent FMEs using one-tailed t-tests. The results, shown inTable 3, reveal statistically significant differences in the hypothesised direction wereobserved for geographic distance in the Shanghai sample only. Shanghainese exporters
ARTICLE IN PRESS
4An examination of the uncorrected sequence data revealed that earlier FMEs account for a greater share of a
firm’s income (35 percent) compared to later FMEs (18 percent; t ¼ 12.762, po.000). That is, entry sequence and
export proportion are correlated (r ¼ �.344, po.001) indicating that the longer a firm is in a market, the more
time it has to develop sales. The raw (uncorrected) and corrected entry sequences were highly correlated (r ¼ .83).
P.D. Ellis / International Business Review 16 (2007) 573–593 583
Author's personal copy
typically began their foreign expansion in geographically proximate markets. However,contrary to expectations, Shanghainese exporters were found to begin with a culturally-distant market before entering markets more similar to home. No statistically significantdistance differences were observed between early and subsequent market entries in Xi’anor Hong Kong. To assess the practical significance of the statistically significant results, t
statistics along with their relevant degrees of freedom were used to calculate effect sizesfollowing Cohen’s (1988) conventions.5 Neither of the two statistically significant results
ARTICLE IN PRESS
Table 3
Comparing early and subsequent foreign market entries
Notes: GD ¼ geographic distance (‘000NM), CD ¼ cultural distance, PD ¼ psychic distance.
5Effect sizes for the t tests were calculated using the following equation: d ¼ 2t/O(df). Effect size cut-offs for
Cohen’s d are; .20 (small), .50 (medium) and .80 (large). Cut-offs for the product moment correlation r (relevant to
the interpretation of H2–H4) are; .10 (small), .30 (medium) and .50 (large) (Cohen 1988, pp. 25–26, 82).
P.D. Ellis / International Business Review 16 (2007) 573–593584
Author's personal copy
for the ‘‘all FMEs’’ group, was big enough to register even as a small effect. However, tworesults that were just outside of the bounds of statistical significance (cultural and psychicdistance in the full Hong Kong sample) did meet the cut-off point for a small effect. Thus,the possibility that a true effect exists in this group but was undetected due to the small sizeof the Hong Kong sample cannot be ruled out. However, in terms of testing the predictionthat exporters make early FMEs closer to home, the restricted sample of exporter-initiatedFMEs provides a firmer basis for drawing conclusions about exporter behaviour.Removed from the analysis is the confounding influence of outsiders with experience levelsthat differ from exporters. An examination of the results obtained for the exporter-initiated FMEs revealed that none conformed to the predicted pattern of expansion.Collectively these results constitute weak to no support for H1.
Hypotheses 2 and 3 relate to overall expansion patterns. To test the link betweendistance to market and entry sequence, correlations were calculated for each group ofexporters. The results are shown in Table 4. On the left side of the table are correlationspertaining to H2. Only one of these conforms to the predicted pattern of expansion:geographic distance is correlated with entry sequence in the full Shanghai sample. Inpractical terms this result constitutes a small effect according to Cohen’s (1988) criteria forgauging effect size. However, none of the results obtained for the restricted exporter-initiated sample of FMEs matched the prediction of increasing distance to market. (Thestatistically significant result for cultural distance in Shanghai was in the wrong direction.)On the right side of the table are correlations pertaining to H3. These correlations measure
Notes: Correlations below the diagonal are for all FMEs; exporter-initiated FME correlations are above the
diagonal. G/C/PD ¼ geographic/cultural/psychic distance. ‘‘Gap’’ refers to the distance separating FMEn and
FMEn�1.apo.05.bpo.01.cpo.001 (2-tailed tests).
P.D. Ellis / International Business Review 16 (2007) 573–593 585
Author's personal copy
the strength of association between entry sequence and the distance separating consecutivemarket entries. None of the correlations relevant to this hypothesis are statisticallysignificant.The correlational, ANOVA and between-group tests conducted so far are useful for
examining the location of all FMEs taking place at particular points in the sequence ofinternational expansion. A better test of H2 and H3 is one that examines the location ofFME n in relationship to the location of FME n�1 for each company. If internationalexpansion patterns are characterised by increasing distance from the home market, thedistance to FME n should exceed the distance to FME n�1 for individual companies. Atest designed specifically for this purpose was devised by Benito and Gripsrud (1992) intheir search for patterns underlying foreign direct investment decisions of Norwegianmanufacturers. Their regression model is adapted here:
Dist:n �Dist:n�1 ¼ aþ b FMEn,
where Dist.n is the distance to the location of FME number n for a given company; Dist.n�1the distance to the location of FME number n�1 for a given company; FMEn is the FMEnumber n for a given company; and a,b are the intercept and slope.Following this procedure a total of 18 regression equations were estimated for all the
FMEs preceded by another FME (three exporter groups� three distance measures� twoinitiation scenarios). Support for the underlying predictions was ascertained by examiningthe coefficients of each model. A positive and statistically significant constant (a) in amodel would constitute support for H2 whereas a positive slope (b) would support H3. In12 out of 18 equations, the sign of the intercept was positive, as predicted, but none ofthese cases was statistically significant. These results provide no support for either H2 orH3.Finally, Benito and Gripsrud (1992) proposed that even in the absence of sequential
expansion patterns based on increasing distance to market, FME choices may be made inthe neighbourhood of past choices allowing managers to transfer experience from onedecision to another. That is, managers may be inclined to enter new markets that areculturally or psychically similar to existing markets, as predicted in H4. If so, then thedistance to a new foreign market will be correlated with the distance to the marketpreviously entered by the same company. This was found to be the case for ten (out of 18)combinations of distance, sample and initiation type. These correlational results prompteda more rigorous regression-based analysis using the following equation adapted fromBenito and Gripsrud (1992):
Dist:n ¼ aþ b Dist:n�1
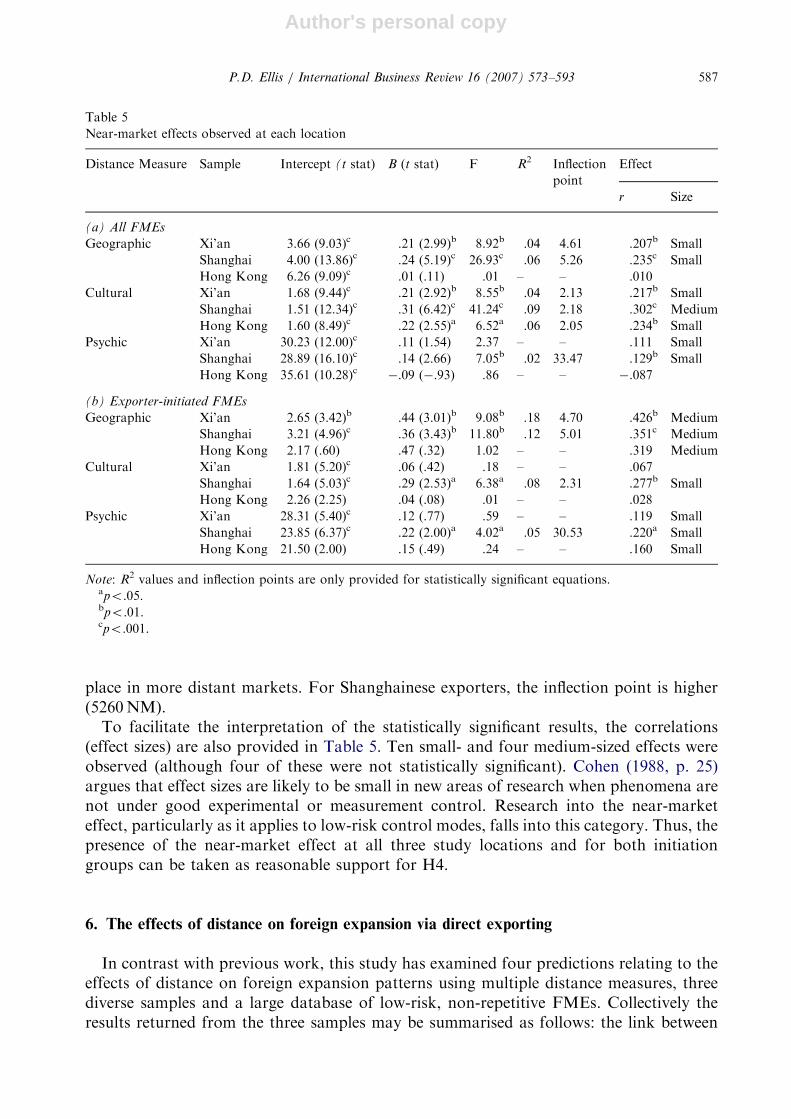
The intercepts (a), regression slopes (b), and F statistics are listed in Table 5.(Coefficients of multiple determination (R2) and inflection points are provided for the tenstatistically significant regression equations.) These results show that the distance to newmarkets is related to the distance to markets already entered. Specifically, the results showthat when firms begin by exporting to proximate markets, subsequent market entries willbe further away and vice versa. The inflection point for each sample is listed in the table.To take the first example listed, if the geographic distance to a market exceeds 4610nautical miles, the regression predicts that the next market entered by exporters from Xi’anwill be geographically closer. Below this threshold point and subsequent entries will take
ARTICLE IN PRESSP.D. Ellis / International Business Review 16 (2007) 573–593586
Author's personal copy
place in more distant markets. For Shanghainese exporters, the inflection point is higher(5260NM).
To facilitate the interpretation of the statistically significant results, the correlations(effect sizes) are also provided in Table 5. Ten small- and four medium-sized effects wereobserved (although four of these were not statistically significant). Cohen (1988, p. 25)argues that effect sizes are likely to be small in new areas of research when phenomena arenot under good experimental or measurement control. Research into the near-marketeffect, particularly as it applies to low-risk control modes, falls into this category. Thus, thepresence of the near-market effect at all three study locations and for both initiationgroups can be taken as reasonable support for H4.
6. The effects of distance on foreign expansion via direct exporting
In contrast with previous work, this study has examined four predictions relating to theeffects of distance on foreign expansion patterns using multiple distance measures, threediverse samples and a large database of low-risk, non-repetitive FMEs. Collectively theresults returned from the three samples may be summarised as follows: the link between
ARTICLE IN PRESS
Table 5
Near-market effects observed at each location
Distance Measure Sample Intercept (t stat) B (t stat) F R2 Inflection
Shanghai 23.85 (6.37)c .22 (2.00)a 4.02a .05 30.53 .220a Small
Hong Kong 21.50 (2.00) .15 (.49) .24 – – .160 Small
Note: R2 values and inflection points are only provided for statistically significant equations.apo.05.bpo.01.cpo.001.
P.D. Ellis / International Business Review 16 (2007) 573–593 587
Author's personal copy
distance and expansion patterns received very weak to no support (H1 and H2)6; thehypothesis linking the rate of international expansion with experience received no support(H3); but the near-market effect was evident in one form or another at all three studylocations (H4). These three broad conclusions are discussed in turn.In Johanson and Wiedersheim-Paul’s original study (1975), the correlation between
psychic distance to markets and FME via independent agents was statistically significant inonly two of the four cases studied. At first glance, it appears that this mixed-result isrepeated in the current study at least in the context of geographic distance. For theShanghainese sample, geography was weakly correlated with entry sequence, although nosuch relationship was observed in Xi’an or Hong Kong. One explanation is that distanceeffects are context-dependent with some locations being more susceptible than others. Thisis an argument others have made to explain why psychic distance effects tend to show up instudies involving Scandinavian companies (Sullivan & Bauerschmidt, 1990). But a saferconclusion is that distance does not affect firm internationalisation in the simple wayspredicted by H1 and H2. The best test of whether firm expansion describes a pattern ofincreasing distance to market is company-specific and here the results are unequivocal.Equations regressing the distance separating consecutive FMEs as a function of thenumber of entries previously made by individual firms returned non-significant results forall of the distance/sample combinations examined. Whatever their reasons were forselecting new foreign markets to enter, the Chinese exporters in this study were notsignificantly impelled by cost considerations arising from minimising the geographic orcultural/psychic distance from home.Additionally, across the three samples there was no support for the conjecture that the rate
of outward expansion is affected by experience (H3). These findings refute Benito andGripsrud’s (1992) hypothesis that the rate of international expansion is affected by experience.To summarise the story so far, the evidence from the three study locations challenges the
proposition that internationalisation patterns conform to a monotonic pattern ofincreasing distance to markets. On what basis then, do exporters make FME decisions?Some answers can be found by looking at the modal choices made by managers at eachlocation. Shanghainese exporters exhibited a strong predilection for two neighbouringmarkets; Japan and Korea. In addition to their geographical proximity both countriesshare a common Confucian heritage with China and neither was rated as being particularlydistant in psychic terms. (Although with a psychic distance score of 32.5 Japan was justover the inflection point of 30.5 returned for Shanghainese exporters suggesting thatsubsequent export markets would be psychically closer to home. Korea’s psychic distancescore for this group was 28.1.) Both Japan and Korea happen to be substantial consumersof Chinese exports. In short, economic factors, rather than geography or culture, may havebeen more significant in influencing early export decisions. Post-hoc correlational analysisbares this out. Market size, measured in terms of the purchasing power-equivalent ofGDP, is more strongly correlated with entry sequence than any of the three distancevariables. Large economies also dominated the top three market choices of exporters fromXi’an (USA, Japan and Germany) and Hong Kong (USA, UK and Germany). As none of
ARTICLE IN PRESS
6Out of 27 results for the ‘‘All FME’’ group obtained for H1 and H2 using three analytical tests (t-test (H1),
correlational and regression analyses (H2)), only two were statistically significant. Of these, only one was ‘‘large’’
enough to register as a small effect. Of the 27 results obtained for the ‘‘exporter-initiated FMEs’’, none was
statistically significant.
P.D. Ellis / International Business Review 16 (2007) 573–593588
Author's personal copy
these markets is particularly close to Xi’an or Hong Kong in geographic, cultural orpsychic terms, a reasonable conclusion seems to be that entry decisions were driven moreby market opportunities than by minimising the costs of overcoming distance (Ellis, 2006).In Hong Kong’s case historical ties to the UK also appear to have played a role in shapingFME patterns, a finding consistent with Ghemawat’s (2001) claim that colonial linksbetween countries boosts trade by 900%. These ties are reflected in a relatively low psychicdistance score of 21.6. Still, the UK was often entered ahead of other psychically andgeographically closer countries, such as Taiwan (13.3), Singapore (18.9), and Thailand(20.9). This pattern of behaviour adds weight to the idea that market size is a moreimportant factor explaining the FME sequence of Hong Kong exporters, a conclusionconsistent with the results of other, firm-level investigations of internationalisationpatterns (Davidson, 1980; Mitra & Golder, 2002; Terpstra & Yu, 1988).
While distance effects were not found to influence the pattern and pace of outwardexpansion in a direct or monotonic fashion, the results nevertheless show that consecutiveFME locations are related and that the direction and extent of movement between twosubsequent market entries can be explained as a function of the location of the earlierFME. Specifically, closer FMEs tend be followed by more distant FMEs and, once acertain point is reached, vice versa. These results closely match those reported by Benitoand Gripsrud (1992) in their analysis of foreign investment patterns. In that study the near-market effect was limited to cultural distance and the inflection point (the value at whichsubsequent investments are made closer to home than a previous investment) was 2.13,well within the range of results returned for cultural distance in this study (2.05–2.31).7 Forthe Hong Kong exporters, this means that if the cultural distance of the previous FMEexceeds 2.05 (El Salvador is closest to this score), the next FME is likely to be culturallycloser to home, and vice versa. For the mainland Chinese exporters, the analogous figure(or market) lies in the 2.13–2.18 range (say, Argentina).
The near-market effect suggests that experience gained in one market reduces theuncertainty associated with entering other, culturally similar markets (Barkema et al., 1996).This is the best explanation of why subsequent FMEs are correlated even when there is no linkbetween distance and overall expansion patterns. The implication is that cultural knowledgegenerated in similar markets is a better predictor of foreign expansion than cultural knowledgeacquired at home (Mitra & Golder, 2002). Interestingly, the near-market effect supports theScandinavian idea that experiential learning shapes firm internationalisation, but not inthe manner originally conceived. Relevant experience is not gained at home, but fromoperating in foreign markets that are similar to the new market being entered. Thistransference between culturally similar markets is logical if new markets have more in commonwith recent markets than the exporter’s country of origin (Mitra & Golder, 2002).
This study extends previous work on the near-market effect in two ways. First, byobserving the near-market effect in the context of low-risk entry modes, the study shows
ARTICLE IN PRESS
7Can the results of cultural distance studies done in separate countries be compared? Undoubtedly specific
country-pairings will be incomparable. (The distance separating Norway from the US will not the same as the
distance from China from the US.) But if cultural distance studies contain a mix of both near and far markets,
then individual differences may balance out, or at least they may be too small to undermine predictions about the
relationship between near and far markets. Interestingly, the means and standard deviations for cultural distance
in this study (2.20/1.08) and the studies by Benito and Gripsrud (1992, 1.95/1.44) and Barkema et al. (1996, 2.64/
1.14) are very similar. No study reported a mean that was more than one standard deviation away from the mean
of either of the other two studies.
P.D. Ellis / International Business Review 16 (2007) 573–593 589
Author's personal copy
that exporters are able to transfer their experience from one market to another in much thesame way that multinationals transfer learning between subsidiaries. Second, the studyfurther reveals that the near-market effect can be detected when distance is operationalisedin psychic terms. This makes intuitive sense. Managers should be able to leverage theirexperiences between markets which are psychically similar.8
The central question asked in this study is whether distance to market affects firminternationalisation. The results show that distance does indeed affect internationalisation,but does so in ways which are not yet well-understood. Near-market knowledge, whethermeasured in cultural or psychic distance terms, was found to be a better predictor of FMEthan distance from the home market. This result is consistent with recent researchinvestigating the timing of FDI decisions (Mitra & Golder, 2002).In summary, two important contributions can be identified. First, by drawing on a large
database of non-repetitive FMEs drawn from diverse exporters in dissimilar locations, thestudy provides a substantial evidentiary basis for testing four distance-related hypotheses.This represents a significant departure from the past practice of drawing distance-relatedconclusions from data-sets evidencing limited variation on the constructs of interest andwhich fail to discriminate between entries into new and existing markets. Second, the studyhas provided arguably the first demonstration of the near-market effect in the context oflow-risk entry modes. Non-zero benchmarks have also been provided against which futureeffect sizes may be compared. For scholars working in the field, the challenge is now toexpand upon this idea that culture-specific learning is an asset that can be transferredbetween markets. The actual means by which this transfer process serves to reduce theuncertainty of exporting to new markets, remains to be explained.
Acknowledgements
The author would like to acknowledge the valuable assistance provided by Ha LauChing, Kwan Loh Yien and Wong Pei Wai in Hong Kong; Zhuang Guijun in Xi’an; andChao Gangling and Li Huihui in Shanghai. The author is grateful for the constructivefeedback provided by Gabriel Benito, Doug Dow, Jan Johanson, and Peter Walters. Theresearch reported in this paper was supported by Internal Research Competitive Grantsprovided by the Hong Kong Polytechnic University: Hong Kong (Project A-P159), Xi’an(Project A-PD24), Shanghai (A-PE88).
Appendix A. Cultural and psychic distance scores—selected countries
See Table A1.
ARTICLE IN PRESS
8Somewhat unexpectedly, the near-market effect was also evident when distance was measured geographically.
However, the geographic results may be spurious as there is no reason to expect that managers can transfer
learning between proximate markets, except when those markets happen to be culturally or psychically similar.
An examination of the link between geographic and cultural distance bares this out. For mainland Chinese firms,
neighbouring markets such as Hong Kong (.14), India (.45), Vietnam (.51), and the Philippines (.25) generally had
much lower cultural distance scores than distant markets such as the US (3.09), the UK (3.08), the Netherlands
(4.49) and Denmark (4.93). Hong Kong is the exception which proves the point. For exporters in this city there is
a non-significant correlation between the cultural and geographic distance to foreign markets. Consequently a
near-market effect observed when distance was measured in cultural terms failed to materialise when distance was
measured geographically.
P.D. Ellis / International Business Review 16 (2007) 573–593590
Author's personal copy
References
Barkema, H. G., Bell, J. H., & Pennings, J. M. (1996). Foreign entry, cultural barriers, and learning. Strategic
Management Journal, 17(2), 151–166.
Beckerman, W. (1956). Distance and the pattern of intra-European trade. Review of Economics and Statistics,
38(1), 31–40.
Benito, G., & Gripsrud, G. (1992). The expansion of foreign direct investments: Discrete rational location choices
or a cultural learning process? Journal of International Business Studies, 23(3), 461–476.
Brewer, P. (2001). International market selection: Developing a model from Australian case studies. International
Business Review, 10, 155–174.
Cairncross, F. (2001). The death of distance: How the communications revolution is changing our lives. Boston:
Harvard Business School Press.
Child, J., Ng, S. H., & Wong, C. (2002). Psychic distance and internationalization. International Studies of
Management and Organizations, 32(1), 36–56.
China Statistical Yearbook. (2005). China statistical yearbook. China Statistics Press: Beijing.
China Statistical Yearbook. (2006). China statistical yearbook. Beijing: China Statistics Press.
Clark, X., Dollar, D., & Micco, A. (2004). Port efficiency, maritime transport costs, and bilateral trade. Journal of
Development Economics, 75, 417–450.
Cohen, J. (1988). Statistical power analysis for the behavioral sciences (2nd ed.). New York: Academic Press.
Combes, P. P., & Lafourcade, M. (2005). Transport costs: Measures, determinants and regional policy
implications for France. Journal of Economic Geography, 5, 319–349.
Czinkota, M. R., & Ursic, M. L. (1987). A refutation of the psychic distance effect on export development.
Developments in Marketing Science, 10, 157–160.
ARTICLE IN PRESS
Table A1
Cultural distance fromy Psychic distance fromy
y Hong Kong Score y China Score y Hong Kong Score y China Score
Hong Kong .00 China .00 Hong Kong 1.00 China 1.00
China .14 Hong Kong .14 China 12.81 Hong Kong 8.31
Vietnam .21 Philippines .25 Taiwan 13.29 Malaysia 21.15