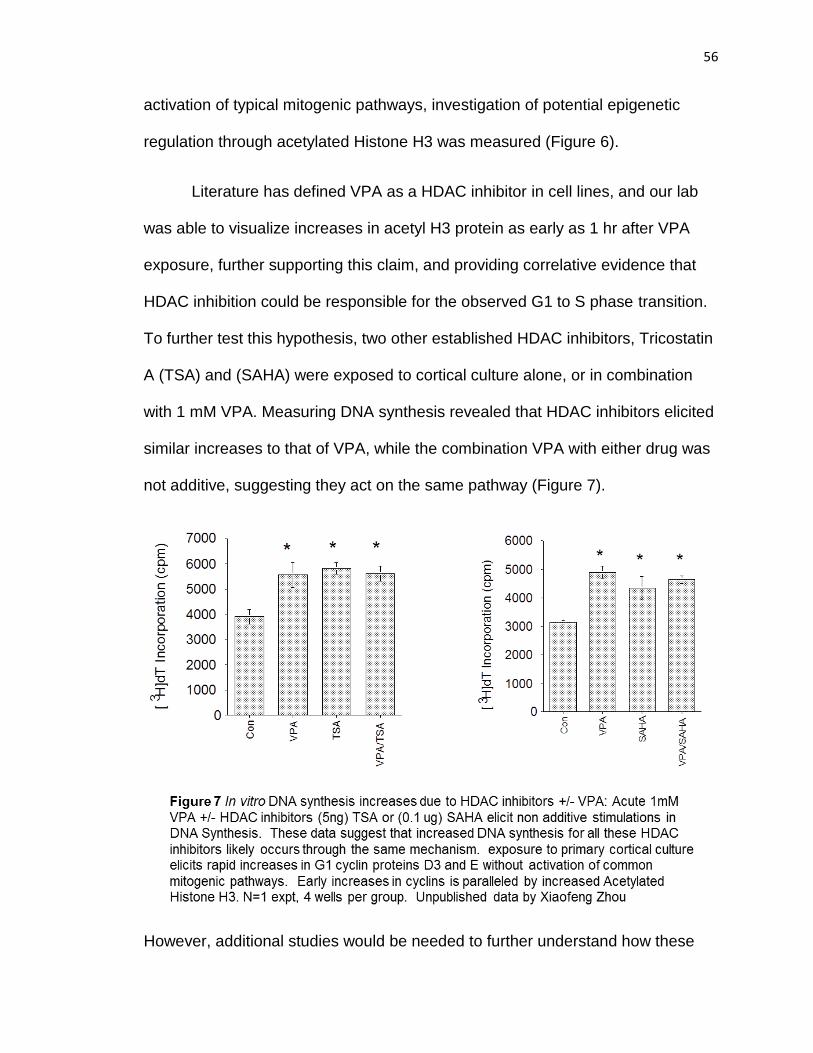
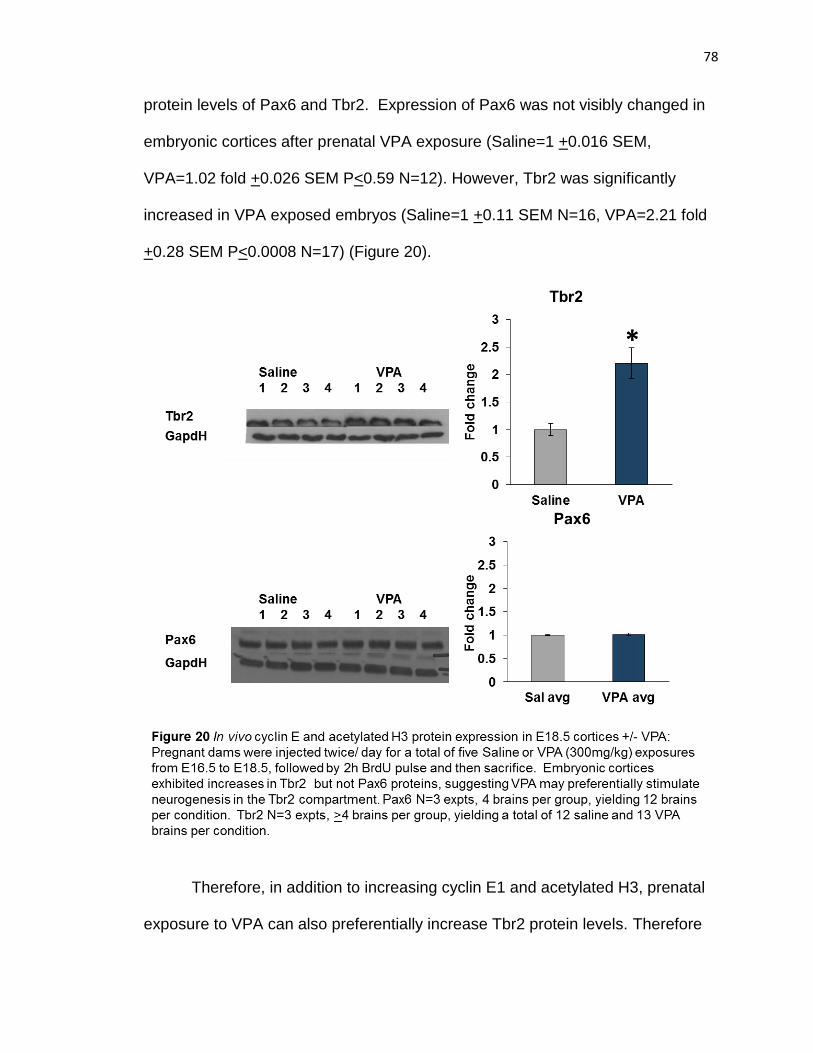
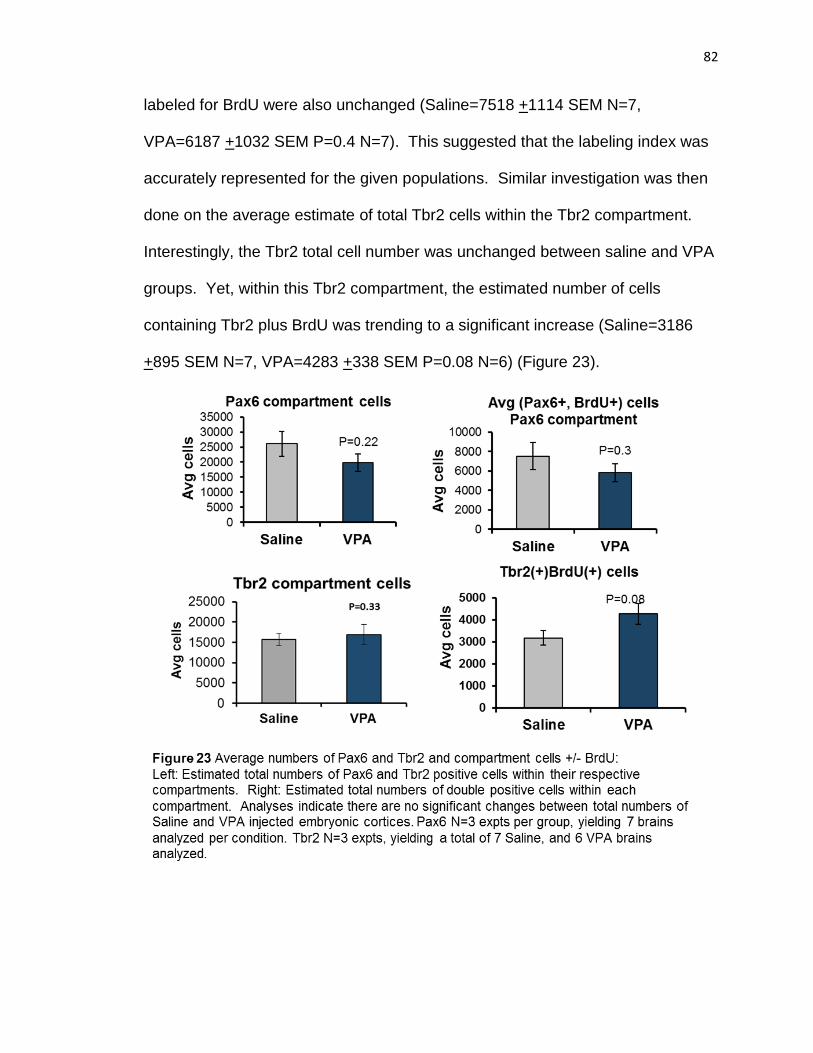
i AUTISM SPECTRUM DISORDERS: ENVIRONMENTAL AND GENETIC RISK FACTORS ALTER CORTICAL NEUROGENESIS by ROBERT JAMES CONNACHER, BS A dissertation submitted to the School of Graduate Studies Rutgers, The State University of New Jersey For the degree of Doctor of Philosophy Graduate Program in Neuroscience Written under the direction of Emanuel DiCicco-Bloom, And approved by _____________________________ _____________________________ _____________________________ _____________________________ _____________________________ New Brunswick, New Jersey October, 2017
Transcript
i
AUTISM SPECTRUM DISORDERS: ENVIRONMENTAL AND GENETIC RISK
FACTORS ALTER CORTICAL NEUROGENESIS
by
ROBERT JAMES CONNACHER, BS
A dissertation submitted to the
School of Graduate Studies
Rutgers, The State University of New Jersey
For the degree of
Doctor of Philosophy
Graduate Program in Neuroscience
Written under the direction of
Emanuel DiCicco-Bloom,
And approved by
_____________________________
_____________________________
_____________________________
_____________________________
_____________________________
New Brunswick, New Jersey
October, 2017
ii
ABSTRACT OF THE DISSERTATION
AUTISM SPECTRUM DISORDERS: ENVIRONMENTAL AND GENETIC RISK
FACTORS ALTER CORTICAL NEUROGENESIS
by ROBERT JAMES CONNACHER, BS
Dissertation Director:
Emanuel DiCicco-Bloom
Cortical Neurogenesis is a highly regulated process which requires
neural precursor population expansion followed by migration and subsequent
differentiation. Early cortical overgrowth has been observed in individuals with
autism spectrum disorder (ASD) and may underpin observed cases of
macrocephaly seen within ASD subgroups. To define mechanisms by which this
process could be altered, studies have identified environmental and genetic ASD
risk factors, including Valproic acid (VPA) and the copy number variant 16p11.2
(16P), respectively.
Valproic acid is a neurotheraputic medicine intended to treat epilepsy,
migraines, and bipolar disorder but poses ASD risk to prenatally exposed fetuses
when mothers are taking this drug. Prenatal VPA exposure in rodents studies
have replicated behavioral and cellular deficits seen in ASD, including alterations
in neurogenesis, but convergence of mechanisms remain undefined. Studies
suggest VPA may impact development through Histone Deacetylase (HDAC)
inhibition, though this enzymatic inhibition has not been directly confirmed in
iii
primary neural cells. The function of HDACs is to epigenetically regulate
acetylation sites which can change gene expression. Therefore, I characterized
HDAC message and protein in the developing rodent brain, and confirmed that
VPA can enzymatically inhibit these proteins. Previously, we found that VPA
exposure promotes G1 to S phase transition through rapid increases of G1
cyclins and acetylated Histone H3, suggesting epigenetic regulation of this
process. Therefore, I measured mRNA of G1 cyclins after acute VPA exposure,
and found upregulation in transcription of these genes, supporting the notion that
post-translational modifications of histones may promote proliferation through
G1-S phase transition. Additionally, our prior studies found that the increased
proliferation resulted in a bigger brain by P21 with more upper layer neurons.
Others have also indicated prenatal VPA exposure promotes neurogenesis of
upper layer neurons. Therefore with these findings, I characterized the
percentage of Pax6 and Tbr2 progenitor cells in S phase, to determine specificity
of VPA effect. Interestingly, only the Tbr2 population had more cells in S phase,
providing explanation for increased upper layer neurons at P21.
Altered neurogenesis is also observed in the copy number variant
16p11.2, a genetic risk factor for ASD. In the 16p11.2 chromosomal deletion,
one copy of 27 genes is missing, including MAPK3, which encodes ERK1. This
gene is a central component in the ERK signaling pathway, which is important for
regulating cellular growth and proliferation. Therefore, I investigated proliferative
changes and signaling alterations in Neural Precursor Cells (NPCs) derived from
control and 16p11.2 patients iPSCs. I found that 16p11.2 NPCs had increased
iv
DNA synthesis under control media but exhibited reduced responses to
mitogenic stimulation with FGF, a developmental extracellular factor known to
activate the ERK pathway. Further characterization of this pathway under control
conditions revealed equivalent if not elevated phosphorylation of ERK1, but
approximately 50% less Total ERK1. Additionally, as may be predicted, there
were elevations in cyclin D1 and P-S6, suggesting mechanisms by which DNA
synthesis is increased in these cells. In aggregate, these studies identify cortical
neurogenesis as a common target of risk factors that contribute to
neuropsychiatric diseases.
v
Acknowledgements
I wish to express my eternal thanks and gratitude to my advisor Dr Manny
DiCicco-Bloom for his patience, support, guidance, and instruction during my
graduate career. It certainly has been a long road, and I greatly appreciate
everything he has provided so that I can reach this milestone in my life.
Within the Dicicco-Bloom lab I must underscore my appreciation for
Xiaofeng Zhou. Her limitless technical skills, patience, and friendship helped me
continue to move forward and always feel at home within the lab. My deepest
thanks also extend to Smrithi Prem. Words cannot fully express my gratitude for
her assistance, encouragement, and unwavering belief in my abilities; I do not
know where I would be without her. Furthermore, I wish to thank Smrithi for her
collaborative assistance, help, and friendship as she truly is the best person ever.
I would also like to extend my sincere appreciation to Madeline Williams, as her
collaboration and friendship have been integral to both my project and sanity.
Madeline not only generously shared her unaffected control proliferation data but
also played a big role in improving my management of data and assisted me with
learning additional NPC culture techniques. Additionally, I wish to thank Dr
Madel Durens for countless years of advice, encouragement, support, and
friendship. It has been a pleasure to work alongside these exemplar individuals
over the years.
At this time I would also like to express my heartfelt thanks to all previous
members of the DiCicco-Bloom lab, including but not limited to Drs Genestine-
Schmitt, Lunden, Lee, Obiorah, Tascau, and Yan. I am incredibly fortunate to
vi
have known them, and appreciated their countless help, advice, support, and
friendship over various stages of my graduate career.
I also wish to thank my committee members Dr Cheryl Dreyfus, Dr
Gabriela D’Arcangelo, Dr Mladen-Roko Rasin, and Dr Arnold Rabson, whom
have given me numerous suggestions, guidance, and advice. Their help has
proved invaluable in my development. Additionally, I wish to express my
appreciation for all faculty in the Neuroscience department, which in sum has
served as a second family to me. I would also like to highlight my tremendous
gratitude for Joan Mordes, Betty Wheeler and Zamina Deen, for all of their
guidance and assistance in paperwork, emails and reminders.
Finally, I would like to express my highest gratitude to all other friends,
mentors and family. It means so much that everyone has always encouraged
and cheered me on. Knowing you all had my back has helped me push through
the difficult times and kept me focused on my dreams.
vii
Table of Contents
Page
Abstract
Acknowledgements
Table of Contents
List of Figures
Chapter 1: Introduction
1.1) Autism Spectrum Disorder
A) Clinical description and prevalence
B) Genetics of Autism
C) Environmental factors contributing to ASD risk
D) ASD Neuropathology
1.2) CNS Development and its regulation
A) Neurogenesis in the Cortex
B) The Cell Cycle and its regulation
C) Signaling pathways impacting neurogenesis
D) Epigenetic regulation of cell cycle
1.3) Clinical observations related to Valproic acid exposure,
and Copy Number Variant 16p11.2
A) VPA’s clinical uses in Humans
B) VPAs effects as a Teratogen and ASD risk factor
C) The genetic risk factor for ASD, 16p11.2 CNV
ii
v
vii
xiii
1
1
1
2
4
6
10
10
12
15
18
21
21
22
23
24
viii
D. Converging phenotypes in Genetic and Environmental
risk factors for ASD
1.4) Models for Environmental and genetic risk factors
A)Rodent models for studying effects of VPA on ASD
B) Proliferation and differentiation after VPA exposure
C) Epigenetic actions of VPA
D) Animal models of 16p11.2 CNVs
E) Using iPSC technology to model genetic forms of
Autism
e) Fetal stem cell nature of iPSC NPCs
Chapter 2: Materials and Methods
2.1) Animal sacrifice
2.2) Cortical Cell Culture
2.3) Human NPC cell culture:
A) Generation of Human NPCs from iPSCs
B) Maintenance of Human NPCs under 100% Expansion
Media
C) Passaging of NPCs
D) Cell culture of NPCs under Experimental conditions
with 30% Expansion Media
E) Cell culture of NPCs for Total cell numbers assay
F) Culturing conditions for NPCs in downstream
Immunocytochemistry
25
25
26
29
31
32
33
34
34
35
36
36
36
37
37
38
38
40
ix
2.4) DNA Synthesis
A) [3H]dT incorporation in rat cortical culture( in vitro)
B) Assaying proliferation of NPCs with 3[H]:
2.5) in Vivo VPA Administration
A) Five injection paradigm
B) Three injection paradigm:
2.6) Protein Collection and Western Blotting
A) Methods for collection, and analysis for in vitro rat
cortical precursors
B) Human NPCs
C) In vivo Rat protein collection and analysis
2.7) RNA isolation
A) In vitro isolation and extraction of RNA:
B) In vivo tissue isolation
C) In vitro qRT-PCR and analysis
D) In vivo RT-PCR and analysis of HDACs 2.8) Fluorometric HDAC enzymatic activity assay
2.9) Immunocytochemistry A) In vitro studies with Rat cortical precursors:
A) 16p11.2 NPCS have altered levels of DNA synthesis
Previous mouse studies have suggested that the 16p11.2 deletion favors
enhanced proliferation due to increased ERK activation and cyclin D1, followed
by early cell cycle exit due to p27 (21). Clinical descriptions of some humans
with the 16P deletion indicated macrocephaly as a phenotype (162) suggesting
alterations in brain development, and proliferation. Although there was some
altered signaling due to loss of this CNV, additional research is needed to
understand how increased proliferation occurs in these mice and humans. I
presented data which supported the biology seen in the mouse. Specifically, I
demonstrated 16p11.2 NPCs have elevated DNA synthesis at early passages,
which then became dramatically slower compared to control NPCs at older
passages. My data demonstrated that the two 16p11.2 males have a 30%
increase in DNA synthesis overall, which increased to 70% if only looking at
passages 3-5. From passage 6-8, the 16p11.2 males actually had a 20%
126
decrease in DNA synthesis with respect to control NPCs, suggesting that as
NPCs become older, more of them could be differentiating. Although
differentiation and S-phase markers for cell cycle exit need to be investigated,
and additional clones need to be studied, my DNA synthesis data by passage
was consistent with cellular biology seen in the mouse model for enhanced early
proliferation, and early cell cycle exit.
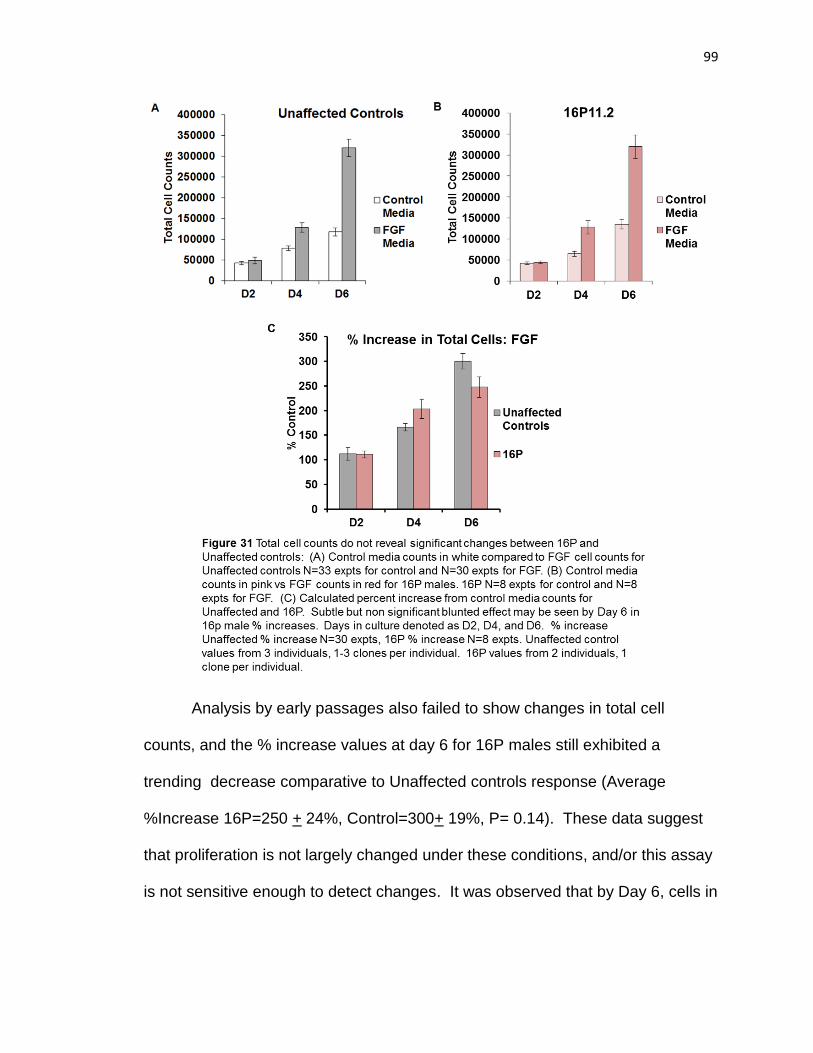
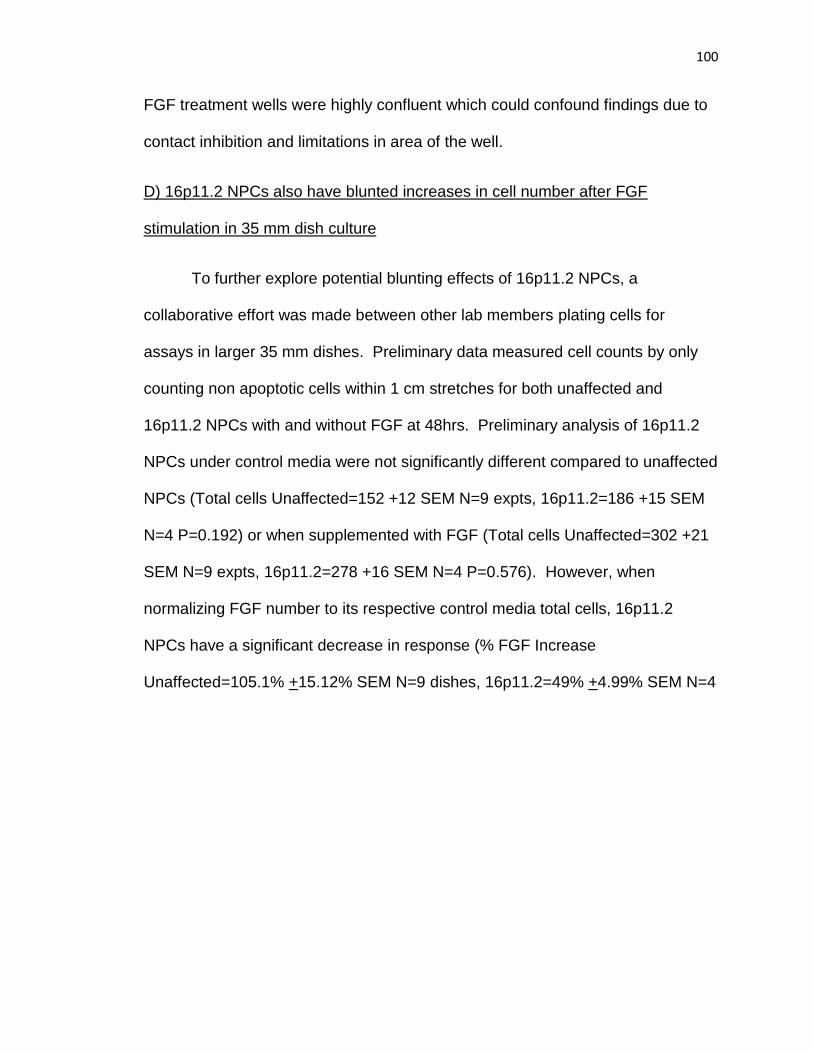
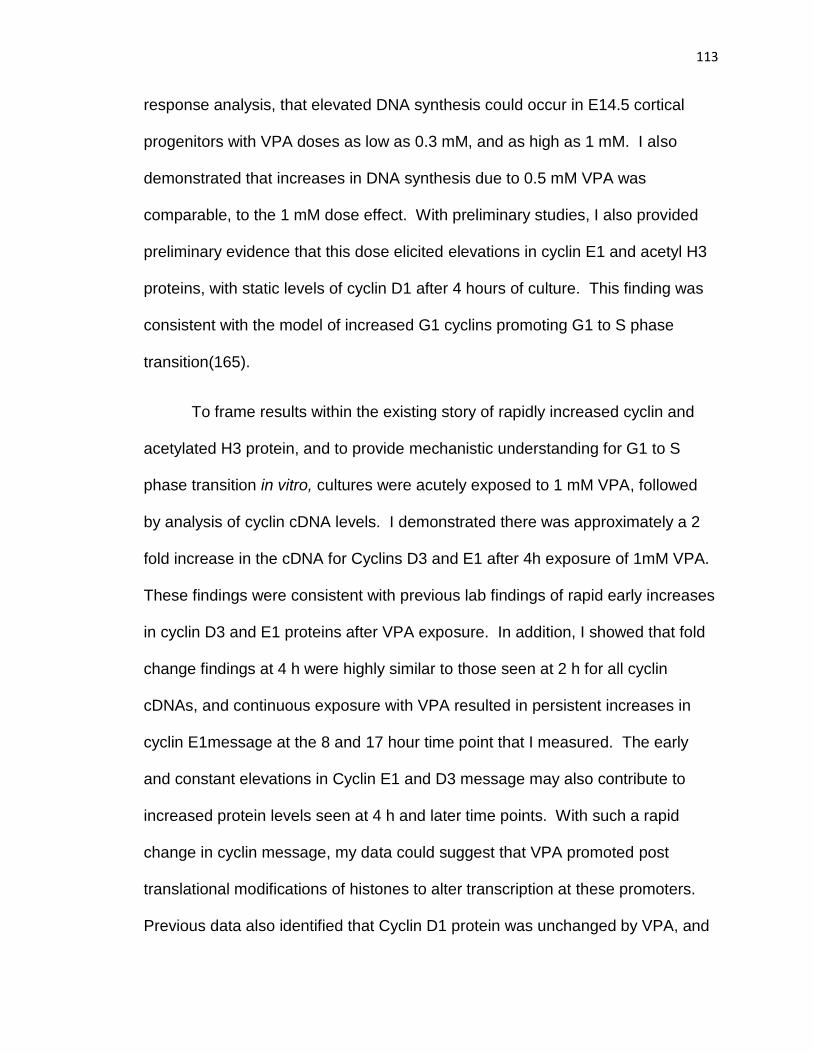
B) 16p11.2 cell counts are similar to control NPCs under 30% expansion
One possible explanation for why 16p11.2 NPCs exhibited increased DNA
synthesis after 48 hours could be increased cell number, due to alterations in
proliferation. Mouse studies indicated proliferative changes were seen by
overactive ERK1 and increased cyclin D1 (21). I presented preliminary evidence
that 16p11.2 NPCs have a non significant 15% increase in total cell numbers by
day 6 of culture. Further, by limiting experiments to P3-P5, a trending 40%
increase was observed by day 6. Although additional experiments need to be
conducted, this data may be consistent with observed increases in DNA
synthesis after 48 hr culture. To address if cell survival was altered in 16p11.2
NPCs, I demonstrated that there were no significant difference in total cell
numbers after 2 days culture. This shows that there was not a dramatic
reduction in 16p11.2 NPC number compared to controls, which was consistent
with the notion that survival of plated cells is equivalent. The mouse model also
indicated no apparent differences in apoptosis between unaffected and affected
rodents (21). Additional studies could investigate this further through cleaved
caspase-3 staining. I also demonstrated that cell counts by day 6 were not
127
significantly different between 16P and control NPCs, however a trending
increase was observed for 16P if data were analyzed by early passage (P3-P5)
only. These data suggested that 16P NPCs do not have dramatically altered
survival or alterations in cell numbers compared to control NPCs under regular
media conditions. Thus the minimal increases in cell number with increased
DNA synthesis, trending increases in PERK and activated downstream effector
cyclin D1 suggested that these cells may have altered cell cycle length and
potentially altered size. This could be supported through overactive P-S6 which
is a downstream effector of mTORC1 (77).
C) 16p11.2 NPCs have reduced total ERK1, and evidence of altered signaling
pathways
The increased proliferation seen in the 16p11.2 mouse was suggested to
be due to hyperphosphorylated ERK 1, as well as upregulation of its downstream
effector, cyclin D1 (21). However, this finding has not yet been investigated in
non cancerous human cells. I first demonstrated that Total ERK 1 protein was
reduced close to 50% of unaffected controls, as expected for the CNV deletion.
With a reduction in total ERK1, studies suggested that mice with 16p11.2
exhibited dysregulation of ERK signaling (21). My data showed a trending 1.3
fold increase in PERK1, however there was variability across individuals. If
additional clones continue this trend to significance, my data would support P-
ERK1 hyperactivity, which is consistent with the mouse model findings. ERK
signaling pathways are involved in regulation of proliferation (21, 69, 179).
Furthermore, Cyclin D1 transcription can occur through the RAF MKK1 ERK
128
signaling pathway (62). My western data demonstrated that 16p11.2 NPCs have
a 1.32 fold increase in Cyclin D1 protein, which is consistent with the increased
DNA synthesis, and could be increased through overactive ERK signaling,
consistent with previous murine studies.
Considering there was elevated DNA synthesis and G1 cyclins, it would
suggest that there could be more proliferation with increased cell numbers. With
only a trending increase seen for this, I investigated P-S6 levels which could
explain increased DNA synthesis without increasing cell numbers. I
demonstrated that phosphorylated S6 was increased by 1.86 fold in 16p11.2
NPCs. Although normal activation of P-S6 can be explained by activation of the
mTOR pathway, evidence has suggested interaction between mTOR and ERK
(76, 77). The ERK pathway may indirectly upregulate P-S6 through RSK (180).
Phosphorylated ERK ½ can phosphorylate the mTORC1 activating protein,
Raptor in a Ras dependent mechanism using cell lines (181). The complex
mTORC1 is also able to interact with S6, playing roles in translation initiation and
elongation (77) . Therefore my findings could be consistent with other studies,
and additional investigation into mTOR signaling within these cells should
provide further understanding if crosstalk between these signaling pathways
occurred in 16P NPCs or if these cells had activated mTOR activity. Although
potential interactions between mTOR and ERK signaling pathways require
additional research, there has also been correlative evidence of dysregulation of
both cyclin D1 and P-S6 in hemimegalencephaly cases. It has been observed
that cyclin D1 and P-S6 are co-expressed in hemimegalencephaly, and within
129
this phenotype, balloon cells and cytomegalic neurons are often observed (182).
However, this activation of cyclin D1 was proposed to be through activation of
beta-catenin signaling pathway (182). Others have suggested that there is
crosstalk between MAPK and beta-catenin pathways based on Wnt3a activation
of ERK pathway, and that inhibition of ERK is able to attenuate Wnt3a
transcription in cell lines (183). My data was also consistent with these findings,
as increases in cyclin D1 and P-S6 have been observed in 16p11.2 NPCs, and
by preliminary visual observation, these NPCs seem to have enlarged somas
compared to unaffected NPCs. Furthermore, the SFARI database indicated that
of these two 16p11.2 patients, one exhibited macrocephaly at 14.3 years, while
the other was within the 71 percentile at 1.5 years, suggesting slight increased
head circumference. Trending increases in PERK1, as well as increases in
Cyclin D1 and P-S6 provided explanations for increased DNA synthesis in 48
hour culture and the trending increases in total cell numbers by day 6. These
data also indicated that 16p11.2 NPCs have multiple alterations in growth and
altered signaling. Although P-S6 increases could be due to multiple signaling
pathways, the elevation corresponded with increased DNA synthesis and a
trending increase in PERK1. Additional studies would need to be done in order
to determine if some of these changes are due to crosstalk between ERK and
mTOR or beta-catenin signaling pathways. To better understand why increases
in cell number by day 6 are only trending, investigations into S phase length
could be elucidating. Increased symmetric division could promote a larger
population of cells and has been argued to have a longer s-phase due to greater
130
efforts in DNA repair and synthesis, while commitment to neural fates have
shorter s-phase (184). Based on signaling abnormalities, these cells could also
have altered cell cycle lengths, suggestive of proliferative or differentiating
phenotypes. In sum, these data suggested that 16p11.2 NPCs exhibit altered
signaling and protein expression in downstream effectors of ERK as well as
mTOR, which could explain increased DNA synthesis, and day6 cell count
findings.
D) 16p11.2 deletion NPCs have altered responses to mitogenic
stimulation
Mitogenic stimulation of the MAPK signaling cascade gives rise to
increased proliferation (69). Considering that recent evidence from 16p11.2
deletion mice suggest that there is ERK dysregulation in this system (21), it
would follow that mitogenic stimulation of this pathway could have altered
responses. The mitogenic factor, fibroblast growth factor (FGF), is known to
activate the ERK signaling pathway through tyrosine kinase receptors (179). I
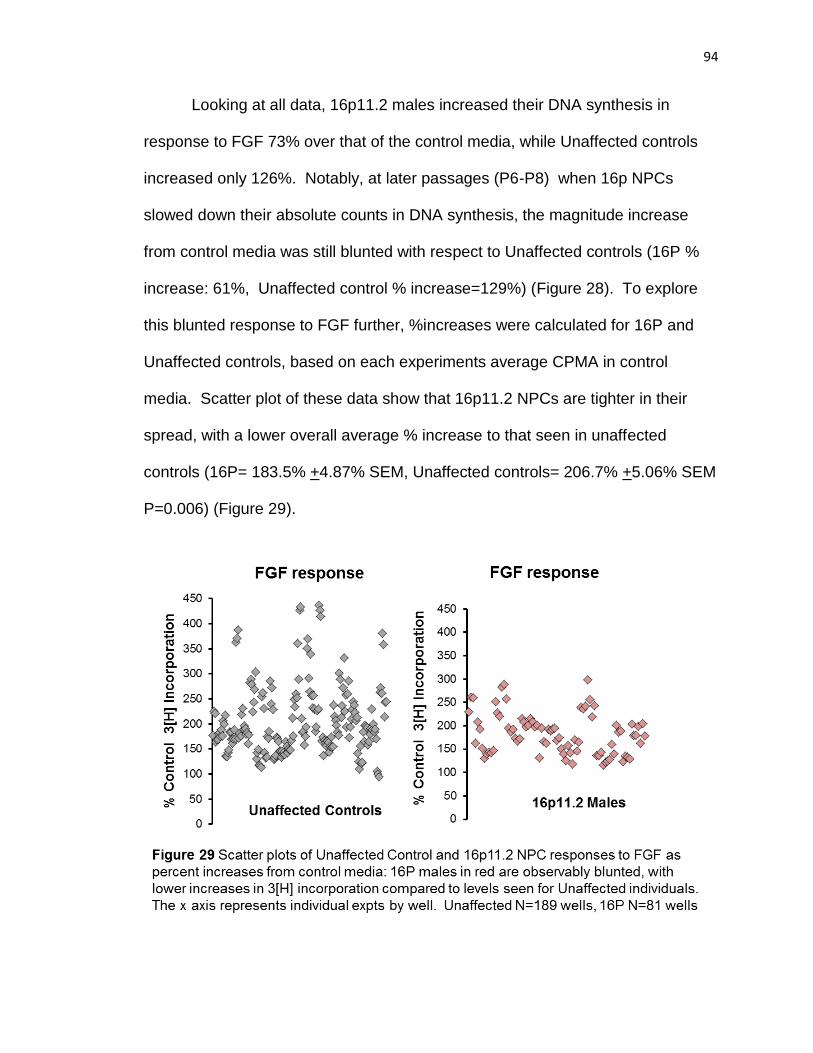
demonstrated by scatter plot of percent control DNA synthesis values, that
unaffected NPCs have a higher FGF response than 16p11.2. This blunting was
also visibly observed from average DNA synthesis graphs where unaffected
NPCs exhibited a 122% increase in DNA synthesis after FGF, while 16P NPCs
only had 68% increase, mirroring the blunted response also seen by scatter plot.
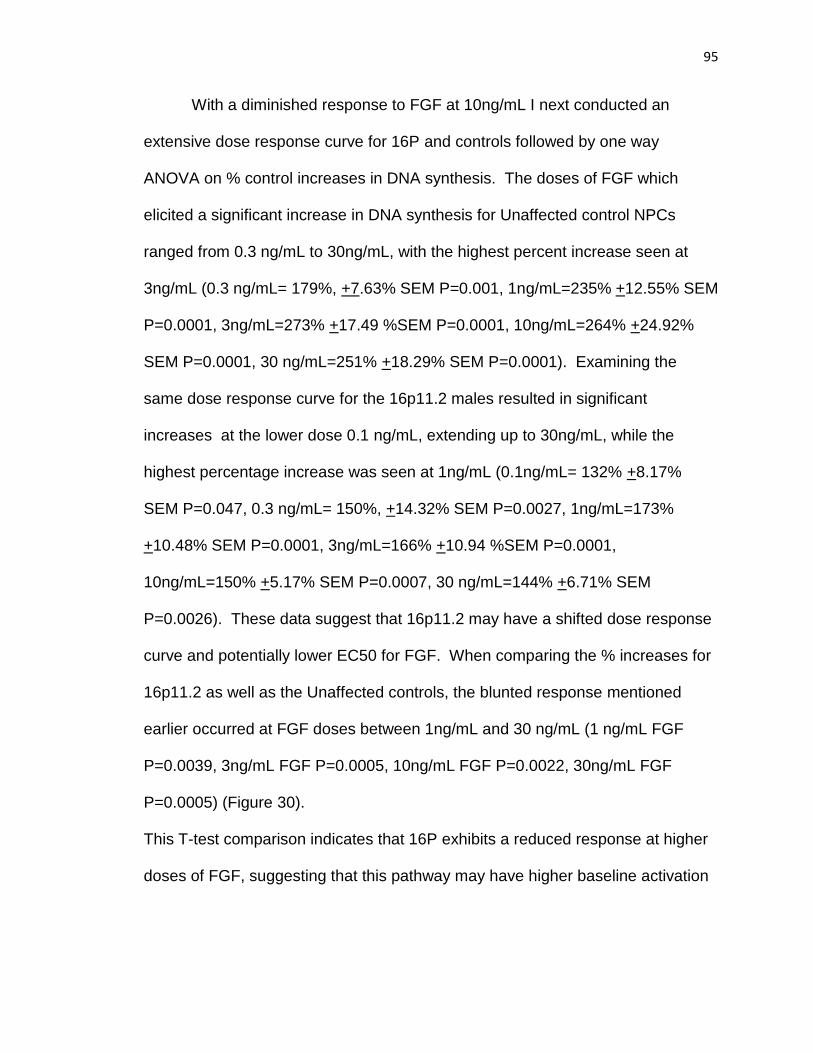
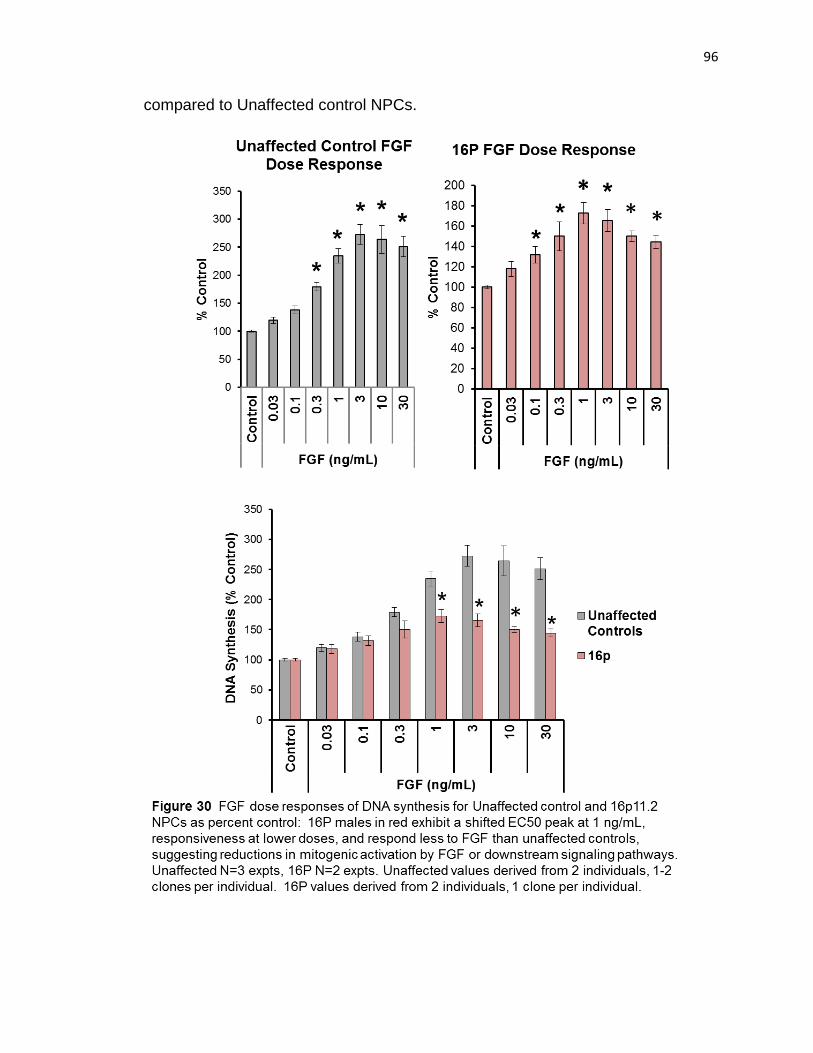
I also demonstrated by FGF dose response, that 16p11.2 NPCs may have a
reduced EC50 at 1ng/mL, compared to 3 ng/mL for unaffected controls. Further,
I demonstrated that 16p11.2 percent control increases were significantly less
131
than unaffected control changes at doses between 1 ng/mL and 30 ng/mL.
Colleagues and I have also demonstrated through additional low density culture
assay that 16p11.2 NPCs increase in cell number after FGF treatment is
approximately 50% lower than increases seen for unaffected control NPCs,
replicating this blunted effect by alternative measures. However, higher density
cell counts do not appear to be dramatically different between 16P and
unaffected NPCs, yet still exhibited a trending decreased response by day 6
compared to unaffected NPCs. These findings are consistent with the mouse
studies indicating that 16p11.2 has ERK dysregulation. Currently, limitations to
this blunted observation are that we have not analyzed all patient clones, nor
have experiments been weighted equally across all passages, potentially
conflating the effect. Ongoing studies however will validate the magnitude of
difference in FGF response for 16p11.2 and unaffected NPCs. In sum, these
data suggested that 16p11.2 NPCs exhibited a blunted response to FGF mitogen
and this may indicate altered functional response in ERK signaling.
132
Chapter 6: Ongoing studies, Future directions, and
Conclusions
6.1) Valproic acids impacts on neurogenesis
Currently, I have several studies which require additional investigation
before findings are deemed complete. With respect to alteration in neurogenesis
due to prenatal VPA exposure, I observed an increase in the Tbr2 labeling index,
which may be sex dependent. Therefore I aim to examine additional embryonic
brains which were injected with saline or VPA during late neurogenesis. After
analyses of these additional brains, genotyping will be conducted, in order to
conclude if a greater magnitude change in the Tbr2 labeling index is observed in
male brains. Further, I expect the additional brains to result in significance for
the average estimated total number of Tbr2 + BrdU+ cells, which likely was
skewed due to sex specific changes in proliferation amongst these cells. It would
be tremendously satisfying to conclude that sex dependent effects in
neurogenesis are observed as a result of prenatal VPA exposure, as this would
underscore the heterogeneity seen for this risk factor, and create interesting
follow up questions into what mechanisms could sex regulate neurogenesis in
the SVZ. I also plan to investigate the degree at which HDAC inhibition could be
implicated in the SVZ. To do this, I plan to count the labeling index of HDAC2
positive cells. HDAC 2 is found within cells transitioning to become post mitotic,
and has increased expression in neurons. Therefore if I see an increased
labeling index in HDAC2 cells in VPA pretreated brains, this would suggest that
133
HDAC inhibition is preventing cells from differentiating, thus explaining why only
this subset of cells is being impacted. With respect to in vitro studies
investigating post translational modifications on histones, thereby increasing
transcription of G1 cyclins, I would like to understand if CKIs are also increased.
I would propose to expose cultures to a series of mitogenic doses of VPA for 4 h,
and measure fold change increases in both cyclins and respective CKIs that
HDACs may regulate. This could provide supporting evidence that lower doses
of VPA can preferentially upregulate message for cyclins over CKIs.
6.2) 16p11.2 and its role in altering neurogenesis
In order to validate previous findings, all of the current findings must be
replicated using additional clones for each patient. Current data suggests that
most clones for a person agree in their biological responses, but some cases
have shown large variability in signaling. To address discrepancies in signaling, I
plan to run westerns using multiple clones for each patient on the same gel. This
may further elucidate changes in P-ERK1 as I currently see a trending increase.
In order for current studies in male 16p11.2 NPCs to be considered complete,
each of the three unaffected controls as well as these two 16p11.2 NPCs should
have studies repeated using 3 different clones. Unfortunately, some of these
patients do not have this amount of clones currently available, so ongoing studies
will be repeated as samples are received. I had also mentioned briefly that
studies have investigated a female patient with the 16p11.2 CNV but did not
have available sex matched controls. As of now, one clone is available to study,
and is being expanded. I plan to conduct the same cassette of experiments on
134
this female control to determine if there are sex differences seen in neurogenesis
within this genetic model for ASD.
My studies using the two male 16p11.2 NPCs indicated that there was an
increase in P-S6 with cell somas being observably larger than unaffected
controls. To investigate these things, I plan to measure volume of cell somas to
determine if this could play a role in the enlarged brain phenotypes sometimes
seen in 16P. Additionally, I am going to investigate the P-S6 signaling pathways
in more detailed protein analyses. If there are no upstream increases in P-S6, I
will look for feedback mechanisms and potential crosstalk with the ERK pathway.
If after additional clones P-ERK1 levels become significant, I will also treat with
an ERK inhibitor to determine if increased DNA Synthesis is due to
hyperphosphorylation of the ERK pathway. I also plan to investigate proliferative
changes in these cells further. It is possible that the current assay measuring
total cell counts after 6 days is not sensitive enough. Therefore I may look into
FACS sorting cell populations in order to get more accurate counts, and also plan
to investigate total cell counts using more low density culture measures. Cell
death will also be directly measured through cleaved caspase staining in order to
identify if non significant increases in cell number is due to increased death in
16p11.2 NPCs. Other studies will investigate differentiation, by staining plated
cells with early differentiated markers after 48 hr culture and analyses will be
categorized by passage. This will help identify if passage specific changes in
DNA synthesis are due to differentiation, or another mechanism.
135
6.3) Conclusions
These studies investigated alterations in neurogenesis due to
environmental and genetic risk factors for ASD. Findings have indicated that
neurogenesis is altered in both cases, but likely through different mechanisms
that can stimulate G1 cyclins and DNA synthesis. Further, both exposures
indicate there may be increased proliferation within precursor cells. VPA
exposure may increase proliferation through HDAC inhibition, increasing G1
cyclins which specifically causes increased G1 to S transition in the SVZ.
However, the CNV 16p11.2 may have increased early proliferation and overall
increases in growth by altered P-ERK1, cyclin D1, and P-S6 signaling. These
two ASD risk factors provide additional explanations for how altered brain growth
in development can produce a bigger brain. Considering that accelerated brain
growth is both observed in, and potentially an early diagnostic tool for ASD, my
findings create a better understanding in how ASD may arise. Further,
approximately 20% of ASD individuals exhibit macrocephaly, and I provide
mechanistic evidence how alterations in neurogenesis can underpin a bigger
brain. Understanding that these epigenetic and genetic changes could create a
bigger brain, we can further study these signaling pathways, to learn how to
prevent, and potentially treat brain overgrowth during development. Growing
evidence suggests that increased neurogenesis is one way which ASD can arise,
thus it is imperative that future studies delve further into these mechanisms.
136
References 1. Breunig JJ, Haydar TF, Rakic P. Neural stem cells: historical perspective and future prospects. Neuron. 2011;70(4):614-25. doi: 10.1016/j.neuron.2011.05.005. PubMed PMID: 21609820; PubMed Central PMCID: PMC3225274. 2. Tury A, Mairet-Coello G, DiCicco-Bloom E. The multiple roles of the cyclin-dependent kinase inhibitory protein p57(KIP2) in cerebral cortical neurogenesis. Developmental neurobiology. 2012;72(6):821-42. doi: 10.1002/dneu.20999. PubMed PMID: 22076965. 3. Caviness VS, Jr., Nowakowski RS, Bhide PG. Neocortical neurogenesis: morphogenetic gradients and beyond. Trends in neurosciences. 2009;32(8):443-50. doi: 10.1016/j.tins.2009.05.003. PubMed PMID: 19635637; PubMed Central PMCID: PMC2725216. 4. Kuo MH, Allis CD. Roles of histone acetyltransferases and deacetylases in gene regulation. BioEssays : news and reviews in molecular, cellular and developmental biology. 1998;20(8):615-26. doi: 10.1002/(SICI)1521-1878(199808)20:8<615::AID-BIES4>3.0.CO;2-H. PubMed PMID: 9780836. 5. American Psychiatric A, American Psychiatric A, Force DSMT. Diagnostic and statistical manual of mental disorders : DSM-52013. 6. American Psychiatric A, American Psychiatric A, Task Force on D-I. Diagnostic and statistical manual of mental disorders : DSM-IV-TR. Washington, DC: American Psychiatric Association; 2000. 7. DiCicco-Bloom E, Lord C, Zwaigenbaum L, Courchesne E, Dager SR, Schmitz C, Schultz RT, Crawley J, Young LJ. The developmental neurobiology of autism spectrum disorder. The Journal of neuroscience : the official journal of the Society for Neuroscience. 2006;26(26):6897-906. doi: 10.1523/JNEUROSCI.1712-06.2006. PubMed PMID: 16807320. 8. Developmental DMNSY, Investigators P. Prevalence of autism spectrum disorder among children aged 8 years-autism and developmental disabilities monitoring network, 11 sites, United States, 2012. Morbidity and mortality weekly report Surveillance summaries (Washington, DC: 2002). 2012;63(2):1. 9. Harris SR. Early motor delays as diagnostic clues in autism spectrum disorder. European journal of pediatrics. 2017. doi: 10.1007/s00431-017-2951-7. PubMed PMID: 28660313. 10. Jones W, Klin A. Attention to eyes is present but in decline in 2-6-month-old infants later diagnosed with autism. Nature. 2013;504(7480):427-31. doi: 10.1038/nature12715. PubMed PMID: 24196715; PubMed Central PMCID: PMC4035120. 11. Estes A, Zwaigenbaum L, Gu H, St John T, Paterson S, Elison JT, Hazlett H, Botteron K, Dager SR, Schultz RT, Kostopoulos P, Evans A, Dawson G, Eliason J, Alvarez S, Piven J, network I. Behavioral, cognitive, and adaptive development in infants with autism spectrum disorder in the first 2 years of life. Journal of neurodevelopmental disorders. 2015;7(1):24. doi: 10.1186/s11689-015-9117-6. PubMed PMID: 26203305; PubMed Central PMCID: PMC4511527.
137
12. Hogart A, Wu D, LaSalle JM, Schanen NC. The comorbidity of autism with the genomic disorders of chromosome 15q11.2-q13. Neurobiology of disease. 2010;38(2):181-91. doi: 10.1016/j.nbd.2008.08.011. PubMed PMID: 18840528; PubMed Central PMCID: PMC2884398. 13. Bi X, Sun J, Ji AX, Baudry M. Potential therapeutic approaches for Angelman syndrome. Expert opinion on therapeutic targets. 2016;20(5):601-13. doi: 10.1517/14728222.2016.1115837. PubMed PMID: 26558806; PubMed Central PMCID: PMC4902328. 14. Yin J, Schaaf CP. Autism genetics - an overview. Prenat Diagn. 2017;37(1):14-30. doi: 10.1002/pd.4942. PubMed PMID: 27743394. 15. Khanzada NS, Butler MG, Manzardo AM. GeneAnalytics Pathway Analysis and Genetic Overlap among Autism Spectrum Disorder, Bipolar Disorder and Schizophrenia. International journal of molecular sciences. 2017;18(3). doi: 10.3390/ijms18030527. PubMed PMID: 28264500; PubMed Central PMCID: PMC5372543. 16. Abrahams BS, Geschwind DH. Advances in autism genetics: on the threshold of a new neurobiology. Nature reviews Genetics. 2008;9(5):341-55. doi: 10.1038/nrg2346. PubMed PMID: 18414403; PubMed Central PMCID: PMC2756414. 17. Ornoy A, Weinstein-Fudim L, Ergaz Z. Genetic Syndromes, Maternal Diseases and Antenatal Factors Associated with Autism Spectrum Disorders (ASD). Frontiers in neuroscience. 2016;10:316. doi: 10.3389/fnins.2016.00316. PubMed PMID: 27458336; PubMed Central PMCID: PMC4933715. 18. Varghese M, Keshav N, Jacot-Descombes S, Warda T, Wicinski B, Dickstein DL, Harony-Nicolas H, De Rubeis S, Drapeau E, Buxbaum JD, Hof PR. Autism spectrum disorder: neuropathology and animal models. Acta neuropathologica. 2017. doi: 10.1007/s00401-017-1736-4. PubMed PMID: 28584888. 19. Pinto D, Delaby E, Merico D, Barbosa M, Merikangas A, Klei L, Thiruvahindrapuram B, Xu X, Ziman R, Wang Z, Vorstman JA, Thompson A, Regan R, Pilorge M, Pellecchia G, Pagnamenta AT, Oliveira B, Marshall CR, Magalhaes TR, Lowe JK, Howe JL, Griswold AJ, Gilbert J, Duketis E, Dombroski BA, De Jonge MV, Cuccaro M, Crawford EL, Correia CT, Conroy J, Conceicao IC, Chiocchetti AG, Casey JP, Cai G, Cabrol C, Bolshakova N, Bacchelli E, Anney R, Gallinger S, Cotterchio M, Casey G, Zwaigenbaum L, Wittemeyer K, Wing K, Wallace S, van Engeland H, Tryfon A, Thomson S, Soorya L, Roge B, Roberts W, Poustka F, Mouga S, Minshew N, McInnes LA, McGrew SG, Lord C, Leboyer M, Le Couteur AS, Kolevzon A, Jimenez Gonzalez P, Jacob S, Holt R, Guter S, Green J, Green A, Gillberg C, Fernandez BA, Duque F, Delorme R, Dawson G, Chaste P, Cafe C, Brennan S, Bourgeron T, Bolton PF, Bolte S, Bernier R, Baird G, Bailey AJ, Anagnostou E, Almeida J, Wijsman EM, Vieland VJ, Vicente AM, Schellenberg GD, Pericak-Vance M, Paterson AD, Parr JR, Oliveira G, Nurnberger JI, Monaco AP, Maestrini E, Klauck SM, Hakonarson H, Haines JL, Geschwind DH, Freitag CM, Folstein SE, Ennis S, Coon H, Battaglia A, Szatmari P, Sutcliffe JS, Hallmayer J, Gill M, Cook EH, Buxbaum JD, Devlin B, Gallagher L, Betancur C, Scherer SW. Convergence of genes and cellular
138
pathways dysregulated in autism spectrum disorders. American journal of human genetics. 2014;94(5):677-94. doi: 10.1016/j.ajhg.2014.03.018. PubMed PMID: 24768552; PubMed Central PMCID: PMC4067558. 20. Devlin B, Scherer SW. Genetic architecture in autism spectrum disorder. Current opinion in genetics & development. 2012;22(3):229-37. doi: 10.1016/j.gde.2012.03.002. PubMed PMID: 22463983. 21. Pucilowska J, Vithayathil J, Tavares EJ, Kelly C, Karlo JC, Landreth GE. The 16p11.2 deletion mouse model of autism exhibits altered cortical progenitor proliferation and brain cytoarchitecture linked to the ERK MAPK pathway. The Journal of neuroscience : the official journal of the Society for Neuroscience. 2015;35(7):3190-200. doi: 10.1523/JNEUROSCI.4864-13.2015. PubMed PMID: 25698753. 22. Hallmayer J, Cleveland S, Torres A, Phillips J, Cohen B, Torigoe T, Miller J, Fedele A, Collins J, Smith K, Lotspeich L, Croen LA, Ozonoff S, Lajonchere C, Grether JK, Risch N. Genetic heritability and shared environmental factors among twin pairs with autism. Archives of general psychiatry. 2011;68(11):1095-102. doi: 10.1001/archgenpsychiatry.2011.76. PubMed PMID: 21727249; PubMed Central PMCID: PMC4440679. 23. Stromland K, Nordin V, Miller M, Akerstrom B, Gillberg C. Autism in thalidomide embryopathy: a population study. Developmental medicine and child neurology. 1994;36(4):351-6. PubMed PMID: 8157157. 24. Wong H, Hoeffer C. Maternal IL-17A in autism. Experimental neurology. 2017. doi: 10.1016/j.expneurol.2017.04.010. PubMed PMID: 28455196. 25. Kalkbrenner AE, Schmidt RJ, Penlesky AC. Environmental chemical exposures and autism spectrum disorders: a review of the epidemiological evidence. Current problems in pediatric and adolescent health care. 2014;44(10):277-318. doi: 10.1016/j.cppeds.2014.06.001. PubMed PMID: 25199954; PubMed Central PMCID: PMC4855851. 26. Landrigan PJ. What causes autism? Exploring the environmental contribution. Current opinion in pediatrics. 2010;22(2):219-25. doi: 10.1097/MOP.0b013e328336eb9a. PubMed PMID: 20087185. 27. Choi GB, Yim YS, Wong H, Kim S, Kim H, Kim SV, Hoeffer CA, Littman DR, Huh JR. The maternal interleukin-17a pathway in mice promotes autism-like phenotypes in offspring. Science. 2016;351(6276):933-9. doi: 10.1126/science.aad0314. PubMed PMID: 26822608; PubMed Central PMCID: PMC4782964. 28. Kim YS, Leventhal BL. Genetic epidemiology and insights into interactive genetic and environmental effects in autism spectrum disorders. Biological psychiatry. 2015;77(1):66-74. doi: 10.1016/j.biopsych.2014.11.001. PubMed PMID: 25483344; PubMed Central PMCID: PMC4260177. 29. Christensen J, Gronborg TK, Sorensen MJ, Schendel D, Parner ET, Pedersen LH, Vestergaard M. Prenatal valproate exposure and risk of autism spectrum disorders and childhood autism. JAMA : the journal of the American Medical Association. 2013;309(16):1696-703. doi: 10.1001/jama.2013.2270. PubMed PMID: 23613074.
139
30. Phiel CJ, Zhang F, Huang EY, Guenther MG, Lazar MA, Klein PS. Histone deacetylase is a direct target of valproic acid, a potent anticonvulsant, mood stabilizer, and teratogen. The Journal of biological chemistry. 2001;276(39):36734-41. doi: 10.1074/jbc.M101287200. PubMed PMID: 11473107. 31. Sacco R, Gabriele S, Persico AM. Head circumference and brain size in autism spectrum disorder: A systematic review and meta-analysis. Psychiatry research. 2015;234(2):239-51. doi: 10.1016/j.pscychresns.2015.08.016. PubMed PMID: 26456415. 32. Courchesne E, Carper R, Akshoomoff N. Evidence of brain overgrowth in the first year of life in autism. JAMA : the journal of the American Medical Association. 2003;290(3):337-44. doi: 10.1001/jama.290.3.337. PubMed PMID: 12865374. 33. Courchesne E, Pierce K. Brain overgrowth in autism during a critical time in development: implications for frontal pyramidal neuron and interneuron development and connectivity. International journal of developmental neuroscience : the official journal of the International Society for Developmental Neuroscience. 2005;23(2-3):153-70. doi: 10.1016/j.ijdevneu.2005.01.003. PubMed PMID: 15749242. 34. Libero LE, Nordahl CW, Li DD, Ferrer E, Rogers SJ, Amaral DG. Persistence of megalencephaly in a subgroup of young boys with autism spectrum disorder. Autism research : official journal of the International Society for Autism Research. 2016;9(11):1169-82. doi: 10.1002/aur.1643. PubMed PMID: 27273931; PubMed Central PMCID: PMC5292980. 35. Hazlett HC, Poe MD, Lightbody AA, Styner M, MacFall JR, Reiss AL, Piven J. Trajectories of early brain volume development in fragile X syndrome and autism. Journal of the American Academy of Child and Adolescent Psychiatry. 2012;51(9):921-33. doi: 10.1016/j.jaac.2012.07.003. PubMed PMID: 22917205; PubMed Central PMCID: PMC3428739. 36. Hazlett HC, Gu H, Munsell BC, Kim SH, Styner M, Wolff JJ, Elison JT, Swanson MR, Zhu H, Botteron KN, Collins DL, Constantino JN, Dager SR, Estes AM, Evans AC, Fonov VS, Gerig G, Kostopoulos P, McKinstry RC, Pandey J, Paterson S, Pruett JR, Schultz RT, Shaw DW, Zwaigenbaum L, Piven J, Network I, Clinical S, Data Coordinating C, Image Processing C, Statistical A. Early brain development in infants at high risk for autism spectrum disorder. Nature. 2017;542(7641):348-51. doi: 10.1038/nature21369. PubMed PMID: 28202961; PubMed Central PMCID: PMC5336143. 37. Amaral DG, Li D, Libero L, Solomon M, Van de Water J, Mastergeorge A, Naigles L, Rogers S, Wu Nordahl C. In pursuit of neurophenotypes: The consequences of having autism and a big brain. Autism research : official journal of the International Society for Autism Research. 2017;10(5):711-22. doi: 10.1002/aur.1755. PubMed PMID: 28239961; PubMed Central PMCID: PMC5520638. 38. Schumann CM, Bloss CS, Barnes CC, Wideman GM, Carper RA, Akshoomoff N, Pierce K, Hagler D, Schork N, Lord C, Courchesne E. Longitudinal magnetic resonance imaging study of cortical development through
140
early childhood in autism. The Journal of neuroscience : the official journal of the Society for Neuroscience. 2010;30(12):4419-27. doi: 10.1523/JNEUROSCI.5714-09.2010. PubMed PMID: 20335478; PubMed Central PMCID: PMC2859218. 39. Libero LE, Burge WK, Deshpande HD, Pestilli F, Kana RK. White Matter Diffusion of Major Fiber Tracts Implicated in Autism Spectrum Disorder. Brain connectivity. 2016;6(9):691-9. doi: 10.1089/brain.2016.0442. PubMed PMID: 27555361; PubMed Central PMCID: PMC5105348. 40. Kaushik G, Zarbalis KS. Prenatal Neurogenesis in Autism Spectrum Disorders. Frontiers in chemistry. 2016;4:12. doi: 10.3389/fchem.2016.00012. PubMed PMID: 27014681; PubMed Central PMCID: PMC4791366. 41. Sanders SJ. First glimpses of the neurobiology of autism spectrum disorder. Current opinion in genetics & development. 2015;33:80-92. doi: 10.1016/j.gde.2015.10.002. PubMed PMID: 26547130. 42. Wolff JJ, Swanson MR, Elison JT, Gerig G, Pruett JR, Jr., Styner MA, Vachet C, Botteron KN, Dager SR, Estes AM, Hazlett HC, Schultz RT, Shen MD, Zwaigenbaum L, Piven J, Network I. Neural circuitry at age 6 months associated with later repetitive behavior and sensory responsiveness in autism. Molecular autism. 2017;8:8. doi: 10.1186/s13229-017-0126-z. PubMed PMID: 28316772; PubMed Central PMCID: PMC5351210. 43. Casanova MF. Neuropathological and genetic findings in autism: the significance of a putative minicolumnopathy. The Neuroscientist : a review journal bringing neurobiology, neurology and psychiatry. 2006;12(5):435-41. doi: 10.1177/1073858406290375. PubMed PMID: 16957005. 44. Wegiel J, Flory M, Kuchna I, Nowicki K, Ma SY, Imaki H, Wegiel J, Cohen IL, London E, Wisniewski T, Brown WT. Stereological study of the neuronal number and volume of 38 brain subdivisions of subjects diagnosed with autism reveals significant alterations restricted to the striatum, amygdala and cerebellum. Acta neuropathologica communications. 2014;2:141. doi: 10.1186/s40478-014-0141-7. PubMed PMID: 25231243; PubMed Central PMCID: PMC4177256. 45. Courchesne E, Mouton PR, Calhoun ME, Semendeferi K, Ahrens-Barbeau C, Hallet MJ, Barnes CC, Pierce K. Neuron number and size in prefrontal cortex of children with autism. JAMA : the journal of the American Medical Association. 2011;306(18):2001-10. doi: 10.1001/jama.2011.1638. PubMed PMID: 22068992. 46. Wegiel J, Flory M, Kuchna I, Nowicki K, Ma SY, Imaki H, Wegiel J, Cohen IL, London E, Brown WT, Wisniewski T. Brain-region-specific alterations of the trajectories of neuronal volume growth throughout the lifespan in autism. Acta neuropathologica communications. 2014;2:28. doi: 10.1186/2051-5960-2-28. PubMed PMID: 24612906; PubMed Central PMCID: PMC4007529. 47. Wegiel J, Kuchna I, Nowicki K, Imaki H, Wegiel J, Marchi E, Ma SY, Chauhan A, Chauhan V, Bobrowicz TW, de Leon M, Louis LA, Cohen IL, London E, Brown WT, Wisniewski T. The neuropathology of autism: defects of neurogenesis and neuronal migration, and dysplastic changes. Acta neuropathologica. 2010;119(6):755-70. doi: 10.1007/s00401-010-0655-4. PubMed PMID: 20198484; PubMed Central PMCID: PMC2869041.
141
48. Amaral DG, Schumann CM, Nordahl CW. Neuroanatomy of autism. Trends in neurosciences. 2008;31(3):137-45. doi: 10.1016/j.tins.2007.12.005. PubMed PMID: 18258309. 49. Scott JA, Schumann CM, Goodlin-Jones BL, Amaral DG. A comprehensive volumetric analysis of the cerebellum in children and adolescents with autism spectrum disorder. Autism research : official journal of the International Society for Autism Research. 2009;2(5):246-57. doi: 10.1002/aur.97. PubMed PMID: 19885834; PubMed Central PMCID: PMC2999464. 50. Kanner L. Autistic disturbances of affective contact. Acta paedopsychiatrica. 1968;35(4):100-36. PubMed PMID: 4880460. 51. Spence SJ, Schneider MT. The role of epilepsy and epileptiform EEGs in autism spectrum disorders. Pediatric research. 2009;65(6):599-606. doi: 10.1203/PDR.0b013e31819e7168. PubMed PMID: 19454962; PubMed Central PMCID: PMC2692092. 52. Chomiak T, Turner N, Hu B. What We Have Learned about Autism Spectrum Disorder from Valproic Acid. Pathology research international. 2013;2013:712758. doi: 10.1155/2013/712758. PubMed PMID: 24381784; PubMed Central PMCID: PMC3871912. 53. Rausch A, Zhang W, Haak KV, Mennes M, Hermans EJ, van Oort E, van Wingen G, Beckmann CF, Buitelaar JK, Groen WB. Altered functional connectivity of the amygdaloid input nuclei in adolescents and young adults with autism spectrum disorder: a resting state fMRI study. Molecular autism. 2016;7:13. doi: 10.1186/s13229-015-0060-x. PubMed PMID: 26823966; PubMed Central PMCID: PMC4730628. 54. Caviness VS, Jr., Takahashi T, Nowakowski RS. Numbers, time and neocortical neuronogenesis: a general developmental and evolutionary model. Trends in neurosciences. 1995;18(9):379-83. PubMed PMID: 7482802. 55. Englund C, Fink A, Lau C, Pham D, Daza RA, Bulfone A, Kowalczyk T, Hevner RF. Pax6, Tbr2, and Tbr1 are expressed sequentially by radial glia, intermediate progenitor cells, and postmitotic neurons in developing neocortex. The Journal of neuroscience : the official journal of the Society for Neuroscience. 2005;25(1):247-51. doi: 10.1523/JNEUROSCI.2899-04.2005. PubMed PMID: 15634788. 56. Noctor SC, Martinez-Cerdeno V, Ivic L, Kriegstein AR. Cortical neurons arise in symmetric and asymmetric division zones and migrate through specific phases. Nature neuroscience. 2004;7(2):136-44. doi: 10.1038/nn1172. PubMed PMID: 14703572. 57. Sansom SN, Griffiths DS, Faedo A, Kleinjan DJ, Ruan Y, Smith J, van Heyningen V, Rubenstein JL, Livesey FJ. The level of the transcription factor Pax6 is essential for controlling the balance between neural stem cell self-renewal and neurogenesis. PLoS genetics. 2009;5(6):e1000511. doi: 10.1371/journal.pgen.1000511. PubMed PMID: 19521500; PubMed Central PMCID: PMC2686252. 58. Sessa A, Mao CA, Colasante G, Nini A, Klein WH, Broccoli V. Tbr2-positive intermediate (basal) neuronal progenitors safeguard cerebral cortex
142
expansion by controlling amplification of pallial glutamatergic neurons and attraction of subpallial GABAergic interneurons. Genes & development. 2010;24(16):1816-26. doi: 10.1101/gad.575410. PubMed PMID: 20713522; PubMed Central PMCID: PMC2922508. 59. Vermeulen K, Van Bockstaele DR, Berneman ZN. The cell cycle: a review of regulation, deregulation and therapeutic targets in cancer. Cell proliferation. 2003;36(3):131-49. PubMed PMID: 12814430. 60. Sherr CJ. Mammalian G1 cyclins and cell cycle progression. Proceedings of the Association of American Physicians. 1995;107(2):181-6. PubMed PMID: 8624851. 61. Sherr CJ, Roberts JM. Inhibitors of mammalian G1 cyclin-dependent kinases. Genes & development. 1995;9(10):1149-63. PubMed PMID: 7758941. 62. Lavoie JN, L'Allemain G, Brunet A, Muller R, Pouyssegur J. Cyclin D1 expression is regulated positively by the p42/p44MAPK and negatively by the p38/HOGMAPK pathway. The Journal of biological chemistry. 1996;271(34):20608-16. PubMed PMID: 8702807. 63. Pagano M. Cell Cycle Control: Springer Berlin Heidelberg; 2013. 64. Schafer KA. The cell cycle: a review. Veterinary pathology. 1998;35(6):461-78. doi: 10.1177/030098589803500601. PubMed PMID: 9823588. 65. Ohtani K, DeGregori J, Nevins JR. Regulation of the cyclin E gene by transcription factor E2F1. Proceedings of the National Academy of Sciences of the United States of America. 1995;92(26):12146-50. PubMed PMID: 8618861; PubMed Central PMCID: PMC40313. 66. Subramanian M, Timmerman CK, Schwartz JL, Pham DL, Meffert MK. Characterizing autism spectrum disorders by key biochemical pathways. Frontiers in neuroscience. 2015;9:313. doi: 10.3389/fnins.2015.00313. PubMed PMID: 26483618; PubMed Central PMCID: PMC4586332. 67. Kwan V, Unda BK, Singh KK. Wnt signaling networks in autism spectrum disorder and intellectual disability. Journal of neurodevelopmental disorders. 2016;8:45. doi: 10.1186/s11689-016-9176-3. PubMed PMID: 27980692; PubMed Central PMCID: PMCPMC5137220. 68. Sun Y, Liu WZ, Liu T, Feng X, Yang N, Zhou HF. Signaling pathway of MAPK/ERK in cell proliferation, differentiation, migration, senescence and apoptosis. J Recept Signal Transduct Res. 2015;35(6):600-4. doi: 10.3109/10799893.2015.1030412. PubMed PMID: 26096166. 69. Seger R, Krebs EG. The MAPK signaling cascade. FASEB journal : official publication of the Federation of American Societies for Experimental Biology. 1995;9(9):726-35. PubMed PMID: 7601337. 70. Roux PP, Blenis J. ERK and p38 MAPK-activated protein kinases: a family of protein kinases with diverse biological functions. Microbiol Mol Biol Rev. 2004;68(2):320-44. doi: 10.1128/MMBR.68.2.320-344.2004. PubMed PMID: 15187187; PubMed Central PMCID: PMCPMC419926. 71. Lillien L, Raphael H. BMP and FGF regulate the development of EGF-responsive neural progenitor cells. Development. 2000;127(22):4993-5005. PubMed PMID: 11044412.
143
72. Li Z, Theus MH, Wei L. Role of ERK 1/2 signaling in neuronal differentiation of cultured embryonic stem cells. Dev Growth Differ. 2006;48(8):513-23. doi: 10.1111/j.1440-169X.2006.00889.x. PubMed PMID: 17026715. 73. Duronio RJ, Xiong Y. Signaling pathways that control cell proliferation. Cold Spring Harbor perspectives in biology. 2013;5(3):a008904. doi: 10.1101/cshperspect.a008904. PubMed PMID: 23457258. 74. Lee DY. Roles of mTOR Signaling in Brain Development. Experimental neurobiology. 2015;24(3):177-85. doi: 10.5607/en.2015.24.3.177. PubMed PMID: 26412966; PubMed Central PMCID: PMCPMC4580744. 75. Qin L, Dai X, Yin Y. Valproic acid exposure sequentially activates Wnt and mTOR pathways in rats. Molecular and cellular neurosciences. 2016;75:27-35. doi: 10.1016/j.mcn.2016.06.004. PubMed PMID: 27343825. 76. Dai J, Bercury KK, Macklin WB. Interaction of mTOR and Erk1/2 signaling to regulate oligodendrocyte differentiation. Glia. 2014;62(12):2096-109. doi: 10.1002/glia.22729. PubMed PMID: 25060812; PubMed Central PMCID: PMCPMC4406223. 77. Mendoza MC, Er EE, Blenis J. The Ras-ERK and PI3K-mTOR pathways: cross-talk and compensation. Trends Biochem Sci. 2011;36(6):320-8. doi: 10.1016/j.tibs.2011.03.006. PubMed PMID: 21531565; PubMed Central PMCID: PMCPMC3112285. 78. Rhim JH, Luo X, Gao D, Xu X, Zhou T, Li F, Wang P, Wong ST, Xia X. Cell type-dependent Erk-Akt pathway crosstalk regulates the proliferation of fetal neural progenitor cells. Scientific reports. 2016;6:26547. doi: 10.1038/srep26547. PubMed PMID: 27211495; PubMed Central PMCID: PMCPMC4876380. 79. Toledo EM, Colombres M, Inestrosa NC. Wnt signaling in neuroprotection and stem cell differentiation. Progress in neurobiology. 2008;86(3):281-96. doi: 10.1016/j.pneurobio.2008.08.001. PubMed PMID: 18786602. 80. Jobe EM, McQuate AL, Zhao X. Crosstalk among Epigenetic Pathways Regulates Neurogenesis. Frontiers in neuroscience. 2012;6:59. doi: 10.3389/fnins.2012.00059. PubMed PMID: 22586361; PubMed Central PMCID: PMC3347638. 81. Dokmanovic M, Clarke C, Marks PA. Histone deacetylase inhibitors: overview and perspectives. Mol Cancer Res. 2007;5(10):981-9. doi: 10.1158/1541-7786.MCR-07-0324. PubMed PMID: 17951399. 82. Brunmeir R, Lagger S, Seiser C. Histone deacetylase HDAC1/HDAC2-controlled embryonic development and cell differentiation. The International journal of developmental biology. 2009;53(2-3):275-89. doi: 10.1387/ijdb.082649rb. PubMed PMID: 19412887. 83. Yamaguchi T, Cubizolles F, Zhang Y, Reichert N, Kohler H, Seiser C, Matthias P. Histone deacetylases 1 and 2 act in concert to promote the G1-to-S progression. Genes Dev. 2010;24(5):455-69. doi: 10.1101/gad.552310. PubMed PMID: 20194438; PubMed Central PMCID: PMCPMC2827841. 84. MacDonald JL, Roskams AJ. Histone deacetylases 1 and 2 are expressed at distinct stages of neuro-glial development. Developmental dynamics : an
144
official publication of the American Association of Anatomists. 2008;237(8):2256-67. doi: 10.1002/dvdy.21626. PubMed PMID: 18651664. 85. Kelly RD, Cowley SM. The physiological roles of histone deacetylase (HDAC) 1 and 2: complex co-stars with multiple leading parts. Biochemical Society transactions. 2013;41(3):741-9. doi: 10.1042/BST20130010. PubMed PMID: 23697933. 86. Montgomery RL, Hsieh J, Barbosa AC, Richardson JA, Olson EN. Histone deacetylases 1 and 2 control the progression of neural precursors to neurons during brain development. Proceedings of the National Academy of Sciences of the United States of America. 2009;106(19):7876-81. doi: 10.1073/pnas.0902750106. PubMed PMID: 19380719; PubMed Central PMCID: PMCPMC2683090. 87. Luo RX, Postigo AA, Dean DC. Rb interacts with histone deacetylase to repress transcription. Cell. 1998;92(4):463-73. PubMed PMID: 9491888. 88. Morrison AJ, Sardet C, Herrera RE. Retinoblastoma protein transcriptional repression through histone deacetylation of a single nucleosome. Molecular and cellular biology. 2002;22(3):856-65. PubMed PMID: 11784861; PubMed Central PMCID: PMC133558. 89. Robertson KD, Ait-Si-Ali S, Yokochi T, Wade PA, Jones PL, Wolffe AP. DNMT1 forms a complex with Rb, E2F1 and HDAC1 and represses transcription from E2F-responsive promoters. Nature genetics. 2000;25(3):338-42. doi: 10.1038/77124. PubMed PMID: 10888886. 90. Gurvich N, Tsygankova OM, Meinkoth JL, Klein PS. Histone deacetylase is a target of valproic acid-mediated cellular differentiation. Cancer Res. 2004;64(3):1079-86. PubMed PMID: 14871841. 91. Johannessen CU. Mechanisms of action of valproate: a commentatory. Neurochemistry international. 2000;37(2-3):103-10. PubMed PMID: 10812195. 92. Monti B, Polazzi E, Contestabile A. Biochemical, molecular and epigenetic mechanisms of valproic acid neuroprotection. Current molecular pharmacology. 2009;2(1):95-109. PubMed PMID: 20021450. 93. Meador KJ. Effects of in utero antiepileptic drug exposure. Epilepsy currents / American Epilepsy Society. 2008;8(6):143-7. doi: 10.1111/j.1535-7511.2008.00273.x. PubMed PMID: 19127305; PubMed Central PMCID: PMC2610228. 94. Tomson T, Battino D. Pregnancy and epilepsy: what should we tell our patients? Journal of neurology. 2009;256(6):856-62. doi: 10.1007/s00415-009-5062-1. PubMed PMID: 19252776. 95. McCorry D, Bromley R. Does in utero exposure of antiepileptic drugs lead to failure to reach full cognitive potential? Seizure : the journal of the British Epilepsy Association. 2015;28:51-6. doi: 10.1016/j.seizure.2015.01.019. PubMed PMID: 25819874. 96. Gottlicher M, Minucci S, Zhu P, Kramer OH, Schimpf A, Giavara S, Sleeman JP, Lo Coco F, Nervi C, Pelicci PG, Heinzel T. Valproic acid defines a novel class of HDAC inhibitors inducing differentiation of transformed cells. The EMBO journal. 2001;20(24):6969-78. doi: 10.1093/emboj/20.24.6969. PubMed PMID: 11742974; PubMed Central PMCID: PMC125788.
145
97. Hanson JW, Smith DW. The fetal hydantoin syndrome. The Journal of pediatrics. 1975;87(2):285-90. PubMed PMID: 50428. 98. Robert E, Rosa F. Valproate and birth defects. Lancet. 1983;2(8359):1142. PubMed PMID: 6138672. 99. DiLiberti JH, Farndon PA, Dennis NR, Curry CJ. The fetal valproate syndrome. American journal of medical genetics. 1984;19(3):473-81. doi: 10.1002/ajmg.1320190308. PubMed PMID: 6439041. 100. Stadelmaier R, Nasri H, Deutsch CK, Bauman M, Hunt A, Stodgell CJ, Adams J, Holmes LB. Exposure to Sodium Valproate during Pregnancy: Facial Features and Signs of Autism. Birth defects research. 2017. doi: 10.1002/bdr2.1052. PubMed PMID: 28635121. 101. Adab N, Kini U, Vinten J, Ayres J, Baker G, Clayton-Smith J, Coyle H, Fryer A, Gorry J, Gregg J, Mawer G, Nicolaides P, Pickering L, Tunnicliffe L, Chadwick DW. The longer term outcome of children born to mothers with epilepsy. Journal of neurology, neurosurgery, and psychiatry. 2004;75(11):1575-83. doi: 10.1136/jnnp.2003.029132. PubMed PMID: 15491979; PubMed Central PMCID: PMC1738809. 102. Bromley RL, Baker GA, Meador KJ. Cognitive abilities and behaviour of children exposed to antiepileptic drugs in utero. Current opinion in neurology. 2009;22(2):162-6. doi: 10.1097/WCO.0b013e3283292401. PubMed PMID: 19532040; PubMed Central PMCID: PMC2743524. 103. Williams G, King J, Cunningham M, Stephan M, Kerr B, Hersh JH. Fetal valproate syndrome and autism: additional evidence of an association. Developmental medicine and child neurology. 2001;43(3):202-6. PubMed PMID: 11263692. 104. Moore SJ, Turnpenny P, Quinn A, Glover S, Lloyd DJ, Montgomery T, Dean JC. A clinical study of 57 children with fetal anticonvulsant syndromes. Journal of medical genetics. 2000;37(7):489-97. PubMed PMID: 10882750; PubMed Central PMCID: PMC1734633. 105. Rasalam AD, Hailey H, Williams JH, Moore SJ, Turnpenny PD, Lloyd DJ, Dean JC. Characteristics of fetal anticonvulsant syndrome associated autistic disorder. Developmental medicine and child neurology. 2005;47(8):551-5. PubMed PMID: 16108456. 106. Bromley RL, Mawer GE, Briggs M, Cheyne C, Clayton-Smith J, Garcia-Finana M, Kneen R, Lucas SB, Shallcross R, Baker GA, Liverpool, Manchester Neurodevelopment G. The prevalence of neurodevelopmental disorders in children prenatally exposed to antiepileptic drugs. Journal of neurology, neurosurgery, and psychiatry. 2013;84(6):637-43. doi: 10.1136/jnnp-2012-304270. PubMed PMID: 23370617; PubMed Central PMCID: PMC4115188. 107. Weiss LA, Shen Y, Korn JM, Arking DE, Miller DT, Fossdal R, Saemundsen E, Stefansson H, Ferreira MA, Green T, Platt OS, Ruderfer DM, Walsh CA, Altshuler D, Chakravarti A, Tanzi RE, Stefansson K, Santangelo SL, Gusella JF, Sklar P, Wu BL, Daly MJ, Autism C. Association between microdeletion and microduplication at 16p11.2 and autism. The New England journal of medicine. 2008;358(7):667-75. doi: 10.1056/NEJMoa075974. PubMed PMID: 18184952.
146
108. Shinawi M, Liu P, Kang SH, Shen J, Belmont JW, Scott DA, Probst FJ, Craigen WJ, Graham BH, Pursley A, Clark G, Lee J, Proud M, Stocco A, Rodriguez DL, Kozel BA, Sparagana S, Roeder ER, McGrew SG, Kurczynski TW, Allison LJ, Amato S, Savage S, Patel A, Stankiewicz P, Beaudet AL, Cheung SW, Lupski JR. Recurrent reciprocal 16p11.2 rearrangements associated with global developmental delay, behavioural problems, dysmorphism, epilepsy, and abnormal head size. Journal of medical genetics. 2010;47(5):332-41. doi: 10.1136/jmg.2009.073015. PubMed PMID: 19914906; PubMed Central PMCID: PMCPMC3158566. 109. Golzio C, Willer J, Talkowski ME, Oh EC, Taniguchi Y, Jacquemont S, Reymond A, Sun M, Sawa A, Gusella JF, Kamiya A, Beckmann JS, Katsanis N. KCTD13 is a major driver of mirrored neuroanatomical phenotypes of the 16p11.2 copy number variant. Nature. 2012;485(7398):363-7. doi: 10.1038/nature11091. PubMed PMID: 22596160; PubMed Central PMCID: PMCPMC3366115. 110. Torres F, Barbosa M, Maciel P. Recurrent copy number variations as risk factors for neurodevelopmental disorders: critical overview and analysis of clinical implications. Journal of medical genetics. 2016;53(2):73-90. doi: 10.1136/jmedgenet-2015-103366. PubMed PMID: 26502893. 111. Ernst C. Proliferation and Differentiation Deficits are a Major Convergence Point for Neurodevelopmental Disorders. Trends in neurosciences. 2016;39(5):290-9. doi: 10.1016/j.tins.2016.03.001. PubMed PMID: 27032601. 112. Estes ML, McAllister AK. Maternal immune activation: Implications for neuropsychiatric disorders. Science. 2016;353(6301):772-7. doi: 10.1126/science.aag3194. PubMed PMID: 27540164. 113. Rodier PM, Ingram JL, Tisdale B, Croog VJ. Linking etiologies in humans and animal models: studies of autism. Reproductive toxicology. 1997;11(2-3):417-22. PubMed PMID: 9100317. 114. Rodier PM, Ingram JL, Tisdale B, Nelson S, Romano J. Embryological origin for autism: developmental anomalies of the cranial nerve motor nuclei. The Journal of comparative neurology. 1996;370(2):247-61. doi: 10.1002/(SICI)1096-9861(19960624)370:2<247::AID-CNE8>3.0.CO;2-2. PubMed PMID: 8808733. 115. Nicolini C, Fahnestock M. The valproic acid-induced rodent model of autism. Experimental neurology. 2017. doi: 10.1016/j.expneurol.2017.04.017. PubMed PMID: 28472621. 116. Wang Z, Xu L, Zhu X, Cui W, Sun Y, Nishijo H, Peng Y, Li R. Demethylation of specific Wnt/beta-catenin pathway genes and its upregulation in rat brain induced by prenatal valproate exposure. Anatomical record. 2010;293(11):1947-53. doi: 10.1002/ar.21232. PubMed PMID: 20734317. 117. Go HS, Seo JE, Kim KC, Han SM, Kim P, Kang YS, Han SH, Shin CY, Ko KH. Valproic acid inhibits neural progenitor cell death by activation of NF-kappaB signaling pathway and up-regulation of Bcl-XL. Journal of biomedical science. 2011;18(1):48. doi: 10.1186/1423-0127-18-48. PubMed PMID: 21722408; PubMed Central PMCID: PMC3158748.
147
118. Go HS, Kim KC, Choi CS, Jeon SJ, Kwon KJ, Han SH, Lee J, Cheong JH, Ryu JH, Kim CH, Ko KH, Shin CY. Prenatal exposure to valproic acid increases the neural progenitor cell pool and induces macrocephaly in rat brain via a mechanism involving the GSK-3beta/beta-catenin pathway. Neuropharmacology. 2012;63(6):1028-41. doi: 10.1016/j.neuropharm.2012.07.028. PubMed PMID: 22841957. 119. Lee HJ, Dreyfus C, DiCicco-Bloom E. Valproic acid stimulates proliferation of glial precursors during cortical gliogenesis in developing rat. Developmental neurobiology. 2016;76(7):780-98. doi: 10.1002/dneu.22359. PubMed PMID: 26505176. 120. Mony TJ, Lee JW, Dreyfus C, DiCicco-Bloom E, Lee HJ. Valproic Acid Exposure during Early Postnatal Gliogenesis Leads to Autistic-like Behaviors in Rats. Clin Psychopharmacol Neurosci. 2016;14(4):338-44. doi: 10.9758/cpn.2016.14.4.338. PubMed PMID: 27776385; PubMed Central PMCID: PMCPMC5083944. 121. Fujimura K, Mitsuhashi T, Shibata S, Shimozato S, Takahashi T. In Utero Exposure to Valproic Acid Induces Neocortical Dysgenesis via Dysregulation of Neural Progenitor Cell Proliferation/Differentiation. The Journal of neuroscience : the official journal of the Society for Neuroscience. 2016;36(42):10908-19. doi: 10.1523/JNEUROSCI.0229-16.2016. PubMed PMID: 27798144. 122. Jung GA, Yoon JY, Moon BS, Yang DH, Kim HY, Lee SH, Bryja V, Arenas E, Choi KY. Valproic acid induces differentiation and inhibition of proliferation in neural progenitor cells via the beta-catenin-Ras-ERK-p21Cip/WAF1 pathway. BMC cell biology. 2008;9:66. doi: 10.1186/1471-2121-9-66. PubMed PMID: 19068119; PubMed Central PMCID: PMC2639384. 123. Kataoka S, Takuma K, Hara Y, Maeda Y, Ago Y, Matsuda T. Autism-like behaviours with transient histone hyperacetylation in mice treated prenatally with valproic acid. Int J Neuropsychopharmacol. 2013;16(1):91-103. doi: 10.1017/S1461145711001714. PubMed PMID: 22093185. 124. Wang L, Liu Y, Li S, Long ZY, Wu YM. Wnt signaling pathway participates in valproic acid-induced neuronal differentiation of neural stem cells. International journal of clinical and experimental pathology. 2015;8(1):578-85. PubMed PMID: 25755748; PubMed Central PMCID: PMC4348902. 125. Favre MR, Barkat TR, Lamendola D, Khazen G, Markram H, Markram K. General developmental health in the VPA-rat model of autism. Frontiers in behavioral neuroscience. 2013;7:88. doi: 10.3389/fnbeh.2013.00088. PubMed PMID: 23898245; PubMed Central PMCID: PMC3721005. 126. Fujiki R, Sato A, Fujitani M, Yamashita T. A proapoptotic effect of valproic acid on progenitors of embryonic stem cell-derived glutamatergic neurons. Cell death & disease. 2013;4:e677. doi: 10.1038/cddis.2013.205. PubMed PMID: 23788034; PubMed Central PMCID: PMC3702299. 127. Kim KC, Lee DK, Go HS, Kim P, Choi CS, Kim JW, Jeon SJ, Song MR, Shin CY. Pax6-dependent cortical glutamatergic neuronal differentiation regulates autism-like behavior in prenatally valproic acid-exposed rat offspring. Molecular neurobiology. 2014;49(1):512-28. doi: 10.1007/s12035-013-8535-2. PubMed PMID: 24030726.
148
128. Fukuchi M, Nii T, Ishimaru N, Minamino A, Hara D, Takasaki I, Tabuchi A, Tsuda M. Valproic acid induces up- or down-regulation of gene expression responsible for the neuronal excitation and inhibition in rat cortical neurons through its epigenetic actions. Neuroscience research. 2009;65(1):35-43. doi: 10.1016/j.neures.2009.05.002. PubMed PMID: 19463867. 129. Hevner RF, Hodge RD, Daza RA, Englund C. Transcription factors in glutamatergic neurogenesis: conserved programs in neocortex, cerebellum, and adult hippocampus. Neuroscience research. 2006;55(3):223-33. doi: 10.1016/j.neures.2006.03.004. PubMed PMID: 16621079. 130. Marinova Z, Leng Y, Leeds P, Chuang DM. Histone deacetylase inhibition alters histone methylation associated with heat shock protein 70 promoter modifications in astrocytes and neurons. Neuropharmacology. 2011;60(7-8):1109-15. doi: 10.1016/j.neuropharm.2010.09.022. PubMed PMID: 20888352; PubMed Central PMCID: PMC3036778. 131. Marinova Z, Ren M, Wendland JR, Leng Y, Liang MH, Yasuda S, Leeds P, Chuang DM. Valproic acid induces functional heat-shock protein 70 via Class I histone deacetylase inhibition in cortical neurons: a potential role of Sp1 acetylation. Journal of neurochemistry. 2009;111(4):976-87. doi: 10.1111/j.1471-4159.2009.06385.x. PubMed PMID: 19765194; PubMed Central PMCID: PMC2766424. 132. Yasuda S, Liang MH, Marinova Z, Yahyavi A, Chuang DM. The mood stabilizers lithium and valproate selectively activate the promoter IV of brain-derived neurotrophic factor in neurons. Molecular psychiatry. 2009;14(1):51-9. doi: 10.1038/sj.mp.4002099. PubMed PMID: 17925795. 133. Dolmetsch R, Geschwind DH. The human brain in a dish: the promise of iPSC-derived neurons. Cell. 2011;145(6):831-4. doi: 10.1016/j.cell.2011.05.034. PubMed PMID: 21663789; PubMed Central PMCID: PMCPMC3691069. 134. Bilic J, Izpisua Belmonte JC. Concise review: Induced pluripotent stem cells versus embryonic stem cells: close enough or yet too far apart? Stem cells. 2012;30(1):33-41. doi: 10.1002/stem.700. PubMed PMID: 22213481. 135. Pasca SP, Panagiotakos G, Dolmetsch RE. Generating human neurons in vitro and using them to understand neuropsychiatric disease. Annual review of neuroscience. 2014;37:479-501. doi: 10.1146/annurev-neuro-062012-170328. PubMed PMID: 25002278. 136. Marchetto MC, Carromeu C, Acab A, Yu D, Yeo GW, Mu Y, Chen G, Gage FH, Muotri AR. A model for neural development and treatment of Rett syndrome using human induced pluripotent stem cells. Cell. 2010;143(4):527-39. doi: 10.1016/j.cell.2010.10.016. PubMed PMID: 21074045; PubMed Central PMCID: PMC3003590. 137. Sheridan SD, Theriault KM, Reis SA, Zhou F, Madison JM, Daheron L, Loring JF, Haggarty SJ. Epigenetic characterization of the FMR1 gene and aberrant neurodevelopment in human induced pluripotent stem cell models of fragile X syndrome. PloS one. 2011;6(10):e26203. doi: 10.1371/journal.pone.0026203. PubMed PMID: 22022567; PubMed Central PMCID: PMCPMC3192166.
149
138. Marchetto MC, Belinson H, Tian Y, Freitas BC, Fu C, Vadodaria KC, Beltrao-Braga PC, Trujillo CA, Mendes AP, Padmanabhan K, Nunez Y, Ou J, Ghosh H, Wright R, Brennand KJ, Pierce K, Eichenfield L, Pramparo T, Eyler LT, Barnes CC, Courchesne E, Geschwind DH, Gage FH, Wynshaw-Boris A, Muotri AR. Altered proliferation and networks in neural cells derived from idiopathic autistic individuals. Molecular psychiatry. 2016. doi: 10.1038/mp.2016.95. PubMed PMID: 27378147. 139. Pasca SP, Portmann T, Voineagu I, Yazawa M, Shcheglovitov A, Pasca AM, Cord B, Palmer TD, Chikahisa S, Nishino S, Bernstein JA, Hallmayer J, Geschwind DH, Dolmetsch RE. Using iPSC-derived neurons to uncover cellular phenotypes associated with Timothy syndrome. Nat Med. 2011;17(12):1657-62. doi: 10.1038/nm.2576. PubMed PMID: 22120178; PubMed Central PMCID: PMC3517299. 140. Chen HM, DeLong CJ, Bame M, Rajapakse I, Herron TJ, McInnis MG, O'Shea KS. Transcripts involved in calcium signaling and telencephalic neuronal fate are altered in induced pluripotent stem cells from bipolar disorder patients. Translational psychiatry. 2014;4:e375. doi: 10.1038/tp.2014.12. 141. Stern S, Santos R, Marchetto MC, Mendes AP, Rouleau GA, Biesmans S, Wang QW, Yao J, Charnay P, Bang AG, Alda M, Gage FH. Neurons derived from patients with bipolar disorder divide into intrinsically different sub-populations of neurons, predicting the patients' responsiveness to lithium. Molecular psychiatry. 2017. doi: 10.1038/mp.2016.260. PubMed PMID: 28242870. 142. Brennand K, Savas JN, Kim Y, Tran N, Simone A, Hashimoto-Torii K, Beaumont KG, Kim HJ, Topol A, Ladran I, Abdelrahim M, Matikainen-Ankney B, Chao SH, Mrksich M, Rakic P, Fang G, Zhang B, Yates JR, 3rd, Gage FH. Phenotypic differences in hiPSC NPCs derived from patients with schizophrenia. Molecular psychiatry. 2015;20(3):361-8. doi: 10.1038/mp.2014.22. PubMed PMID: 24686136; PubMed Central PMCID: PMC4182344. 143. Topol A, Zhu S, Tran N, Simone A, Fang G, Brennand KJ. Altered WNT Signaling in Human Induced Pluripotent Stem Cell Neural Progenitor Cells Derived from Four Schizophrenia Patients. Biological psychiatry. 2015;78(6):e29-34. doi: 10.1016/j.biopsych.2014.12.028. PubMed PMID: 25708228; PubMed Central PMCID: PMCPMC4520784. 144. Handel AE, Chintawar S, Lalic T, Whiteley E, Vowles J, Giustacchini A, Argoud K, Sopp P, Nakanishi M, Bowden R, Cowley S, Newey S, Akerman C, Ponting CP, Cader MZ. Assessing similarity to primary tissue and cortical layer identity in induced pluripotent stem cell-derived cortical neurons through single-cell transcriptomics. Human molecular genetics. 2016;25(5):989-1000. doi: 10.1093/hmg/ddv637. PubMed PMID: 26740550; PubMed Central PMCID: PMCPMC4754051. 145. Camp JG, Badsha F, Florio M, Kanton S, Gerber T, Wilsch-Brauninger M, Lewitus E, Sykes A, Hevers W, Lancaster M, Knoblich JA, Lachmann R, Paabo S, Huttner WB, Treutlein B. Human cerebral organoids recapitulate gene expression programs of fetal neocortex development. Proceedings of the National Academy of Sciences of the United States of America.
150
2015;112(51):15672-7. doi: 10.1073/pnas.1520760112. PubMed PMID: 26644564; PubMed Central PMCID: PMCPMC4697386. 146. Lu N, DiCicco-Bloom E. Pituitary adenylate cyclase-activating polypeptide is an autocrine inhibitor of mitosis in cultured cortical precursor cells. Proceedings of the National Academy of Sciences of the United States of America. 1997;94(7):3357-62. PubMed PMID: 9096398; PubMed Central PMCID: PMC20374. 147. Mairet-Coello G, Tury A, DiCicco-Bloom E. Insulin-like growth factor-1 promotes G(1)/S cell cycle progression through bidirectional regulation of cyclins and cyclin-dependent kinase inhibitors via the phosphatidylinositol 3-kinase/Akt pathway in developing rat cerebral cortex. The Journal of neuroscience : the official journal of the Society for Neuroscience. 2009;29(3):775-88. doi: 10.1523/JNEUROSCI.1700-08.2009. PubMed PMID: 19158303; PubMed Central PMCID: PMC3256126. 148. Burke K, Cheng Y, Li B, Petrov A, Joshi P, Berman RF, Reuhl KR, DiCicco-Bloom E. Methylmercury elicits rapid inhibition of cell proliferation in the developing brain and decreases cell cycle regulator, cyclin E. Neurotoxicology. 2006;27(6):970-81. doi: 10.1016/j.neuro.2006.09.001. PubMed PMID: 17056119; PubMed Central PMCID: PMC2013736. 149. Yan Y, Zhou X, Pan Z, Ma J, Waschek JA, DiCicco-Bloom E. Pro- and anti-mitogenic actions of pituitary adenylate cyclase-activating polypeptide in developing cerebral cortex: potential mediation by developmental switch of PAC1 receptor mRNA isoforms. The Journal of neuroscience : the official journal of the Society for Neuroscience. 2013;33(9):3865-78. doi: 10.1523/JNEUROSCI.1062-12.2013. PubMed PMID: 23447598; PubMed Central PMCID: PMC3652328. 150. DiCicco-Bloom E, Friedman WJ, Black IB. NT-3 stimulates sympathetic neuroblast proliferation by promoting precursor survival. Neuron. 1993;11(6):1101-11. PubMed PMID: 7903858. 151. Li B, DiCicco-Bloom E. Basic fibroblast growth factor exhibits dual and rapid regulation of cyclin D1 and p27 to stimulate proliferation of rat cerebral cortical precursors. Developmental neuroscience. 2004;26(2-4):197-207. doi: 10.1159/000082137. PubMed PMID: 15711060. 152. Carey RG, Li B, DiCicco-Bloom E. Pituitary adenylate cyclase activating polypeptide anti-mitogenic signaling in cerebral cortical progenitors is regulated by p57Kip2-dependent CDK2 activity. The Journal of neuroscience : the official journal of the Society for Neuroscience. 2002;22(5):1583-91. PubMed PMID: 11880488. 153. Mairet-Coello G, Tury A, Van Buskirk E, Robinson K, Genestine M, DiCicco-Bloom E. p57(KIP2) regulates radial glia and intermediate precursor cell cycle dynamics and lower layer neurogenesis in developing cerebral cortex. Development. 2012;139(3):475-87. doi: 10.1242/dev.067314. PubMed PMID: 22223678; PubMed Central PMCID: PMC3252351. 154. Tao Y, Black IB, DiCicco-Bloom E. Neurogenesis in neonatal rat brain is regulated by peripheral injection of basic fibroblast growth factor (bFGF). The Journal of comparative neurology. 1996;376(4):653-63. doi: 10.1002/(SICI)1096-
151
9861(19961223)376:4<653::AID-CNE11>3.0.CO;2-N. PubMed PMID: 8978476. 155. Wagner GC, Reuhl KR, Cheh M, McRae P, Halladay AK. A new neurobehavioral model of autism in mice: pre- and postnatal exposure to sodium valproate. Journal of autism and developmental disorders. 2006;36(6):779-93. doi: 10.1007/s10803-006-0117-y. PubMed PMID: 16609825. 156. Maity A, McKenna WG, Muschel RJ. Cyclin A message stability varies with the cell cycle. Cell growth & differentiation : the molecular biology journal of the American Association for Cancer Research. 1997;8(3):311-8. PubMed PMID: 9056673. 157. Manuel M, Price DJ. Role of Pax6 in forebrain regionalization. Brain Res Bull. 2005;66(4-6):387-93. doi: 10.1016/j.brainresbull.2005.02.006. PubMed PMID: 16144620. 158. Manuel M, Georgala PA, Carr CB, Chanas S, Kleinjan DA, Martynoga B, Mason JO, Molinek M, Pinson J, Pratt T, Quinn JC, Simpson TI, Tyas DA, van Heyningen V, West JD, Price DJ. Controlled overexpression of Pax6 in vivo negatively autoregulates the Pax6 locus, causing cell-autonomous defects of late cortical progenitor proliferation with little effect on cortical arealization. Development. 2007;134(3):545-55. doi: 10.1242/dev.02764. PubMed PMID: 17202185; PubMed Central PMCID: PMCPMC2386558. 159. Talamillo A, Quinn JC, Collinson JM, Caric D, Price DJ, West JD, Hill RE. Pax6 regulates regional development and neuronal migration in the cerebral cortex. Developmental biology. 2003;255(1):151-63. PubMed PMID: 12618140. 160. Elsen GE, Hodge RD, Bedogni F, Daza RA, Nelson BR, Shiba N, Reiner SL, Hevner RF. The protomap is propagated to cortical plate neurons through an Eomes-dependent intermediate map. Proceedings of the National Academy of Sciences of the United States of America. 2013;110(10):4081-6. doi: 10.1073/pnas.1209076110. PubMed PMID: 23431145; PubMed Central PMCID: PMCPMC3593833. 161. Arnold SJ, Huang GJ, Cheung AF, Era T, Nishikawa S, Bikoff EK, Molnar Z, Robertson EJ, Groszer M. The T-box transcription factor Eomes/Tbr2 regulates neurogenesis in the cortical subventricular zone. Genes Dev. 2008;22(18):2479-84. doi: 10.1101/gad.475408. PubMed PMID: 18794345; PubMed Central PMCID: PMCPMC2546697. 162. Steinman KJ, Spence SJ, Ramocki MB, Proud MB, Kessler SK, Marco EJ, Green Snyder L, D'Angelo D, Chen Q, Chung WK, Sherr EH, Simons VIPC. 16p11.2 deletion and duplication: Characterizing neurologic phenotypes in a large clinically ascertained cohort. American journal of medical genetics Part A. 2016;170(11):2943-55. doi: 10.1002/ajmg.a.37820. PubMed PMID: 27410714. 163. Marchetto MC, Belinson H, Tian Y, Freitas BC, Fu C, Vadodaria K, Beltrao-Braga P, Trujillo CA, Mendes APD, Padmanabhan K, Nunez Y, Ou J, Ghosh H, Wright R, Brennand K, Pierce K, Eichenfield L, Pramparo T, Eyler L, Barnes CC, Courchesne E, Geschwind DH, Gage FH, Wynshaw-Boris A, Muotri AR. Altered proliferation and networks in neural cells derived from idiopathic autistic individuals. Molecular psychiatry. 2017;22(6):820-35. doi:
152
10.1038/mp.2016.95. PubMed PMID: 27378147; PubMed Central PMCID: PMCPMC5215991. 164. Mariani J, Coppola G, Zhang P, Abyzov A, Provini L, Tomasini L, Amenduni M, Szekely A, Palejev D, Wilson M, Gerstein M, Grigorenko EL, Chawarska K, Pelphrey KA, Howe JR, Vaccarino FM. FOXG1-Dependent Dysregulation of GABA/Glutamate Neuron Differentiation in Autism Spectrum Disorders. Cell. 2015;162(2):375-90. doi: 10.1016/j.cell.2015.06.034. PubMed PMID: 26186191; PubMed Central PMCID: PMCPMC4519016. 165. Nakayama KI, Hatakeyama S, Nakayama K. Regulation of the cell cycle at the G1-S transition by proteolysis of cyclin E and p27Kip1. Biochemical and biophysical research communications. 2001;282(4):853-60. doi: 10.1006/bbrc.2001.4627. PubMed PMID: 11352628. 166. Stacey DW. Cyclin D1 serves as a cell cycle regulatory switch in actively proliferating cells. Curr Opin Cell Biol. 2003;15(2):158-63. PubMed PMID: 12648671. 167. Kim S, Kang JK, Kim YK, Seo DW, Ahn SH, Lee JC, Lee CH, You JS, Cho EJ, Lee HW, Han JW. Histone deacetylase inhibitor apicidin induces cyclin E expression through Sp1 sites. Biochemical and biophysical research communications. 2006;342(4):1168-73. doi: 10.1016/j.bbrc.2006.02.081. PubMed PMID: 16516150. 168. Ocker M, Schneider-Stock R. Histone deacetylase inhibitors: signalling towards p21cip1/waf1. Int J Biochem Cell Biol. 2007;39(7-8):1367-74. doi: 10.1016/j.biocel.2007.03.001. PubMed PMID: 17412634. 169. Hnilicova J, Hozeifi S, Duskova E, Icha J, Tomankova T, Stanek D. Histone deacetylase activity modulates alternative splicing. PloS one. 2011;6(2):e16727. doi: 10.1371/journal.pone.0016727. PubMed PMID: 21311748; PubMed Central PMCID: PMCPMC3032741. 170. Yu IT, Park JY, Kim SH, Lee JS, Kim YS, Son H. Valproic acid promotes neuronal differentiation by induction of proneural factors in association with H4 acetylation. Neuropharmacology. 2009;56(2):473-80. doi: 10.1016/j.neuropharm.2008.09.019. PubMed PMID: 19007798. 171. Zhang HS, Gavin M, Dahiya A, Postigo AA, Ma D, Luo RX, Harbour JW, Dean DC. Exit from G1 and S phase of the cell cycle is regulated by repressor complexes containing HDAC-Rb-hSWI/SNF and Rb-hSWI/SNF. Cell. 2000;101(1):79-89. doi: 10.1016/S0092-8674(00)80625-X. PubMed PMID: 10778858. 172. Telles E, Seto E. Modulation of cell cycle regulators by HDACs. Frontiers in bioscience. 2012;4:831-9. PubMed PMID: 22202094; PubMed Central PMCID: PMC3990255. 173. Zhang Z, Convertini P, Shen M, Xu X, Lemoine F, de la Grange P, Andres DA, Stamm S. Valproic acid causes proteasomal degradation of DICER and influences miRNA expression. PloS one. 2013;8(12):e82895. doi: 10.1371/journal.pone.0082895. PubMed PMID: 24358235; PubMed Central PMCID: PMC3866160. 174. Poddar S, Kesharwani D, Datta M. Histone deacetylase inhibition regulates miR-449a levels in skeletal muscle cells. Epigenetics : official journal of
153
the DNA Methylation Society. 2016;11(8):579-87. doi: 10.1080/15592294.2016.1188247. PubMed PMID: 27184529; PubMed Central PMCID: PMCPMC4990227. 175. Hara Y, Ago Y, Takano E, Hasebe S, Nakazawa T, Hashimoto H, Matsuda T, Takuma K. Prenatal exposure to valproic acid increases miR-132 levels in the mouse embryonic brain. Molecular autism. 2017;8:33. doi: 10.1186/s13229-017-0149-5. PubMed PMID: 28670439; PubMed Central PMCID: PMCPMC5490164. 176. Olde Loohuis NF, Kole K, Glennon JC, Karel P, Van der Borg G, Van Gemert Y, Van den Bosch D, Meinhardt J, Kos A, Shahabipour F, Tiesinga P, van Bokhoven H, Martens GJ, Kaplan BB, Homberg JR, Aschrafi A. Elevated microRNA-181c and microRNA-30d levels in the enlarged amygdala of the valproic acid rat model of autism. Neurobiology of disease. 2015;80:42-53. doi: 10.1016/j.nbd.2015.05.006. PubMed PMID: 25986729. 177. Hui W, Yuntao L, Lun L, WenSheng L, ChaoFeng L, HaiYong H, Yueyang B. MicroRNA-195 inhibits the proliferation of human glioma cells by directly targeting cyclin D1 and cyclin E1. PloS one. 2013;8(1):e54932. doi: 10.1371/journal.pone.0054932. PubMed PMID: 23383003; PubMed Central PMCID: PMCPMC3557299. 178. Campbell DJ, Chang J, Chawarska K. Early generalized overgrowth in autism spectrum disorder: prevalence rates, gender effects, and clinical outcomes. Journal of the American Academy of Child and Adolescent Psychiatry. 2014;53(10):1063-73 e5. doi: 10.1016/j.jaac.2014.07.008. PubMed PMID: 25245350; PubMed Central PMCID: PMCPMC4173120. 179. Samuels IS, Karlo JC, Faruzzi AN, Pickering K, Herrup K, Sweatt JD, Saitta SC, Landreth GE. Deletion of ERK2 mitogen-activated protein kinase identifies its key roles in cortical neurogenesis and cognitive function. The Journal of neuroscience : the official journal of the Society for Neuroscience. 2008;28(27):6983-95. doi: 10.1523/JNEUROSCI.0679-08.2008. PubMed PMID: 18596172; PubMed Central PMCID: PMCPMC4364995. 180. Roux PP, Shahbazian D, Vu H, Holz MK, Cohen MS, Taunton J, Sonenberg N, Blenis J. RAS/ERK signaling promotes site-specific ribosomal protein S6 phosphorylation via RSK and stimulates cap-dependent translation. The Journal of biological chemistry. 2007;282(19):14056-64. doi: 10.1074/jbc.M700906200. PubMed PMID: 17360704; PubMed Central PMCID: PMCPMC3618456. 181. Carriere A, Romeo Y, Acosta-Jaquez HA, Moreau J, Bonneil E, Thibault P, Fingar DC, Roux PP. ERK1/2 phosphorylate Raptor to promote Ras-dependent activation of mTOR complex 1 (mTORC1). The Journal of biological chemistry. 2011;286(1):567-77. doi: 10.1074/jbc.M110.159046. PubMed PMID: 21071439; PubMed Central PMCID: PMCPMC3013016. 182. Aronica E, Boer K, Baybis M, Yu J, Crino P. Co-expression of cyclin D1 and phosphorylated ribosomal S6 proteins in hemimegalencephaly. Acta neuropathologica. 2007;114(3):287-93. doi: 10.1007/s00401-007-0225-6. PubMed PMID: 17483958.
154
183. Bikkavilli RK, Malbon CC. Mitogen-activated protein kinases and Wnt/beta-catenin signaling: Molecular conversations among signaling pathways. Commun Integr Biol. 2009;2(1):46-9. PubMed PMID: 19513264; PubMed Central PMCID: PMCPMC2649302. 184. Arai Y, Pulvers JN, Haffner C, Schilling B, Nusslein I, Calegari F, Huttner WB. Neural stem and progenitor cells shorten S-phase on commitment to neuron production. Nature communications. 2011;2:154. doi: 10.1038/ncomms1155. PubMed PMID: 21224845; PubMed Central PMCID: PMC3105305. 185. Paxinos, G., et al., Atlas of the Developing Rat Nervous System Second Edition. Academic Press 1994. 186. Williams M, Prem S, Zhou X, Matteson P, Yeung L, Lu C.W., Pang Z, Flax J.F., Brzustowicz L, Millonig J.H, DiCicco-Bloom E. Rapid detection of neurodevelopmental phenotypes in human neural precursor cells (NPCs). Journal of Visualized Experiments (JOVE). Accepted with Revisions