262
Autodesk MapGuide ® 2010 Autodesk Official Training Guide May 2009 Enterprise and Studio Essentials

Autodesk MapGuide®
2010
Autodesk Official Training Guide
May 2009
Enterprise and Studio Essentials
©!2009!Autodesk,!Inc.!All!rights!reserved.
Except!as!otherwise!permitted!by!Autodesk,!Inc.,!this!publication,!or!parts!thereof,!may!not!be!reproduced!inany!form,!by!any!method,!for!any!purpose.
Certain!materials!included!in!this!publication!are!reprinted!with!the!permission!of!the!copyright!holder.
Trademarks
The!following!are!registered!trademarks!or!trademarks!of!Autodesk,!Inc.,!in!the!USA!and!other!countries:!3DEC!(design/logo),! 3December,! 3December.com,! 3ds!Max,!ADI,!Algor,!Alias,!Alias! (swirl!design/logo),!AliasStudio,!Alias|Wavefront(design/logo),! ATC,! AUGI,! AutoCAD,! AutoCAD! Learning! Assistance,! AutoCAD! LT,! AutoCAD! Simulator,! AutoCAD! SQLExtension,!AutoCAD! SQL! Interface,!Autodesk,!Autodesk! Envision,!Autodesk! Intent,!Autodesk! Inventor,!Autodesk!Map,Autodesk!MapGuide,!Autodesk!Streamline,!AutoLISP,!AutoSnap,!AutoSketch,!AutoTrack,!Backdraft,!Built!with!ObjectARX(logo),!Burn,!Buzzsaw,!CAiCE,!Can!You!Imagine,!Character!Studio,!Cinestream,!Civil!3D,!Cleaner,!Cleaner!Central,!ClearScale,Colour! Warper,! Combustion,! Communication! Specification,! Constructware,! Content! Explorer,! Create>what’s>Next>(design/logo),! Dancing! Baby! (image),! DesignCenter,! Design! Doctor,! Designer’s! Toolkit,! DesignKids,! DesignProf,DesignServer,!DesignStudio,!Design|Studio! (design/logo),!Design!Web!Format,!Discreet,!DWF,!DWG,!DWG! (logo),!DWGExtreme,!DWG!TrueConvert,!DWG!TrueView,!DXF,!Ecotect,!Exposure,!Extending!the!Design!Team,!Face!Robot,!FBX,!Fempro,Filmbox,!Fire,!Flame,!Flint,!FMDesktop,!Freewheel,!Frost,!GDX!Driver,!Gmax,!Green!Building!Studio,!Heads"up!Design,!Heidi,HumanIK,! IDEA! Server,! i"drop,! ImageModeler,! iMOUT,! Incinerator,! Inferno,! Inventor,! Inventor! LT,! Kaydara,! Kaydara(design/logo),! Kynapse,! Kynogon,! LandXplorer,! Lustre,!Matchmover,!Maya,!Mechanical!Desktop,!Moldflow,!Moonbox,MotionBuilder,!Movimento,!MPA,!MPA! (design/logo),!Moldflow!Plastics!Advisers,!MPI,!Moldflow!Plastics! Insight,!MPX,MPX!(design/logo),!Moldflow!Plastics!Xpert,!Mudbox,!NavisWorks,!ObjectARX,!ObjectDBX,!Open!Reality,!Opticore,!OpticoreOpus,!Pipeplus,!PolarSnap,!PortfolioWall,!Powered!with!Autodesk!Technology,!Productstream,!ProjectPoint,!ProMaterials,RasterDWG,!Reactor,!RealDWG,!Real"time!Roto,!REALVIZ,!Recognize,!Render!Queue,!Retimer,!Reveal,!Revit,!Showcase,ShowMotion,!SketchBook,!Smoke,!Softimage,!Softimage|XSI!(design/logo),!SteeringWheels,!Stitcher,!Stone,!StudioTools,Topobase,!Toxik,!TrustedDWG,!ViewCube,!Visual,!Visual!Construction,!Visual!Drainage,!Visual!Landscape,!Visual!Survey,Visual!Toolbox,!Visual!LISP,!Voice!Reality,!Volo,!Vtour,!Wire,!Wiretap,!WiretapCentral,!XSI,!and!XSI!(design/logo).!
The! following!are! registered! trademarks!or! trademarks!of!Autodesk!Canada!Co.! in! the!USA!and/or!Canada!and!othercountries:!Backburner,!Multi"Master!Editing,!River,!and!Sparks.
All!other!brand!names,!product!names,!or!trademarks!belong!to!their!respective!holders.
Disclaimer
THIS! PUBLICATION! AND! THE! INFORMATION! CONTAINED! HEREIN! IS! MADE! AVAILABLE! BY! AUTODESK,! INC.! “AS! IS.”AUTODESK,!INC.!DISCLAIMS!ALL!WARRANTIES,!EITHER!EXPRESS!OR!IMPLIED,!INCLUDING!BUT!NOT!LIMITED!TO!ANY!IMPLIEDWARRANTIES!OF!MERCHANTABILITY!OR!FITNESS!FOR!A!PARTICULAR!PURPOSE!REGARDING!THESE!MATERIALS.!
Published!by:!Autodesk,!Inc.!111!Mclnnis!Parkway!San!Rafael,!CA!94903,!USA
iii
Contents
Introduction ....................................................................................................... ix
Chapter 1: Introduction to Autodesk MapGuide Enterprise .............................. 1Lesson: Introduction to Autodesk MapGuide Server .......................................... 2
About MapGuide Server ........................................................................... 3About MapGuide Web Server Extensions ................................................. 4About MapGuide Site Administration ....................................................... 6
Lesson: Introduction to Autodesk MapGuide Studio .......................................... 8About Autodesk MapGuide Studio ........................................................... 9Finding Data ............................................................................................ 10Building Layers ........................................................................................ 11Making Maps .......................................................................................... 13Placing Maps on the Internet ................................................................. 15About Viewers ......................................................................................... 18
Lesson: Feature Data Objects ‐ FDO ................................................................. 19About Feature Data Objects ‐ FDO ......................................................... 20FDO Application Programming Interface (API) ........................................ 21
Chapter Summary ............................................................................................. 23
Chapter 2: Autodesk MapGuide Enterprise Server .......................................... 25Lesson: Installation ............................................................................................ 26
Installing MapGuide Enterprise Server for Windows .............................. 29Exercise: Installing Autodesk MapGuide Enterprise Server
and Web Extensions ....................................................................... 31Lesson: Server Configuration ............................................................................ 35
About the Site Administrator .................................................................. 36Exercise: Create New User Groups ......................................................... 41Exercise: Create New Users .................................................................... 43Exercise: Assign Roles ............................................................................. 45Exercise: Create Alias .............................................................................. 47Exercise: Load a Package ......................................................................... 48
Chapter Summary ............................................................................................. 50
iv ■ Contents
Chapter 3: Authoring with Autodesk MapGuide Studio ............................... 51Lesson: Data Connections ............................................................................. 52
About Data Management ................................................................... 53Connecting with FDO Data Sources .................................................... 54About Unmanaged Data Sources ........................................................ 55Using Data Source Preview ................................................................. 56About Feature Joins ............................................................................ 58Exercise: Using Studio to Create Project Folders ................................. 60Exercise: Creating a Data Connection to a Microsoft Access
Database .................................................................................... 62Exercise: Creating a Data Connection to a SHP Folder ........................ 65Exercise: Creating a Join between SHP and ODBC Database ............... 67
Lesson: Data Loading .................................................................................... 69About Data Loading ............................................................................ 70Loading Raster Data ............................................................................ 72Exercise: Load SHP Files with a Load Procedure ................................. 74Exercise: Load Raster Files with a Load Procedure ............................. 77
Lesson: Layers ............................................................................................... 79About Layers ....................................................................................... 80User‐Defined Line Styles and Symbols ................................................ 84Advanced Stylization ........................................................................... 87Exercise: Create a Point Layer from a Database .................................. 92Exercise: Create a Themed Zoning Layer ............................................ 94Exercise: Create a Roads Layer ........................................................... 97Exercise: Create a Layer with Joined Database ................................. 100Exercise: Create an Airphoto Layer ................................................... 103
Lesson: Maps ............................................................................................... 105Create the Map ................................................................................. 106Add Layers ......................................................................................... 107Exercise: Create a New Map ............................................................. 109
Chapter Summary ....................................................................................... 112
Chapter 4: Basic and Flexible Web Layouts ............................................... 113Lesson: Basic Web Layouts ......................................................................... 114
About Web Layouts ........................................................................... 115Exercise: Create a New Web Layout ................................................. 117About Customizing Basic Layouts ..................................................... 120Built‐in Commands ............................................................................ 121Custom Commands ........................................................................... 122Exercise: Customize the Web Layout ................................................ 125

Contents ■ v
Lesson: Flexible Web Layouts ...................................................................... 129About Flexible Web Layouts ............................................................. 130Layout Templates .............................................................................. 131Exercise: Create a Flexible Web Layout ............................................. 133About Toolbars .................................................................................. 136Customizing the Search Component ................................................. 138Creating an Overview Map ............................................................... 141Exercise: Customize the Task Pane .................................................... 143Exercise: Create a Search Component .............................................. 145
Chapter Summary ....................................................................................... 149
Chapter 5: Application Development ......................................................... 151Lesson: Development Language Options .................................................... 152
About Programming Languages ........................................................ 153PHP, ASP.NET, and JSP/Java ............................................................... 154
Lesson: Web Server Extensions API ............................................................ 157About Site Service ............................................................................. 158Resource Service ............................................................................... 159Feature, Mapping, Drawing, and Rendering Services ....................... 162Exercise: Explore the Web Server Extensions API Help ..................... 165
Lesson: FDO, Viewer, and Studio APIs ......................................................... 168FDO API ............................................................................................. 169About the Viewer API ....................................................................... 172About the Studio API ........................................................................ 178
Lesson: Choosing Your Development IDE .................................................... 186IDEs ................................................................................................... 187
Chapter Summary ....................................................................................... 190
Chapter 6: Report Development ................................................................ 191Lesson: Developing Reports ........................................................................ 192
PHP Basic Components ..................................................................... 193PHP Forms and Reports .................................................................... 197Exercise: Create a Web Alias ............................................................. 201Exercise: Create an ODBC Connection to the MS Access
Database .................................................................................. 202Exercise: Create a PHP Report .......................................................... 204
Chapter Summary ....................................................................................... 210
Chapter 7: Scalability ................................................................................. 211Lesson: Server Performance ........................................................................ 212
MapGuide Server Performance ......................................................... 213Configuration for Performance ......................................................... 217

vi ■ Contents
Lesson: Studio Performance ........................................................................ 219Scale Ranges ...................................................................................... 220Generalize Vectors ............................................................................ 221Sub‐sample Raster Images ................................................................ 223AJAX Base Layers for Smooth Navigation .......................................... 224Exercise: Create a Scale Range .......................................................... 226Exercise: Generalize a Layer and Add a Layer to Map ....................... 228
Lesson: Data Performance .......................................................................... 232Index Non‐spatial Data ...................................................................... 233Spatial Index for FDO Data Sources .................................................. 235
Chapter Summary ....................................................................................... 237
Chapter 8: Native Google Earth Support ................................................... 239Lesson: Native Google Earth Support ......................................................... 240
Publish Maps, Layers, and Features to KML ...................................... 241Chapter Summary ....................................................................................... 245
Appendix .................................................................................................... 247

Acknowledgements ■ vii
Acknowledgements
The Autodesk Official Training Guide team wishes to thank everyone who participated in thedevelopment of this project, with special acknowledgement to the authoring contributions and subjectmatter expertise of Gordon Luckett. Gordon Luckett is the founder and president of Arrow Geomatics Inc, a GIS consulting, training, anddevelopment company. Oracle Spatial and Autodesk geospatial product integration is the main focus ofGordon’s consulting and training efforts. Leveraging his experience as an Autodesk Certified Instructor,Autodesk University presenter, and consultant, he continues to develop guides for AutoCAD® Map 3Dand Autodesk MapGuide® Enterprise.

viii ■ Acknowledgements
ix
Introduction
Welcome to the Autodesk MapGuide Enterprise Server and Studio 2010 Essentials Autodesk OfficialTraining Guide, a training guide for use in Authorized Training Center (ATC®) locations, corporatetraining settings, and other classroom settings.
Although this guide is designed for instructor‐led courses, you can also use it for self‐paced learning.The guide encourages self‐learning through the use of the Autodesk MapGuide® Enterprise Server2010 and Autodesk MapGuide® Studio 2010 Help systems. This introduction covers the following topics: ■ Guide objectives■ Prerequisites■ Using this guide■ CD contents■ Installing the exercise data files from the CD■ Notes, tips, and warnings■ Feedback This guide is complementary to the software documentation. For detailed explanations of features andfunctionality, refer to the Help in the software.
Objectives After completing this guide, you will be able to:
■ Describe the MapGuide Enterprise Server and Studio system.■ Install and configure MapGuide Enterprise server on Microsoft Windows.■ Use MapGuide Studio to load data, build layers, create maps, and establish a web layout.■ Create and cusotmize Flexible and Basic web layouts.■ Describe Server, FDO, Viewer, and Studio APIs.■ Connect PHP Reports to a Web Layout.■ Enhance MapGuide Server, Studio, and data performance.■ Describe native Google Earth support.
x ■ Introduction
Prerequisites This guide is designed for the student new to Autodesk MapGuide 2010. It is recommended that you have a working knowledge of: ■ Fundamentals of geographic information systems.■ Microsoft® Windows® XP or Microsoft® Windows® Vista.
Using This Guide The lessons are independent of each other. However, it is recommended that you completethese lessons in the order that they are presented unless you are familiar with the concepts andfunctionality described in those lessons. Each chapter contains: ■ Lessons
Usually two or more lessons in each chapter.■ Exercises
Practical, real‐world examples for you to practice using the functionality you have just learned.Each exercise contains step‐by‐step procedures and graphics to help you complete the exercisesuccessfully.
CD Contents The CD attached to the back cover of this book contains all the data and drawings you need tocomplete the exercises in this guide.
Installing the Exercise Data Files from the CD
To install the data files for the exercises:
1. Insert the courseware CD.
2.
When the setup wizard begins, follow the instructions on screen to install the data. 3.
If the wizard does not start automatically, browse to the root directory of the CD and double‐clicksetup.exe.
Unless you specify a different folder, the exercise files are installed in the following folder:
C:\Projects
After you install the data from the CD, this folder contains all the files necessary to complete eachexercise in this guide.
Introduction ■ xi
Notes, Tips, and Warnings
Throughout this guide, notes, tips, and warnings are called out for special attention.
Notes contain guidelines, constraints, and other explanatory information.
Tips provide information to enhance your productivity.
Warnings provide information about actions that might result in the loss of data, system failures,or other serious consequences.
Feedback We always welcome feedback on Autodesk Official Training Guides. After completing this guide, if youhave suggestions for improvements or if you want to report an error in the book or on the CD, pleasesend your comments to [email protected].

xii ■ Introduction
1
Chapter
1
Introduction to AutodeskMapGuide Enterprise
In this chapter, you review the high‐level key components that make up Autodesk MapGuide®Enterprise. The Autodesk MapGuide® Studio, an integral part of MapGuide Enterprise, is introduced.Feature data objects (FDO) and their associated providers are also introduced. You are introduced toall the components that make up a MapGuide solution.
Objectives After completing this chapter, you will be able to:
■ Describe the key components of Autodesk MapGuide Enterprise.■ Explain the four key processes to publish data to the web with Autodesk MapGuide Studio.■ Explain Feature Data Objects (FDO) and its data providers.
2 ■ Chapter 1: Introduction to Autodesk MapGuide Enterprise
Lesson: Introduction to Autodesk MapGuideLesson: Server
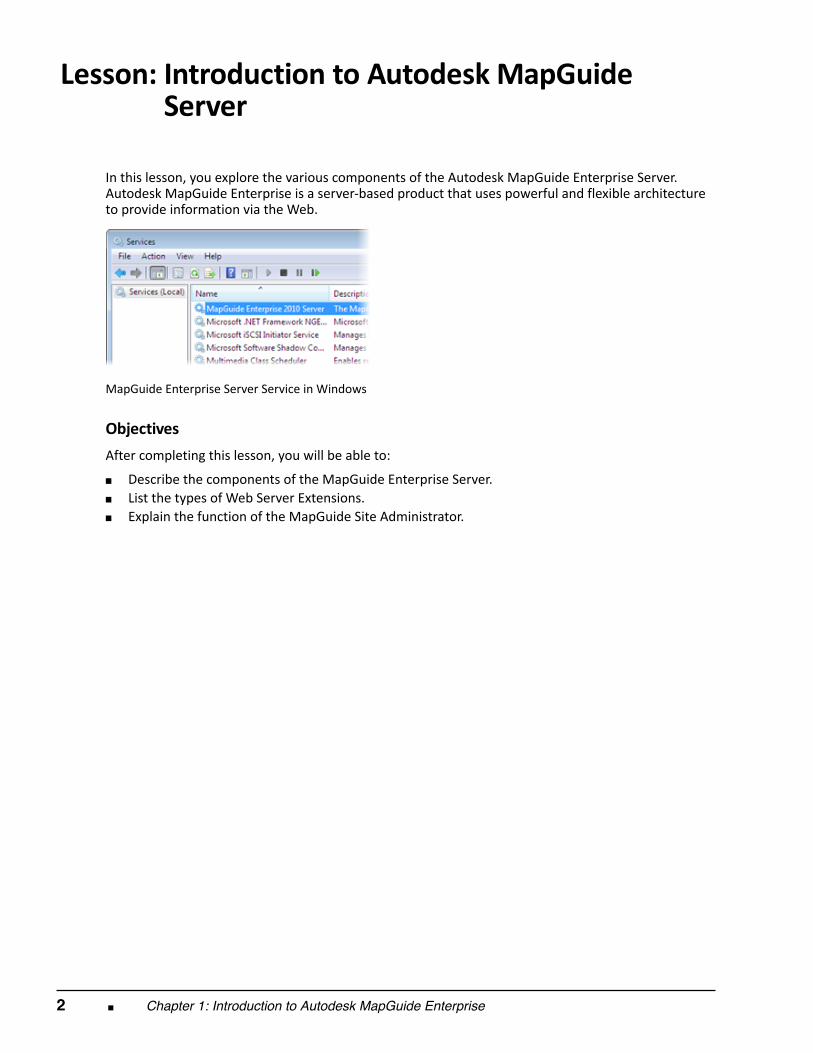
In this lesson, you explore the various components of the Autodesk MapGuide Enterprise Server.Autodesk MapGuide Enterprise is a server‐based product that uses powerful and flexible architectureto provide information via the Web.
MapGuide Enterprise Server Service in Windows
Objectives After completing this lesson, you will be able to:
■ Describe the components of the MapGuide Enterprise Server.■ List the types of Web Server Extensions.■ Explain the function of the MapGuide Site Administrator.
Lesson: Introduction to Autodesk MapGuide Server ■ 3
About MapGuide Server
Autodesk MapGuide Enterprise Server is the primary web engine that hosts the spatial applicationservices. These services enable you to produce maps, combine data, filter information and performGIS analysis within a server‐side environment. It is installed in conjunction with a web server includingApache and Microsoft Internet Information Services (IIS). Autodesk MapGuide Enterprise server has three components: ■ Server Service■ Web Server Extensions■ Site Administrator Windows and Linux Support
Autodesk MapGuide Enterprise can be installed on either Microsoft Windows Server. MapGuide alsosupports Linux Red Hat Enterprise.
Microsoft Windows and Red Hat Linux are supported
Regardless of which operating system is used, Autodesk MapGuide Enterprise can be installed on oneor more physical web servers that can share services.
Microsoft Windows XP or Vista and Autodesk MapGuide Enterprise Autodesk MapGuide Enterprise can run on Microsoft Windows XP Professional orVista for demonstration purposes. XP and Vista are not officially supported but can beused in a training environment with limited users.
There are two ways to access information from Autodesk MapGuide Enterprise: ■ From files stored directly on the Autodesk MapGuide Enterprise Server that is loaded with
MapGuide Studio.■ From data that is linked to the Autodesk MapGuide Enterprise Server with Feature Data Objects
(FDO) connections. The data repositories arestored as XML files that reside on Autodesk MapGuide Enterprise Serverwhere the file‐based GIS files are also stored. These repositories are used by Autodesk MapGuideEnterprise to provide mapping objects. The repositories aremainlycreated and managed in AutodeskMapGuide Enterprise by using Autodesk MapGuide Studio.
4 ■ Chapter 1: Introduction to Autodesk MapGuide Enterprise
MapGuide Web Server Services
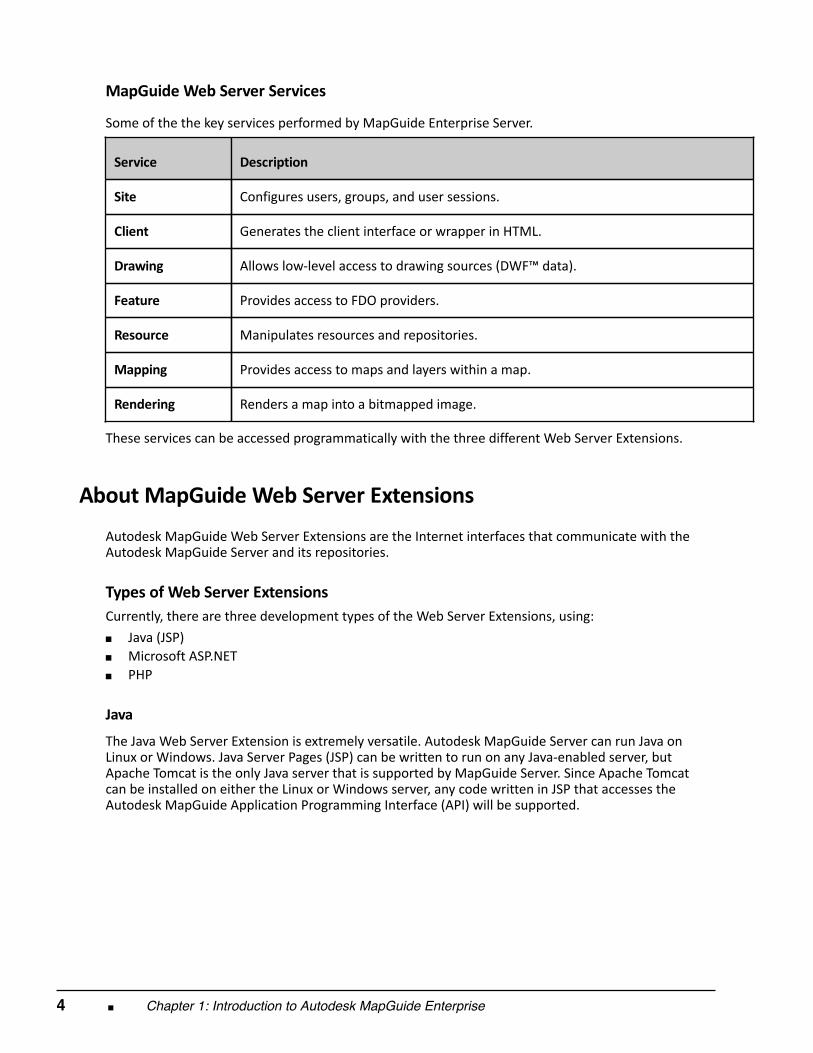
Some of the the key services performed by MapGuide Enterprise Server.
Service
Description
Site Configures users, groups, and user sessions.
Client Generates the client interface or wrapper in HTML.
Drawing Allows low‐level access to drawing sources (DWF™ data).
Feature Provides access to FDO providers.
Resource Manipulates resources and repositories.
Mapping Provides access to maps and layers within a map.
Rendering Renders a map into a bitmapped image.
These services can be accessed programmatically with the three different Web Server Extensions.
About MapGuide Web Server Extensions
Autodesk MapGuide Web Server Extensions are the Internet interfaces that communicate with theAutodesk MapGuide Server and its repositories.
Types of Web Server Extensions Currently, there are three development types of the Web Server Extensions, using: ■ Java (JSP)■ Microsoft ASP.NET■ PHP
Java The Java Web Server Extension is extremely versatile. Autodesk MapGuide Server can run Java onLinux or Windows. Java Server Pages (JSP) can be written to run on any Java‐enabled server, butApache Tomcat is the only Java server that is supported by MapGuide Server. Since Apache Tomcatcan be installed on either the Linux or Windows server, any code written in JSP that accesses theAutodesk MapGuide Application Programming Interface (API) will be supported.
Lesson: Introduction to Autodesk MapGuide Server ■ 5
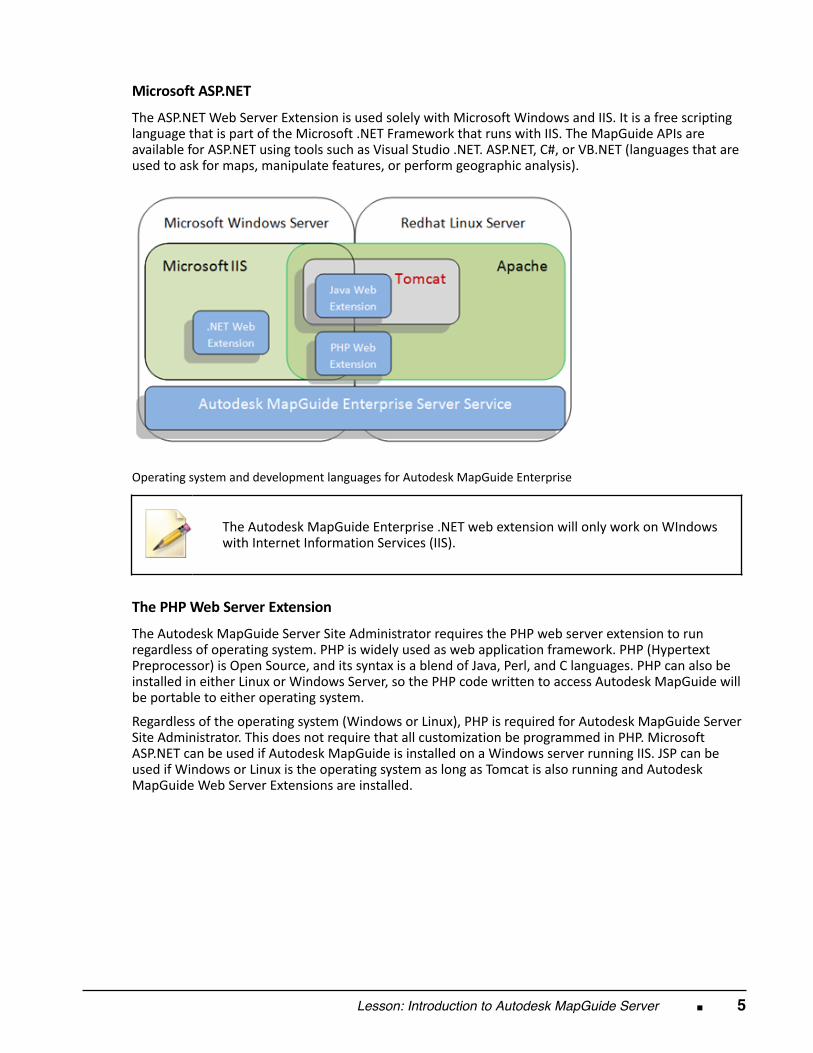
Microsoft ASP.NET The ASP.NET Web Server Extension is used solely with Microsoft Windows and IIS. It is a free scriptinglanguage that is part of the Microsoft .NET Framework that runs with IIS. The MapGuide APIs areavailable for ASP.NET using tools such as Visual Studio .NET. ASP.NET, C#, or VB.NET (languages that areused to ask for maps, manipulate features, or perform geographic analysis).
Operating system and development languages for Autodesk MapGuide Enterprise
The Autodesk MapGuide Enterprise .NET web extension will only work on WIndowswith Internet Information Services (IIS).
The PHP Web Server Extension The Autodesk MapGuide Server Site Administrator requires the PHP web server extension to runregardless of operating system. PHP is widely used as web application framework. PHP (HypertextPreprocessor) is Open Source, and its syntax is a blend of Java, Perl, and C languages. PHP can also beinstalled in either Linux or Windows Server, so the PHP code written to access Autodesk MapGuide willbe portable to either operating system.
Regardless of the operating system (Windows or Linux), PHP is required for Autodesk MapGuide ServerSite Administrator. This does not require that all customization be programmed in PHP. MicrosoftASP.NET can be used if Autodesk MapGuide is installed on a Windows server running IIS. JSP can beused if Windows or Linux is the operating system as long as Tomcat is also running and AutodeskMapGuide Web Server Extensions are installed.
6 ■ Chapter 1: Introduction to Autodesk MapGuide Enterprise
About MapGuide Site Administration
The web‐based Autodesk MapGuide Site Administrator manages the Autodesk MapGuide sites. Eachsite has a collection of servers that process requests from Autodesk MapGuide. Each site shares asingle XML‐based resource repository among its servers. The resource repository stores the resourcesthat map authors use to create maps and web layouts. Site Administrator
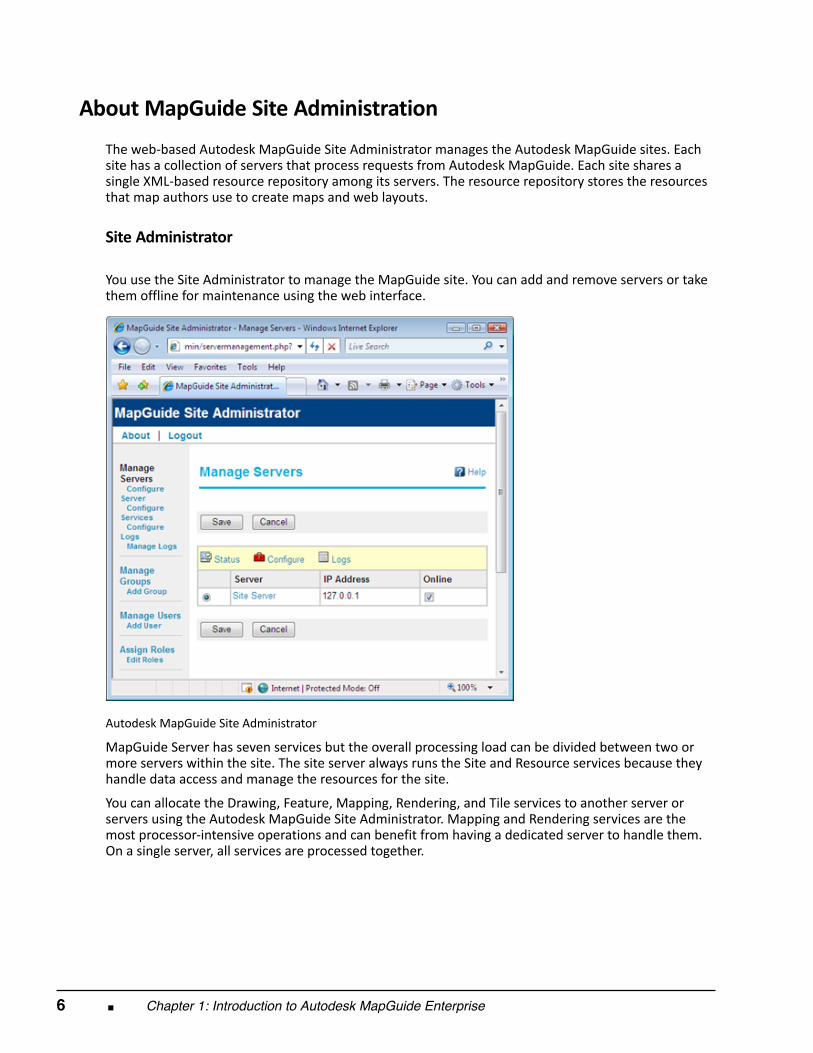
You use the Site Administrator to manage the MapGuide site. You can add and remove servers or takethem offline for maintenance using the web interface.
Autodesk MapGuide Site Administrator MapGuide Server has seven services but the overall processing load can be divided between two ormore servers within the site. The site server always runs the Site and Resource services because theyhandle data access and manage the resources for the site.
You can allocate the Drawing, Feature, Mapping, Rendering, and Tile services to another server orservers using the Autodesk MapGuide Site Administrator. Mapping and Rendering services are themost processor‐intensive operations and can benefit from having a dedicated server to handle them.On a single server, all services are processed together.
Lesson: Introduction to Autodesk MapGuide Server ■ 7
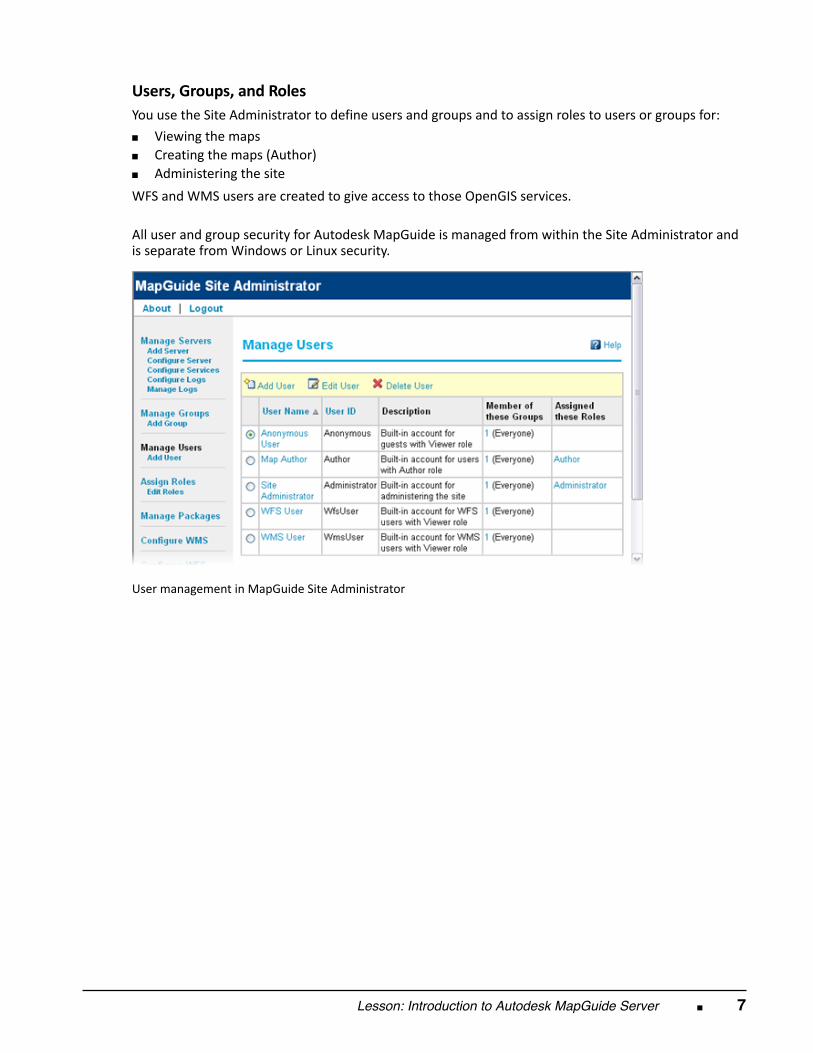
Users, Groups, and Roles You use the Site Administrator to define users and groups and to assign roles to users or groups for: ■ Viewing the maps■ Creating the maps (Author)■ Administering the site WFS and WMS users are created to give access to those OpenGIS services. All user and group security for Autodesk MapGuide is managed from within the Site Administrator andis separate from Windows or Linux security.
User management in MapGuide Site Administrator
8 ■ Chapter 1: Introduction to Autodesk MapGuide Enterprise
Lesson: Introduction to Autodesk MapGuideLesson: Studio
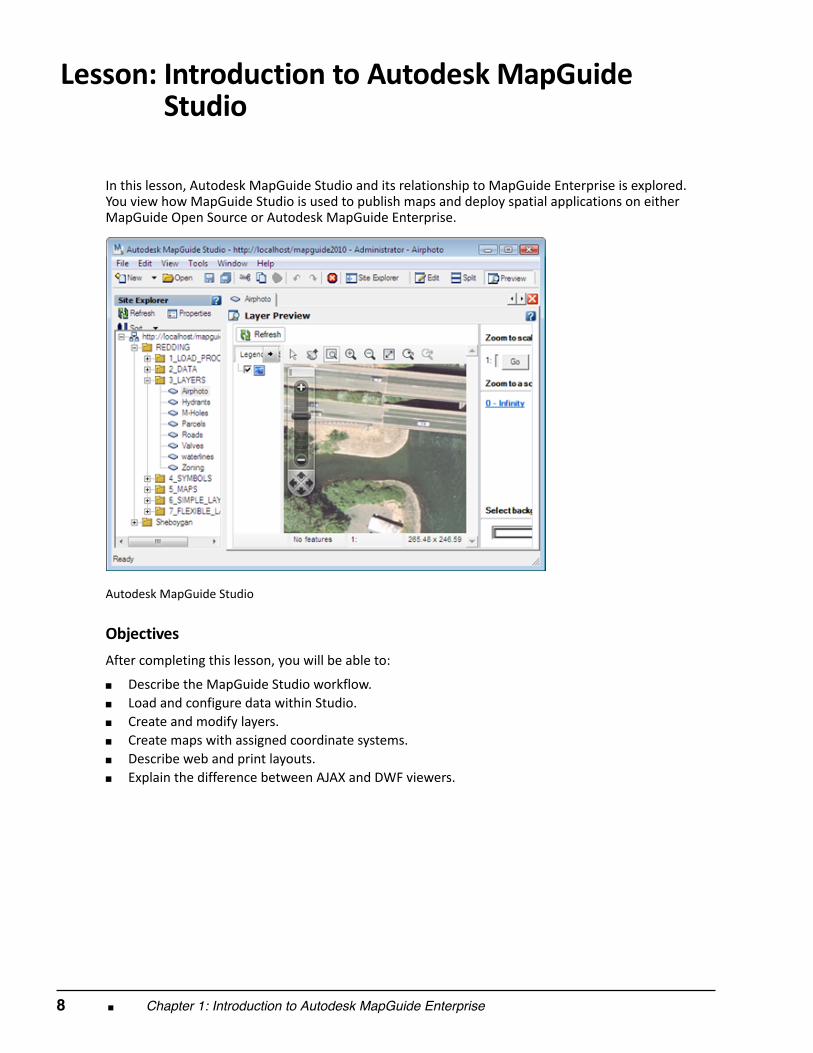
In this lesson, Autodesk MapGuide Studio and its relationship to MapGuide Enterprise is explored.You view how MapGuide Studio is used to publish maps and deploy spatial applications on eitherMapGuide Open Source or Autodesk MapGuide Enterprise.
Autodesk MapGuide Studio
Objectives After completing this lesson, you will be able to:
■ Describe the MapGuide Studio workflow.■ Load and configure data within Studio.■ Create and modify layers.■ Create maps with assigned coordinate systems.■ Describe web and print layouts.■ Explain the difference between AJAX and DWF viewers.
Lesson: Introduction to Autodesk MapGuide Studio ■ 9
About Autodesk MapGuide Studio
Introduction to MapGuide Studio Functions With Autodesk MapGuide Studio you can prepare all aspects of geospatial data and mapping. You canuse Autodesk MapGuide Studio to do the following: ■ Log in to Autodesk MapGuide Server using its Administrator URL.■ Manage the content in the repositories on Autodesk MapGuide Server.■ Load or connect to geospatial data.■ Stylize geospatial data.■ Publish maps created in Autodesk MapGuide Studio on the Internet.
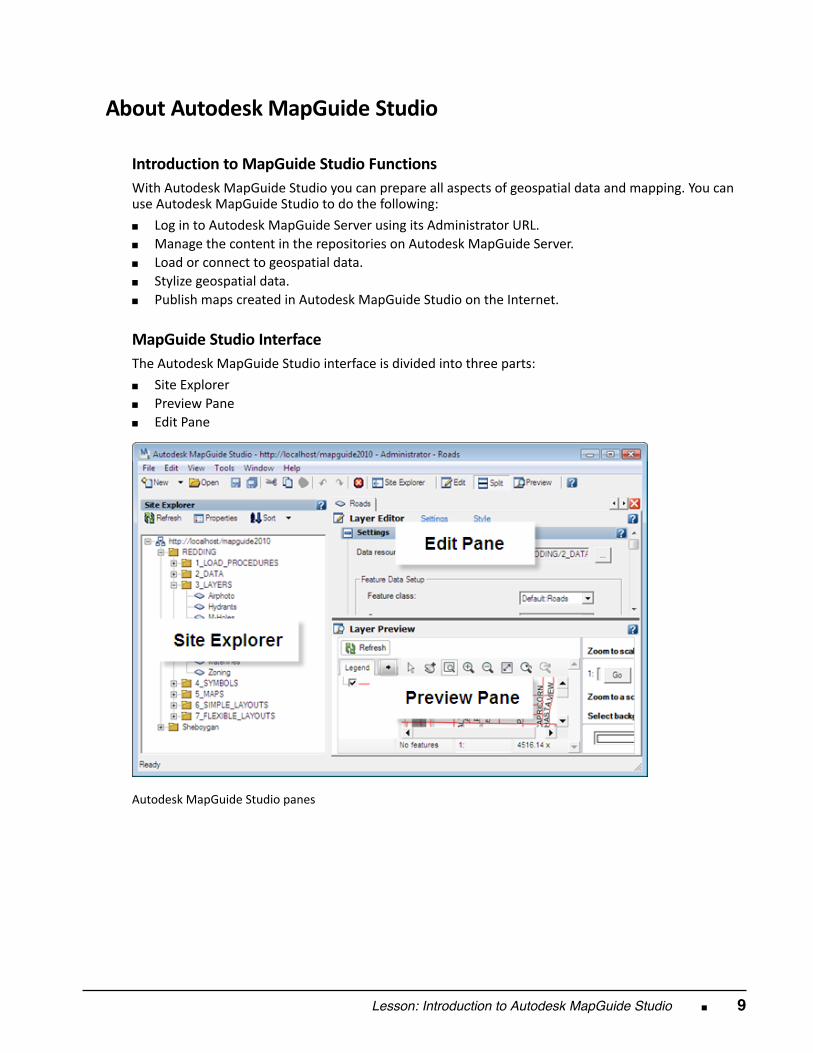
MapGuide Studio Interface The Autodesk MapGuide Studio interface is divided into three parts: ■ Site Explorer■ Preview Pane■ Edit Pane
Autodesk MapGuide Studio panes
10 ■ Chapter 1: Introduction to Autodesk MapGuide Enterprise
Workflow When you are using Autodesk MapGuide Studio, the workflow consists of these four steps: ■ Find data.■ Build layers.■ Make a map.■ Place the map on the Internet.
Access to Site Explorer To access the Site Explorer, you open Autodesk MapGuide Studio and connect to the site server (forexample, http://www.autodesk.com/mapguide2010/).
The Site Explorer shows the resources that are stored in the resource repository. Double clicking anyresource in the Site Explorer opens the associated editor for that resource.
Split or Preview buttons show the graphical representation of the layer being edited and will appear inthe Preview Pane.
Finding Data
There are two ways to find data within Autodesk MapGuide Studio: ■ Use the Load Procedure function to upload spatial data■ Configure spatial data already on the server
Load Spatial Data You can use Load Procedure to upload data into Autodesk MapGuide Enterprise using MapGuideStudio in any of the following data file formats: ■ SDF (Including legacy SDF2.0 files used by Autodesk MapGuide 6.x)■ SHP■ DWF■ DWG™■ DXF™■ Raster (geo‐referenced)
Lesson: Introduction to Autodesk MapGuide Studio ■ 11
Configure Spatial Data Not all spatial data needs to be loaded; only configured. Autodesk MapGuide Server uses AutodeskFeature Data Objects (FDO) to make database connections or direct connections to files already onthe server. (It is assumed that Autodesk MapGuide Enterprise has access to the files or enterprisedatabases through the appropriate client software such Oracle Instant Client or ArcSDE Client orthrough network permissions.)
With the live FDO connections to the corporate spatial database, Autodesk MapGuide Enterpriseprovides real‐time mapping information without having to load new files with MapGuide Studio. TheFDO method of data connection is by far the more efficient method of serving data with AutodeskMapGuide Enterprise.
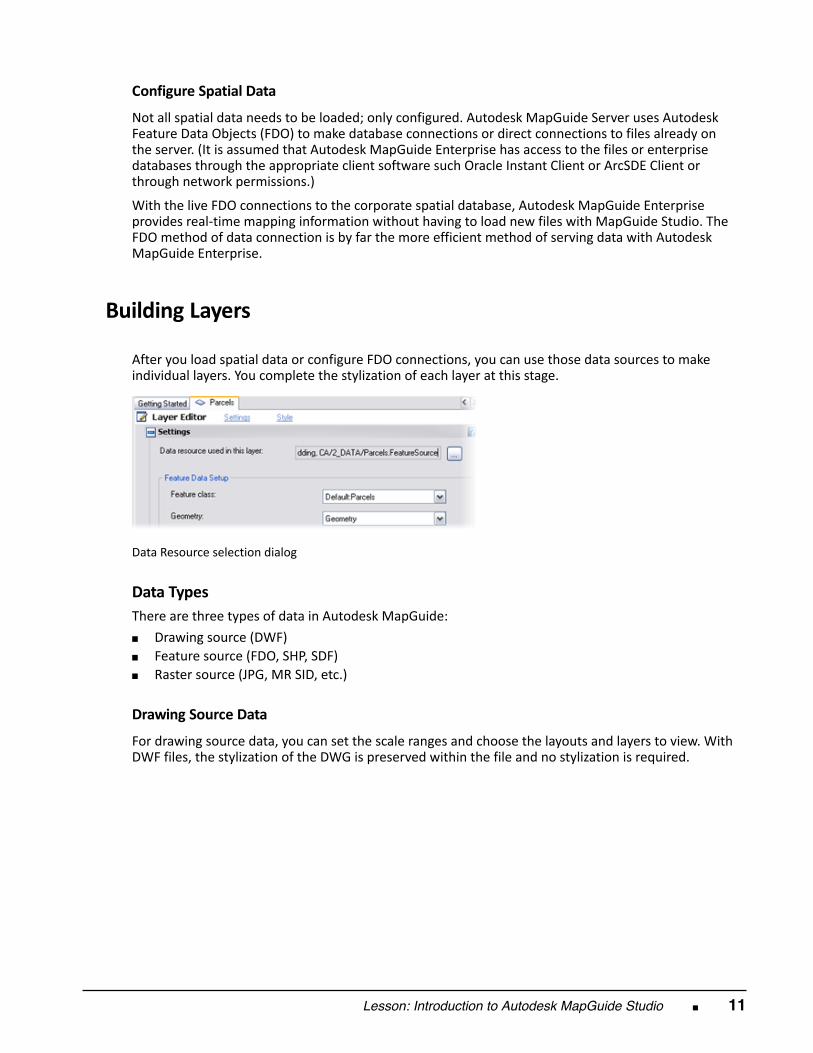
Building Layers
After you load spatial data or configure FDO connections, you can use those data sources to makeindividual layers. You complete the stylization of each layer at this stage.
Data Resource selection dialog
Data Types There are three types of data in Autodesk MapGuide: ■ Drawing source (DWF)■ Feature source (FDO, SHP, SDF)■ Raster source (JPG, MR SID, etc.)
Drawing Source Data For drawing source data, you can set the scale ranges and choose the layouts and layers to view. WithDWF files, the stylization of the DWG is preserved within the file and no stylization is required.
12 ■ Chapter 1: Introduction to Autodesk MapGuide Enterprise
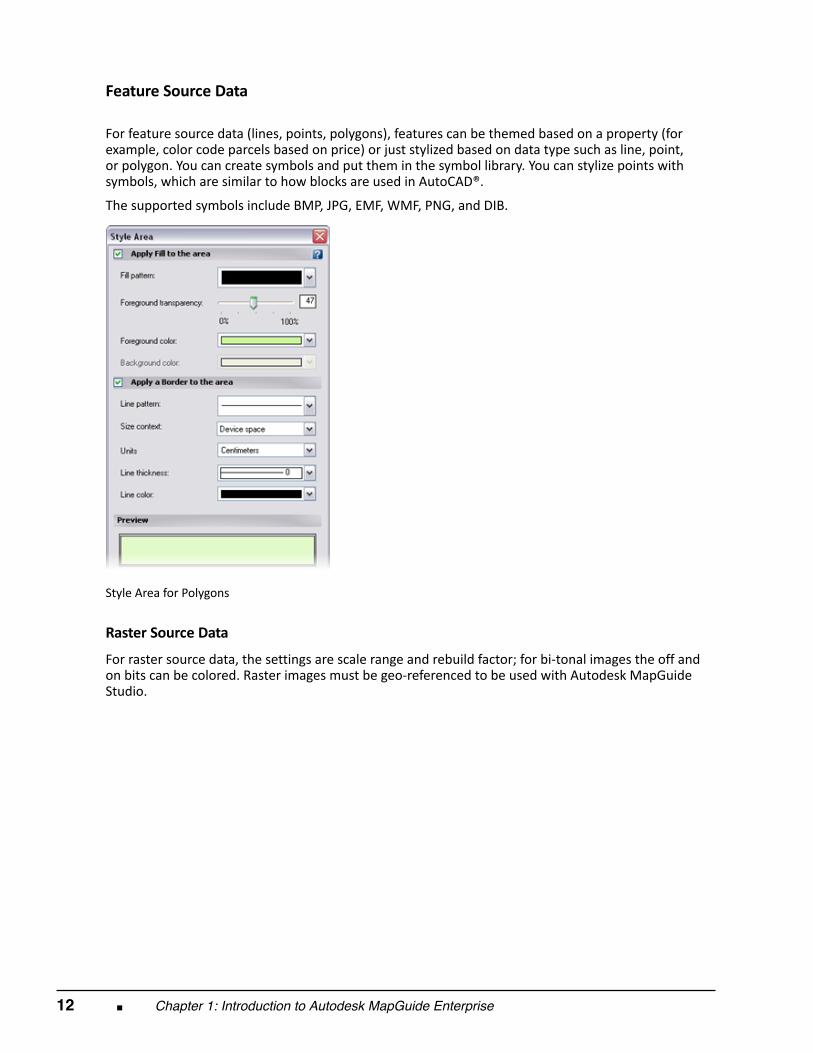
Feature Source Data
For feature source data (lines, points, polygons), features can be themed based on a property (forexample, color code parcels based on price) or just stylized based on data type such as line, point,or polygon. You can create symbols and put them in the symbol library. You can stylize points withsymbols, which are similar to how blocks are used in AutoCAD®.
The supported symbols include BMP, JPG, EMF, WMF, PNG, and DIB.
Style Area for Polygons
Raster Source Data For raster source data, the settings are scale range and rebuild factor; for bi‐tonal images the off andon bits can be colored. Raster images must be geo‐referenced to be used with Autodesk MapGuideStudio.
Lesson: Introduction to Autodesk MapGuide Studio ■ 13
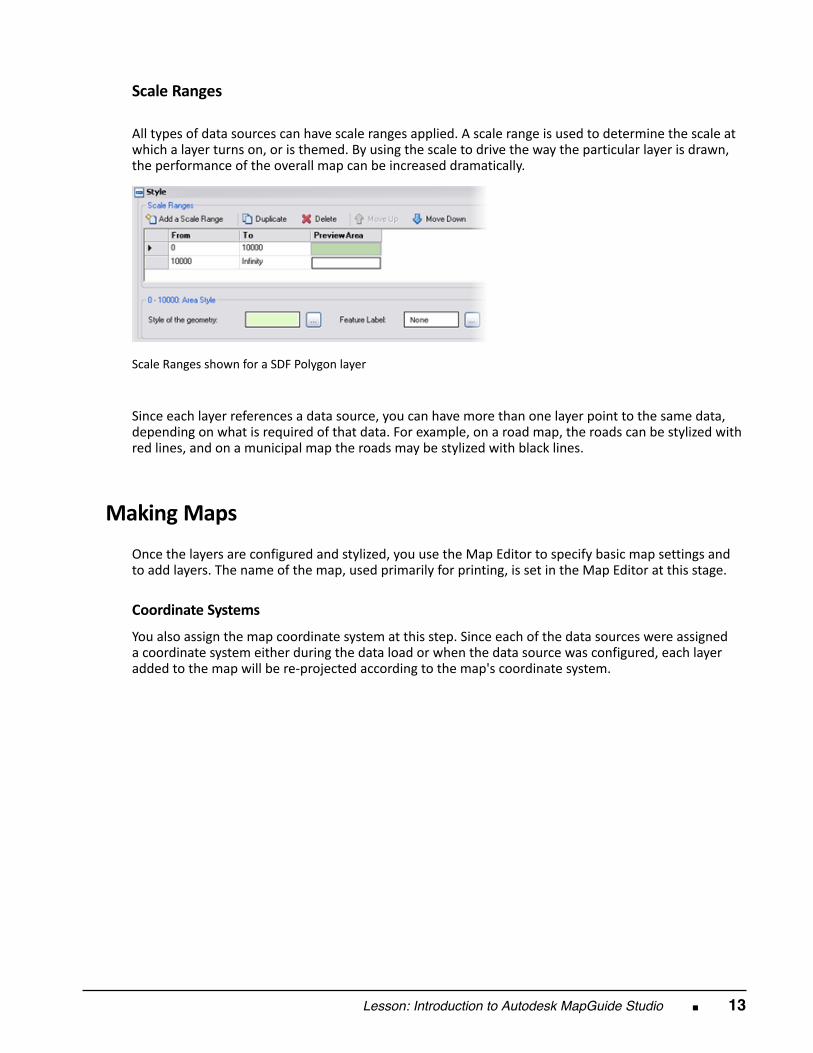
Scale Ranges
All types of data sources can have scale ranges applied. A scale range is used to determine the scale atwhich a layer turns on, or is themed. By using the scale to drive the way the particular layer is drawn,the performance of the overall map can be increased dramatically.
Scale Ranges shown for a SDF Polygon layer
Since each layer references a data source, you can have more than one layer point to the same data,depending on what is required of that data. For example, on a road map, the roads can be stylized withred lines, and on a municipal map the roads may be stylized with black lines.
Making Maps
Once the layers are configured and stylized, you use the Map Editor to specify basic map settings andto add layers. The name of the map, used primarily for printing, is set in the Map Editor at this stage.
Coordinate Systems You also assign the map coordinate system at this step. Since each of the data sources were assigneda coordinate system either during the data load or when the data source was configured, each layeradded to the map will be re‐projected according to the map's coordinate system.
14 ■ Chapter 1: Introduction to Autodesk MapGuide Enterprise
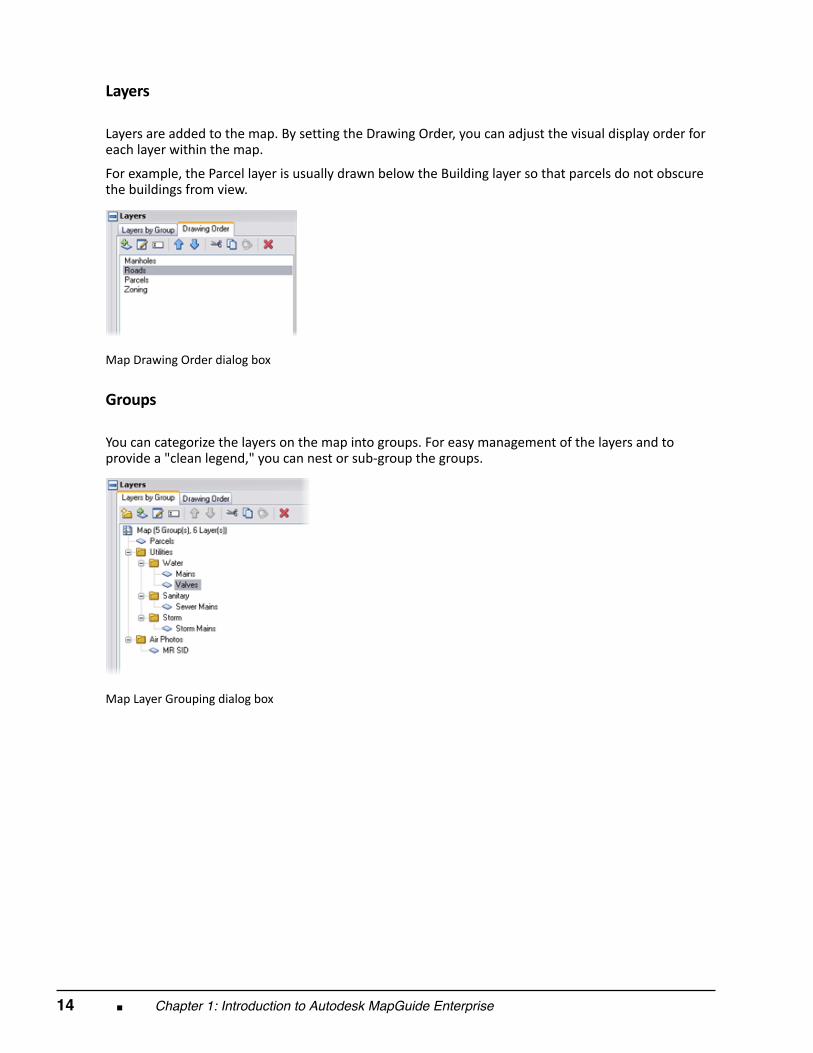
Layers
Layers are added to the map. By setting the Drawing Order, you can adjust the visual display order foreach layer within the map.
For example, the Parcel layer is usually drawn below the Building layer so that parcels do not obscurethe buildings from view.
Map Drawing Order dialog box Groups
You can categorize the layers on the map into groups. For easy management of the layers and toprovide a "clean legend," you can nest or sub‐group the groups.
Map Layer Grouping dialog box
Lesson: Introduction to Autodesk MapGuide Studio ■ 15
Placing Maps on the Internet
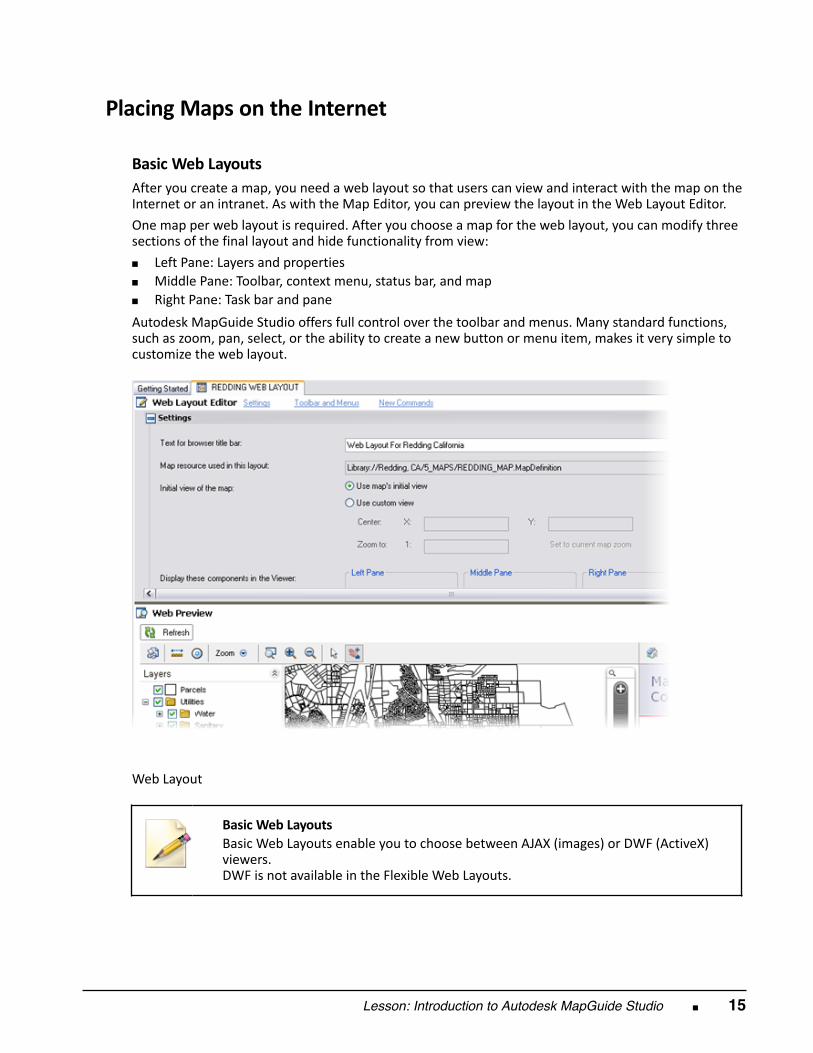
Basic Web Layouts After you create a map, you need a web layout so that users can view and interact with the map on theInternet or an intranet. As with the Map Editor, you can preview the layout in the Web Layout Editor. One map per web layout is required. After you choose a map for the web layout, you can modify threesections of the final layout and hide functionality from view: ■ Left Pane: Layers and properties■ Middle Pane: Toolbar, context menu, status bar, and map■ Right Pane: Task bar and pane Autodesk MapGuide Studio offers full control over the toolbar and menus. Many standard functions,such as zoom, pan, select, or the ability to create a new button or menu item, makes it very simple tocustomize the web layout.
Web Layout
Basic Web Layouts Basic Web Layouts enable you to choose between AJAX (images) or DWF (ActiveX)viewers.DWF is not available in the Flexible Web Layouts.
16 ■ Chapter 1: Introduction to Autodesk MapGuide Enterprise
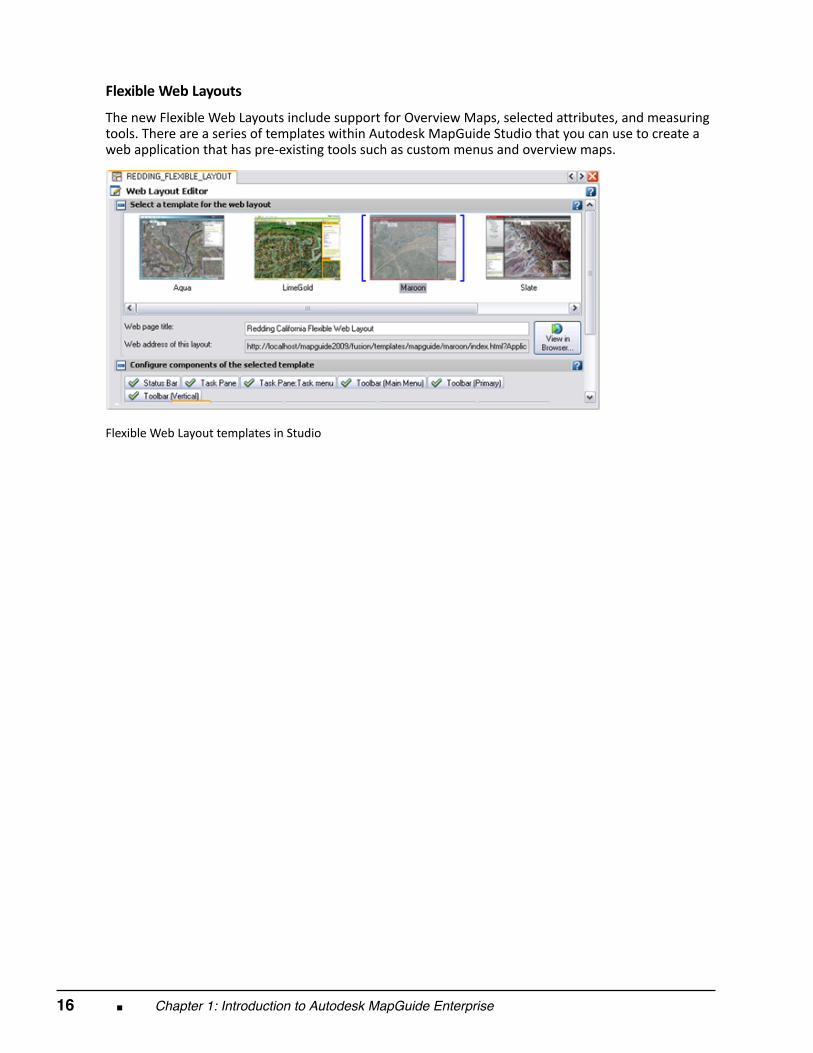
Flexible Web Layouts The new Flexible Web Layouts include support for Overview Maps, selected attributes, and measuringtools. There are a series of templates within Autodesk MapGuide Studio that you can use to create aweb application that has pre‐existing tools such as custom menus and overview maps.
Flexible Web Layout templates in Studio
Lesson: Introduction to Autodesk MapGuide Studio ■ 17
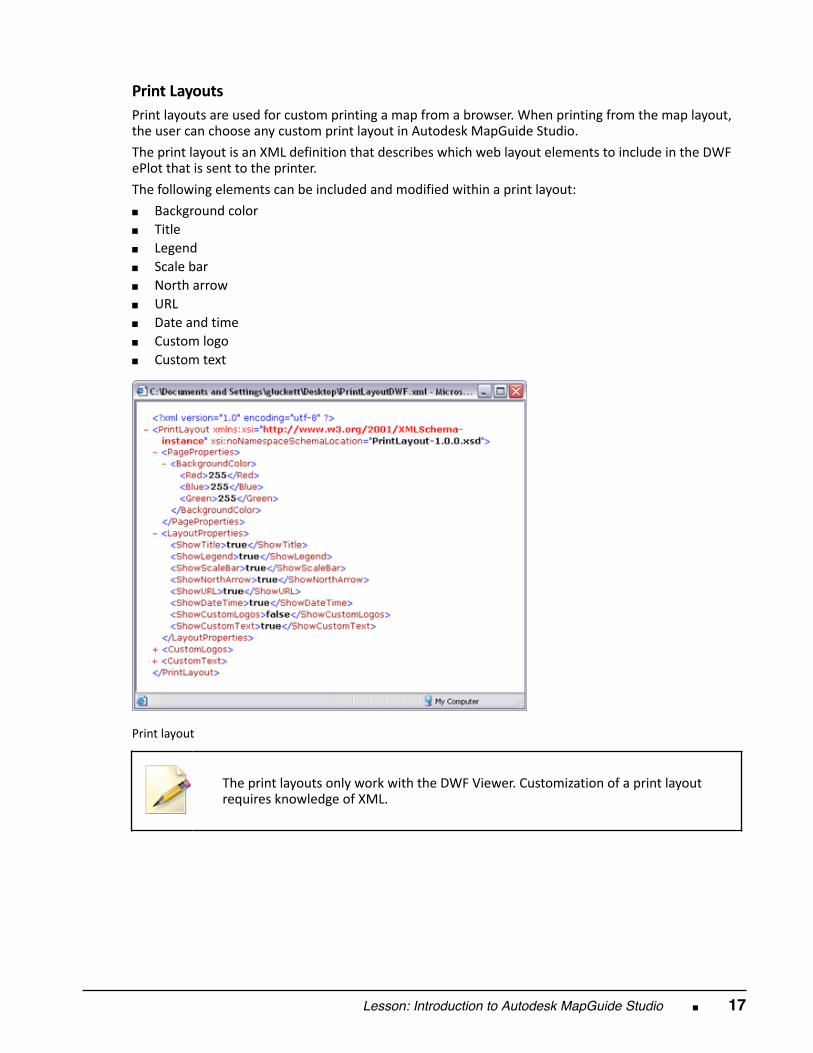
Print Layouts Print layouts are used for custom printing a map from a browser. When printing from the map layout,the user can choose any custom print layout in Autodesk MapGuide Studio. The print layout is an XML definition that describes which web layout elements to include in the DWFePlot that is sent to the printer. The following elements can be included and modified within a print layout: ■ Background color■ Title■ Legend■ Scale bar■ North arrow■ URL■ Date and time■ Custom logo■ Custom text
Print layout
The print layouts only work with the DWF Viewer. Customization of a print layoutrequires knowledge of XML.
18 ■ Chapter 1: Introduction to Autodesk MapGuide Enterprise
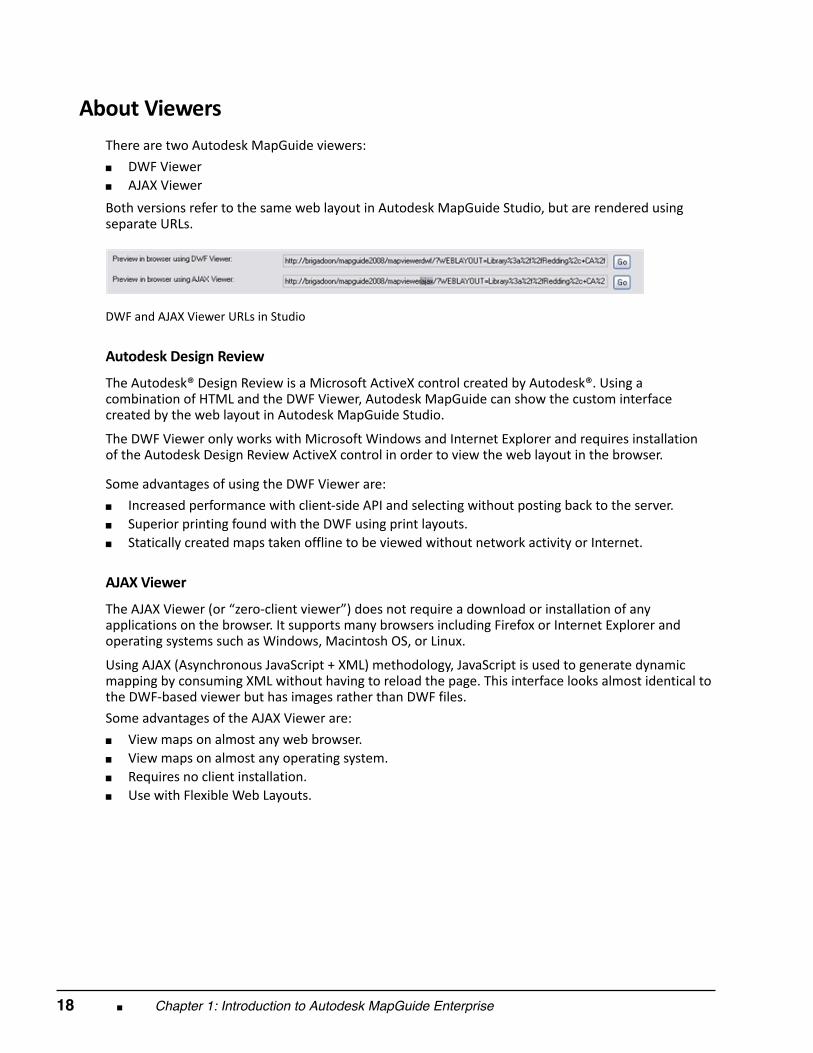
About Viewers
There are two Autodesk MapGuide viewers: ■ DWF Viewer■ AJAX Viewer Both versions refer to the same web layout in Autodesk MapGuide Studio, but are rendered usingseparate URLs.
DWF and AJAX Viewer URLs in Studio
Autodesk Design Review The Autodesk® Design Review is a Microsoft ActiveX control created by Autodesk®. Using acombination of HTML and the DWF Viewer, Autodesk MapGuide can show the custom interfacecreated by the web layout in Autodesk MapGuide Studio.
The DWF Viewer only works with Microsoft Windows and Internet Explorer and requires installationof the Autodesk Design Review ActiveX control in order to view the web layout in the browser.
Some advantages of using the DWF Viewer are: ■ Increased performance with client‐side API and selecting without posting back to the server.■ Superior printing found with the DWF using print layouts.■ Statically created maps taken offline to be viewed without network activity or Internet.
AJAX Viewer The AJAX Viewer (or “zero‐client viewer”) does not require a download or installation of anyapplications on the browser. It supports many browsers including Firefox or Internet Explorer andoperating systems such as Windows, Macintosh OS, or Linux.
Using AJAX (Asynchronous JavaScript + XML) methodology, JavaScript is used to generate dynamicmapping by consuming XML without having to reload the page. This interface looks almost identical tothe DWF‐based viewer but has images rather than DWF files. Some advantages of the AJAX Viewer are: ■ View maps on almost any web browser.■ View maps on almost any operating system.■ Requires no client installation.■ Use with Flexible Web Layouts.
Lesson: Feature Data Objects - FDO ■ 19
Lesson: Feature Data Objects ‐ FDO
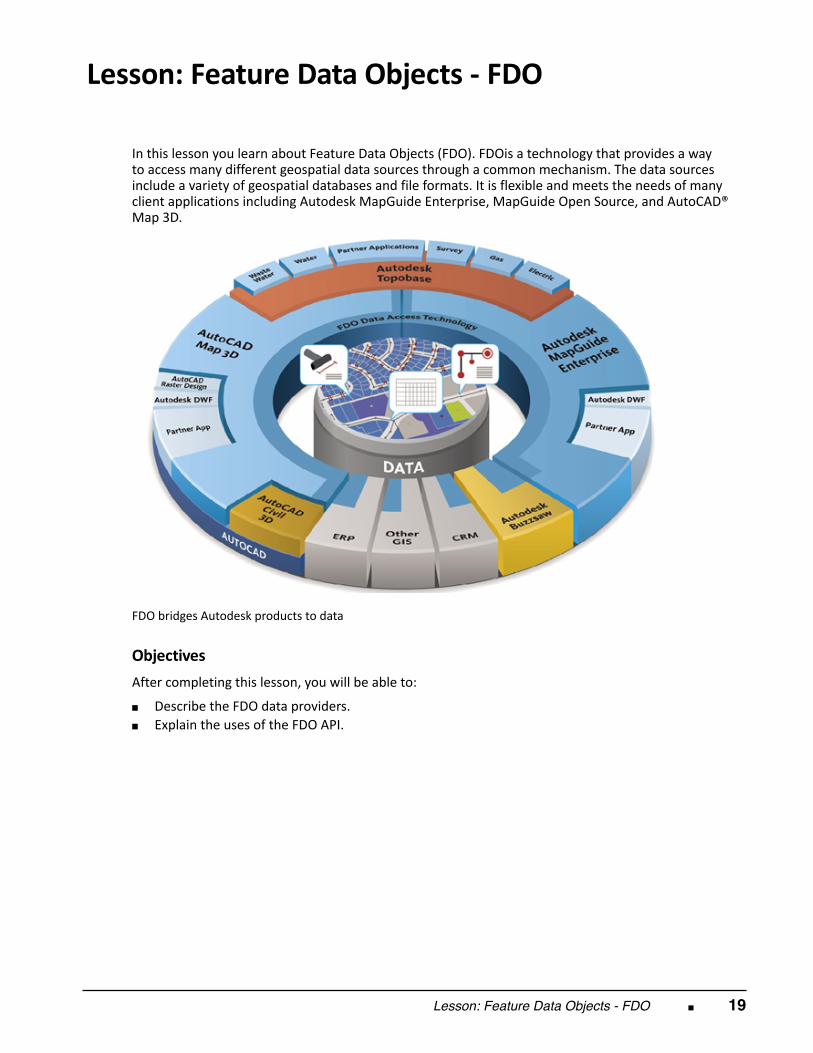
In this lesson you learn about Feature Data Objects (FDO). FDOis a technology that provides a wayto access many different geospatial data sources through a common mechanism. The data sourcesinclude a variety of geospatial databases and file formats. It is flexible and meets the needs of manyclient applications including Autodesk MapGuide Enterprise, MapGuide Open Source, and AutoCAD®Map 3D.
FDO bridges Autodesk products to data
Objectives After completing this lesson, you will be able to:
■ Describe the FDO data providers.■ Explain the uses of the FDO API.

20 ■ Chapter 1: Introduction to Autodesk MapGuide Enterprise
About Feature Data Objects ‐ FDO
Autodesk Feature Data Objects (FDO) is a set of Application Programming Interfaces (APIs) forconnecting Autodesk products to various native data stores. For example, Autodesk MapGuide canconnect directly to Oracle Spatial, ArcSDE, or the OpenGIS Web Map Service (WMS).
Although Autodesk MapGuide Studio can run load procedures to convert or place SHP, SDF, DWG,DWF, and DXF files on the server, it is more efficient to connect directly to the live geographicdatabases without uploading them to the server or translating files.
FDO provides a single interface to all corporate data, so that the underlying data behind the layersand maps in Autodesk MapGuide Enterprise is automatically updated. FDO is also used with AutodeskMapGuide Enterprise to update and maintain information so that there is a seamless process ofcreating, editing, maintaining, and distributing spatial data within any organization.
FDO Providers Since there are many direct FDO connections to data that do not require loading files on the server,FDO is the most efficient enterprise method of distributing spatial data in Autodesk MapGuideEnterprise. Autodesk MapGuide Enterprise includes the following providers: ■ Autodesk FDO Provider for Oracle■ Autodesk FDO provider for Raster■ Autodesk FDO Provider for SQL Server■ OSGeo FDO Provider for ArcSDE■ OSGeo FDO Provider for MySQL■ OSGeo FDO Provider for ODBC■ OSGeo FDO Provider for SDF■ OSGeo FDO Provider for SHP■ OSGeo FDO Provider for SQL Server Spatial■ OSGeo FDO Provider for WMS■ OSGeo FDO Provider for WFS Many of the FDO Providers also need the associated client software to run. For example, if theAutodesk FDO Provider for Oracle is used, then the Oracle Instant Client needs to be installed on theserver.
Lesson: Feature Data Objects - FDO ■ 21
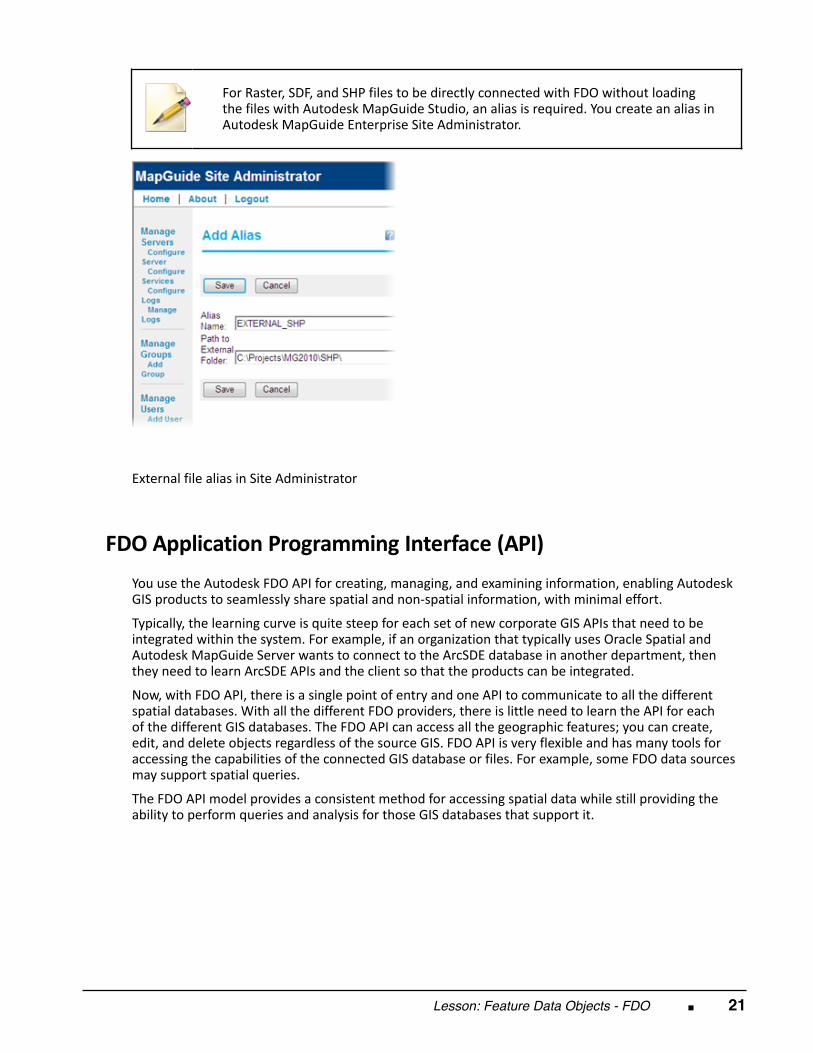
For Raster, SDF, and SHP files to be directly connected with FDO without loading
the files with Autodesk MapGuide Studio, an alias is required. You create an alias inAutodesk MapGuide Enterprise Site Administrator.
External file alias in Site Administrator
FDO Application Programming Interface (API)
You use the Autodesk FDO API for creating, managing, and examining information, enabling AutodeskGIS products to seamlessly share spatial and non‐spatial information, with minimal effort.
Typically, the learning curve is quite steep for each set of new corporate GIS APIs that need to beintegrated within the system. For example, if an organization that typically uses Oracle Spatial andAutodesk MapGuide Server wants to connect to the ArcSDE database in another department, thenthey need to learn ArcSDE APIs and the client so that the products can be integrated.
Now, with FDO API, there is a single point of entry and one API to communicate to all the differentspatial databases. With all the different FDO providers, there is little need to learn the API for eachof the different GIS databases. The FDO API can access all the geographic features; you can create,edit, and delete objects regardless of the source GIS. FDO API is very flexible and has many tools foraccessing the capabilities of the connected GIS database or files. For example, some FDO data sourcesmay support spatial queries.
The FDO API model provides a consistent method for accessing spatial data while still providing theability to perform queries and analysis for those GIS databases that support it.

22 ■ Chapter 1: Introduction to Autodesk MapGuide Enterprise
Direct Access to FDO API FDO is installed with AutoCAD Map 3D and Autodesk MapGuide Enterprise. In AutoCAD Map 3D, theC++ and C# APIs are exposed directly. However, in Autodesk MapGuide Enterprise, the .NET (C# andVB.NET) APIs are the only direct API into FDO.
Even without the direct access to the FDO, you can reach most APIs through the MapGuide EnterpriseWeb Server Extensions with Java, .NET, and PHP.
AutoCAD Map 3D ObjectARX API download contains FDO C# code that can be used in
either Map 3D or MapGuide.Examples can be found in the C:\Map ObjectARX SDK 2010\Map Samples\Platform\folder when the OjectARX API is installed.

Chapter Summary ■ 23
Chapter Summary
Having completed this chapter, you can:
■ Describe the key components of Autodesk MapGuide Enterprise.■ Explain the four key processes to publish data to the web with Autodesk MapGuide Studio.■ Explain Feature Data Objects (FDO) and its data providers.

24 ■ Chapter 1: Introduction to Autodesk MapGuide Enterprise
Chapter Overview ■ 25
Chapter
2
Autodesk MapGuide EnterpriseServer
In this chapter, you explore the process of installing Autodesk MapGuide® Enterprise Server. Althoughnot officially supported to use as a Server, the installation that you use for the Windows version isMicrosoft Windows Vista.
The server‐side configuration of Autodesk MapGuide Enterprise, once installed and running, isidentical regardless of operating system used. You learn to install and configure Autodesk MapGuideEnterprise Server and Web Server extensions on Microsoft® Windows® Vista.
Objectives After completing this chapter, you will be able to:
■ Install MapGuide Server and Web Server Extensions.■ Configure MapGuide Enterprise with the Site Administrator.
26 ■ Chapter 2: Autodesk MapGuide Enterprise Server
Lesson: Installation
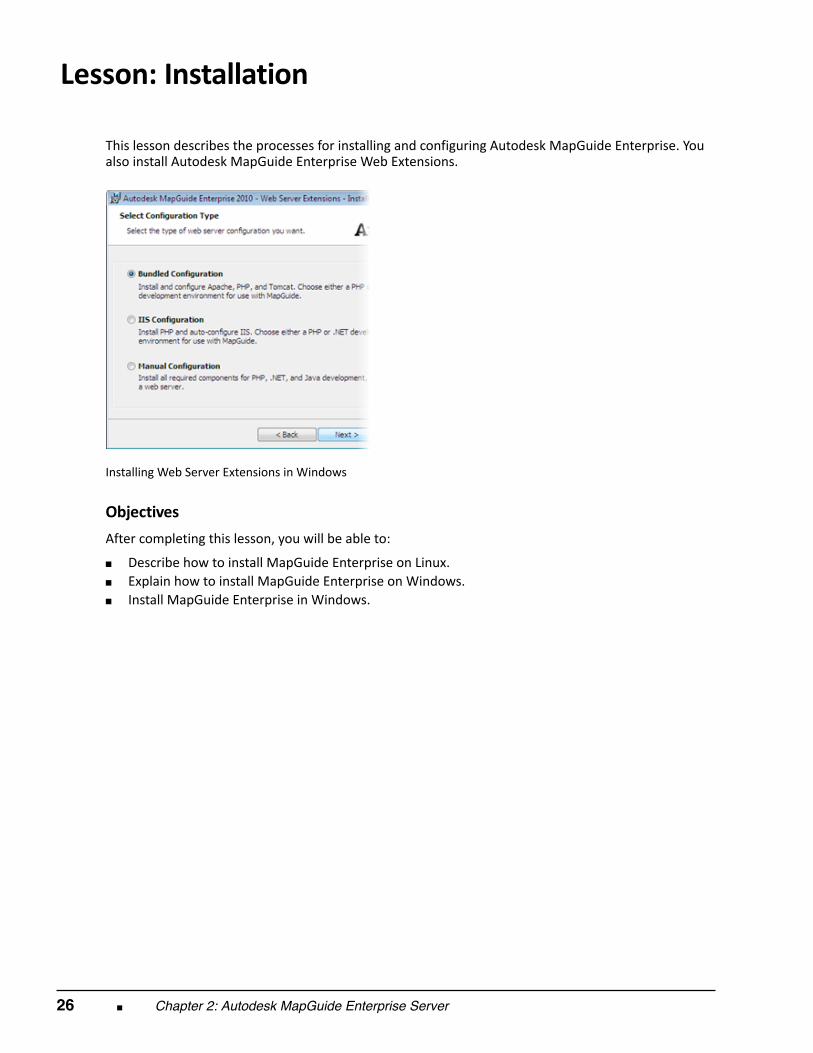
This lesson describes the processes for installing and configuring Autodesk MapGuide Enterprise. Youalso install Autodesk MapGuide Enterprise Web Extensions.
Installing Web Server Extensions in Windows
Objectives After completing this lesson, you will be able to:
■ Describe how to install MapGuide Enterprise on Linux.■ Explain how to install MapGuide Enterprise on Windows.■ Install MapGuide Enterprise in Windows.
Lesson: Installation ■ 27
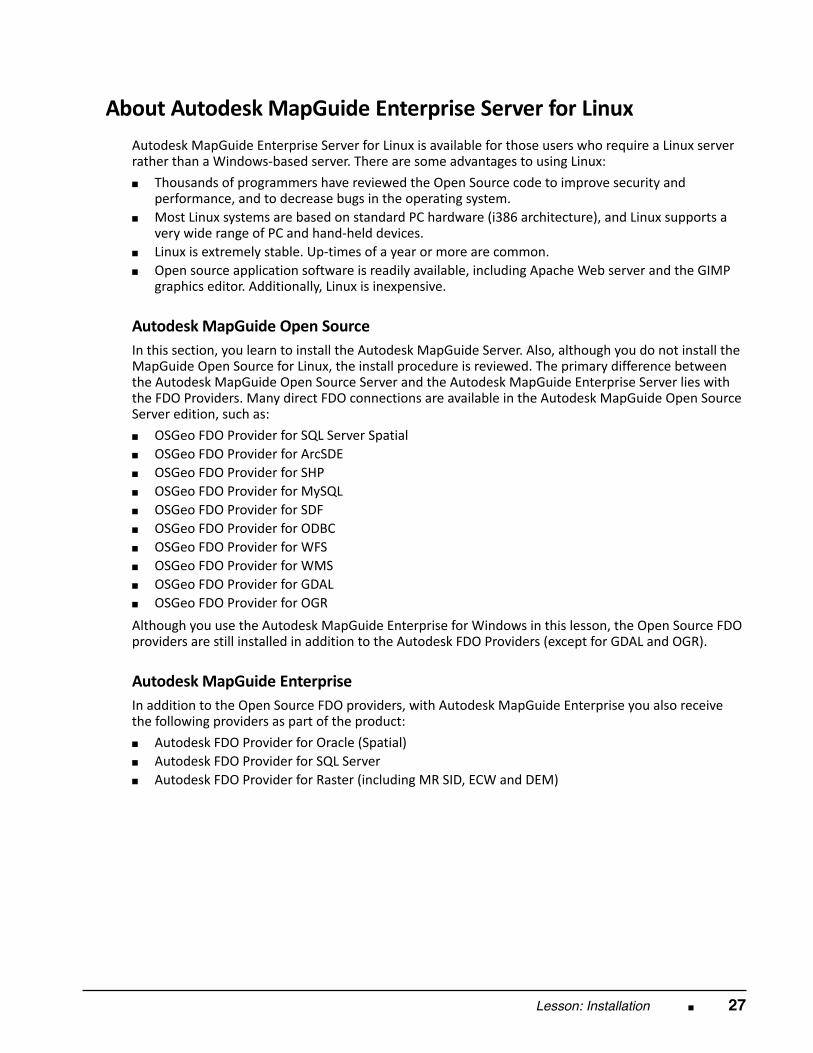
About Autodesk MapGuide Enterprise Server for Linux
Autodesk MapGuide Enterprise Server for Linux is available for those users who require a Linux serverrather than a Windows‐based server. There are some advantages to using Linux: ■ Thousands of programmers have reviewed the Open Source code to improve security and
performance, and to decrease bugs in the operating system.■ Most Linux systems are based on standard PC hardware (i386 architecture), and Linux supports a
very wide range of PC and hand‐held devices.■ Linux is extremely stable. Up‐times of a year or more are common.■ Open source application software is readily available, including Apache Web server and the GIMP
graphics editor. Additionally, Linux is inexpensive.
Autodesk MapGuide Open Source In this section, you learn to install the Autodesk MapGuide Server. Also, although you do not install theMapGuide Open Source for Linux, the install procedure is reviewed. The primary difference betweenthe Autodesk MapGuide Open Source Server and the Autodesk MapGuide Enterprise Server lies withthe FDO Providers. Many direct FDO connections are available in the Autodesk MapGuide Open SourceServer edition, such as: ■ OSGeo FDO Provider for SQL Server Spatial■ OSGeo FDO Provider for ArcSDE■ OSGeo FDO Provider for SHP■ OSGeo FDO Provider for MySQL■ OSGeo FDO Provider for SDF■ OSGeo FDO Provider for ODBC■ OSGeo FDO Provider for WFS■ OSGeo FDO Provider for WMS■ OSGeo FDO Provider for GDAL■ OSGeo FDO Provider for OGR Although you use the Autodesk MapGuide Enterprise for Windows in this lesson, the Open Source FDOproviders are still installed in addition to the Autodesk FDO Providers (except for GDAL and OGR). Autodesk MapGuide Enterprise In addition to the Open Source FDO providers, with Autodesk MapGuide Enterprise you also receivethe following providers as part of the product: ■ Autodesk FDO Provider for Oracle (Spatial)■ Autodesk FDO Provider for SQL Server■ Autodesk FDO Provider for Raster (including MR SID, ECW and DEM)
28 ■ Chapter 2: Autodesk MapGuide Enterprise Server
System Requirements for Autodesk MapGuide Enterprise and MapGuide Open SourceServer for Linux Autodesk MapGuide Enterprise and MapGuide Open Source Servers can run on Red Hat Enterprise4.0 or Fedora Core 6. This lesson uses Fedora 6. The following are requirements for installing AutodeskMapGuide Enterprise and MapGuide Open Source Servers: ■ Apache HTTP Server 2.xx■ PHP 5.2.5■ Java JDK 5.0■ Feature Data Objects FDO 3.3■ JPEG Library ‐ libjpeg.so■ PNG Library ‐ libpng.so
The MapGuide Open Source LiveCD have MapGuide installed on Ubuntu on a
bootable CD.Available at: mapguide.osgeo.org.
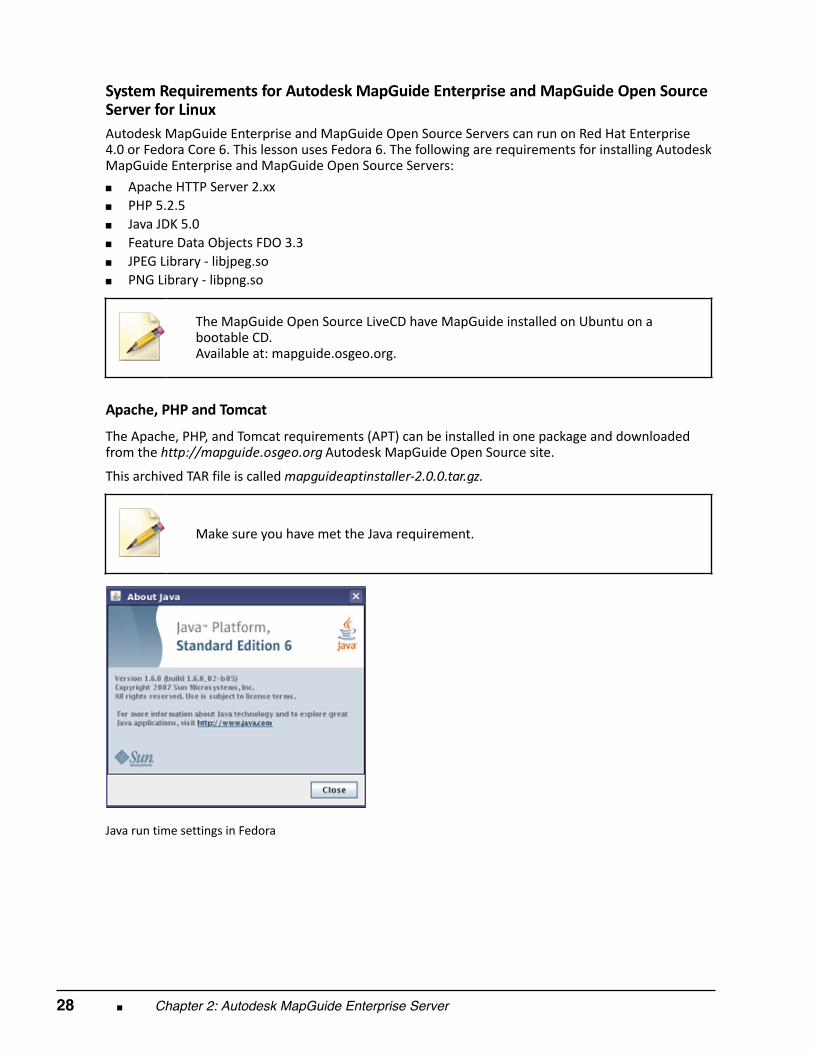
Apache, PHP and Tomcat The Apache, PHP, and Tomcat requirements (APT) can be installed in one package and downloadedfrom the http://mapguide.osgeo.org Autodesk MapGuide Open Source site.
This archived TAR file is called mapguideaptinstaller‐2.0.0.tar.gz.
Make sure you have met the Java requirement.
Java run time settings in Fedora
Lesson: Installation ■ 29
Installing MapGuide Enterprise Server for Windows
Some preliminary setup steps are required before installing Autodesk MapGuide Enterprise Server.If a previous version of the Autodesk FDO SDK, version 2.0 or less, has been installed, it needs to beremoved. The installation of Autodesk MapGuide Enterprise Server loads FDO 3.* automatically wheninstalling Autodesk MapGuide Enterprise for Windows.
FDO SDK If already installed, the older FDO SDK 2.0 is located in the following folder:
C:\Program Files\Common Files\Autodesk Shared\GIS\FDO 2.0\
If this folder exists, it must be deleted or renamed prior to the installation of Autodesk MapGuideEnterprise Server.
Web Server Another prerequisite for the installation of Autodesk MapGuide Enterprise Server is a running WebServer application. Most Microsoft Windows‐based servers use Microsoft Internet Information Server(IIS) as the default web server, but it is not the only server available for Windows. Apache 2.0 orgreater is also supported by Autodesk MapGuide Enterprise on Windows or Linux.
If you choose a bundled install, Apache may be installed when the Web Extensions are installed.
PHP Version PHP 5.2 or greater will be automatically installed when loading the Autodesk MapGuide Server WebExtensions.
PHP 5.2 now has Object Oriented Programming (OOP) and XML extensions for manipulating andworking with XML files. Install Autodesk MapGuide Enterprise Server
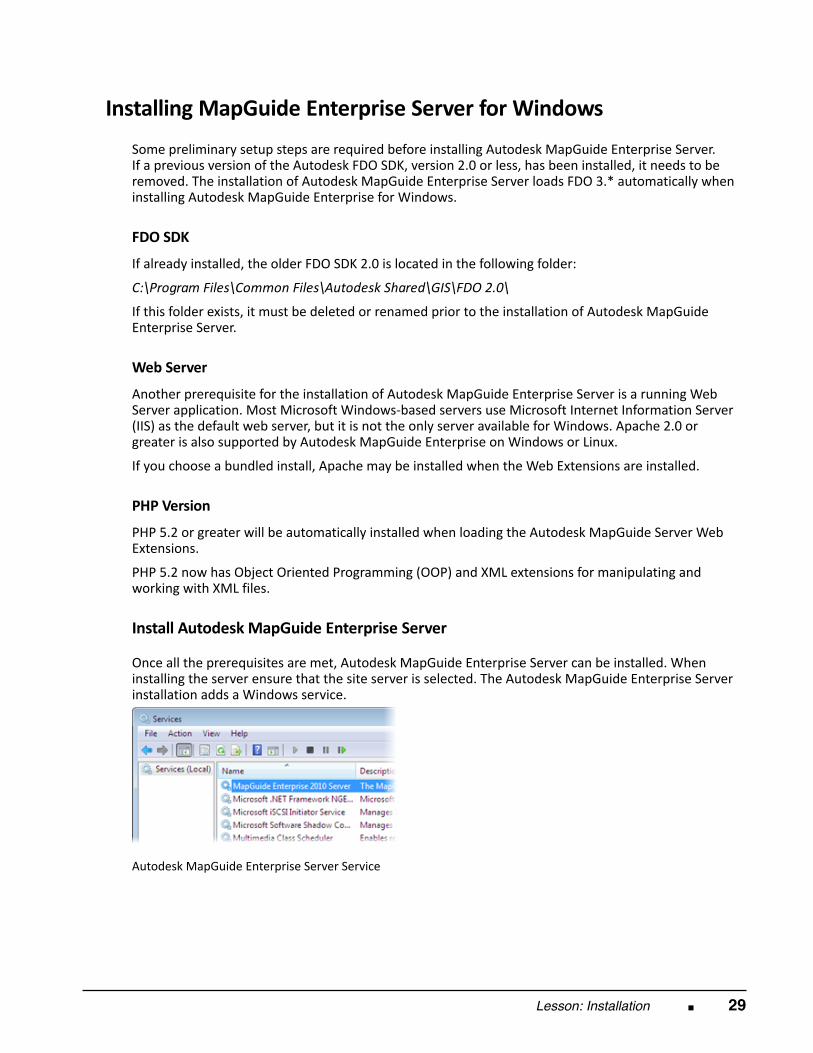
Once all the prerequisites are met, Autodesk MapGuide Enterprise Server can be installed. Wheninstalling the server ensure that the site server is selected. The Autodesk MapGuide Enterprise Serverinstallation adds a Windows service.
Autodesk MapGuide Enterprise Server Service
30 ■ Chapter 2: Autodesk MapGuide Enterprise Server
To ensure that the server is available and running, you can view the Services dialog box in ControlPanel.
Autodesk License Manager When installing Autodesk MapGuide Enterprise, you must also install AutodeskLicense Manger. When you register your Autodesk MapGuide Enterprise, the licensefile (*.lic) that Autodesk sends must be read by the License Manger application calledLMTOOLS.
Install Autodesk MapGuide Enterprise Web Server Extensions
Once the server is installed, the next step is to install the Web Server Extensions. The Web ServerExtensions install the API tools that PHP, ASP.NET, or Java (JSP) languages can use to communicatewith the server.
Depending on the choice of PHP, Microsoft .NET, or Java, you must also configure the developmentengine. For example, if the user chooses to install the .NET Web Server Extensions, the .NETFramework must also be installed on the server. If the user chooses the Java Web Server Extensions,then Apache Tomcat must also be installed.
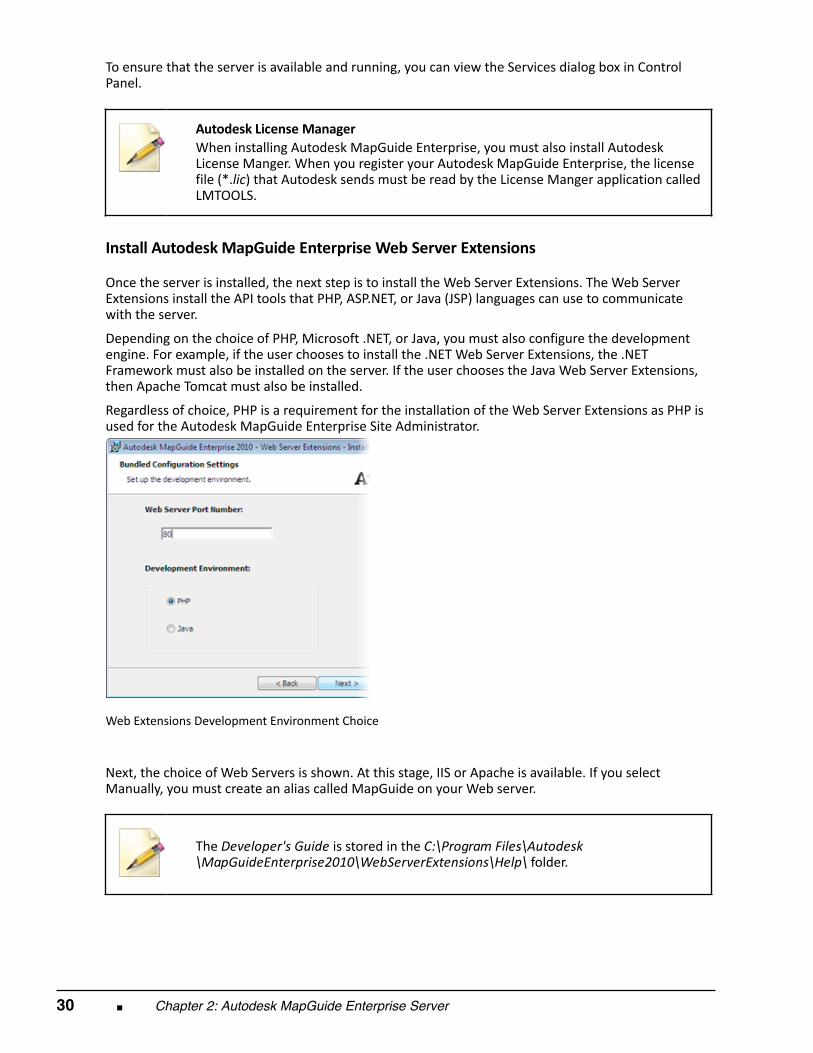
Regardless of choice, PHP is a requirement for the installation of the Web Server Extensions as PHP isused for the Autodesk MapGuide Enterprise Site Administrator.
Web Extensions Development Environment Choice
Next, the choice of Web Servers is shown. At this stage, IIS or Apache is available. If you selectManually, you must create an alias called MapGuide on your Web server.
The Developer's Guide is stored in the C:\Program Files\Autodesk\MapGuideEnterprise2010\WebServerExtensions\Help\ folder.
Lesson: Installation ■ 31
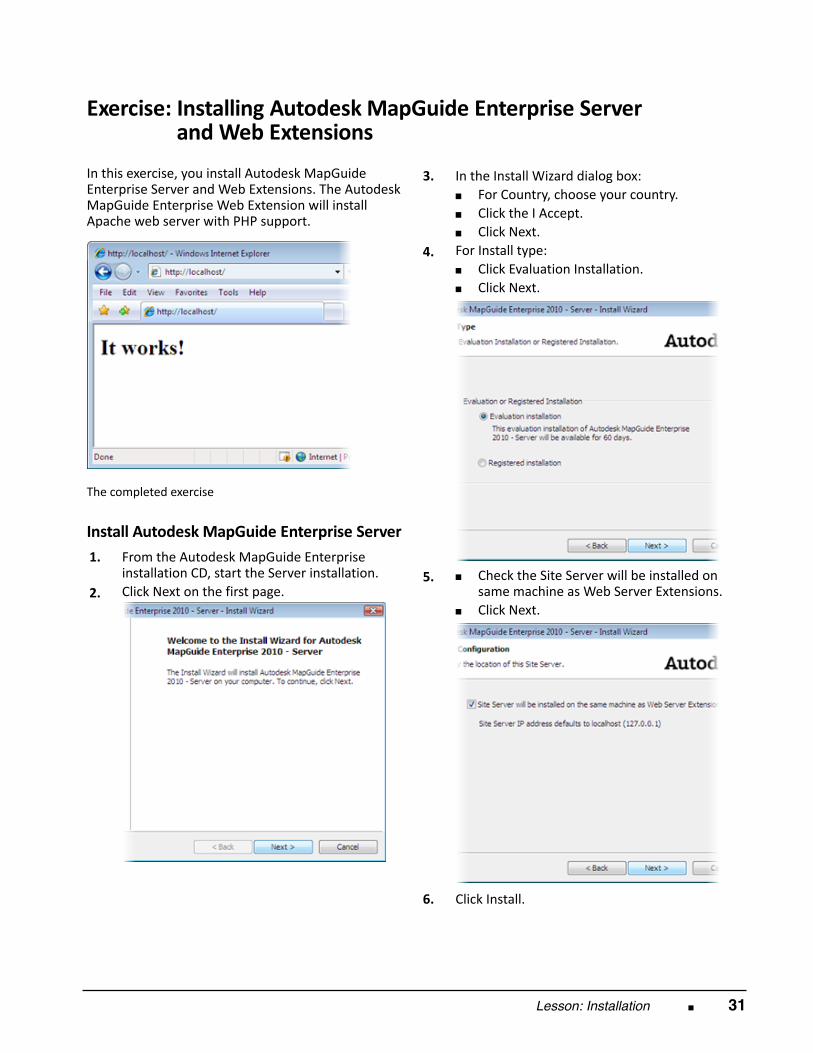
Exercise: Installing Autodesk MapGuide Enterprise ServerExercise: and Web Extensions In this exercise, you install Autodesk MapGuideEnterprise Server and Web Extensions. The AutodeskMapGuide Enterprise Web Extension will installApache web server with PHP support.
The completed exercise
Install Autodesk MapGuide Enterprise Server 1.
From the Autodesk MapGuide Enterpriseinstallation CD, start the Server installation.
2. Click Next on the first page.
3.
In the Install Wizard dialog box:■ For Country, choose your country.■ Click the I Accept.■ Click Next.
4.
For Install type:■ Click Evaluation Installation.■ Click Next.
5. ■ Check the Site Server will be installed on
same machine as Web Server Extensions.■ Click Next.
6.
Click Install.
32 ■ Chapter 2: Autodesk MapGuide Enterprise Server
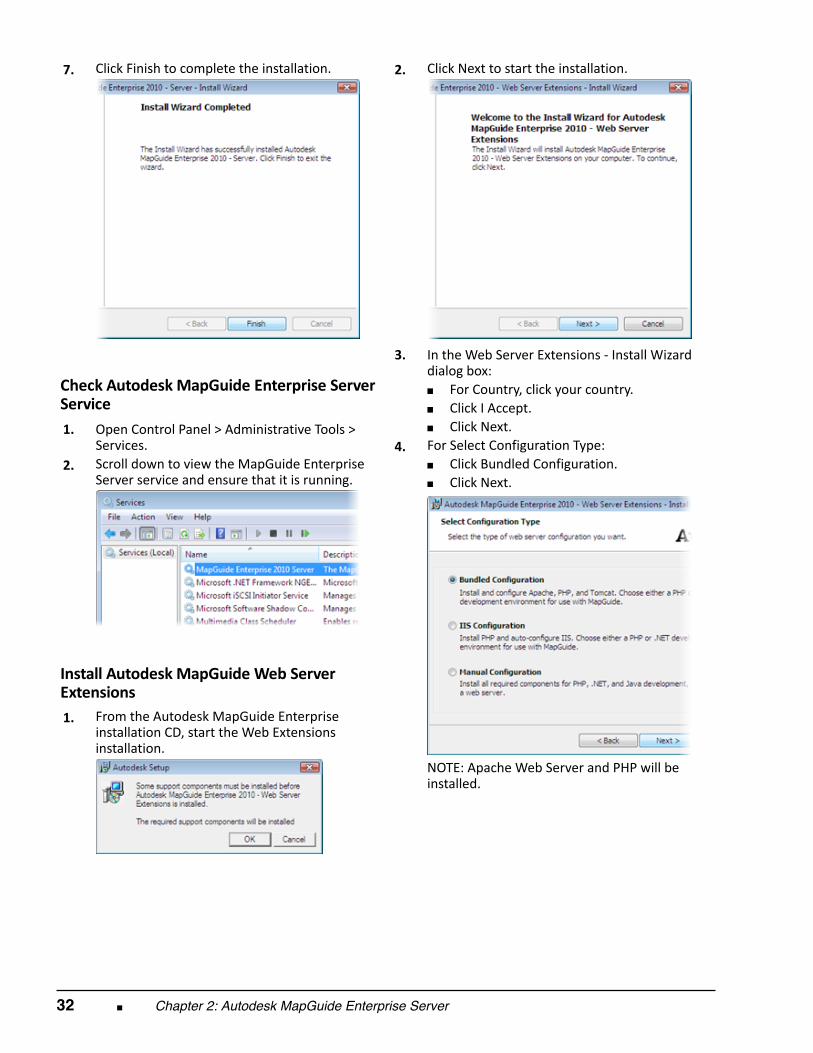
7.
Click Finish to complete the installation.
Check Autodesk MapGuide Enterprise ServerService 1.
Open Control Panel > Administrative Tools >Services.
2.
Scroll down to view the MapGuide EnterpriseServer service and ensure that it is running.
Install Autodesk MapGuide Web ServerExtensions 1.
From the Autodesk MapGuide Enterpriseinstallation CD, start the Web Extensionsinstallation.
2.
Click Next to start the installation.
3.
In the Web Server Extensions ‐ Install Wizarddialog box:■ For Country, click your country.■ Click I Accept.■ Click Next.
4.
For Select Configuration Type:■ Click Bundled Configuration.■ Click Next.
NOTE: Apache Web Server and PHP will beinstalled.
Lesson: Installation ■ 33
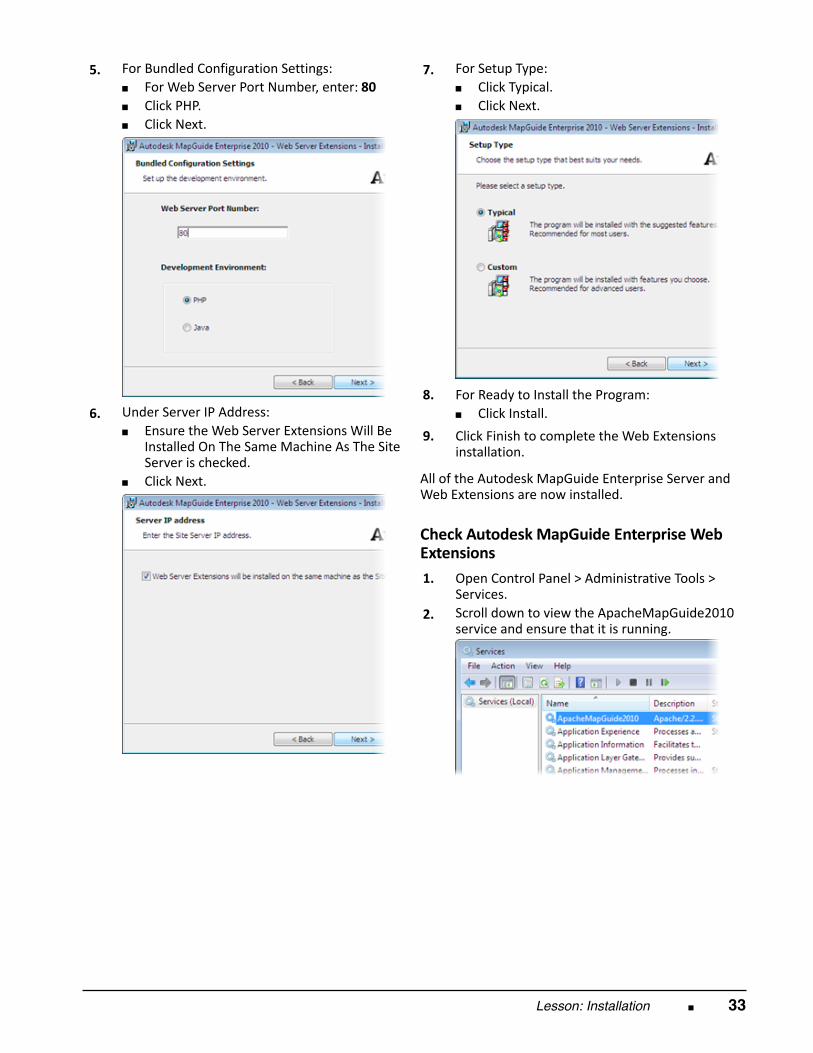
5.
For Bundled Configuration Settings:■ For Web Server Port Number, enter: 80■ Click PHP.■ Click Next.
6.
Under Server IP Address:■ Ensure the Web Server Extensions Will Be
Installed On The Same Machine As The SiteServer is checked.
■ Click Next.
7.
For Setup Type:■ Click Typical.■ Click Next.
8.
For Ready to Install the Program:■ Click Install.
9. Click Finish to complete the Web Extensionsinstallation.
All of the Autodesk MapGuide Enterprise Server andWeb Extensions are now installed.
Check Autodesk MapGuide Enterprise WebExtensions 1.
Open Control Panel > Administrative Tools >Services.
2.
Scroll down to view the ApacheMapGuide2010service and ensure that it is running.
34 ■ Chapter 2: Autodesk MapGuide Enterprise Server
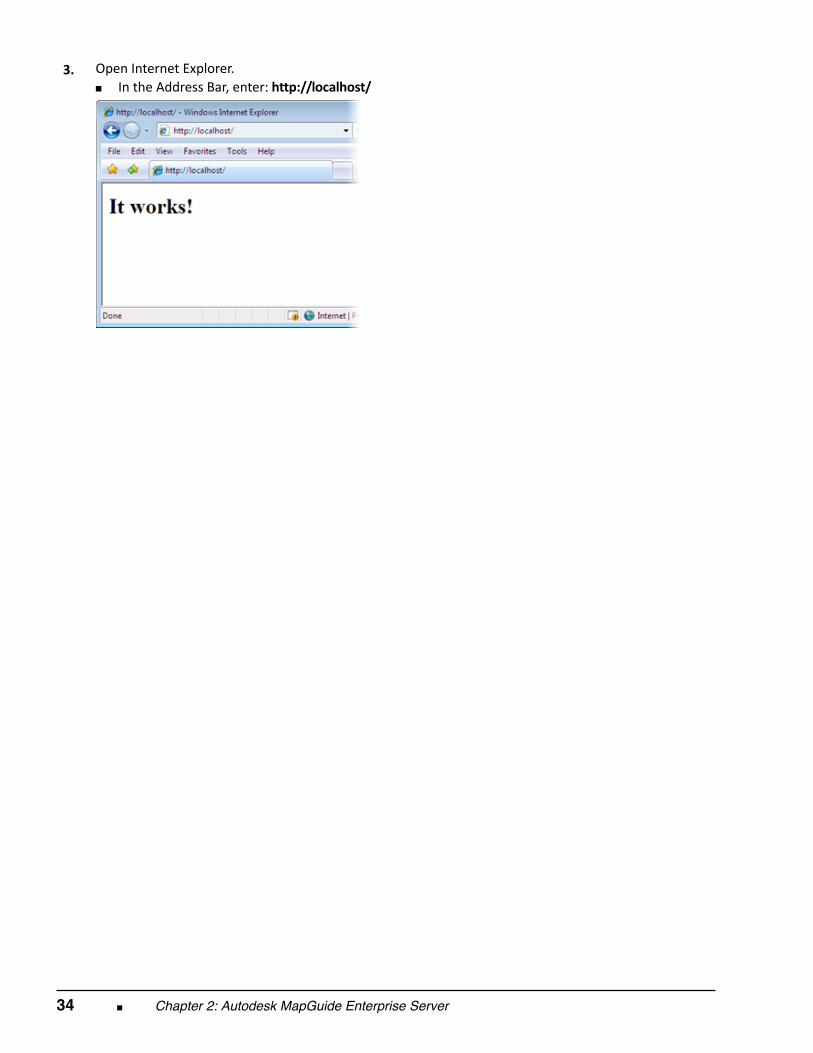
3.
Open Internet Explorer.■ In the Address Bar, enter: http://localhost/
Lesson: Server Configuration ■ 35
Lesson: Server Configuration
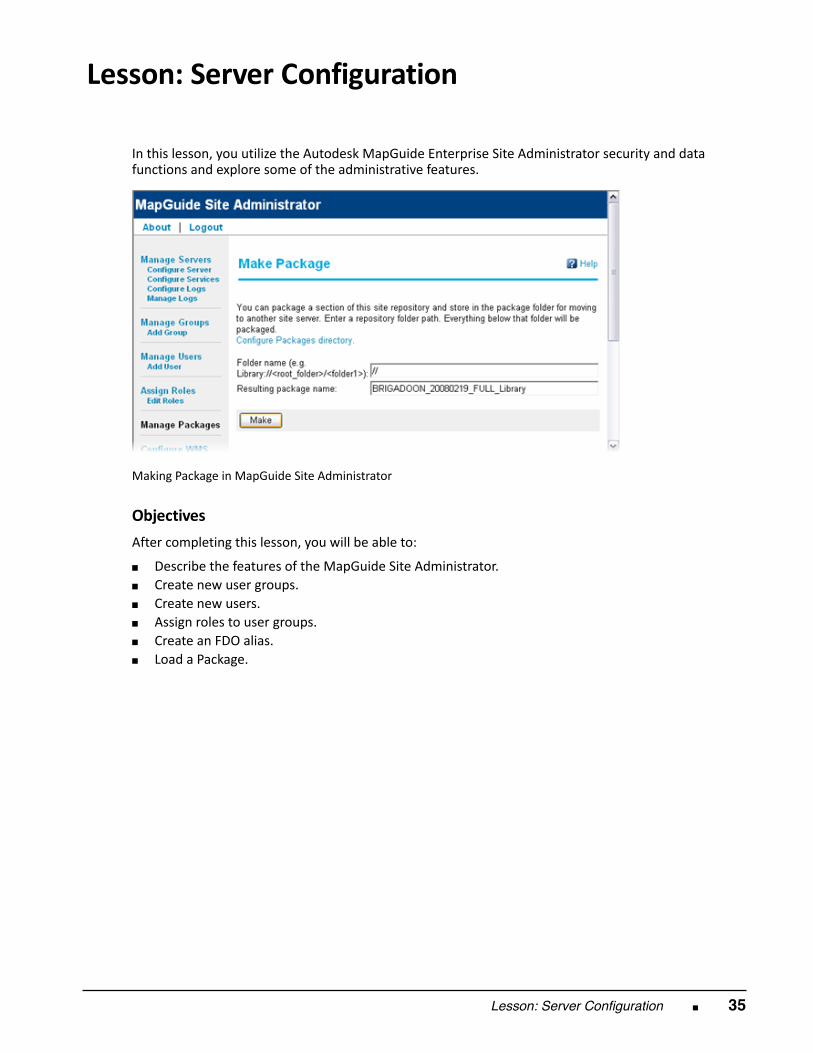
In this lesson, you utilize the Autodesk MapGuide Enterprise Site Administrator security and datafunctions and explore some of the administrative features.
Making Package in MapGuide Site Administrator
Objectives After completing this lesson, you will be able to:
■ Describe the features of the MapGuide Site Administrator.■ Create new user groups.■ Create new users.■ Assign roles to user groups.■ Create an FDO alias.■ Load a Package.
36 ■ Chapter 2: Autodesk MapGuide Enterprise Server
About the Site Administrator
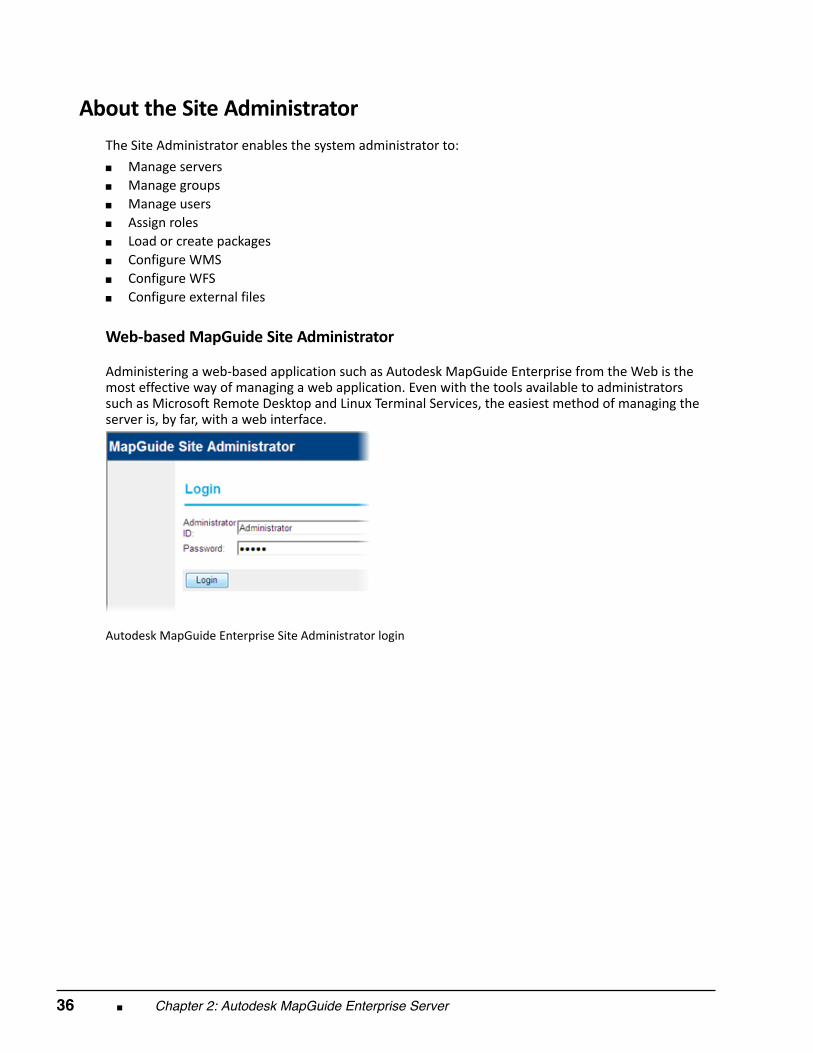
The Site Administrator enables the system administrator to: ■ Manage servers■ Manage groups■ Manage users■ Assign roles■ Load or create packages■ Configure WMS■ Configure WFS■ Configure external files Web‐based MapGuide Site Administrator
Administering a web‐based application such as Autodesk MapGuide Enterprise from the Web is themost effective way of managing a web application. Even with the tools available to administratorssuch as Microsoft Remote Desktop and Linux Terminal Services, the easiest method of managing theserver is, by far, with a web interface.
Autodesk MapGuide Enterprise Site Administrator login
Lesson: Server Configuration ■ 37
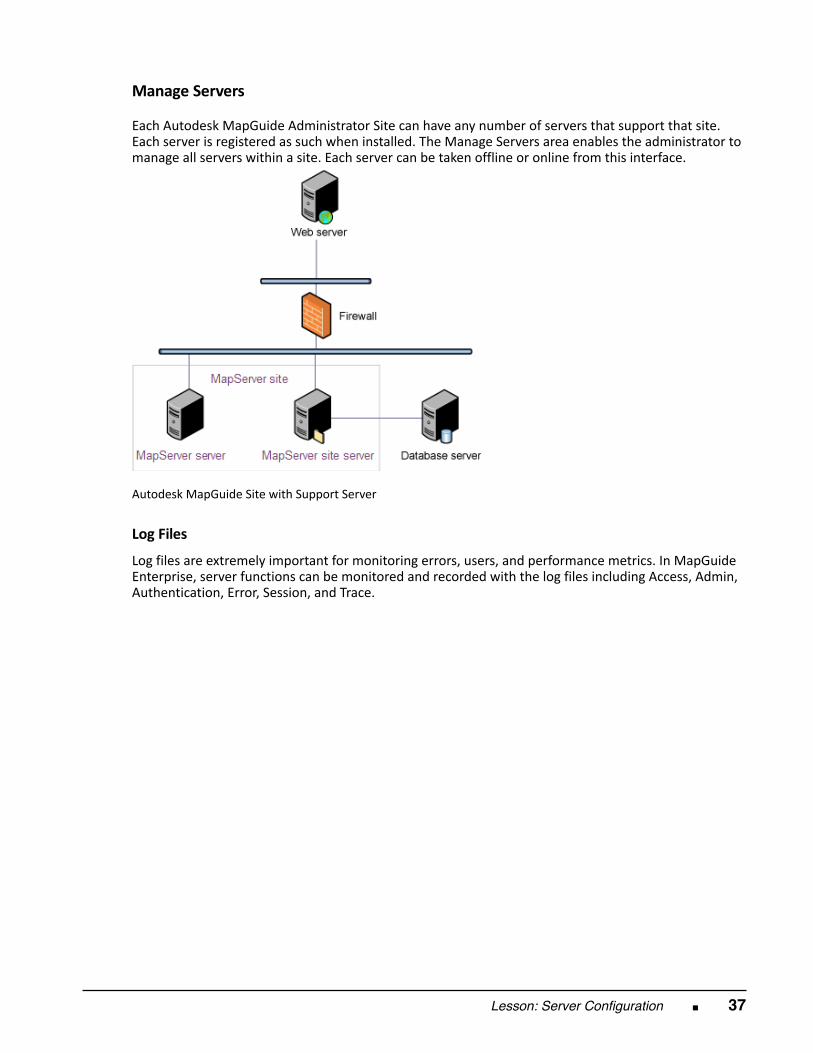
Manage Servers
Each Autodesk MapGuide Administrator Site can have any number of servers that support that site.Each server is registered as such when installed. The Manage Servers area enables the administrator tomanage all servers within a site. Each server can be taken offline or online from this interface.
Autodesk MapGuide Site with Support Server
Log Files Log files are extremely important for monitoring errors, users, and performance metrics. In MapGuideEnterprise, server functions can be monitored and recorded with the log files including Access, Admin,Authentication, Error, Session, and Trace.
38 ■ Chapter 2: Autodesk MapGuide Enterprise Server
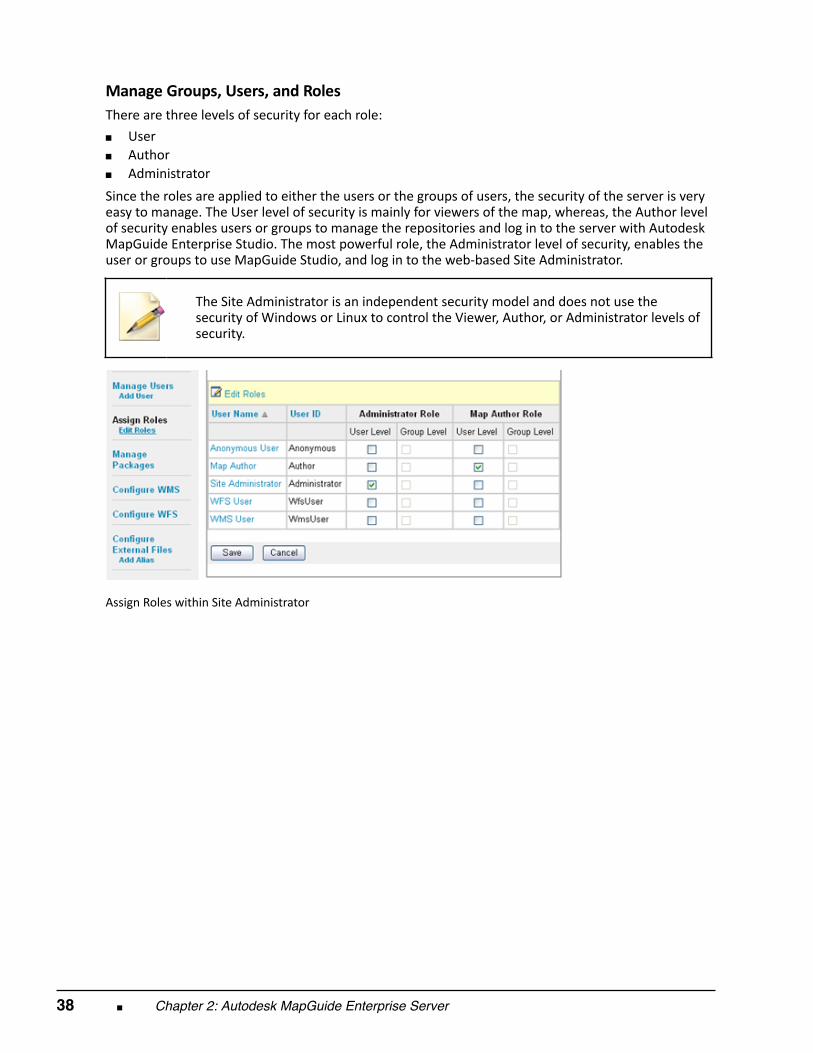
Manage Groups, Users, and Roles There are three levels of security for each role: ■ User■ Author■ Administrator Since the roles are applied to either the users or the groups of users, the security of the server is veryeasy to manage. The User level of security is mainly for viewers of the map, whereas, the Author levelof security enables users or groups to manage the repositories and log in to the server with AutodeskMapGuide Enterprise Studio. The most powerful role, the Administrator level of security, enables theuser or groups to use MapGuide Studio, and log in to the web‐based Site Administrator.
The Site Administrator is an independent security model and does not use thesecurity of Windows or Linux to control the Viewer, Author, or Administrator levels ofsecurity.
Assign Roles within Site Administrator
Lesson: Server Configuration ■ 39
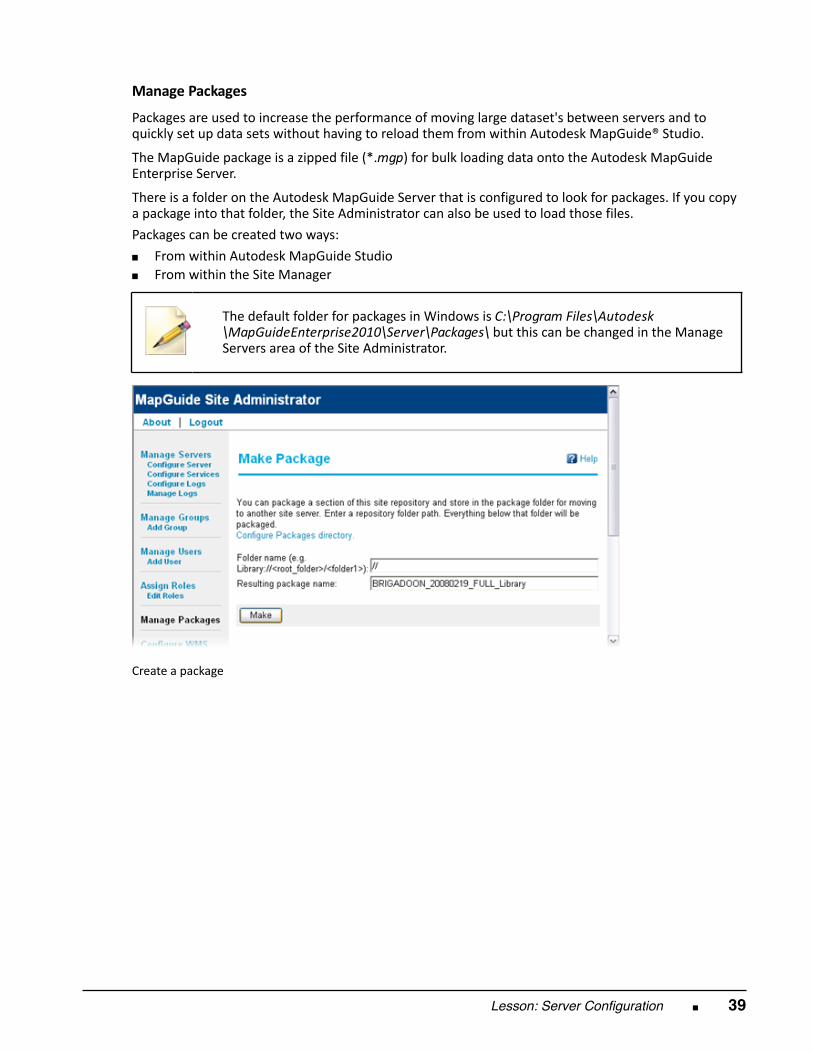
Manage Packages Packages are used to increase the performance of moving large dataset's between servers and toquickly set up data sets without having to reload them from within Autodesk MapGuide® Studio.
The MapGuide package is a zipped file (*.mgp) for bulk loading data onto the Autodesk MapGuideEnterprise Server.
There is a folder on the Autodesk MapGuide Server that is configured to look for packages. If you copya package into that folder, the Site Administrator can also be used to load those files. Packages can be created two ways: ■ From within Autodesk MapGuide Studio■ From within the Site Manager
The default folder for packages in Windows is C:\Program Files\Autodesk
\MapGuideEnterprise2010\Server\Packages\ but this can be changed in the ManageServers area of the Site Administrator.
Create a package
40 ■ Chapter 2: Autodesk MapGuide Enterprise Server
Configure WMS and WFS The Open GIS Consortium (OGC) has developed standards for distributing GIS information. Usingthe Web Map Service (WMS) and Web Feature Service (WFS), Autodesk MapGuide Enterprise candistribute all mapping information to consumers of the WMS and WFS. WMS renders the mappinginformation in an image file, such as PNG, so that the map information can be used in a browser.Inquiry commands usually return an XML response that can be interpreted by an application.Unlike WMS, WFS actually returns an XML response that sends the coordinate geometry and all thefeature information so that any client of the WFS can utilize the information to generate live vectorinformation.
The fact that Autodesk MapGuide Enterprise can distribute its GIS information using WMS (raster) orWFS (vector) formats makes it extremely flexible and powerful. All settings for the WMS and WFS areconfigured in the Site Administrator.
Autodesk MapGuide Enterprise is OGC compliant for WMS
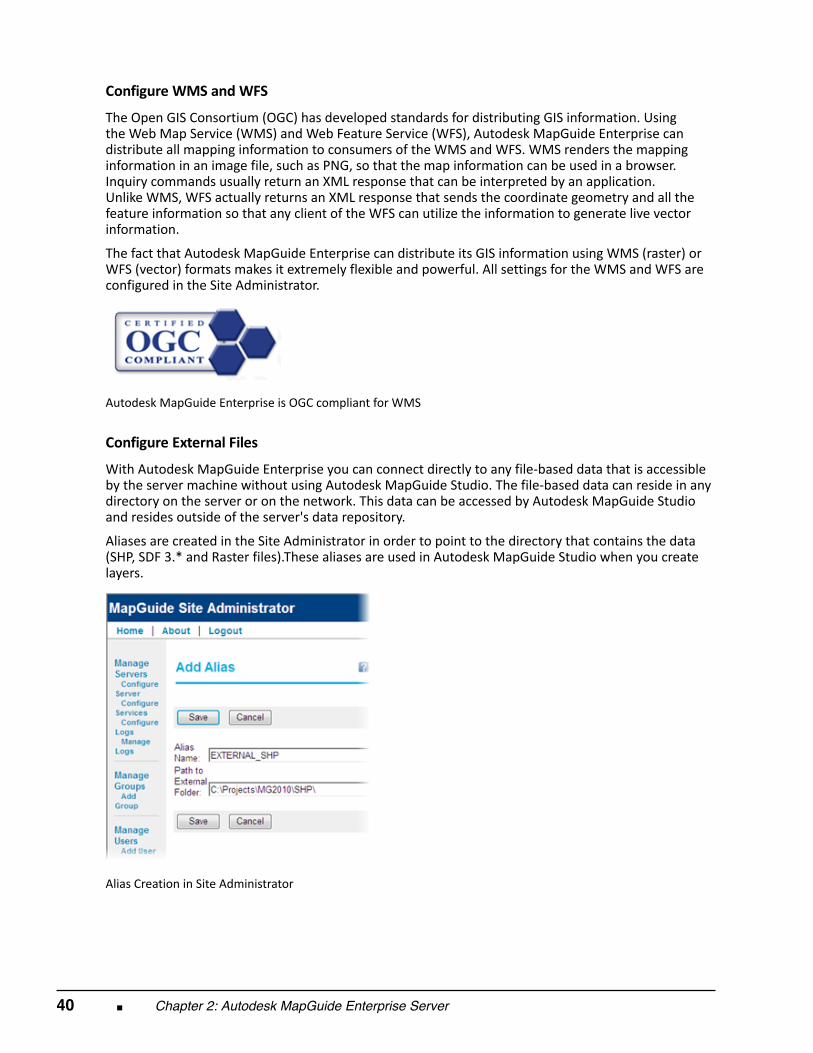
Configure External Files With Autodesk MapGuide Enterprise you can connect directly to any file‐based data that is accessibleby the server machine without using Autodesk MapGuide Studio. The file‐based data can reside in anydirectory on the server or on the network. This data can be accessed by Autodesk MapGuide Studioand resides outside of the server's data repository.
Aliases are created in the Site Administrator in order to point to the directory that contains the data(SHP, SDF 3.* and Raster files).These aliases are used in Autodesk MapGuide Studio when you createlayers.
Alias Creation in Site Administrator
Lesson: Server Configuration ■ 41
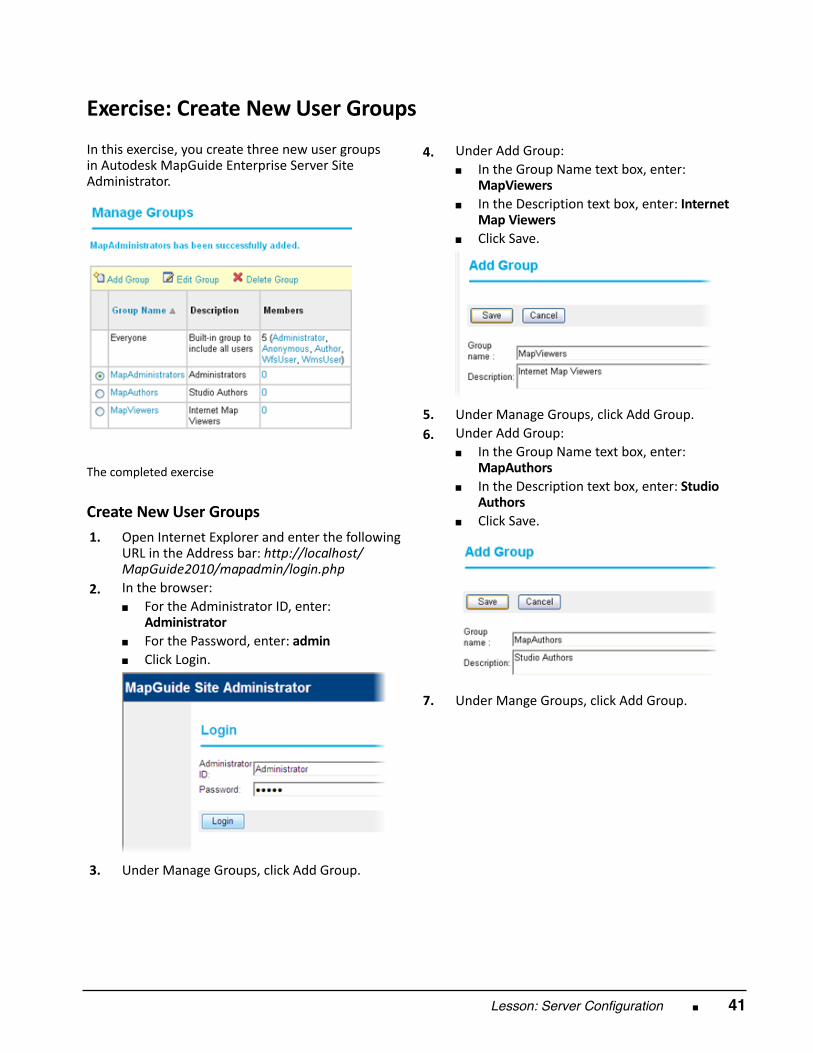
Exercise: Create New User Groups In this exercise, you create three new user groupsin Autodesk MapGuide Enterprise Server SiteAdministrator.
The completed exercise
Create New User Groups 1.
Open Internet Explorer and enter the followingURL in the Address bar: http://localhost/MapGuide2010/mapadmin/login.php
2.
In the browser:■ For the Administrator ID, enter:
Administrator■ For the Password, enter: admin■ Click Login.
3.
Under Manage Groups, click Add Group.
4.
Under Add Group:■ In the Group Name text box, enter:
MapViewers■ In the Description text box, enter: Internet
Map Viewers■ Click Save.
5.
Under Manage Groups, click Add Group. 6.
Under Add Group:■ In the Group Name text box, enter:
MapAuthors■ In the Description text box, enter: Studio
Authors■ Click Save.
7.
Under Mange Groups, click Add Group.
42 ■ Chapter 2: Autodesk MapGuide Enterprise Server
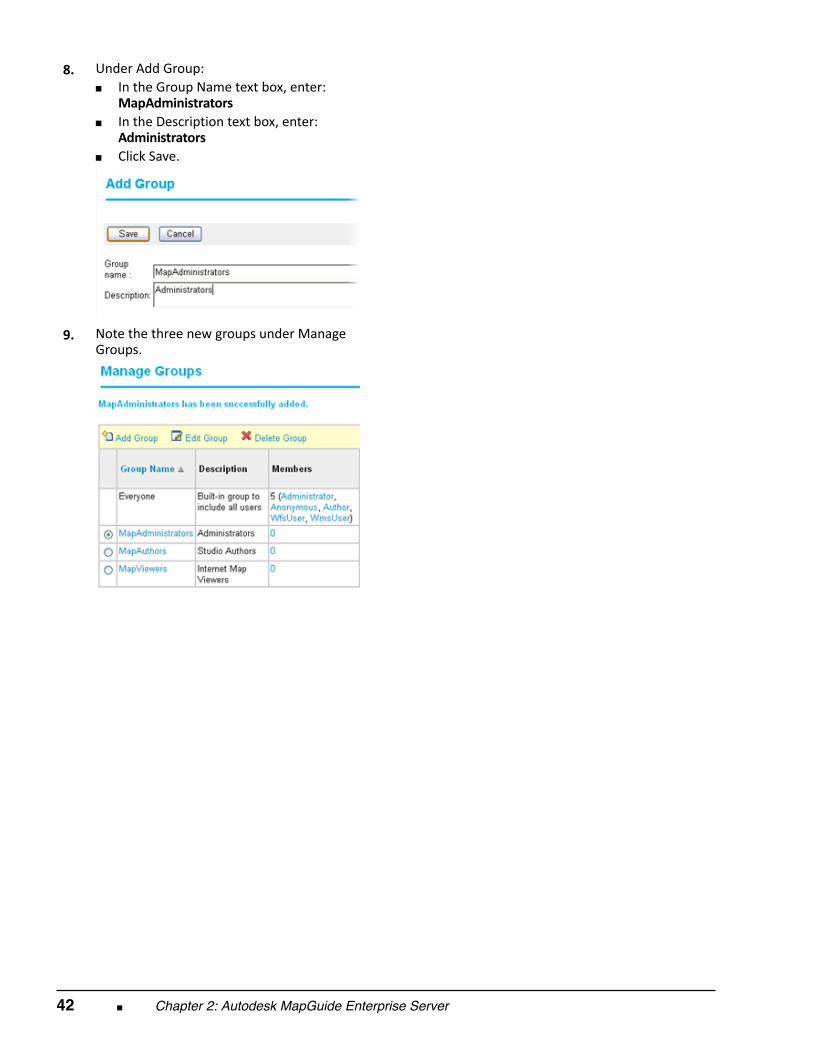
8.
Under Add Group:■ In the Group Name text box, enter:
MapAdministrators■ In the Description text box, enter:
Administrators■ Click Save.
9.
Note the three new groups under ManageGroups.
Lesson: Server Configuration ■ 43
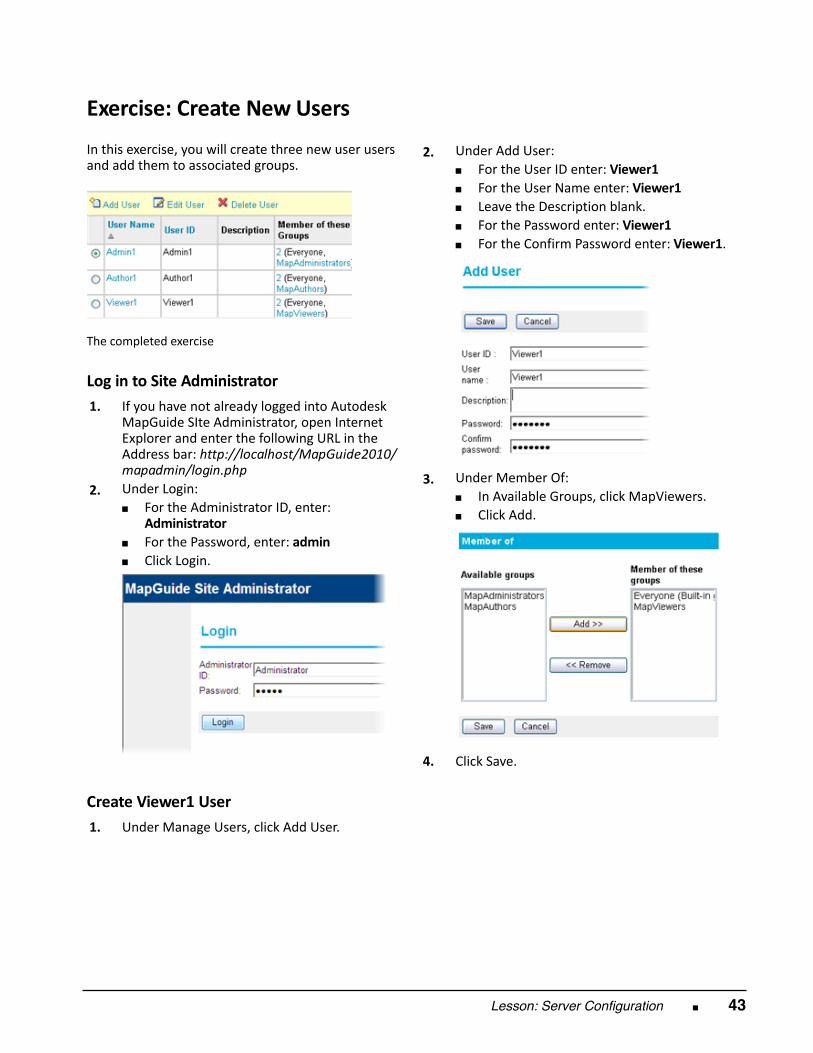
Exercise: Create New Users In this exercise, you will create three new user usersand add them to associated groups.
The completed exercise
Log in to Site Administrator 1.
If you have not already logged into AutodeskMapGuide SIte Administrator, open InternetExplorer and enter the following URL in theAddress bar: http://localhost/MapGuide2010/mapadmin/login.php
2.
Under Login:■ For the Administrator ID, enter:
Administrator■ For the Password, enter: admin■ Click Login.
Create Viewer1 User 1.
Under Manage Users, click Add User.
2.
Under Add User:■ For the User ID enter: Viewer1■ For the User Name enter: Viewer1■ Leave the Description blank.■ For the Password enter: Viewer1■ For the Confirm Password enter: Viewer1.
3.
Under Member Of:■ In Available Groups, click MapViewers.■ Click Add.
4.
Click Save.
44 ■ Chapter 2: Autodesk MapGuide Enterprise Server
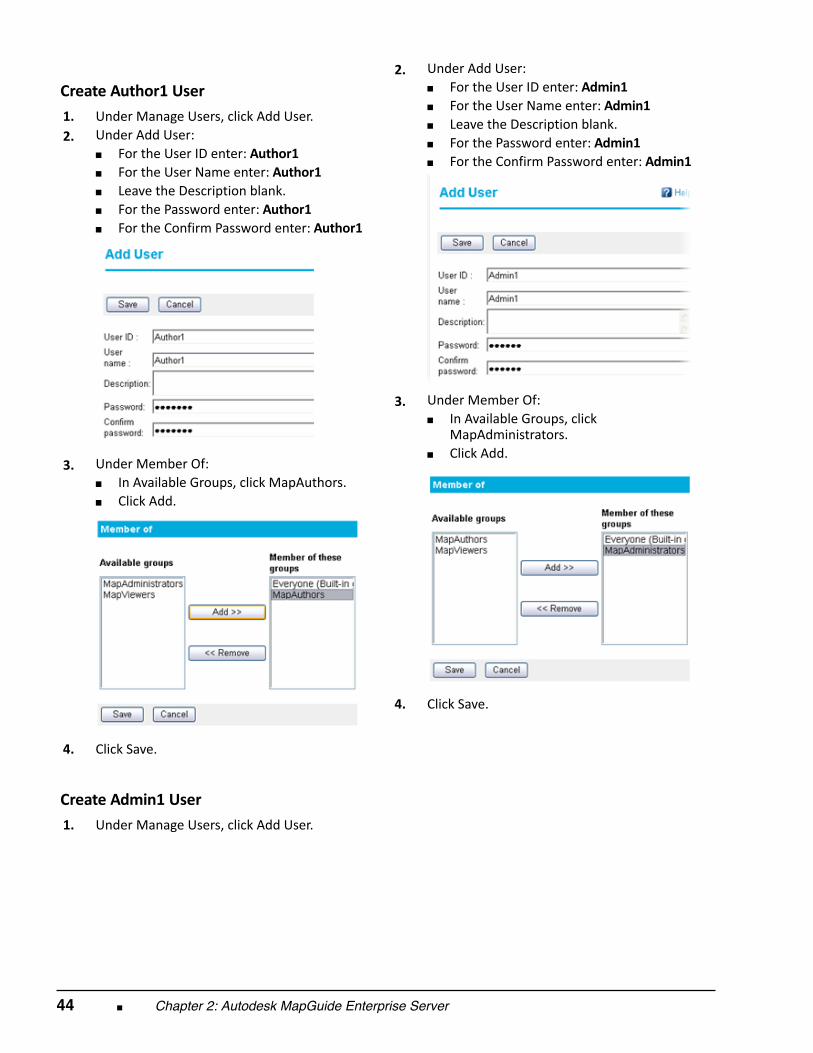
Create Author1 User 1.
Under Manage Users, click Add User. 2.
Under Add User:■ For the User ID enter: Author1■ For the User Name enter: Author1■ Leave the Description blank.■ For the Password enter: Author1■ For the Confirm Password enter: Author1
3.
Under Member Of:■ In Available Groups, click MapAuthors.■ Click Add.
4.
Click Save.
Create Admin1 User 1.
Under Manage Users, click Add User.
2.
Under Add User:■ For the User ID enter: Admin1■ For the User Name enter: Admin1■ Leave the Description blank.■ For the Password enter: Admin1■ For the Confirm Password enter: Admin1
3.
Under Member Of:■ In Available Groups, click
MapAdministrators.■ Click Add.
4.
Click Save.
Lesson: Server Configuration ■ 45
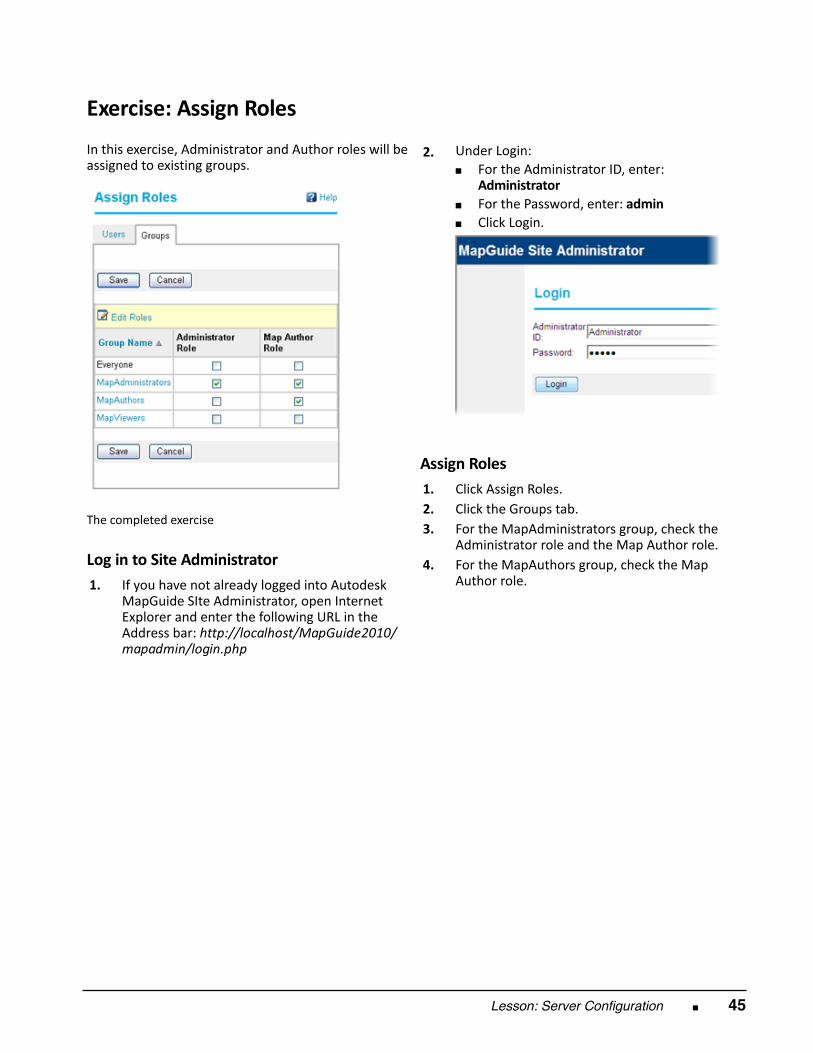
Exercise: Assign Roles In this exercise, Administrator and Author roles will beassigned to existing groups.
The completed exercise
Log in to Site Administrator 1.
If you have not already logged into AutodeskMapGuide SIte Administrator, open InternetExplorer and enter the following URL in theAddress bar: http://localhost/MapGuide2010/mapadmin/login.php
2.
Under Login:■ For the Administrator ID, enter:
Administrator■ For the Password, enter: admin■ Click Login.
Assign Roles 1.
Click Assign Roles. 2.
Click the Groups tab. 3.
For the MapAdministrators group, check theAdministrator role and the Map Author role.
4.
For the MapAuthors group, check the MapAuthor role.
46 ■ Chapter 2: Autodesk MapGuide Enterprise Server
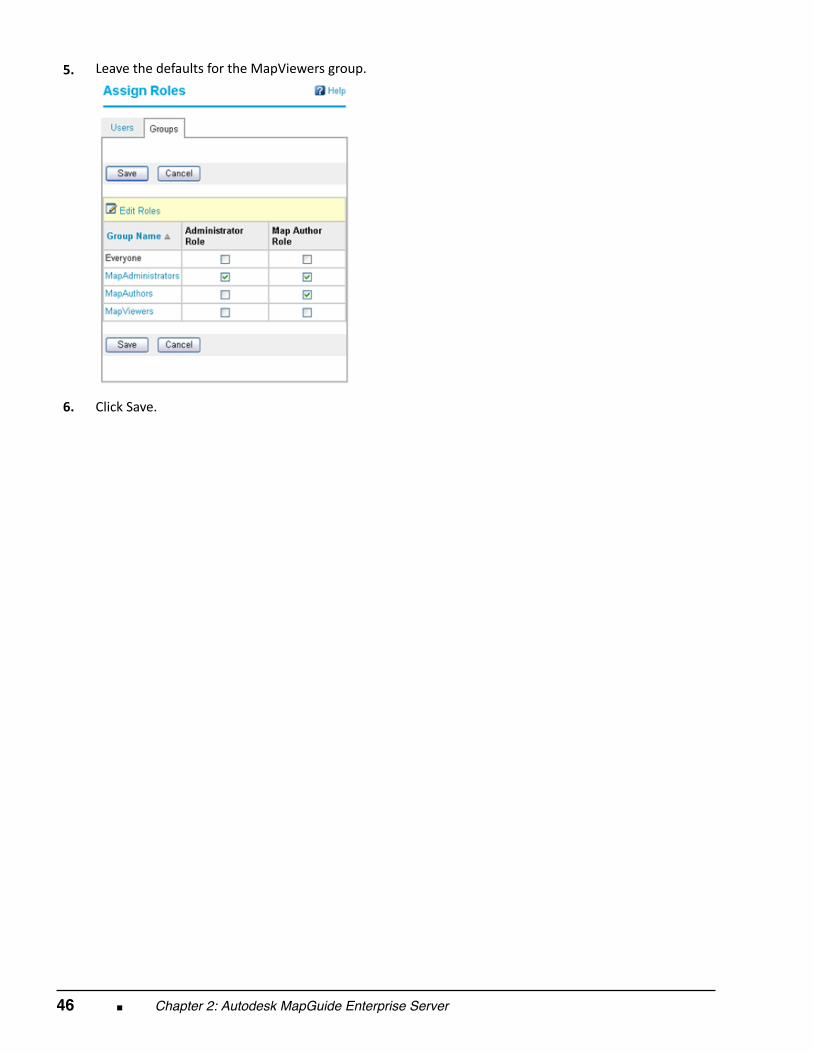
5.
Leave the defaults for the MapViewers group.
6.
Click Save.
Lesson: Server Configuration ■ 47
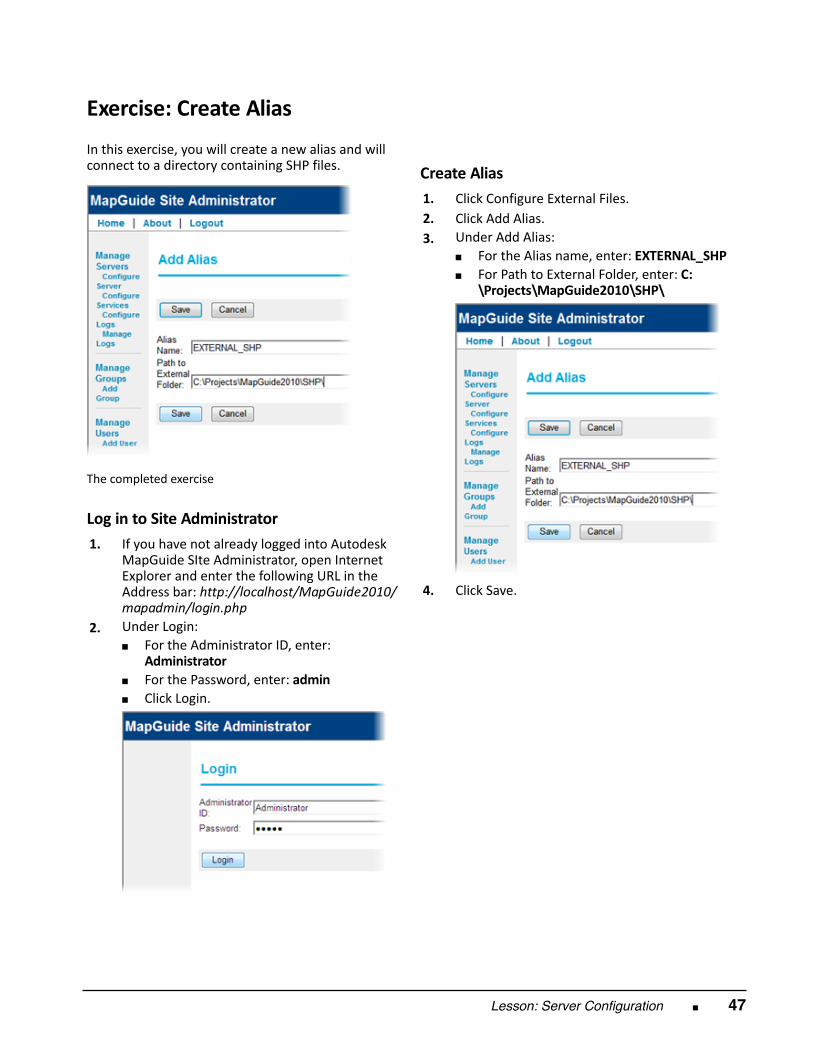
Exercise: Create Alias In this exercise, you will create a new alias and willconnect to a directory containing SHP files.
The completed exercise
Log in to Site Administrator 1.
If you have not already logged into AutodeskMapGuide SIte Administrator, open InternetExplorer and enter the following URL in theAddress bar: http://localhost/MapGuide2010/mapadmin/login.php
2.
Under Login:■ For the Administrator ID, enter:
Administrator■ For the Password, enter: admin■ Click Login.
Create Alias 1.
Click Configure External Files. 2.
Click Add Alias. 3.
Under Add Alias:■ For the Alias name, enter: EXTERNAL_SHP■ For Path to External Folder, enter: C:
\Projects\MapGuide2010\SHP\
4.
Click Save.
48 ■ Chapter 2: Autodesk MapGuide Enterprise Server
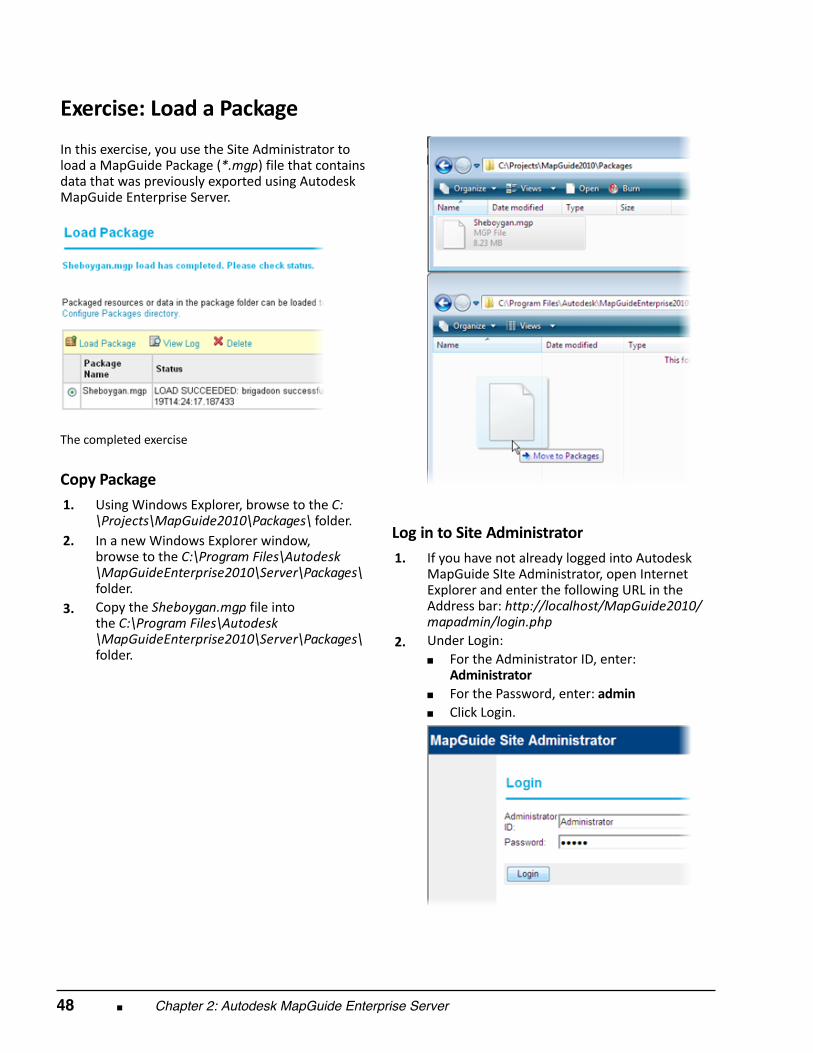
Exercise: Load a Package In this exercise, you use the Site Administrator toload a MapGuide Package (*.mgp) file that containsdata that was previously exported using AutodeskMapGuide Enterprise Server.
The completed exercise
Copy Package 1.
Using Windows Explorer, browse to the C:\Projects\MapGuide2010\Packages\ folder.
2.
In a new Windows Explorer window,browse to the C:\Program Files\Autodesk\MapGuideEnterprise2010\Server\Packages\folder.
3.
Copy the Sheboygan.mgp file intothe C:\Program Files\Autodesk\MapGuideEnterprise2010\Server\Packages\folder.
Log in to Site Administrator 1.
If you have not already logged into AutodeskMapGuide SIte Administrator, open InternetExplorer and enter the following URL in theAddress bar: http://localhost/MapGuide2010/mapadmin/login.php
2.
Under Login:■ For the Administrator ID, enter:
Administrator■ For the Password, enter: admin■ Click Login.
Lesson: Server Configuration ■ 49
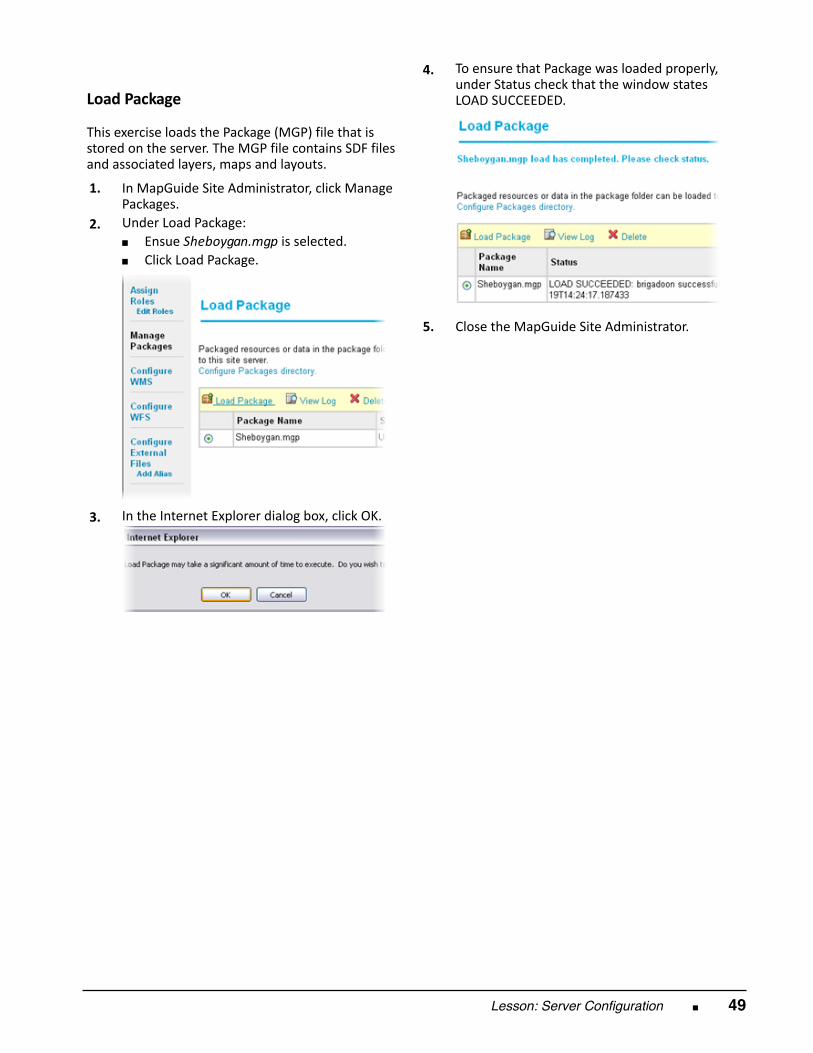
Load Package This exercise loads the Package (MGP) file that isstored on the server. The MGP file contains SDF filesand associated layers, maps and layouts. 1.
In MapGuide Site Administrator, click ManagePackages.
2.
Under Load Package:■ Ensue Sheboygan.mgp is selected.■ Click Load Package.
3.
In the Internet Explorer dialog box, click OK.
4.
To ensure that Package was loaded properly,under Status check that the window statesLOAD SUCCEEDED.
5.
Close the MapGuide Site Administrator.

50 ■ Chapter 2: Autodesk MapGuide Enterprise Server
Chapter Summary
Having completed this chapter, you can:
■ Install MapGuide Server and Web Server Extensions.■ Configure MapGuide Enterprise with the Site Administrator.
Chapter Overview ■ 51
Chapter
3
Authoring with AutodeskMapGuide Studio
In this chapter, you get an in‐depth look at Autodesk MapGuide® Studio, an authoring environmentthat handles most aspects of collecting and preparing geospatial data for distribution on the Internet.MapGuide Studio follows four steps to get information to the Web: Create resources from your sourcedata, build styled and themed layers from the resources, compile the layers into a map, and finally,embed the map in a web page using a web layout.
The final step, creating a web layout, is not covered in this chapter.
Objectives After completing this chapter, you will be able to:
■ Explain the difference between data loading and data connections within MapGuide Studio.■ Describe the data loading process in MapGuide Studio.■ Create layers in MapGuide Studio.■ Create maps in MapGuide Studio.
52 ■ Chapter 3: Authoring with Autodesk MapGuide Studio
Lesson: Data Connections
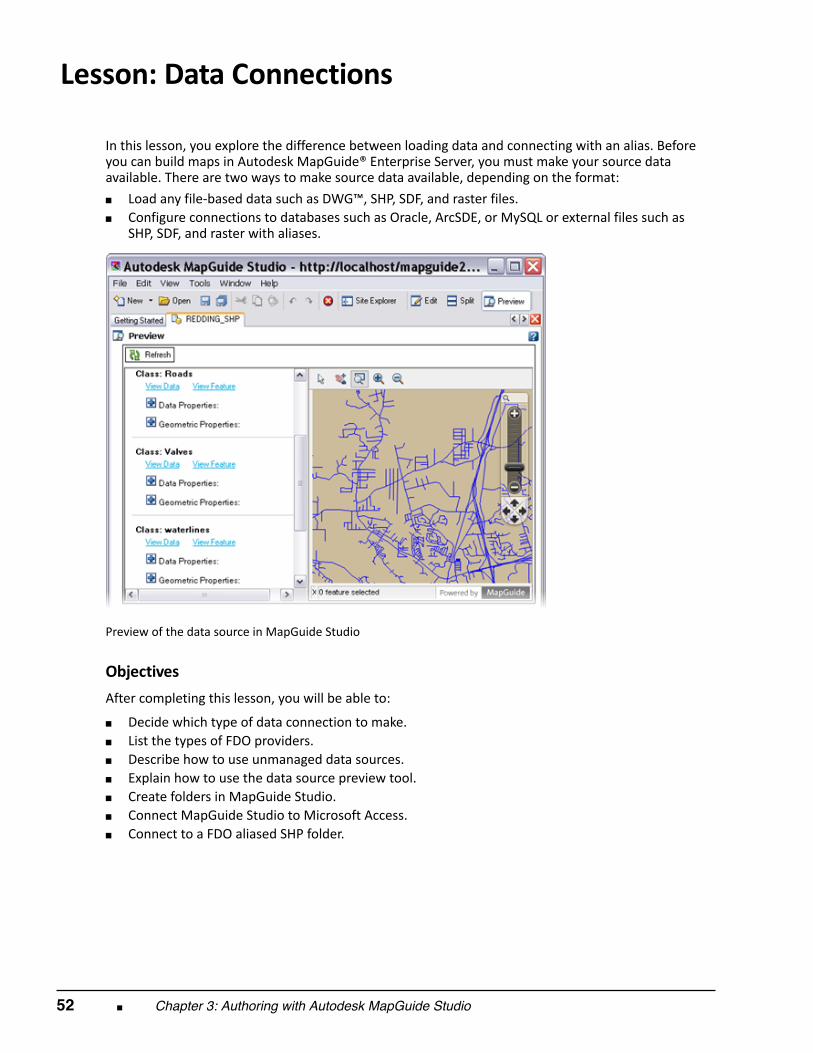
In this lesson, you explore the difference between loading data and connecting with an alias. Beforeyou can build maps in Autodesk MapGuide® Enterprise Server, you must make your source dataavailable. There are two ways to make source data available, depending on the format: ■ Load any file‐based data such as DWG™, SHP, SDF, and raster files.■ Configure connections to databases such as Oracle, ArcSDE, or MySQL or external files such as
SHP, SDF, and raster with aliases.
Preview of the data source in MapGuide Studio
Objectives After completing this lesson, you will be able to:
■ Decide which type of data connection to make.■ List the types of FDO providers.■ Describe how to use unmanaged data sources.■ Explain how to use the data source preview tool.■ Create folders in MapGuide Studio.■ Connect MapGuide Studio to Microsoft Access.■ Connect to a FDO aliased SHP folder.
Lesson: Data Connections ■ 53
About Data Management
You can load data by converting all, or part of, the source file into a format that Autodesk MapGuideEnterprise Server can use (for example SDF, SHP, or DWF™) and store it as a resource. For example, youcan automatically load all the layers in a DWG file and create a separate SDF resource for each one.
Data stored in a database does not need to be loaded. You simply connect to it by configuring adata source for it. In this case, the information necessary to connect to the database is stored as theresource.
Autodesk MapGuide Enterprise Server uses Autodesk Feature Data Objects (FDO) to make databaseconnections. An Autodesk FDO provider is an implementation of the FDO API that provides access todata in a particular DataStore. The resource repository is an XML database that stores the resourcescreated by loading file‐based data or by connecting to databases. There is one repository per site andit resides on the site server.
Resources are designed to be reused and shared. Some resources reference other resources. Forexample, maps and layers are stored as separate resources, and the map references the layers thatare included in the map. Layers reference feature sources or drawing sources. When you update theoriginal feature source, the layer is automatically updated as well.
Resources Some resources stored on the MapGuide Server, such as print layouts, are self‐sufficient and do notreference any other resources or files. Some resources use associated resource data. For example, anArcSDE feature source uses a file that holds the database credentials. Resource data can be stored asfiles, streams, or strings. ■ Files are used when the amount of data is large, such as DWF or SDF files.■ Streams are used for faster access to smaller pieces of binary data, such as symbols.■ Strings are used for small pieces of text data, such as database access credentials or aliases.
General Process Regardless of whether the data you are using is file‐based, such as SDF or SHP files, or containedin a database, such as Oracle or MySQL, the following steps are always the same within AutodeskMapGuide Studio: ■ Find data.■ Make layers.■ Build a map.■ Place the map on the Internet.
54 ■ Chapter 3: Authoring with Autodesk MapGuide Studio
Connecting with FDO Data Sources
FDO Connections Connections to databases are stored as resources in the resource repository and can be edited justlike any other resource. Connection resources use one of the following providers: ■ Autodesk FDO Provider for Oracle■ Autodesk FDO Provider for SQL Server■ Autodesk FDO Provider for Raster■ OSGeo FDO Provider for ODBC■ OSGeo FDO Provider for SDF■ OSGeo FDO Provider for SHP■ OSGeo FDO Provider for MySQL■ OSGeo FDO Provider for ArcSDE■ OSGeo FDO Provider for SQL Server Spatial■ OSGeo FDO Provider for WMS■ OSGeo FDO Provider for WFS
Some FDO Providers require that the associated client software be installed. Forexample, the Oracle Client is required to connect to an Oracle database.
Data connections using FDO providers give Autodesk MapGuide Enterprise the ability to render datain "real time" from live GIS databases or repositories. Each FDO provider can access the data featuresin the same way.
Once the vector features are returned to the Autodesk MapGuide Studio, every feature is treated thesame way and can be authored as a point, polygon, or polyline feature, regardless of the original datasource.
Lesson: Data Connections ■ 55
About Unmanaged Data Sources
With Autodesk MapGuide Enterprise you can connect directly to any file‐based data that is accessibleby the server machine without the need for a load procedure in Autodesk MapGuide Studio. The file‐based data can reside in any directory on the server or network.
These unmanaged data sources are linked with an alias pointing to the folder on the server thatcontains the files. You create these aliases with the Autodesk MapGuide Enterprise Site Administrator.
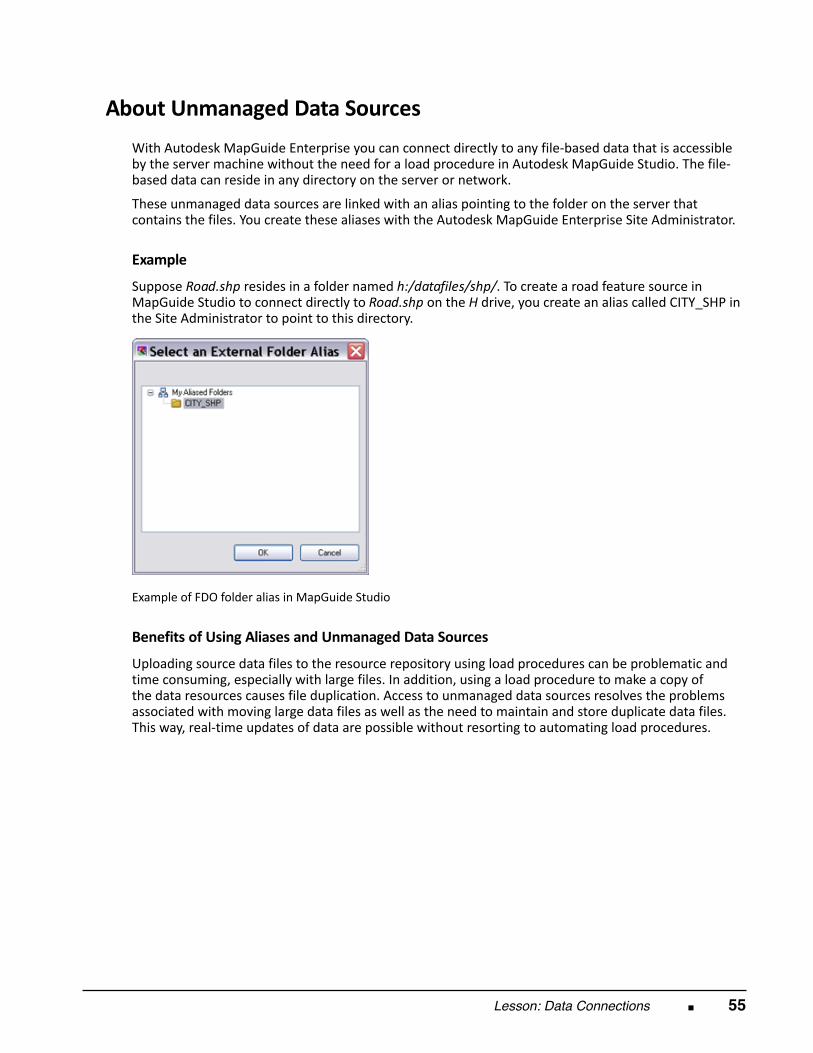
Example Suppose Road.shp resides in a folder named h:/datafiles/shp/. To create a road feature source inMapGuide Studio to connect directly to Road.shp on the H drive, you create an alias called CITY_SHP inthe Site Administrator to point to this directory.
Example of FDO folder alias in MapGuide Studio
Benefits of Using Aliases and Unmanaged Data Sources Uploading source data files to the resource repository using load procedures can be problematic andtime consuming, especially with large files. In addition, using a load procedure to make a copy ofthe data resources causes file duplication. Access to unmanaged data sources resolves the problemsassociated with moving large data files as well as the need to maintain and store duplicate data files.This way, real‐time updates of data are possible without resorting to automating load procedures.
56 ■ Chapter 3: Authoring with Autodesk MapGuide Studio
Using Data Source Preview
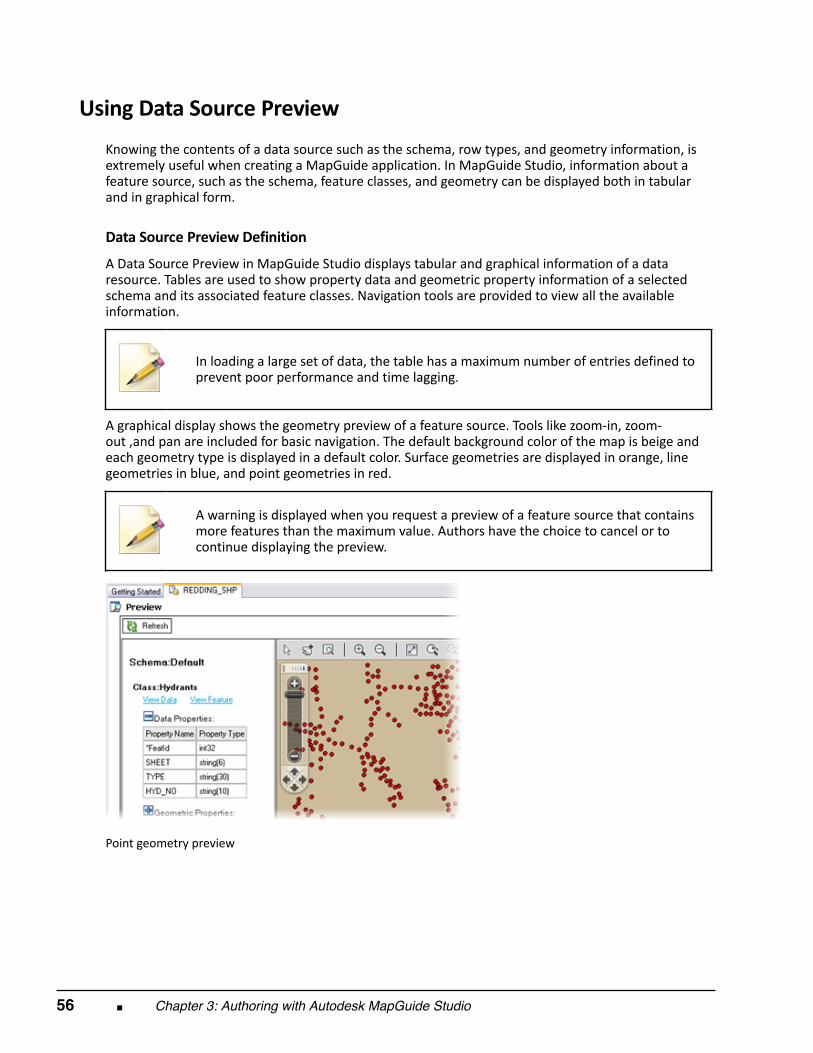
Knowing the contents of a data source such as the schema, row types, and geometry information, isextremely useful when creating a MapGuide application. In MapGuide Studio, information about afeature source, such as the schema, feature classes, and geometry can be displayed both in tabularand in graphical form.
Data Source Preview Definition A Data Source Preview in MapGuide Studio displays tabular and graphical information of a dataresource. Tables are used to show property data and geometric property information of a selectedschema and its associated feature classes. Navigation tools are provided to view all the availableinformation.
In loading a large set of data, the table has a maximum number of entries defined toprevent poor performance and time lagging.
A graphical display shows the geometry preview of a feature source. Tools like zoom‐in, zoom‐out ,and pan are included for basic navigation. The default background color of the map is beige andeach geometry type is displayed in a default color. Surface geometries are displayed in orange, linegeometries in blue, and point geometries in red.
A warning is displayed when you request a preview of a feature source that contains
more features than the maximum value. Authors have the choice to cancel or tocontinue displaying the preview.
Point geometry preview
Lesson: Data Connections ■ 57
An Example After adding Parcels.sdf data source in MapGuide Studio, the author can simply click the previewbutton to see a graphical preview of Parcels.sdf.
Benefits of Using Data Source Preview It is very difficult to know the full contents of a particular data resource simply by the file name.Autodesk MapGuide Enterprise solves this problem by displaying a tabular and a graphical preview ofthe data resource in the feature source editor.
The Data Source Preview allows the author to become familiar with the contents of the data resourceat the time the resource is loaded. As a result, authors can better plan each map layer which, in turn,results in more efficient map creation.
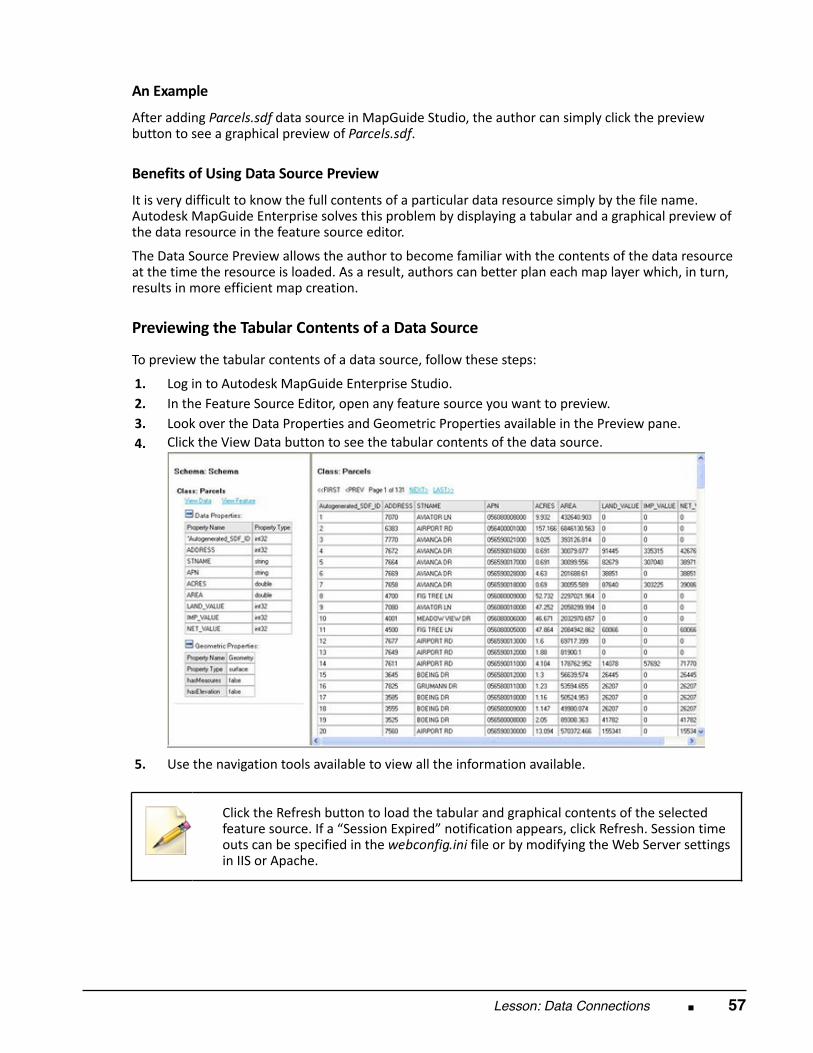
Previewing the Tabular Contents of a Data Source
To preview the tabular contents of a data source, follow these steps:
1. Log in to Autodesk MapGuide Enterprise Studio.
2.
In the Feature Source Editor, open any feature source you want to preview. 3.
Look over the Data Properties and Geometric Properties available in the Preview pane. 4.
Click the View Data button to see the tabular contents of the data source.
5.
Use the navigation tools available to view all the information available.
Click the Refresh button to load the tabular and graphical contents of the selectedfeature source. If a “Session Expired” notification appears, click Refresh. Session timeouts can be specified in the webconfig.ini file or by modifying the Web Server settingsin IIS or Apache.
58 ■ Chapter 3: Authoring with Autodesk MapGuide Studio
About Feature Joins
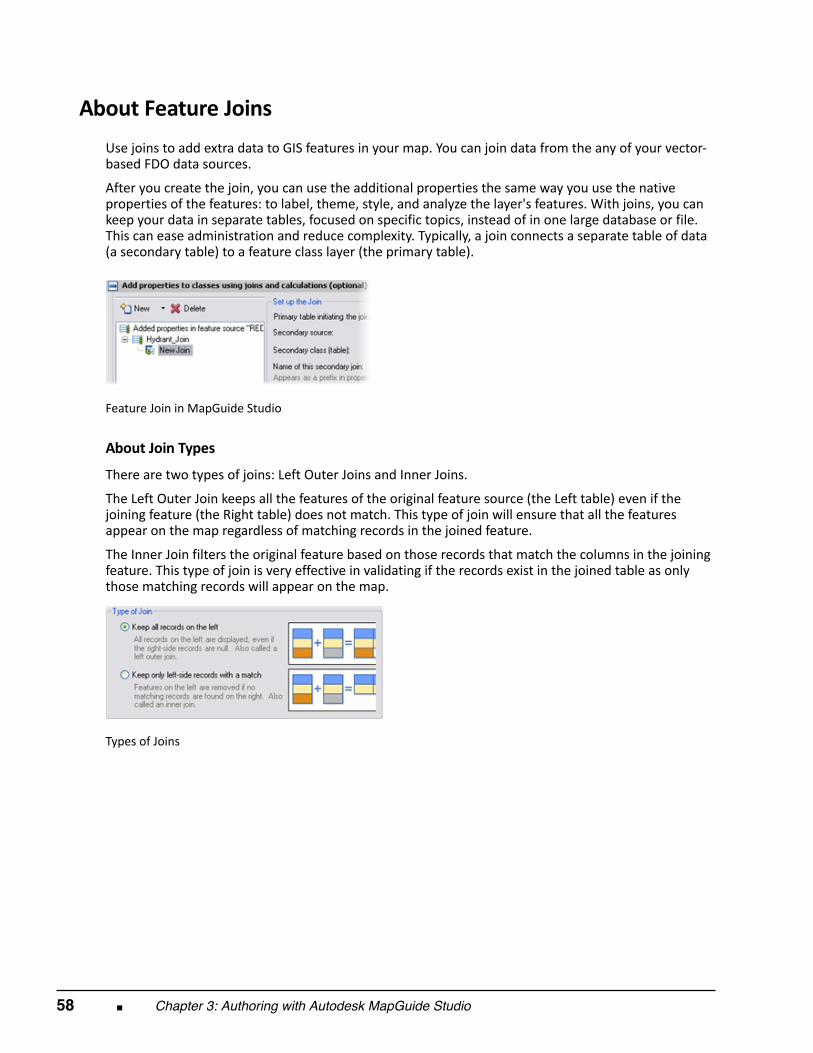
Use joins to add extra data to GIS features in your map. You can join data from the any of your vector‐based FDO data sources.
After you create the join, you can use the additional properties the same way you use the nativeproperties of the features: to label, theme, style, and analyze the layer's features. With joins, you cankeep your data in separate tables, focused on specific topics, instead of in one large database or file.This can ease administration and reduce complexity. Typically, a join connects a separate table of data(a secondary table) to a feature class layer (the primary table).
Feature Join in MapGuide Studio
About Join Types There are two types of joins: Left Outer Joins and Inner Joins.
The Left Outer Join keeps all the features of the original feature source (the Left table) even if thejoining feature (the Right table) does not match. This type of join will ensure that all the featuresappear on the map regardless of matching records in the joined feature.
The Inner Join filters the original feature based on those records that match the columns in the joiningfeature. This type of join is very effective in validating if the records exist in the joined table as onlythose matching records will appear on the map.
Types of Joins
Lesson: Data Connections ■ 59
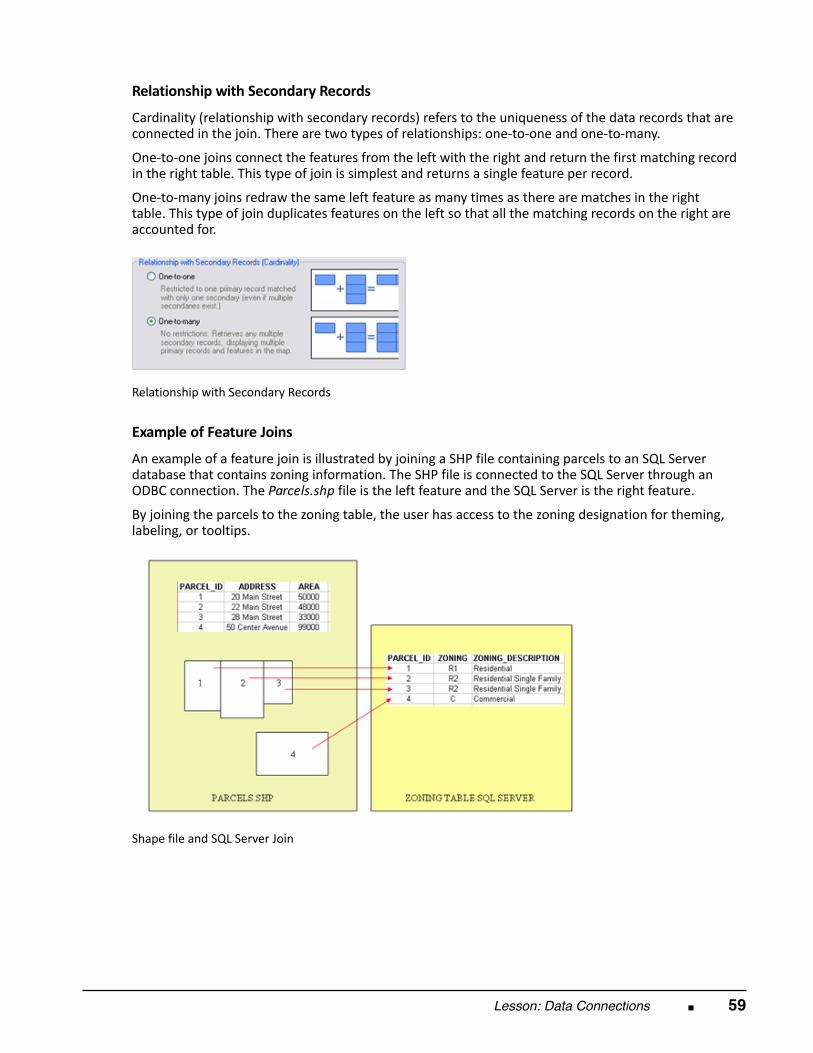
Relationship with Secondary Records Cardinality (relationship with secondary records) refers to the uniqueness of the data records that areconnected in the join. There are two types of relationships: one‐to‐one and one‐to‐many.
One‐to‐one joins connect the features from the left with the right and return the first matching recordin the right table. This type of join is simplest and returns a single feature per record.
One‐to‐many joins redraw the same left feature as many times as there are matches in the righttable. This type of join duplicates features on the left so that all the matching records on the right areaccounted for.
Relationship with Secondary Records
Example of Feature Joins An example of a feature join is illustrated by joining a SHP file containing parcels to an SQL Serverdatabase that contains zoning information. The SHP file is connected to the SQL Server through anODBC connection. The Parcels.shp file is the left feature and the SQL Server is the right feature.
By joining the parcels to the zoning table, the user has access to the zoning designation for theming,labeling, or tooltips.
Shape file and SQL Server Join
60 ■ Chapter 3: Authoring with Autodesk MapGuide Studio
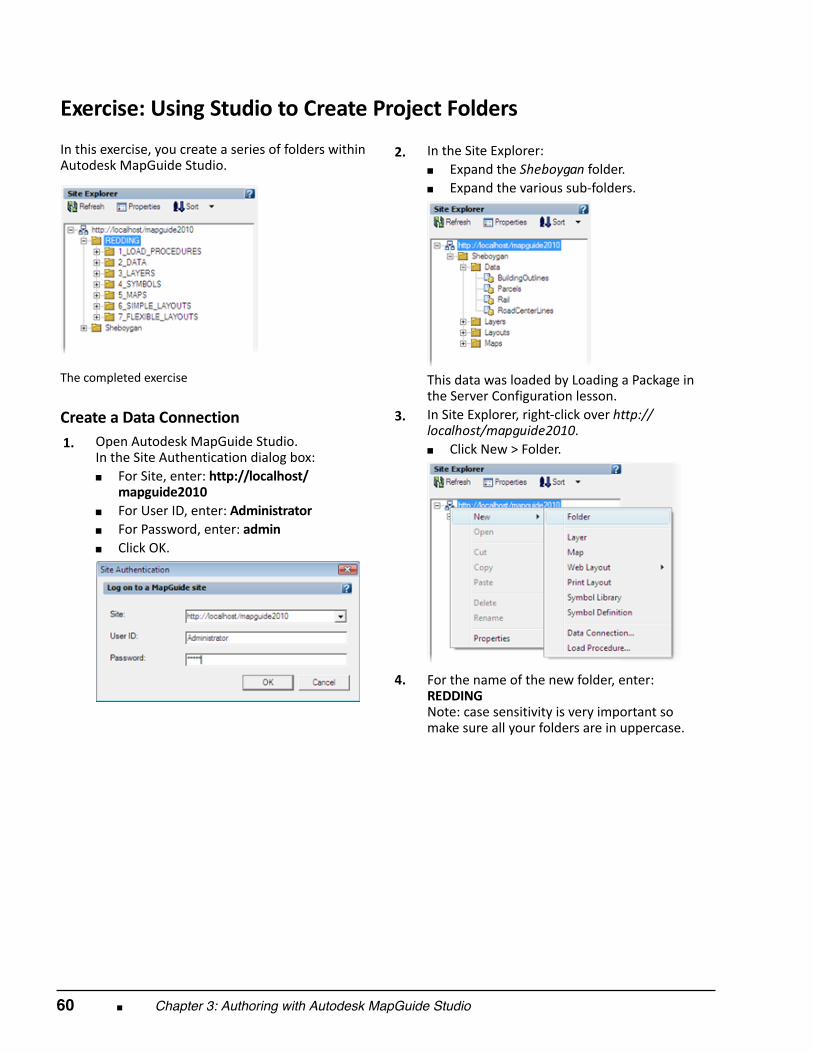
Exercise: Using Studio to Create Project Folders In this exercise, you create a series of folders withinAutodesk MapGuide Studio.
The completed exercise
Create a Data Connection 1.
Open Autodesk MapGuide Studio. In the Site Authentication dialog box:■ For Site, enter: http://localhost/
mapguide2010■ For User ID, enter: Administrator■ For Password, enter: admin■ Click OK.
2.
In the Site Explorer:■ Expand the Sheboygan folder.■ Expand the various sub‐folders.
This data was loaded by Loading a Package inthe Server Configuration lesson.
3.
In Site Explorer, right‐click over http://localhost/mapguide2010.■ Click New > Folder.
4.
For the name of the new folder, enter:REDDING Note: case sensitivity is very important somake sure all your folders are in uppercase.
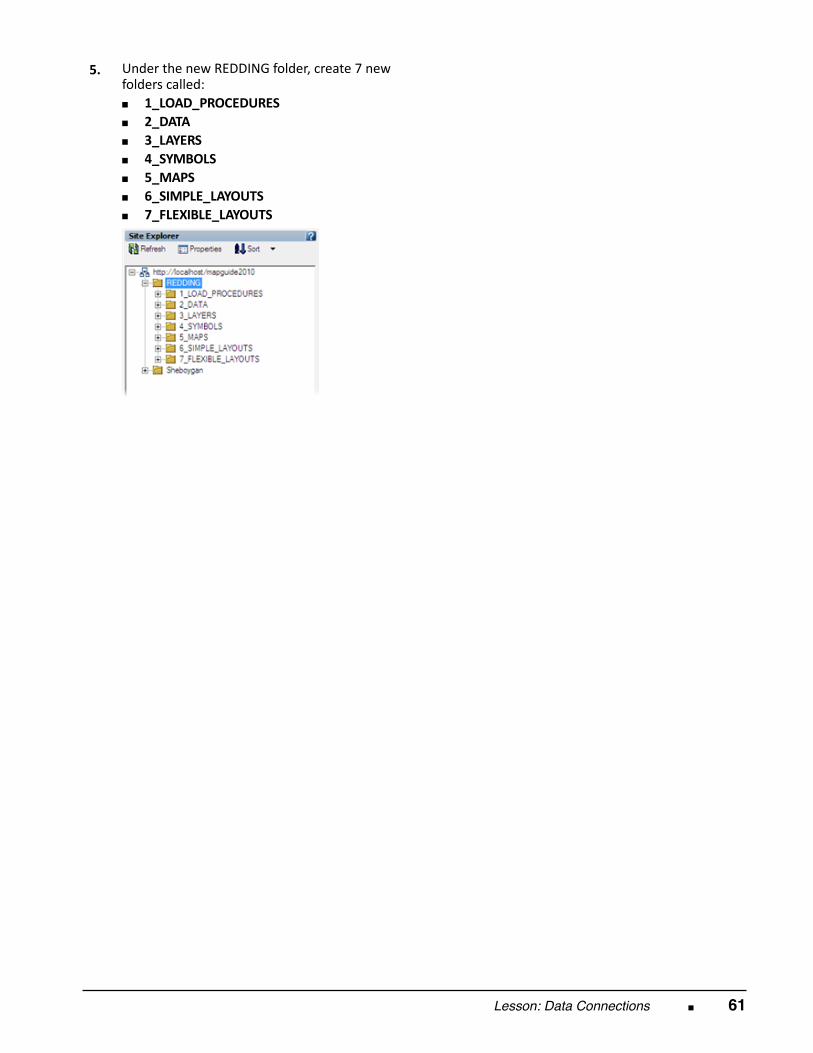
Lesson: Data Connections ■ 61
5.
Under the new REDDING folder, create 7 newfolders called:■ 1_LOAD_PROCEDURES■ 2_DATA■ 3_LAYERS■ 4_SYMBOLS■ 5_MAPS■ 6_SIMPLE_LAYOUTS■ 7_FLEXIBLE_LAYOUTS
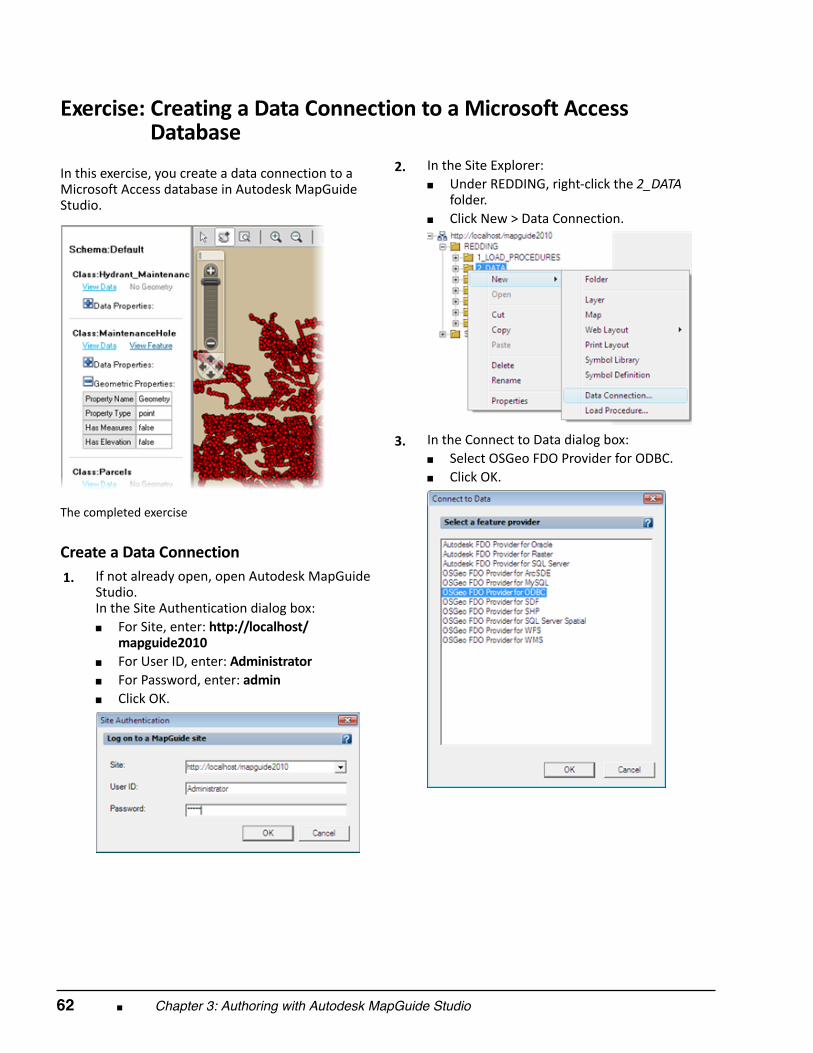
62 ■ Chapter 3: Authoring with Autodesk MapGuide Studio
Exercise: Creating a Data Connection to a Microsoft AccessExercise: Database In this exercise, you create a data connection to aMicrosoft Access database in Autodesk MapGuideStudio.
The completed exercise
Create a Data Connection 1.
If not already open, open Autodesk MapGuideStudio. In the Site Authentication dialog box:■ For Site, enter: http://localhost/
mapguide2010■ For User ID, enter: Administrator■ For Password, enter: admin■ Click OK.
2.
In the Site Explorer:■ Under REDDING, right‐click the 2_DATA
folder.■ Click New > Data Connection.
3.
In the Connect to Data dialog box:■ Select OSGeo FDO Provider for ODBC.■ Click OK.
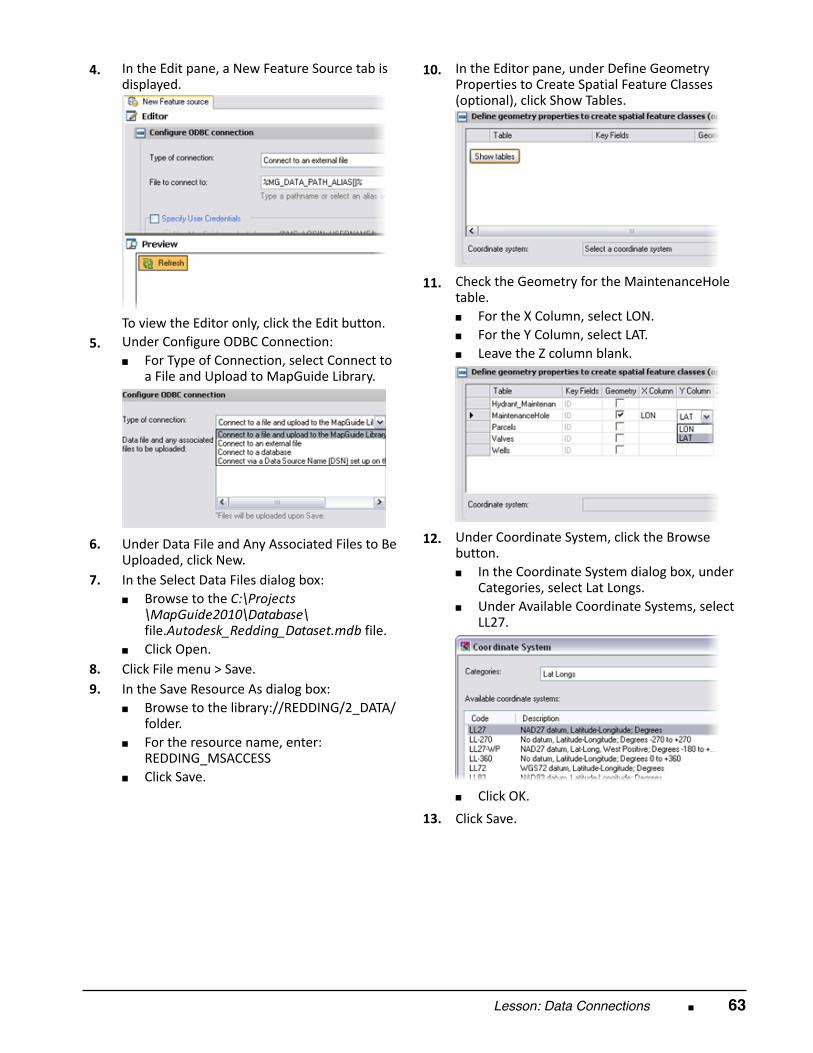
Lesson: Data Connections ■ 63
4.
In the Edit pane, a New Feature Source tab isdisplayed.
To view the Editor only, click the Edit button. 5.
Under Configure ODBC Connection:■ For Type of Connection, select Connect to
a File and Upload to MapGuide Library.
6.
Under Data File and Any Associated Files to BeUploaded, click New.
7.
In the Select Data Files dialog box:■ Browse to the C:\Projects
\MapGuide2010\Database\file.Autodesk_Redding_Dataset.mdb file.
■ Click Open. 8.
Click File menu > Save. 9.
In the Save Resource As dialog box:■ Browse to the library://REDDING/2_DATA/
folder.■ For the resource name, enter:
REDDING_MSACCESS■ Click Save.
10.
In the Editor pane, under Define GeometryProperties to Create Spatial Feature Classes(optional), click Show Tables.
11.
Check the Geometry for the MaintenanceHoletable.■ For the X Column, select LON.■ For the Y Column, select LAT.■ Leave the Z column blank.
12.
Under Coordinate System, click the Browsebutton.■ In the Coordinate System dialog box, under
Categories, select Lat Longs.■ Under Available Coordinate Systems, select
LL27.
■ Click OK.
13. Click Save.
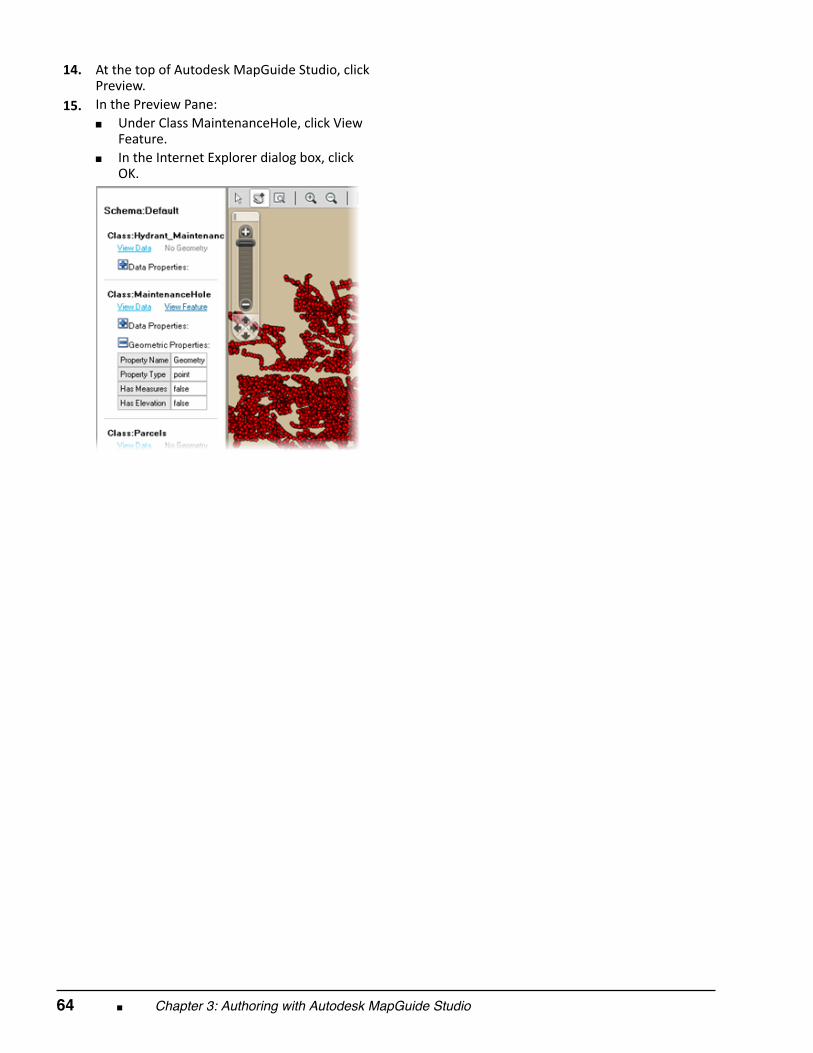
64 ■ Chapter 3: Authoring with Autodesk MapGuide Studio
14.
At the top of Autodesk MapGuide Studio, clickPreview.
15.
In the Preview Pane:■ Under Class MaintenanceHole, click View
Feature.■ In the Internet Explorer dialog box, click
OK.
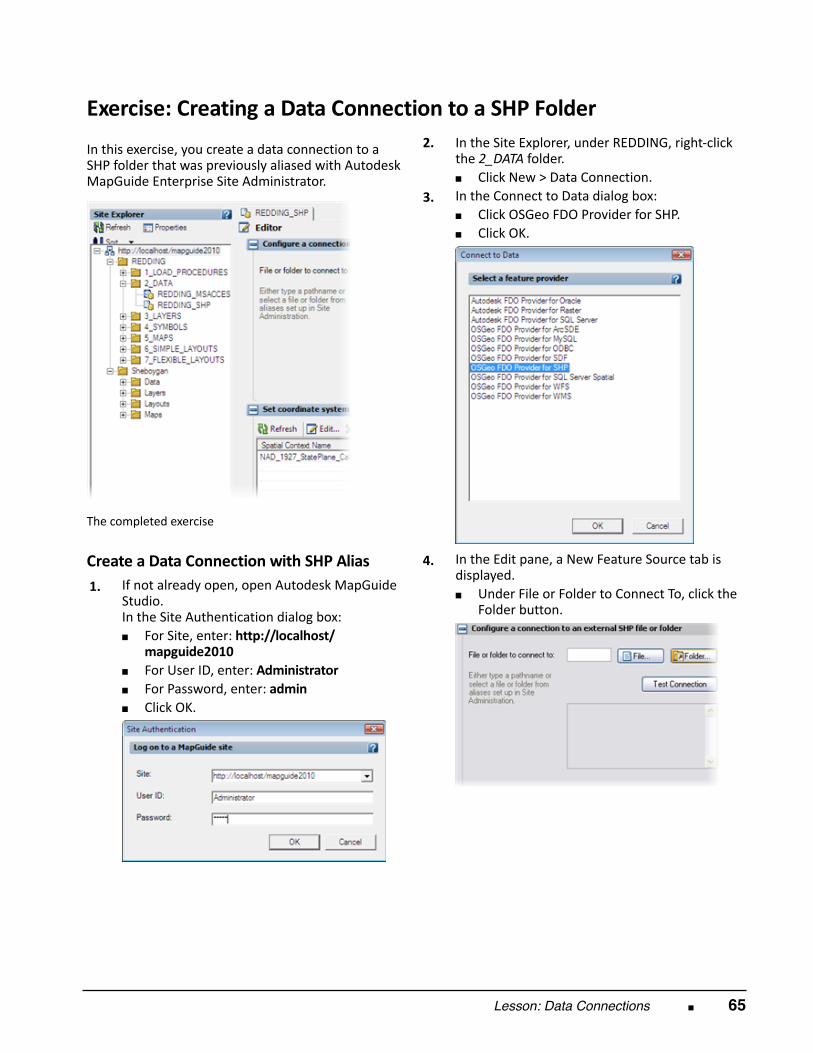
Lesson: Data Connections ■ 65
Exercise: Creating a Data Connection to a SHP Folder In this exercise, you create a data connection to aSHP folder that was previously aliased with AutodeskMapGuide Enterprise Site Administrator.
The completed exercise
Create a Data Connection with SHP Alias 1.
If not already open, open Autodesk MapGuideStudio. In the Site Authentication dialog box:■ For Site, enter: http://localhost/
mapguide2010■ For User ID, enter: Administrator■ For Password, enter: admin■ Click OK.
2.
In the Site Explorer, under REDDING, right‐clickthe 2_DATA folder.■ Click New > Data Connection.
3.
In the Connect to Data dialog box:■ Click OSGeo FDO Provider for SHP.■ Click OK.
4.
In the Edit pane, a New Feature Source tab isdisplayed.■ Under File or Folder to Connect To, click the
Folder button.
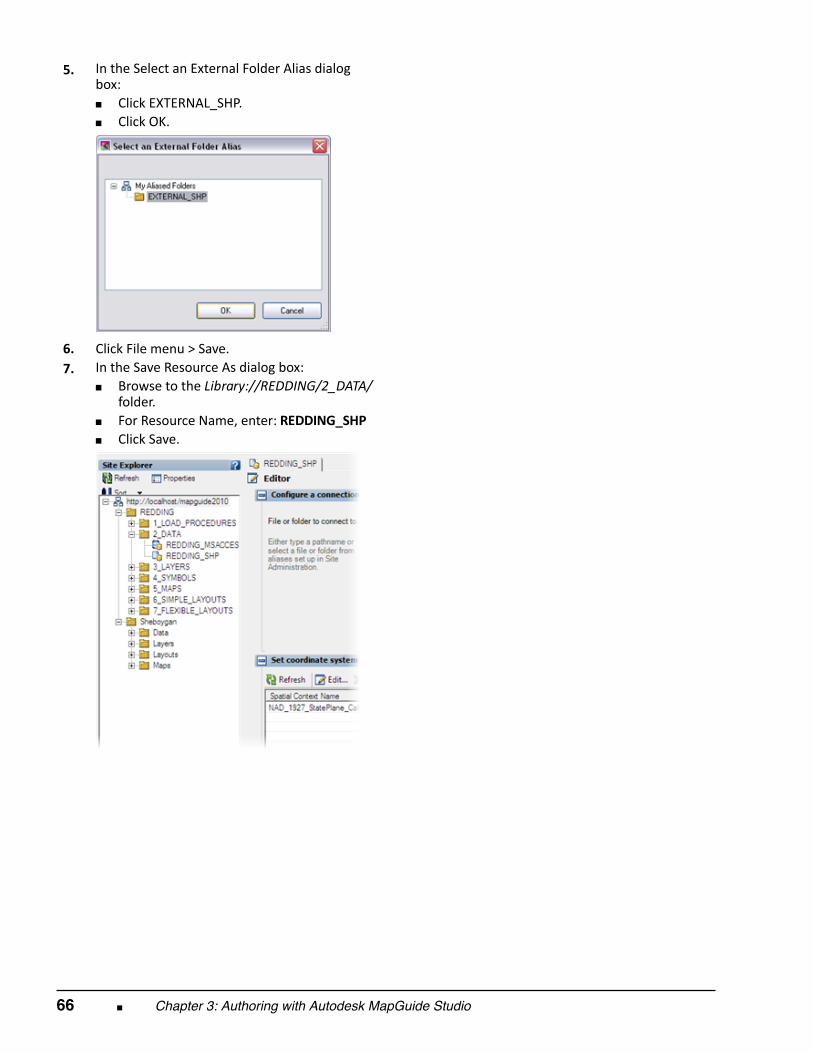
66 ■ Chapter 3: Authoring with Autodesk MapGuide Studio
5.
In the Select an External Folder Alias dialogbox:■ Click EXTERNAL_SHP.■ Click OK.
6.
Click File menu > Save. 7.
In the Save Resource As dialog box:■ Browse to the Library://REDDING/2_DATA/
folder.■ For Resource Name, enter: REDDING_SHP■ Click Save.
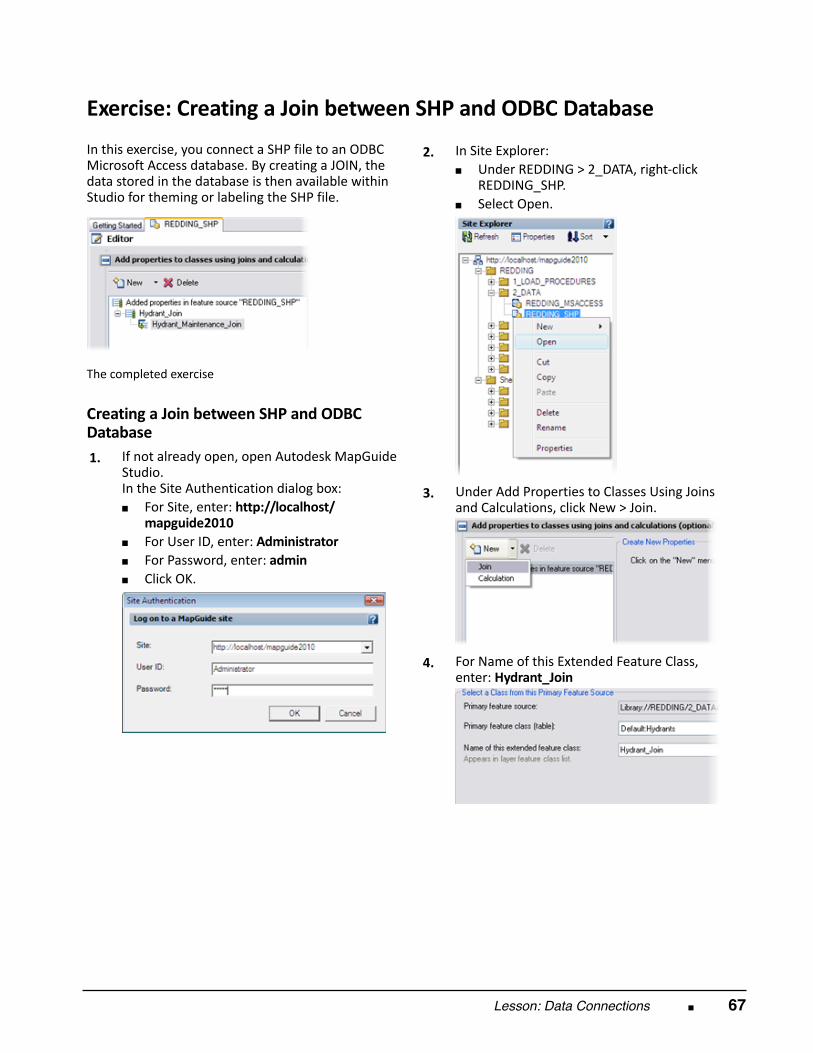
Lesson: Data Connections ■ 67
Exercise: Creating a Join between SHP and ODBC Database In this exercise, you connect a SHP file to an ODBCMicrosoft Access database. By creating a JOIN, thedata stored in the database is then available withinStudio for theming or labeling the SHP file.
The completed exercise
Creating a Join between SHP and ODBCDatabase 1.
If not already open, open Autodesk MapGuideStudio. In the Site Authentication dialog box:■ For Site, enter: http://localhost/
mapguide2010■ For User ID, enter: Administrator■ For Password, enter: admin■ Click OK.
2.
In Site Explorer:■ Under REDDING > 2_DATA, right‐click
REDDING_SHP.■ Select Open.
3.
Under Add Properties to Classes Using Joinsand Calculations, click New > Join.
4.
For Name of this Extended Feature Class,enter: Hydrant_Join
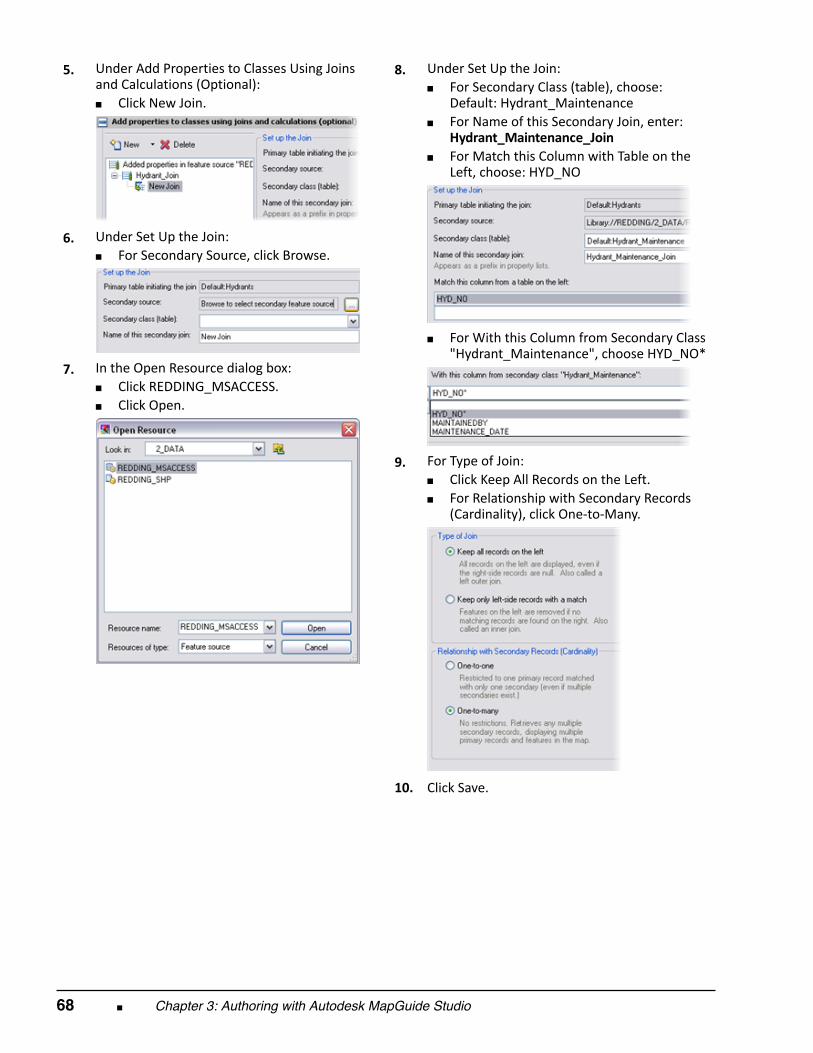
68 ■ Chapter 3: Authoring with Autodesk MapGuide Studio
5.
Under Add Properties to Classes Using Joinsand Calculations (Optional):■ Click New Join.
6.
Under Set Up the Join:■ For Secondary Source, click Browse.
7.
In the Open Resource dialog box:■ Click REDDING_MSACCESS.■ Click Open.
8.
Under Set Up the Join:■ For Secondary Class (table), choose:
Default: Hydrant_Maintenance■ For Name of this Secondary Join, enter:
Hydrant_Maintenance_Join■ For Match this Column with Table on the
Left, choose: HYD_NO
■ For With this Column from Secondary Class
"Hydrant_Maintenance", choose HYD_NO*
9.
For Type of Join:■ Click Keep All Records on the Left.■ For Relationship with Secondary Records
(Cardinality), click One‐to‐Many.
10.
Click Save.
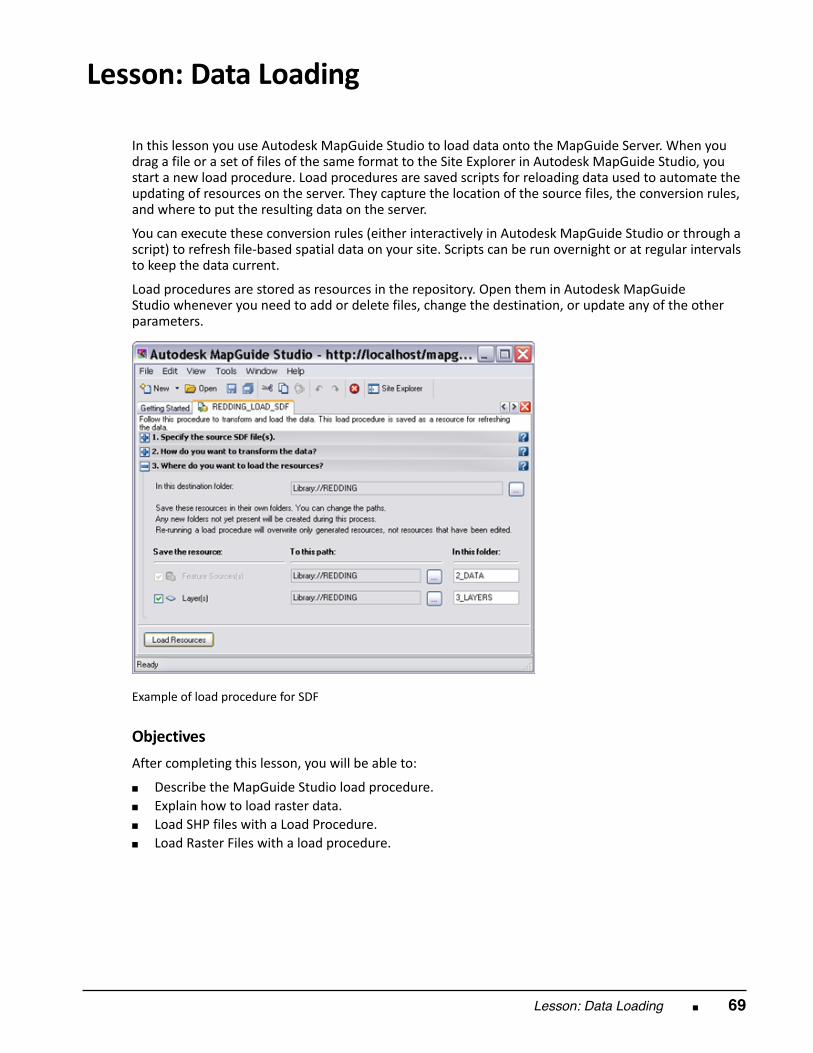
Lesson: Data Loading ■ 69
Lesson: Data Loading
In this lesson you use Autodesk MapGuide Studio to load data onto the MapGuide Server. When youdrag a file or a set of files of the same format to the Site Explorer in Autodesk MapGuide Studio, youstart a new load procedure. Load procedures are saved scripts for reloading data used to automate theupdating of resources on the server. They capture the location of the source files, the conversion rules,and where to put the resulting data on the server.
You can execute these conversion rules (either interactively in Autodesk MapGuide Studio or through ascript) to refresh file‐based spatial data on your site. Scripts can be run overnight or at regular intervalsto keep the data current.
Load procedures are stored as resources in the repository. Open them in Autodesk MapGuideStudio whenever you need to add or delete files, change the destination, or update any of the otherparameters.
Example of load procedure for SDF
Objectives After completing this lesson, you will be able to:
■ Describe the MapGuide Studio load procedure.■ Explain how to load raster data.■ Load SHP files with a Load Procedure.■ Load Raster Files with a load procedure.
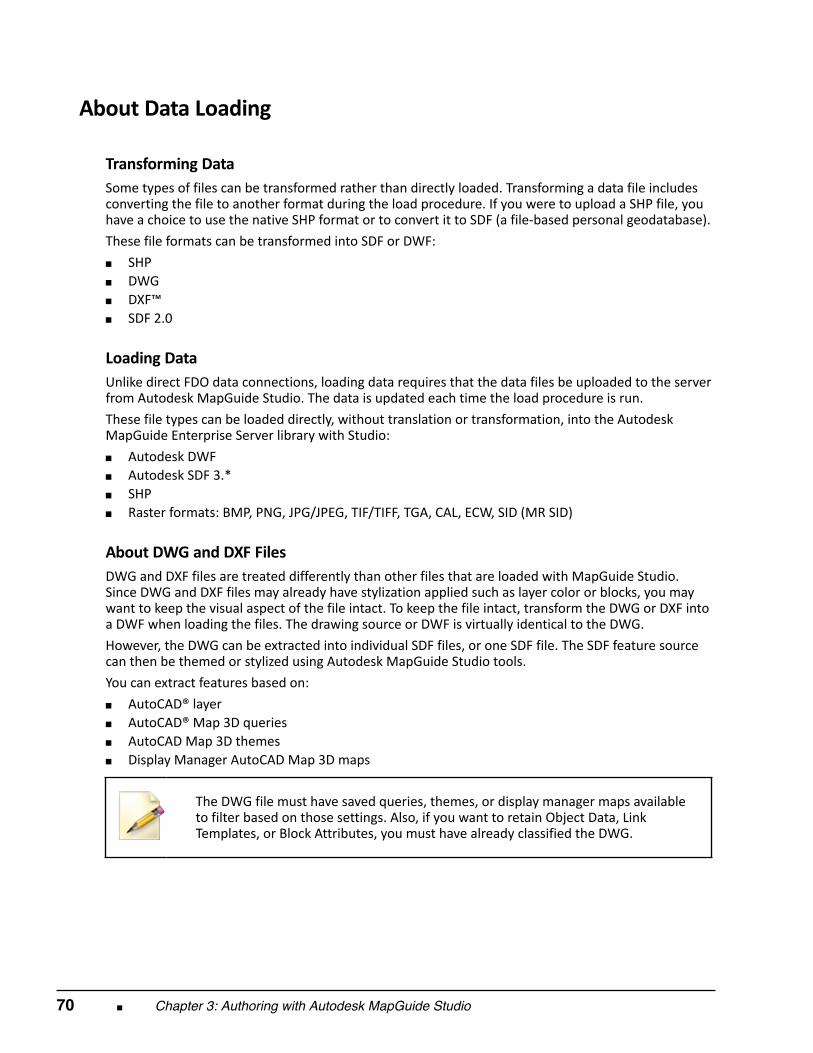
70 ■ Chapter 3: Authoring with Autodesk MapGuide Studio
About Data Loading
Transforming Data Some types of files can be transformed rather than directly loaded. Transforming a data file includesconverting the file to another format during the load procedure. If you were to upload a SHP file, youhave a choice to use the native SHP format or to convert it to SDF (a file‐based personal geodatabase). These file formats can be transformed into SDF or DWF: ■ SHP■ DWG■ DXF™■ SDF 2.0
Loading Data Unlike direct FDO data connections, loading data requires that the data files be uploaded to the serverfrom Autodesk MapGuide Studio. The data is updated each time the load procedure is run. These file types can be loaded directly, without translation or transformation, into the AutodeskMapGuide Enterprise Server library with Studio: ■ Autodesk DWF■ Autodesk SDF 3.*■ SHP■ Raster formats: BMP, PNG, JPG/JPEG, TIF/TIFF, TGA, CAL, ECW, SID (MR SID)
About DWG and DXF Files DWG and DXF files are treated differently than other files that are loaded with MapGuide Studio.Since DWG and DXF files may already have stylization applied such as layer color or blocks, you maywant to keep the visual aspect of the file intact. To keep the file intact, transform the DWG or DXF intoa DWF when loading the files. The drawing source or DWF is virtually identical to the DWG. However, the DWG can be extracted into individual SDF files, or one SDF file. The SDF feature sourcecan then be themed or stylized using Autodesk MapGuide Studio tools. You can extract features based on: ■ AutoCAD® layer■ AutoCAD® Map 3D queries■ AutoCAD Map 3D themes■ Display Manager AutoCAD Map 3D maps
The DWG file must have saved queries, themes, or display manager maps available
to filter based on those settings. Also, if you want to retain Object Data, LinkTemplates, or Block Attributes, you must have already classified the DWG.
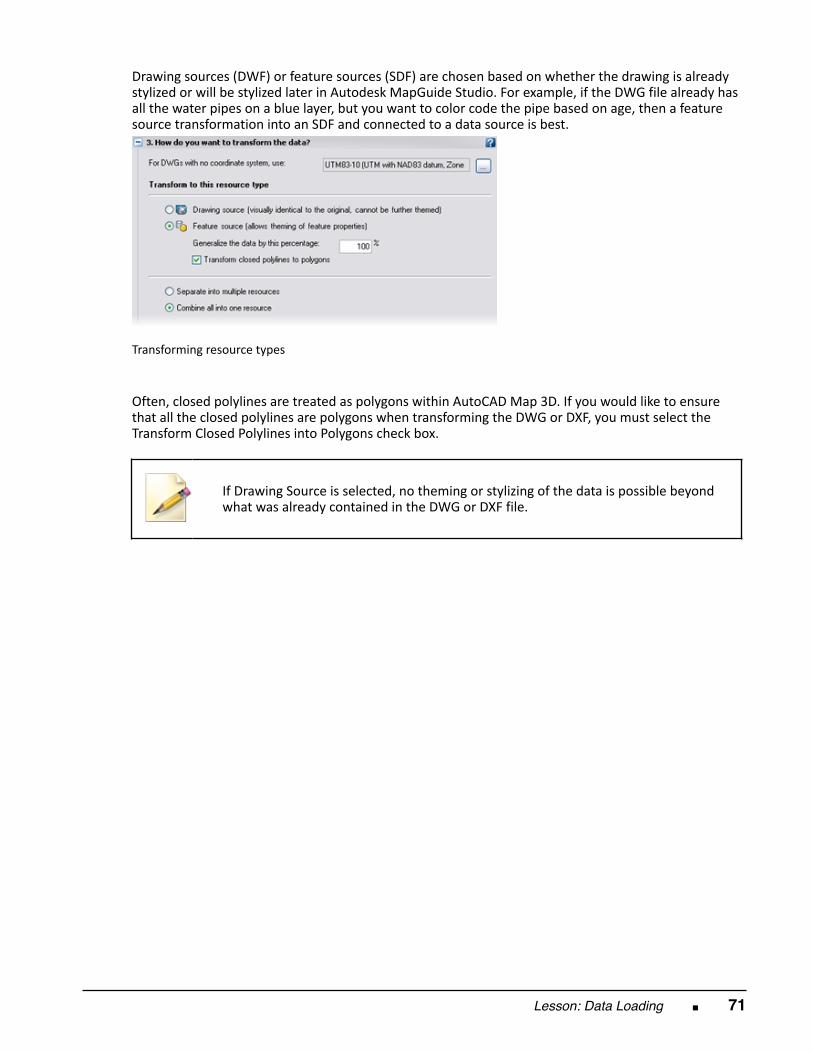
Lesson: Data Loading ■ 71
Drawing sources (DWF) or feature sources (SDF) are chosen based on whether the drawing is alreadystylized or will be stylized later in Autodesk MapGuide Studio. For example, if the DWG file already hasall the water pipes on a blue layer, but you want to color code the pipe based on age, then a featuresource transformation into an SDF and connected to a data source is best.
Transforming resource types
Often, closed polylines are treated as polygons within AutoCAD Map 3D. If you would like to ensurethat all the closed polylines are polygons when transforming the DWG or DXF, you must select theTransform Closed Polylines into Polygons check box.
If Drawing Source is selected, no theming or stylizing of the data is possible beyondwhat was already contained in the DWG or DXF file.
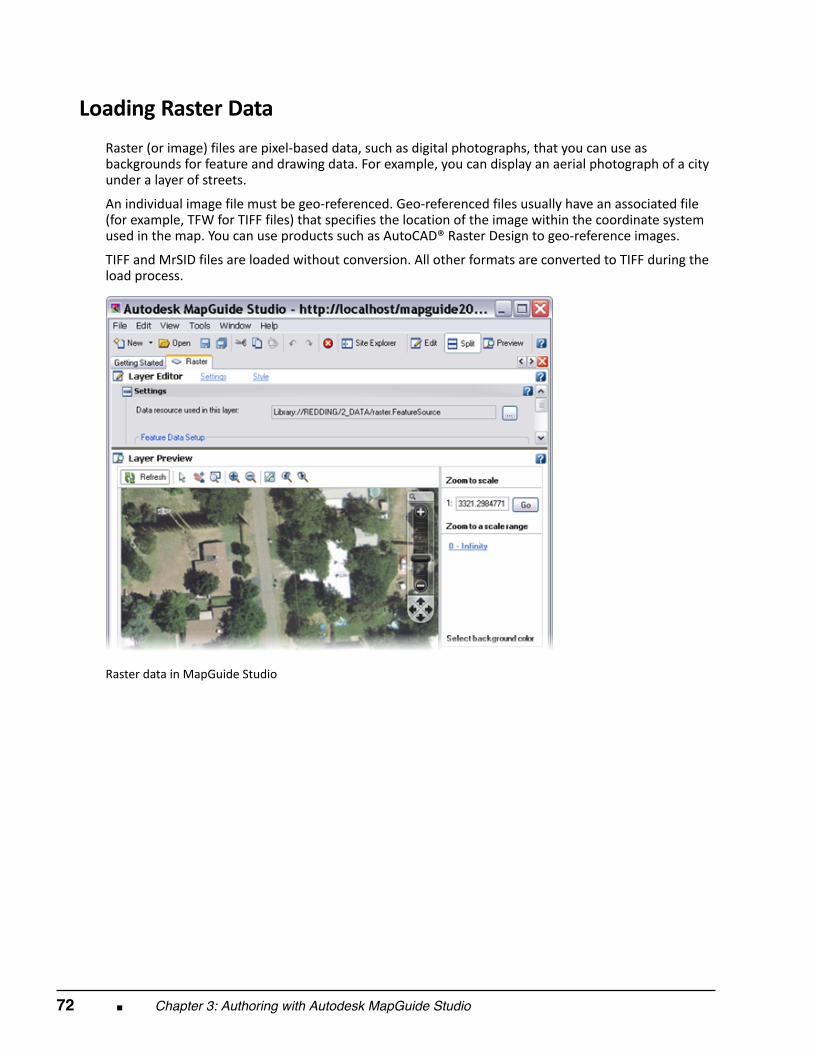
72 ■ Chapter 3: Authoring with Autodesk MapGuide Studio
Loading Raster Data
Raster (or image) files are pixel‐based data, such as digital photographs, that you can use asbackgrounds for feature and drawing data. For example, you can display an aerial photograph of a cityunder a layer of streets.
An individual image file must be geo‐referenced. Geo‐referenced files usually have an associated file(for example, TFW for TIFF files) that specifies the location of the image within the coordinate systemused in the map. You can use products such as AutoCAD® Raster Design to geo‐reference images.
TIFF and MrSID files are loaded without conversion. All other formats are converted to TIFF during theload process.
Raster data in MapGuide Studio
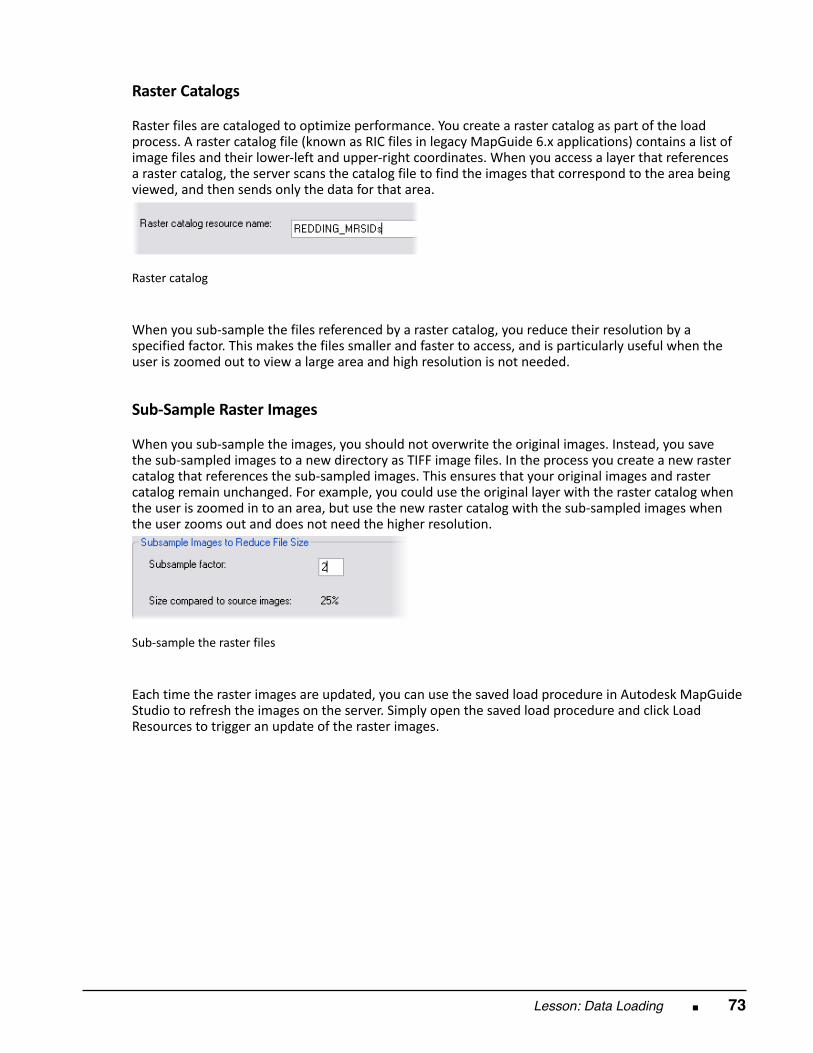
Lesson: Data Loading ■ 73
Raster Catalogs
Raster files are cataloged to optimize performance. You create a raster catalog as part of the loadprocess. A raster catalog file (known as RIC files in legacy MapGuide 6.x applications) contains a list ofimage files and their lower‐left and upper‐right coordinates. When you access a layer that referencesa raster catalog, the server scans the catalog file to find the images that correspond to the area beingviewed, and then sends only the data for that area.
Raster catalog
When you sub‐sample the files referenced by a raster catalog, you reduce their resolution by aspecified factor. This makes the files smaller and faster to access, and is particularly useful when theuser is zoomed out to view a large area and high resolution is not needed.
Sub‐Sample Raster Images
When you sub‐sample the images, you should not overwrite the original images. Instead, you savethe sub‐sampled images to a new directory as TIFF image files. In the process you create a new rastercatalog that references the sub‐sampled images. This ensures that your original images and rastercatalog remain unchanged. For example, you could use the original layer with the raster catalog whenthe user is zoomed in to an area, but use the new raster catalog with the sub‐sampled images whenthe user zooms out and does not need the higher resolution.
Sub‐sample the raster files
Each time the raster images are updated, you can use the saved load procedure in Autodesk MapGuideStudio to refresh the images on the server. Simply open the saved load procedure and click LoadResources to trigger an update of the raster images.
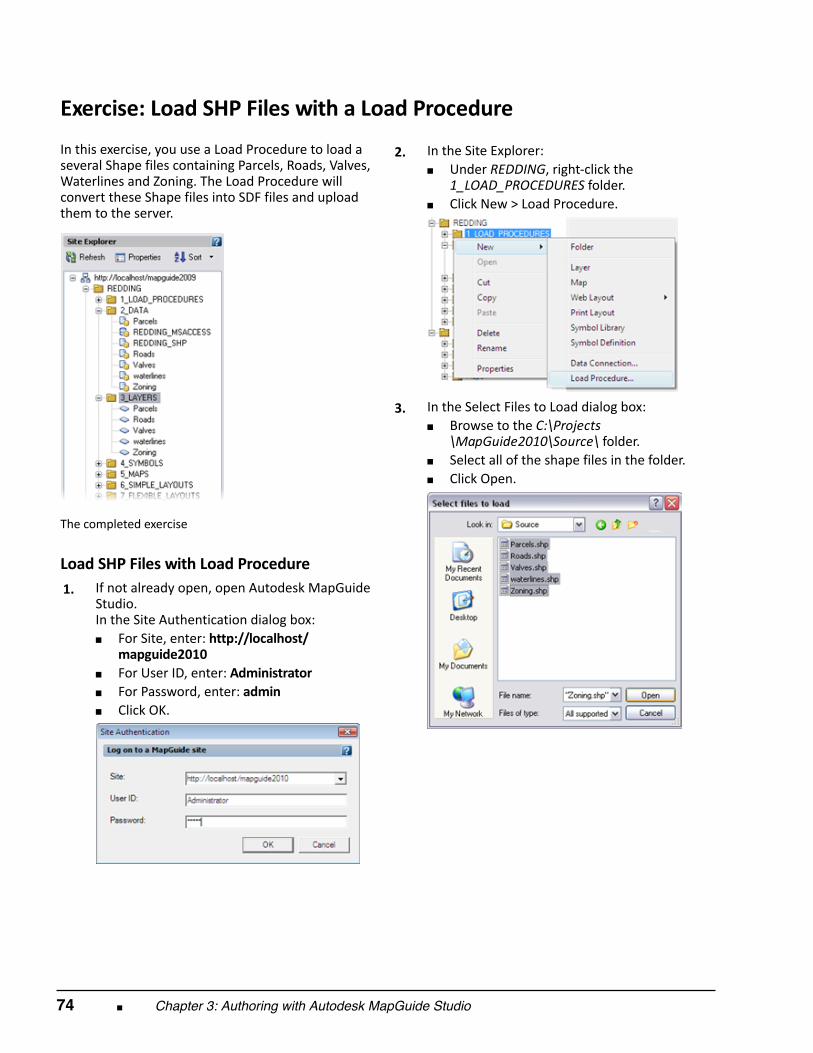
74 ■ Chapter 3: Authoring with Autodesk MapGuide Studio
Exercise: Load SHP Files with a Load Procedure In this exercise, you use a Load Procedure to load aseveral Shape files containing Parcels, Roads, Valves,Waterlines and Zoning. The Load Procedure willconvert these Shape files into SDF files and uploadthem to the server.
The completed exercise
Load SHP Files with Load Procedure 1.
If not already open, open Autodesk MapGuideStudio. In the Site Authentication dialog box:■ For Site, enter: http://localhost/
mapguide2010■ For User ID, enter: Administrator■ For Password, enter: admin■ Click OK.
2.
In the Site Explorer:■ Under REDDING, right‐click the
1_LOAD_PROCEDURES folder.■ Click New > Load Procedure.
3.
In the Select Files to Load dialog box:■ Browse to the C:\Projects
\MapGuide2010\Source\ folder.■ Select all of the shape files in the folder.■ Click Open.
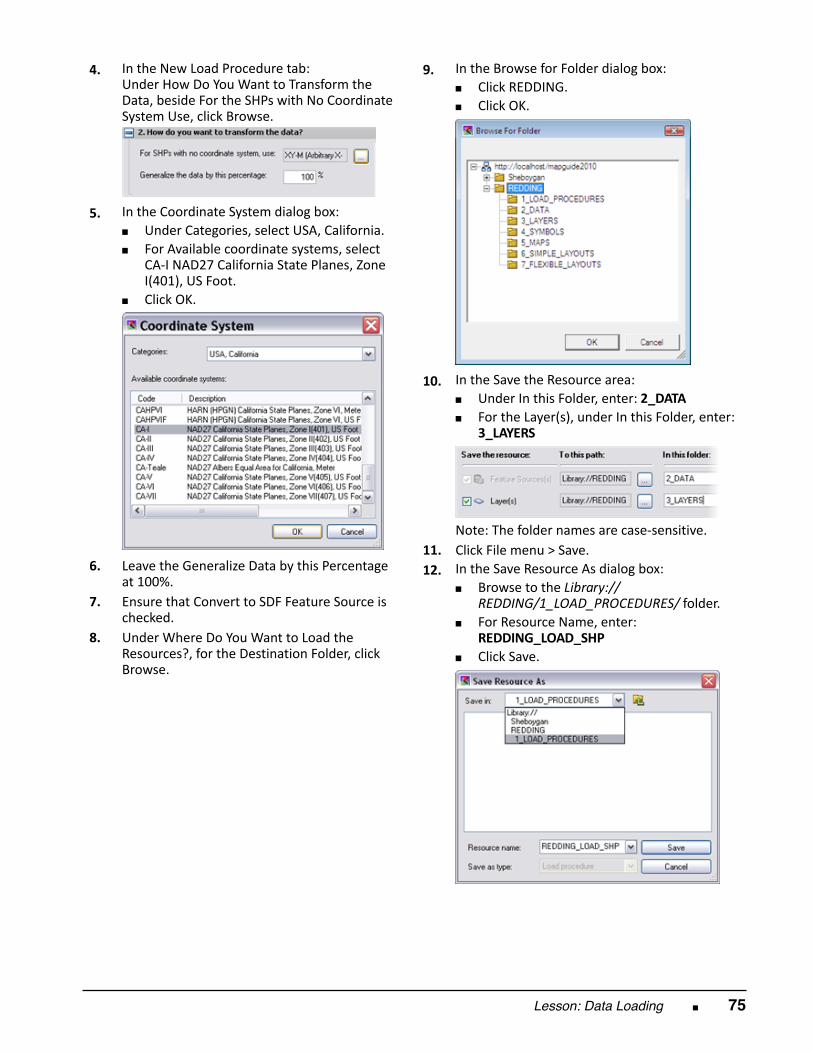
Lesson: Data Loading ■ 75
4.
In the New Load Procedure tab: Under How Do You Want to Transform theData, beside For the SHPs with No CoordinateSystem Use, click Browse.
5.
In the Coordinate System dialog box:■ Under Categories, select USA, California.■ For Available coordinate systems, select
CA‐I NAD27 California State Planes, ZoneI(401), US Foot.
■ Click OK.
6.
Leave the Generalize Data by this Percentageat 100%.
7.
Ensure that Convert to SDF Feature Source ischecked.
8.
Under Where Do You Want to Load theResources?, for the Destination Folder, clickBrowse.
9.
In the Browse for Folder dialog box:■ Click REDDING.■ Click OK.
10.
In the Save the Resource area:■ Under In this Folder, enter: 2_DATA■ For the Layer(s), under In this Folder, enter:
3_LAYERS
Note: The folder names are case‐sensitive. 11.
Click File menu > Save. 12.
In the Save Resource As dialog box:■ Browse to the Library://
REDDING/1_LOAD_PROCEDURES/ folder.■ For Resource Name, enter:
REDDING_LOAD_SHP■ Click Save.
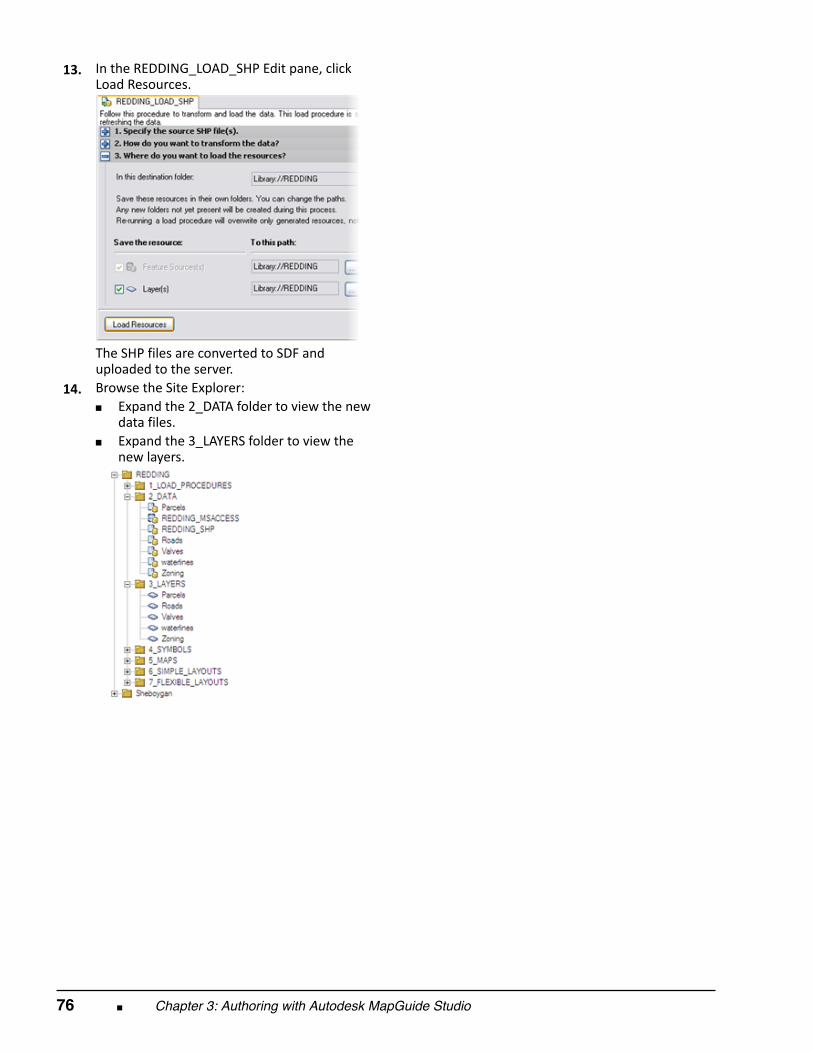
76 ■ Chapter 3: Authoring with Autodesk MapGuide Studio
13.
In the REDDING_LOAD_SHP Edit pane, clickLoad Resources.
The SHP files are converted to SDF anduploaded to the server.
14. Browse the Site Explorer:■ Expand the 2_DATA folder to view the new
data files.■ Expand the 3_LAYERS folder to view the
new layers.
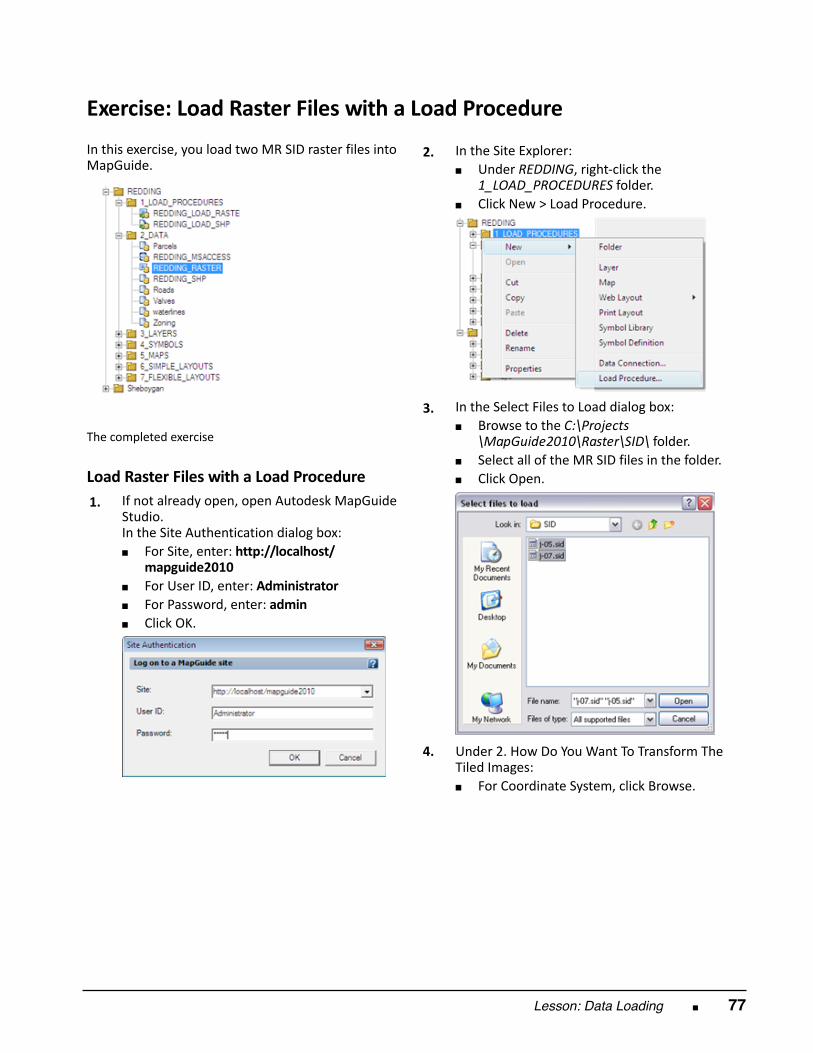
Lesson: Data Loading ■ 77
Exercise: Load Raster Files with a Load Procedure In this exercise, you load two MR SID raster files intoMapGuide.
The completed exercise
Load Raster Files with a Load Procedure 1.
If not already open, open Autodesk MapGuideStudio. In the Site Authentication dialog box:■ For Site, enter: http://localhost/
mapguide2010■ For User ID, enter: Administrator■ For Password, enter: admin■ Click OK.
2.
In the Site Explorer:■ Under REDDING, right‐click the
1_LOAD_PROCEDURES folder.■ Click New > Load Procedure.
3.
In the Select Files to Load dialog box:■ Browse to the C:\Projects
\MapGuide2010\Raster\SID\ folder.■ Select all of the MR SID files in the folder.■ Click Open.
4.
Under 2. How Do You Want To Transform TheTiled Images:■ For Coordinate System, click Browse.
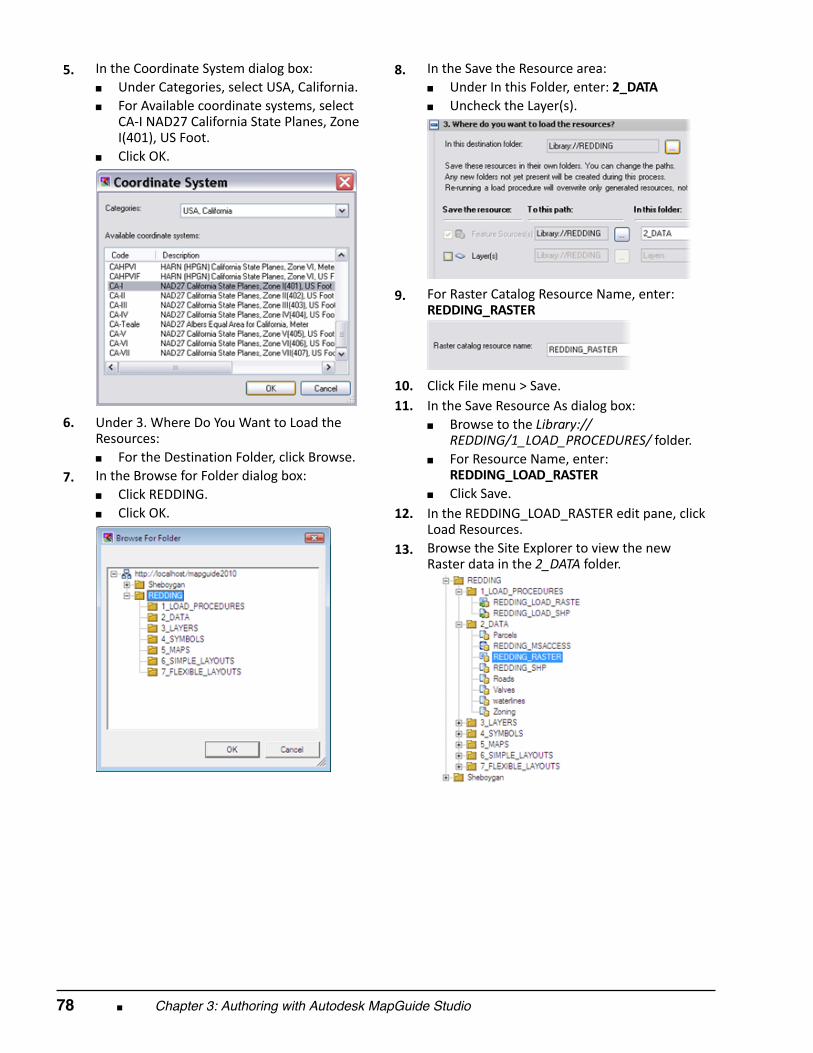
78 ■ Chapter 3: Authoring with Autodesk MapGuide Studio
5.
In the Coordinate System dialog box:■ Under Categories, select USA, California.■ For Available coordinate systems, select
CA‐I NAD27 California State Planes, ZoneI(401), US Foot.
■ Click OK.
6.
Under 3. Where Do You Want to Load theResources:■ For the Destination Folder, click Browse.
7.
In the Browse for Folder dialog box:■ Click REDDING.■ Click OK.
8.
In the Save the Resource area:■ Under In this Folder, enter: 2_DATA■ Uncheck the Layer(s).
9.
For Raster Catalog Resource Name, enter:REDDING_RASTER
10.
Click File menu > Save. 11.
In the Save Resource As dialog box:■ Browse to the Library://
REDDING/1_LOAD_PROCEDURES/ folder.■ For Resource Name, enter:
REDDING_LOAD_RASTER■ Click Save.
12.
In the REDDING_LOAD_RASTER edit pane, clickLoad Resources.
13.
Browse the Site Explorer to view the newRaster data in the 2_DATA folder.
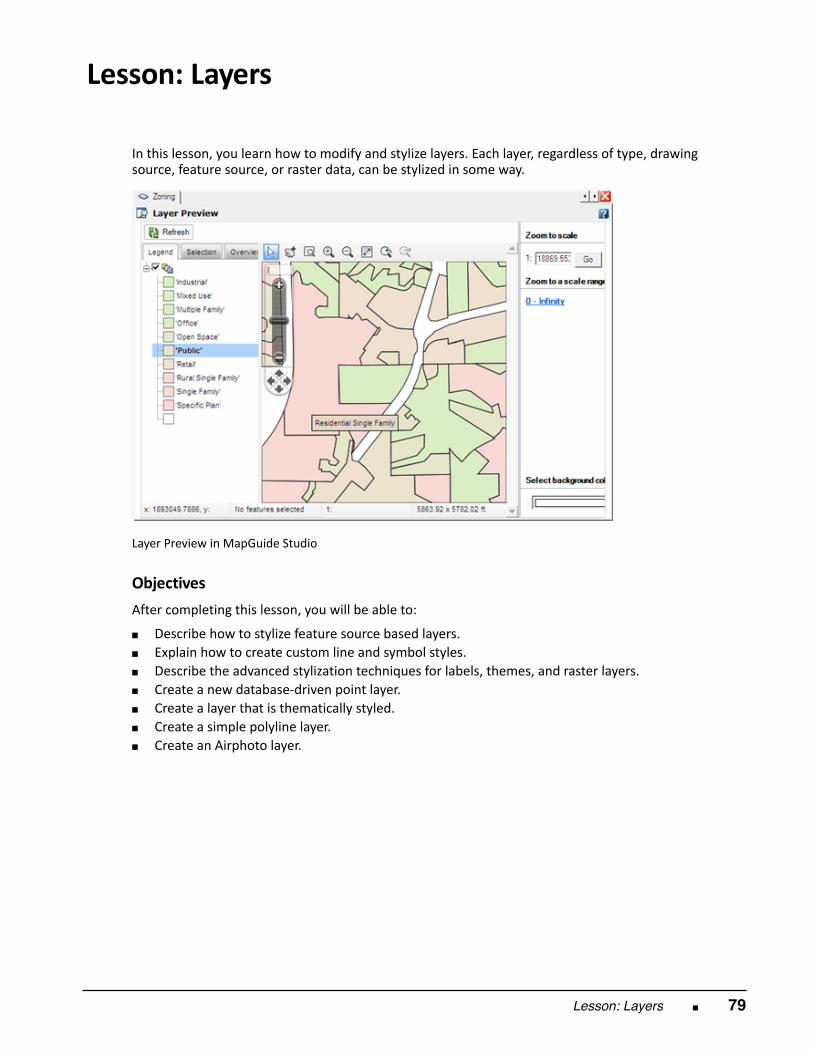
Lesson: Layers ■ 79
Lesson: Layers
In this lesson, you learn how to modify and stylize layers. Each layer, regardless of type, drawingsource, feature source, or raster data, can be stylized in some way.
Layer Preview in MapGuide Studio
Objectives After completing this lesson, you will be able to:
■ Describe how to stylize feature source based layers.■ Explain how to create custom line and symbol styles.■ Describe the advanced stylization techniques for labels, themes, and raster layers.■ Create a new database‐driven point layer.■ Create a layer that is thematically styled.■ Create a simple polyline layer.■ Create an Airphoto layer.
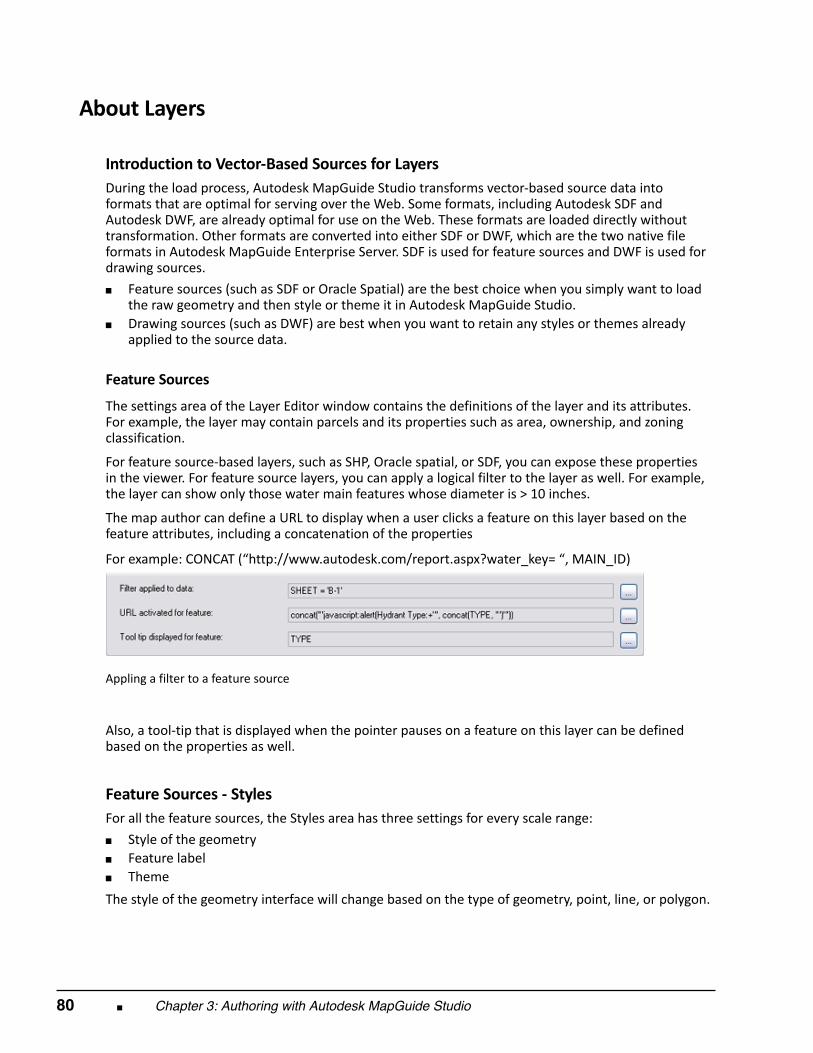
80 ■ Chapter 3: Authoring with Autodesk MapGuide Studio
About Layers
Introduction to Vector‐Based Sources for Layers During the load process, Autodesk MapGuide Studio transforms vector‐based source data intoformats that are optimal for serving over the Web. Some formats, including Autodesk SDF andAutodesk DWF, are already optimal for use on the Web. These formats are loaded directly withouttransformation. Other formats are converted into either SDF or DWF, which are the two native fileformats in Autodesk MapGuide Enterprise Server. SDF is used for feature sources and DWF is used fordrawing sources. ■ Feature sources (such as SDF or Oracle Spatial) are the best choice when you simply want to load
the raw geometry and then style or theme it in Autodesk MapGuide Studio.■ Drawing sources (such as DWF) are best when you want to retain any styles or themes already
applied to the source data.
Feature Sources The settings area of the Layer Editor window contains the definitions of the layer and its attributes.For example, the layer may contain parcels and its properties such as area, ownership, and zoningclassification.
For feature source‐based layers, such as SHP, Oracle spatial, or SDF, you can expose these propertiesin the viewer. For feature source layers, you can apply a logical filter to the layer as well. For example,the layer can show only those water main features whose diameter is > 10 inches.
The map author can define a URL to display when a user clicks a feature on this layer based on thefeature attributes, including a concatenation of the properties For example: CONCAT (“http://www.autodesk.com/report.aspx?water_key= “, MAIN_ID)
Appling a filter to a feature source
Also, a tool‐tip that is displayed when the pointer pauses on a feature on this layer can be definedbased on the properties as well.
Feature Sources ‐ Styles For all the feature sources, the Styles area has three settings for every scale range: ■ Style of the geometry■ Feature label■ Theme The style of the geometry interface will change based on the type of geometry, point, line, or polygon.
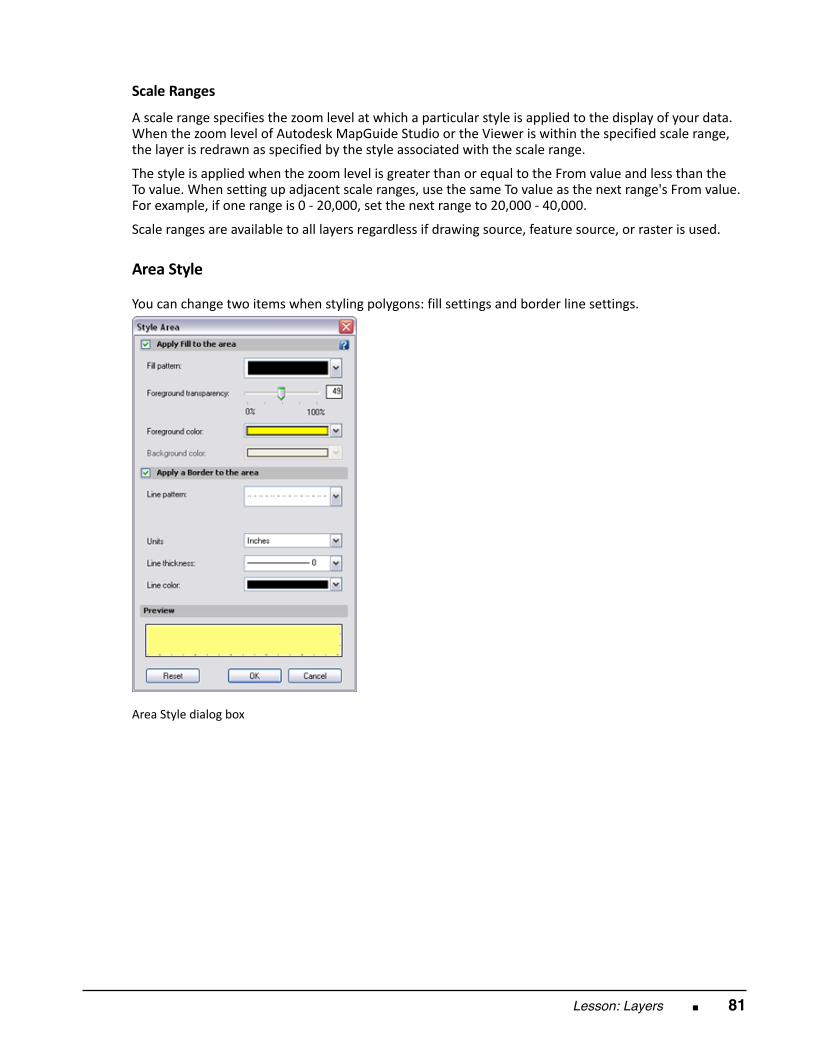
Lesson: Layers ■ 81
Scale Ranges A scale range specifies the zoom level at which a particular style is applied to the display of your data.When the zoom level of Autodesk MapGuide Studio or the Viewer is within the specified scale range,the layer is redrawn as specified by the style associated with the scale range.
The style is applied when the zoom level is greater than or equal to the From value and less than theTo value. When setting up adjacent scale ranges, use the same To value as the next range's From value.For example, if one range is 0 ‐ 20,000, set the next range to 20,000 ‐ 40,000.
Scale ranges are available to all layers regardless if drawing source, feature source, or raster is used. Area Style
You can change two items when styling polygons: fill settings and border line settings.
Area Style dialog box
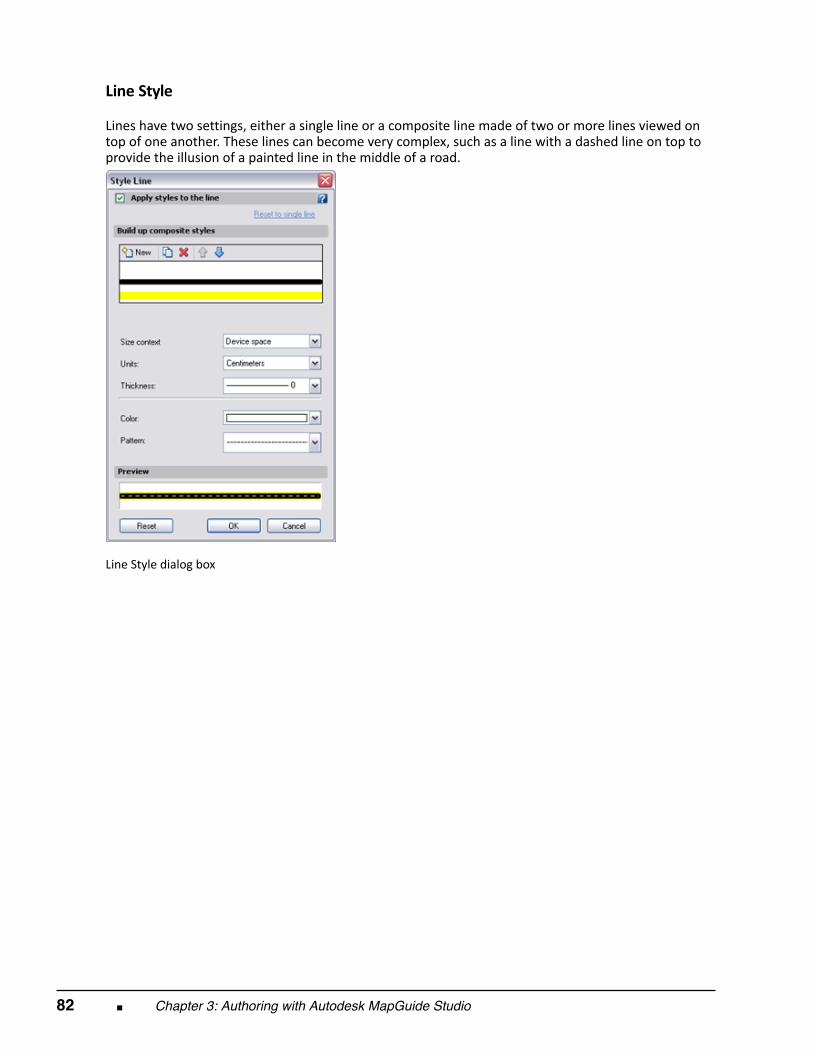
82 ■ Chapter 3: Authoring with Autodesk MapGuide Studio
Line Style
Lines have two settings, either a single line or a composite line made of two or more lines viewed ontop of one another. These lines can become very complex, such as a line with a dashed line on top toprovide the illusion of a painted line in the middle of a road.
Line Style dialog box
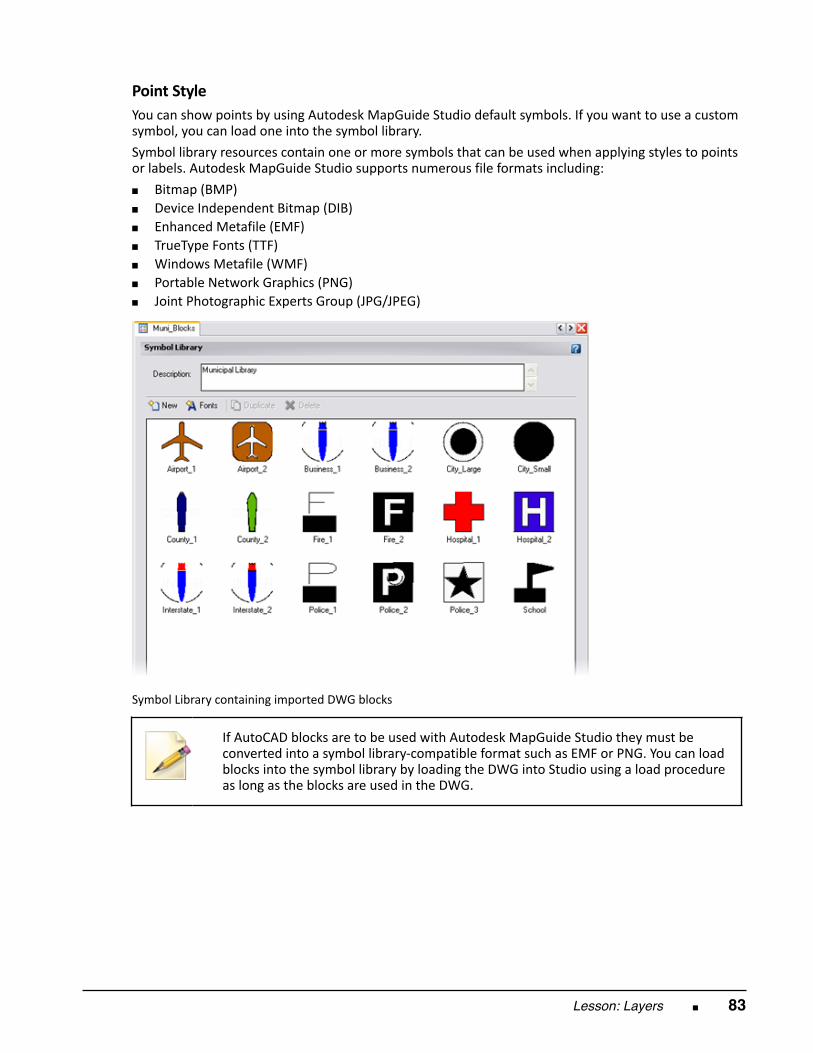
Lesson: Layers ■ 83
Point Style You can show points by using Autodesk MapGuide Studio default symbols. If you want to use a customsymbol, you can load one into the symbol library. Symbol library resources contain one or more symbols that can be used when applying styles to pointsor labels. Autodesk MapGuide Studio supports numerous file formats including: ■ Bitmap (BMP)■ Device Independent Bitmap (DIB)■ Enhanced Metafile (EMF)■ TrueType Fonts (TTF)■ Windows Metafile (WMF)■ Portable Network Graphics (PNG)■ Joint Photographic Experts Group (JPG/JPEG)
Symbol Library containing imported DWG blocks
If AutoCAD blocks are to be used with Autodesk MapGuide Studio they must be
converted into a symbol library‐compatible format such as EMF or PNG. You can loadblocks into the symbol library by loading the DWG into Studio using a load procedureas long as the blocks are used in the DWG.
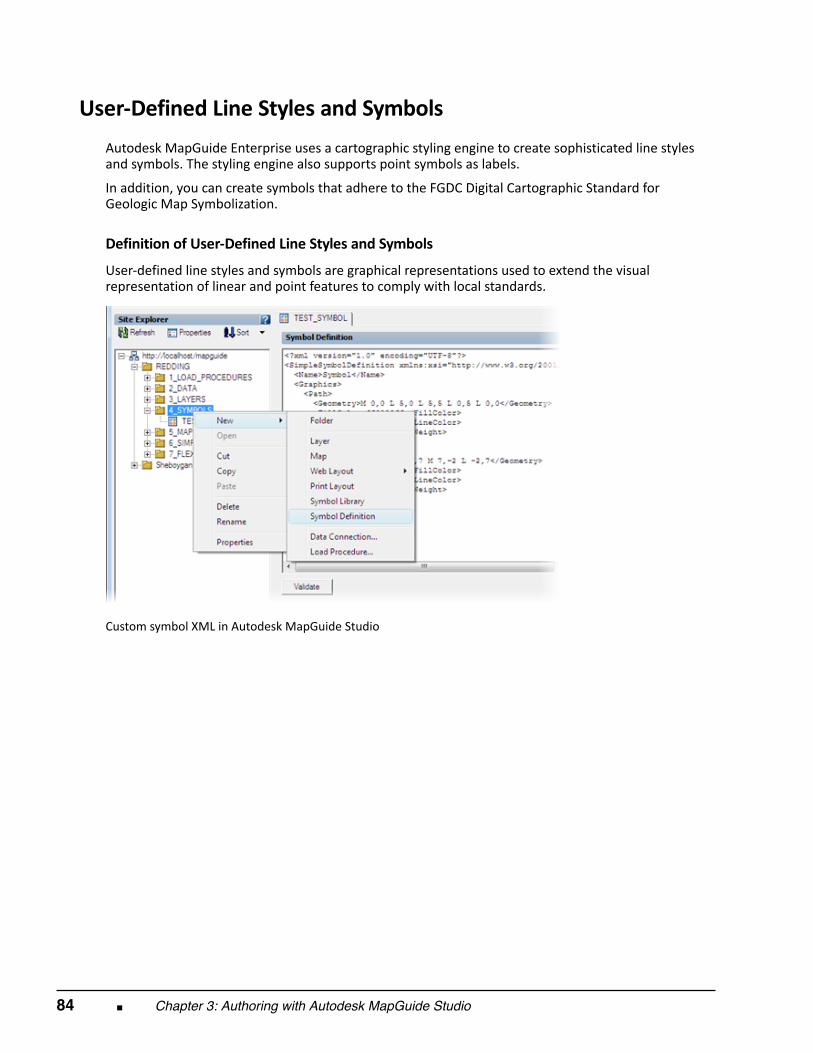
84 ■ Chapter 3: Authoring with Autodesk MapGuide Studio
User‐Defined Line Styles and Symbols
Autodesk MapGuide Enterprise uses a cartographic styling engine to create sophisticated line stylesand symbols. The styling engine also supports point symbols as labels.
In addition, you can create symbols that adhere to the FGDC Digital Cartographic Standard forGeologic Map Symbolization.
Definition of User‐Defined Line Styles and Symbols User‐defined line styles and symbols are graphical representations used to extend the visualrepresentation of linear and point features to comply with local standards.
Custom symbol XML in Autodesk MapGuide Studio
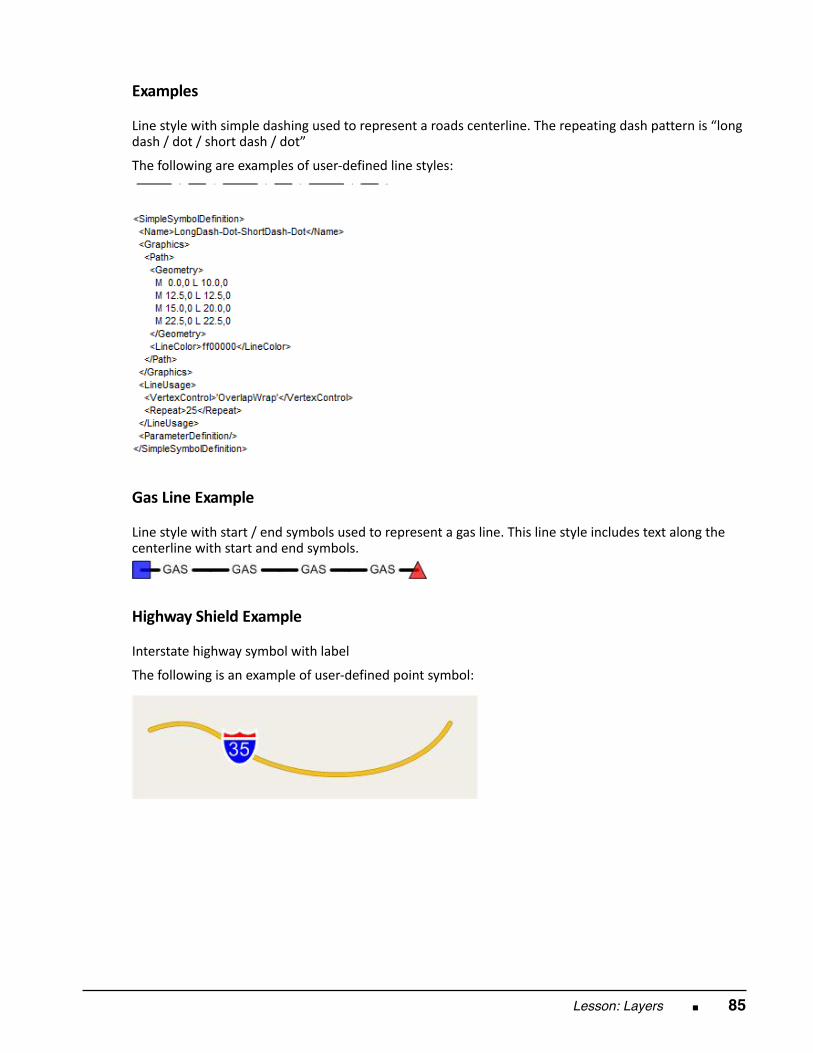
Lesson: Layers ■ 85
Examples
Line style with simple dashing used to represent a roads centerline. The repeating dash pattern is “longdash / dot / short dash / dot”
The following are examples of user‐defined line styles:
Gas Line Example
Line style with start / end symbols used to represent a gas line. This line style includes text along thecenterline with start and end symbols.
Highway Shield Example
Interstate highway symbol with label
The following is an example of user‐defined point symbol:
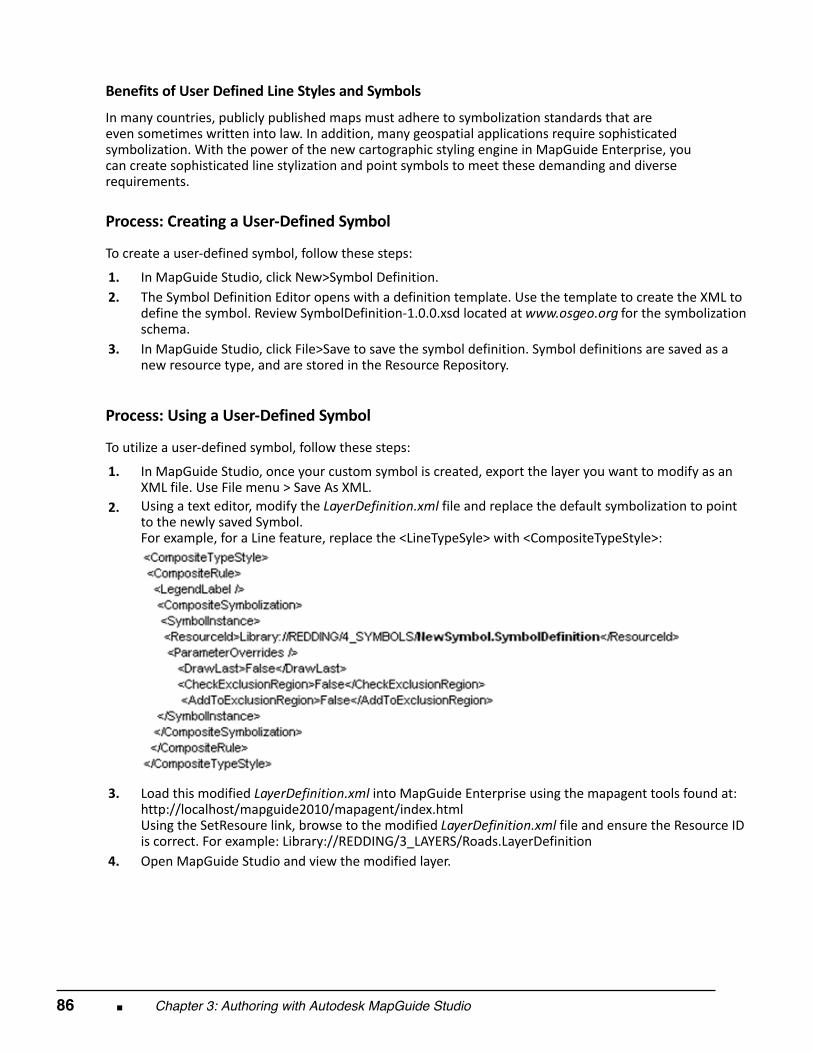
86 ■ Chapter 3: Authoring with Autodesk MapGuide Studio
Benefits of User Defined Line Styles and Symbols In many countries, publicly published maps must adhere to symbolization standards that areeven sometimes written into law. In addition, many geospatial applications require sophisticatedsymbolization. With the power of the new cartographic styling engine in MapGuide Enterprise, youcan create sophisticated line stylization and point symbols to meet these demanding and diverserequirements.
Process: Creating a User‐Defined Symbol
To create a user‐defined symbol, follow these steps:
1. In MapGuide Studio, click New>Symbol Definition.
2.
The Symbol Definition Editor opens with a definition template. Use the template to create the XML todefine the symbol. Review SymbolDefinition‐1.0.0.xsd located at www.osgeo.org for the symbolizationschema.
3.
In MapGuide Studio, click File>Save to save the symbol definition. Symbol definitions are saved as anew resource type, and are stored in the Resource Repository.
Process: Using a User‐Defined Symbol
To utilize a user‐defined symbol, follow these steps:
1. In MapGuide Studio, once your custom symbol is created, export the layer you want to modify as anXML file. Use File menu > Save As XML.
2.
Using a text editor, modify the LayerDefinition.xml file and replace the default symbolization to pointto the newly saved Symbol. For example, for a Line feature, replace the <LineTypeSyle> with <CompositeTypeStyle>:
3.
Load this modified LayerDefinition.xml into MapGuide Enterprise using the mapagent tools found at:http://localhost/mapguide2010/mapagent/index.html Using the SetResoure link, browse to the modified LayerDefinition.xml file and ensure the Resource IDis correct. For example: Library://REDDING/3_LAYERS/Roads.LayerDefinition
4.
Open MapGuide Studio and view the modified layer.
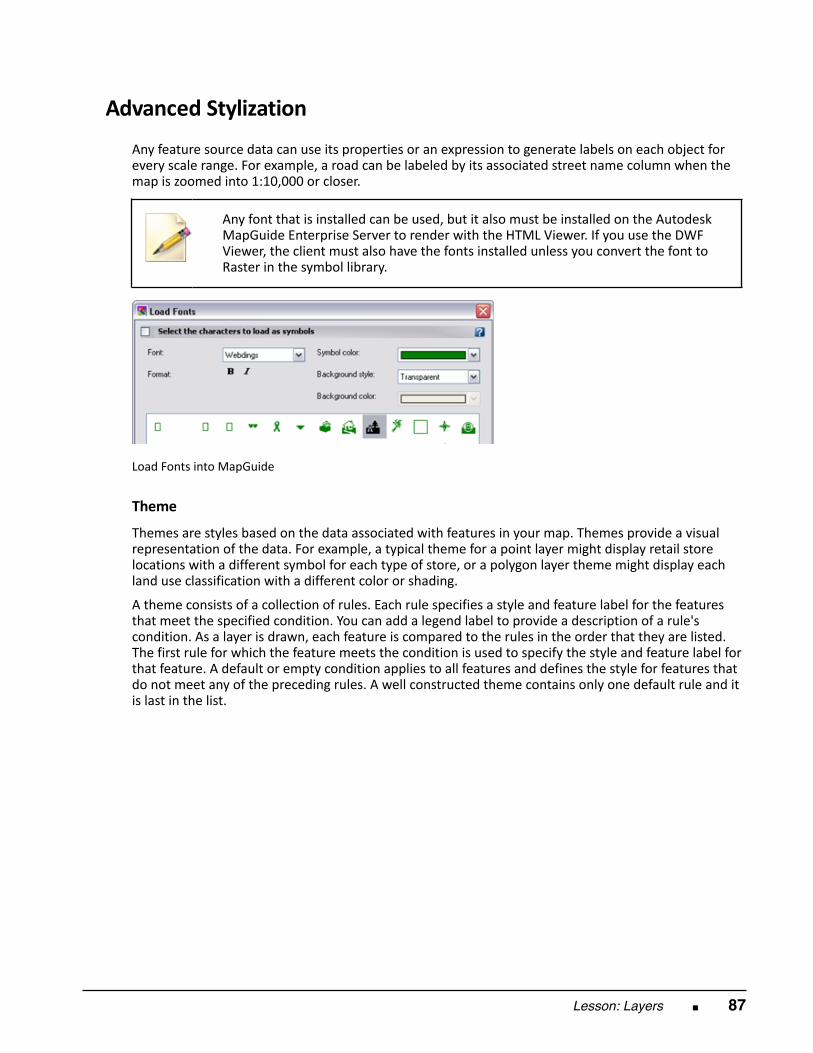
Lesson: Layers ■ 87
Advanced Stylization
Any feature source data can use its properties or an expression to generate labels on each object forevery scale range. For example, a road can be labeled by its associated street name column when themap is zoomed into 1:10,000 or closer.
Any font that is installed can be used, but it also must be installed on the Autodesk
MapGuide Enterprise Server to render with the HTML Viewer. If you use the DWFViewer, the client must also have the fonts installed unless you convert the font toRaster in the symbol library.
Load Fonts into MapGuide
Theme Themes are styles based on the data associated with features in your map. Themes provide a visualrepresentation of the data. For example, a typical theme for a point layer might display retail storelocations with a different symbol for each type of store, or a polygon layer theme might display eachland use classification with a different color or shading.
A theme consists of a collection of rules. Each rule specifies a style and feature label for the featuresthat meet the specified condition. You can add a legend label to provide a description of a rule'scondition. As a layer is drawn, each feature is compared to the rules in the order that they are listed.The first rule for which the feature meets the condition is used to specify the style and feature label forthat feature. A default or empty condition applies to all features and defines the style for features thatdo not meet any of the preceding rules. A well constructed theme contains only one default rule and itis last in the list.
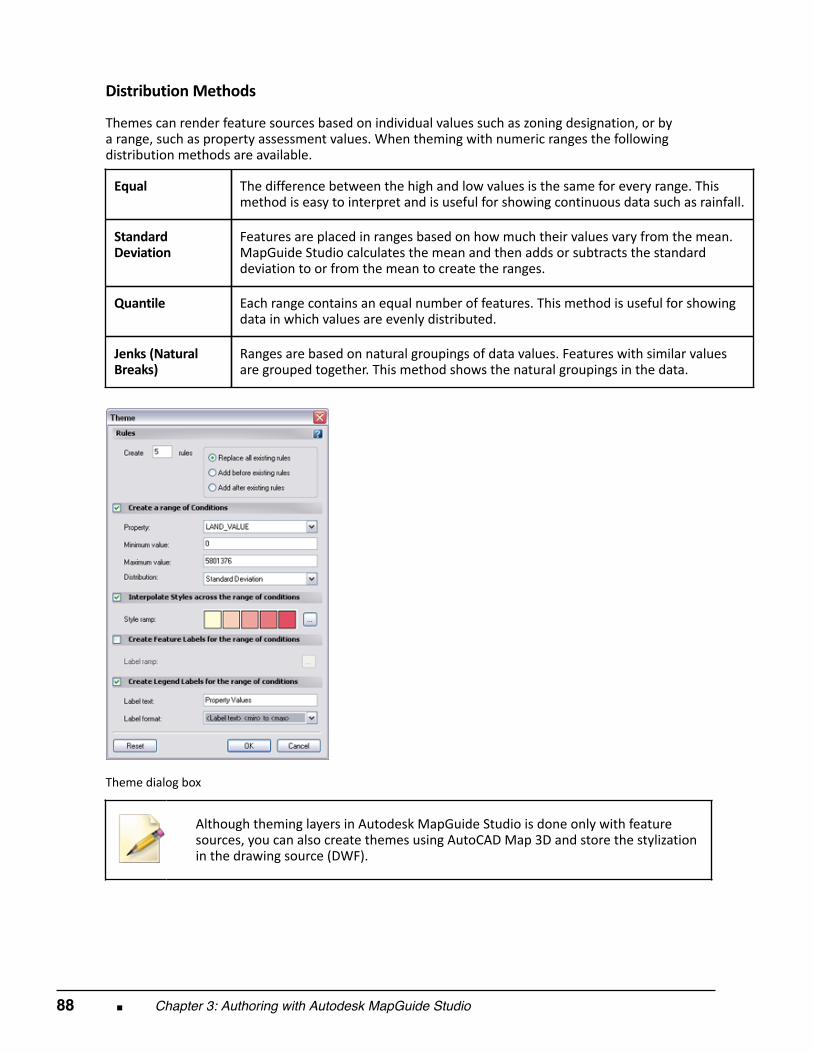
88 ■ Chapter 3: Authoring with Autodesk MapGuide Studio
Distribution Methods
Themes can render feature sources based on individual values such as zoning designation, or bya range, such as property assessment values. When theming with numeric ranges the followingdistribution methods are available.
Equal
The difference between the high and low values is the same for every range. Thismethod is easy to interpret and is useful for showing continuous data such as rainfall.
StandardDeviation
Features are placed in ranges based on how much their values vary from the mean.MapGuide Studio calculates the mean and then adds or subtracts the standarddeviation to or from the mean to create the ranges.
Quantile Each range contains an equal number of features. This method is useful for showingdata in which values are evenly distributed.
Jenks (NaturalBreaks)
Ranges are based on natural groupings of data values. Features with similar valuesare grouped together. This method shows the natural groupings in the data.
Theme dialog box
Although theming layers in Autodesk MapGuide Studio is done only with feature
sources, you can also create themes using AutoCAD Map 3D and store the stylizationin the drawing source (DWF).
Lesson: Layers ■ 89
Drawing Sources Changes you can make to the drawing source (DWF) are the scale range, the print layout, and layersyou want to pull from the DWF.
Raster Sources Other than the scale ranges, raster sources have only two style settings for a raster based layer: ■ Rebuild layer after zooming in by a factor of■ Bitonal image settings
Rebuild Layer After Zooming In By A Factor Of The Rebuild Layer After Zooming in by a Factor Of setting specifies the number of times the user mustzoom in before the layer is automatically rebuilt; this value is expressed as (number of times)/2. Eachtime the layer is rebuilt on the server, a higher resolution version of the image is sent to the client, asAutodesk MapGuide Enterprise dynamically samples the images as you zoom out.
If you zoom in on the map several times, the generalized detail that was appropriate when you werezoomed out might now be too coarse, so you will want to rebuild the layer to use the proper amountof detail at this zoom level. A factor of three is sufficient, but if you require better detail when zoomingin, decrease the number. However, because rebuilding takes time, you should set this number as highas possible to avoid unnecessarily slowing down performance when the user zooms. If the zoom factoris zero, the layer will not be rebuilt on zooming.
Bitonal Image Settings Bitonal Image settings are used for images that are either 1 or 0 in terms of pixel settings. For bitonalraster images, foreground color (1 or “on” pixels) is black by default and background color (0 or “off”pixels) is white. You can specify the following settings for the foreground and background colors: ■ Background window color (of the map)■ Transparent■ Any color from palette These bi‐tonal settings are ignored for any multi‐tonal image, such as full‐color or grayscale images.
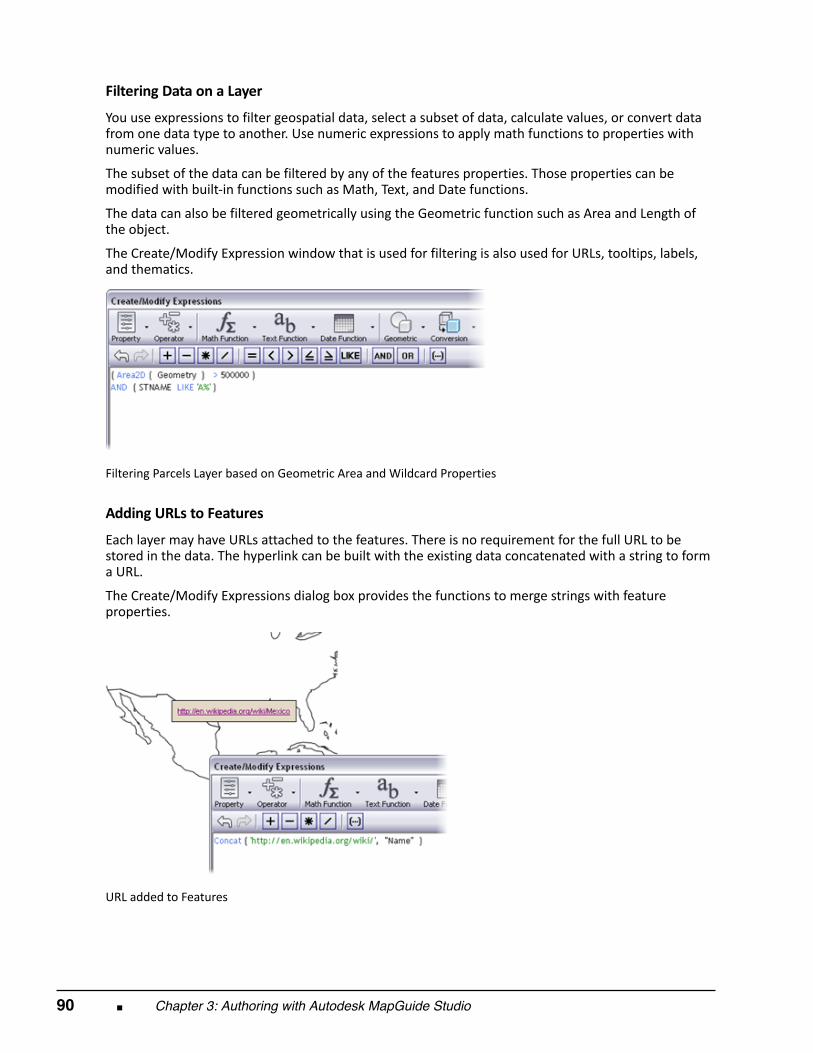
90 ■ Chapter 3: Authoring with Autodesk MapGuide Studio
Filtering Data on a Layer You use expressions to filter geospatial data, select a subset of data, calculate values, or convert datafrom one data type to another. Use numeric expressions to apply math functions to properties withnumeric values.
The subset of the data can be filtered by any of the features properties. Those properties can bemodified with built‐in functions such as Math, Text, and Date functions.
The data can also be filtered geometrically using the Geometric function such as Area and Length ofthe object.
The Create/Modify Expression window that is used for filtering is also used for URLs, tooltips, labels,and thematics.
Filtering Parcels Layer based on Geometric Area and Wildcard Properties
Adding URLs to Features Each layer may have URLs attached to the features. There is no requirement for the full URL to bestored in the data. The hyperlink can be built with the existing data concatenated with a string to forma URL.
The Create/Modify Expressions dialog box provides the functions to merge strings with featureproperties.
URL added to Features
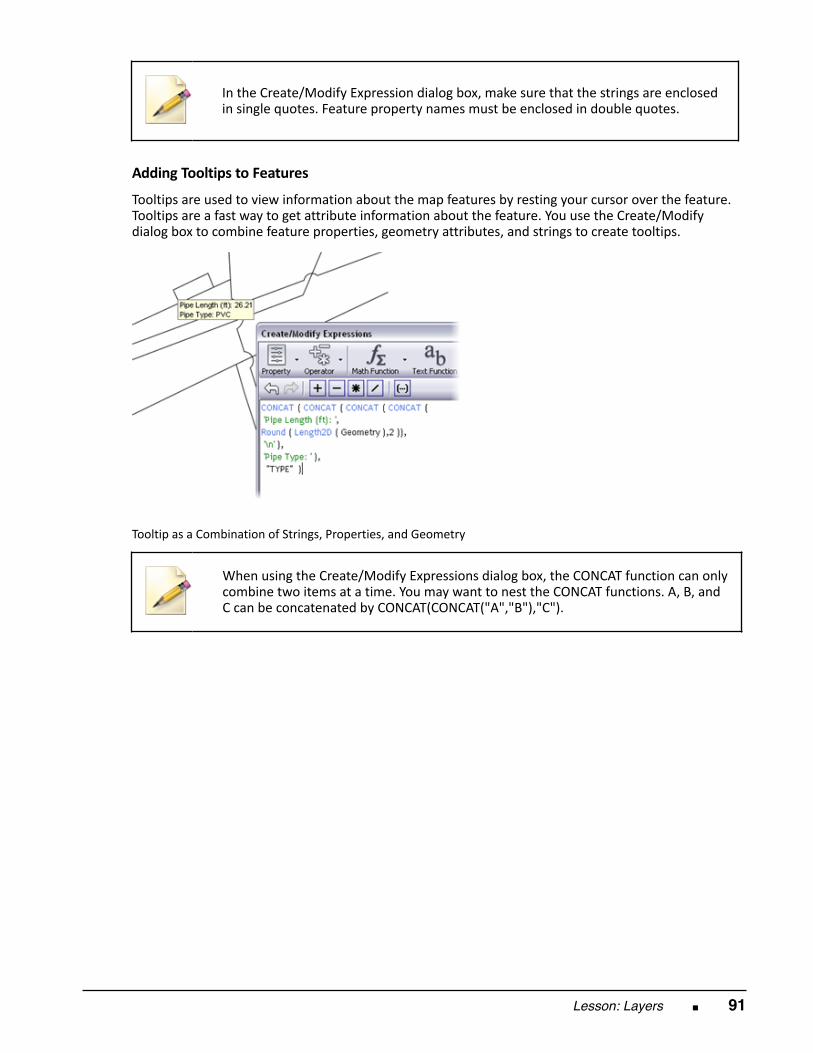
Lesson: Layers ■ 91
In the Create/Modify Expression dialog box, make sure that the strings are enclosedin single quotes. Feature property names must be enclosed in double quotes.
Adding Tooltips to Features Tooltips are used to view information about the map features by resting your cursor over the feature.Tooltips are a fast way to get attribute information about the feature. You use the Create/Modifydialog box to combine feature properties, geometry attributes, and strings to create tooltips.
Tooltip as a Combination of Strings, Properties, and Geometry
When using the Create/Modify Expressions dialog box, the CONCAT function can only
combine two items at a time. You may want to nest the CONCAT functions. A, B, andC can be concatenated by CONCAT(CONCAT("A","B"),"C").
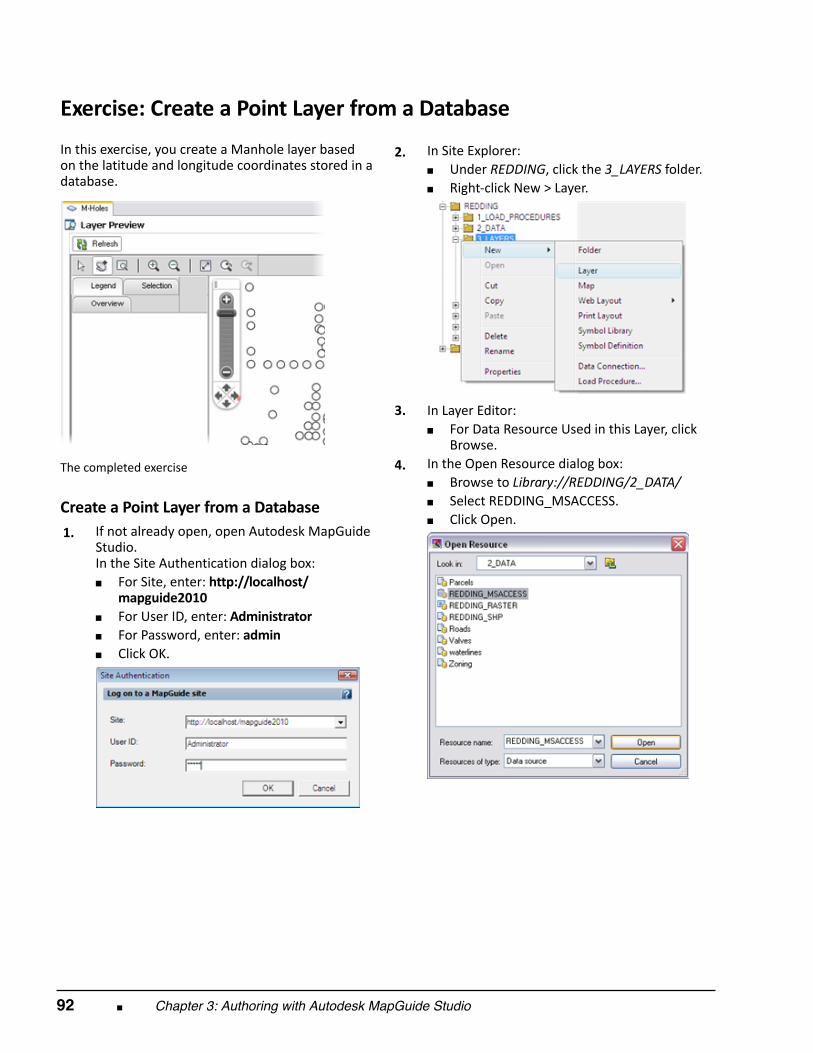
92 ■ Chapter 3: Authoring with Autodesk MapGuide Studio
Exercise: Create a Point Layer from a Database In this exercise, you create a Manhole layer basedon the latitude and longitude coordinates stored in adatabase.
The completed exercise
Create a Point Layer from a Database 1.
If not already open, open Autodesk MapGuideStudio. In the Site Authentication dialog box:■ For Site, enter: http://localhost/
mapguide2010■ For User ID, enter: Administrator■ For Password, enter: admin■ Click OK.
2.
In Site Explorer:■ Under REDDING, click the 3_LAYERS folder.■ Right‐click New > Layer.
3.
In Layer Editor:■ For Data Resource Used in this Layer, click
Browse. 4.
In the Open Resource dialog box:■ Browse to Library://REDDING/2_DATA/■ Select REDDING_MSACCESS.■ Click Open.
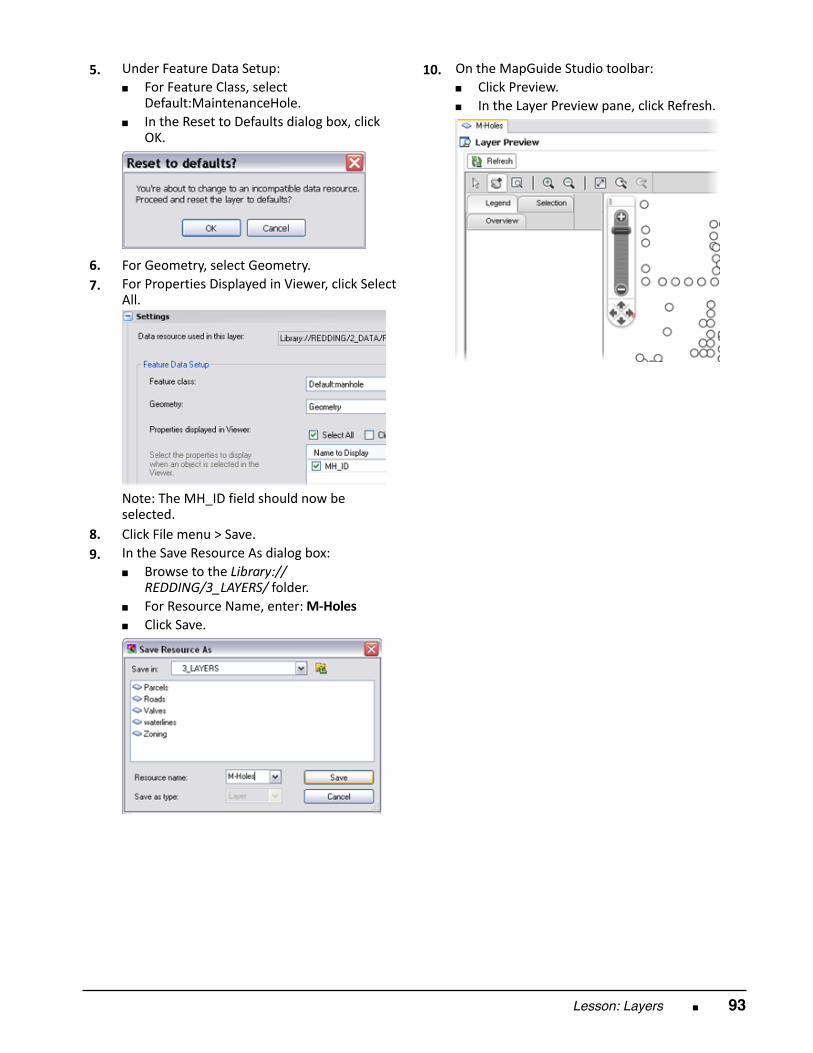
Lesson: Layers ■ 93
5.
Under Feature Data Setup:■ For Feature Class, select
Default:MaintenanceHole.■ In the Reset to Defaults dialog box, click
OK.
6.
For Geometry, select Geometry. 7.
For Properties Displayed in Viewer, click SelectAll.
Note: The MH_ID field should now beselected.
8.
Click File menu > Save. 9.
In the Save Resource As dialog box:■ Browse to the Library://
REDDING/3_LAYERS/ folder.■ For Resource Name, enter: M‐Holes■ Click Save.
10.
On the MapGuide Studio toolbar:■ Click Preview.■ In the Layer Preview pane, click Refresh.
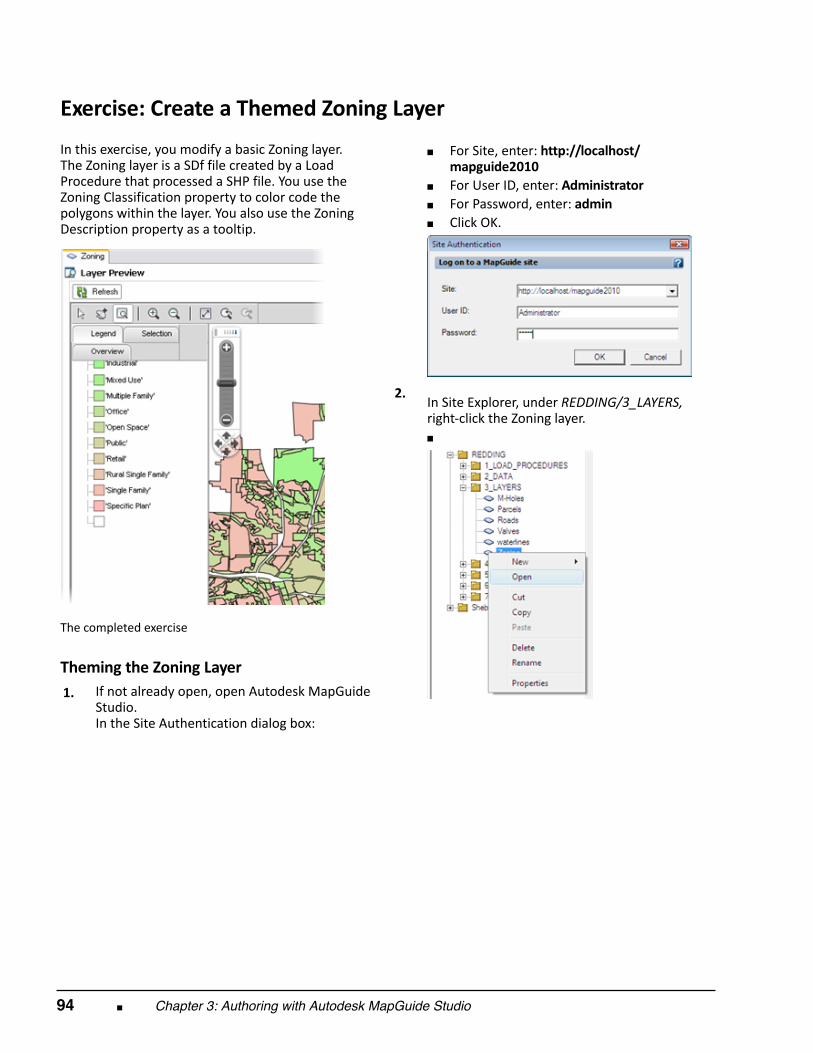
94 ■ Chapter 3: Authoring with Autodesk MapGuide Studio
Exercise: Create a Themed Zoning Layer In this exercise, you modify a basic Zoning layer.The Zoning layer is a SDf file created by a LoadProcedure that processed a SHP file. You use theZoning Classification property to color code thepolygons within the layer. You also use the ZoningDescription property as a tooltip.
The completed exercise
Theming the Zoning Layer 1.
If not already open, open Autodesk MapGuideStudio. In the Site Authentication dialog box:
■ For Site, enter: http://localhost/mapguide2010
■ For User ID, enter: Administrator■ For Password, enter: admin■ Click OK.
2.
In Site Explorer, under REDDING/3_LAYERS,right‐click the Zoning layer.■
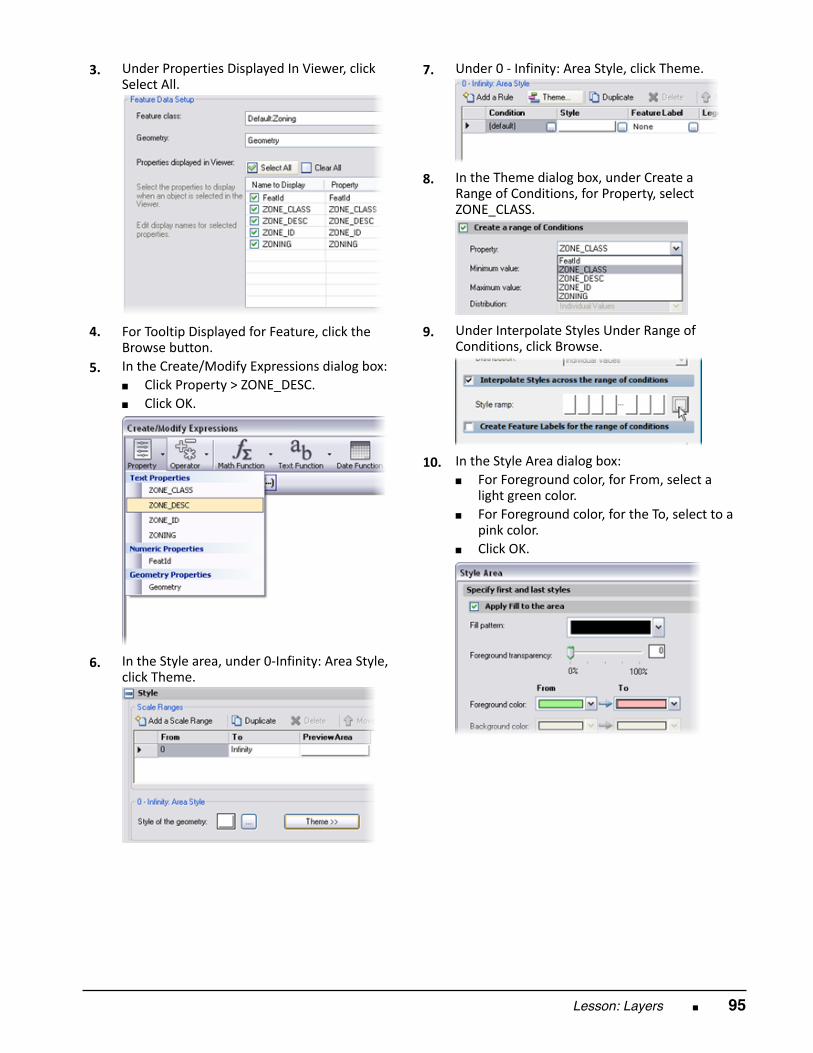
Lesson: Layers ■ 95
3.
Under Properties Displayed In Viewer, clickSelect All.
4.
For Tooltip Displayed for Feature, click theBrowse button.
5.
In the Create/Modify Expressions dialog box:■ Click Property > ZONE_DESC.■ Click OK.
6.
In the Style area, under 0‐Infinity: Area Style,click Theme.
7.
Under 0 ‐ Infinity: Area Style, click Theme.
8.
In the Theme dialog box, under Create aRange of Conditions, for Property, selectZONE_CLASS.
9.
Under Interpolate Styles Under Range ofConditions, click Browse.
10.
In the Style Area dialog box:■ For Foreground color, for From, select a
light green color.■ For Foreground color, for the To, select to a
pink color.■ Click OK.
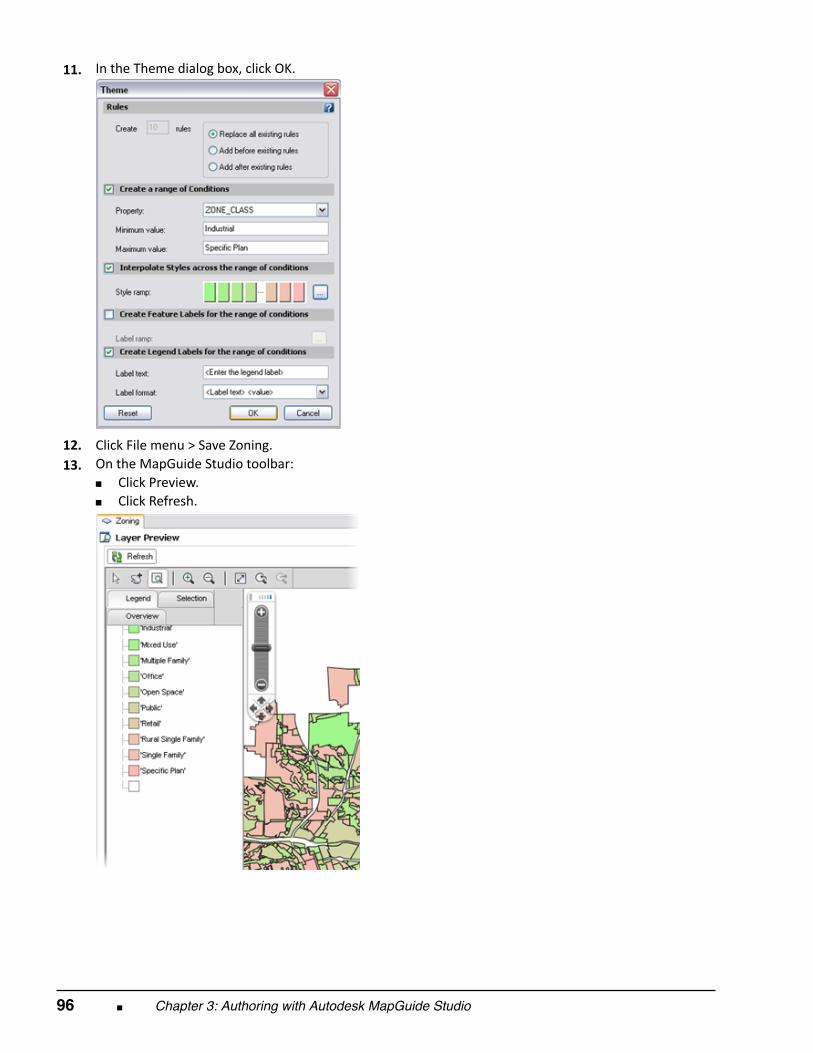
96 ■ Chapter 3: Authoring with Autodesk MapGuide Studio
11.
In the Theme dialog box, click OK.
12.
Click File menu > Save Zoning. 13.
On the MapGuide Studio toolbar:■ Click Preview.■ Click Refresh.
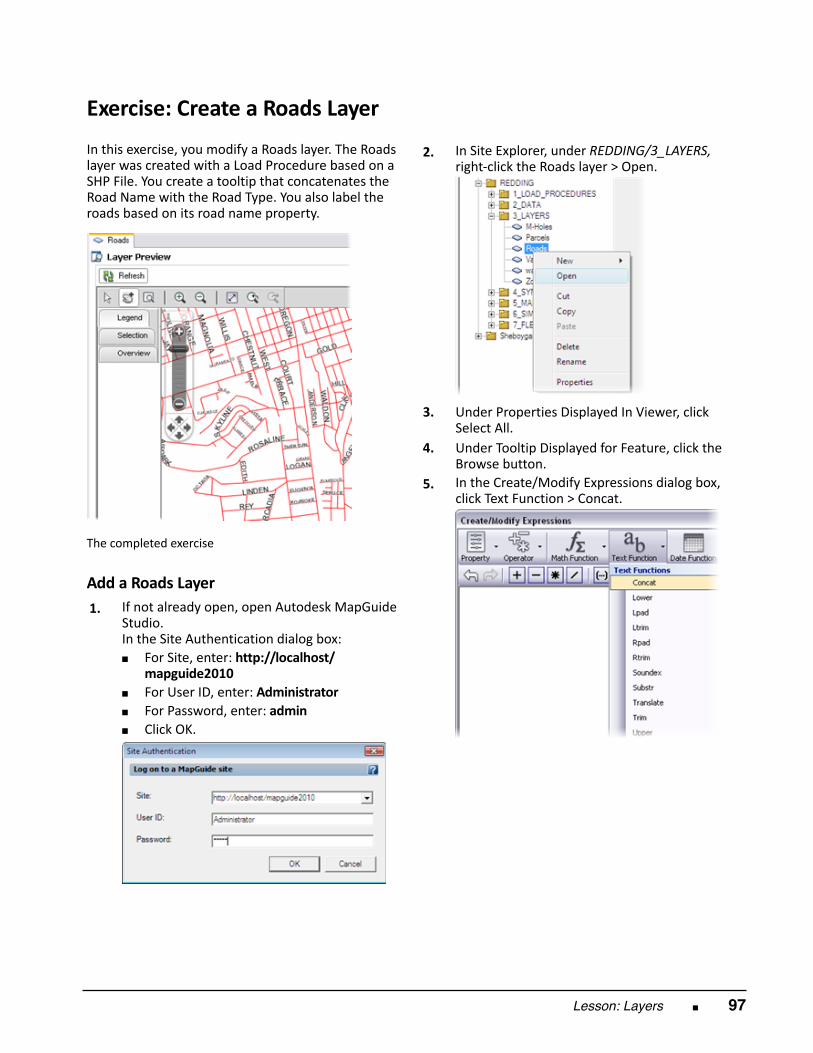
Lesson: Layers ■ 97
Exercise: Create a Roads Layer In this exercise, you modify a Roads layer. The Roadslayer was created with a Load Procedure based on aSHP File. You create a tooltip that concatenates theRoad Name with the Road Type. You also label theroads based on its road name property.
The completed exercise
Add a Roads Layer 1.
If not already open, open Autodesk MapGuideStudio. In the Site Authentication dialog box:■ For Site, enter: http://localhost/
mapguide2010■ For User ID, enter: Administrator■ For Password, enter: admin■ Click OK.
2.
In Site Explorer, under REDDING/3_LAYERS,right‐click the Roads layer > Open.
3.
Under Properties Displayed In Viewer, clickSelect All.
4.
Under Tooltip Displayed for Feature, click theBrowse button.
5.
In the Create/Modify Expressions dialog box,click Text Function > Concat.
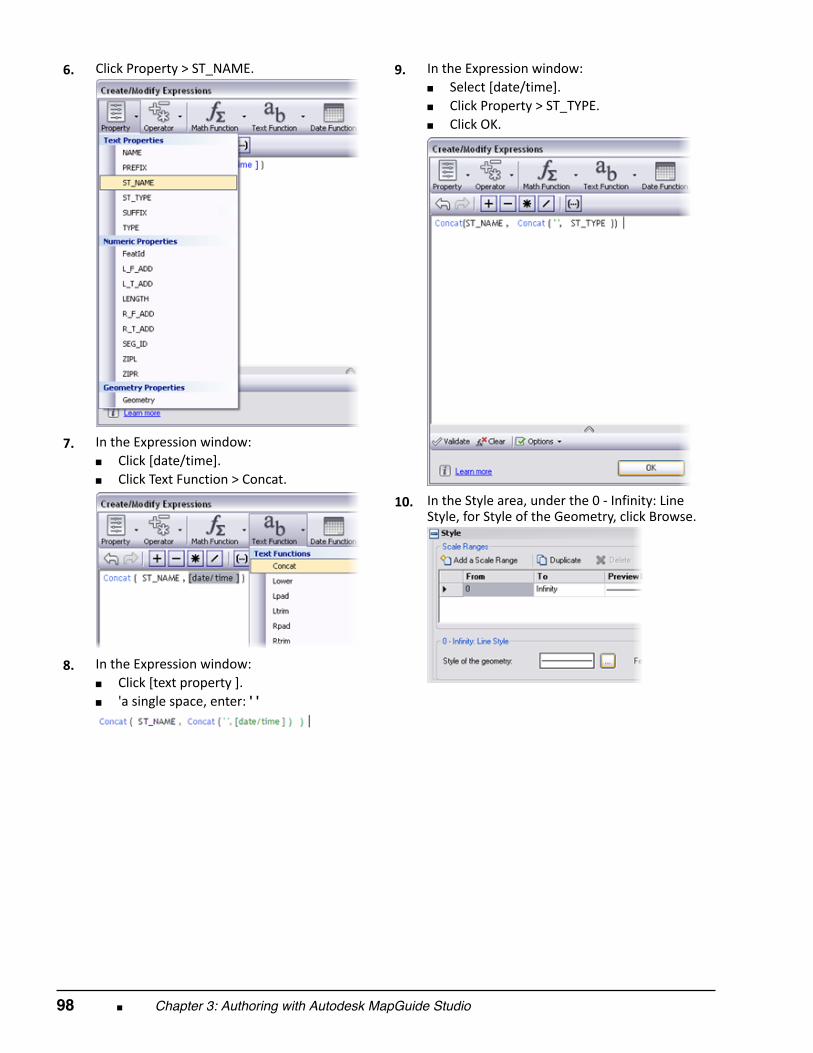
98 ■ Chapter 3: Authoring with Autodesk MapGuide Studio
6.
Click Property > ST_NAME.
7.
In the Expression window:■ Click [date/time].■ Click Text Function > Concat.
8.
In the Expression window:■ Click [text property ].■ 'a single space, enter: ' '
9.
In the Expression window:■ Select [date/time].■ Click Property > ST_TYPE.■ Click OK.
10.
In the Style area, under the 0 ‐ Infinity: LineStyle, for Style of the Geometry, click Browse.
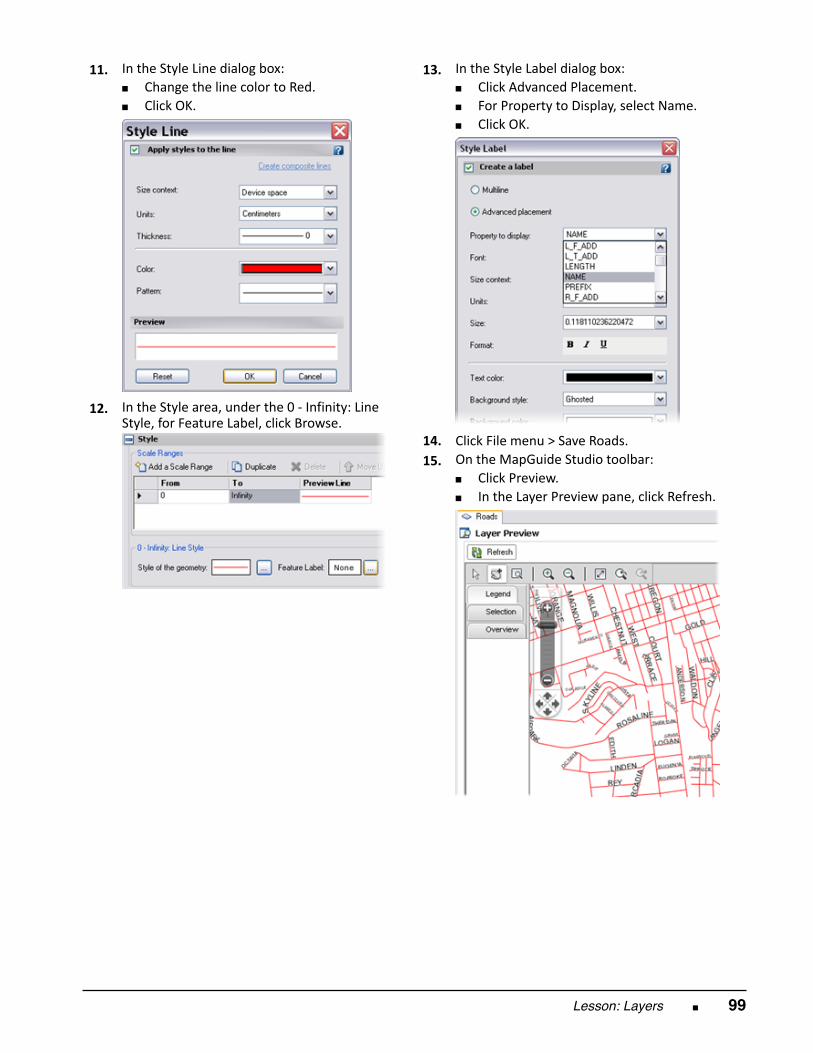
Lesson: Layers ■ 99
11.
In the Style Line dialog box:■ Change the line color to Red.■ Click OK.
12.
In the Style area, under the 0 ‐ Infinity: LineStyle, for Feature Label, click Browse.
13.
In the Style Label dialog box:■ Click Advanced Placement.■ For Property to Display, select Name.■ Click OK.
14.
Click File menu > Save Roads. 15.
On the MapGuide Studio toolbar:■ Click Preview.■ In the Layer Preview pane, click Refresh.
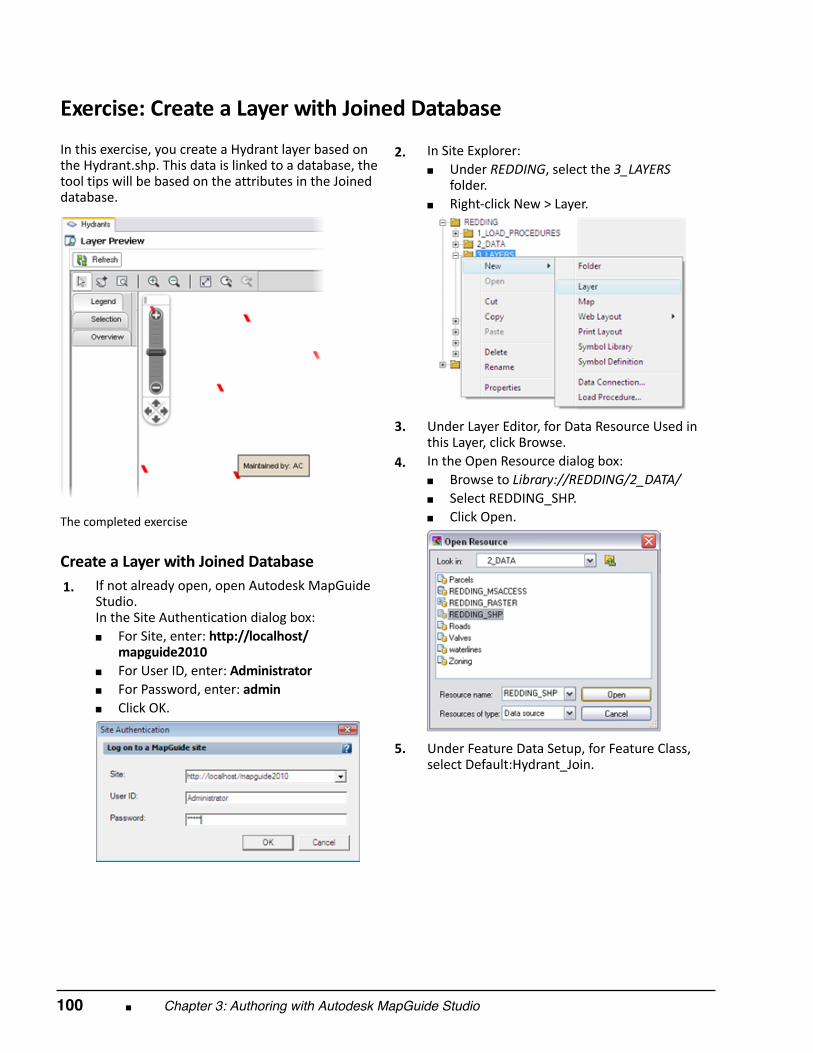
100 ■ Chapter 3: Authoring with Autodesk MapGuide Studio
Exercise: Create a Layer with Joined Database In this exercise, you create a Hydrant layer based onthe Hydrant.shp. This data is linked to a database, thetool tips will be based on the attributes in the Joineddatabase.
The completed exercise
Create a Layer with Joined Database 1.
If not already open, open Autodesk MapGuideStudio. In the Site Authentication dialog box:■ For Site, enter: http://localhost/
mapguide2010■ For User ID, enter: Administrator■ For Password, enter: admin■ Click OK.
2.
In Site Explorer:■ Under REDDING, select the 3_LAYERS
folder.■ Right‐click New > Layer.
3.
Under Layer Editor, for Data Resource Used inthis Layer, click Browse.
4.
In the Open Resource dialog box:■ Browse to Library://REDDING/2_DATA/■ Select REDDING_SHP.■ Click Open.
5.
Under Feature Data Setup, for Feature Class,select Default:Hydrant_Join.
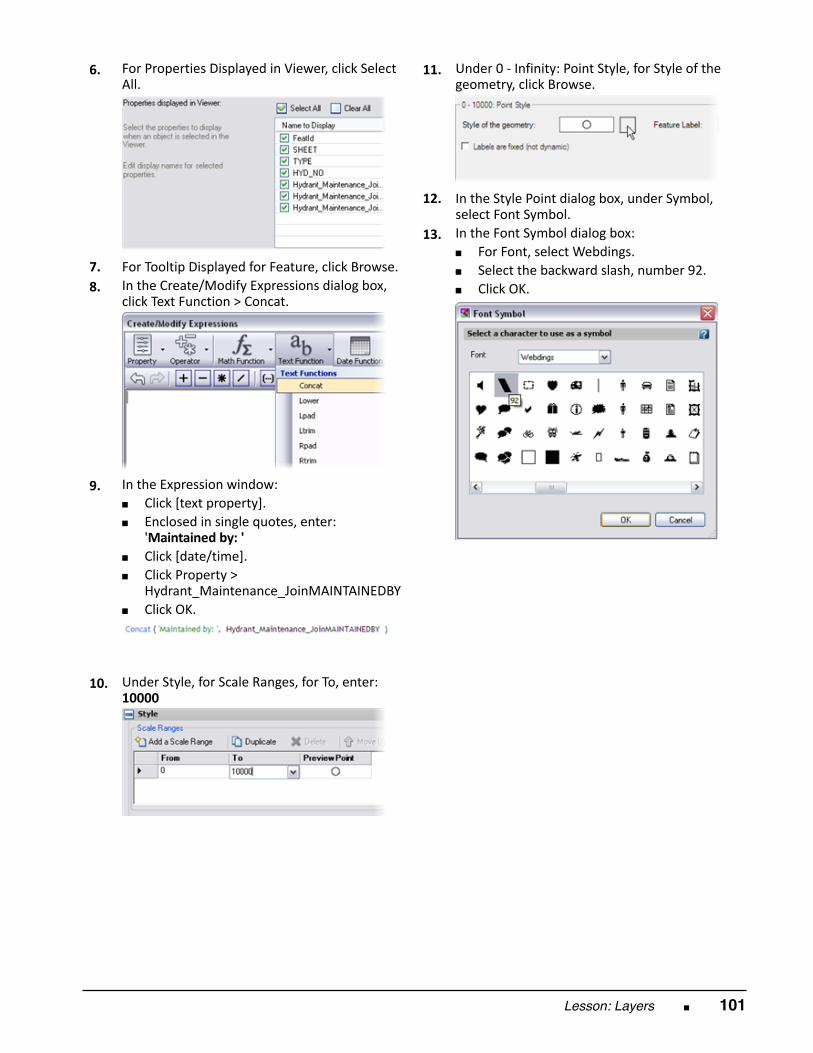
Lesson: Layers ■ 101
6.
For Properties Displayed in Viewer, click SelectAll.
7.
For Tooltip Displayed for Feature, click Browse. 8.
In the Create/Modify Expressions dialog box,click Text Function > Concat.
9.
In the Expression window:■ Click [text property].■ Enclosed in single quotes, enter:
'Maintained by: '■ Click [date/time].■ Click Property >
Hydrant_Maintenance_JoinMAINTAINEDBY■ Click OK.
10.
Under Style, for Scale Ranges, for To, enter:10000
11.
Under 0 ‐ Infinity: Point Style, for Style of thegeometry, click Browse.
12.
In the Style Point dialog box, under Symbol,select Font Symbol.
13.
In the Font Symbol dialog box:■ For Font, select Webdings.■ Select the backward slash, number 92.■ Click OK.
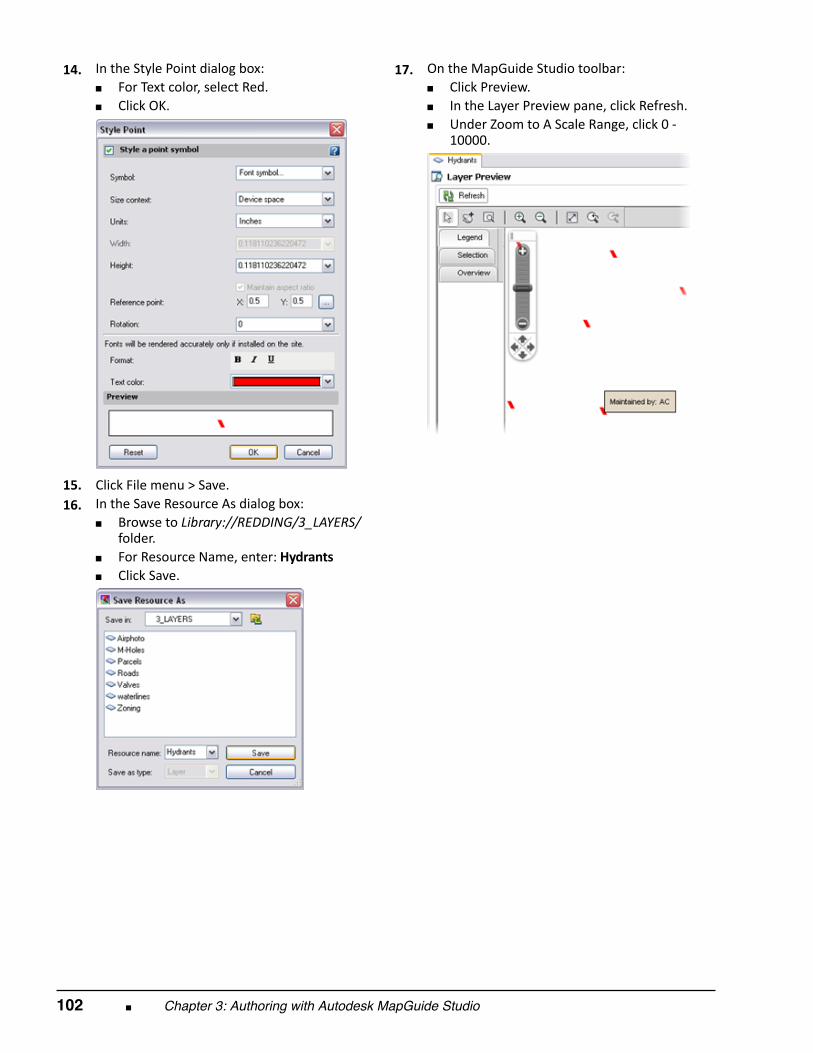
102 ■ Chapter 3: Authoring with Autodesk MapGuide Studio
14.
In the Style Point dialog box:■ For Text color, select Red.■ Click OK.
15.
Click File menu > Save. 16.
In the Save Resource As dialog box:■ Browse to Library://REDDING/3_LAYERS/
folder.■ For Resource Name, enter: Hydrants■ Click Save.
17.
On the MapGuide Studio toolbar:■ Click Preview.■ In the Layer Preview pane, click Refresh.■ Under Zoom to A Scale Range, click 0 ‐
10000.
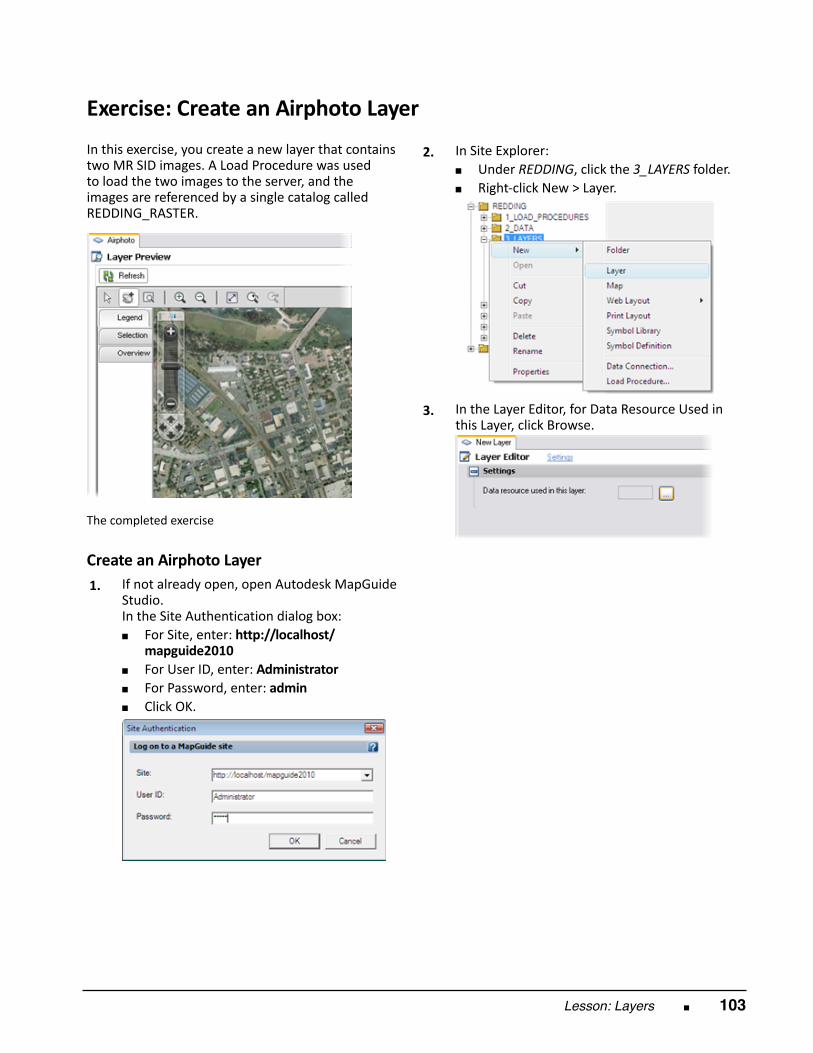
Lesson: Layers ■ 103
Exercise: Create an Airphoto Layer In this exercise, you create a new layer that containstwo MR SID images. A Load Procedure was usedto load the two images to the server, and theimages are referenced by a single catalog calledREDDING_RASTER.
The completed exercise
Create an Airphoto Layer 1.
If not already open, open Autodesk MapGuideStudio. In the Site Authentication dialog box:■ For Site, enter: http://localhost/
mapguide2010■ For User ID, enter: Administrator■ For Password, enter: admin■ Click OK.
2.
In Site Explorer:■ Under REDDING, click the 3_LAYERS folder.■ Right‐click New > Layer.
3.
In the Layer Editor, for Data Resource Used inthis Layer, click Browse.
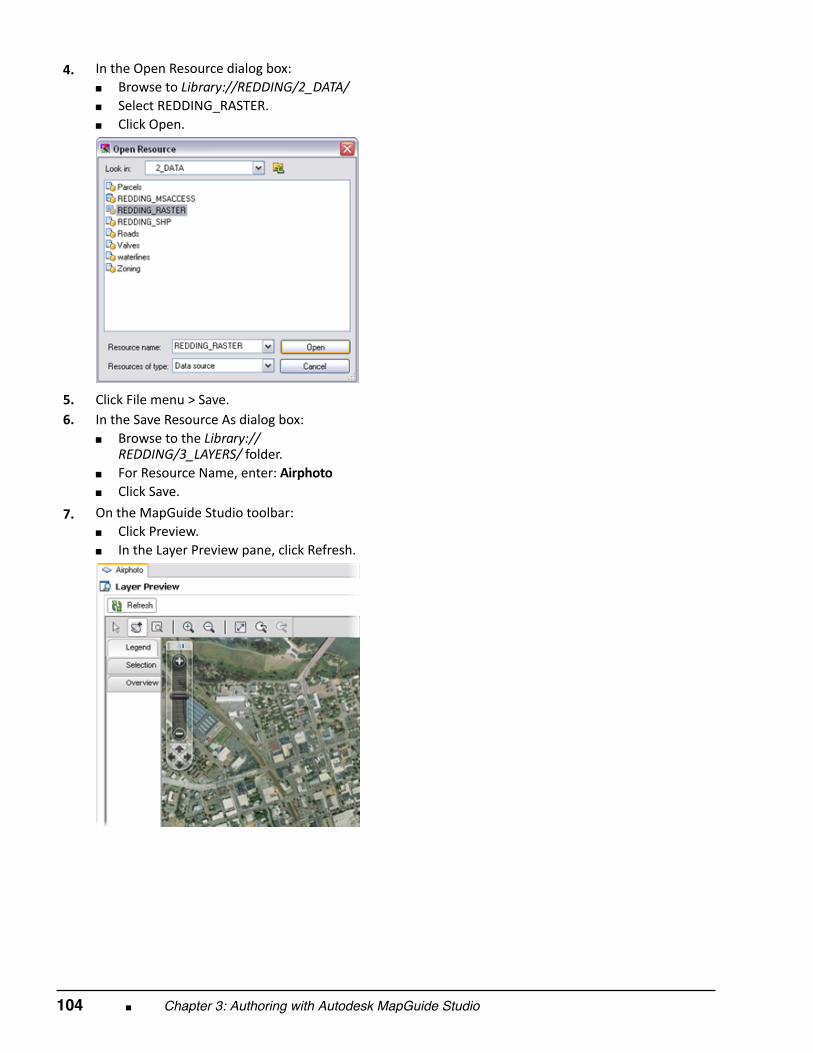
104 ■ Chapter 3: Authoring with Autodesk MapGuide Studio
4.
In the Open Resource dialog box:■ Browse to Library://REDDING/2_DATA/■ Select REDDING_RASTER.■ Click Open.
5.
Click File menu > Save. 6.
In the Save Resource As dialog box:■ Browse to the Library://
REDDING/3_LAYERS/ folder.■ For Resource Name, enter: Airphoto■ Click Save.
7. On the MapGuide Studio toolbar:■ Click Preview.■ In the Layer Preview pane, click Refresh.
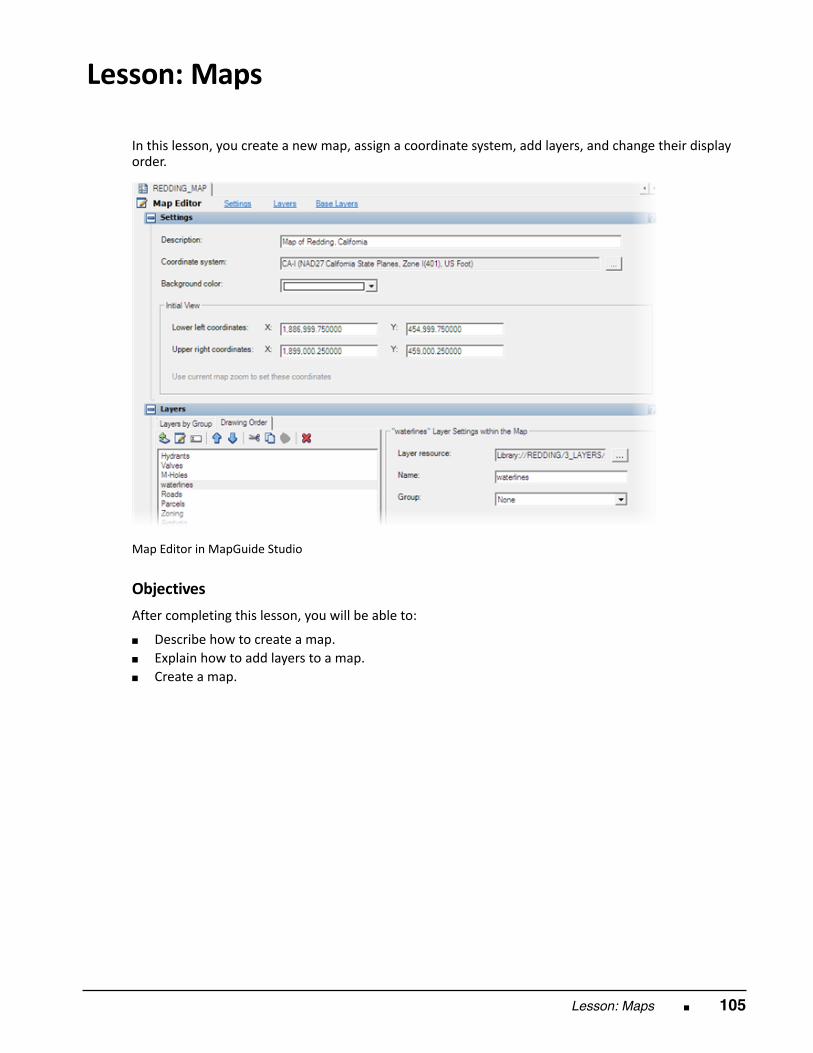
Lesson: Maps ■ 105
Lesson: Maps
In this lesson, you create a new map, assign a coordinate system, add layers, and change their displayorder.
Map Editor in MapGuide Studio
Objectives After completing this lesson, you will be able to:
■ Describe how to create a map.■ Explain how to add layers to a map.■ Create a map.
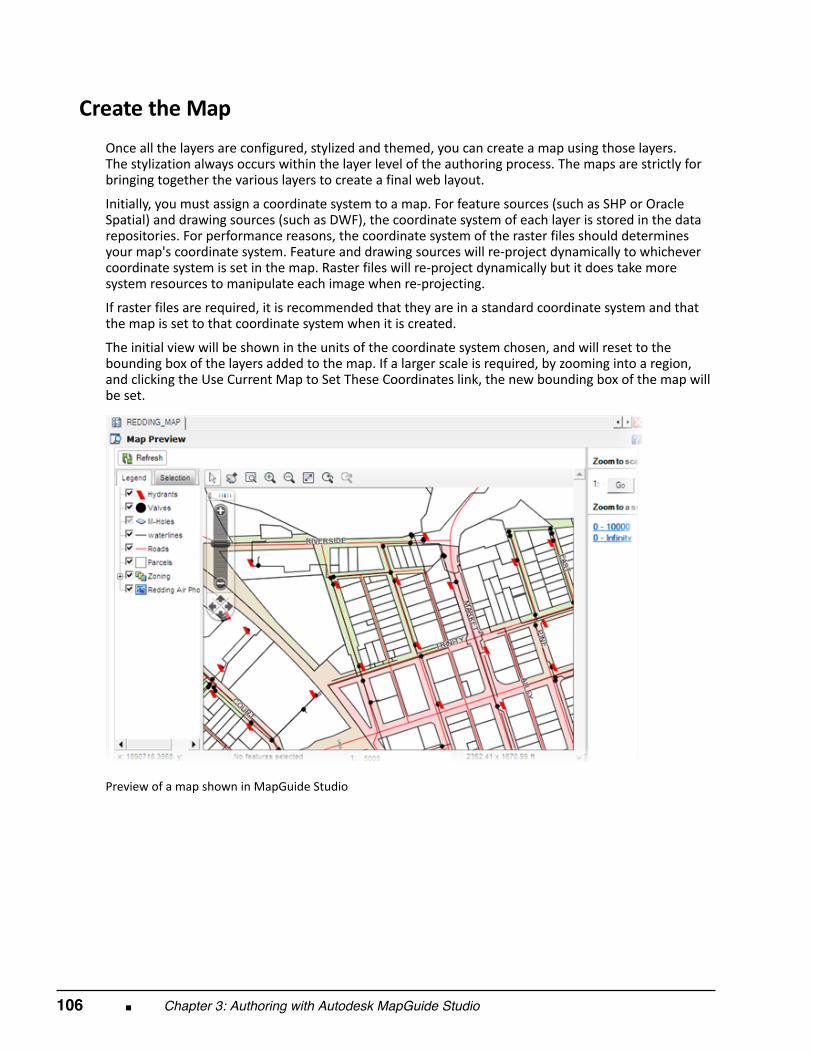
106 ■ Chapter 3: Authoring with Autodesk MapGuide Studio
Create the Map
Once all the layers are configured, stylized and themed, you can create a map using those layers.The stylization always occurs within the layer level of the authoring process. The maps are strictly forbringing together the various layers to create a final web layout.
Initially, you must assign a coordinate system to a map. For feature sources (such as SHP or OracleSpatial) and drawing sources (such as DWF), the coordinate system of each layer is stored in the datarepositories. For performance reasons, the coordinate system of the raster files should determinesyour map's coordinate system. Feature and drawing sources will re‐project dynamically to whichevercoordinate system is set in the map. Raster files will re‐project dynamically but it does take moresystem resources to manipulate each image when re‐projecting.
If raster files are required, it is recommended that they are in a standard coordinate system and thatthe map is set to that coordinate system when it is created.
The initial view will be shown in the units of the coordinate system chosen, and will reset to thebounding box of the layers added to the map. If a larger scale is required, by zooming into a region,and clicking the Use Current Map to Set These Coordinates link, the new bounding box of the map willbe set.
Preview of a map shown in MapGuide Studio
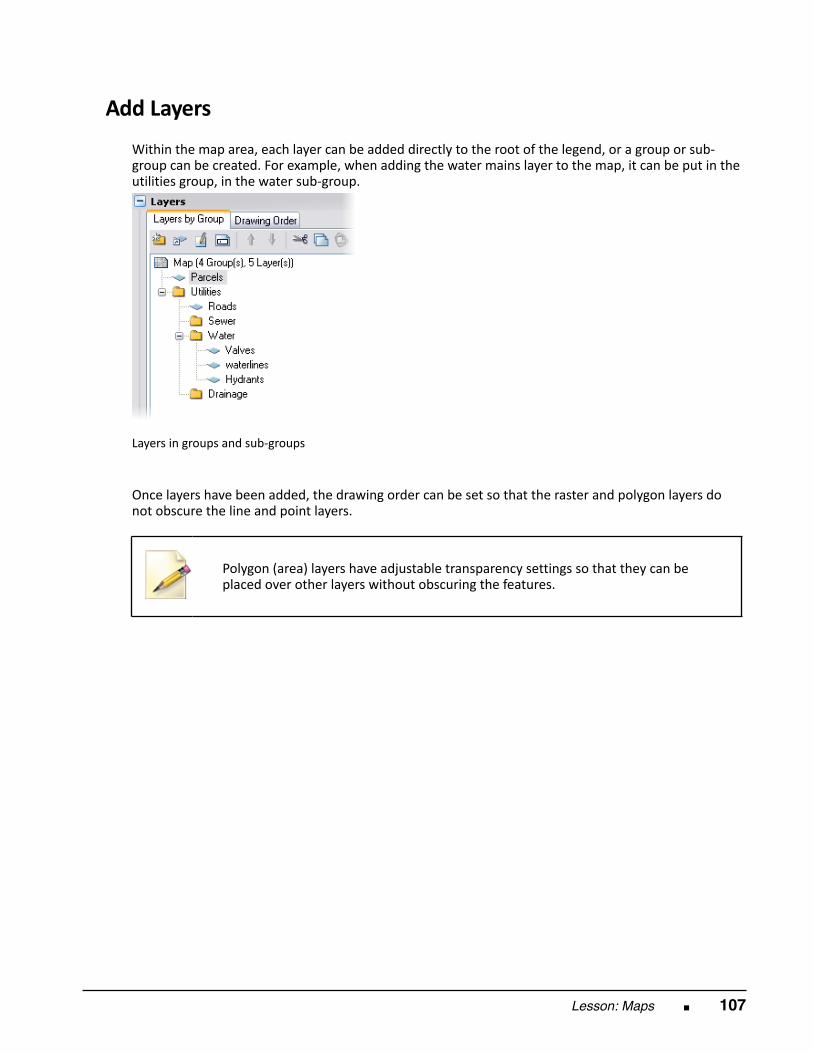
Lesson: Maps ■ 107
Add Layers
Within the map area, each layer can be added directly to the root of the legend, or a group or sub‐group can be created. For example, when adding the water mains layer to the map, it can be put in theutilities group, in the water sub‐group.
Layers in groups and sub‐groups
Once layers have been added, the drawing order can be set so that the raster and polygon layers donot obscure the line and point layers.
Polygon (area) layers have adjustable transparency settings so that they can beplaced over other layers without obscuring the features.
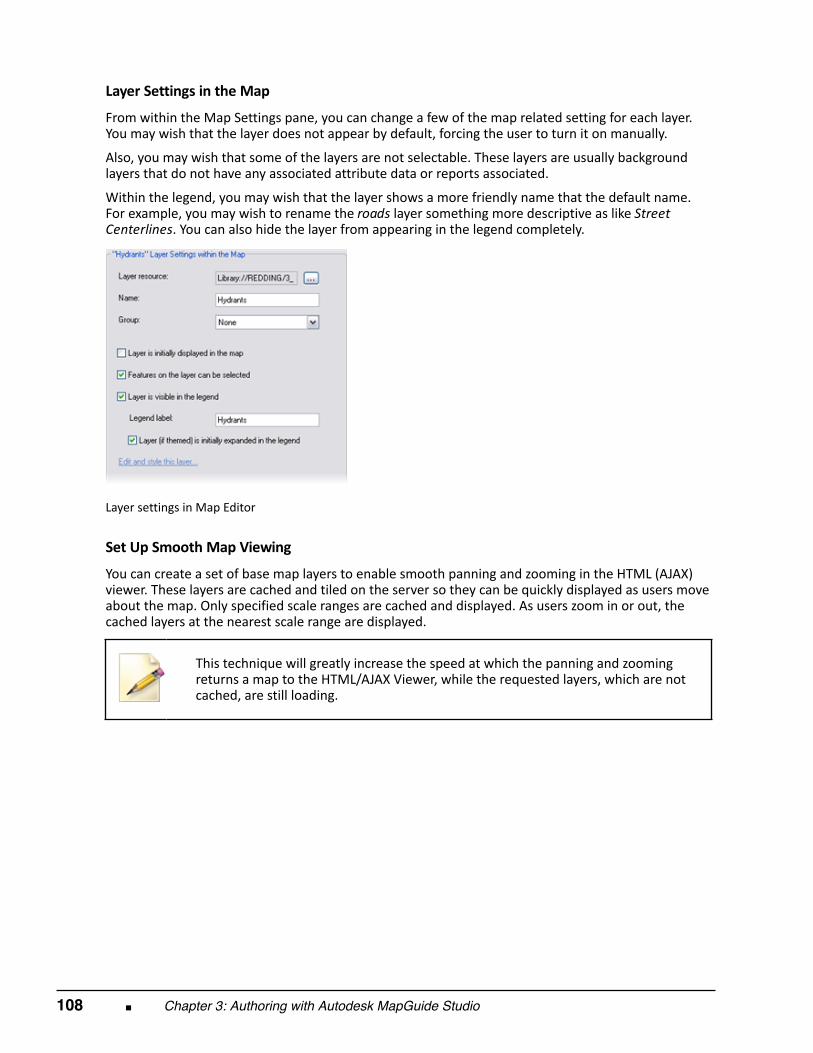
108 ■ Chapter 3: Authoring with Autodesk MapGuide Studio
Layer Settings in the Map From within the Map Settings pane, you can change a few of the map related setting for each layer.You may wish that the layer does not appear by default, forcing the user to turn it on manually.
Also, you may wish that some of the layers are not selectable. These layers are usually backgroundlayers that do not have any associated attribute data or reports associated.
Within the legend, you may wish that the layer shows a more friendly name that the default name.For example, you may wish to rename the roads layer something more descriptive as like StreetCenterlines. You can also hide the layer from appearing in the legend completely.
Layer settings in Map Editor
Set Up Smooth Map Viewing You can create a set of base map layers to enable smooth panning and zooming in the HTML (AJAX)viewer. These layers are cached and tiled on the server so they can be quickly displayed as users moveabout the map. Only specified scale ranges are cached and displayed. As users zoom in or out, thecached layers at the nearest scale range are displayed.
This technique will greatly increase the speed at which the panning and zooming
returns a map to the HTML/AJAX Viewer, while the requested layers, which are notcached, are still loading.
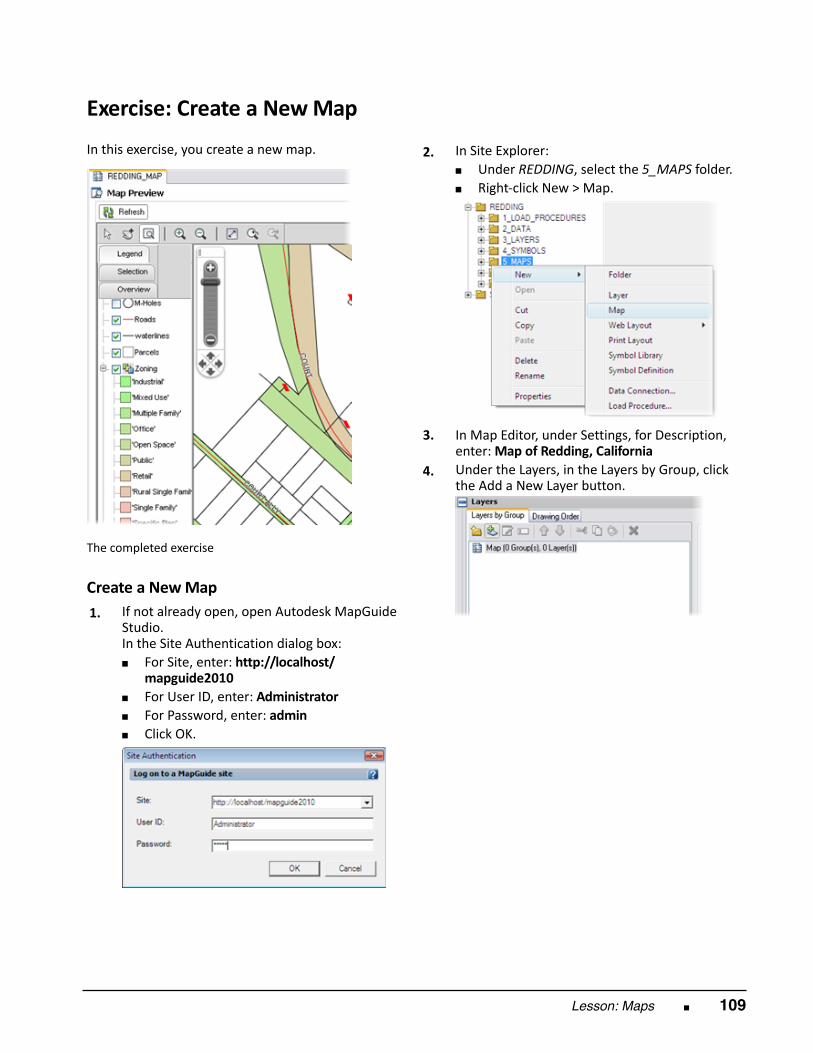
Lesson: Maps ■ 109
Exercise: Create a New Map In this exercise, you create a new map.
The completed exercise
Create a New Map 1.
If not already open, open Autodesk MapGuideStudio. In the Site Authentication dialog box:■ For Site, enter: http://localhost/
mapguide2010■ For User ID, enter: Administrator■ For Password, enter: admin■ Click OK.
2.
In Site Explorer:■ Under REDDING, select the 5_MAPS folder.■ Right‐click New > Map.
3.
In Map Editor, under Settings, for Description,enter: Map of Redding, California
4.
Under the Layers, in the Layers by Group, clickthe Add a New Layer button.
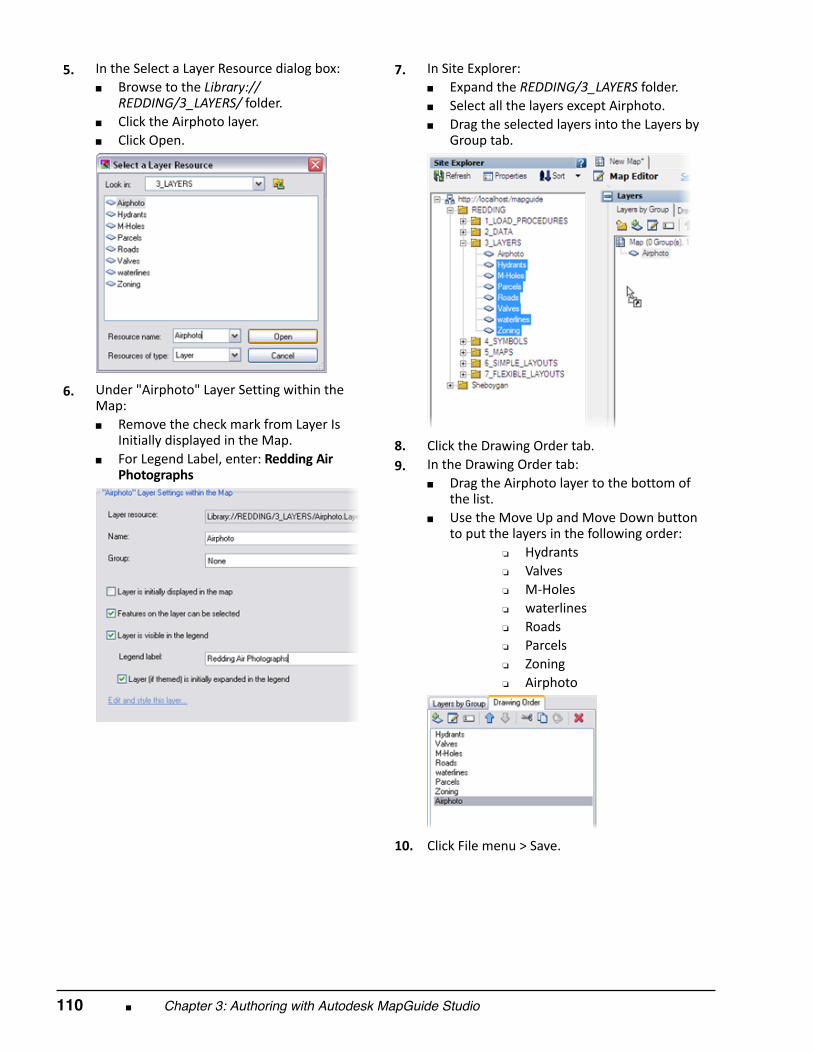
110 ■ Chapter 3: Authoring with Autodesk MapGuide Studio
5.
In the Select a Layer Resource dialog box:■ Browse to the Library://
REDDING/3_LAYERS/ folder.■ Click the Airphoto layer.■ Click Open.
6.
Under "Airphoto" Layer Setting within theMap:■ Remove the check mark from Layer Is
Initially displayed in the Map.■ For Legend Label, enter: Redding Air
Photographs
7.
In Site Explorer:■ Expand the REDDING/3_LAYERS folder.■ Select all the layers except Airphoto.■ Drag the selected layers into the Layers by
Group tab.
8.
Click the Drawing Order tab. 9.
In the Drawing Order tab:■ Drag the Airphoto layer to the bottom of
the list.■ Use the Move Up and Move Down button
to put the layers in the following order:❏ Hydrants❏ Valves❏ M‐Holes❏ waterlines❏ Roads❏ Parcels❏ Zoning❏ Airphoto
10.
Click File menu > Save.
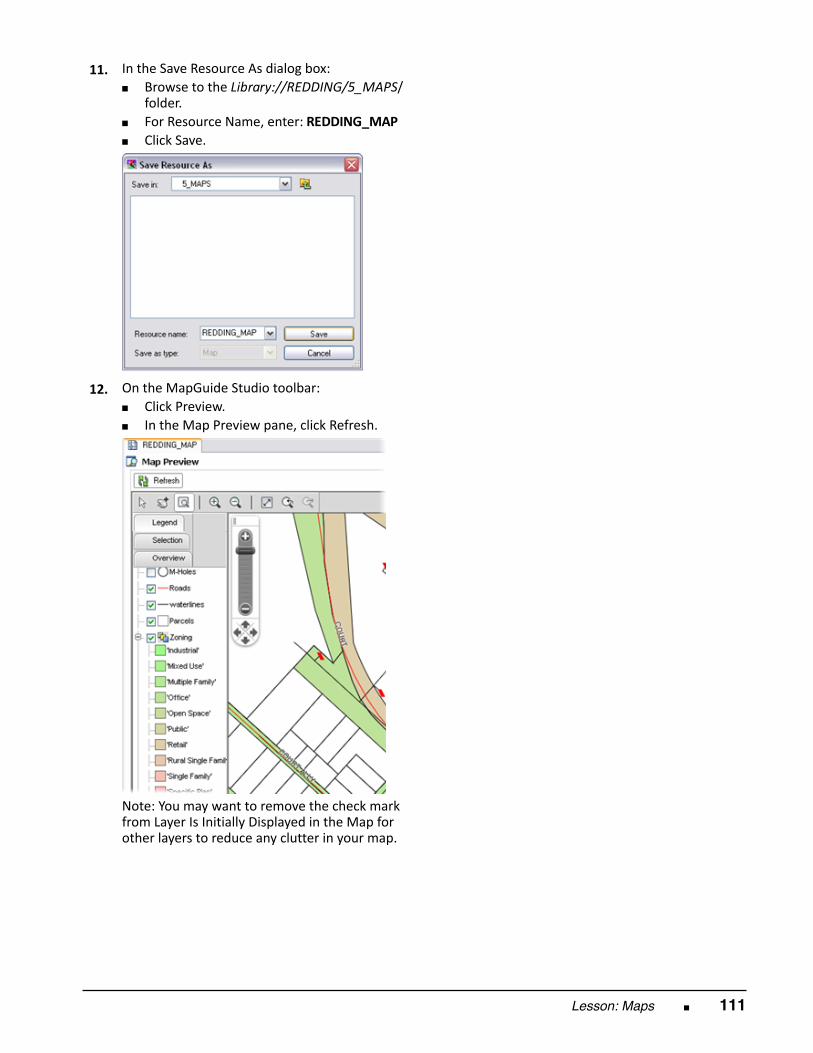
Lesson: Maps ■ 111
11.
In the Save Resource As dialog box:■ Browse to the Library://REDDING/5_MAPS/
folder.■ For Resource Name, enter: REDDING_MAP■ Click Save.
12.
On the MapGuide Studio toolbar:■ Click Preview.■ In the Map Preview pane, click Refresh.
Note: You may want to remove the check markfrom Layer Is Initially Displayed in the Map forother layers to reduce any clutter in your map.

112 ■ Chapter 3: Authoring with Autodesk MapGuide Studio
Chapter Summary
Having completed this chapter, you can:
■ Explain the difference between data loading and data connections within MapGuide Studio.■ Describe the data loading process in MapGuide Studio.■ Create layers in MapGuide Studio.■ Create maps in MapGuide Studio.
Chapter Overview ■ 113
Chapter
4
Basic and Flexible Web Layouts
Autodesk MapGuide® Studio is used to create and customize a web layout in preparation for webdeployment. Some of the tools within MapGuide Studio, such as customizing buttons, do not requirecoding or elaborate programming. This chapter reviews both the Basic Web Layout and the FlexibleWeb Layout tools.
Objectives After completing this chapter, you will be able to:
■ Create a basic web layout in MapGuide Studio.■ Describe the components of the Flexible Layouts and how to customize the various components.
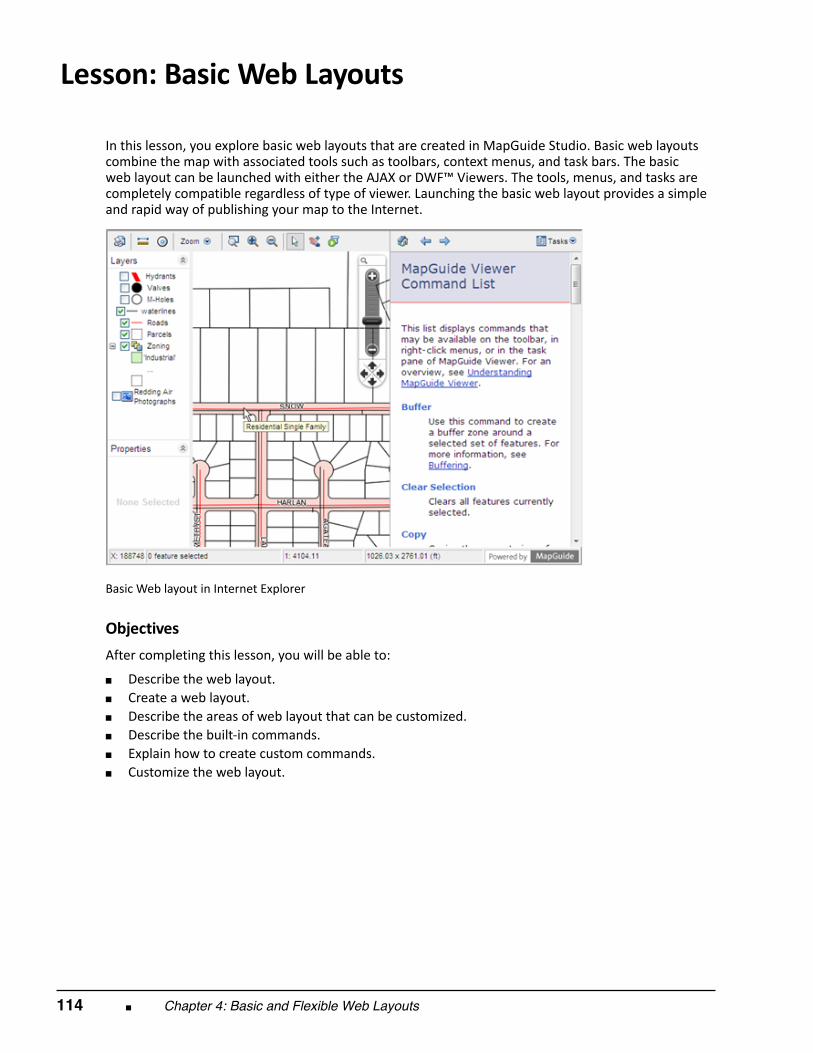
114 ■ Chapter 4: Basic and Flexible Web Layouts
Lesson: Basic Web Layouts
In this lesson, you explore basic web layouts that are created in MapGuide Studio. Basic web layoutscombine the map with associated tools such as toolbars, context menus, and task bars. The basicweb layout can be launched with either the AJAX or DWF™ Viewers. The tools, menus, and tasks arecompletely compatible regardless of type of viewer. Launching the basic web layout provides a simpleand rapid way of publishing your map to the Internet.
Basic Web layout in Internet Explorer
Objectives After completing this lesson, you will be able to:
■ Describe the web layout.■ Create a web layout.■ Describe the areas of web layout that can be customized.■ Describe the built‐in commands.■ Explain how to create custom commands.■ Customize the web layout.
Lesson: Basic Web Layouts ■ 115
About Web Layouts
Introduction to Basic Web Layouts The Autodesk MapGuide Viewer can be used with most web browsers. There are two types of the Autodesk MapGuide® Enterprise Viewers: ■ The downloadable viewer is based on a Microsoft ActiveX control and has full support for the DWF
format. It works with the Microsoft Internet Explorer browser installed on a Windows computeronly.
■ The HTML viewer (or “zero‐client AJAX viewer”) does not need a download. It works with mostbrowsers such as Microsoft Internet Explorer or Mozilla Firefox on most operating systems.
You can customize the appearance of the viewer and select which toolbar commands you want to usewith a template called a web layout. Of course, you can also add features and functions to the basiclayout using your own programming code. Creating Basic Web Layouts After you create a map, you can build a basic web layout so that users can view and interact withthe map on the Internet or an intranet. You can preview your map and layout in the Web LayoutEditor. You can also view your web layout in a browser using the AJAX Viewer or the DWF Viewer usingAutodesk® Design Review. Layer, Map, and Web Layout Dependency
In Autodesk MapGuide Studio, the stylizing of the layers is done at the layer level of the map, so thatif the layer color changes, such as road changes from red to black, it is seen in any map that uses thatlayer.
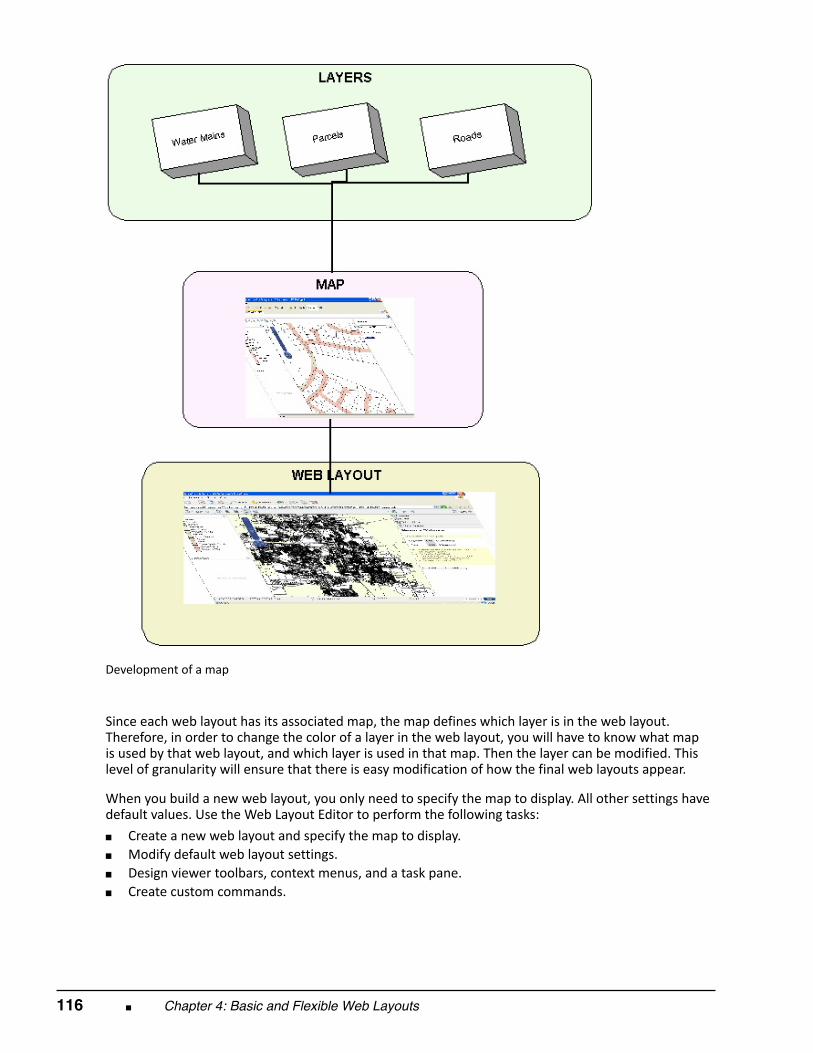
116 ■ Chapter 4: Basic and Flexible Web Layouts
Development of a map
Since each web layout has its associated map, the map defines which layer is in the web layout.Therefore, in order to change the color of a layer in the web layout, you will have to know what mapis used by that web layout, and which layer is used in that map. Then the layer can be modified. Thislevel of granularity will ensure that there is easy modification of how the final web layouts appear.
When you build a new web layout, you only need to specify the map to display. All other settings havedefault values. Use the Web Layout Editor to perform the following tasks: ■ Create a new web layout and specify the map to display.■ Modify default web layout settings.■ Design viewer toolbars, context menus, and a task pane.■ Create custom commands.
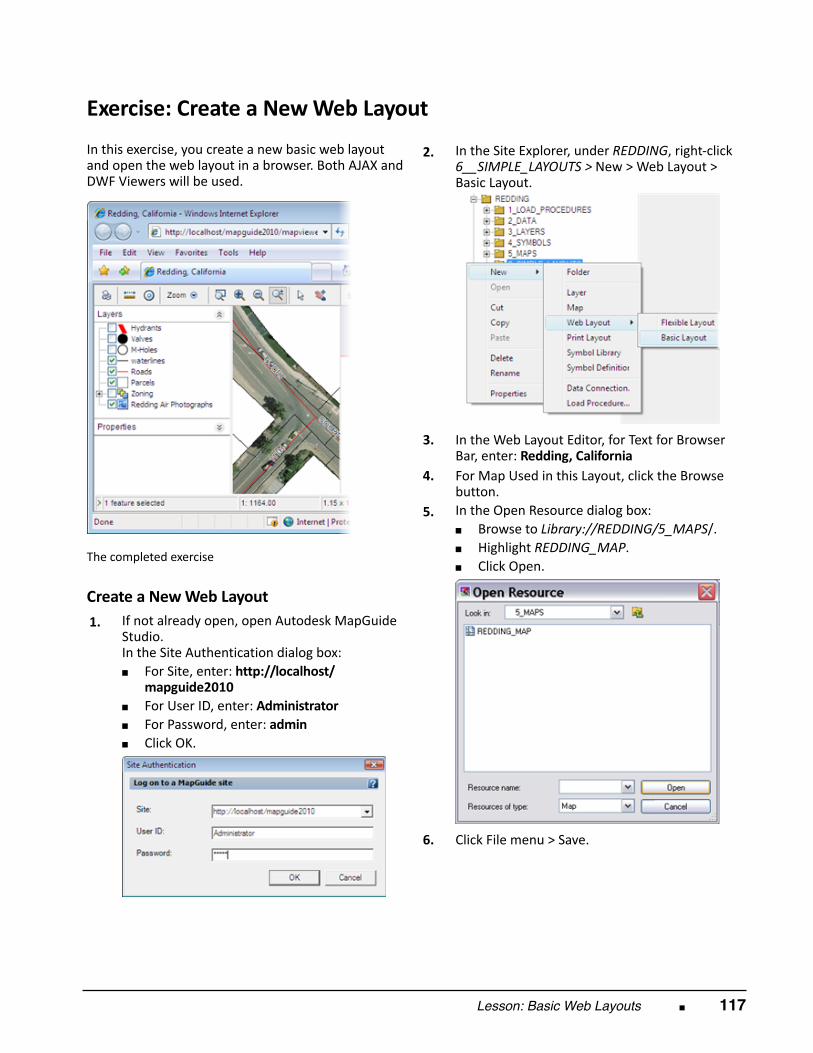
Lesson: Basic Web Layouts ■ 117
Exercise: Create a New Web Layout In this exercise, you create a new basic web layoutand open the web layout in a browser. Both AJAX andDWF Viewers will be used.
The completed exercise
Create a New Web Layout 1.
If not already open, open Autodesk MapGuideStudio. In the Site Authentication dialog box:■ For Site, enter: http://localhost/
mapguide2010■ For User ID, enter: Administrator■ For Password, enter: admin■ Click OK.
2.
In the Site Explorer, under REDDING, right‐click6__SIMPLE_LAYOUTS > New > Web Layout >Basic Layout.
3.
In the Web Layout Editor, for Text for BrowserBar, enter: Redding, California
4.
For Map Used in this Layout, click the Browsebutton.
5.
In the Open Resource dialog box:■ Browse to Library://REDDING/5_MAPS/.■ Highlight REDDING_MAP.■ Click Open.
6.
Click File menu > Save.
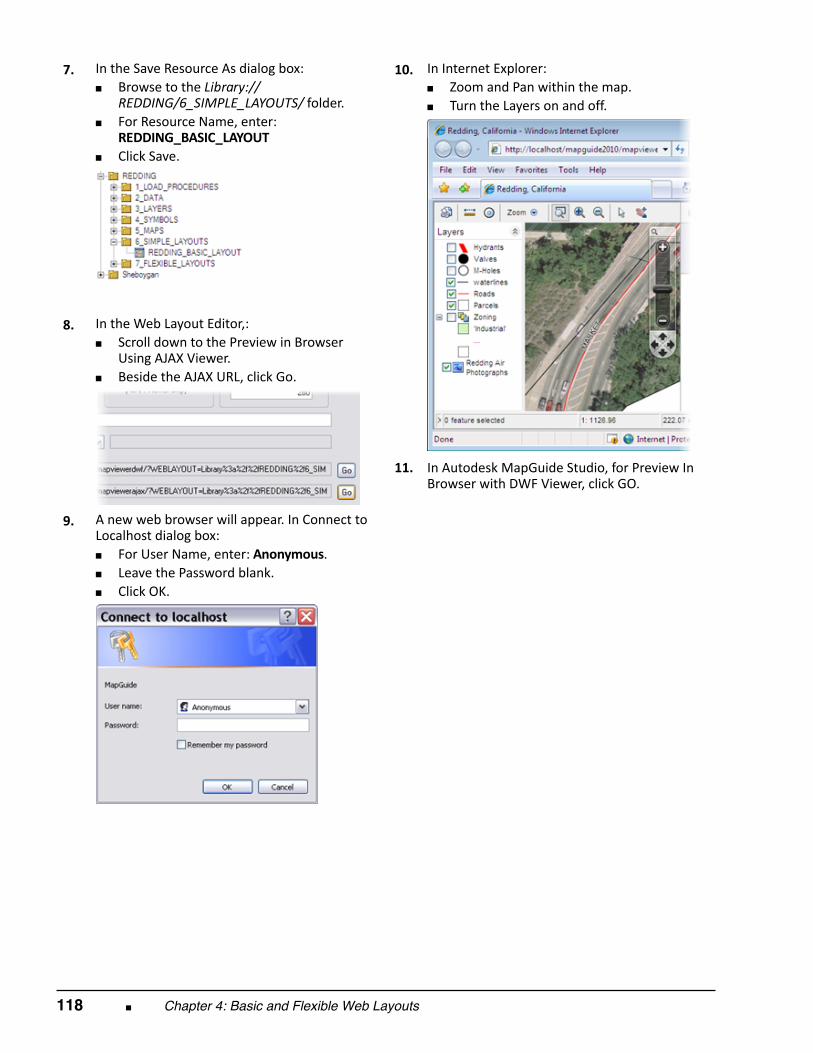
118 ■ Chapter 4: Basic and Flexible Web Layouts
7.
In the Save Resource As dialog box:■ Browse to the Library://
REDDING/6_SIMPLE_LAYOUTS/ folder.■ For Resource Name, enter:
REDDING_BASIC_LAYOUT■ Click Save.
8.
In the Web Layout Editor,:■ Scroll down to the Preview in Browser
Using AJAX Viewer.■ Beside the AJAX URL, click Go.
9.
A new web browser will appear. In Connect toLocalhost dialog box:■ For User Name, enter: Anonymous.■ Leave the Password blank.■ Click OK.
10.
In Internet Explorer:■ Zoom and Pan within the map.■ Turn the Layers on and off.
11.
In Autodesk MapGuide Studio, for Preview InBrowser with DWF Viewer, click GO.
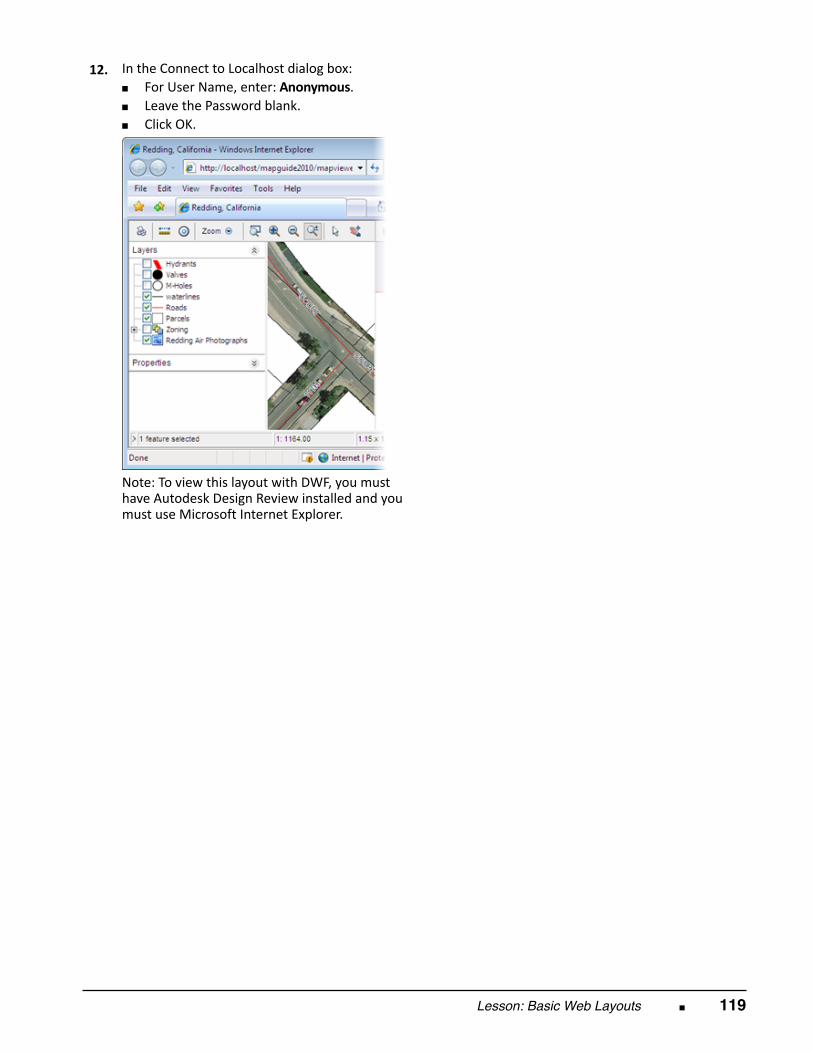
Lesson: Basic Web Layouts ■ 119
12.
In the Connect to Localhost dialog box:■ For User Name, enter: Anonymous.■ Leave the Password blank.■ Click OK.
Note: To view this layout with DWF, you musthave Autodesk Design Review installed and youmust use Microsoft Internet Explorer.
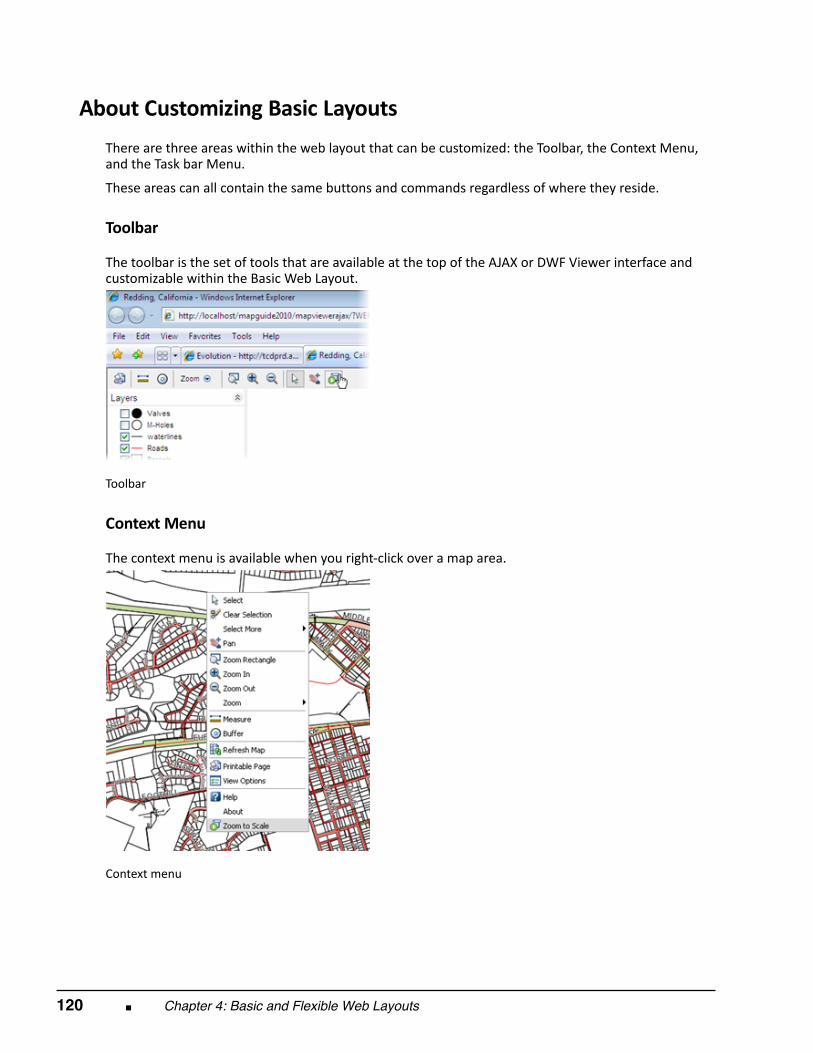
120 ■ Chapter 4: Basic and Flexible Web Layouts
About Customizing Basic Layouts
There are three areas within the web layout that can be customized: the Toolbar, the Context Menu,and the Task bar Menu.
These areas can all contain the same buttons and commands regardless of where they reside. Toolbar
The toolbar is the set of tools that are available at the top of the AJAX or DWF Viewer interface andcustomizable within the Basic Web Layout.
Toolbar Context Menu
The context menu is available when you right‐click over a map area.
Context menu
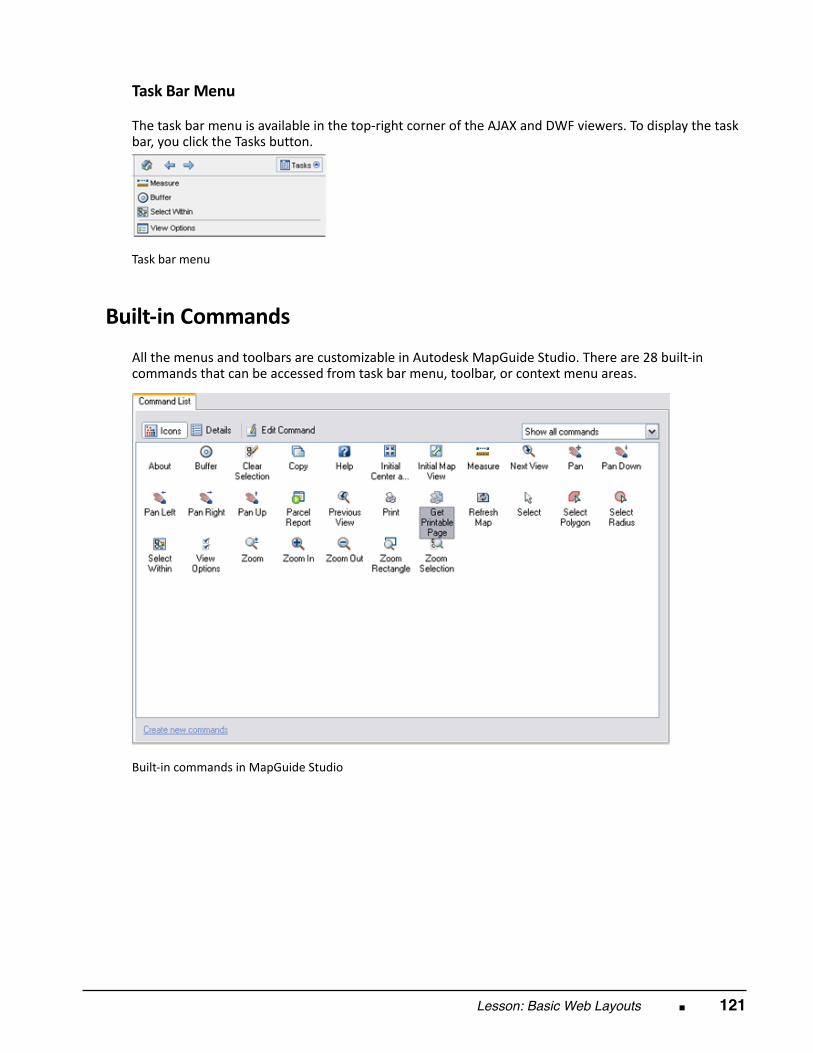
Lesson: Basic Web Layouts ■ 121
Task Bar Menu
The task bar menu is available in the top‐right corner of the AJAX and DWF viewers. To display the taskbar, you click the Tasks button.
Task bar menu
Built‐in Commands
All the menus and toolbars are customizable in Autodesk MapGuide Studio. There are 28 built‐incommands that can be accessed from task bar menu, toolbar, or context menu areas.
Built‐in commands in MapGuide Studio
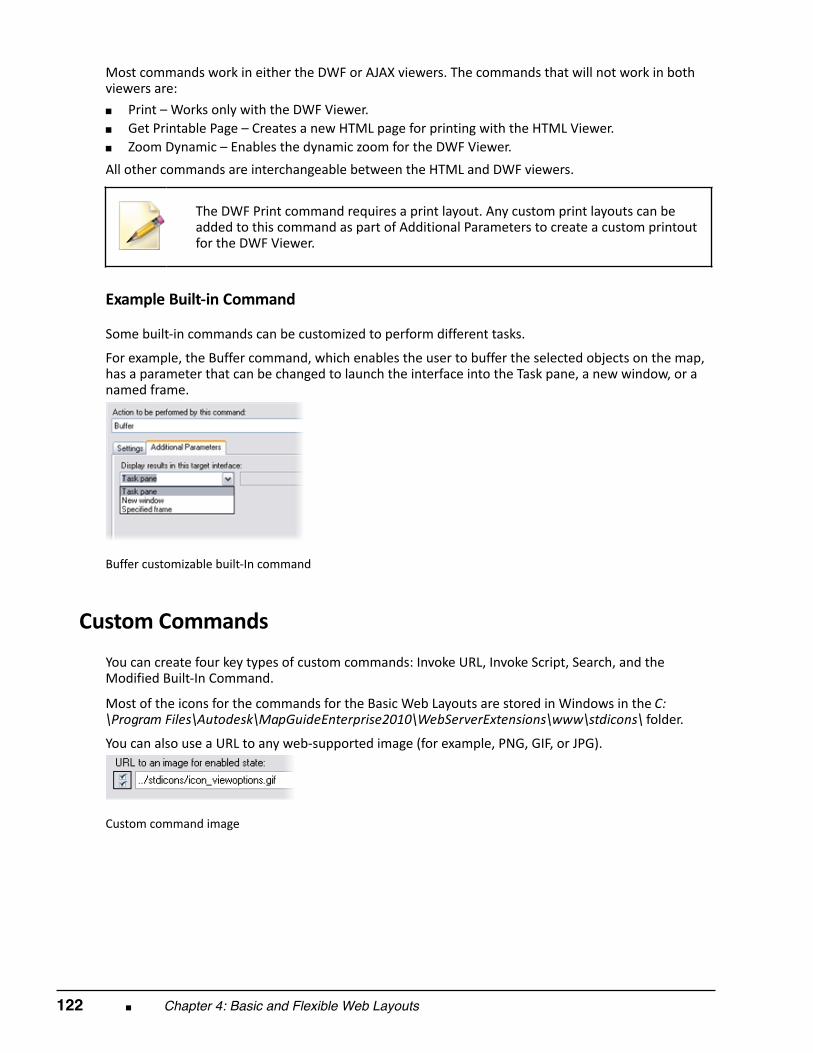
122 ■ Chapter 4: Basic and Flexible Web Layouts
Most commands work in either the DWF or AJAX viewers. The commands that will not work in bothviewers are: ■ Print – Works only with the DWF Viewer.■ Get Printable Page – Creates a new HTML page for printing with the HTML Viewer.■ Zoom Dynamic – Enables the dynamic zoom for the DWF Viewer. All other commands are interchangeable between the HTML and DWF viewers.
The DWF Print command requires a print layout. Any custom print layouts can beadded to this command as part of Additional Parameters to create a custom printoutfor the DWF Viewer.
Example Built‐in Command
Some built‐in commands can be customized to perform different tasks.
For example, the Buffer command, which enables the user to buffer the selected objects on the map,has a parameter that can be changed to launch the interface into the Task pane, a new window, or anamed frame.
Buffer customizable built‐In command
Custom Commands
You can create four key types of custom commands: Invoke URL, Invoke Script, Search, and theModified Built‐In Command. Most of the icons for the commands for the Basic Web Layouts are stored in Windows in the C:\Program Files\Autodesk\MapGuideEnterprise2010\WebServerExtensions\www\stdicons\ folder.
You can also use a URL to any web‐supported image (for example, PNG, GIF, or JPG).
Custom command image
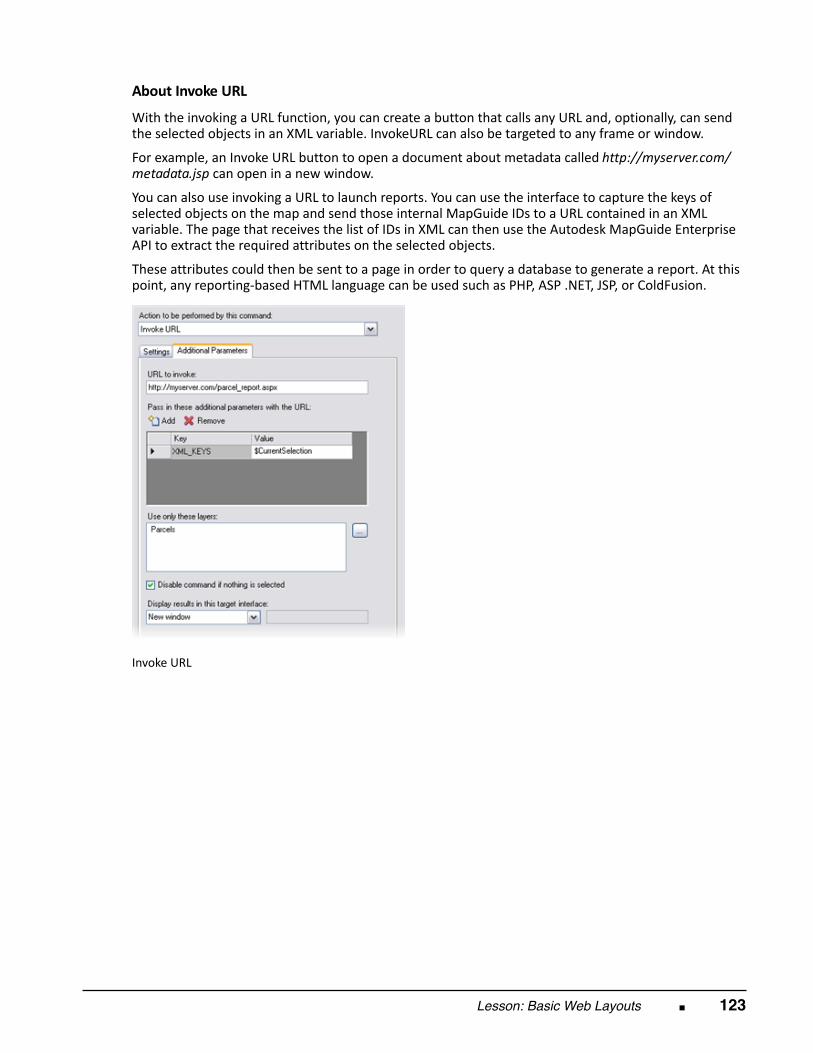
Lesson: Basic Web Layouts ■ 123
About Invoke URL With the invoking a URL function, you can create a button that calls any URL and, optionally, can sendthe selected objects in an XML variable. InvokeURL can also be targeted to any frame or window.
For example, an Invoke URL button to open a document about metadata called http://myserver.com/metadata.jsp can open in a new window.
You can also use invoking a URL to launch reports. You can use the interface to capture the keys ofselected objects on the map and send those internal MapGuide IDs to a URL contained in an XMLvariable. The page that receives the list of IDs in XML can then use the Autodesk MapGuide EnterpriseAPI to extract the required attributes on the selected objects.
These attributes could then be sent to a page in order to query a database to generate a report. At thispoint, any reporting‐based HTML language can be used such as PHP, ASP .NET, JSP, or ColdFusion.
Invoke URL
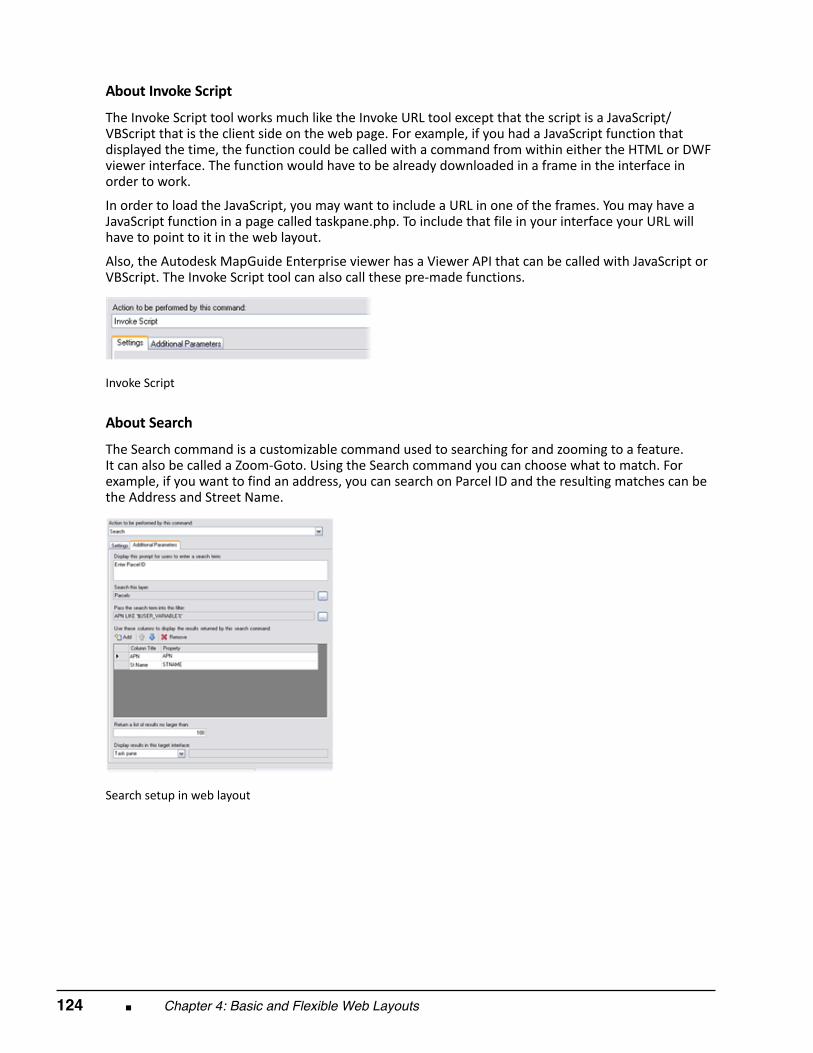
124 ■ Chapter 4: Basic and Flexible Web Layouts
About Invoke Script The Invoke Script tool works much like the Invoke URL tool except that the script is a JavaScript/VBScript that is the client side on the web page. For example, if you had a JavaScript function thatdisplayed the time, the function could be called with a command from within either the HTML or DWFviewer interface. The function would have to be already downloaded in a frame in the interface inorder to work.
In order to load the JavaScript, you may want to include a URL in one of the frames. You may have aJavaScript function in a page called taskpane.php. To include that file in your interface your URL willhave to point to it in the web layout.
Also, the Autodesk MapGuide Enterprise viewer has a Viewer API that can be called with JavaScript orVBScript. The Invoke Script tool can also call these pre‐made functions.
Invoke Script
About Search The Search command is a customizable command used to searching for and zooming to a feature.It can also be called a Zoom‐Goto. Using the Search command you can choose what to match. Forexample, if you want to find an address, you can search on Parcel ID and the resulting matches can bethe Address and Street Name.
Search setup in web layout
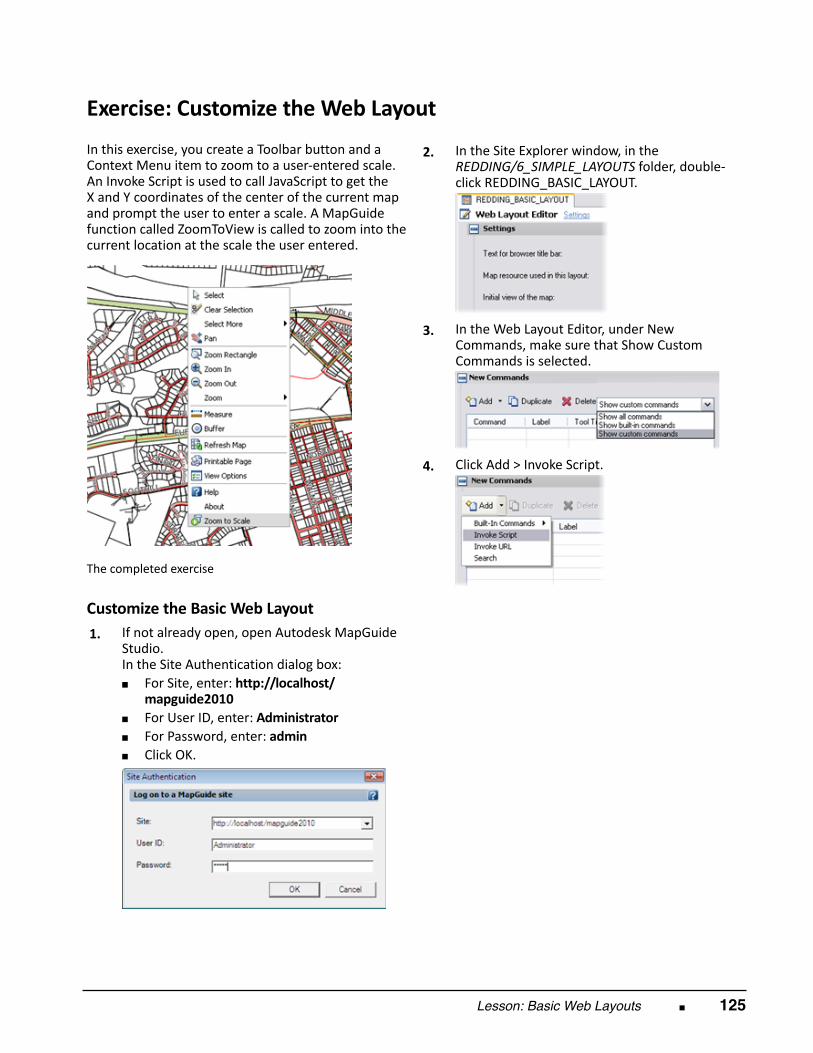
Lesson: Basic Web Layouts ■ 125
Exercise: Customize the Web Layout In this exercise, you create a Toolbar button and aContext Menu item to zoom to a user‐entered scale.An Invoke Script is used to call JavaScript to get theX and Y coordinates of the center of the current mapand prompt the user to enter a scale. A MapGuidefunction called ZoomToView is called to zoom into thecurrent location at the scale the user entered.
The completed exercise
Customize the Basic Web Layout 1.
If not already open, open Autodesk MapGuideStudio. In the Site Authentication dialog box:■ For Site, enter: http://localhost/
mapguide2010■ For User ID, enter: Administrator■ For Password, enter: admin■ Click OK.
2.
In the Site Explorer window, in theREDDING/6_SIMPLE_LAYOUTS folder, double‐click REDDING_BASIC_LAYOUT.
3.
In the Web Layout Editor, under NewCommands, make sure that Show CustomCommands is selected.
4.
Click Add > Invoke Script.
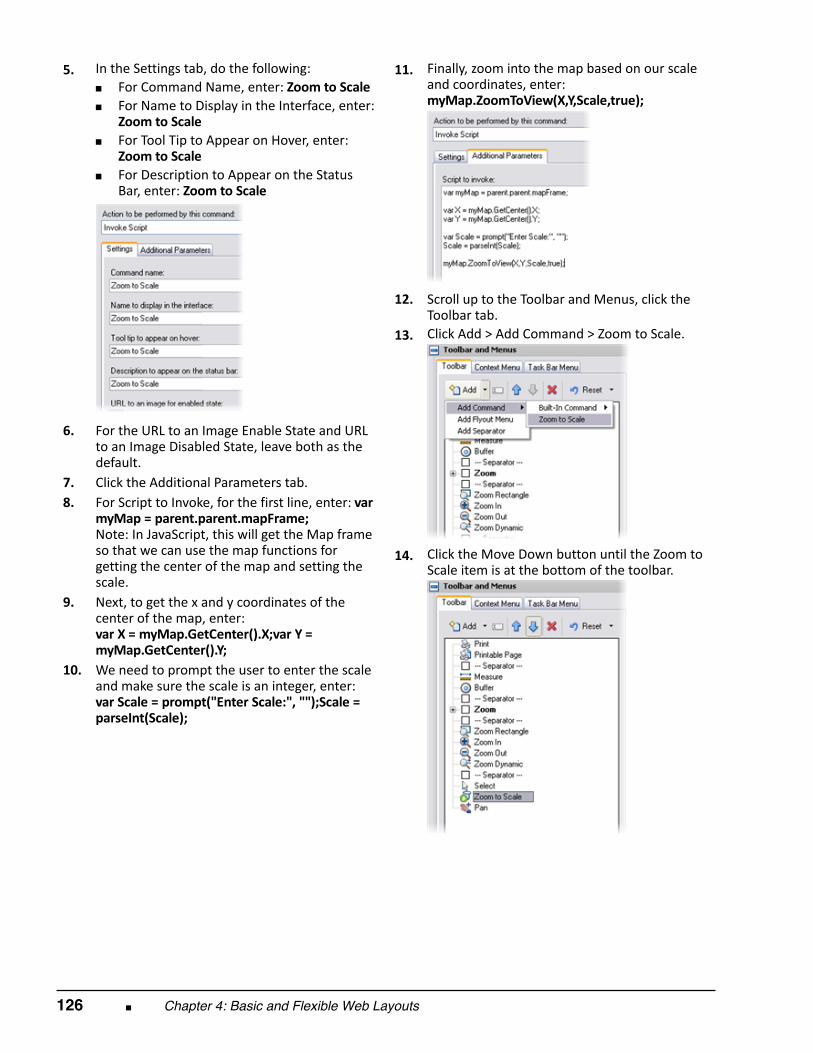
126 ■ Chapter 4: Basic and Flexible Web Layouts
5.
In the Settings tab, do the following:■ For Command Name, enter: Zoom to Scale■ For Name to Display in the Interface, enter:
Zoom to Scale■ For Tool Tip to Appear on Hover, enter:
Zoom to Scale■ For Description to Appear on the Status
Bar, enter: Zoom to Scale
6.
For the URL to an Image Enable State and URLto an Image Disabled State, leave both as thedefault.
7.
Click the Additional Parameters tab. 8.
For Script to Invoke, for the first line, enter: varmyMap = parent.parent.mapFrame; Note: In JavaScript, this will get the Map frameso that we can use the map functions forgetting the center of the map and setting thescale.
9.
Next, to get the x and y coordinates of thecenter of the map, enter: var X = myMap.GetCenter().X;var Y =myMap.GetCenter().Y;
10.
We need to prompt the user to enter the scaleand make sure the scale is an integer, enter: var Scale = prompt("Enter Scale:", "");Scale =parseInt(Scale);
11.
Finally, zoom into the map based on our scaleand coordinates, enter: myMap.ZoomToView(X,Y,Scale,true);
12.
Scroll up to the Toolbar and Menus, click theToolbar tab.
13.
Click Add > Add Command > Zoom to Scale.
14.
Click the Move Down button until the Zoom toScale item is at the bottom of the toolbar.
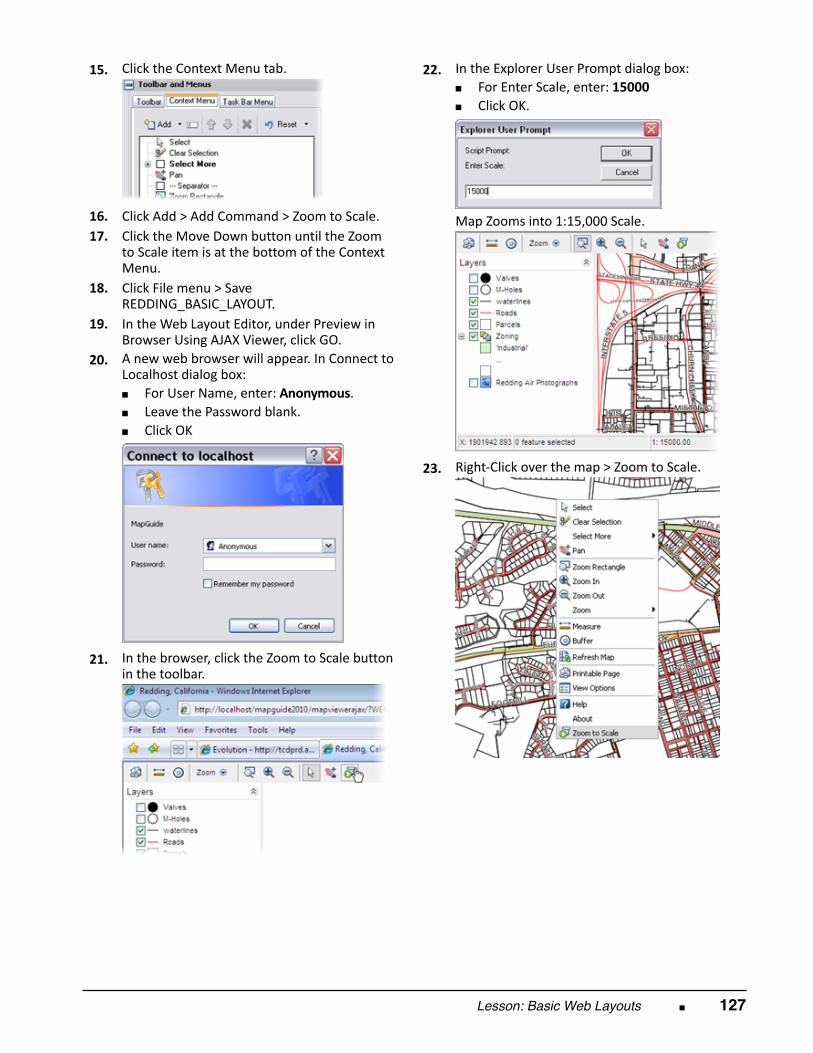
Lesson: Basic Web Layouts ■ 127
15.
Click the Context Menu tab.
16.
Click Add > Add Command > Zoom to Scale. 17.
Click the Move Down button until the Zoomto Scale item is at the bottom of the ContextMenu.
18.
Click File menu > SaveREDDING_BASIC_LAYOUT.
19.
In the Web Layout Editor, under Preview inBrowser Using AJAX Viewer, click GO.
20.
A new web browser will appear. In Connect toLocalhost dialog box:■ For User Name, enter: Anonymous.■ Leave the Password blank.■ Click OK
21.
In the browser, click the Zoom to Scale buttonin the toolbar.
22.
In the Explorer User Prompt dialog box:■ For Enter Scale, enter: 15000■ Click OK.
Map Zooms into 1:15,000 Scale.
23.
Right‐Click over the map > Zoom to Scale.
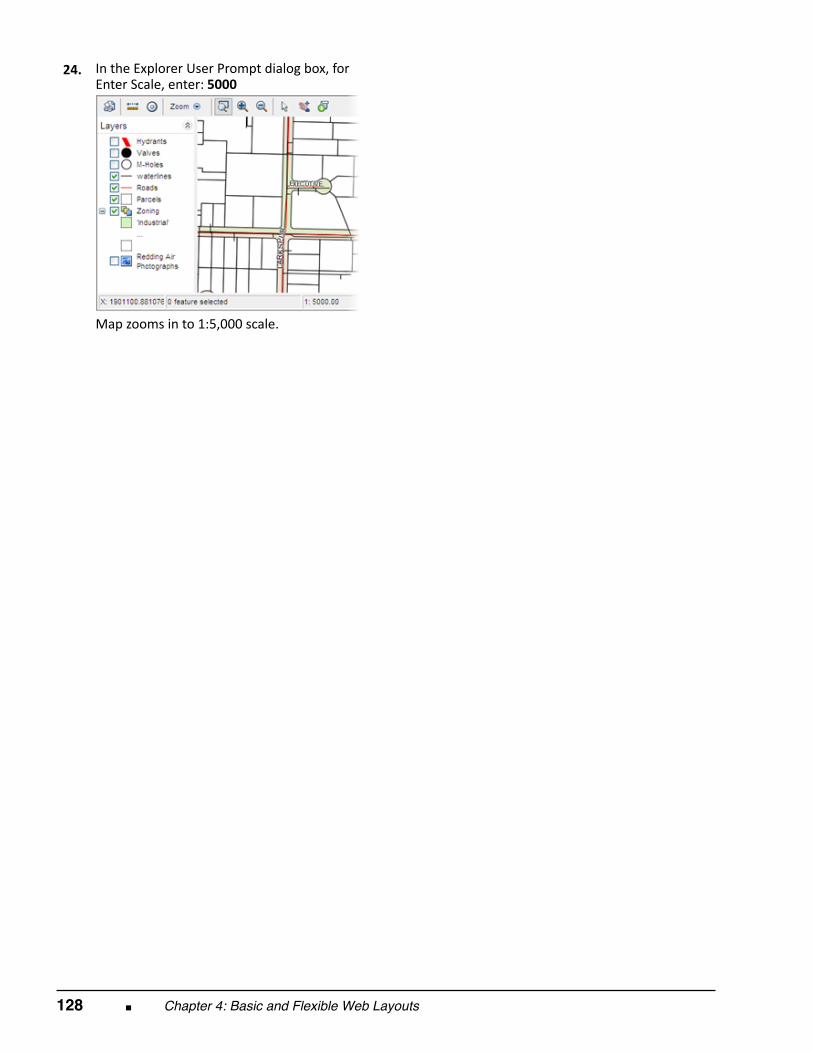
128 ■ Chapter 4: Basic and Flexible Web Layouts
24.
In the Explorer User Prompt dialog box, forEnter Scale, enter: 5000
Map zooms in to 1:5,000 scale.
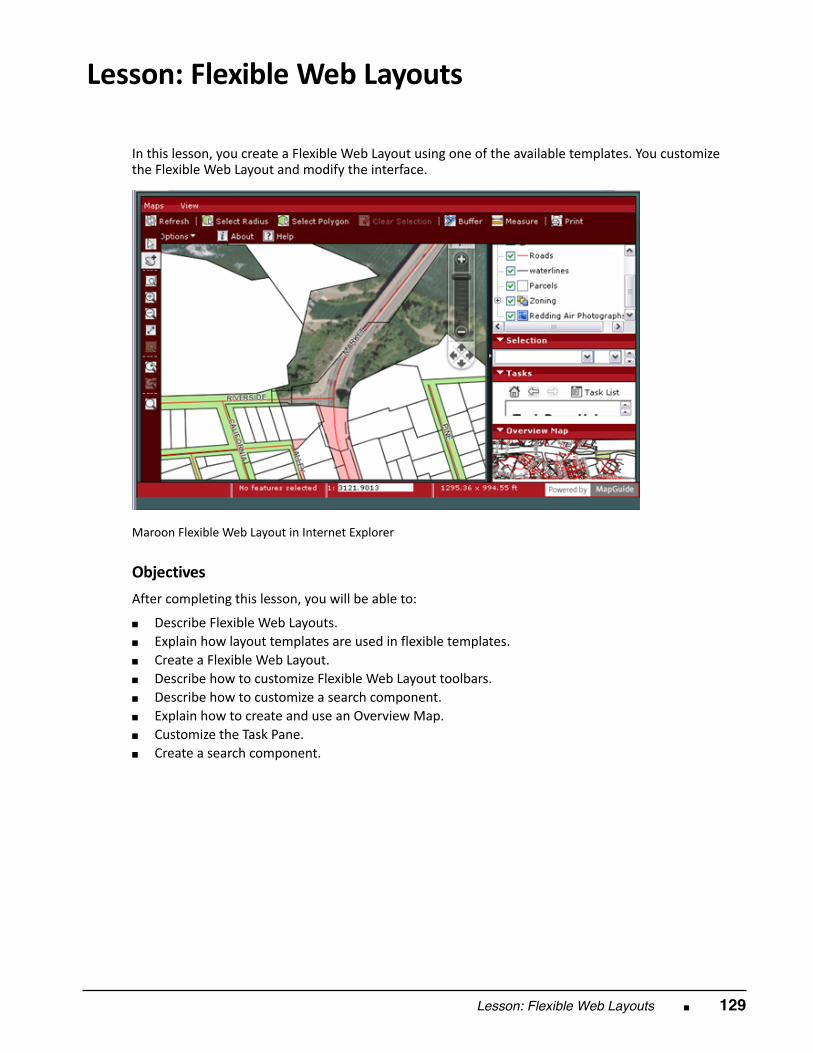
Lesson: Flexible Web Layouts ■ 129
Lesson: Flexible Web Layouts
In this lesson, you create a Flexible Web Layout using one of the available templates. You customizethe Flexible Web Layout and modify the interface.
Maroon Flexible Web Layout in Internet Explorer
Objectives After completing this lesson, you will be able to:
■ Describe Flexible Web Layouts.■ Explain how layout templates are used in flexible templates.■ Create a Flexible Web Layout.■ Describe how to customize Flexible Web Layout toolbars.■ Describe how to customize a search component.■ Explain how to create and use an Overview Map.■ Customize the Task Pane.■ Create a search component.
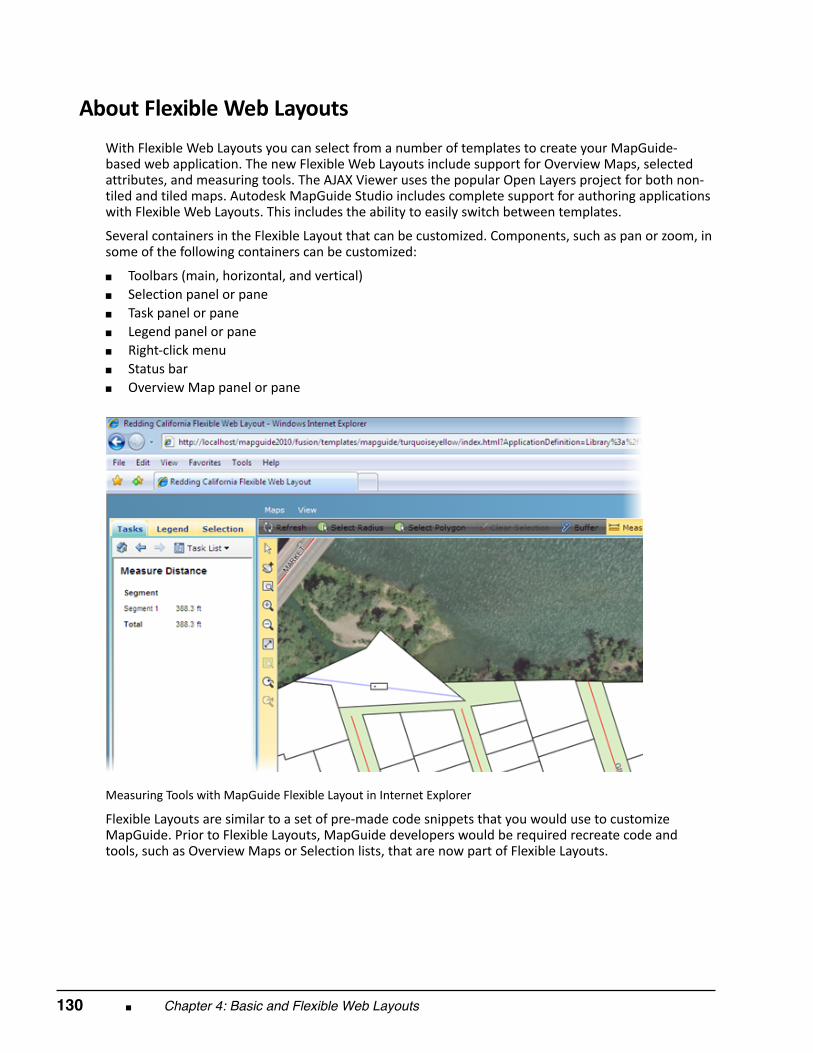
130 ■ Chapter 4: Basic and Flexible Web Layouts
About Flexible Web Layouts
With Flexible Web Layouts you can select from a number of templates to create your MapGuide‐based web application. The new Flexible Web Layouts include support for Overview Maps, selectedattributes, and measuring tools. The AJAX Viewer uses the popular Open Layers project for both non‐tiled and tiled maps. Autodesk MapGuide Studio includes complete support for authoring applicationswith Flexible Web Layouts. This includes the ability to easily switch between templates. Several containers in the Flexible Layout that can be customized. Components, such as pan or zoom, insome of the following containers can be customized:
■ Toolbars (main, horizontal, and vertical)■ Selection panel or pane■ Task panel or pane■ Legend panel or pane■ Right‐click menu■ Status bar■ Overview Map panel or pane
Measuring Tools with MapGuide Flexible Layout in Internet Explorer Flexible Layouts are similar to a set of pre‐made code snippets that you would use to customizeMapGuide. Prior to Flexible Layouts, MapGuide developers would be required recreate code andtools, such as Overview Maps or Selection lists, that are now part of Flexible Layouts.
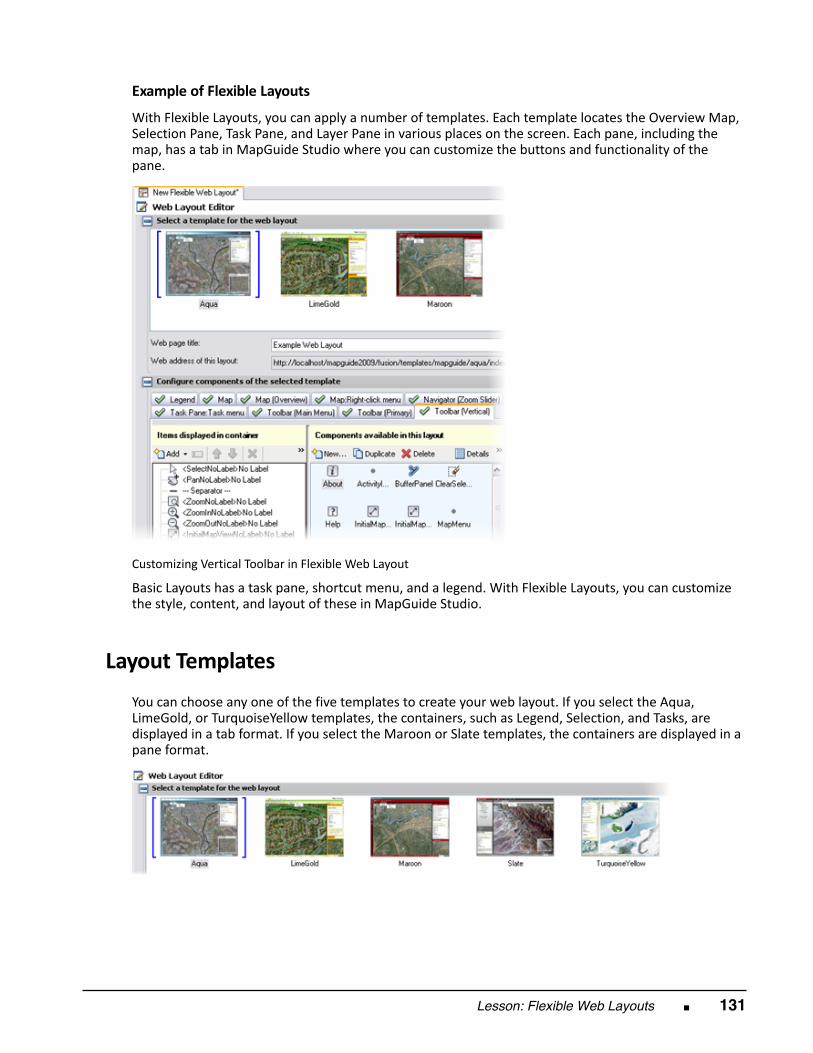
Lesson: Flexible Web Layouts ■ 131
Example of Flexible Layouts With Flexible Layouts, you can apply a number of templates. Each template locates the Overview Map,Selection Pane, Task Pane, and Layer Pane in various places on the screen. Each pane, including themap, has a tab in MapGuide Studio where you can customize the buttons and functionality of thepane.
Customizing Vertical Toolbar in Flexible Web Layout Basic Layouts has a task pane, shortcut menu, and a legend. With Flexible Layouts, you can customizethe style, content, and layout of these in MapGuide Studio.
Layout Templates
You can choose any one of the five templates to create your web layout. If you select the Aqua,LimeGold, or TurquoiseYellow templates, the containers, such as Legend, Selection, and Tasks, aredisplayed in a tab format. If you select the Maroon or Slate templates, the containers are displayed in apane format.
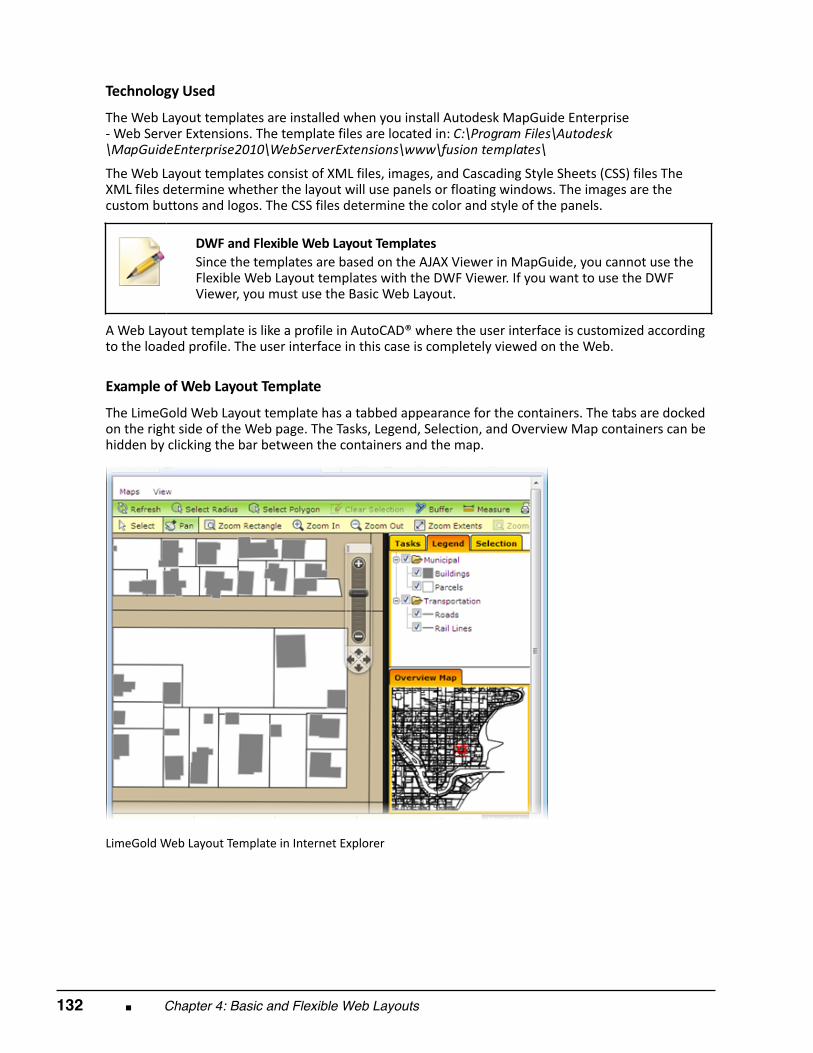
132 ■ Chapter 4: Basic and Flexible Web Layouts
Technology Used The Web Layout templates are installed when you install Autodesk MapGuide Enterprise‐ Web Server Extensions. The template files are located in: C:\Program Files\Autodesk\MapGuideEnterprise2010\WebServerExtensions\www\fusion templates\
The Web Layout templates consist of XML files, images, and Cascading Style Sheets (CSS) files TheXML files determine whether the layout will use panels or floating windows. The images are thecustom buttons and logos. The CSS files determine the color and style of the panels.
DWF and Flexible Web Layout Templates Since the templates are based on the AJAX Viewer in MapGuide, you cannot use theFlexible Web Layout templates with the DWF Viewer. If you want to use the DWFViewer, you must use the Basic Web Layout.
A Web Layout template is like a profile in AutoCAD® where the user interface is customized accordingto the loaded profile. The user interface in this case is completely viewed on the Web.
Example of Web Layout Template The LimeGold Web Layout template has a tabbed appearance for the containers. The tabs are dockedon the right side of the Web page. The Tasks, Legend, Selection, and Overview Map containers can behidden by clicking the bar between the containers and the map.
LimeGold Web Layout Template in Internet Explorer
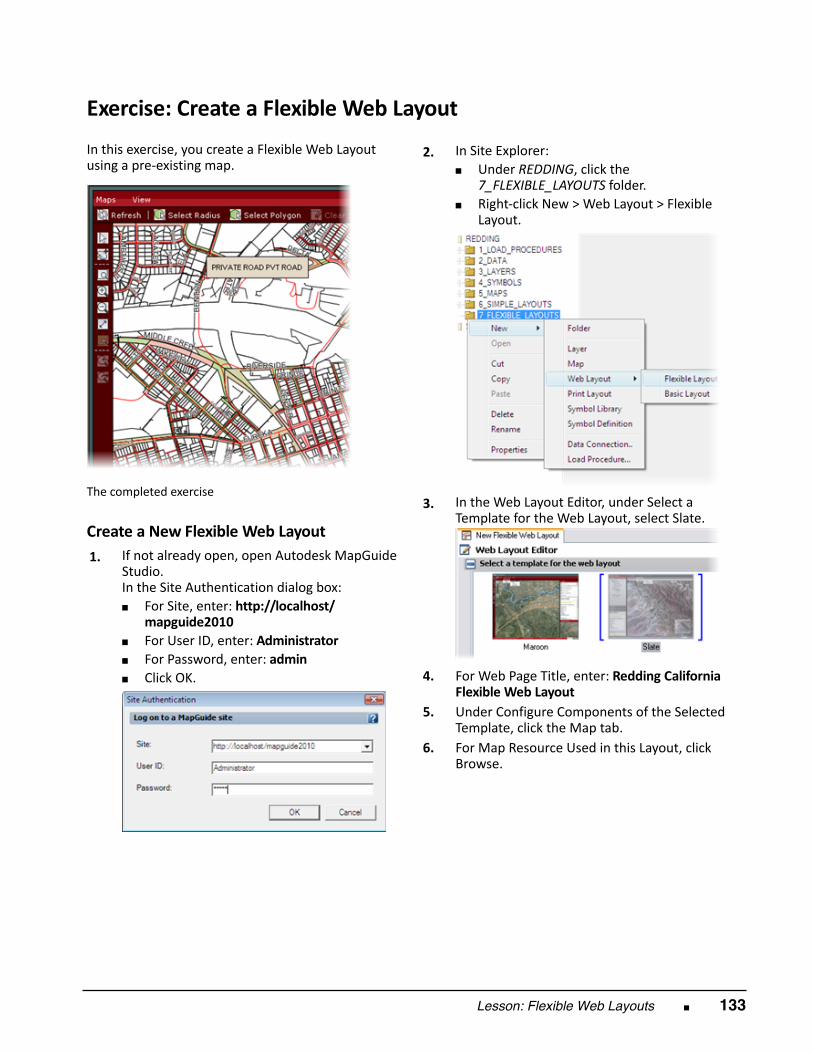
Lesson: Flexible Web Layouts ■ 133
Exercise: Create a Flexible Web Layout In this exercise, you create a Flexible Web Layoutusing a pre‐existing map.
The completed exercise
Create a New Flexible Web Layout 1.
If not already open, open Autodesk MapGuideStudio. In the Site Authentication dialog box:■ For Site, enter: http://localhost/
mapguide2010■ For User ID, enter: Administrator■ For Password, enter: admin■ Click OK.
2.
In Site Explorer:■ Under REDDING, click the
7_FLEXIBLE_LAYOUTS folder.■ Right‐click New > Web Layout > Flexible
Layout.
3.
In the Web Layout Editor, under Select aTemplate for the Web Layout, select Slate.
4.
For Web Page Title, enter: Redding CaliforniaFlexible Web Layout
5.
Under Configure Components of the SelectedTemplate, click the Map tab.
6.
For Map Resource Used in this Layout, clickBrowse.
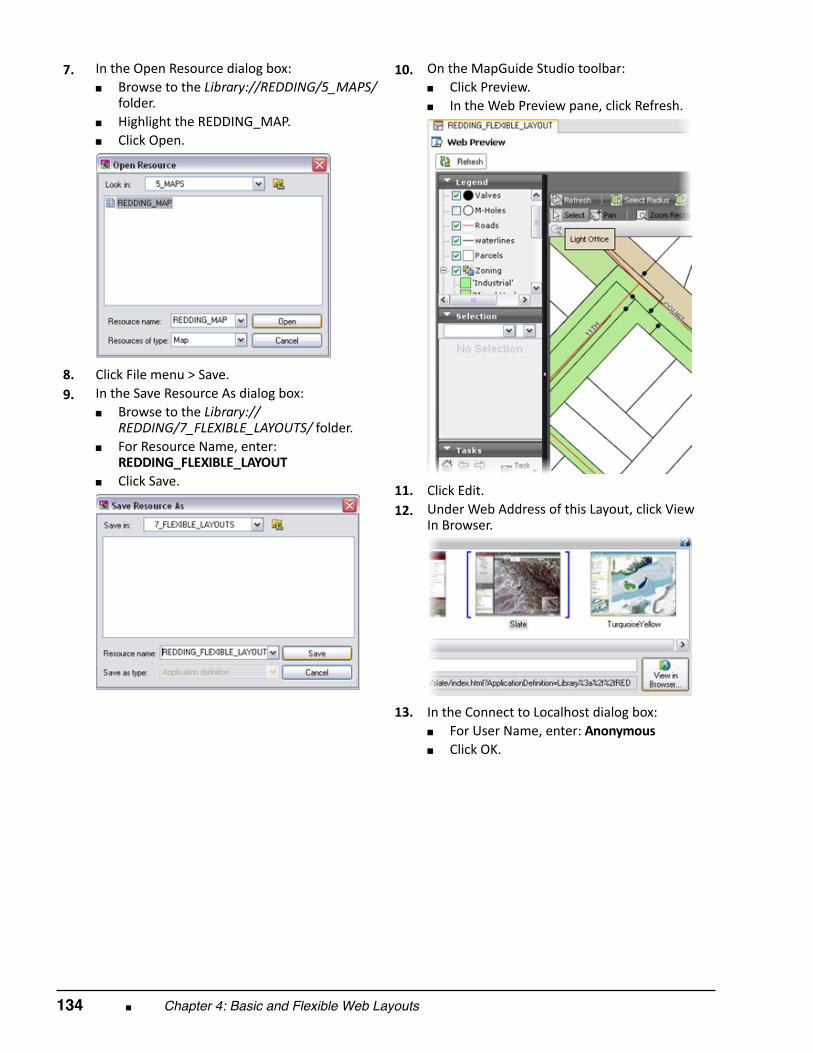
134 ■ Chapter 4: Basic and Flexible Web Layouts
7.
In the Open Resource dialog box:■ Browse to the Library://REDDING/5_MAPS/
folder.■ Highlight the REDDING_MAP.■ Click Open.
8.
Click File menu > Save. 9.
In the Save Resource As dialog box:■ Browse to the Library://
REDDING/7_FLEXIBLE_LAYOUTS/ folder.■ For Resource Name, enter:
REDDING_FLEXIBLE_LAYOUT■ Click Save.
10.
On the MapGuide Studio toolbar:■ Click Preview.■ In the Web Preview pane, click Refresh.
11.
Click Edit. 12.
Under Web Address of this Layout, click ViewIn Browser.
13.
In the Connect to Localhost dialog box:■ For User Name, enter: Anonymous■ Click OK.
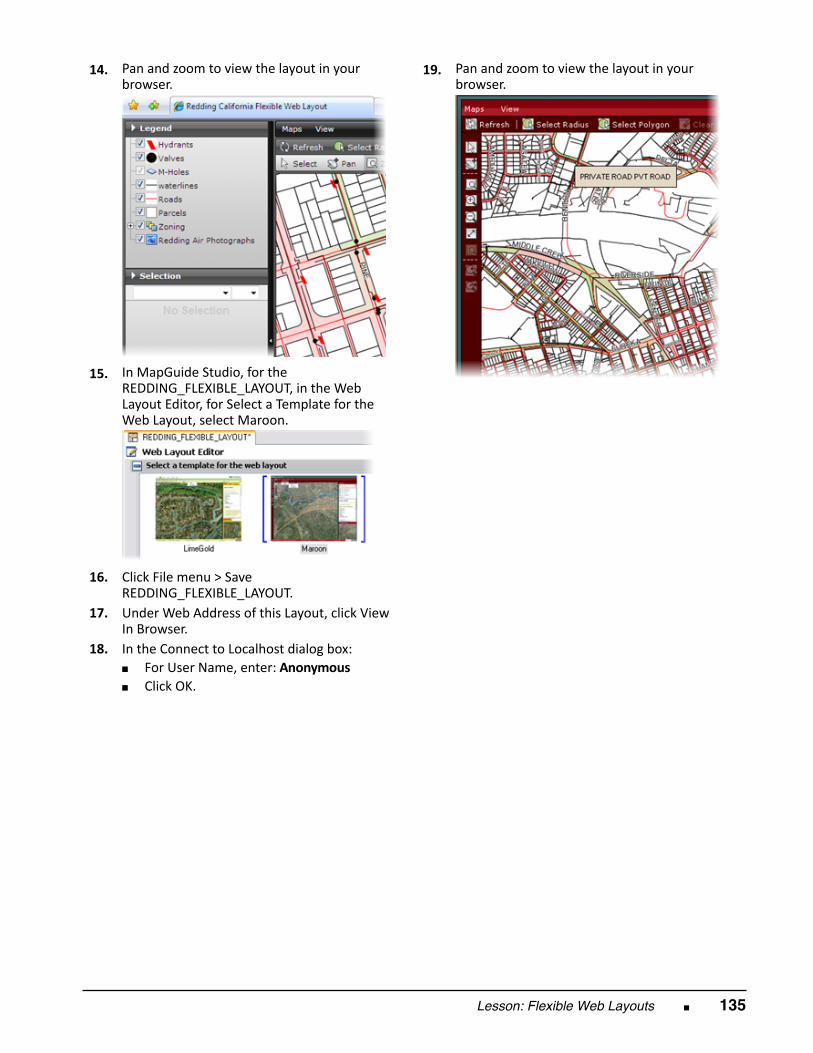
Lesson: Flexible Web Layouts ■ 135
14.
Pan and zoom to view the layout in yourbrowser.
15.
In MapGuide Studio, for theREDDING_FLEXIBLE_LAYOUT, in the WebLayout Editor, for Select a Template for theWeb Layout, select Maroon.
16.
Click File menu > SaveREDDING_FLEXIBLE_LAYOUT.
17.
Under Web Address of this Layout, click ViewIn Browser.
18.
In the Connect to Localhost dialog box:■ For User Name, enter: Anonymous■ Click OK.
19.
Pan and zoom to view the layout in yourbrowser.
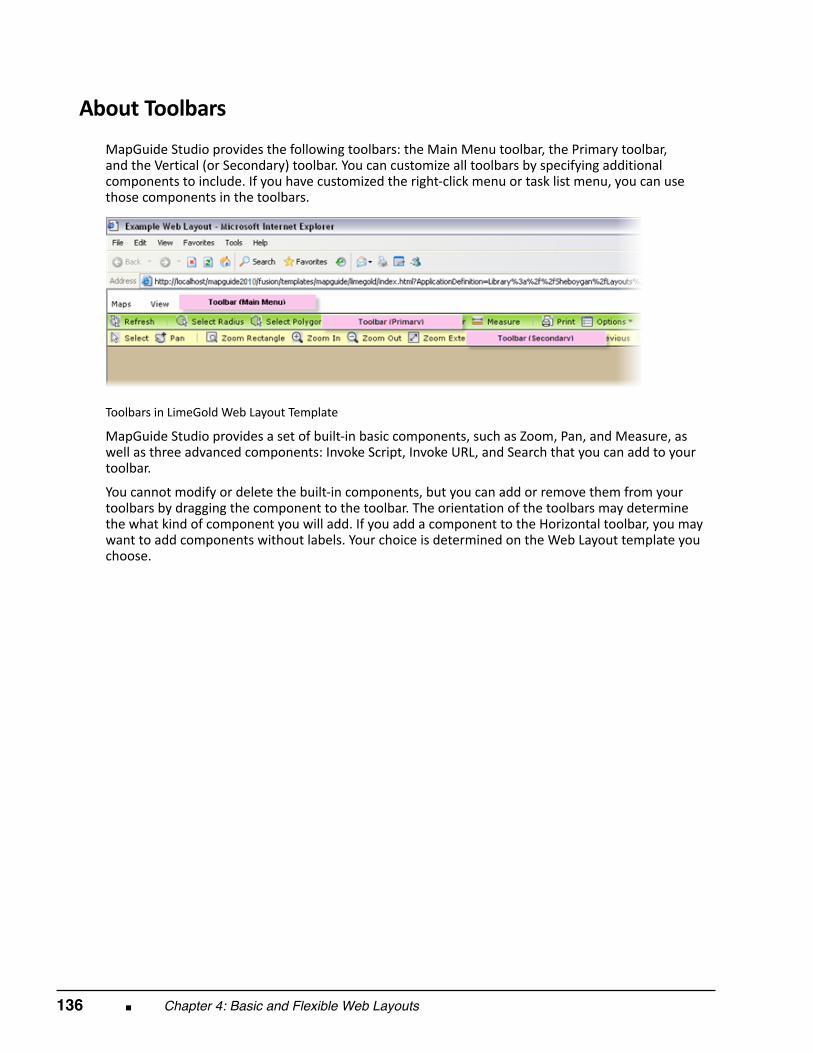
136 ■ Chapter 4: Basic and Flexible Web Layouts
About Toolbars
MapGuide Studio provides the following toolbars: the Main Menu toolbar, the Primary toolbar,and the Vertical (or Secondary) toolbar. You can customize all toolbars by specifying additionalcomponents to include. If you have customized the right‐click menu or task list menu, you can usethose components in the toolbars.
Toolbars in LimeGold Web Layout Template MapGuide Studio provides a set of built‐in basic components, such as Zoom, Pan, and Measure, aswell as three advanced components: Invoke Script, Invoke URL, and Search that you can add to yourtoolbar.
You cannot modify or delete the built‐in components, but you can add or remove them from yourtoolbars by dragging the component to the toolbar. The orientation of the toolbars may determinethe what kind of component you will add. If you add a component to the Horizontal toolbar, you maywant to add components without labels. Your choice is determined on the Web Layout template youchoose.
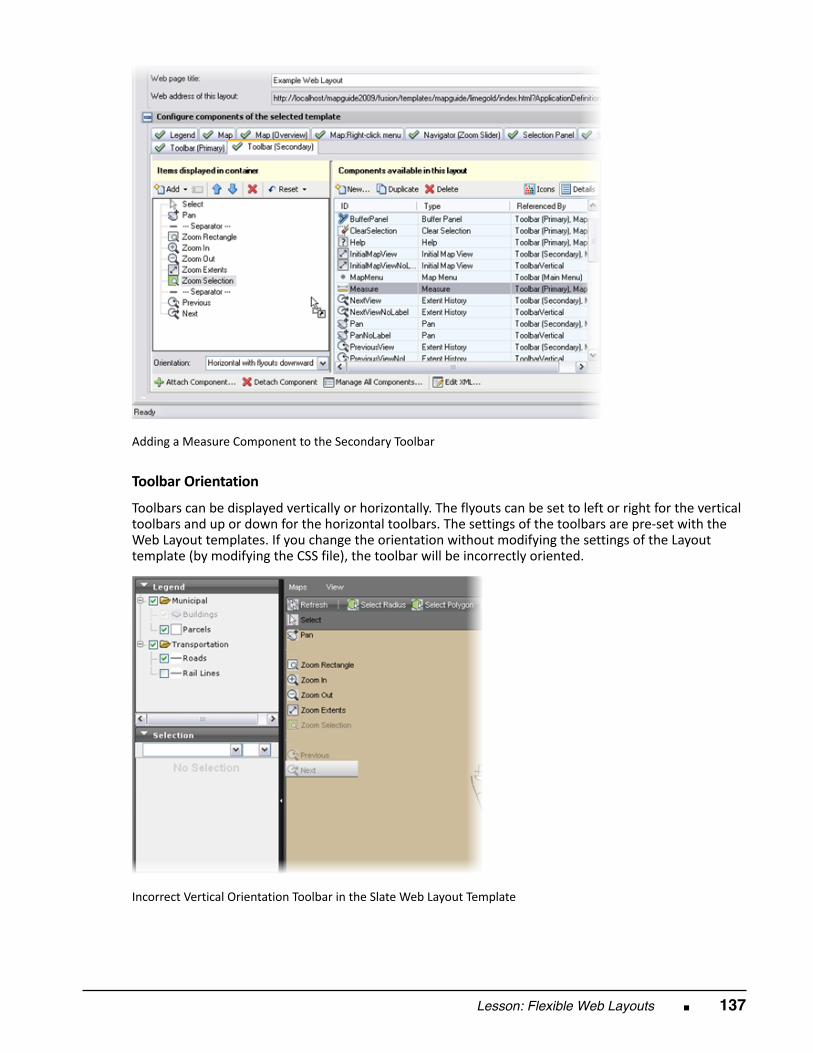
Lesson: Flexible Web Layouts ■ 137
Adding a Measure Component to the Secondary Toolbar
Toolbar Orientation Toolbars can be displayed vertically or horizontally. The flyouts can be set to left or right for the verticaltoolbars and up or down for the horizontal toolbars. The settings of the toolbars are pre‐set with theWeb Layout templates. If you change the orientation without modifying the settings of the Layouttemplate (by modifying the CSS file), the toolbar will be incorrectly oriented.
Incorrect Vertical Orientation Toolbar in the Slate Web Layout Template
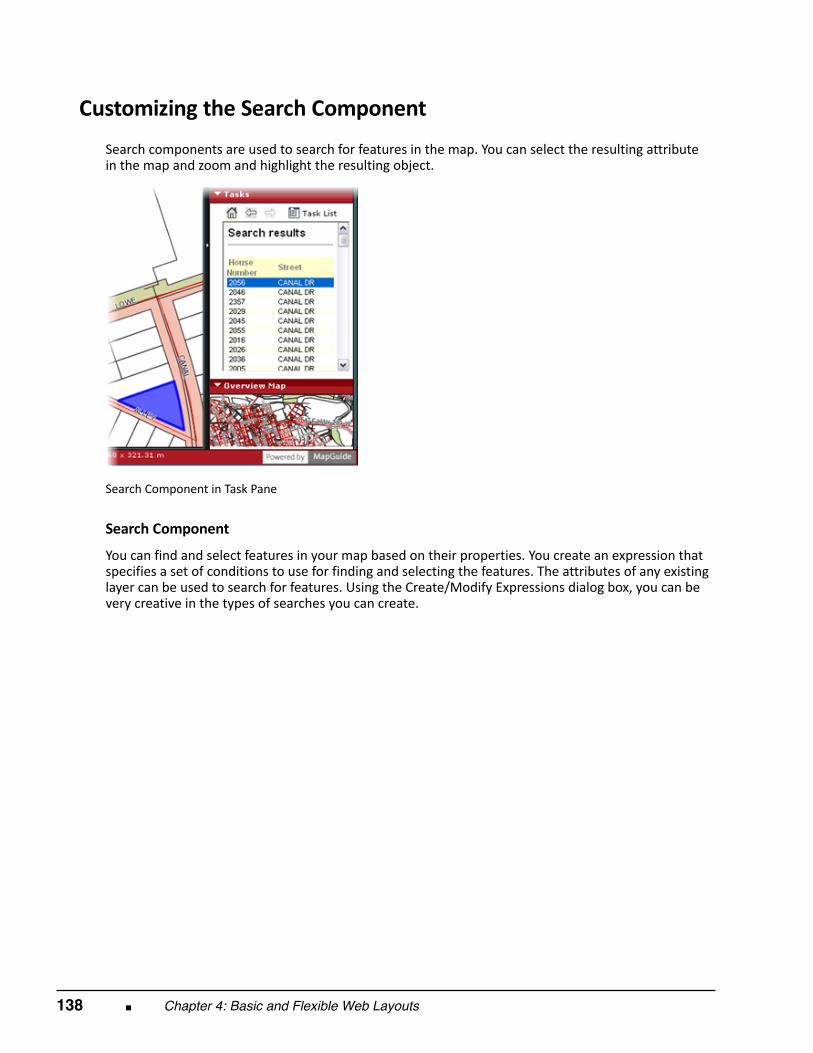
138 ■ Chapter 4: Basic and Flexible Web Layouts
Customizing the Search Component
Search components are used to search for features in the map. You can select the resulting attributein the map and zoom and highlight the resulting object.
Search Component in Task Pane
Search Component You can find and select features in your map based on their properties. You create an expression thatspecifies a set of conditions to use for finding and selecting the features. The attributes of any existinglayer can be used to search for features. Using the Create/Modify Expressions dialog box, you can bevery creative in the types of searches you can create.

Lesson: Flexible Web Layouts ■ 139
Process: Creating Search Components
Search components are used to find a geographic feature on a map by searching by some attribute ofthe feature.
1.
Make sure that the layer you are going touse to search is available in the map.
2.
Within the Flexible Web Layout, choose atoolbar, task menu, or right‐click menu tocustomize.
3.
Add a new component that will be availableto use in the container.
4.
Change the label and tooltip names of thenew search component.
5.
Build the search based on the propertiesof the layer that is being selected. Use thepercent sign (%) as a wild card.
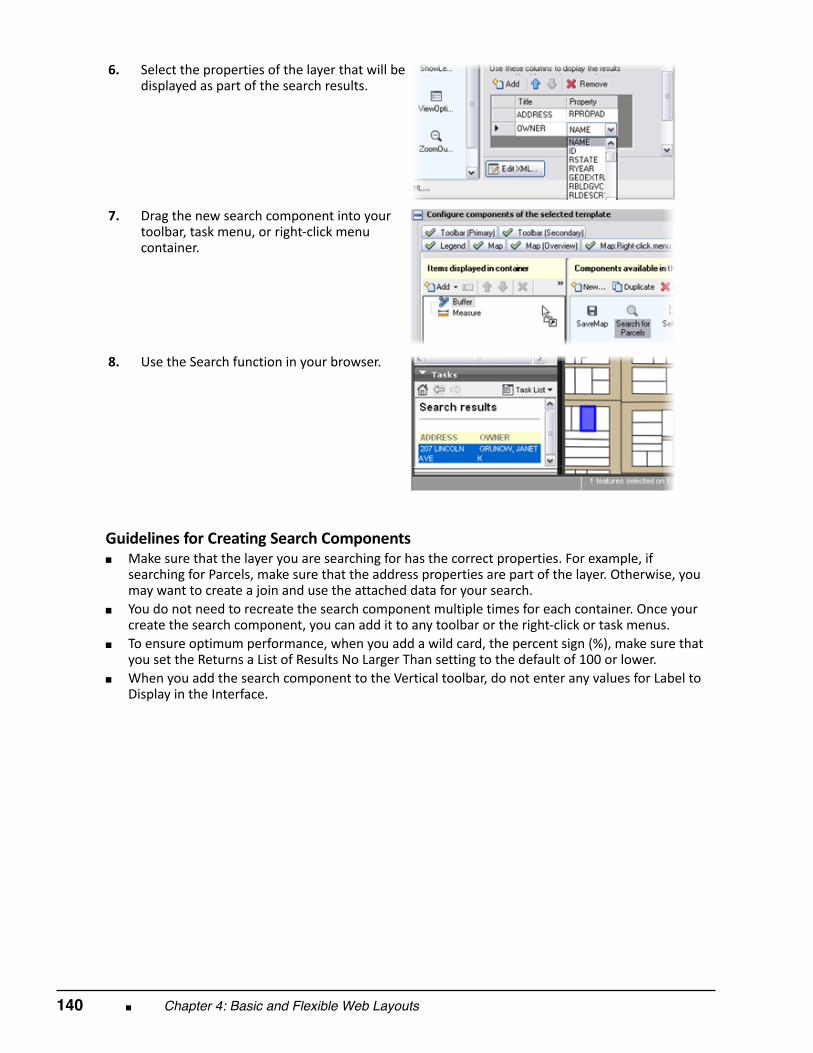
140 ■ Chapter 4: Basic and Flexible Web Layouts
6.
Select the properties of the layer that will bedisplayed as part of the search results.
7.
Drag the new search component into yourtoolbar, task menu, or right‐click menucontainer.
8.
Use the Search function in your browser.
Guidelines for Creating Search Components■ Make sure that the layer you are searching for has the correct properties. For example, if
searching for Parcels, make sure that the address properties are part of the layer. Otherwise, youmay want to create a join and use the attached data for your search.
■ You do not need to recreate the search component multiple times for each container. Once yourcreate the search component, you can add it to any toolbar or the right‐click or task menus.
■ To ensure optimum performance, when you add a wild card, the percent sign (%), make sure thatyou set the Returns a List of Results No Larger Than setting to the default of 100 or lower.
■ When you add the search component to the Vertical toolbar, do not enter any values for Label toDisplay in the Interface.
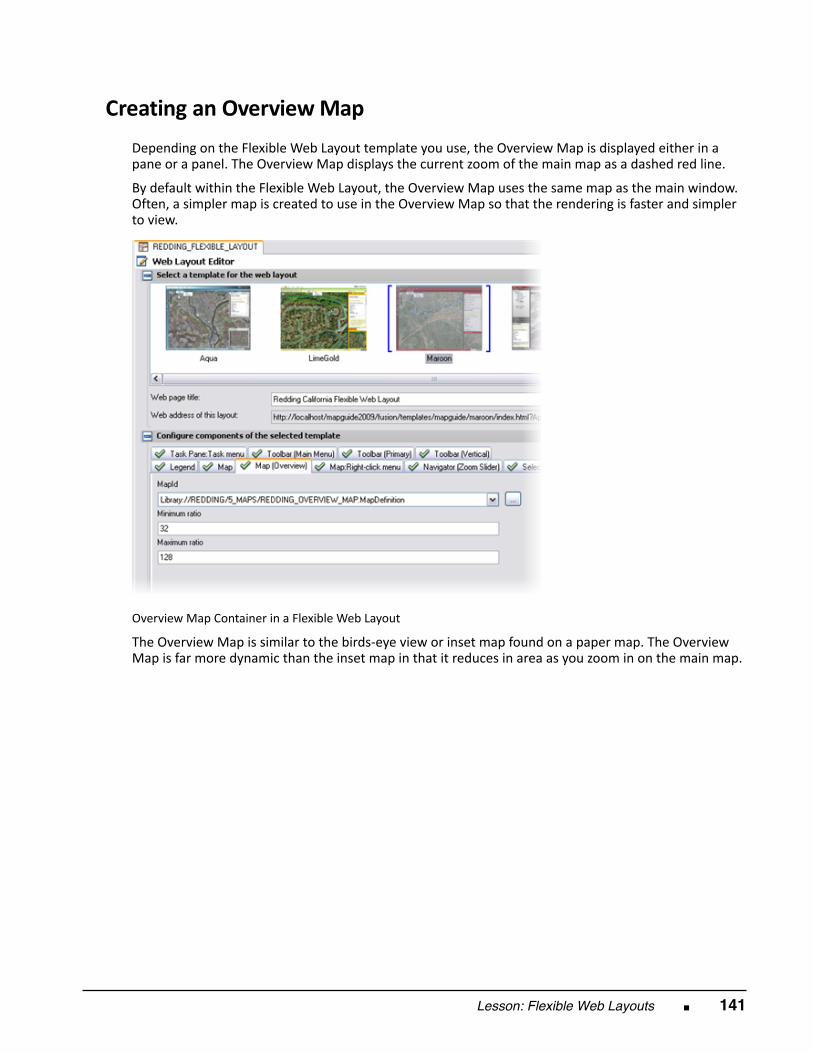
Lesson: Flexible Web Layouts ■ 141
Creating an Overview Map
Depending on the Flexible Web Layout template you use, the Overview Map is displayed either in apane or a panel. The Overview Map displays the current zoom of the main map as a dashed red line.
By default within the Flexible Web Layout, the Overview Map uses the same map as the main window.Often, a simpler map is created to use in the Overview Map so that the rendering is faster and simplerto view.
Overview Map Container in a Flexible Web Layout The Overview Map is similar to the birds‐eye view or inset map found on a paper map. The OverviewMap is far more dynamic than the inset map in that it reduces in area as you zoom in on the main map.
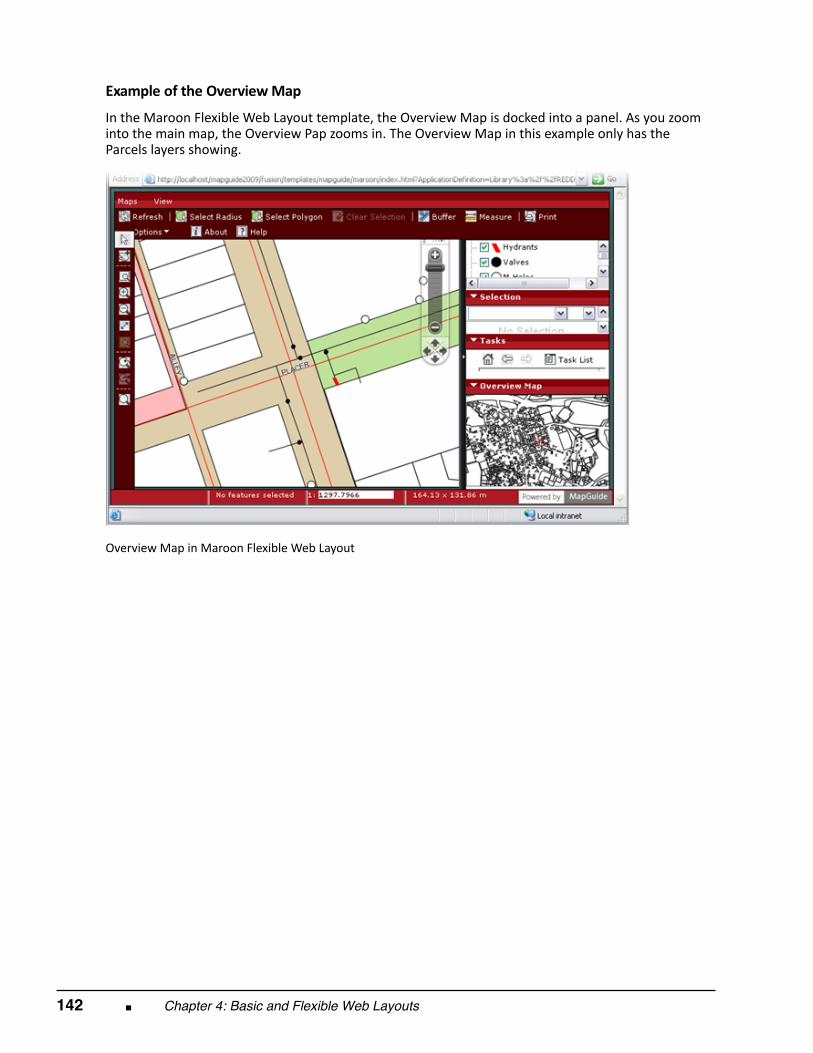
142 ■ Chapter 4: Basic and Flexible Web Layouts
Example of the Overview Map In the Maroon Flexible Web Layout template, the Overview Map is docked into a panel. As you zoominto the main map, the Overview Pap zooms in. The Overview Map in this example only has theParcels layers showing.
Overview Map in Maroon Flexible Web Layout
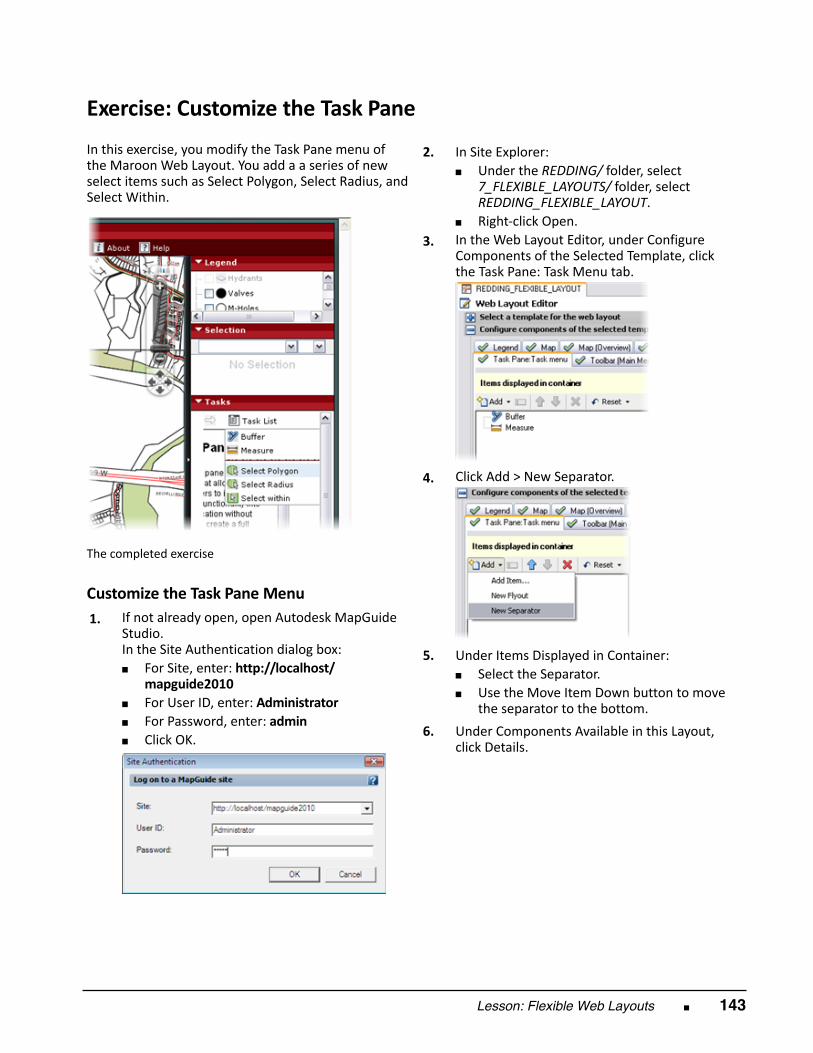
Lesson: Flexible Web Layouts ■ 143
Exercise: Customize the Task Pane In this exercise, you modify the Task Pane menu ofthe Maroon Web Layout. You add a a series of newselect items such as Select Polygon, Select Radius, andSelect Within.
The completed exercise
Customize the Task Pane Menu 1.
If not already open, open Autodesk MapGuideStudio. In the Site Authentication dialog box:■ For Site, enter: http://localhost/
mapguide2010■ For User ID, enter: Administrator■ For Password, enter: admin■ Click OK.
2.
In Site Explorer:■ Under the REDDING/ folder, select
7_FLEXIBLE_LAYOUTS/ folder, selectREDDING_FLEXIBLE_LAYOUT.
■ Right‐click Open. 3.
In the Web Layout Editor, under ConfigureComponents of the Selected Template, clickthe Task Pane: Task Menu tab.
4.
Click Add > New Separator.
5.
Under Items Displayed in Container:■ Select the Separator.■ Use the Move Item Down button to move
the separator to the bottom.
6. Under Components Available in this Layout,click Details.
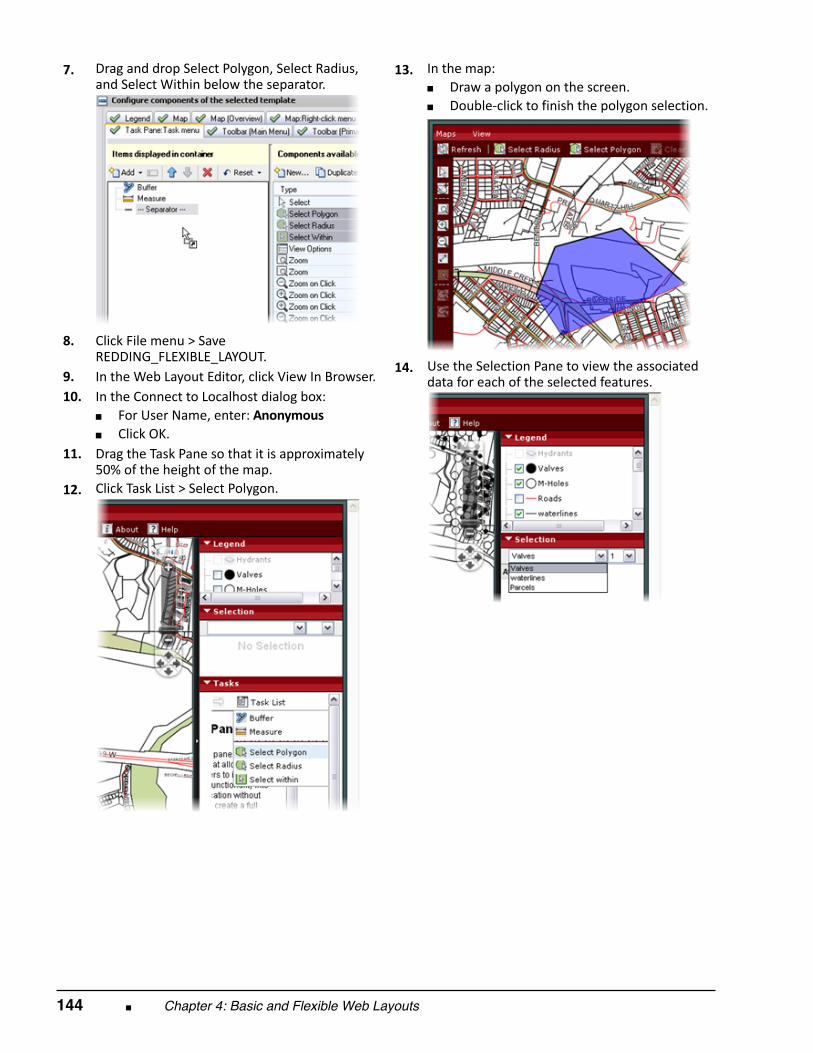
144 ■ Chapter 4: Basic and Flexible Web Layouts
7.
Drag and drop Select Polygon, Select Radius,and Select Within below the separator.
8.
Click File menu > SaveREDDING_FLEXIBLE_LAYOUT.
9.
In the Web Layout Editor, click View In Browser. 10.
In the Connect to Localhost dialog box:■ For User Name, enter: Anonymous■ Click OK.
11.
Drag the Task Pane so that it is approximately50% of the height of the map.
12.
Click Task List > Select Polygon.
13.
In the map:■ Draw a polygon on the screen.■ Double‐click to finish the polygon selection.
14.
Use the Selection Pane to view the associateddata for each of the selected features.
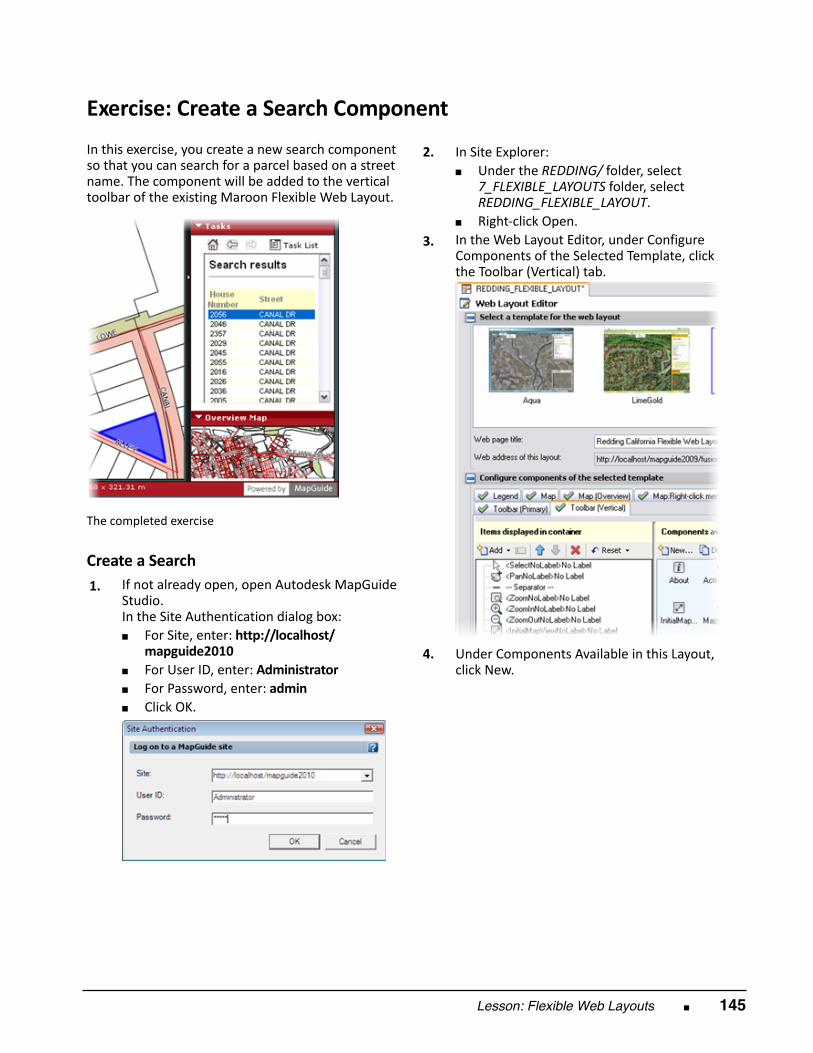
Lesson: Flexible Web Layouts ■ 145
Exercise: Create a Search Component In this exercise, you create a new search componentso that you can search for a parcel based on a streetname. The component will be added to the verticaltoolbar of the existing Maroon Flexible Web Layout.
The completed exercise
Create a Search 1.
If not already open, open Autodesk MapGuideStudio. In the Site Authentication dialog box:■ For Site, enter: http://localhost/
mapguide2010■ For User ID, enter: Administrator■ For Password, enter: admin■ Click OK.
2.
In Site Explorer:■ Under the REDDING/ folder, select
7_FLEXIBLE_LAYOUTS folder, selectREDDING_FLEXIBLE_LAYOUT.
■ Right‐click Open. 3.
In the Web Layout Editor, under ConfigureComponents of the Selected Template, clickthe Toolbar (Vertical) tab.
4.
Under Components Available in this Layout,click New.
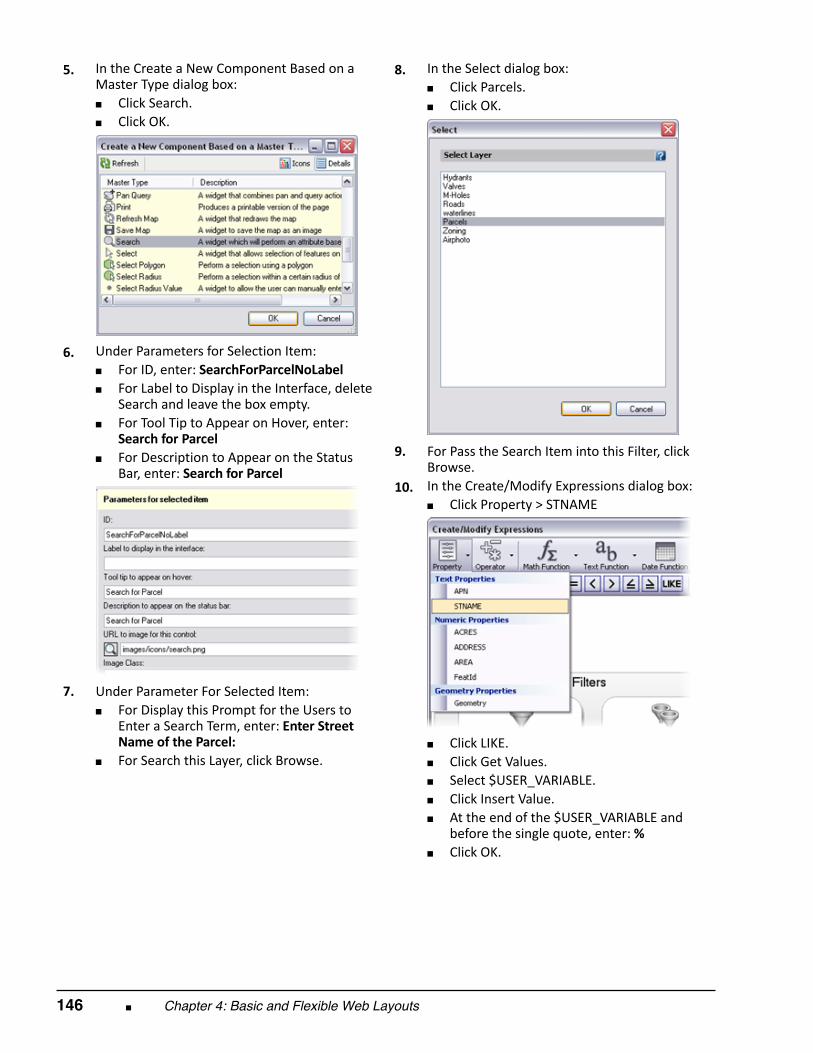
146 ■ Chapter 4: Basic and Flexible Web Layouts
5.
In the Create a New Component Based on aMaster Type dialog box:■ Click Search.■ Click OK.
6.
Under Parameters for Selection Item:■ For ID, enter: SearchForParcelNoLabel■ For Label to Display in the Interface, delete
Search and leave the box empty.■ For Tool Tip to Appear on Hover, enter:
Search for Parcel■ For Description to Appear on the Status
Bar, enter: Search for Parcel
7.
Under Parameter For Selected Item:■ For Display this Prompt for the Users to
Enter a Search Term, enter: Enter StreetName of the Parcel:
■ For Search this Layer, click Browse.
8.
In the Select dialog box:■ Click Parcels.■ Click OK.
9.
For Pass the Search Item into this Filter, clickBrowse.
10.
In the Create/Modify Expressions dialog box:■ Click Property > STNAME
■ Click LIKE.■ Click Get Values.■ Select $USER_VARIABLE.■ Click Insert Value.■ At the end of the $USER_VARIABLE and
before the single quote, enter: %■ Click OK.
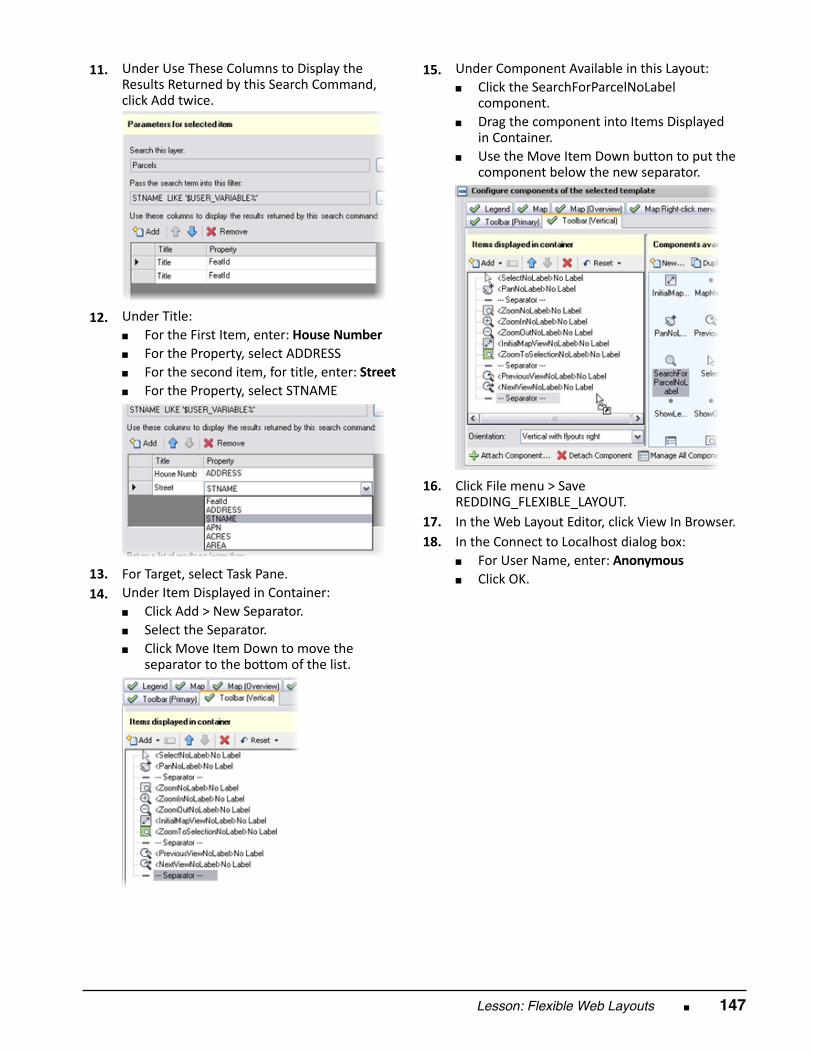
Lesson: Flexible Web Layouts ■ 147
11.
Under Use These Columns to Display theResults Returned by this Search Command,click Add twice.
12.
Under Title:■ For the First Item, enter: House Number■ For the Property, select ADDRESS■ For the second item, for title, enter: Street■ For the Property, select STNAME
13.
For Target, select Task Pane. 14.
Under Item Displayed in Container:■ Click Add > New Separator.■ Select the Separator.■ Click Move Item Down to move the
separator to the bottom of the list.
15.
Under Component Available in this Layout:■ Click the SearchForParcelNoLabel
component.■ Drag the component into Items Displayed
in Container.■ Use the Move Item Down button to put the
component below the new separator.
16.
Click File menu > SaveREDDING_FLEXIBLE_LAYOUT.
17.
In the Web Layout Editor, click View In Browser. 18.
In the Connect to Localhost dialog box:■ For User Name, enter: Anonymous■ Click OK.
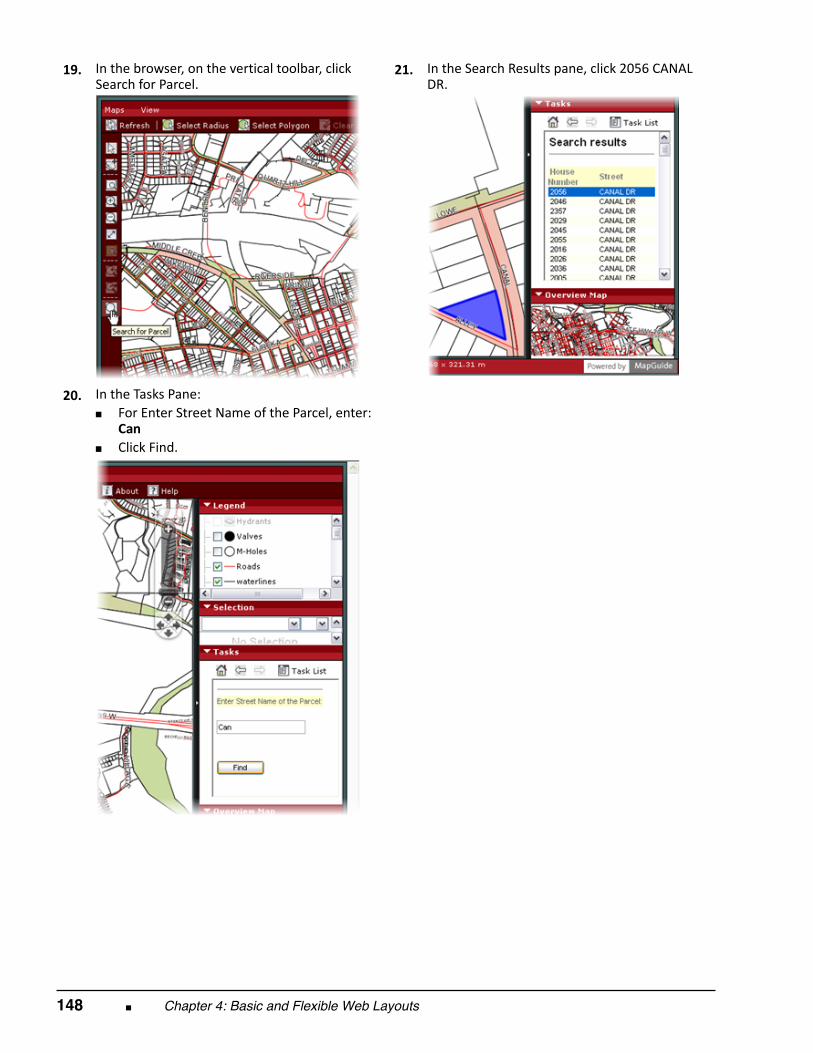
148 ■ Chapter 4: Basic and Flexible Web Layouts
19.
In the browser, on the vertical toolbar, clickSearch for Parcel.
20.
In the Tasks Pane:■ For Enter Street Name of the Parcel, enter:
Can■ Click Find.
21.
In the Search Results pane, click 2056 CANALDR.

Chapter Summary ■ 149
Chapter Summary
Having completed this chapter, you can:
■ Create a basic web layout in MapGuide Studio.■ Describe the components of the Flexible Layouts and how to customize the various components.

150 ■ Chapter 4: Basic and Flexible Web Layouts

Chapter Overview ■ 151
Chapter
5
Application Development
In this chapter, you learn about the four application programming interface (API) environments,including MapGuide Web Server, FDO, Studio, and Viewer. Each of these API environments enables youto customize Autodesk MapGuide® Enterprise in many ways, both on the server and on the desktop.
You learn that each API has its own location for development. The Web Server components aredeveloped to be run on the server, the Studio API to be run on the workstation, and the Viewer APIto be run in the web browser client. Since much of the FDO API is wrapped with the Web Serverextensions, you do not need to know it in order to develop with MapGuide Enterprise. However,the FDO API is a very good option for cross‐platform programmers and can be run on the server orworkstation.
Although you review MapGuide related code, you do not perform any programming in this chapter.
Objectives After completing this chapter, you will be able to:
■ Decide how to choose the MapGuide Enterprise Web Server Extension and development language.■ Explain the purpose of the Web Server Extensions API.■ Explain the difference between the FDO, Viewer and MapGuide Studio API.■ List the advantages of using an Integrated Development Environment (IDE).
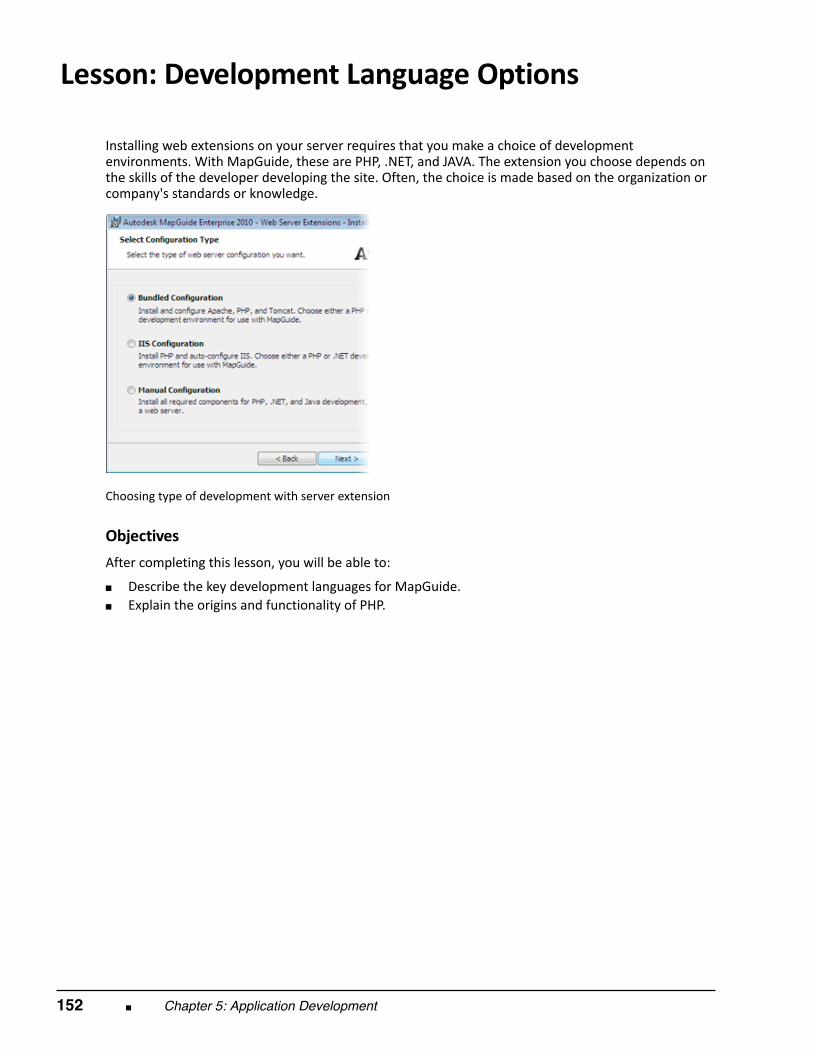
152 ■ Chapter 5: Application Development
Lesson: Development Language Options
Installing web extensions on your server requires that you make a choice of developmentenvironments. With MapGuide, these are PHP, .NET, and JAVA. The extension you choose depends onthe skills of the developer developing the site. Often, the choice is made based on the organization orcompany's standards or knowledge.
Choosing type of development with server extension
Objectives After completing this lesson, you will be able to:
■ Describe the key development languages for MapGuide.■ Explain the origins and functionality of PHP.
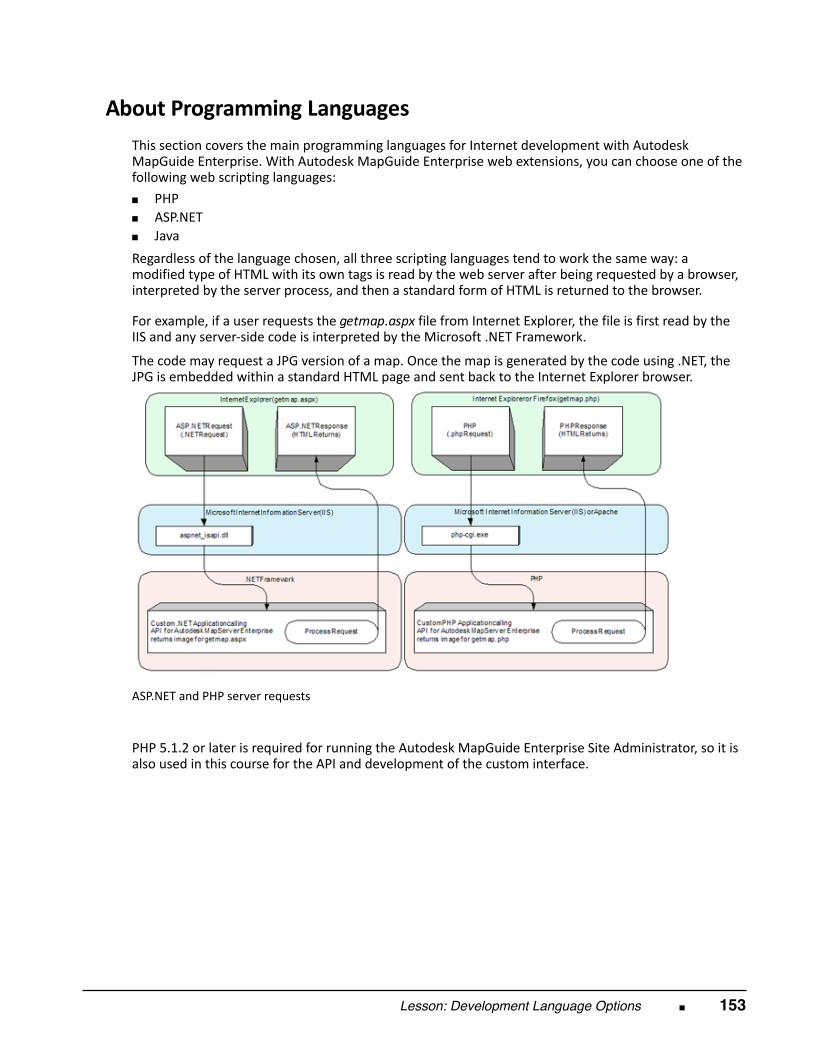
Lesson: Development Language Options ■ 153
About Programming Languages
This section covers the main programming languages for Internet development with AutodeskMapGuide Enterprise. With Autodesk MapGuide Enterprise web extensions, you can choose one of thefollowing web scripting languages: ■ PHP■ ASP.NET■ Java Regardless of the language chosen, all three scripting languages tend to work the same way: amodified type of HTML with its own tags is read by the web server after being requested by a browser,interpreted by the server process, and then a standard form of HTML is returned to the browser. For example, if a user requests the getmap.aspx file from Internet Explorer, the file is first read by theIIS and any server‐side code is interpreted by the Microsoft .NET Framework.
The code may request a JPG version of a map. Once the map is generated by the code using .NET, theJPG is embedded within a standard HTML page and sent back to the Internet Explorer browser.
ASP.NET and PHP server requests
PHP 5.1.2 or later is required for running the Autodesk MapGuide Enterprise Site Administrator, so it isalso used in this course for the API and development of the custom interface.

154 ■ Chapter 5: Application Development
PHP, ASP.NET, and JSP/Java
PHP started out as a Perl (Practical Extraction and Reporting Language) hack. It has since evolved toPHP 5, originally rebuilt in 2004 and now the most recent version of PHP, at the time this documentwas published, is 5.2.9.
Other than for the Autodesk MapGuide Enterprise Site Administrator, PHP version 5 is also requiredbecause of its Object Oriented Programming (OOP) model and its XML support. XML is the mainformat of storage of all the settings for the site repositories.
PHP also natively supports many databases, including MySQL, Oracle, Sybase, Informix, Microsoft SQLServer, PostgreSQL, and even Microsoft Access.
PHP is Open Source, and as such, it is completely free to use and distribute and can be recompiledwith modifications to the source code. PHP can be downloaded from http://www.php.net
Disadvantages of PHP Although PHP is always installed with MapGuide Enterprise Web Server Extensions is still has a fewdisadvantages: ■ Has no bundled Integrated Development Environment (IDE) like asp.net.■ Contains little debugging and error management and may be more difficult that other
environments (i.e. silent errors).■ Does not support Namespaces.■ Provides many similar and perhaps confusion functions (i.e. sort(), asort(), kSort()). Within PHP, its ease of use and rapid development cycle by far makes up for any disadvantages it mayhave. Microsoft ASP .NET Microsoft ASP .NET is a scripted language that uses the .NET framework to interpret the code intoHTML pages on demand. Visual Basic.NET, Visual C#, and Jscript .NET are all supported scriptinglanguages with ASP.NET. Regardless of the scripting language that is chosen, ASP.NET requires the webserver to be Internet Information Server (IIS) installed on a Windows operating system.
Some third‐party open source products such as MONO (http://www.mono‐
project.com), provide wrappers for the .NET Framework to run on Linux withApache, but ASP.NET would not be officially supported on Linux.

Lesson: Development Language Options ■ 155
Advantages of ASP.NET ASP .NET applications can be developed with development tools such as Microsoft Visual Studio .NET.WYSIWYG (What You See Is What You Get) environments found in tools such as Visual Studio notonly speed up development, but reduce the amount of coding knowledge required to develop anapplication. Auto‐complete tags, visual representations of the code, integrated debugging support, andeasily‐accessed objects make these sorts of environments invaluable.
Migration to the web for those applications coded in Visual Basic .NET or C# is extremely simple.Many developers who use Microsoft Visual Studio already know the object model and code styles forASP .NET. ASP .NET is extremely robust and very extensible: as the application grows, the code canaccommodate the changes.
Disadvantages of ASP .NET Primarily, ASP .NET is confined to Microsoft operating systems and Microsoft Internet InformationServer (IIS), thus reducing the flexibility of implementation.
ASP .NET is also very memory intensive and relatively slow with processing long URLs and web paths.
ASP .NET sometimes renders HTML that does not work well with non‐Internet Explorer browsers.
Java and Java Server Pages (JSP) Java Server Pages (JSP) are similar to PHP and ASP.NET pages as JSP also uses custom tags within anHTML page to run server‐side applications or scripts. JSP is handled by a separate application that mustrun concurrently with the web server. PHP and ASP .NET use server‐side plug‐ins to accomplish thistask rather than a whole server‐side application.
Apache Tomcat must run parallel to IIS or Apache web servers. Tomcat converts JSP pages into Javaand then compiles them on the server. Unlike PHP or ASP .NET, JSP pages are compiled with theJava run time on the server prior to serving the application, also known as a servlet, to the client orbrowser. Each time a JSP page is requested, Tomcat checks if that page has already been compiledbefore re‐compiling that page.
If JSP is chosen for the Autodesk MapGuide Enterprise web extension, then aprerequisite is to have Apache Tomcat running on the web server as well.

156 ■ Chapter 5: Application Development
Advantages of JSP JSP can work on any platform such as Windows or Linux. Almost any web server such as Apache, IIS,or Netscape servers can be configured to run JSP pages. Since JSP is a scripted version of Java, existingJava developers find this language extremely easy to use. JSP also relies on reusable, cross‐platform components like JavaBeans, Enterprise JavaBeans, andcustom tag libraries. These components have a long record of use in the industry. Organizationsdeveloping with JSP have little trouble finding programmers that are familiar with Java. Some other advantages of JSP include (features not found in ASP .NET): ■ Reusable, cross‐platform components.■ Security against system crashes.■ Memory leak protection.■ Customizable tags.
Disadvantages of JSP Since the JSP is compiled on the server, initialization of the Java servlets may have a slowerperformance initially when compared to the interpreted languages such as ASP .NET or PHP.
Since JSP is enabled with Java servlets and beans, you are locked into the development path of usingonly Java. Interpreted scripting is much higher‐level programming and does not require as muchsyntactic knowledge as Java.
Although JSP and Java is often the language of choice for extremely heavy‐duty and criticalapplications in a development environment, the initial learning curve may be steep and the rapiddevelopment of applications for demonstrations or “proof of concept” will be much slower.
Language Choices The advantages and disadvantages of PHP, JSP and ASP .NET listed here are hardly exhaustive lists.Often, the choice of development language is already decided by current programming knowledge orby an organization's coding standards.
For example, a developer may be very savvy with JSP/Java, but the corporation that the developer isworking for requires ASP .NET and Visual C# development. Luckily, Autodesk MapGuide Enterprise canaccommodate most development languages today.
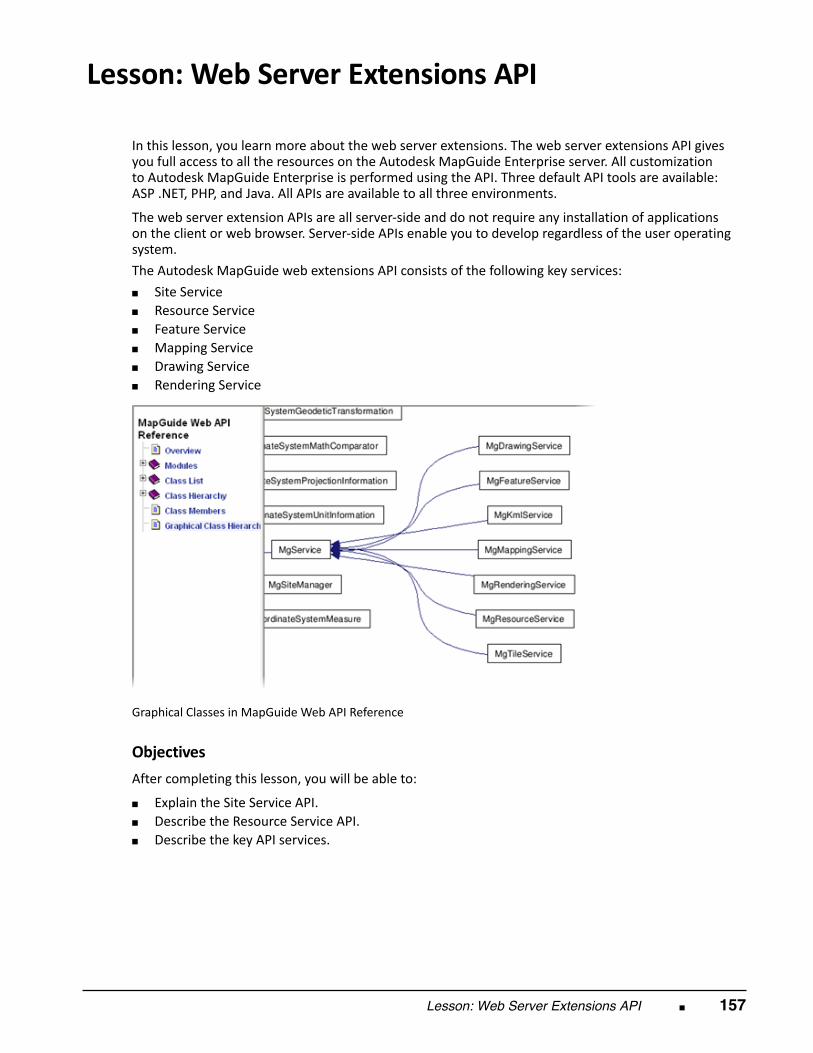
Lesson: Web Server Extensions API ■ 157
Lesson: Web Server Extensions API
In this lesson, you learn more about the web server extensions. The web server extensions API givesyou full access to all the resources on the Autodesk MapGuide Enterprise server. All customizationto Autodesk MapGuide Enterprise is performed using the API. Three default API tools are available:ASP .NET, PHP, and Java. All APIs are available to all three environments.
The web server extension APIs are all server‐side and do not require any installation of applicationson the client or web browser. Server‐side APIs enable you to develop regardless of the user operatingsystem. The Autodesk MapGuide web extensions API consists of the following key services: ■ Site Service■ Resource Service■ Feature Service■ Mapping Service■ Drawing Service■ Rendering Service
Graphical Classes in MapGuide Web API Reference
Objectives After completing this lesson, you will be able to:
■ Explain the Site Service API.■ Describe the Resource Service API.■ Describe the key API services.
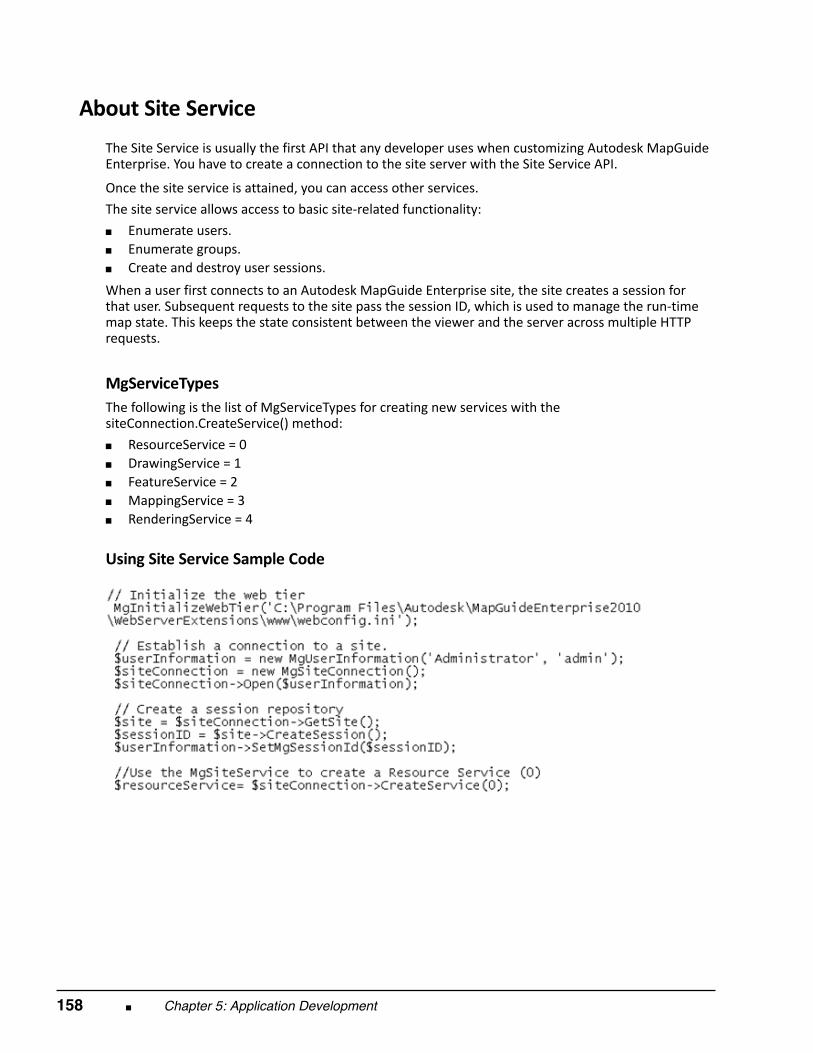
158 ■ Chapter 5: Application Development
About Site Service
The Site Service is usually the first API that any developer uses when customizing Autodesk MapGuideEnterprise. You have to create a connection to the site server with the Site Service API.
Once the site service is attained, you can access other services. The site service allows access to basic site‐related functionality: ■ Enumerate users.■ Enumerate groups.■ Create and destroy user sessions. When a user first connects to an Autodesk MapGuide Enterprise site, the site creates a session forthat user. Subsequent requests to the site pass the session ID, which is used to manage the run‐timemap state. This keeps the state consistent between the viewer and the server across multiple HTTPrequests. MgServiceTypes The following is the list of MgServiceTypes for creating new services with thesiteConnection.CreateService() method: ■ ResourceService = 0■ DrawingService = 1■ FeatureService = 2■ MappingService = 3■ RenderingService = 4 Using Site Service Sample Code
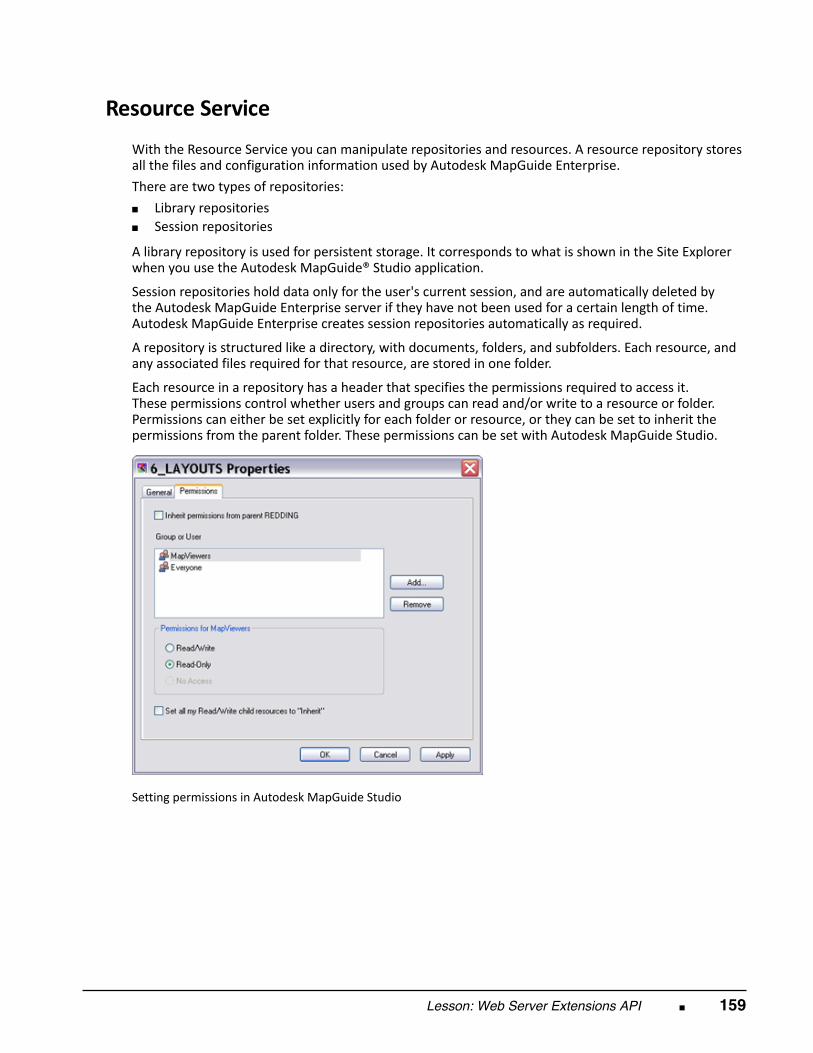
Lesson: Web Server Extensions API ■ 159
Resource Service
With the Resource Service you can manipulate repositories and resources. A resource repository storesall the files and configuration information used by Autodesk MapGuide Enterprise. There are two types of repositories: ■ Library repositories■ Session repositories A library repository is used for persistent storage. It corresponds to what is shown in the Site Explorerwhen you use the Autodesk MapGuide® Studio application. Session repositories hold data only for the user's current session, and are automatically deleted bythe Autodesk MapGuide Enterprise server if they have not been used for a certain length of time.Autodesk MapGuide Enterprise creates session repositories automatically as required. A repository is structured like a directory, with documents, folders, and subfolders. Each resource, andany associated files required for that resource, are stored in one folder.
Each resource in a repository has a header that specifies the permissions required to access it.These permissions control whether users and groups can read and/or write to a resource or folder.Permissions can either be set explicitly for each folder or resource, or they can be set to inherit thepermissions from the parent folder. These permissions can be set with Autodesk MapGuide Studio.
Setting permissions in Autodesk MapGuide Studio
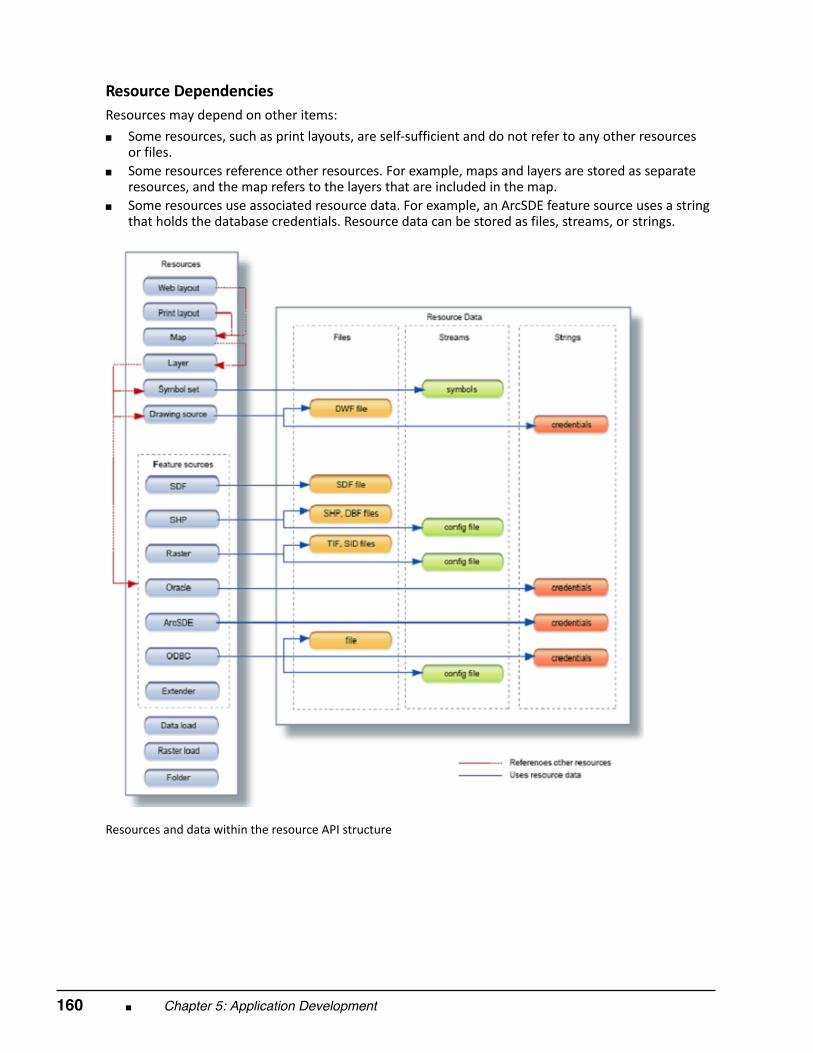
160 ■ Chapter 5: Application Development
Resource Dependencies Resources may depend on other items: ■ Some resources, such as print layouts, are self‐sufficient and do not refer to any other resources
or files.■ Some resources reference other resources. For example, maps and layers are stored as separate
resources, and the map refers to the layers that are included in the map.■ Some resources use associated resource data. For example, an ArcSDE feature source uses a string
that holds the database credentials. Resource data can be stored as files, streams, or strings.
Resources and data within the resource API structure
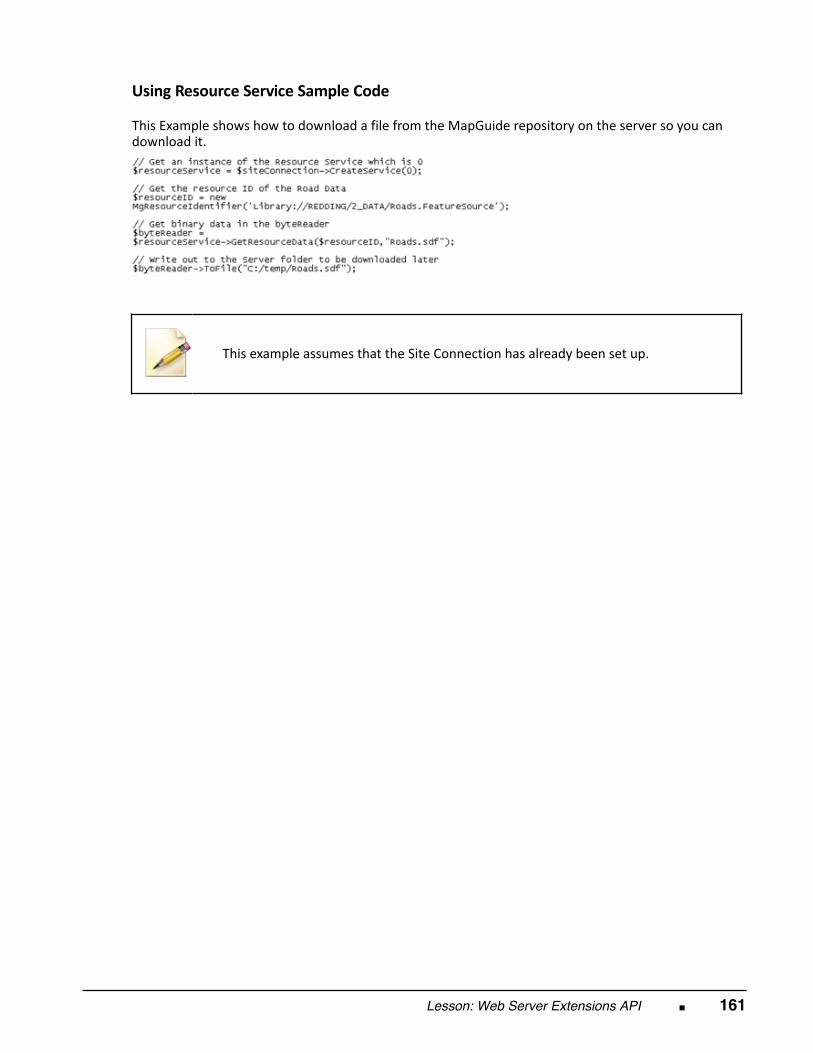
Lesson: Web Server Extensions API ■ 161
Using Resource Service Sample Code
This Example shows how to download a file from the MapGuide repository on the server so you candownload it.
This example assumes that the Site Connection has already been set up.
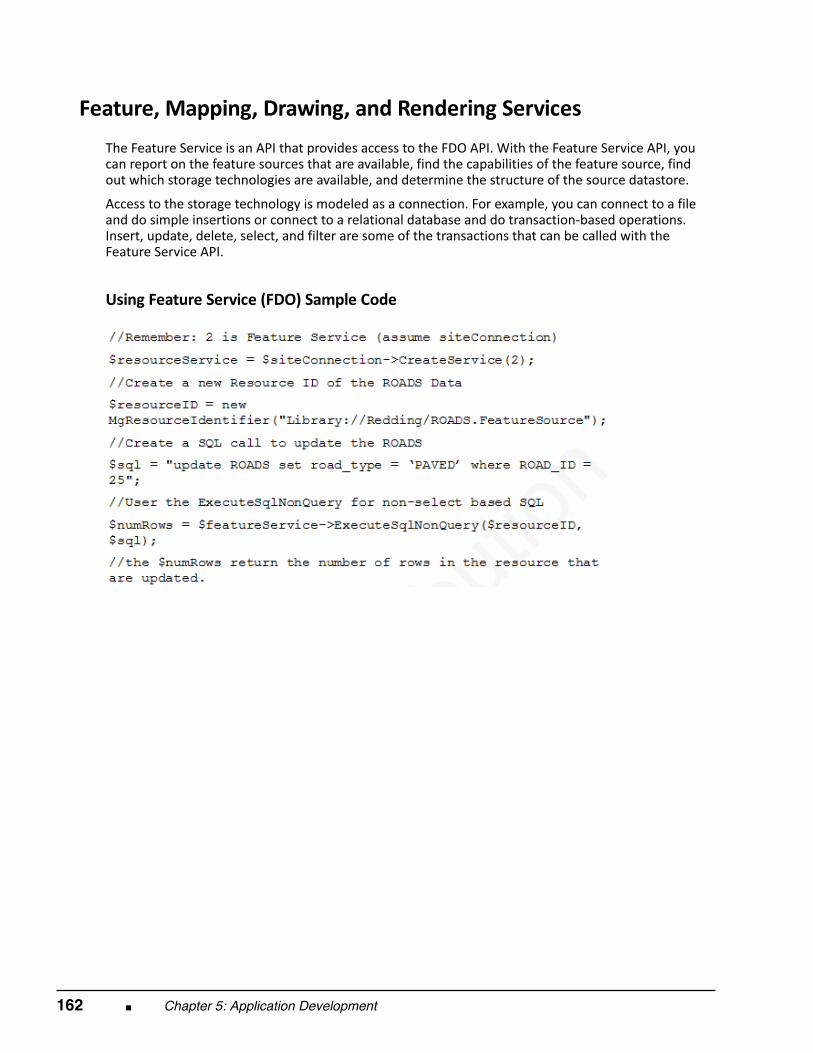
162 ■ Chapter 5: Application Development
Feature, Mapping, Drawing, and Rendering Services
The Feature Service is an API that provides access to the FDO API. With the Feature Service API, youcan report on the feature sources that are available, find the capabilities of the feature source, findout which storage technologies are available, and determine the structure of the source datastore.
Access to the storage technology is modeled as a connection. For example, you can connect to a fileand do simple insertions or connect to a relational database and do transaction‐based operations.Insert, update, delete, select, and filter are some of the transactions that can be called with theFeature Service API.
Using Feature Service (FDO) Sample Code
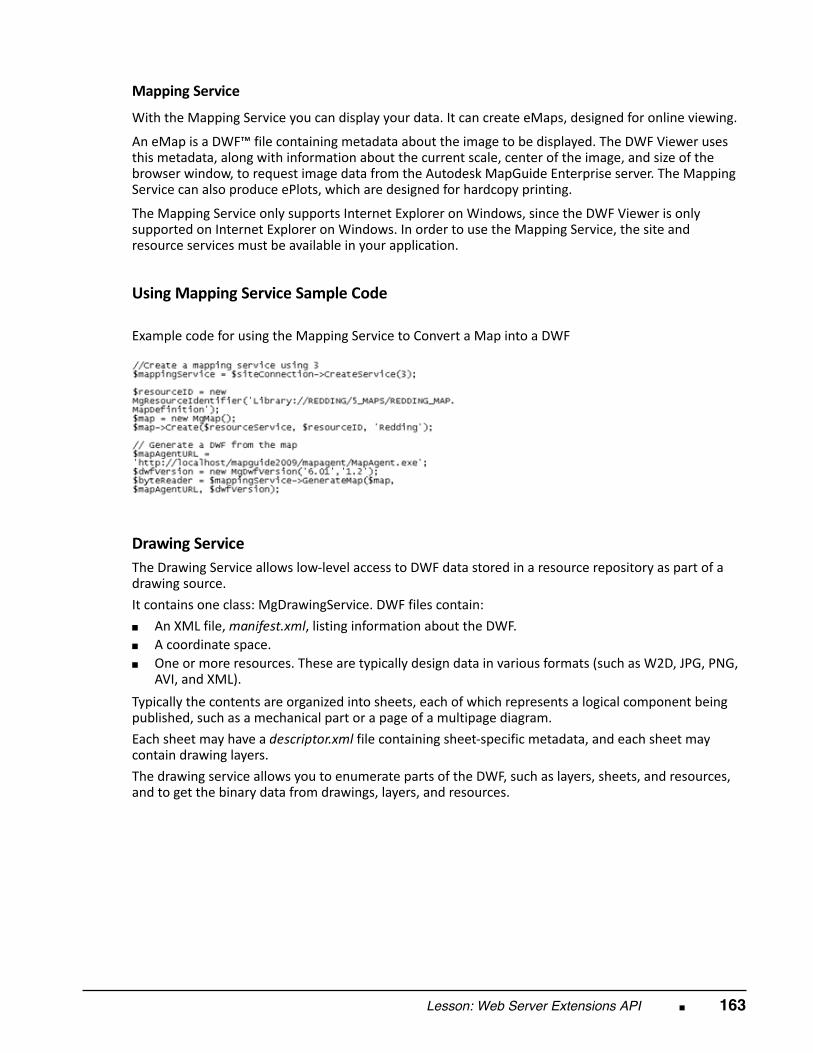
Lesson: Web Server Extensions API ■ 163
Mapping Service With the Mapping Service you can display your data. It can create eMaps, designed for online viewing.
An eMap is a DWF™ file containing metadata about the image to be displayed. The DWF Viewer usesthis metadata, along with information about the current scale, center of the image, and size of thebrowser window, to request image data from the Autodesk MapGuide Enterprise server. The MappingService can also produce ePlots, which are designed for hardcopy printing.
The Mapping Service only supports Internet Explorer on Windows, since the DWF Viewer is onlysupported on Internet Explorer on Windows. In order to use the Mapping Service, the site andresource services must be available in your application.
Using Mapping Service Sample Code
Example code for using the Mapping Service to Convert a Map into a DWF
Drawing Service The Drawing Service allows low‐level access to DWF data stored in a resource repository as part of adrawing source. It contains one class: MgDrawingService. DWF files contain: ■ An XML file, manifest.xml, listing information about the DWF.■ A coordinate space.■ One or more resources. These are typically design data in various formats (such as W2D, JPG, PNG,
AVI, and XML). Typically the contents are organized into sheets, each of which represents a logical component beingpublished, such as a mechanical part or a page of a multipage diagram. Each sheet may have a descriptor.xml file containing sheet‐specific metadata, and each sheet maycontain drawing layers. The drawing service allows you to enumerate parts of the DWF, such as layers, sheets, and resources,and to get the binary data from drawings, layers, and resources.
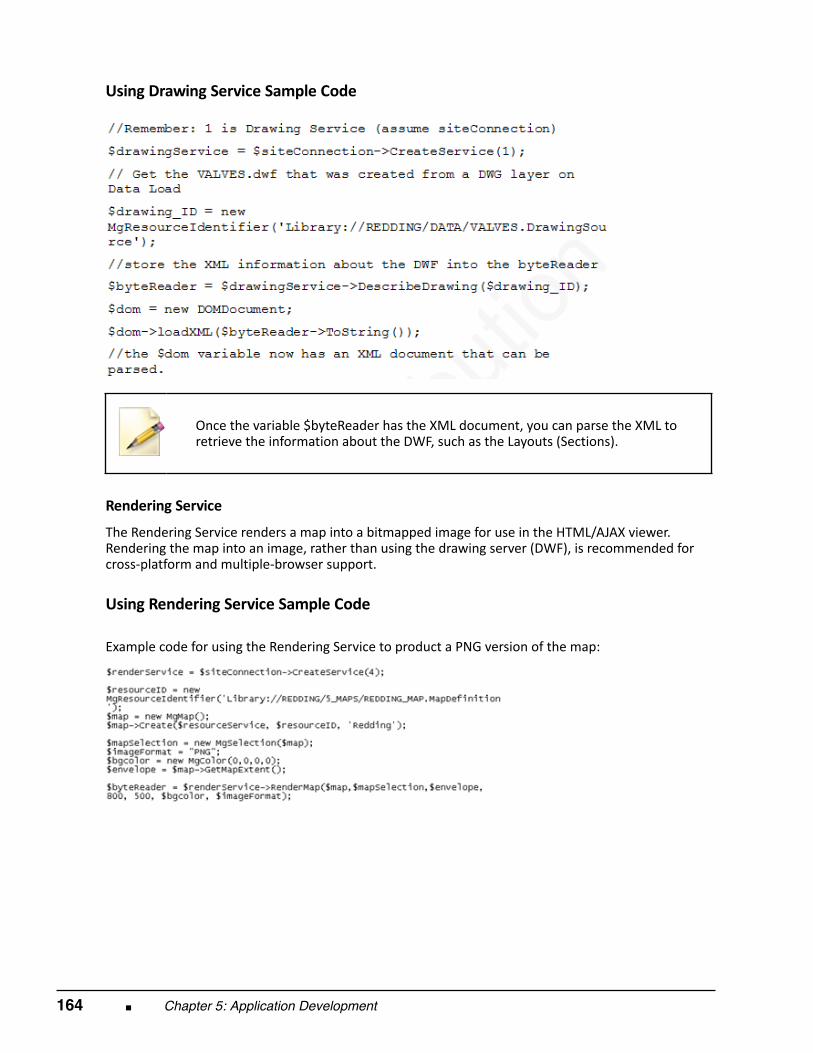
164 ■ Chapter 5: Application Development
Using Drawing Service Sample Code
Once the variable $byteReader has the XML document, you can parse the XML toretrieve the information about the DWF, such as the Layouts (Sections).
Rendering Service The Rendering Service renders a map into a bitmapped image for use in the HTML/AJAX viewer.Rendering the map into an image, rather than using the drawing server (DWF), is recommended forcross‐platform and multiple‐browser support. Using Rendering Service Sample Code
Example code for using the Rendering Service to product a PNG version of the map:
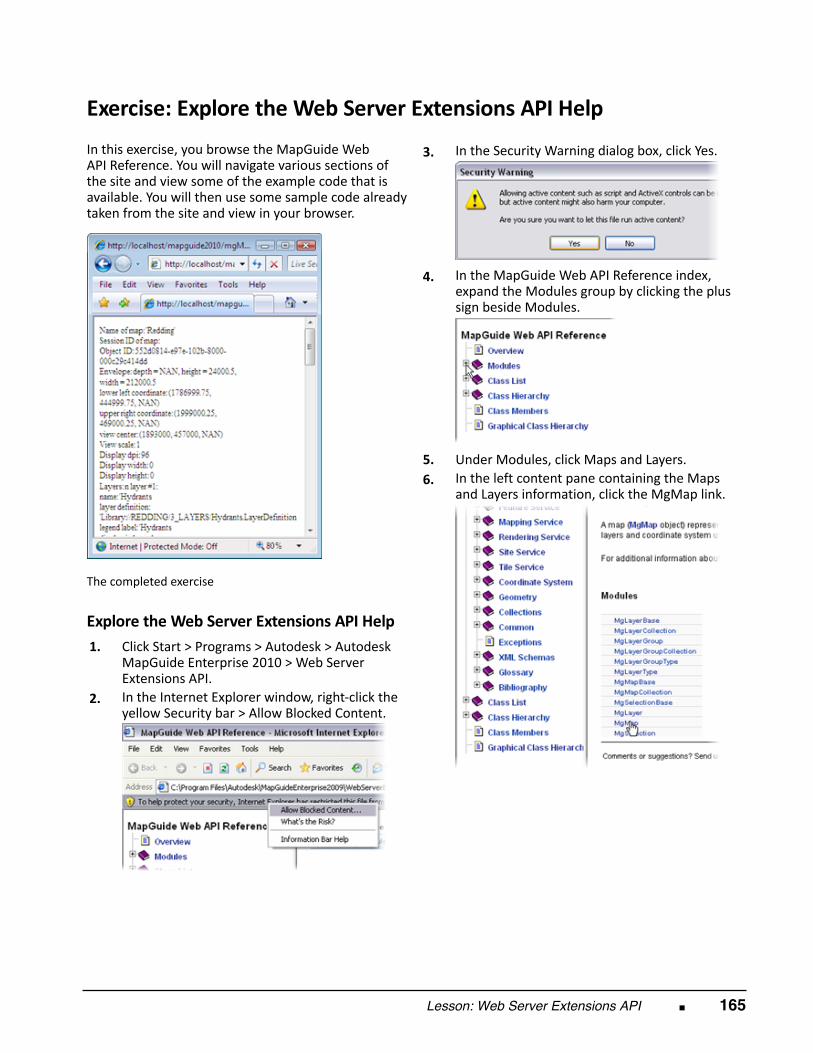
Lesson: Web Server Extensions API ■ 165
Exercise: Explore the Web Server Extensions API Help In this exercise, you browse the MapGuide WebAPI Reference. You will navigate various sections ofthe site and view some of the example code that isavailable. You will then use some sample code alreadytaken from the site and view in your browser.
The completed exercise
Explore the Web Server Extensions API Help 1.
Click Start > Programs > Autodesk > AutodeskMapGuide Enterprise 2010 > Web ServerExtensions API.
2.
In the Internet Explorer window, right‐click theyellow Security bar > Allow Blocked Content.
3.
In the Security Warning dialog box, click Yes.
4.
In the MapGuide Web API Reference index,expand the Modules group by clicking the plussign beside Modules.
5.
Under Modules, click Maps and Layers. 6.
In the left content pane containing the Mapsand Layers information, click the MgMap link.
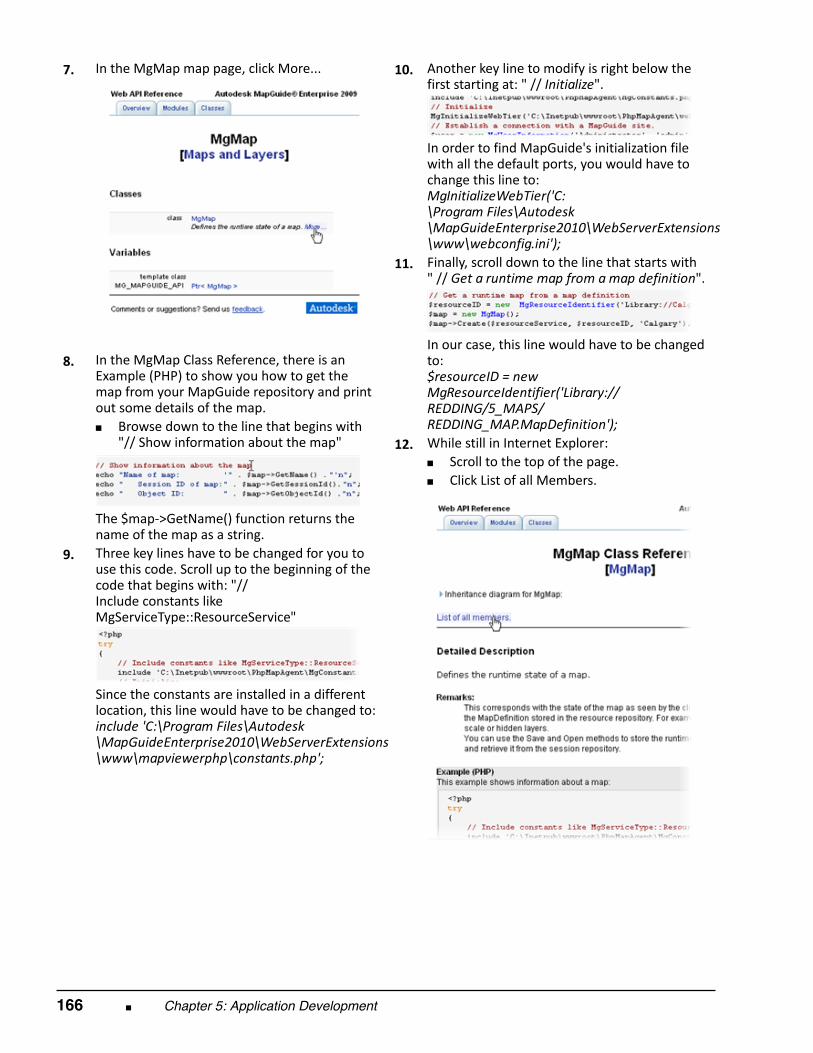
166 ■ Chapter 5: Application Development
7.
In the MgMap map page, click More...
8.
In the MgMap Class Reference, there is anExample (PHP) to show you how to get themap from your MapGuide repository and printout some details of the map.■ Browse down to the line that begins with
"// Show information about the map"
The $map‐>GetName() function returns thename of the map as a string.
9.
Three key lines have to be changed for you touse this code. Scroll up to the beginning of thecode that begins with: "// Include constants likeMgServiceType::ResourceService"
Since the constants are installed in a differentlocation, this line would have to be changed to: include 'C:\Program Files\Autodesk\MapGuideEnterprise2010\WebServerExtensions\www\mapviewerphp\constants.php';
10.
Another key line to modify is right below thefirst starting at: " // Initialize".
In order to find MapGuide's initialization filewith all the default ports, you would have tochange this line to: MgInitializeWebTier('C:\Program Files\Autodesk\MapGuideEnterprise2010\WebServerExtensions\www\webconfig.ini');
11.
Finally, scroll down to the line that starts with" // Get a runtime map from a map definition".
In our case, this line would have to be changedto: $resourceID = newMgResourceIdentifier('Library://REDDING/5_MAPS/REDDING_MAP.MapDefinition');
12.
While still in Internet Explorer:■ Scroll to the top of the page.■ Click List of all Members.
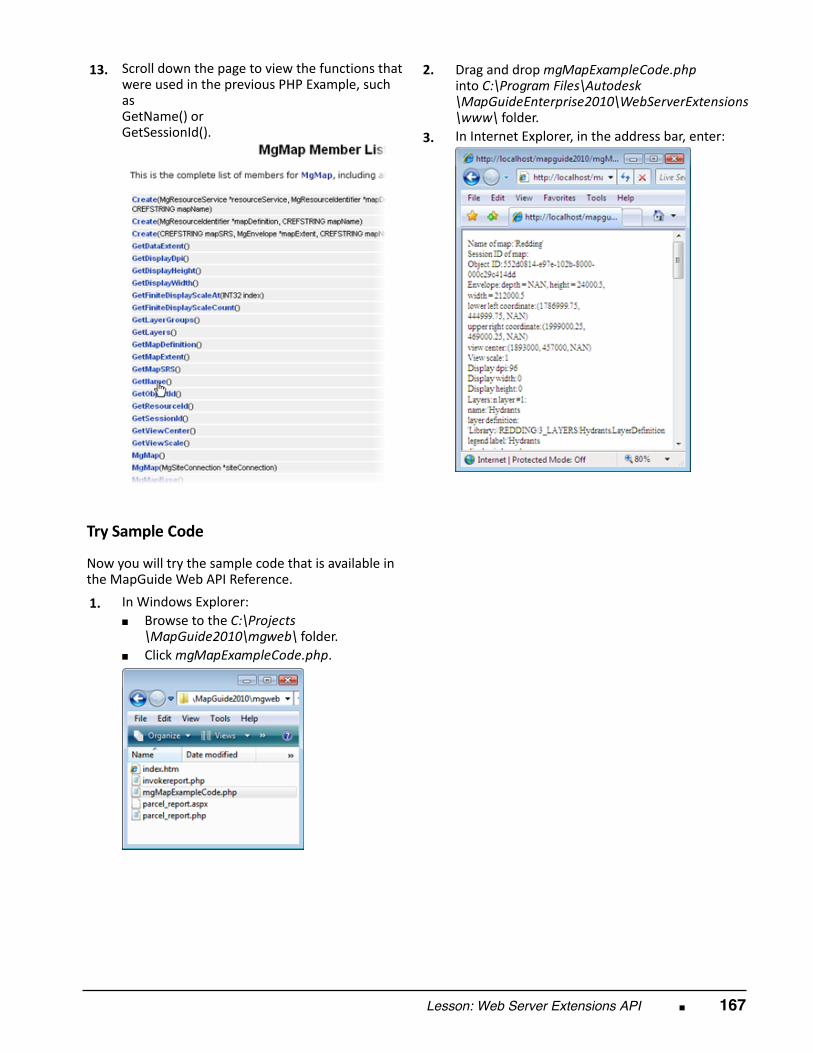
Lesson: Web Server Extensions API ■ 167
13.
Scroll down the page to view the functions thatwere used in the previous PHP Example, suchas GetName() or GetSessionId().
Try Sample Code Now you will try the sample code that is available inthe MapGuide Web API Reference. 1.
In Windows Explorer:■ Browse to the C:\Projects
\MapGuide2010\mgweb\ folder.■ Click mgMapExampleCode.php.
2.
Drag and drop mgMapExampleCode.phpinto C:\Program Files\Autodesk\MapGuideEnterprise2010\WebServerExtensions\www\ folder.
3.
In Internet Explorer, in the address bar, enter:
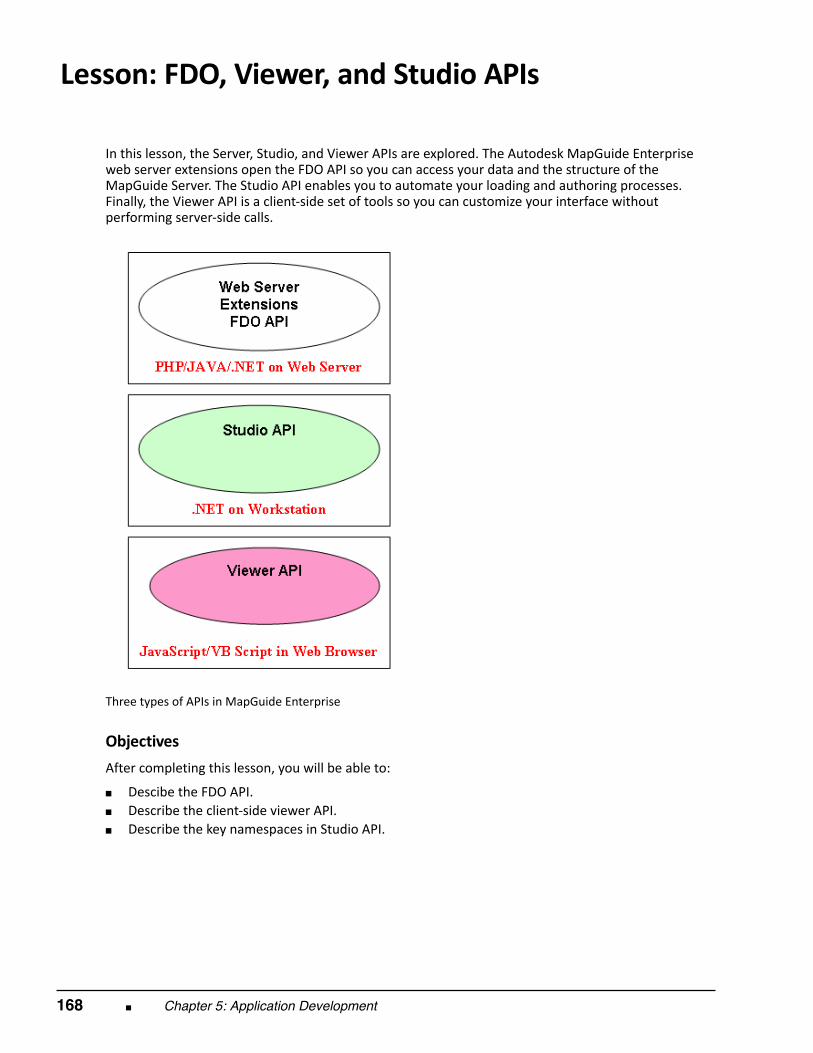
168 ■ Chapter 5: Application Development
Lesson: FDO, Viewer, and Studio APIs
In this lesson, the Server, Studio, and Viewer APIs are explored. The Autodesk MapGuide Enterpriseweb server extensions open the FDO API so you can access your data and the structure of theMapGuide Server. The Studio API enables you to automate your loading and authoring processes.Finally, the Viewer API is a client‐side set of tools so you can customize your interface withoutperforming server‐side calls.
Three types of APIs in MapGuide Enterprise
Objectives After completing this lesson, you will be able to:
■ Descibe the FDO API.■ Describe the client‐side viewer API.■ Describe the key namespaces in Studio API.

Lesson: FDO, Viewer, and Studio APIs ■ 169
FDO API
The Autodesk Feature Data Objects (FDO) API is a programming environment that provides an objectoriented API that you can use to customize AutoCAD and AutoCAD‐based products like AutoCAD® Map3D and Autodesk MapGuide Enterprise.
The FDO API provides consistent access to feature data, whether it comes from a file‐based datasource or from a relational database that supports rich classification. To achieve this, FDO supports amodel that can readily feature the capabilities of each data source, allowing you to tailor consumerapplications functionality to that of the data source.
For example, some data sources may support spatial queries and long transactions, such as OracleSpatial, while others do not, such as SHP. Likewise, FDO includes a flexible metadata model to allowclients to adapt to the underlying feature schema exposed by each data source.
Autodesk MapGuide Enterprise web extensions, using the feature service API, enable you to accessFDO through Autodesk MapGuide, so you can forgo using the direct FDO API. The direct FDO APIis an independent API for cross development with Autodesk MapGuide and AutoCAD Map 3D FDOdevelopment.
AutoCAD Map 3D and Autodesk MapGuide Enterprise share the FDO. The FDO providers give thesame, direct, simultaneous access to multiple databases and files (including Oracle, ArcSDE, DEM, andSDF).
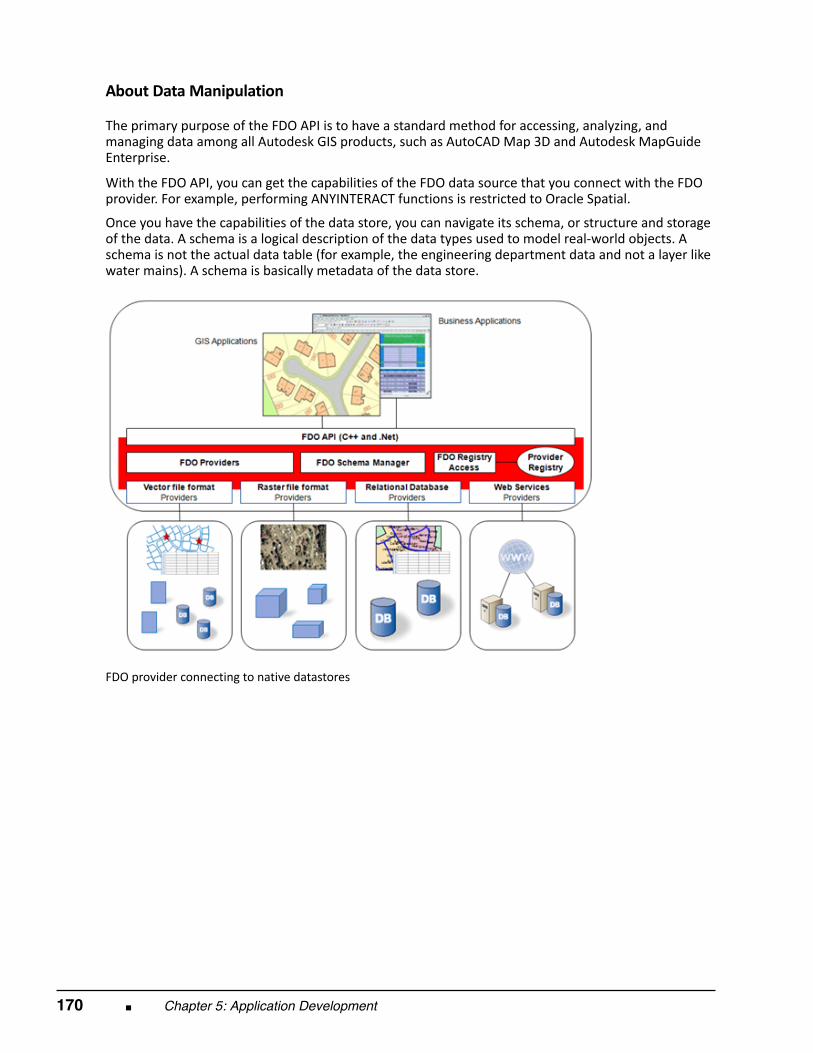
170 ■ Chapter 5: Application Development
About Data Manipulation
The primary purpose of the FDO API is to have a standard method for accessing, analyzing, andmanaging data among all Autodesk GIS products, such as AutoCAD Map 3D and Autodesk MapGuideEnterprise. With the FDO API, you can get the capabilities of the FDO data source that you connect with the FDOprovider. For example, performing ANYINTERACT functions is restricted to Oracle Spatial.
Once you have the capabilities of the data store, you can navigate its schema, or structure and storageof the data. A schema is a logical description of the data types used to model real‐world objects. Aschema is not the actual data table (for example, the engineering department data and not a layer likewater mains). A schema is basically metadata of the data store.
FDO provider connecting to native datastores
Lesson: FDO, Viewer, and Studio APIs ■ 171
Filters and Commands Much like the filters that you can use in the feature service of the web extensions API, the FDO API alsoallows spatial filters. An SQL context can be applied to the FDO data source for filtering.
For example, a filter may be used to identify all road type features that have two lanes and that arewithin two hundred meters of a particular location. Commands are those calls to the datastore totrigger or activate an event or filter within that datastore. For example, a command may be used tocopy a feature or delete a layer.
Geometry The following geometries are supported by the FDO API: ■ Point.■ LineString (one or more connected line segments, defined by positions at the vertices).■ CurveString (a collection of connected circular arc segments and linear segments).■ Polygon (a surface bound by one outer ring and zero or more interior rings; the rings are closed,
connected line segments, defined by positions at the vertices).■ CurvePolygon (a surface bound by one outer ring and zero or more interior rings; the rings are
closed, connected curve segments).■ MultiPoint (multiple points, which may be disjoint).■ MultiLineString (multiple LineStrings, which may be disjoint).■ MultiCurveString (multiple CurveStrings, which may be disjoint).■ MultiPolygon (multiple Polygons, which may be disjoint).■ MultiCurvePolygon (multiple CurvePolygons, which may be disjoint).■ MultiGeometry (a heterogeneous collection of geometries, which may be disjoint).
Geometry such as raster and ODBC points, and DEM datasets such GeoTIF and DEMfiles, are also natively supported with the FDO API.
The FDO libraries in the Autodesk MapGuide Enterprise web extensions are a subset of the FDO APIfound in AutoCAD Map 3D. Autodesk MapGuide Enterprise, combined with AutoCAD Map 3D, is acomplete enterprise solution for data creation, management, and publishing.
Also, more FDO libraries are available that are used in AutoCAD Map 3D as well. For fulldocumentation, visit http://fdo.osgeo.org.
172 ■ Chapter 5: Application Development
About the Viewer API
There are two key Viewer APIs: ■ Basic Web Layout Viewer API (JavaScript/VBScript)■ Flexible Web Layout Viewer API (JavaScript/XML)
Basic Web Layout Viewer API This neutral Viewer API that works with both AJAX and DWF Viewers. This API is a client‐sideJavascript/VBScript API that is loaded when the frames that surround the web layout is seen inthe browser. Within Basic Web Layout you can use the Viewer API to manipulate the map, createcustomized buttons or trigger events to launch URLs.
There are some Basic Web Layout Viewer API calls that are used to pass information
to the server. The JavaScript API is created to call real‐time server requests, while stillusing client side scripting. For more information, see the Viewer API document inhttps://mapguide.osgeo.org/files/mapguide/docs/viewerapi/viewerapi.html.
Flexible Web Layout Viewer API The Flexible Web Layout viewer is AJAX, much like the Basic Web Layout version, but has a differentarchitecture. The API is not the same as the Basic Web Layout. Although it still uses JavaScript on theclient, it also utilizes XML files as Widgets. These Widgets use a combination of XML, JavaScript andsome server‐side API in order to work.
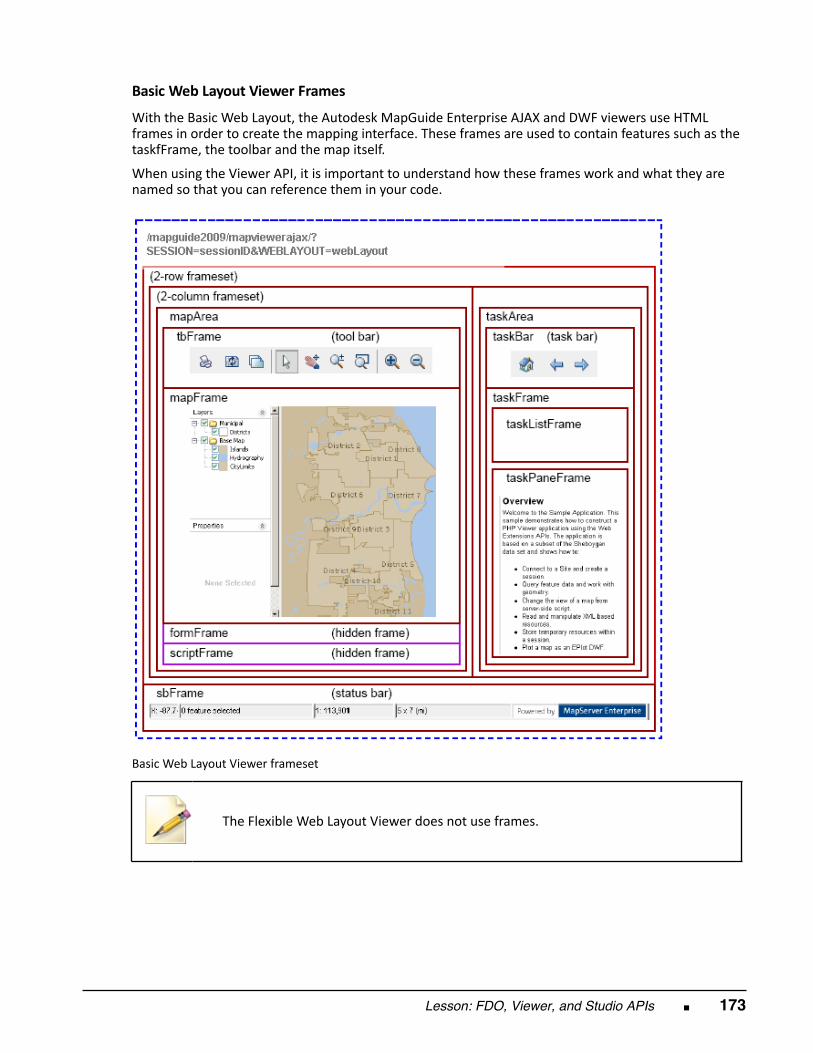
Lesson: FDO, Viewer, and Studio APIs ■ 173
Basic Web Layout Viewer Frames With the Basic Web Layout, the Autodesk MapGuide Enterprise AJAX and DWF viewers use HTMLframes in order to create the mapping interface. These frames are used to contain features such as thetaskfFrame, the toolbar and the map itself.
When using the Viewer API, it is important to understand how these frames work and what they arenamed so that you can reference them in your code.
Basic Web Layout Viewer frameset
The Flexible Web Layout Viewer does not use frames.
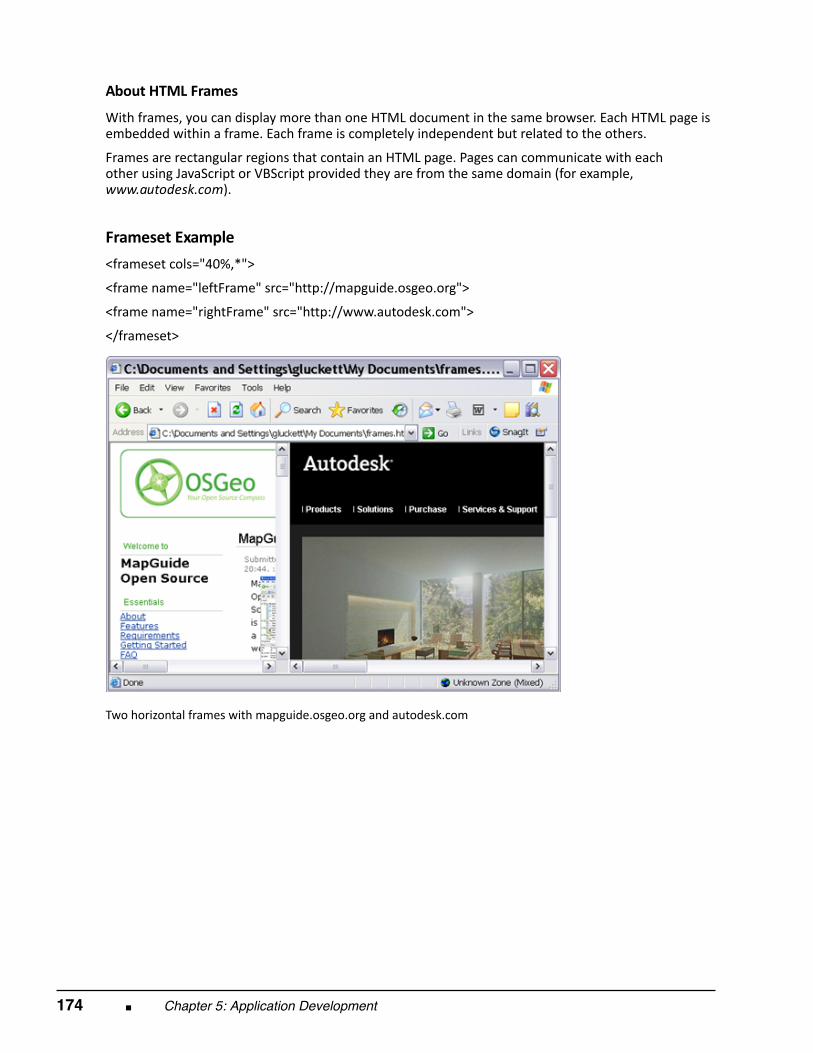
174 ■ Chapter 5: Application Development
About HTML Frames With frames, you can display more than one HTML document in the same browser. Each HTML page isembedded within a frame. Each frame is completely independent but related to the others.
Frames are rectangular regions that contain an HTML page. Pages can communicate with eachother using JavaScript or VBScript provided they are from the same domain (for example,www.autodesk.com).
Frameset Example <frameset cols="40%,*">
<frame name="leftFrame" src="http://mapguide.osgeo.org">
<frame name="rightFrame" src="http://www.autodesk.com">
</frameset>
Two horizontal frames with mapguide.osgeo.org and autodesk.com
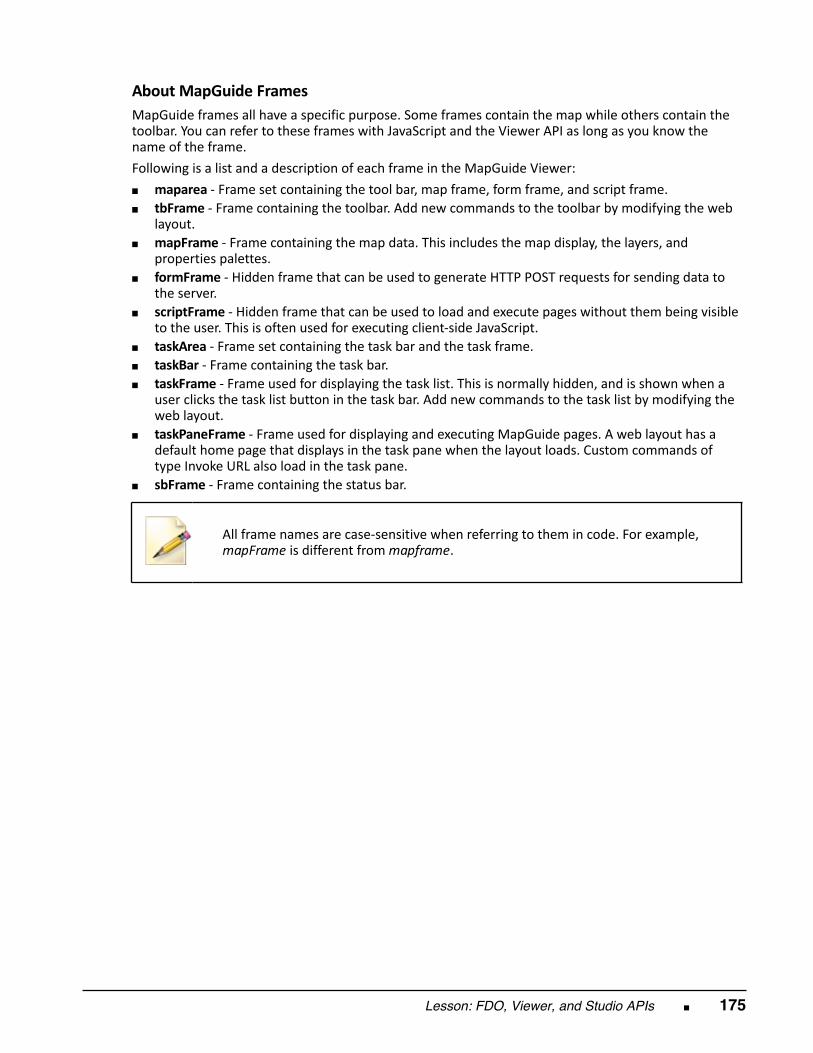
Lesson: FDO, Viewer, and Studio APIs ■ 175
About MapGuide Frames MapGuide frames all have a specific purpose. Some frames contain the map while others contain thetoolbar. You can refer to these frames with JavaScript and the Viewer API as long as you know thename of the frame. Following is a list and a description of each frame in the MapGuide Viewer: ■ maparea ‐ Frame set containing the tool bar, map frame, form frame, and script frame.■ tbFrame ‐ Frame containing the toolbar. Add new commands to the toolbar by modifying the web
layout.■ mapFrame ‐ Frame containing the map data. This includes the map display, the layers, and
properties palettes.■ formFrame ‐ Hidden frame that can be used to generate HTTP POST requests for sending data to
the server.■ scriptFrame ‐ Hidden frame that can be used to load and execute pages without them being visible
to the user. This is often used for executing client‐side JavaScript.■ taskArea ‐ Frame set containing the task bar and the task frame.■ taskBar ‐ Frame containing the task bar.■ taskFrame ‐ Frame used for displaying the task list. This is normally hidden, and is shown when a
user clicks the task list button in the task bar. Add new commands to the task list by modifying theweb layout.
■ taskPaneFrame ‐ Frame used for displaying and executing MapGuide pages. A web layout has adefault home page that displays in the task pane when the layout loads. Custom commands oftype Invoke URL also load in the task pane.
■ sbFrame ‐ Frame containing the status bar.
All frame names are case‐sensitive when referring to them in code. For example,mapFrame is different from mapframe.
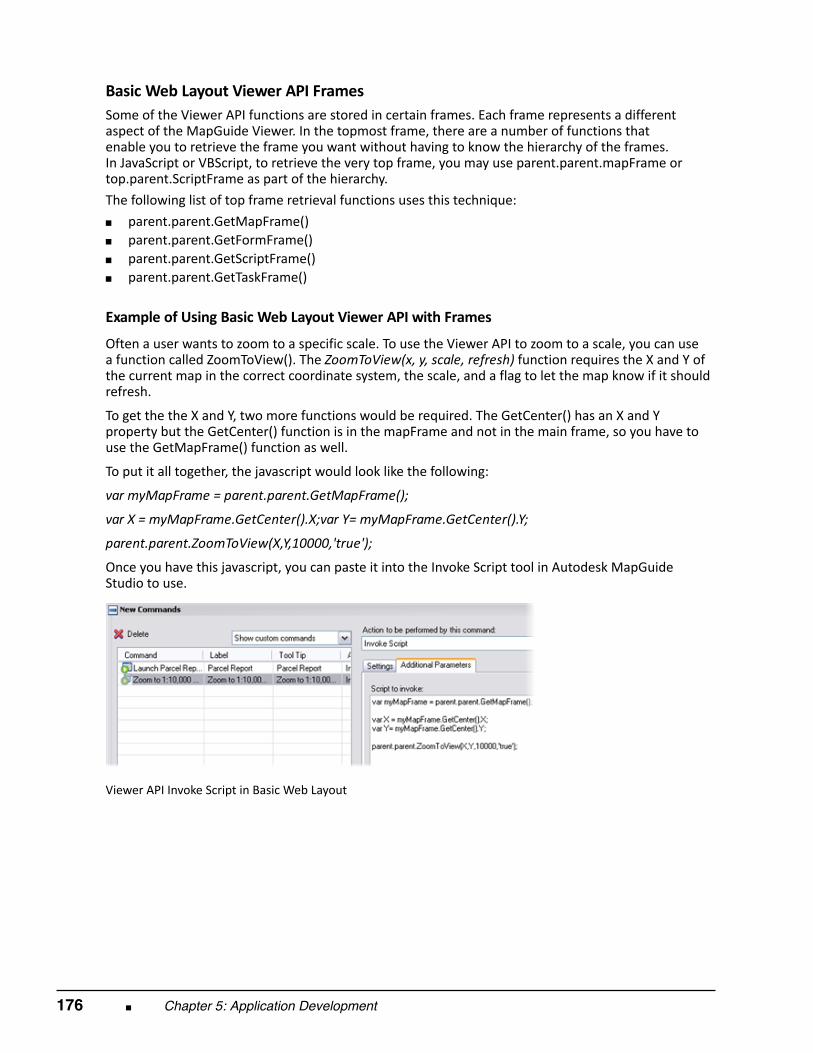
176 ■ Chapter 5: Application Development
Basic Web Layout Viewer API Frames Some of the Viewer API functions are stored in certain frames. Each frame represents a differentaspect of the MapGuide Viewer. In the topmost frame, there are a number of functions thatenable you to retrieve the frame you want without having to know the hierarchy of the frames.In JavaScript or VBScript, to retrieve the very top frame, you may use parent.parent.mapFrame ortop.parent.ScriptFrame as part of the hierarchy. The following list of top frame retrieval functions uses this technique: ■ parent.parent.GetMapFrame()■ parent.parent.GetFormFrame()■ parent.parent.GetScriptFrame()■ parent.parent.GetTaskFrame()
Example of Using Basic Web Layout Viewer API with Frames Often a user wants to zoom to a specific scale. To use the Viewer API to zoom to a scale, you can usea function called ZoomToView(). The ZoomToView(x, y, scale, refresh) function requires the X and Y ofthe current map in the correct coordinate system, the scale, and a flag to let the map know if it shouldrefresh.
To get the the X and Y, two more functions would be required. The GetCenter() has an X and Yproperty but the GetCenter() function is in the mapFrame and not in the main frame, so you have touse the GetMapFrame() function as well.
To put it all together, the javascript would look like the following:
var myMapFrame = parent.parent.GetMapFrame();
var X = myMapFrame.GetCenter().X;var Y= myMapFrame.GetCenter().Y;
parent.parent.ZoomToView(X,Y,10000,'true');
Once you have this javascript, you can paste it into the Invoke Script tool in Autodesk MapGuideStudio to use.
Viewer API Invoke Script in Basic Web Layout
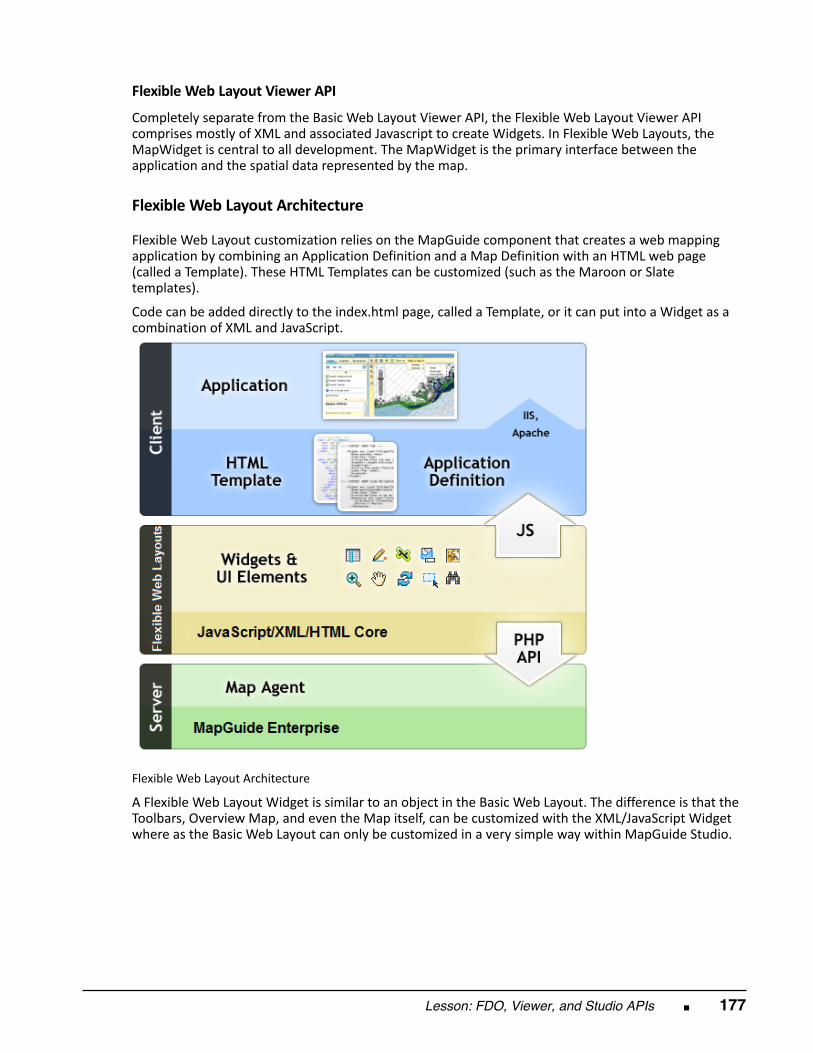
Lesson: FDO, Viewer, and Studio APIs ■ 177
Flexible Web Layout Viewer API Completely separate from the Basic Web Layout Viewer API, the Flexible Web Layout Viewer APIcomprises mostly of XML and associated Javascript to create Widgets. In Flexible Web Layouts, theMapWidget is central to all development. The MapWidget is the primary interface between theapplication and the spatial data represented by the map. Flexible Web Layout Architecture
Flexible Web Layout customization relies on the MapGuide component that creates a web mappingapplication by combining an Application Definition and a Map Definition with an HTML web page(called a Template). These HTML Templates can be customized (such as the Maroon or Slatetemplates).
Code can be added directly to the index.html page, called a Template, or it can put into a Widget as acombination of XML and JavaScript.
Flexible Web Layout Architecture A Flexible Web Layout Widget is similar to an object in the Basic Web Layout. The difference is that theToolbars, Overview Map, and even the Map itself, can be customized with the XML/JavaScript Widgetwhere as the Basic Web Layout can only be customized in a very simple way within MapGuide Studio.
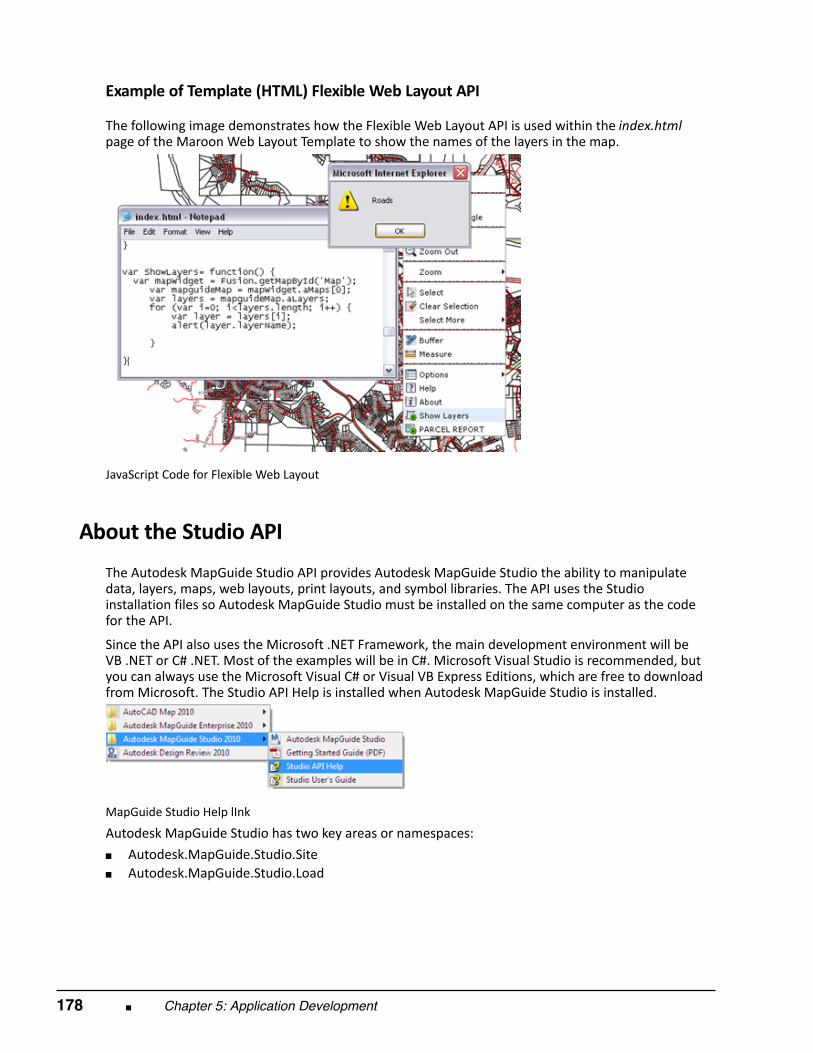
178 ■ Chapter 5: Application Development
Example of Template (HTML) Flexible Web Layout API
The following image demonstrates how the Flexible Web Layout API is used within the index.htmlpage of the Maroon Web Layout Template to show the names of the layers in the map.
JavaScript Code for Flexible Web Layout
About the Studio API
The Autodesk MapGuide Studio API provides Autodesk MapGuide Studio the ability to manipulatedata, layers, maps, web layouts, print layouts, and symbol libraries. The API uses the Studioinstallation files so Autodesk MapGuide Studio must be installed on the same computer as the codefor the API.
Since the API also uses the Microsoft .NET Framework, the main development environment will beVB .NET or C# .NET. Most of the examples will be in C#. Microsoft Visual Studio is recommended, butyou can always use the Microsoft Visual C# or Visual VB Express Editions, which are free to downloadfrom Microsoft. The Studio API Help is installed when Autodesk MapGuide Studio is installed.
MapGuide Studio Help lInk Autodesk MapGuide Studio has two key areas or namespaces: ■ Autodesk.MapGuide.Studio.Site■ Autodesk.MapGuide.Studio.Load
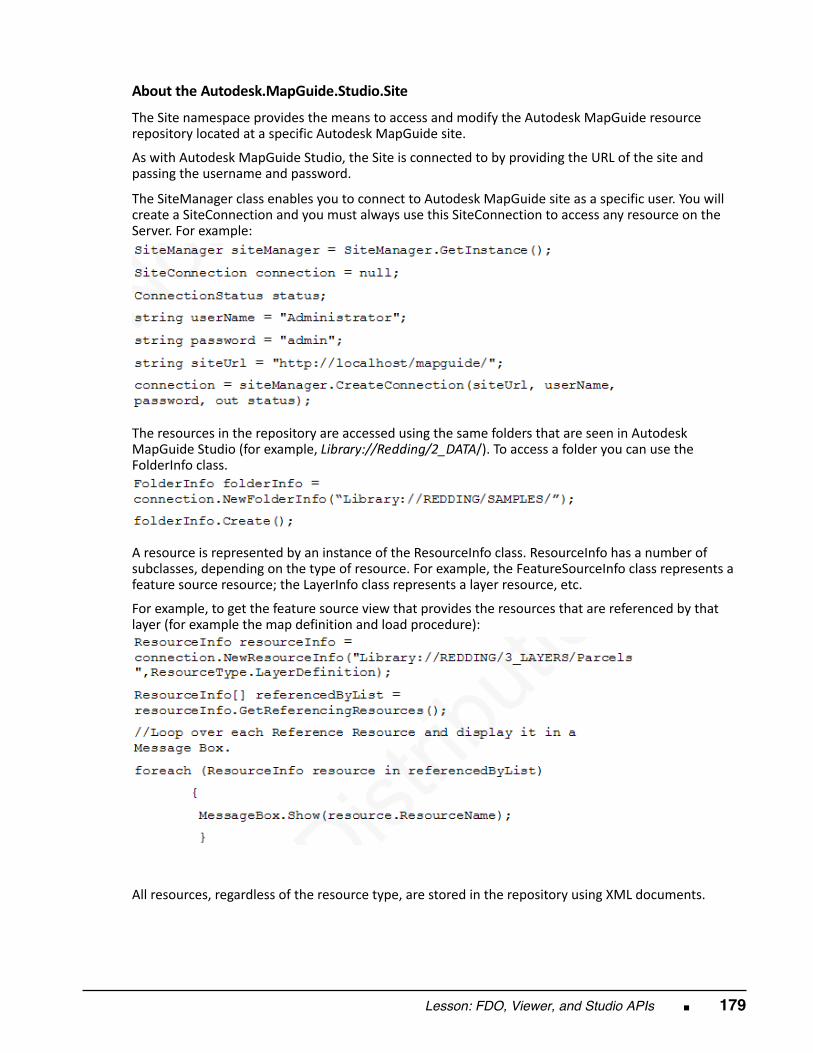
Lesson: FDO, Viewer, and Studio APIs ■ 179
About the Autodesk.MapGuide.Studio.Site The Site namespace provides the means to access and modify the Autodesk MapGuide resourcerepository located at a specific Autodesk MapGuide site.
As with Autodesk MapGuide Studio, the Site is connected to by providing the URL of the site andpassing the username and password. The SiteManager class enables you to connect to Autodesk MapGuide site as a specific user. You willcreate a SiteConnection and you must always use this SiteConnection to access any resource on theServer. For example:
The resources in the repository are accessed using the same folders that are seen in AutodeskMapGuide Studio (for example, Library://Redding/2_DATA/). To access a folder you can use theFolderInfo class.
A resource is represented by an instance of the ResourceInfo class. ResourceInfo has a number ofsubclasses, depending on the type of resource. For example, the FeatureSourceInfo class represents afeature source resource; the LayerInfo class represents a layer resource, etc.
For example, to get the feature source view that provides the resources that are referenced by thatlayer (for example the map definition and load procedure):
All resources, regardless of the resource type, are stored in the repository using XML documents.
180 ■ Chapter 5: Application Development
In order to manipulate the XML, you must be able to use the XMLDOM and parsethe XML with code. Consuming XML is a pivotal part of manipulating the resources inAutodesk MapGuide Studio API.
About Autodesk.MapGuide.Studio.Load With the Load namespace, you can convert a number of file formats into one of the file formatssupported by Autodesk MapGuide Enterprise including: ■ DWG™■ DWF■ SDF■ SHP■ Raster To convert a file, you use an instance of LoadProcedure class. This class has one subclass for each typeof file that can be converted such as: ■ DwfLoadProcedure■ DwgLoadProcedure■ SDFLoadProcedure■ SHPLoadProcedure■ RasterLoadProdure
In order to retrieve Block Attributes, Object Data, or Link Template information from
the DWG, the DWG must be classified prior to conversion with Autodesk MapGuideStudio or with the Studio API.
Lesson: FDO, Viewer, and Studio APIs ■ 181
The LoadProcedure class uses some of the classes in the Site namespace in order to add files to aMapGuide resource repository.
Loading data using the Autodesk MapGuide Studio API is almost as simple as using AutodeskMapGuide Studio itself. For example, if you wanted to load a DWG file stored on your computer to theAutodesk MapGuide Enterprise site, the following code could be run:
Finally, if you have already defined your connection to the site, you can load the file to the server:
The execute command can optionally have the local path for the package (MGP) file, such as:
A Sewer.MGP file will be left in the folder. When the execute method is run, a temporary MGP file iscreated, but if you enter the full path where you want the MGP file placed, you can retain a copy.
If you rename a MGP file to a ZIP, you can view the package and associated XML andSDF or DWF files using Windows or WinZip.
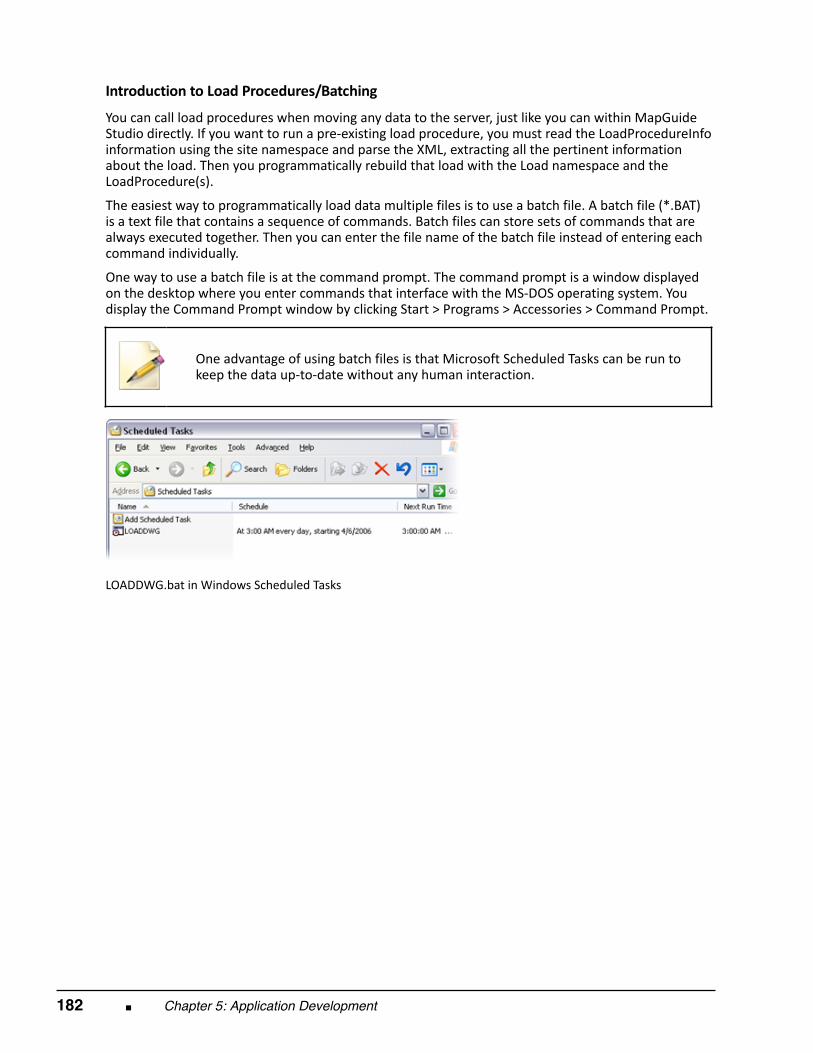
182 ■ Chapter 5: Application Development
Introduction to Load Procedures/Batching You can call load procedures when moving any data to the server, just like you can within MapGuideStudio directly. If you want to run a pre‐existing load procedure, you must read the LoadProcedureInfoinformation using the site namespace and parse the XML, extracting all the pertinent informationabout the load. Then you programmatically rebuild that load with the Load namespace and theLoadProcedure(s).
The easiest way to programmatically load data multiple files is to use a batch file. A batch file (*.BAT)is a text file that contains a sequence of commands. Batch files can store sets of commands that arealways executed together. Then you can enter the file name of the batch file instead of entering eachcommand individually.
One way to use a batch file is at the command prompt. The command prompt is a window displayedon the desktop where you enter commands that interface with the MS‐DOS operating system. Youdisplay the Command Prompt window by clicking Start > Programs > Accessories > Command Prompt.
One advantage of using batch files is that Microsoft Scheduled Tasks can be run tokeep the data up‐to‐date without any human interaction.
LOADDWG.bat in Windows Scheduled Tasks
Lesson: FDO, Viewer, and Studio APIs ■ 183
DWG Load With Command Line Arguments
To create a batch file, the executable you create must be able to accept arguments from the commandline.
You will have to create your own switches or command line arguments that store your variables. In theexample above, the /SUBSAMPLE: is a switch with a value of 25.
In the following C# example of loading DWG files using batch files, the following switches are created:
/RTFLD:
The root folder for the load on the MapGuide server (for example, “Library://Redding/”)
/DATAFLD: The folder where the data repositories are stored (2_DATA)
/LYRFLD: The folder where each layer is stored (3_LAYERS)
/MAPFLD: The folder where the maps are stored (5_MAPS)
/SYMFLD: The folder where the symbol library is stored (4_SYMBOLS)
/MGUSER: The MapGuide Server login (Administrator)
/MGPASS: The MapGuide Server password (admin)
/MGSITE: The MapGuide Server Site URL (http://localhost/mapguide2009)
These switches can be called anything you want; they just store the variables passedin the command line interface.

184 ■ Chapter 5: Application Development
In order to use these switches, you have to be able to catch the arguments in the executable (forexample, string[] args), and then parse each argument in a variable:
Lesson: FDO, Viewer, and Studio APIs ■ 185
Now that you have all the command line arguments, you can load the DWG as demonstrated earlier:
This code is extremely simple and does not contain any error checking or stringvalidation.
Once compiled, the executable can now accept all the switches contained in the batch file. Forexample, the batch file may look like the following:
This batch file can be run using the Window Scheduled Tasks to keep the server up‐to‐date with thelatest DWG information.
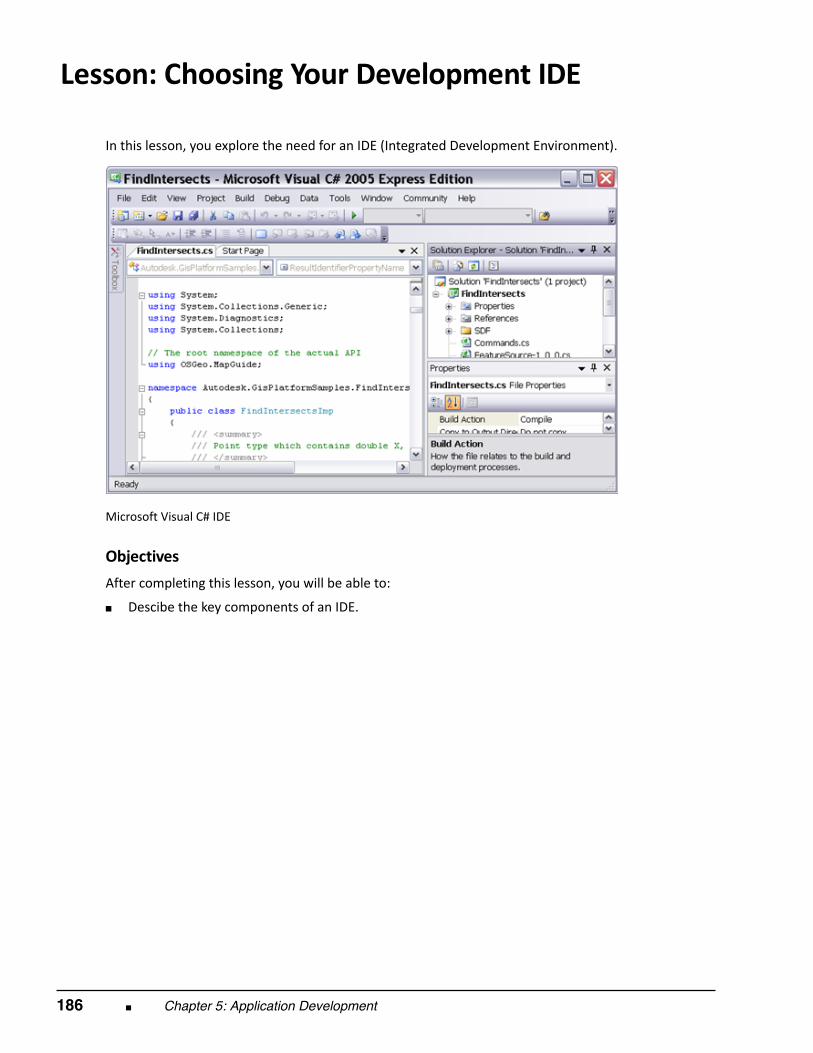
186 ■ Chapter 5: Application Development
Lesson: Choosing Your Development IDE
In this lesson, you explore the need for an IDE (Integrated Development Environment).
Microsoft Visual C# IDE
Objectives After completing this lesson, you will be able to:
■ Descibe the key components of an IDE.
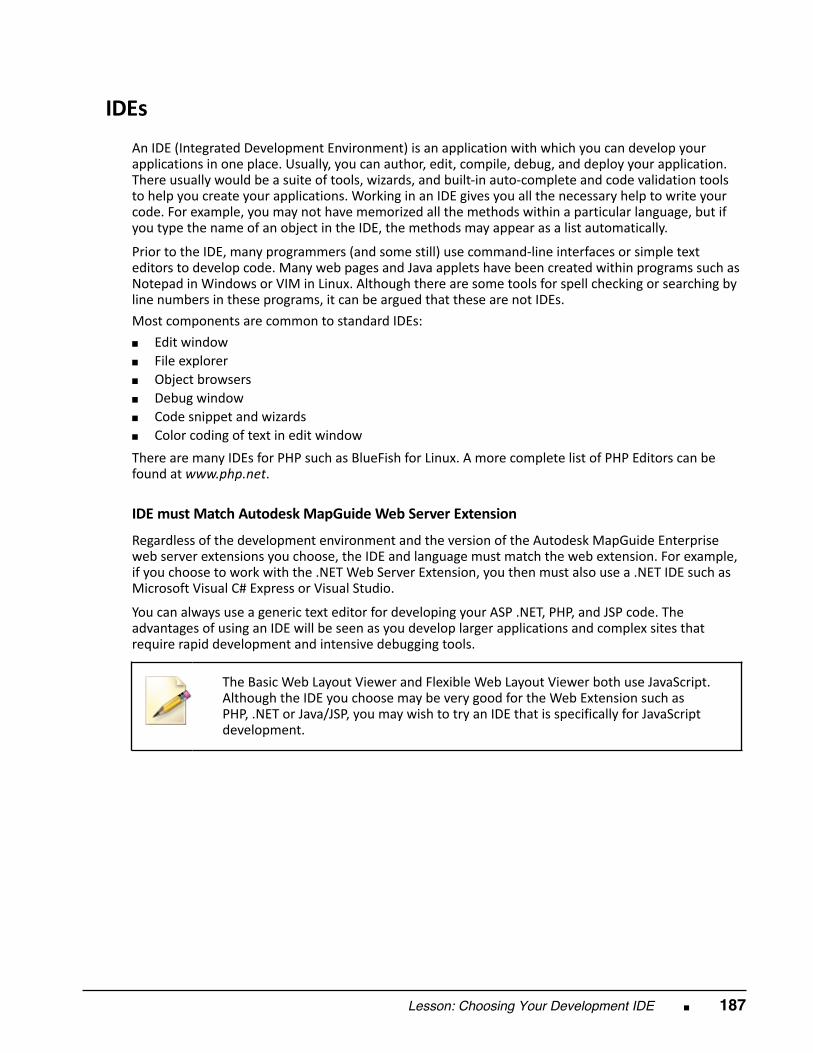
Lesson: Choosing Your Development IDE ■ 187
IDEs
An IDE (Integrated Development Environment) is an application with which you can develop yourapplications in one place. Usually, you can author, edit, compile, debug, and deploy your application.There usually would be a suite of tools, wizards, and built‐in auto‐complete and code validation toolsto help you create your applications. Working in an IDE gives you all the necessary help to write yourcode. For example, you may not have memorized all the methods within a particular language, but ifyou type the name of an object in the IDE, the methods may appear as a list automatically.
Prior to the IDE, many programmers (and some still) use command‐line interfaces or simple texteditors to develop code. Many web pages and Java applets have been created within programs such asNotepad in Windows or VIM in Linux. Although there are some tools for spell checking or searching byline numbers in these programs, it can be argued that these are not IDEs. Most components are common to standard IDEs: ■ Edit window■ File explorer■ Object browsers■ Debug window■ Code snippet and wizards■ Color coding of text in edit window There are many IDEs for PHP such as BlueFish for Linux. A more complete list of PHP Editors can befound at www.php.net. IDE must Match Autodesk MapGuide Web Server Extension Regardless of the development environment and the version of the Autodesk MapGuide Enterpriseweb server extensions you choose, the IDE and language must match the web extension. For example,if you choose to work with the .NET Web Server Extension, you then must also use a .NET IDE such asMicrosoft Visual C# Express or Visual Studio.
You can always use a generic text editor for developing your ASP .NET, PHP, and JSP code. Theadvantages of using an IDE will be seen as you develop larger applications and complex sites thatrequire rapid development and intensive debugging tools.
The Basic Web Layout Viewer and Flexible Web Layout Viewer both use JavaScript.
Although the IDE you choose may be very good for the Web Extension such asPHP, .NET or Java/JSP, you may wish to try an IDE that is specifically for JavaScriptdevelopment.
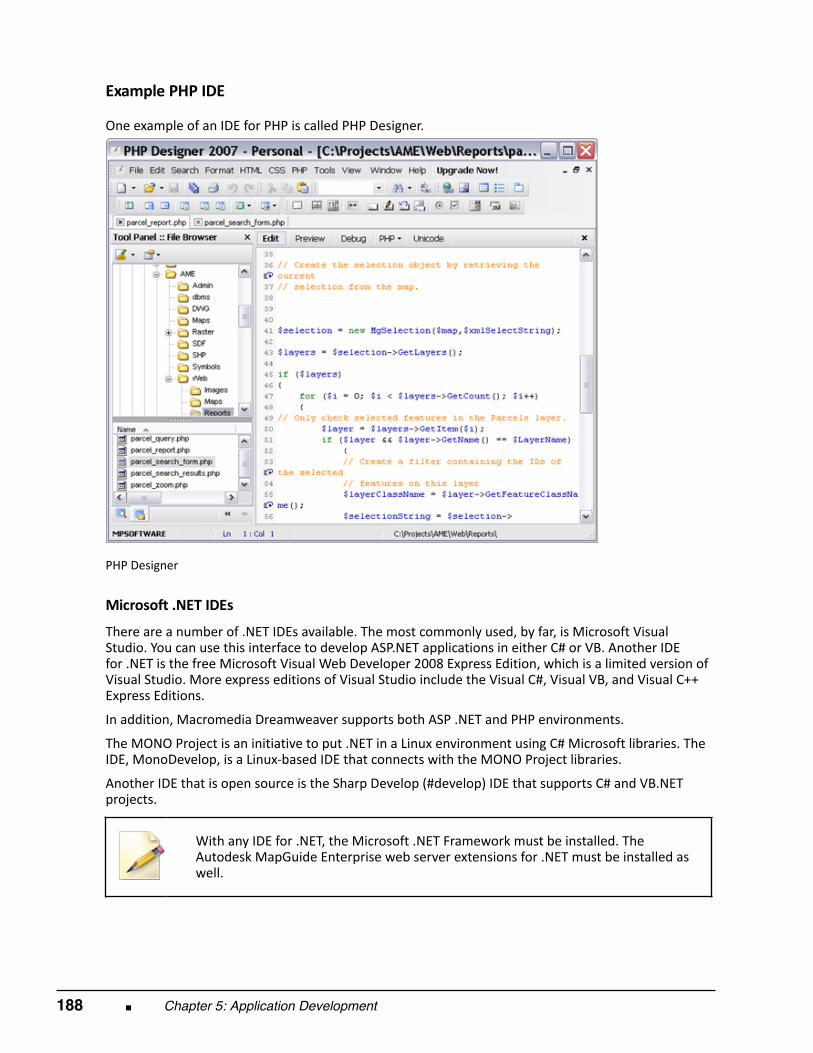
188 ■ Chapter 5: Application Development
Example PHP IDE
One example of an IDE for PHP is called PHP Designer.
PHP Designer
Microsoft .NET IDEs There are a number of .NET IDEs available. The most commonly used, by far, is Microsoft VisualStudio. You can use this interface to develop ASP.NET applications in either C# or VB. Another IDEfor .NET is the free Microsoft Visual Web Developer 2008 Express Edition, which is a limited version ofVisual Studio. More express editions of Visual Studio include the Visual C#, Visual VB, and Visual C++Express Editions.
In addition, Macromedia Dreamweaver supports both ASP .NET and PHP environments.
The MONO Project is an initiative to put .NET in a Linux environment using C# Microsoft libraries. TheIDE, MonoDevelop, is a Linux‐based IDE that connects with the MONO Project libraries.
Another IDE that is open source is the Sharp Develop (#develop) IDE that supports C# and VB.NETprojects.
With any IDE for .NET, the Microsoft .NET Framework must be installed. The
Autodesk MapGuide Enterprise web server extensions for .NET must be installed aswell.
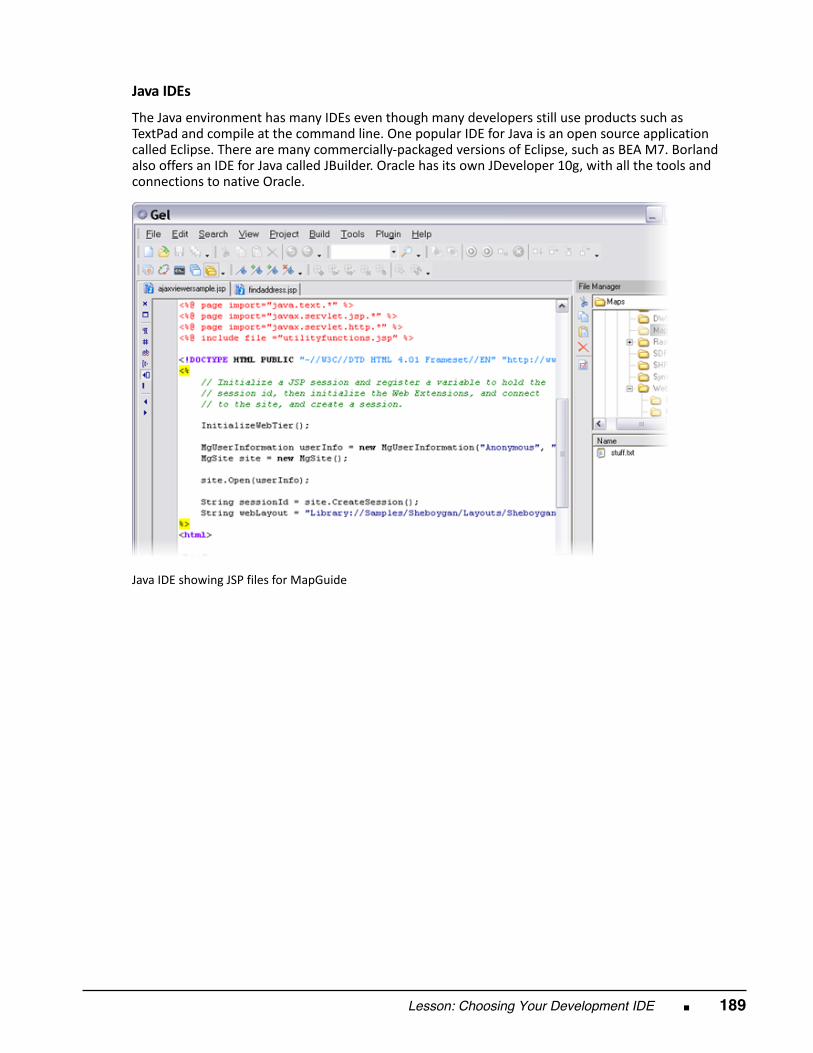
Lesson: Choosing Your Development IDE ■ 189
Java IDEs The Java environment has many IDEs even though many developers still use products such asTextPad and compile at the command line. One popular IDE for Java is an open source applicationcalled Eclipse. There are many commercially‐packaged versions of Eclipse, such as BEA M7. Borlandalso offers an IDE for Java called JBuilder. Oracle has its own JDeveloper 10g, with all the tools andconnections to native Oracle.
Java IDE showing JSP files for MapGuide

190 ■ Chapter 5: Application Development
Chapter Summary
Having completed this chapter, you can:
■ Decide how to choose the MapGuide Enterprise Web Server Extension and developmentlanguage.
■ Explain the purpose of the Web Server Extensions API.■ Explain the difference between the FDO, Viewer and MapGuide Studio API.■ List the advantages of using an Integrated Development Environment (IDE).
Chapter Overview ■ 191
Chapter
6
Report Development
In this chapter, you learn the basic components of PHP scripting using Autodesk MapGuide® EnterpriseWeb Server extensions. This chapter introduces you to techniques for launching reports using the WebLayouts from within MapGuide Studio.
Objectives After completing this chapter, you will be able to:
■ Develop an application for reporting with PHP using the Web Server Extensions API.
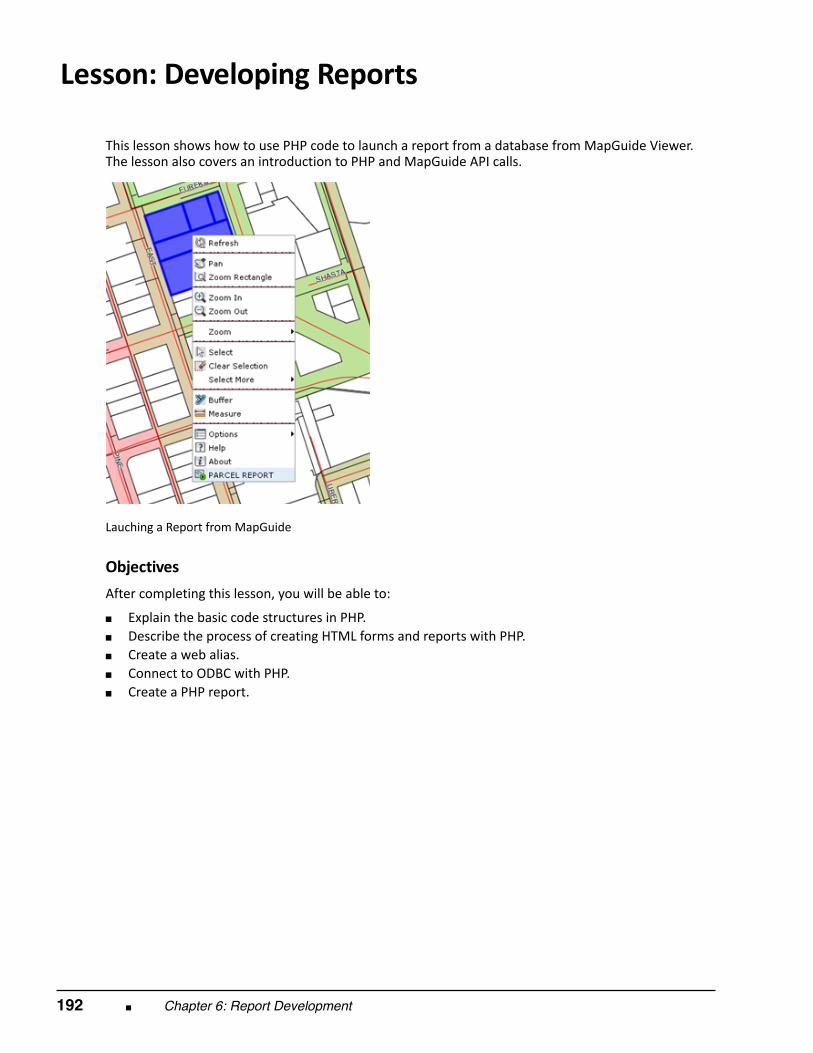
192 ■ Chapter 6: Report Development
Lesson: Developing Reports
This lesson shows how to use PHP code to launch a report from a database from MapGuide Viewer.The lesson also covers an introduction to PHP and MapGuide API calls.
Lauching a Report from MapGuide
Objectives After completing this lesson, you will be able to:
■ Explain the basic code structures in PHP.■ Describe the process of creating HTML forms and reports with PHP.■ Create a web alias.■ Connect to ODBC with PHP.■ Create a PHP report.

Lesson: Developing Reports ■ 193
PHP Basic Components
PHP is similar in style to JavaScript or C, so if you are already a developer or have done someprogramming previously, you will find PHP a simple language to learn. For new developers, thisoverview will be a good start to building advanced applications with PHP and Autodesk MapGuideEnterprise. Basic Syntax and Variables
PHP code is wrapped with the PHP tags. These tags delineate which code is going to process on theserver before being sent to the browser as standard HTML.
Even though the variables are defined when they are assigned a value, they are still defined distinctlyand not as a variant. For example, you cannot multiply two variables that are defined as strings. Thefollowing is list of types of variables: ■ String (any text values)■ Integer (discrete numbers like 1,2,3)■ Double (floating point decimal 23.332)■ Boolean (True or False, Yes or No, 1 or 0)■ Array (Ordered map of data within the variable – any type)■ Object (Type with Properties and Methods) For example, in the same order as variables above:
Variables always have the dollar sign ($) preceding the variable name.

194 ■ Chapter 6: Report Development
Loops and Conditions Looping is extremely important when working with arrays or lists. To loop over an object's collection isoften required in Autodesk MapGuide Enterprise. Some examples of three types of loops (do‐while, while, and for):
These are the conditions in PHP.
Condition
Result
$a == $b Equal
$a != $b Not equal
$a <> $b Not equal
$a < $b Less than
$a > $b Greater than
$a <= $b Less than or equal to
$a >= $b Greater than or equal to

Lesson: Developing Reports ■ 195
IF and Switch Conditions
When developing an application, you always need to use logical conditions such as the IF and Switchstatements. For example, if the user is a “guest,” then a variable would be set to show that. If the useris an “Administrator,” then the variable would be set to something else. This example shows IF andSwitch conditions:

196 ■ Chapter 6: Report Development
PHP Database Reports: ODBC Example
In this example, PHP is used to connect to a sample ODBC database in Windows.
The echo statements print the results to the HTML page after the PHP code is
processed on the server and the odbc_fetch_row() function iterates through theresulting record set.
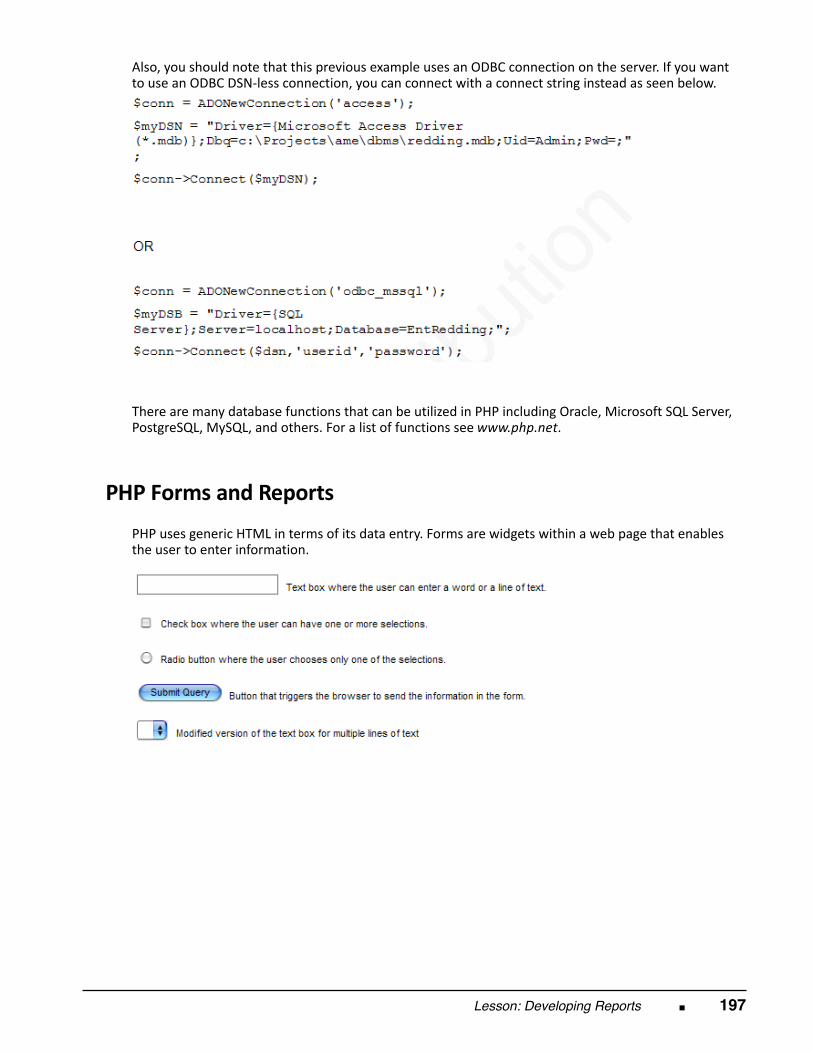
Lesson: Developing Reports ■ 197
Also, you should note that this previous example uses an ODBC connection on the server. If you wantto use an ODBC DSN‐less connection, you can connect with a connect string instead as seen below.
There are many database functions that can be utilized in PHP including Oracle, Microsoft SQL Server,PostgreSQL, MySQL, and others. For a list of functions see www.php.net.
PHP Forms and Reports
PHP uses generic HTML in terms of its data entry. Forms are widgets within a web page that enablesthe user to enter information.
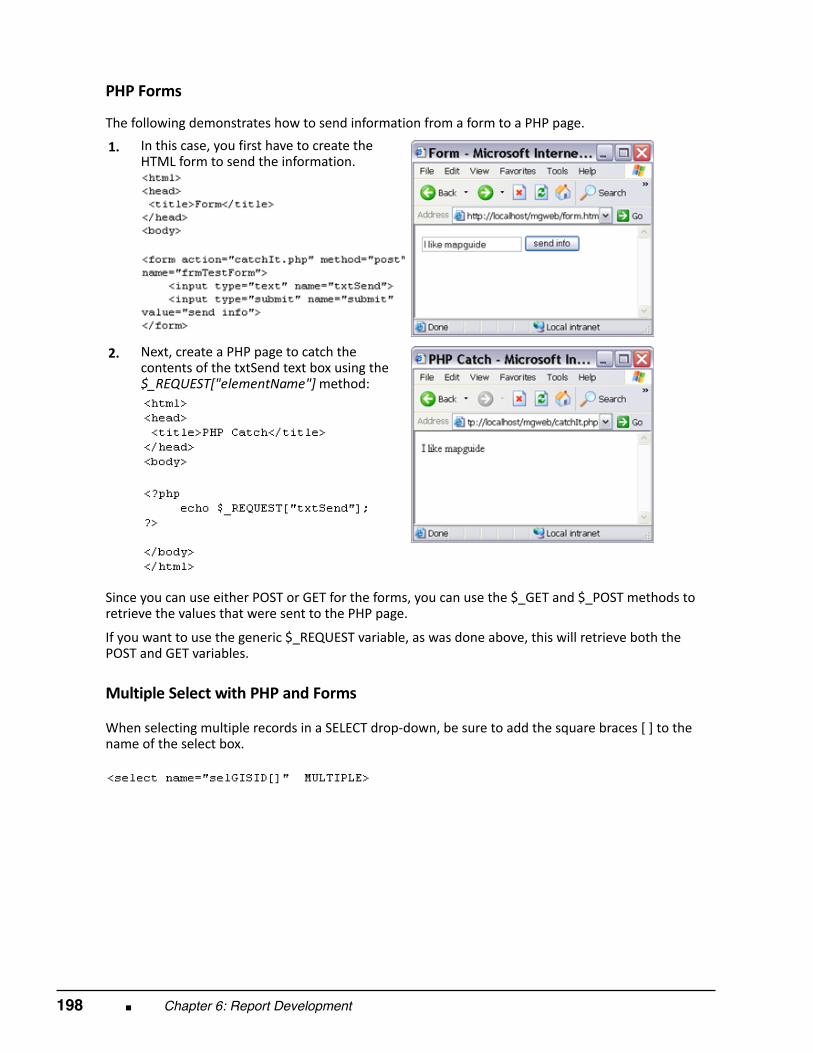
198 ■ Chapter 6: Report Development
PHP Forms
The following demonstrates how to send information from a form to a PHP page.
1. In this case, you first have to create theHTML form to send the information.
2.
Next, create a PHP page to catch thecontents of the txtSend text box using the$_REQUEST["elementName"] method:
Since you can use either POST or GET for the forms, you can use the $_GET and $_POST methods toretrieve the values that were sent to the PHP page.
If you want to use the generic $_REQUEST variable, as was done above, this will retrieve both thePOST and GET variables. Multiple Select with PHP and Forms
When selecting multiple records in a SELECT drop‐down, be sure to add the square braces [ ] to thename of the select box.

Lesson: Developing Reports ■ 199
Parsing the Multiple Select in PHP
Once the multiple select has been passed to the PHP page, you will need to loop over the selGISID andput commas between each ID. Note that the extra comma is removed from the end of the list.
Write PHP Reports In Autodesk MapGuide® Studio, if you are using the Basic Web Layouts, you can create an Invoke URLscript that would launch the URL with the associated XML variable containing the internal MapGuideIDs stored in XML passed as the $CurrentSelection parameter.
For example, the http://localhost/mgweb/reports/parseMapGuideXML.php can be launched fromthe shortcut menu if the user selected the parcels layer. This URL would receive the URL parameters ?OBJ_KEYS_XML=xml‐of‐selected‐features when the user clicked this button in the Autodesk MapGuideViewer.
Another method, used by server‐side API, available for the Basic Web Layout with AJAX andFlexible Web Layouts is the ability to send the user's MapGuide Session ID to the API to extract theproperties of the selected features. This method is entirely server‐side and requires no XML fromthe client. The pivotal API that enables this selection is the method of the MgSelection object calledGetSelectedFeatures().
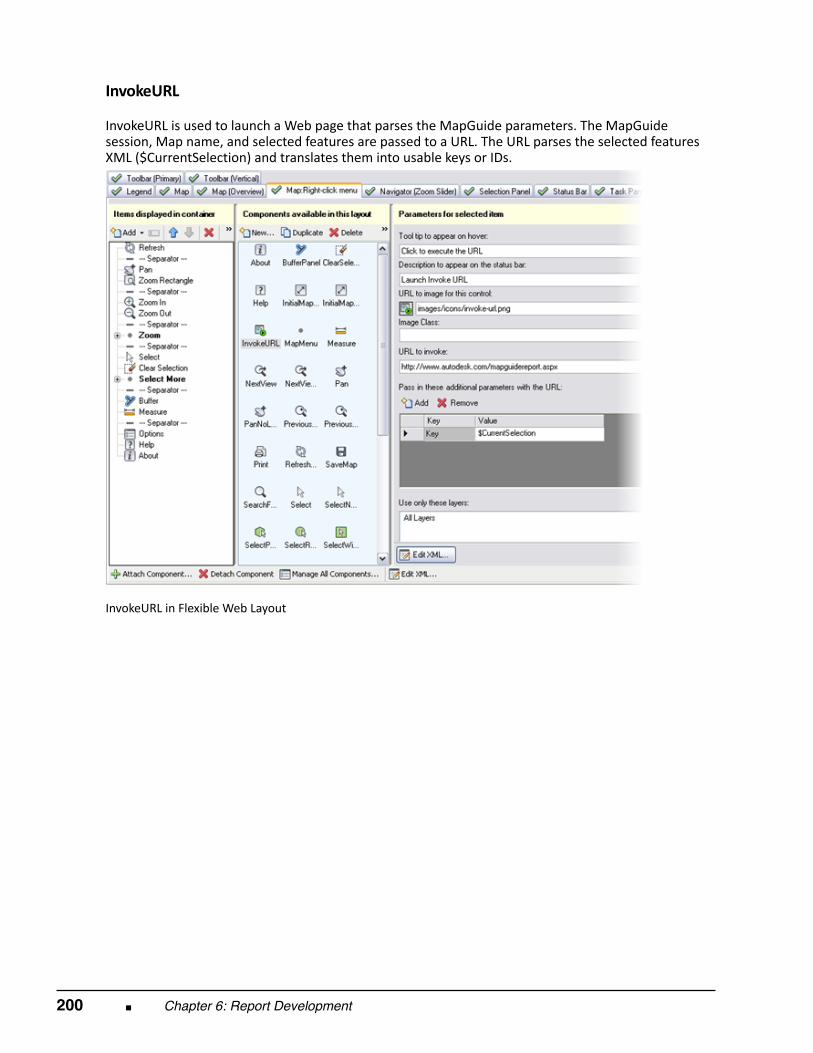
200 ■ Chapter 6: Report Development
InvokeURL
InvokeURL is used to launch a Web page that parses the MapGuide parameters. The MapGuidesession, Map name, and selected features are passed to a URL. The URL parses the selected featuresXML ($CurrentSelection) and translates them into usable keys or IDs.
InvokeURL in Flexible Web Layout
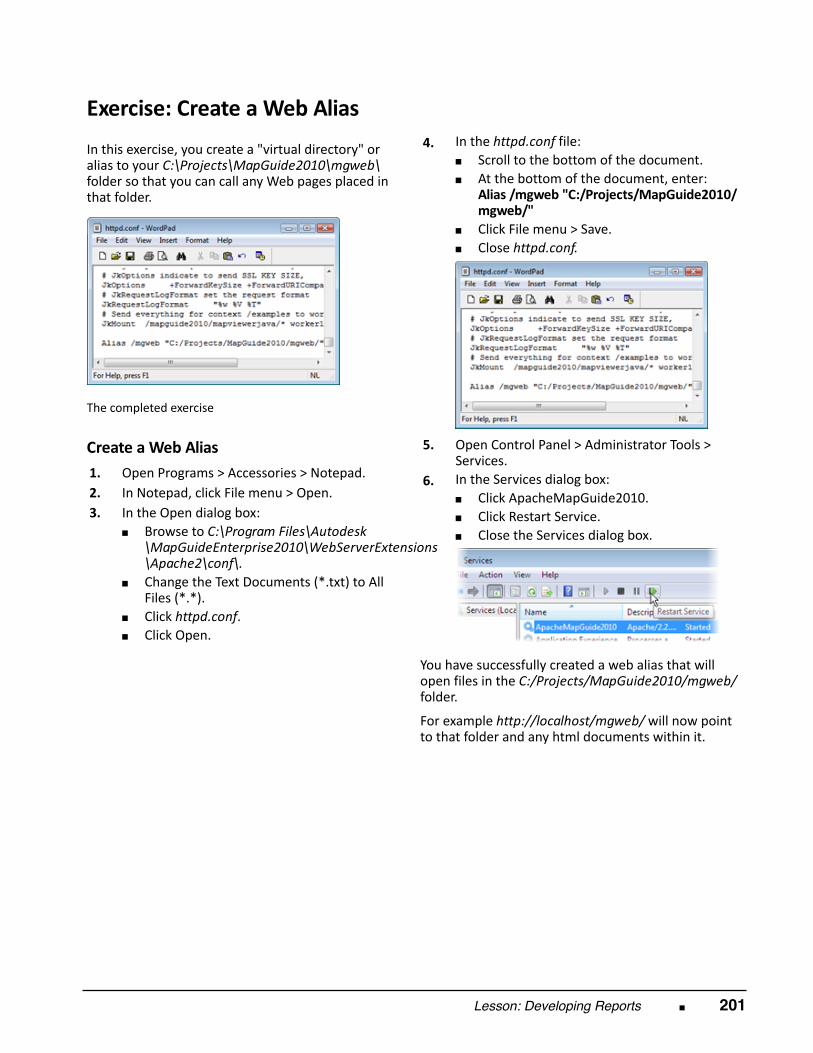
Lesson: Developing Reports ■ 201
Exercise: Create a Web Alias In this exercise, you create a "virtual directory" oralias to your C:\Projects\MapGuide2010\mgweb\folder so that you can call any Web pages placed inthat folder.
The completed exercise
Create a Web Alias 1.
Open Programs > Accessories > Notepad. 2.
In Notepad, click File menu > Open. 3.
In the Open dialog box:■ Browse to C:\Program Files\Autodesk
\MapGuideEnterprise2010\WebServerExtensions\Apache2\conf\.
■ Change the Text Documents (*.txt) to AllFiles (*.*).
■ Click httpd.conf.■ Click Open.
4.
In the httpd.conf file:■ Scroll to the bottom of the document.■ At the bottom of the document, enter:
Alias /mgweb "C:/Projects/MapGuide2010/mgweb/"
■ Click File menu > Save.■ Close httpd.conf.
5.
Open Control Panel > Administrator Tools >Services.
6.
In the Services dialog box:■ Click ApacheMapGuide2010.■ Click Restart Service.■ Close the Services dialog box.
You have successfully created a web alias that willopen files in the C:/Projects/MapGuide2010/mgweb/folder. For example http://localhost/mgweb/ will now pointto that folder and any html documents within it.
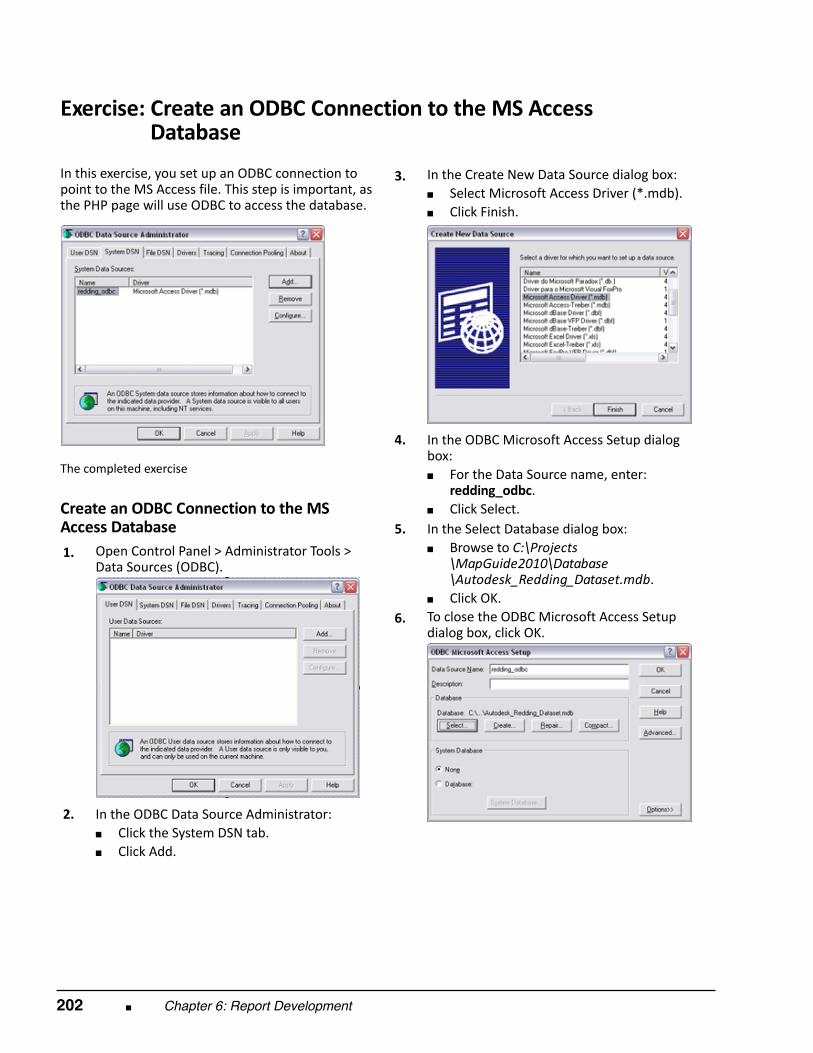
202 ■ Chapter 6: Report Development
Exercise: Create an ODBC Connection to the MS AccessExercise: Database In this exercise, you set up an ODBC connection topoint to the MS Access file. This step is important, asthe PHP page will use ODBC to access the database.
The completed exercise
Create an ODBC Connection to the MSAccess Database 1.
Open Control Panel > Administrator Tools >Data Sources (ODBC).
2.
In the ODBC Data Source Administrator:■ Click the System DSN tab.■ Click Add.
3.
In the Create New Data Source dialog box:■ Select Microsoft Access Driver (*.mdb).■ Click Finish.
4.
In the ODBC Microsoft Access Setup dialogbox:■ For the Data Source name, enter:
redding_odbc.■ Click Select.
5.
In the Select Database dialog box:■ Browse to C:\Projects
\MapGuide2010\Database\Autodesk_Redding_Dataset.mdb.
■ Click OK. 6.
To close the ODBC Microsoft Access Setupdialog box, click OK.
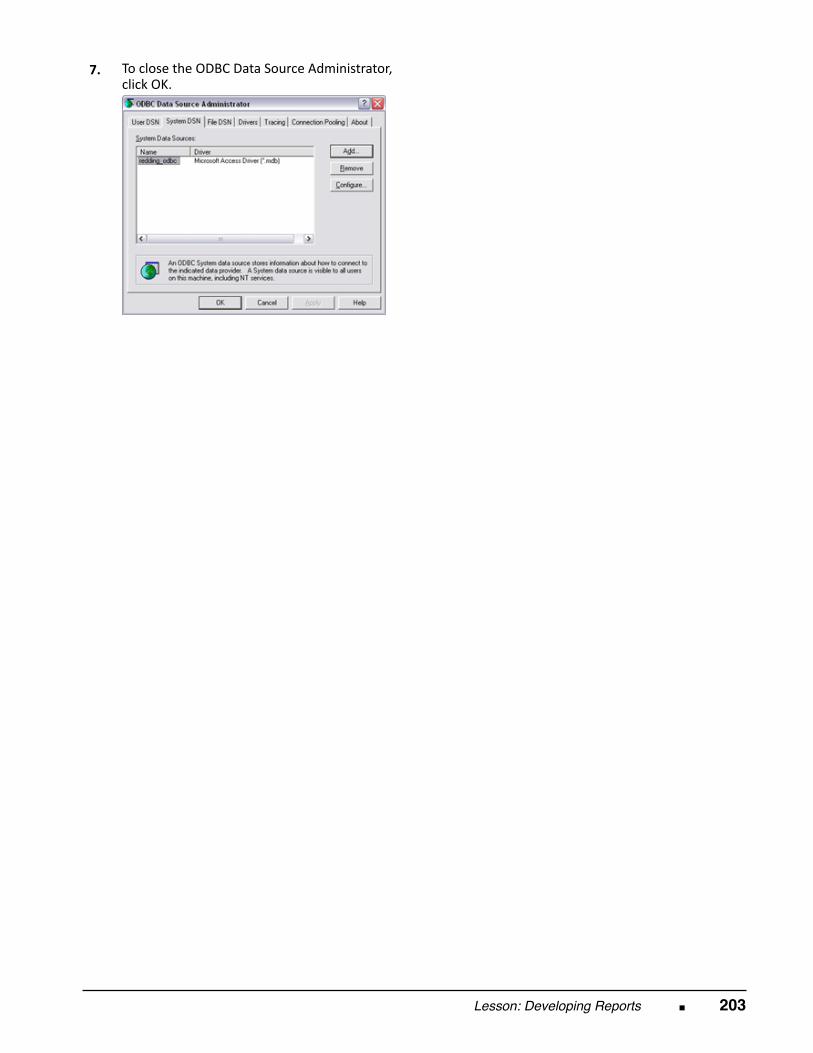
Lesson: Developing Reports ■ 203
7.
To close the ODBC Data Source Administrator,click OK.
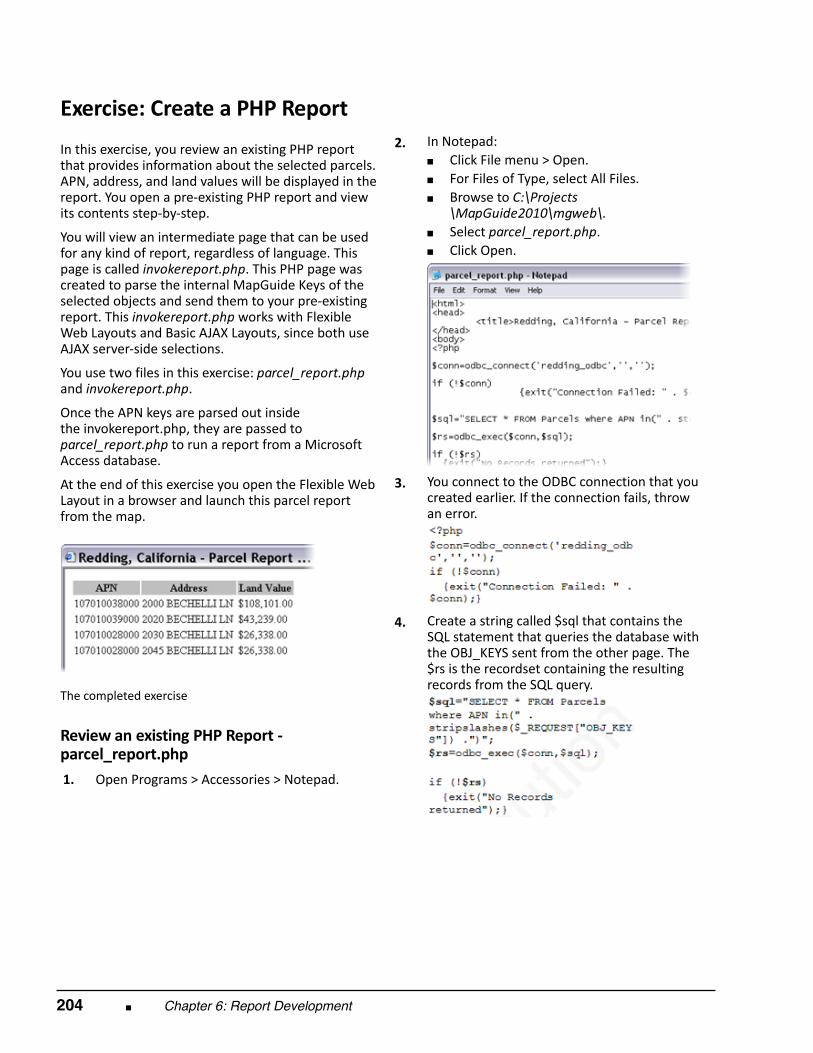
204 ■ Chapter 6: Report Development
Exercise: Create a PHP Report In this exercise, you review an existing PHP reportthat provides information about the selected parcels.APN, address, and land values will be displayed in thereport. You open a pre‐existing PHP report and viewits contents step‐by‐step. You will view an intermediate page that can be usedfor any kind of report, regardless of language. Thispage is called invokereport.php. This PHP page wascreated to parse the internal MapGuide Keys of theselected objects and send them to your pre‐existingreport. This invokereport.php works with FlexibleWeb Layouts and Basic AJAX Layouts, since both useAJAX server‐side selections. You use two files in this exercise: parcel_report.phpand invokereport.php. Once the APN keys are parsed out insidethe invokereport.php, they are passed toparcel_report.php to run a report from a MicrosoftAccess database. At the end of this exercise you open the Flexible WebLayout in a browser and launch this parcel reportfrom the map.
The completed exercise
Review an existing PHP Report ‐parcel_report.php 1.
Open Programs > Accessories > Notepad.
2.
In Notepad:■ Click File menu > Open.■ For Files of Type, select All Files.■ Browse to C:\Projects
\MapGuide2010\mgweb\.■ Select parcel_report.php.■ Click Open.
3.
You connect to the ODBC connection that youcreated earlier. If the connection fails, throwan error.
4.
Create a string called $sql that contains theSQL statement that queries the database withthe OBJ_KEYS sent from the other page. The$rs is the recordset containing the resultingrecords from the SQL query.
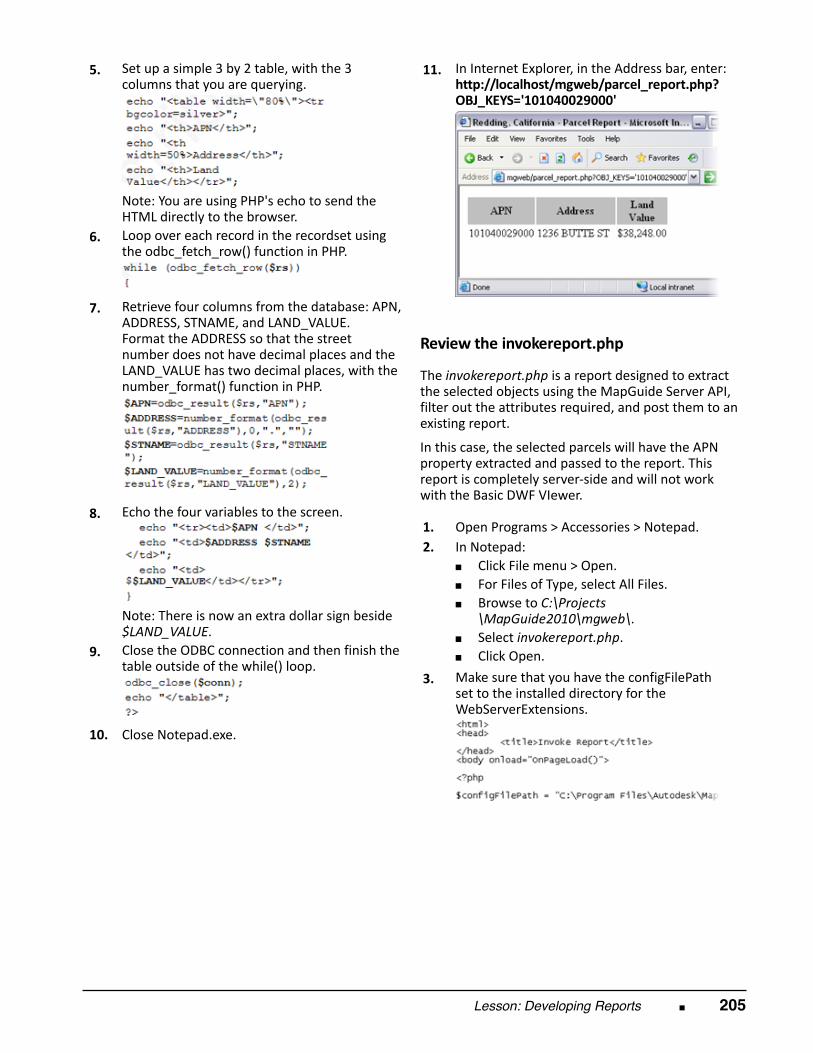
Lesson: Developing Reports ■ 205
5.
Set up a simple 3 by 2 table, with the 3columns that you are querying.
Note: You are using PHP's echo to send theHTML directly to the browser.
6.
Loop over each record in the recordset usingthe odbc_fetch_row() function in PHP.
7.
Retrieve four columns from the database: APN,ADDRESS, STNAME, and LAND_VALUE. Format the ADDRESS so that the streetnumber does not have decimal places and theLAND_VALUE has two decimal places, with thenumber_format() function in PHP.
8.
Echo the four variables to the screen.
Note: There is now an extra dollar sign beside$LAND_VALUE.
9.
Close the ODBC connection and then finish thetable outside of the while() loop.
10.
Close Notepad.exe.
11.
In Internet Explorer, in the Address bar, enter:http://localhost/mgweb/parcel_report.php?OBJ_KEYS='101040029000'
Review the invokereport.php The invokereport.php is a report designed to extractthe selected objects using the MapGuide Server API,filter out the attributes required, and post them to anexisting report. In this case, the selected parcels will have the APNproperty extracted and passed to the report. Thisreport is completely server‐side and will not workwith the Basic DWF VIewer. 1.
Open Programs > Accessories > Notepad. 2.
In Notepad:■ Click File menu > Open.■ For Files of Type, select All Files.■ Browse to C:\Projects
\MapGuide2010\mgweb\.■ Select invokereport.php.■ Click Open.
3. Make sure that you have the configFilePathset to the installed directory for theWebServerExtensions.
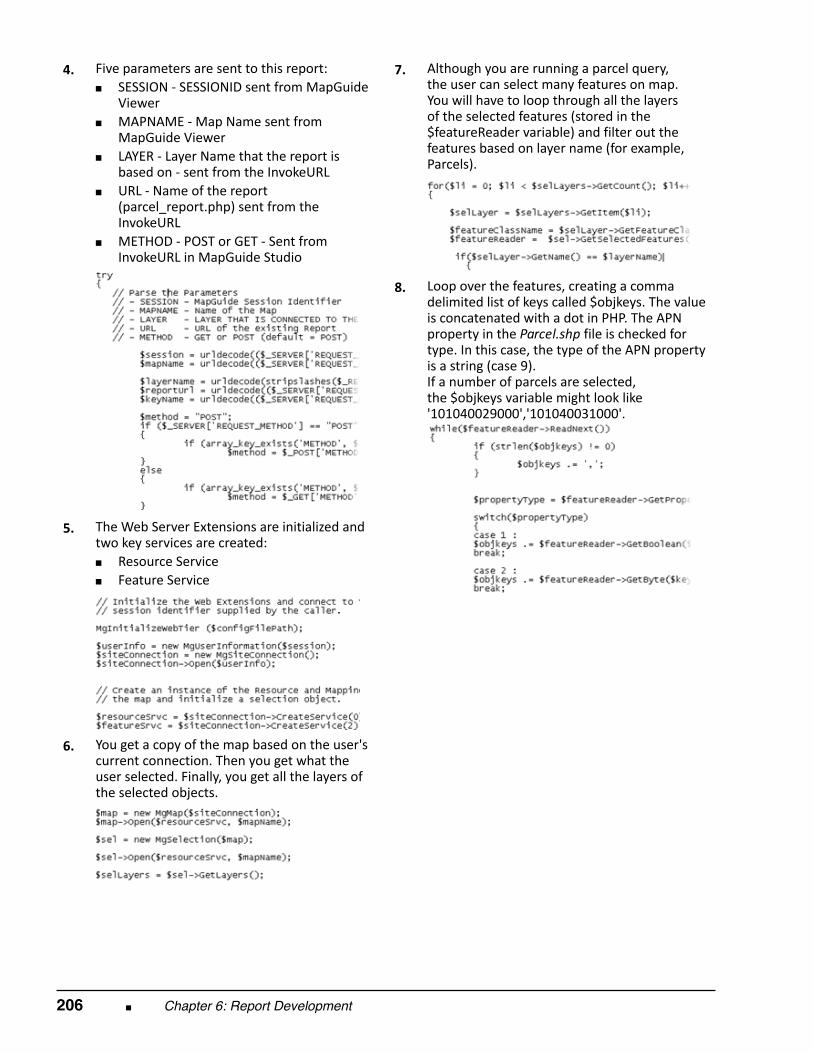
206 ■ Chapter 6: Report Development
4.
Five parameters are sent to this report:■ SESSION ‐ SESSIONID sent from MapGuide
Viewer■ MAPNAME ‐ Map Name sent from
MapGuide Viewer■ LAYER ‐ Layer Name that the report is
based on ‐ sent from the InvokeURL■ URL ‐ Name of the report
(parcel_report.php) sent from theInvokeURL
■ METHOD ‐ POST or GET ‐ Sent fromInvokeURL in MapGuide Studio
5.
The Web Server Extensions are initialized andtwo key services are created:■ Resource Service■ Feature Service
6.
You get a copy of the map based on the user'scurrent connection. Then you get what theuser selected. Finally, you get all the layers ofthe selected objects.
7.
Although you are running a parcel query,the user can select many features on map.You will have to loop through all the layersof the selected features (stored in the$featureReader variable) and filter out thefeatures based on layer name (for example,Parcels).
8.
Loop over the features, creating a commadelimited list of keys called $objkeys. The valueis concatenated with a dot in PHP. The APNproperty in the Parcel.shp file is checked fortype. In this case, the type of the APN propertyis a string (case 9). If a number of parcels are selected,the $objkeys variable might look like'101040029000','101040031000'.
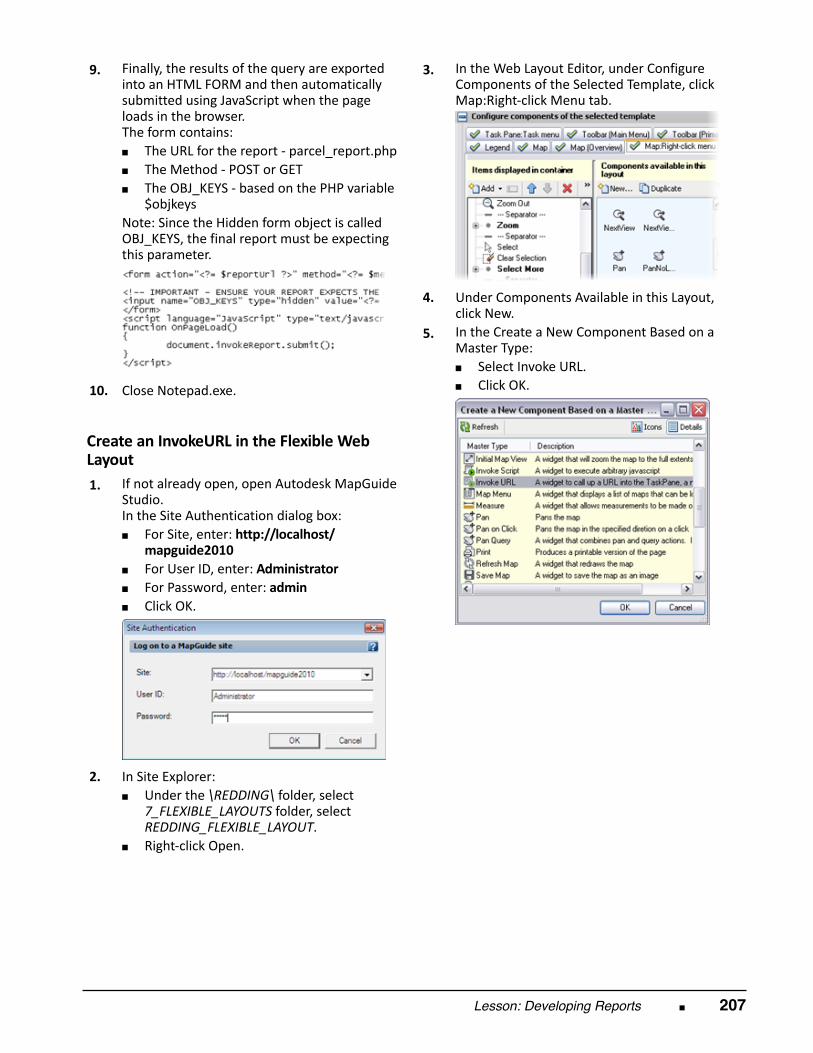
Lesson: Developing Reports ■ 207
9.
Finally, the results of the query are exportedinto an HTML FORM and then automaticallysubmitted using JavaScript when the pageloads in the browser. The form contains:■ The URL for the report ‐ parcel_report.php■ The Method ‐ POST or GET■ The OBJ_KEYS ‐ based on the PHP variable
$objkeys Note: Since the Hidden form object is calledOBJ_KEYS, the final report must be expectingthis parameter.
10.
Close Notepad.exe.
Create an InvokeURL in the Flexible WebLayout 1.
If not already open, open Autodesk MapGuideStudio. In the Site Authentication dialog box:■ For Site, enter: http://localhost/
mapguide2010■ For User ID, enter: Administrator■ For Password, enter: admin■ Click OK.
2.
In Site Explorer:■ Under the \REDDING\ folder, select
7_FLEXIBLE_LAYOUTS folder, selectREDDING_FLEXIBLE_LAYOUT.
■ Right‐click Open.
3.
In the Web Layout Editor, under ConfigureComponents of the Selected Template, clickMap:Right‐click Menu tab.
4.
Under Components Available in this Layout,click New.
5.
In the Create a New Component Based on aMaster Type:■ Select Invoke URL.■ Click OK.
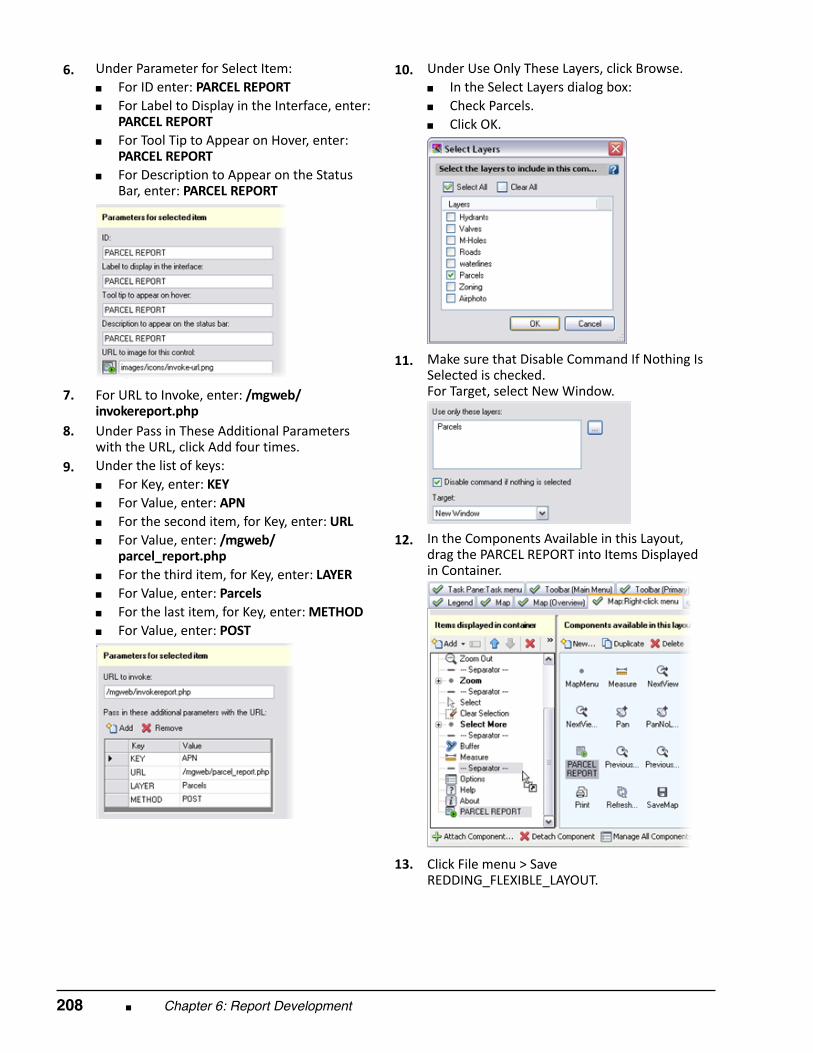
208 ■ Chapter 6: Report Development
6.
Under Parameter for Select Item:■ For ID enter: PARCEL REPORT■ For Label to Display in the Interface, enter:
PARCEL REPORT■ For Tool Tip to Appear on Hover, enter:
PARCEL REPORT■ For Description to Appear on the Status
Bar, enter: PARCEL REPORT
7.
For URL to Invoke, enter: /mgweb/invokereport.php
8.
Under Pass in These Additional Parameterswith the URL, click Add four times.
9.
Under the list of keys:■ For Key, enter: KEY■ For Value, enter: APN■ For the second item, for Key, enter: URL■ For Value, enter: /mgweb/
parcel_report.php■ For the third item, for Key, enter: LAYER■ For Value, enter: Parcels■ For the last item, for Key, enter: METHOD■ For Value, enter: POST
10.
Under Use Only These Layers, click Browse.■ In the Select Layers dialog box:■ Check Parcels.■ Click OK.
11.
Make sure that Disable Command If Nothing IsSelected is checked. For Target, select New Window.
12.
In the Components Available in this Layout,drag the PARCEL REPORT into Items Displayedin Container.
13.
Click File menu > SaveREDDING_FLEXIBLE_LAYOUT.
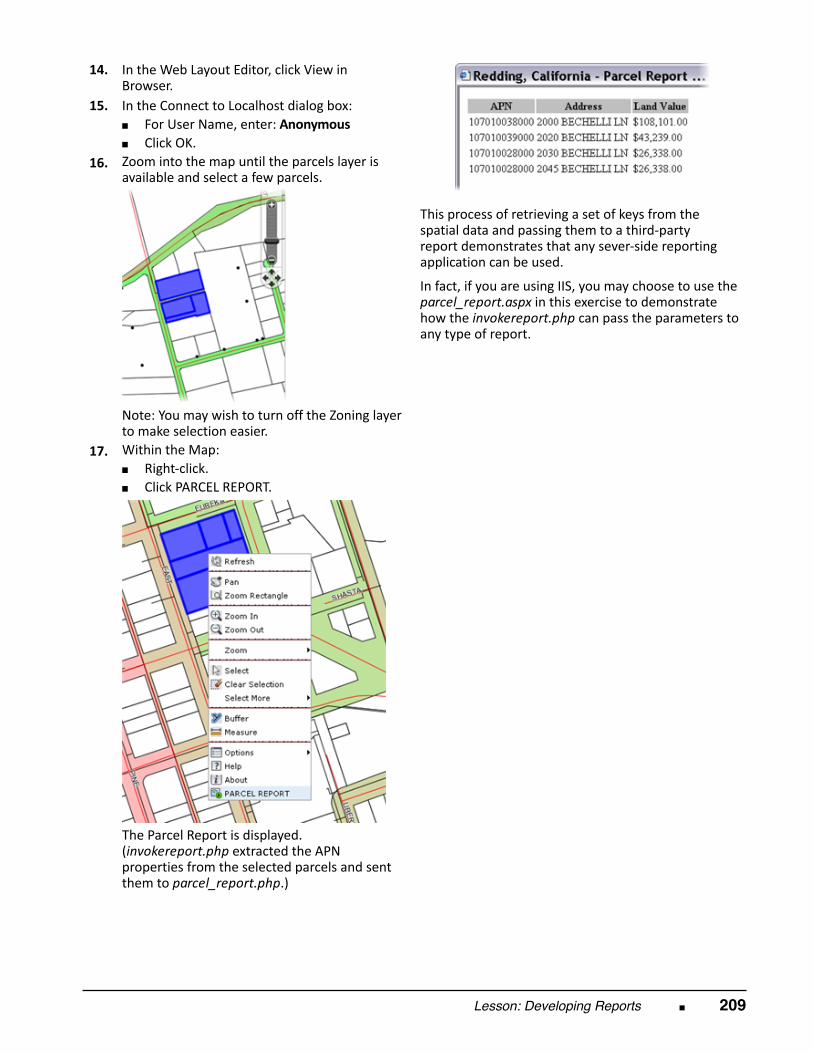
Lesson: Developing Reports ■ 209
14.
In the Web Layout Editor, click View inBrowser.
15.
In the Connect to Localhost dialog box:■ For User Name, enter: Anonymous■ Click OK.
16.
Zoom into the map until the parcels layer isavailable and select a few parcels.
Note: You may wish to turn off the Zoning layerto make selection easier.
17.
Within the Map:■ Right‐click.■ Click PARCEL REPORT.
The Parcel Report is displayed.(invokereport.php extracted the APNproperties from the selected parcels and sentthem to parcel_report.php.)
This process of retrieving a set of keys from thespatial data and passing them to a third‐partyreport demonstrates that any sever‐side reportingapplication can be used. In fact, if you are using IIS, you may choose to use theparcel_report.aspx in this exercise to demonstratehow the invokereport.php can pass the parameters toany type of report.

210 ■ Chapter 6: Report Development
Chapter Summary
Having completed this chapter, you can:
■ Develop an application for reporting with PHP using the Web Server Extensions API.
Chapter Overview ■ 211
Chapter
7
Scalability
In this chapter, you learn three methods to increase the performance of your MapGuide site.Serverperformance is introduced and youlearn to differentiate between a web farm and a customizedAutodesk MapGuide® Enterprise implementation for performance. You also learn how to use AutodeskMapGuide® Studio to improve performance of the maps themselves. Finally, you learn how to managethe data to optimize the searching, rendering, and querying of spatial and nonspatial data.
Objectives After completing this chapter, you will be able to:
■ Describe the MapGuide Server performance tools.■ Use MapGuide Studio to increase performance of the maps and layers.■ Descibe how to structure spatial and non‐spatial data to increase performance in MapGuide.

212 ■ Chapter 7: Scalability
Lesson: Server Performance
In this lesson, you learn how to improve performance of the Autodesk MapGuide Enterprise Server.The performance of Autodesk MapGuide Enterprise can be affected by the server‐side configuration.
Objectives After completing this lesson, you will be able to:
■ Explain how to configure pragmatic and site/support load balancing.■ Describe Techniques for increasing MapGuide Server performance.
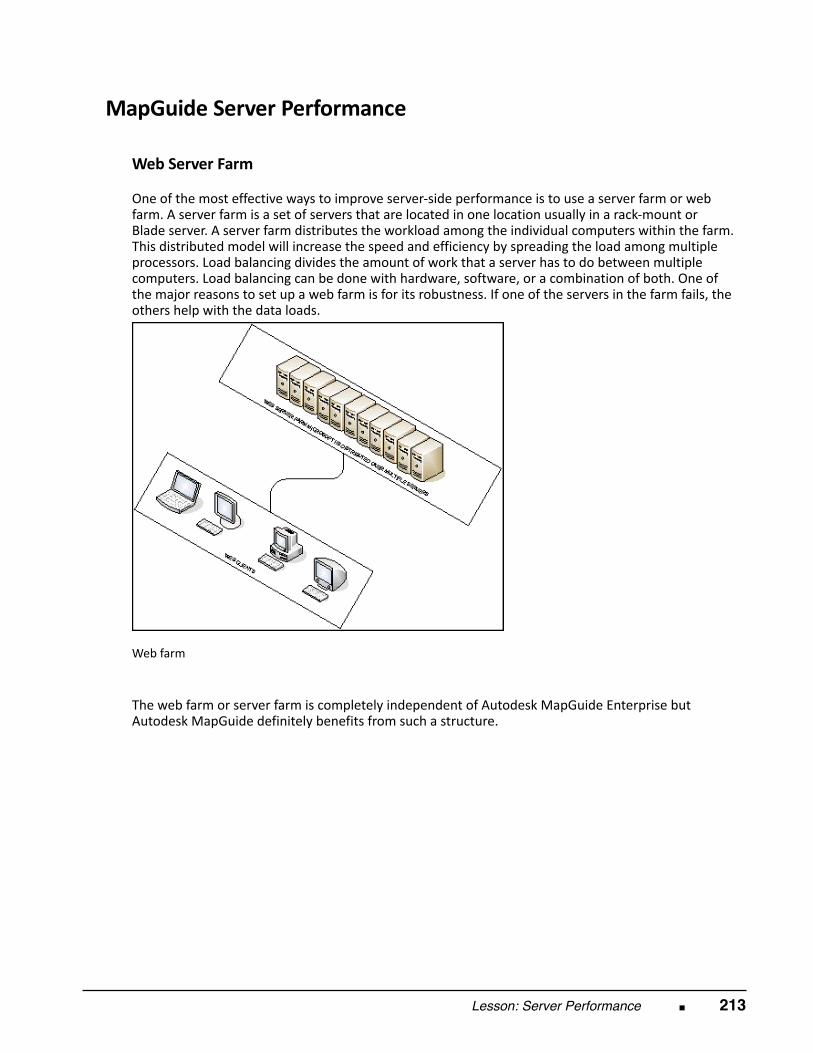
Lesson: Server Performance ■ 213
MapGuide Server Performance
Web Server Farm
One of the most effective ways to improve server‐side performance is to use a server farm or webfarm. A server farm is a set of servers that are located in one location usually in a rack‐mount orBlade server. A server farm distributes the workload among the individual computers within the farm.This distributed model will increase the speed and efficiency by spreading the load among multipleprocessors. Load balancing divides the amount of work that a server has to do between multiplecomputers. Load balancing can be done with hardware, software, or a combination of both. One ofthe major reasons to set up a web farm is for its robustness. If one of the servers in the farm fails, theothers help with the data loads.
Web farm
The web farm or server farm is completely independent of Autodesk MapGuide Enterprise butAutodesk MapGuide definitely benefits from such a structure.
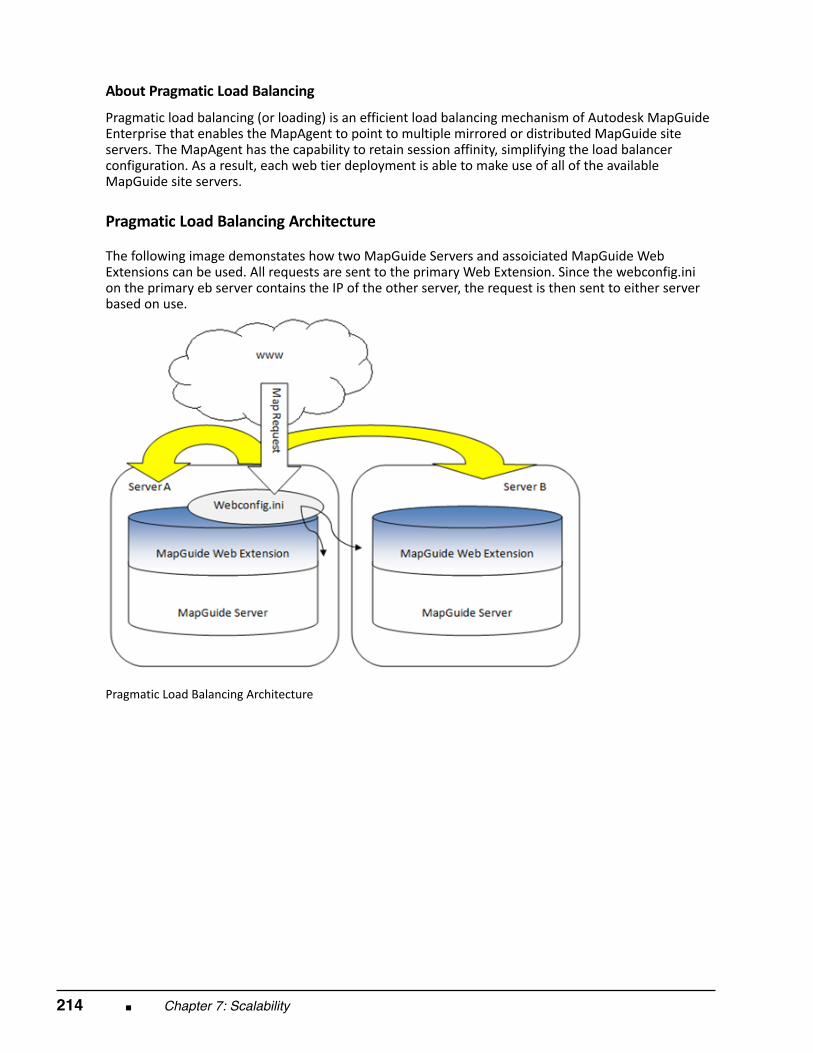
214 ■ Chapter 7: Scalability
About Pragmatic Load Balancing Pragmatic load balancing (or loading) is an efficient load balancing mechanism of Autodesk MapGuideEnterprise that enables the MapAgent to point to multiple mirrored or distributed MapGuide siteservers. The MapAgent has the capability to retain session affinity, simplifying the load balancerconfiguration. As a result, each web tier deployment is able to make use of all of the availableMapGuide site servers. Pragmatic Load Balancing Architecture
The following image demonstates how two MapGuide Servers and assoiciated MapGuide WebExtensions can be used. All requests are sent to the primary Web Extension. Since the webconfig.inion the primary eb server contains the IP of the other server, the request is then sent to either serverbased on use.
Pragmatic Load Balancing Architecture
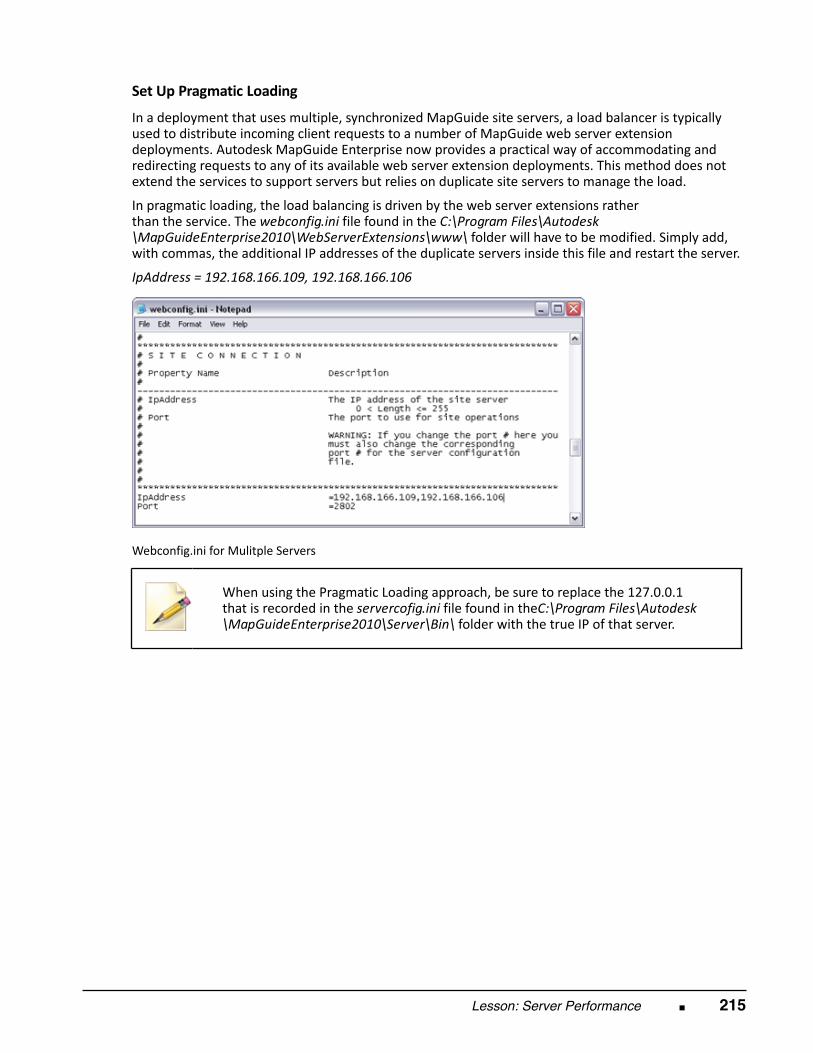
Lesson: Server Performance ■ 215
Set Up Pragmatic Loading In a deployment that uses multiple, synchronized MapGuide site servers, a load balancer is typicallyused to distribute incoming client requests to a number of MapGuide web server extensiondeployments. Autodesk MapGuide Enterprise now provides a practical way of accommodating andredirecting requests to any of its available web server extension deployments. This method does notextend the services to support servers but relies on duplicate site servers to manage the load.
In pragmatic loading, the load balancing is driven by the web server extensions ratherthan the service. The webconfig.ini file found in the C:\Program Files\Autodesk\MapGuideEnterprise2010\WebServerExtensions\www\ folder will have to be modified. Simply add,with commas, the additional IP addresses of the duplicate servers inside this file and restart the server.
IpAddress = 192.168.166.109, 192.168.166.106
Webconfig.ini for Mulitple Servers
When using the Pragmatic Loading approach, be sure to replace the 127.0.0.1
that is recorded in the servercofig.ini file found in theC:\Program Files\Autodesk\MapGuideEnterprise2010\Server\Bin\ folder with the true IP of that server.
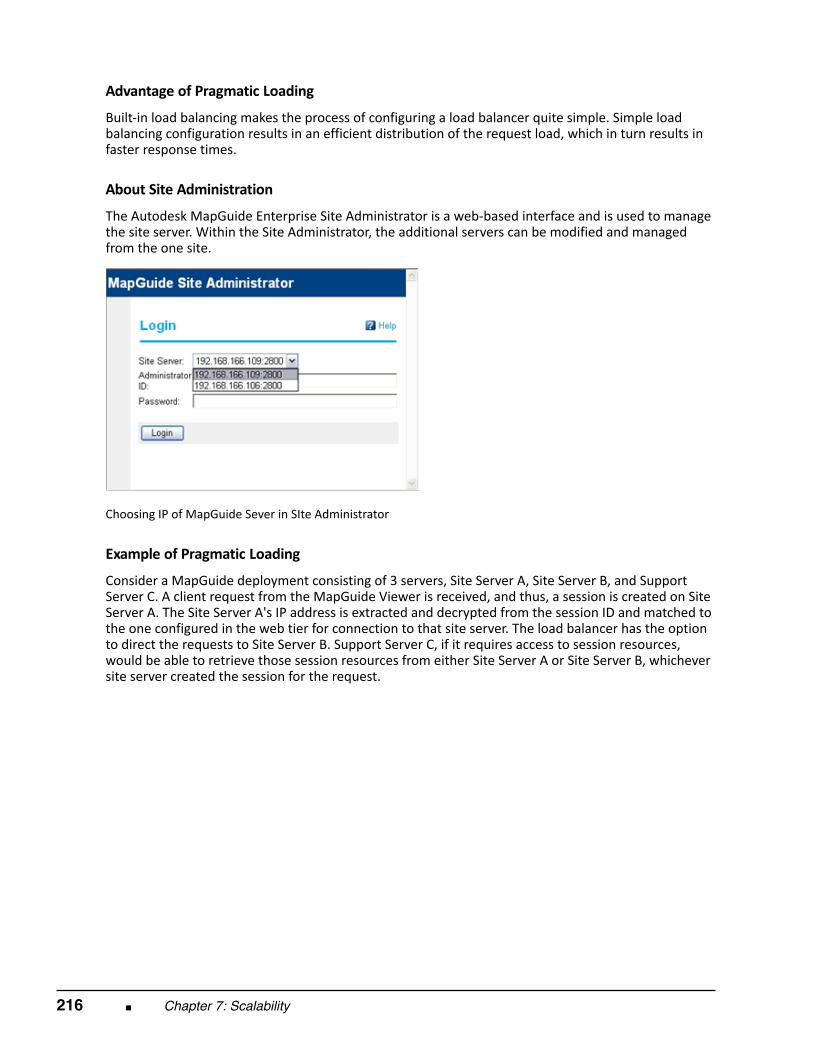
216 ■ Chapter 7: Scalability
Advantage of Pragmatic Loading Built‐in load balancing makes the process of configuring a load balancer quite simple. Simple loadbalancing configuration results in an efficient distribution of the request load, which in turn results infaster response times.
About Site Administration The Autodesk MapGuide Enterprise Site Administrator is a web‐based interface and is used to managethe site server. Within the Site Administrator, the additional servers can be modified and managedfrom the one site.
Choosing IP of MapGuide Sever in SIte Administrator
Example of Pragmatic Loading Consider a MapGuide deployment consisting of 3 servers, Site Server A, Site Server B, and SupportServer C. A client request from the MapGuide Viewer is received, and thus, a session is created on SiteServer A. The Site Server A's IP address is extracted and decrypted from the session ID and matched tothe one configured in the web tier for connection to that site server. The load balancer has the optionto direct the requests to Site Server B. Support Server C, if it requires access to session resources,would be able to retrieve those session resources from either Site Server A or Site Server B, whicheversite server created the session for the request.
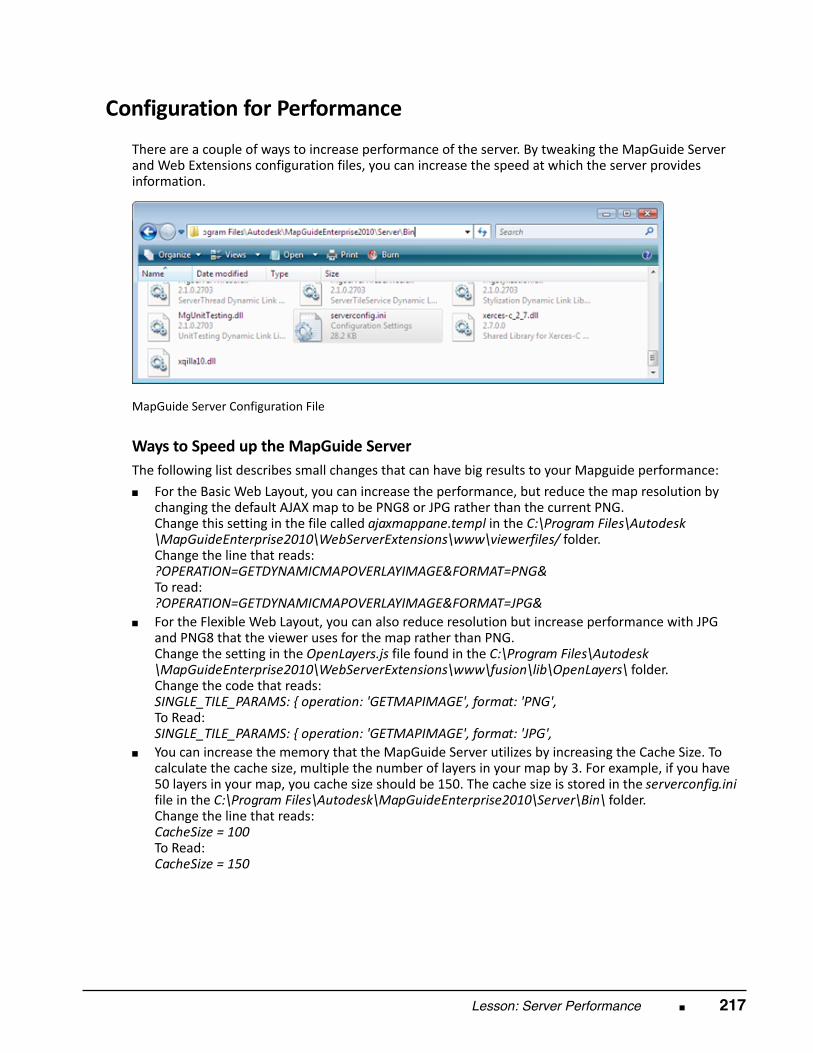
Lesson: Server Performance ■ 217
Configuration for Performance
There are a couple of ways to increase performance of the server. By tweaking the MapGuide Serverand Web Extensions configuration files, you can increase the speed at which the server providesinformation.
MapGuide Server Configuration File
Ways to Speed up the MapGuide Server The following list describes small changes that can have big results to your Mapguide performance: ■ For the Basic Web Layout, you can increase the performance, but reduce the map resolution by
changing the default AJAX map to be PNG8 or JPG rather than the current PNG.Change this setting in the file called ajaxmappane.templ in the C:\Program Files\Autodesk\MapGuideEnterprise2010\WebServerExtensions\www\viewerfiles/ folder.Change the line that reads:?OPERATION=GETDYNAMICMAPOVERLAYIMAGE&FORMAT=PNG&To read:?OPERATION=GETDYNAMICMAPOVERLAYIMAGE&FORMAT=JPG&
■ For the Flexible Web Layout, you can also reduce resolution but increase performance with JPGand PNG8 that the viewer uses for the map rather than PNG.Change the setting in the OpenLayers.js file found in the C:\Program Files\Autodesk\MapGuideEnterprise2010\WebServerExtensions\www\fusion\lib\OpenLayers\ folder.Change the code that reads:SINGLE_TILE_PARAMS: { operation: 'GETMAPIMAGE', format: 'PNG',To Read:SINGLE_TILE_PARAMS: { operation: 'GETMAPIMAGE', format: 'JPG',
■ You can increase the memory that the MapGuide Server utilizes by increasing the Cache Size. Tocalculate the cache size, multiple the number of layers in your map by 3. For example, if you have50 layers in your map, you cache size should be 150. The cache size is stored in the serverconfig.inifile in the C:\Program Files\Autodesk\MapGuideEnterprise2010\Server\Bin\ folder.Change the line that reads:CacheSize = 100To Read:CacheSize = 150

218 ■ Chapter 7: Scalability
■ You can increase the data connection pooling, which enables MapGuide Server to use existingconnections to feature sources in memory, which increases performance. This technique may locksome feature sources and may require a re‐start of the server to unlock the files during data loadsor package creation.Within the serverconfig.ini file, change the lines that read:DataConnectionPoolSize = 200DataConnectionPoolExcludedProviders =OSGeo.SDF,OSGeo.SHPDataConnectionPoolEnabled = 0To read:DataConnectionPoolSize = 200DataConnectionPoolExcludedProviders = noneDataConnectionPoolEnabled = 1The ConnectionPoolSize should be the same number of Feature Sources you have on the server. Donot Exclude and providers so that all connections, including SDF and SHP are pooled.
These techniques are to be used cautiously, as they may affect the resolution and/or daily update ofyour mapping information.
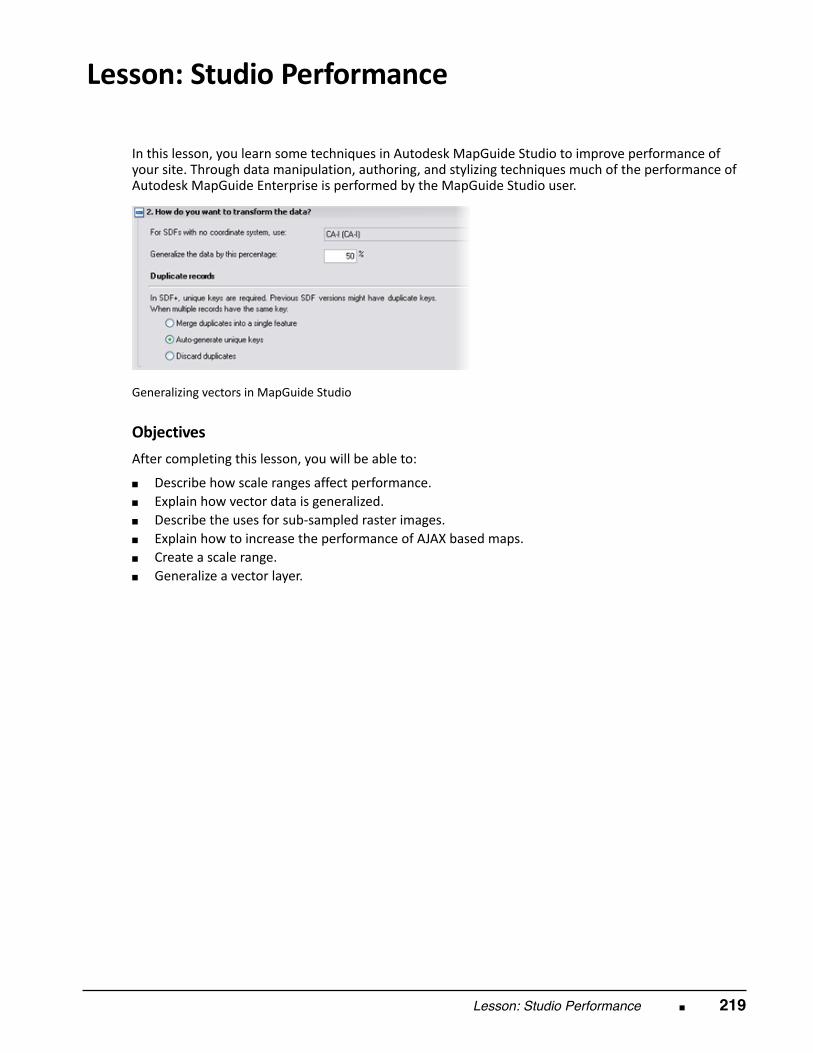
Lesson: Studio Performance ■ 219
Lesson: Studio Performance
In this lesson, you learn some techniques in Autodesk MapGuide Studio to improve performance ofyour site. Through data manipulation, authoring, and stylizing techniques much of the performance ofAutodesk MapGuide Enterprise is performed by the MapGuide Studio user.
Generalizing vectors in MapGuide Studio
Objectives After completing this lesson, you will be able to:
■ Describe how scale ranges affect performance.■ Explain how vector data is generalized.■ Describe the uses for sub‐sampled raster images.■ Explain how to increase the performance of AJAX based maps.■ Create a scale range.■ Generalize a vector layer.
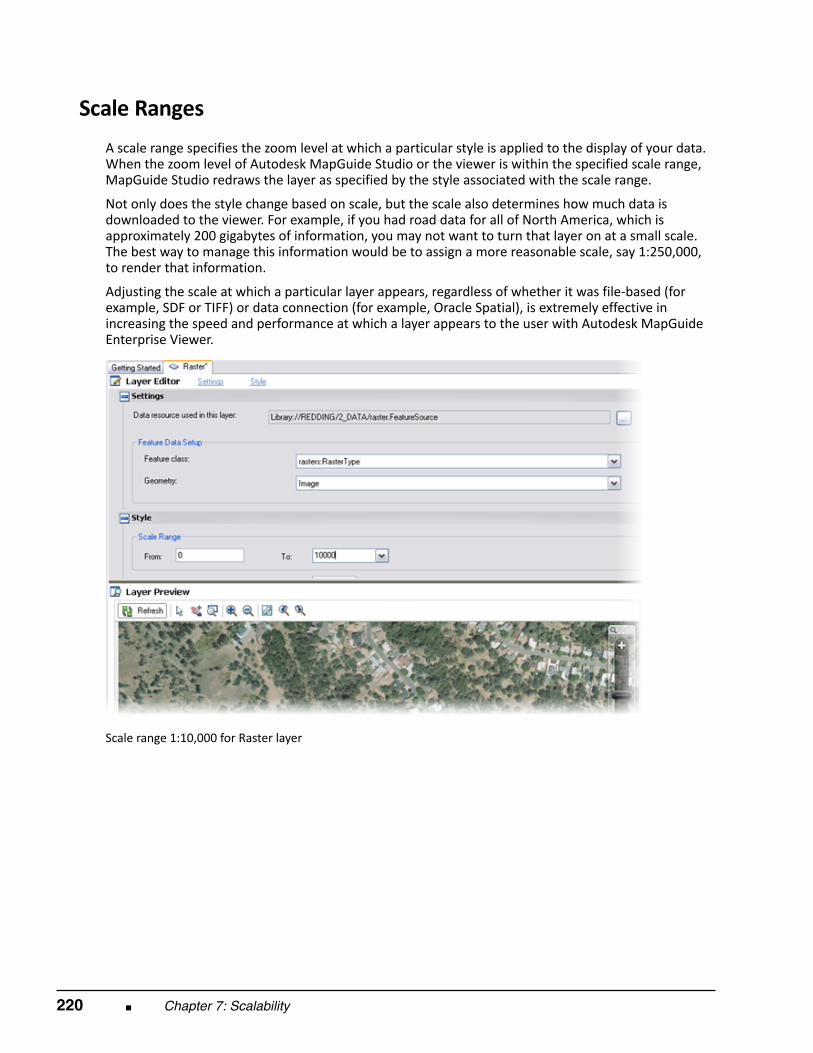
220 ■ Chapter 7: Scalability
Scale Ranges
A scale range specifies the zoom level at which a particular style is applied to the display of your data.When the zoom level of Autodesk MapGuide Studio or the viewer is within the specified scale range,MapGuide Studio redraws the layer as specified by the style associated with the scale range.
Not only does the style change based on scale, but the scale also determines how much data isdownloaded to the viewer. For example, if you had road data for all of North America, which isapproximately 200 gigabytes of information, you may not want to turn that layer on at a small scale.The best way to manage this information would be to assign a more reasonable scale, say 1:250,000,to render that information.
Adjusting the scale at which a particular layer appears, regardless of whether it was file‐based (forexample, SDF or TIFF) or data connection (for example, Oracle Spatial), is extremely effective inincreasing the speed and performance at which a layer appears to the user with Autodesk MapGuideEnterprise Viewer.
Scale range 1:10,000 for Raster layer
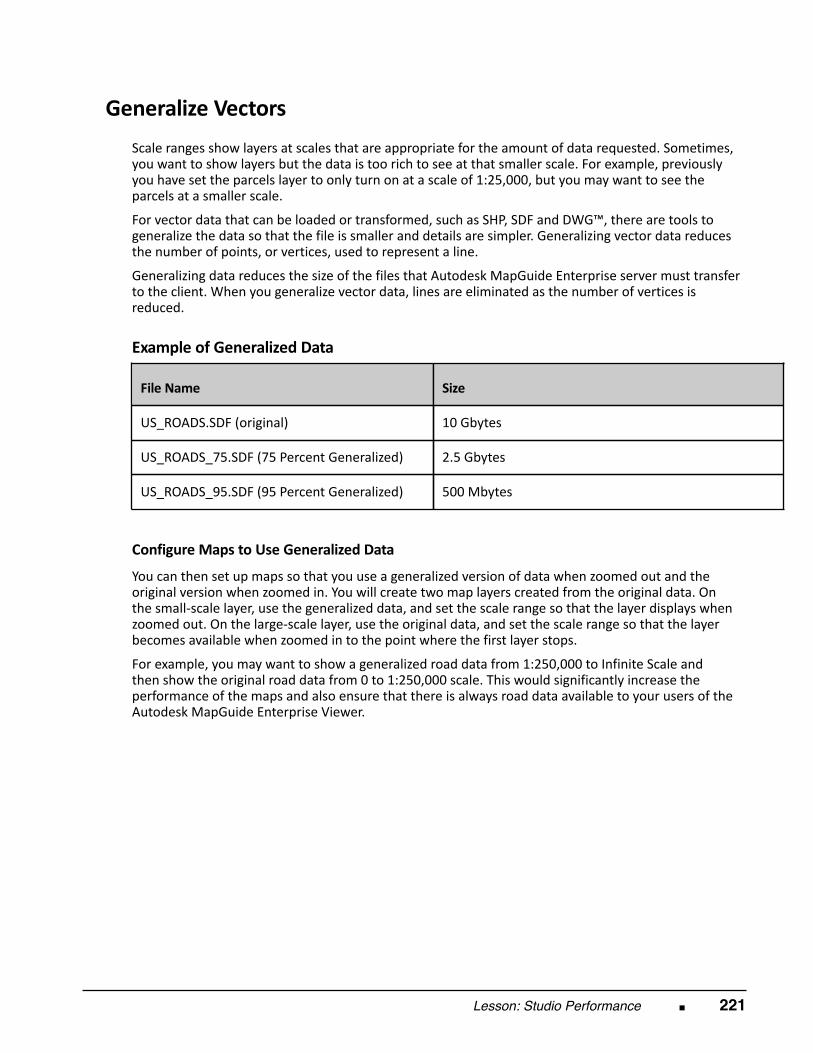
Lesson: Studio Performance ■ 221
Generalize Vectors
Scale ranges show layers at scales that are appropriate for the amount of data requested. Sometimes,you want to show layers but the data is too rich to see at that smaller scale. For example, previouslyyou have set the parcels layer to only turn on at a scale of 1:25,000, but you may want to see theparcels at a smaller scale.
For vector data that can be loaded or transformed, such as SHP, SDF and DWG™, there are tools togeneralize the data so that the file is smaller and details are simpler. Generalizing vector data reducesthe number of points, or vertices, used to represent a line.
Generalizing data reduces the size of the files that Autodesk MapGuide Enterprise server must transferto the client. When you generalize vector data, lines are eliminated as the number of vertices isreduced.
Example of Generalized Data
File Name
Size
US_ROADS.SDF (original) 10 Gbytes
US_ROADS_75.SDF (75 Percent Generalized) 2.5 Gbytes
US_ROADS_95.SDF (95 Percent Generalized) 500 Mbytes
Configure Maps to Use Generalized Data You can then set up maps so that you use a generalized version of data when zoomed out and theoriginal version when zoomed in. You will create two map layers created from the original data. Onthe small‐scale layer, use the generalized data, and set the scale range so that the layer displays whenzoomed out. On the large‐scale layer, use the original data, and set the scale range so that the layerbecomes available when zoomed in to the point where the first layer stops. For example, you may want to show a generalized road data from 1:250,000 to Infinite Scale andthen show the original road data from 0 to 1:250,000 scale. This would significantly increase theperformance of the maps and also ensure that there is always road data available to your users of theAutodesk MapGuide Enterprise Viewer.
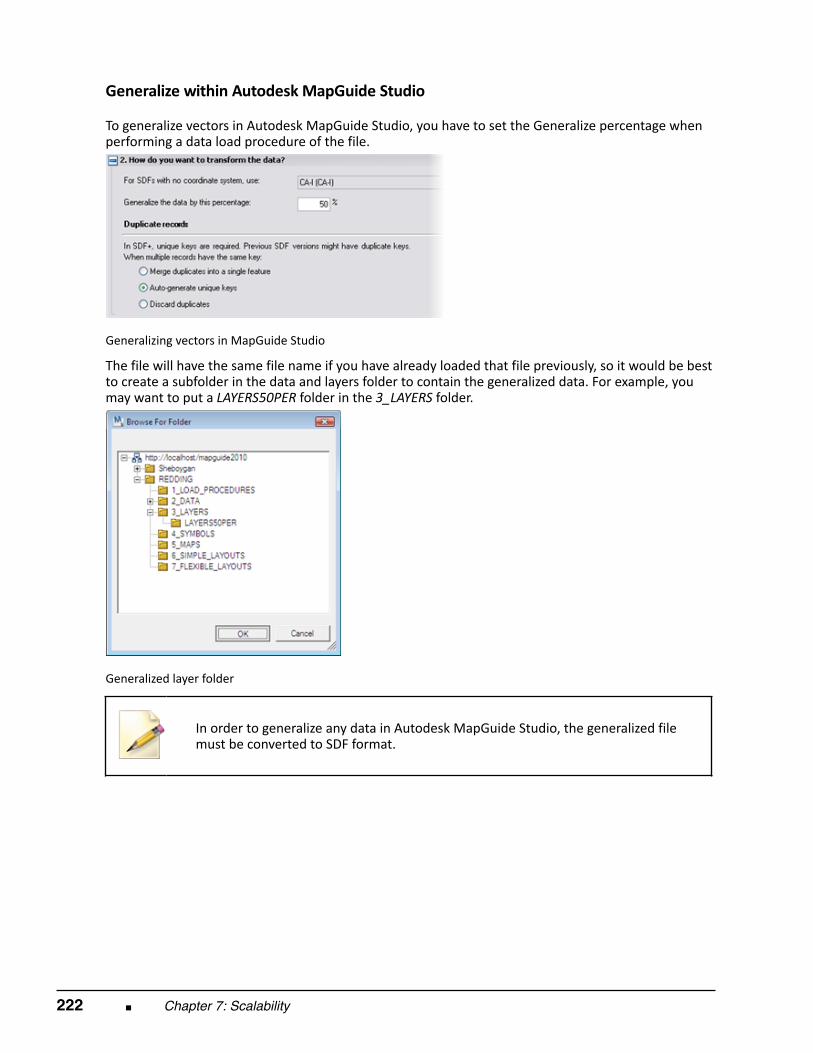
222 ■ Chapter 7: Scalability
Generalize within Autodesk MapGuide Studio
To generalize vectors in Autodesk MapGuide Studio, you have to set the Generalize percentage whenperforming a data load procedure of the file.
Generalizing vectors in MapGuide Studio The file will have the same file name if you have already loaded that file previously, so it would be bestto create a subfolder in the data and layers folder to contain the generalized data. For example, youmay want to put a LAYERS50PER folder in the 3_LAYERS folder.
Generalized layer folder
In order to generalize any data in Autodesk MapGuide Studio, the generalized filemust be converted to SDF format.
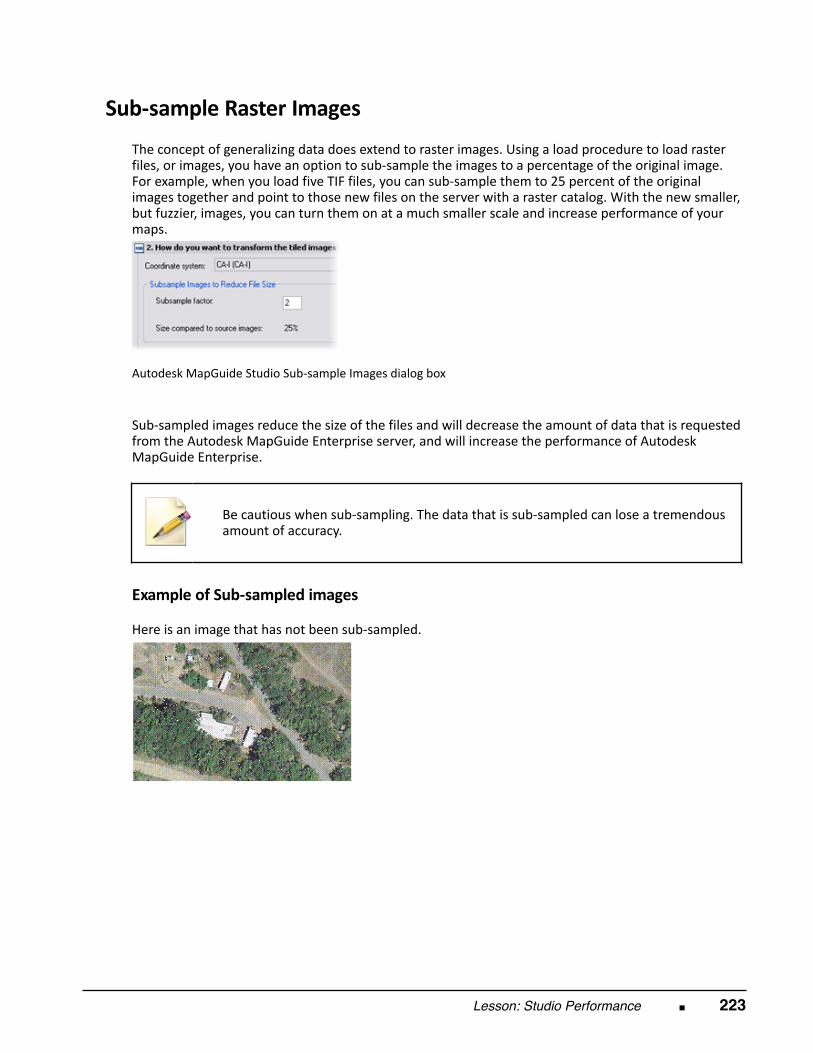
Lesson: Studio Performance ■ 223
Sub‐sample Raster Images
The concept of generalizing data does extend to raster images. Using a load procedure to load rasterfiles, or images, you have an option to sub‐sample the images to a percentage of the original image.For example, when you load five TIF files, you can sub‐sample them to 25 percent of the originalimages together and point to those new files on the server with a raster catalog. With the new smaller,but fuzzier, images, you can turn them on at a much smaller scale and increase performance of yourmaps.
Autodesk MapGuide Studio Sub‐sample Images dialog box
Sub‐sampled images reduce the size of the files and will decrease the amount of data that is requestedfrom the Autodesk MapGuide Enterprise server, and will increase the performance of AutodeskMapGuide Enterprise.
Be cautious when sub‐sampling. The data that is sub‐sampled can lose a tremendousamount of accuracy.
Example of Sub‐sampled images
Here is an image that has not been sub‐sampled.
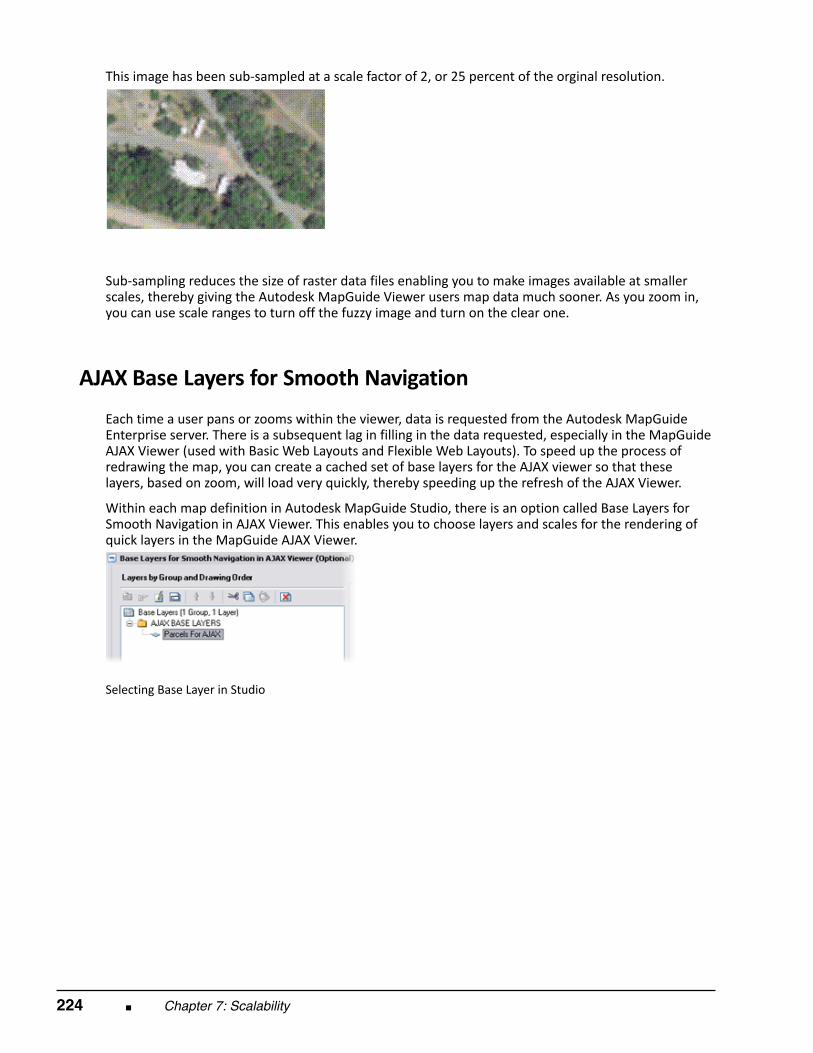
224 ■ Chapter 7: Scalability
This image has been sub‐sampled at a scale factor of 2, or 25 percent of the orginal resolution.
Sub‐sampling reduces the size of raster data files enabling you to make images available at smallerscales, thereby giving the Autodesk MapGuide Viewer users map data much sooner. As you zoom in,you can use scale ranges to turn off the fuzzy image and turn on the clear one.
AJAX Base Layers for Smooth Navigation
Each time a user pans or zooms within the viewer, data is requested from the Autodesk MapGuideEnterprise server. There is a subsequent lag in filling in the data requested, especially in the MapGuideAJAX Viewer (used with Basic Web Layouts and Flexible Web Layouts). To speed up the process ofredrawing the map, you can create a cached set of base layers for the AJAX viewer so that theselayers, based on zoom, will load very quickly, thereby speeding up the refresh of the AJAX Viewer. Within each map definition in Autodesk MapGuide Studio, there is an option called Base Layers forSmooth Navigation in AJAX Viewer. This enables you to choose layers and scales for the rendering ofquick layers in the MapGuide AJAX Viewer.
Selecting Base Layer in Studio
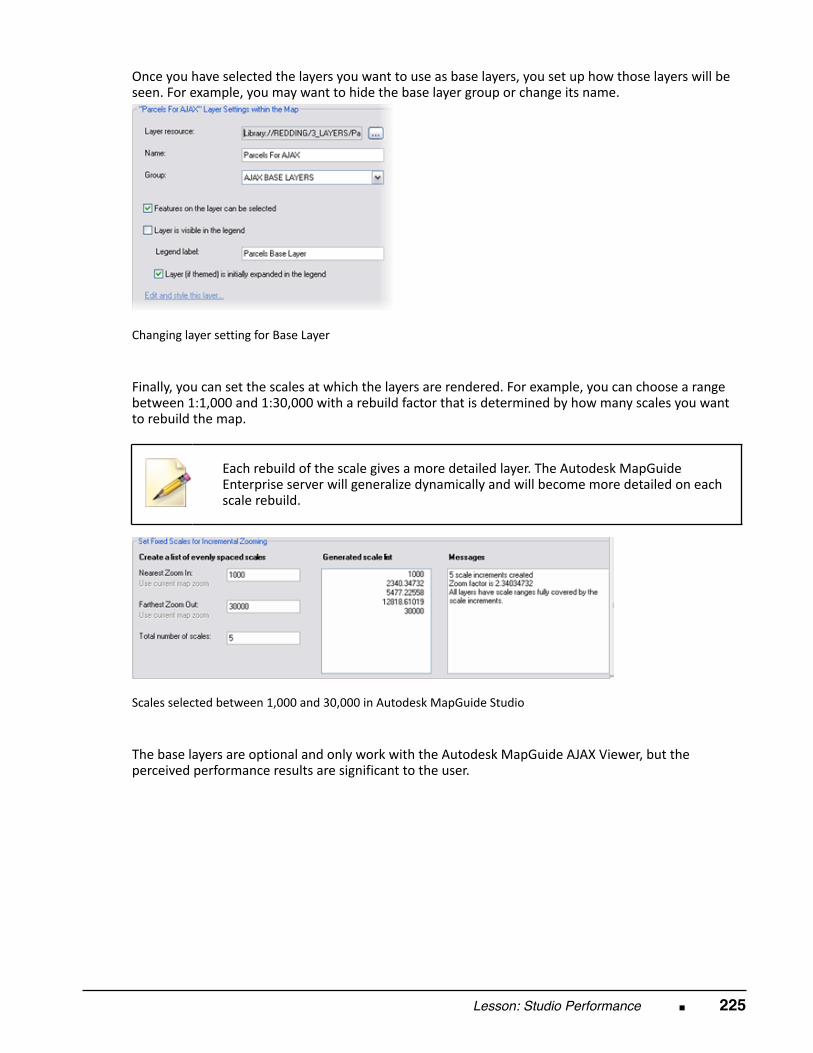
Lesson: Studio Performance ■ 225
Once you have selected the layers you want to use as base layers, you set up how those layers will beseen. For example, you may want to hide the base layer group or change its name.
Changing layer setting for Base Layer
Finally, you can set the scales at which the layers are rendered. For example, you can choose a rangebetween 1:1,000 and 1:30,000 with a rebuild factor that is determined by how many scales you wantto rebuild the map.
Each rebuild of the scale gives a more detailed layer. The Autodesk MapGuide
Enterprise server will generalize dynamically and will become more detailed on eachscale rebuild.
Scales selected between 1,000 and 30,000 in Autodesk MapGuide Studio
The base layers are optional and only work with the Autodesk MapGuide AJAX Viewer, but theperceived performance results are significant to the user.
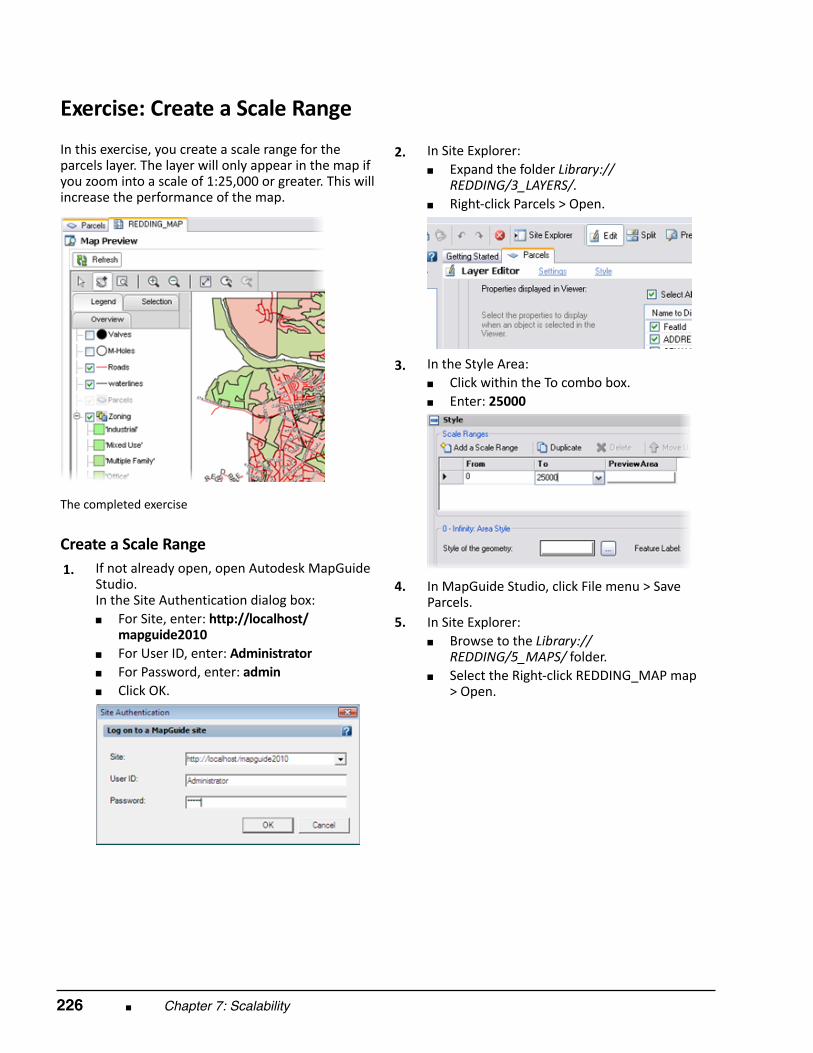
226 ■ Chapter 7: Scalability
Exercise: Create a Scale Range In this exercise, you create a scale range for theparcels layer. The layer will only appear in the map ifyou zoom into a scale of 1:25,000 or greater. This willincrease the performance of the map.
The completed exercise
Create a Scale Range 1.
If not already open, open Autodesk MapGuideStudio. In the Site Authentication dialog box:■ For Site, enter: http://localhost/
mapguide2010■ For User ID, enter: Administrator■ For Password, enter: admin■ Click OK.
2.
In Site Explorer:■ Expand the folder Library://
REDDING/3_LAYERS/.■ Right‐click Parcels > Open.
3.
In the Style Area:■ Click within the To combo box.■ Enter: 25000
4.
In MapGuide Studio, click File menu > SaveParcels.
5.
In Site Explorer:■ Browse to the Library://
REDDING/5_MAPS/ folder.■ Select the Right‐click REDDING_MAP map
> Open.
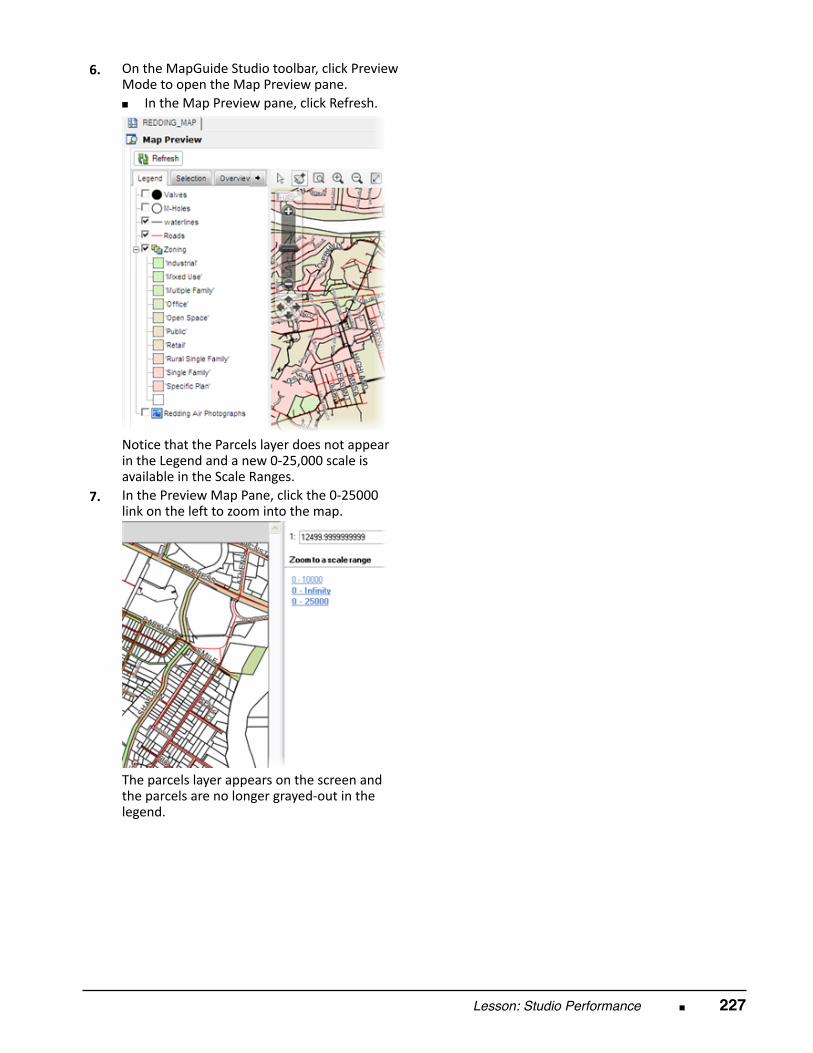
Lesson: Studio Performance ■ 227
6.
On the MapGuide Studio toolbar, click PreviewMode to open the Map Preview pane.■ In the Map Preview pane, click Refresh.
Notice that the Parcels layer does not appearin the Legend and a new 0‐25,000 scale isavailable in the Scale Ranges.
7.
In the Preview Map Pane, click the 0‐25000link on the left to zoom into the map.
The parcels layer appears on the screen andthe parcels are no longer grayed‐out in thelegend.
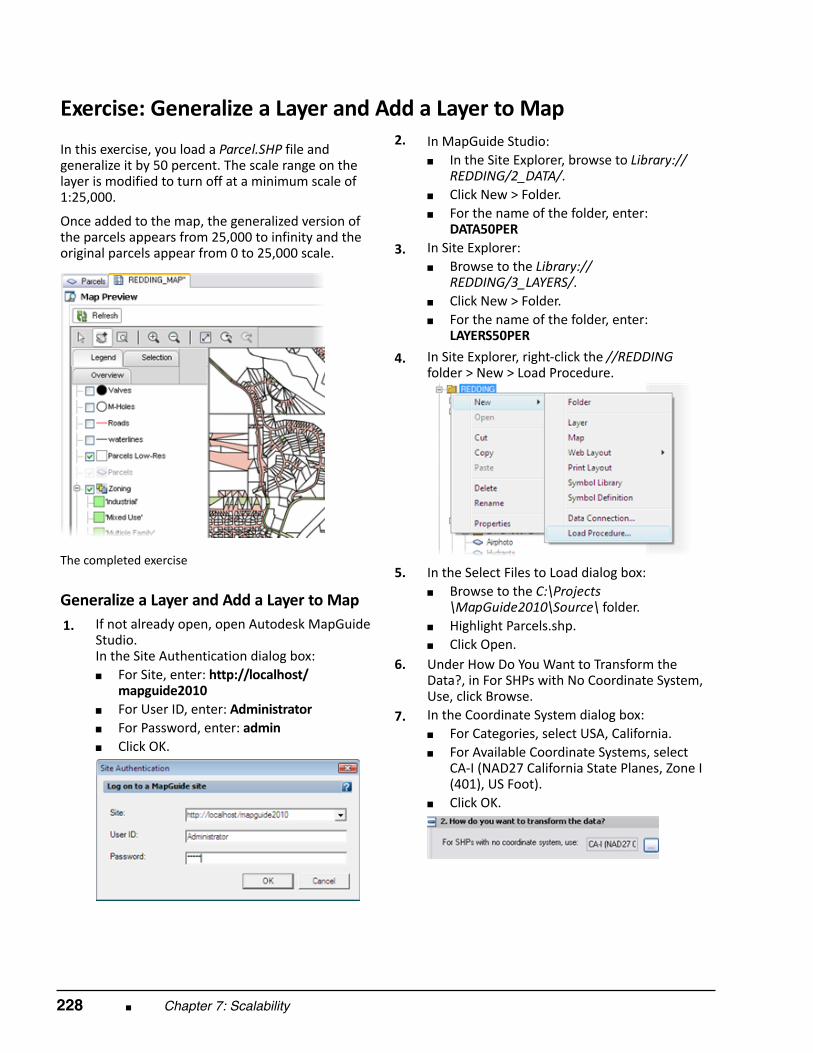
228 ■ Chapter 7: Scalability
Exercise: Generalize a Layer and Add a Layer to Map In this exercise, you load a Parcel.SHP file andgeneralize it by 50 percent. The scale range on thelayer is modified to turn off at a minimum scale of1:25,000. Once added to the map, the generalized version ofthe parcels appears from 25,000 to infinity and theoriginal parcels appear from 0 to 25,000 scale.
The completed exercise
Generalize a Layer and Add a Layer to Map 1.
If not already open, open Autodesk MapGuideStudio. In the Site Authentication dialog box:■ For Site, enter: http://localhost/
mapguide2010■ For User ID, enter: Administrator■ For Password, enter: admin■ Click OK.
2. In MapGuide Studio:■ In the Site Explorer, browse to Library://
REDDING/2_DATA/.■ Click New > Folder.■ For the name of the folder, enter:
DATA50PER 3.
In Site Explorer:■ Browse to the Library://
REDDING/3_LAYERS/.■ Click New > Folder.■ For the name of the folder, enter:
LAYERS50PER
4. In Site Explorer, right‐click the //REDDINGfolder > New > Load Procedure.
5.
In the Select Files to Load dialog box:■ Browse to the C:\Projects
\MapGuide2010\Source\ folder.■ Highlight Parcels.shp.■ Click Open.
6.
Under How Do You Want to Transform theData?, in For SHPs with No Coordinate System,Use, click Browse.
7.
In the Coordinate System dialog box:■ For Categories, select USA, California.■ For Available Coordinate Systems, select
CA‐I (NAD27 California State Planes, Zone I(401), US Foot).
■ Click OK.
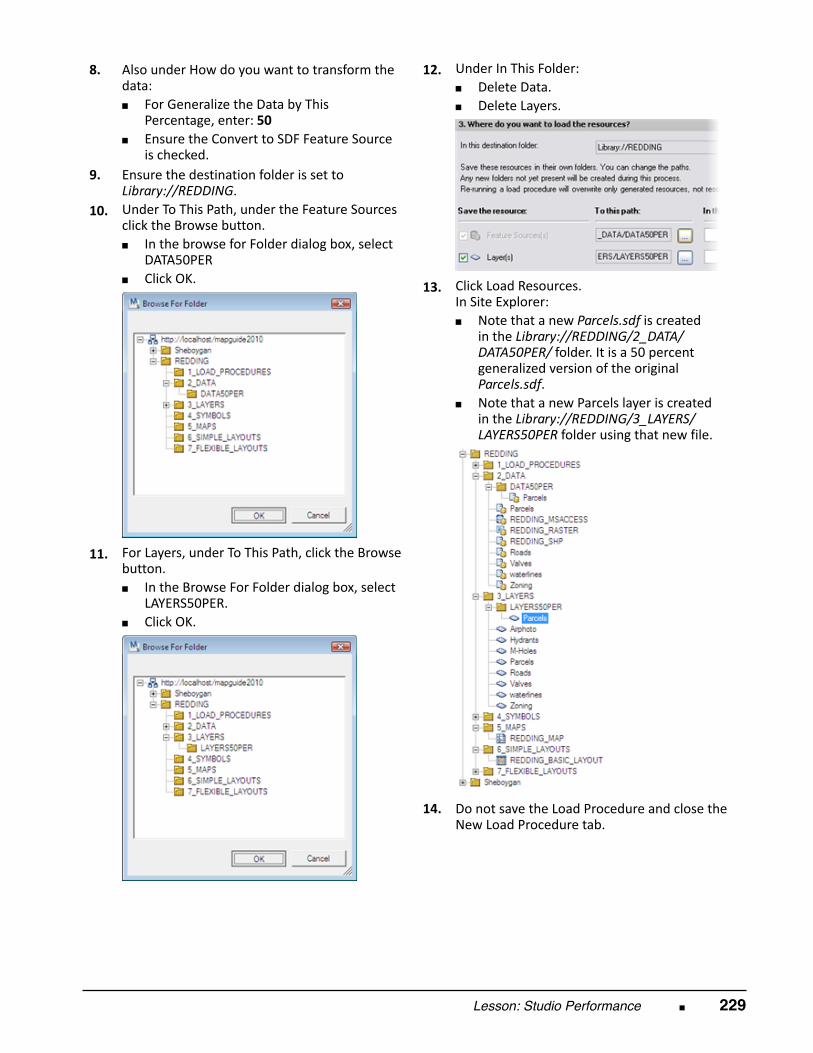
Lesson: Studio Performance ■ 229
8.
Also under How do you want to transform thedata:■ For Generalize the Data by This
Percentage, enter: 50■ Ensure the Convert to SDF Feature Source
is checked. 9.
Ensure the destination folder is set toLibrary://REDDING.
10.
Under To This Path, under the Feature Sourcesclick the Browse button.■ In the browse for Folder dialog box, select
DATA50PER■ Click OK.
11.
For Layers, under To This Path, click the Browsebutton.■ In the Browse For Folder dialog box, select
LAYERS50PER.■ Click OK.
12.
Under In This Folder:■ Delete Data.■ Delete Layers.
13.
Click Load Resources. In Site Explorer:■ Note that a new Parcels.sdf is created
in the Library://REDDING/2_DATA/DATA50PER/ folder. It is a 50 percentgeneralized version of the originalParcels.sdf.
■ Note that a new Parcels layer is createdin the Library://REDDING/3_LAYERS/LAYERS50PER folder using that new file.
14.
Do not save the Load Procedure and close theNew Load Procedure tab.
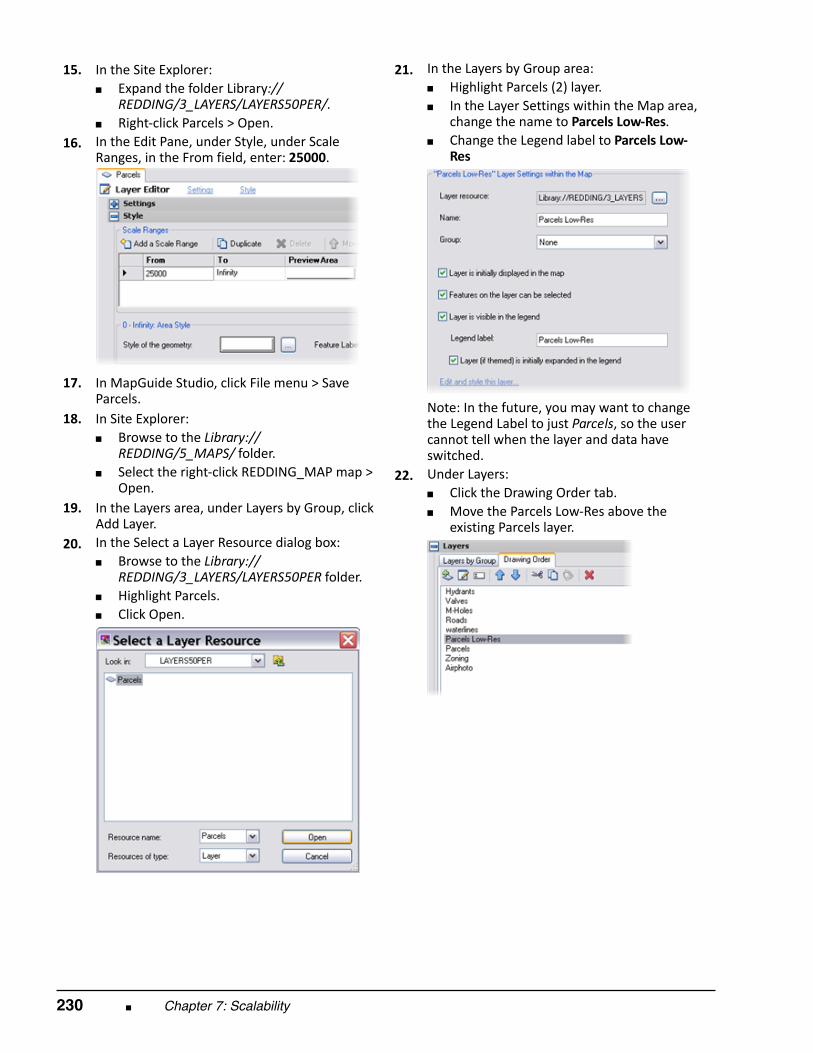
230 ■ Chapter 7: Scalability
15.
In the Site Explorer:■ Expand the folder Library://
REDDING/3_LAYERS/LAYERS50PER/.■ Right‐click Parcels > Open.
16.
In the Edit Pane, under Style, under ScaleRanges, in the From field, enter: 25000.
17.
In MapGuide Studio, click File menu > SaveParcels.
18.
In Site Explorer:■ Browse to the Library://
REDDING/5_MAPS/ folder.■ Select the right‐click REDDING_MAP map >
Open. 19.
In the Layers area, under Layers by Group, clickAdd Layer.
20.
In the Select a Layer Resource dialog box:■ Browse to the Library://
REDDING/3_LAYERS/LAYERS50PER folder.■ Highlight Parcels.■ Click Open.
21.
In the Layers by Group area:■ Highlight Parcels (2) layer.■ In the Layer Settings within the Map area,
change the name to Parcels Low‐Res.■ Change the Legend label to Parcels Low‐
Res
Note: In the future, you may want to changethe Legend Label to just Parcels, so the usercannot tell when the layer and data haveswitched.
22.
Under Layers:■ Click the Drawing Order tab.■ Move the Parcels Low‐Res above the
existing Parcels layer.
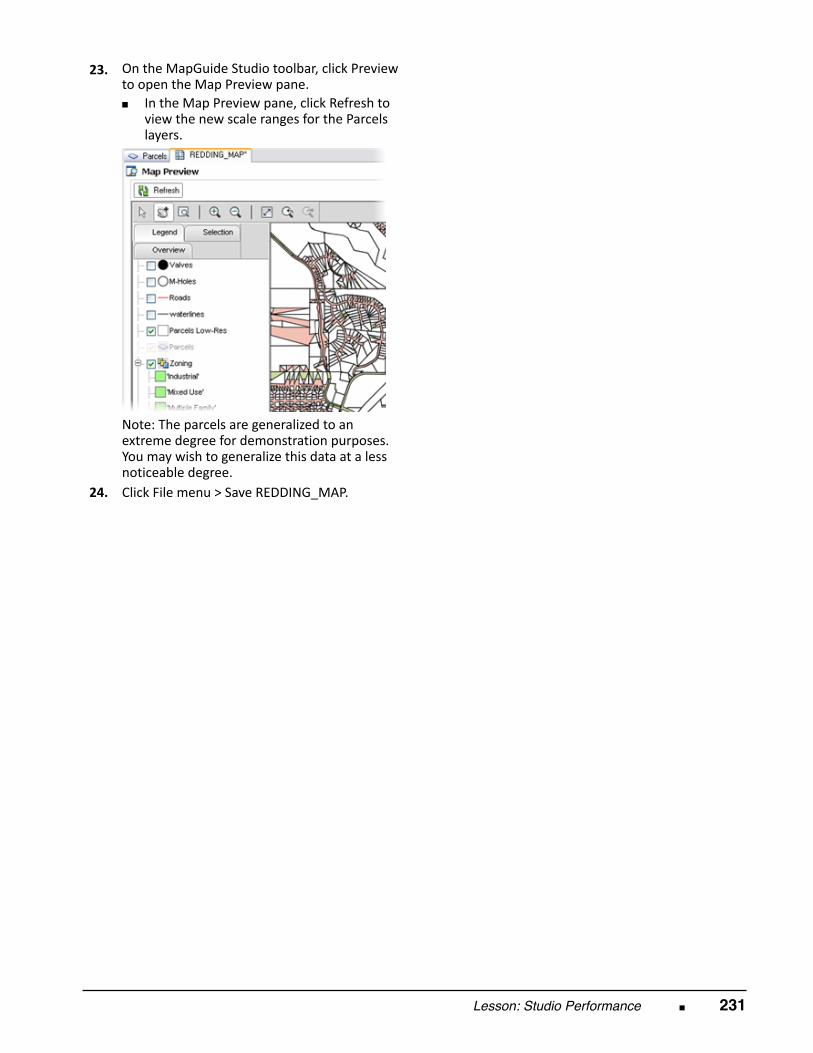
Lesson: Studio Performance ■ 231
23.
On the MapGuide Studio toolbar, click Previewto open the Map Preview pane.■ In the Map Preview pane, click Refresh to
view the new scale ranges for the Parcelslayers.
Note: The parcels are generalized to anextreme degree for demonstration purposes.You may wish to generalize this data at a lessnoticeable degree.
24. Click File menu > Save REDDING_MAP.
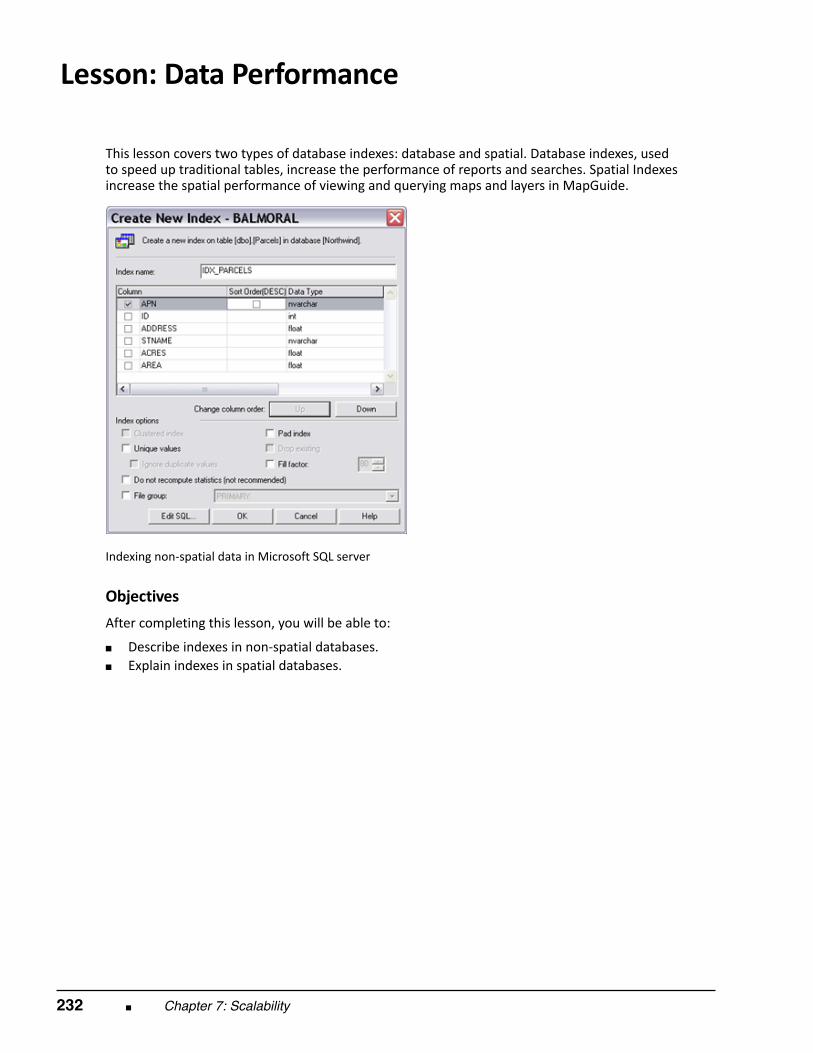
232 ■ Chapter 7: Scalability
Lesson: Data Performance
This lesson covers two types of database indexes: database and spatial. Database indexes, usedto speed up traditional tables, increase the performance of reports and searches. Spatial Indexesincrease the spatial performance of viewing and querying maps and layers in MapGuide.
Indexing non‐spatial data in Microsoft SQL server
Objectives After completing this lesson, you will be able to:
■ Describe indexes in non‐spatial databases.■ Explain indexes in spatial databases.
Lesson: Data Performance ■ 233
Index Non‐spatial Data
Indexing, or sorting, is a technique where a special object in the database keeps track of the order andsequence of the columns of a particular table. Indexing is one of the most important ways to improvethe performance of a database. Without an index, finding any information would take significantlylonger.
As with an index, a primary key, which is automatically indexed, is also required to improve theperformance of the database.
How to Create an Index Regardless of the type of database, including Oracle, Microsoft SQL Server and Access, or MySQL, theway to create an index on a column is always the same.
CREATE INDEX indexname ON tablename(columnname)
For example, if you want to index the Land_Value in the table called Parcels you would enter:
CREATE INDEX IDX_Parcels ON Parcels(Land_Value);
This command works in most databases and increase any searches or themes that use the Land_Valuecolumn.
Exception to Index Performance Indexes are not always good for the database. Sometimes having an index causes a performancedrag when modifying records. Each time a query modifies a record, the indexes on that table mustdynamically change also. This is not an issue with heavy reporting functions from a database sincemost of the queries are read‐only.
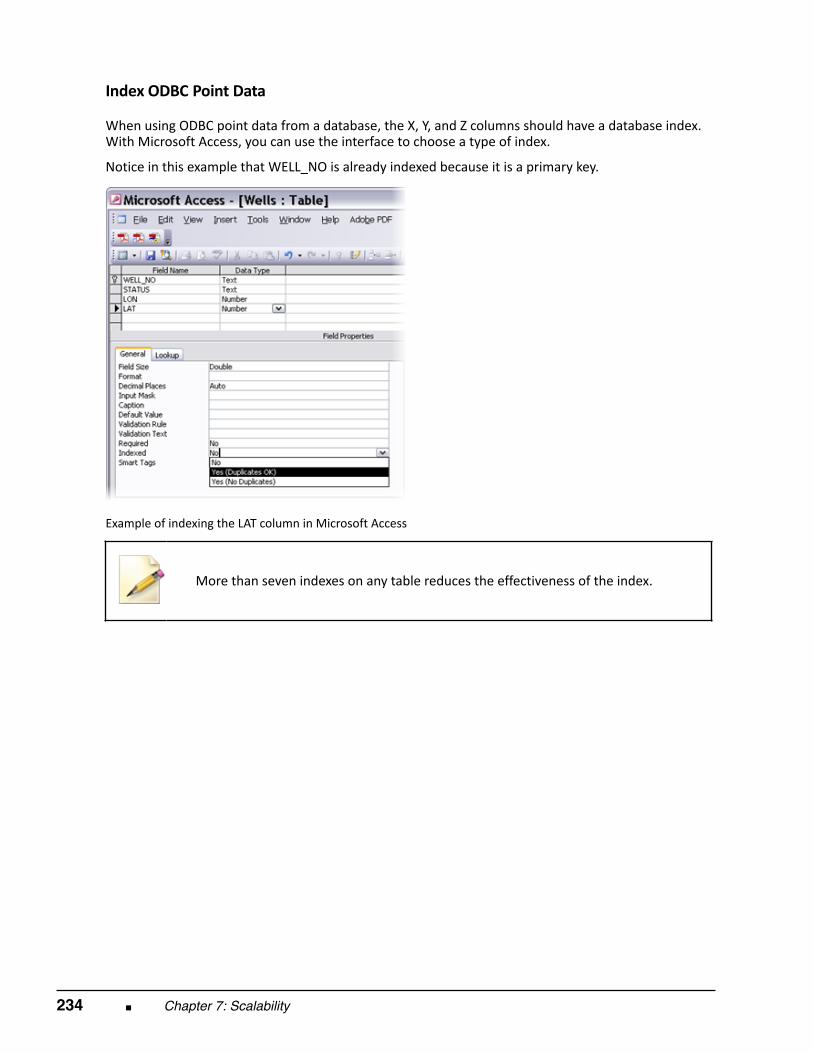
234 ■ Chapter 7: Scalability
Index ODBC Point Data
When using ODBC point data from a database, the X, Y, and Z columns should have a database index.With Microsoft Access, you can use the interface to choose a type of index. Notice in this example that WELL_NO is already indexed because it is a primary key.
Example of indexing the LAT column in Microsoft Access
More than seven indexes on any table reduces the effectiveness of the index.

Lesson: Data Performance ■ 235
Spatial Index for FDO Data Sources
Another technique for increasing the performance of Autodesk MapGuide Enterprise is with spatialindexes. Many of the FDO data sources available with Autodesk MapGuide Enterprise have their owninternal spatial index. For example, SDF 3.x files are spatially indexed.
Spatial databases, such as Oracle, with its own SDO_GEOM data type, have spatial indexes that notonly sort by column, but also geographically.
Spatial indexes are a special form of index, which is based on coordinates also known as a geospatialindex. Usually these indexes have spatial index types, such as QUADTREE or R TREE. These indexes takecare of wasted space in the database and quickly find a location based on spatial density and area.Often these indexes are maintained automatically within the database, or, like Oracle, are created witha spatial index advisor.
Example of a Quadtree index to the 3rd Level
Notice that in the index above, that the small oval is in the index area known as 300.
Where the 3 is the 3rd quadrant of the first grid. The second 0 is the 0 quadrant of the second grid,and the last 0 is the 0 quadrant of the third grid.
Seven levels in a Quadtree index are often recommended.
236 ■ Chapter 7: Scalability
Creating Spatial Indexes Most spatial features already have spatial indexes such as SDF or SHP. When creating spatialrepositories with Map 3D, spatial data stored in SQL Server, Oracle, and MySQL have spatial indexes bydefault.
There are times when spatial indexes have to be created manually. If your data was created with third‐party software, or just inserted into the database with SQL statements, you would need to create thespatial index.
With Oracle, to create a spatial index on the GEOMETRY column in the Water_Mains table, thestatement would be:
CREATE INDEX Water_Mains_id ON Water_Mains(GEOMETRY ) INDEXTYPE IS MDSYS.SPATIAL_INDEXLOCAL;
With MySQL, you would create a spatial index with the following syntax:
CREATE SPATIAL INDEX sp_Water_Mains_index ON Water_Mains(GEOMETRY);
With SQL Server 2008, and its new spatial support, to create an index on the GEOMETRY column, thesyntax would be:
CREATE SPATIAL INDEX SIndx_Water_Mains ON dbo.Water_Mains(GEOMETRY);
Regardless of the type of spatial repository, your maps will appear in MapGuide much faster if thedata has a spatial index.

Chapter Summary ■ 237
Chapter Summary
Having completed this chapter, you can:
■ Describe the MapGuide Server performance tools.■ Use MapGuide Studio to increase performance of the maps and layers.■ Descibe how to structure spatial and non‐spatial data to increase performance in MapGuide.

238 ■ Chapter 7: Scalability
Chapter Overview ■ 239
Chapter
8
Native Google Earth Support
In this chapter, you integrate Autodesk MapGuide® Enterprise with Google® Earth. By leveraging thehuge data repository that Google Earth offers andcombining itwith your own datasets streamed fromMapGuide Enterprise, you create an effective way to visualize data within a world context.
Objectives After completing this chapter, you will be able to:
■ Explain how to render MapGuide information as KML data in Google Earth.
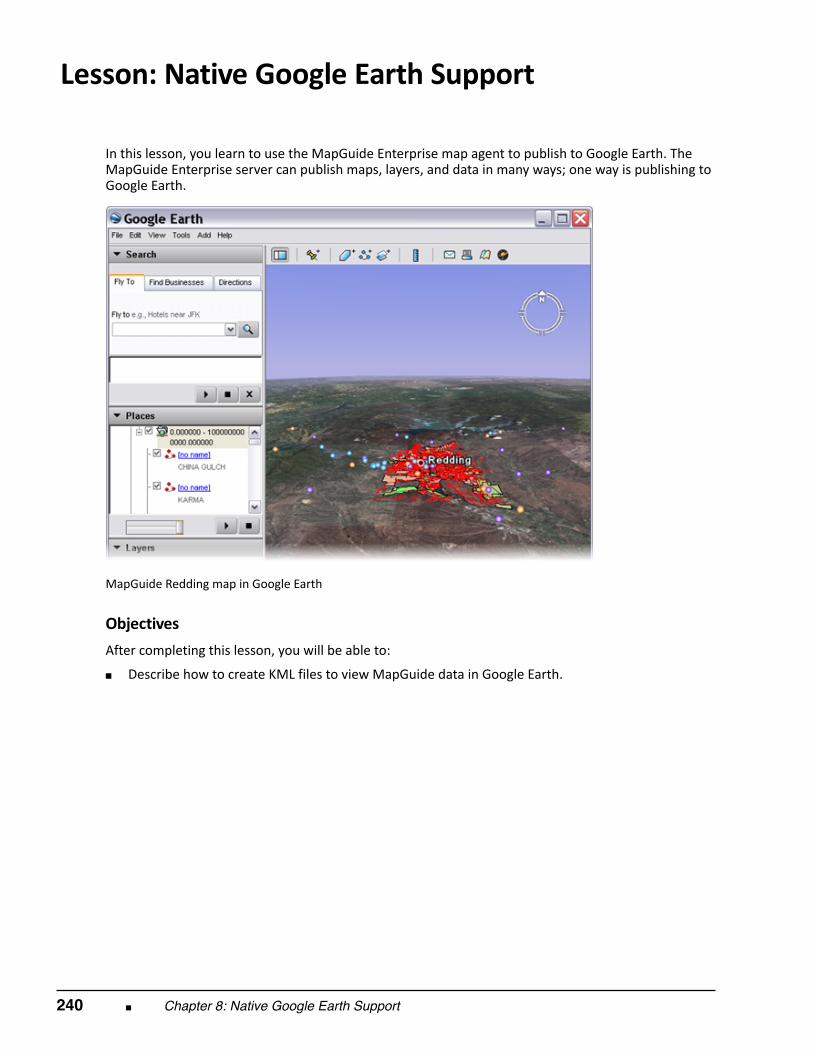
240 ■ Chapter 8: Native Google Earth Support
Lesson: Native Google Earth Support
In this lesson, you learn to use the MapGuide Enterprise map agent to publish to Google Earth. TheMapGuide Enterprise server can publish maps, layers, and data in many ways; one way is publishing toGoogle Earth.
MapGuide Redding map in Google Earth
Objectives After completing this lesson, you will be able to:
■ Describe how to create KML files to view MapGuide data in Google Earth.
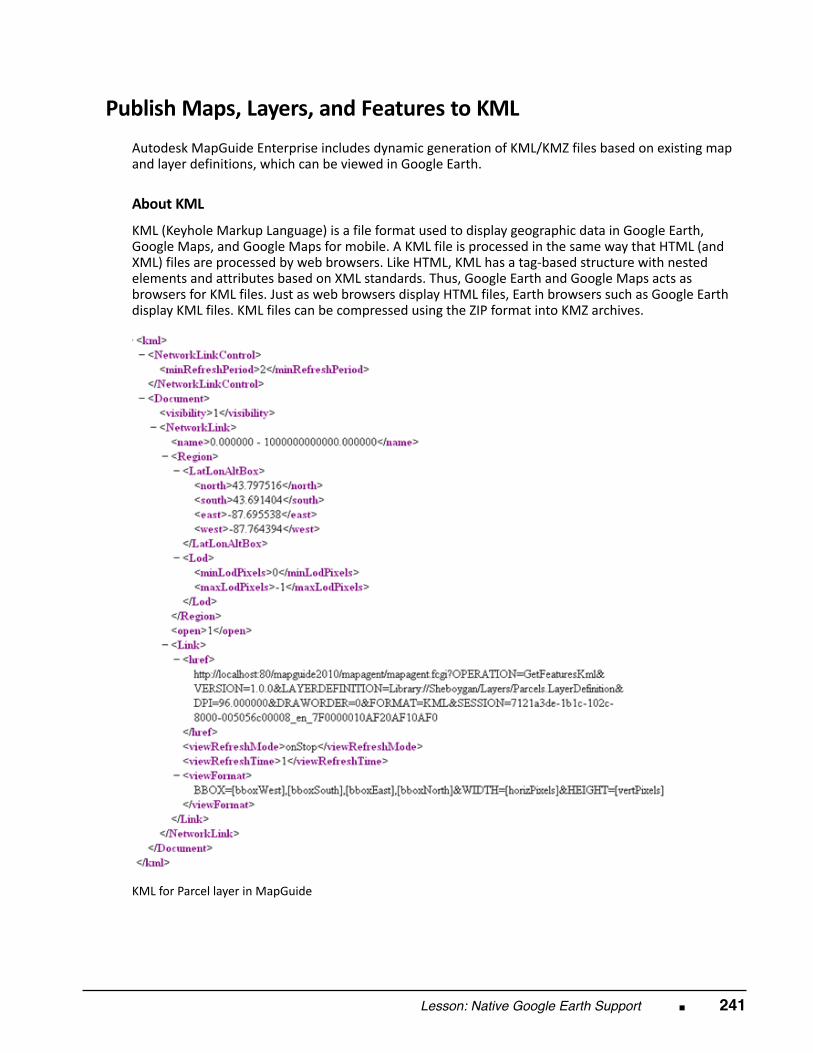
Lesson: Native Google Earth Support ■ 241
Publish Maps, Layers, and Features to KML
Autodesk MapGuide Enterprise includes dynamic generation of KML/KMZ files based on existing mapand layer definitions, which can be viewed in Google Earth.
About KML KML (Keyhole Markup Language) is a file format used to display geographic data in Google Earth,Google Maps, and Google Maps for mobile. A KML file is processed in the same way that HTML (andXML) files are processed by web browsers. Like HTML, KML has a tag‐based structure with nestedelements and attributes based on XML standards. Thus, Google Earth and Google Maps acts asbrowsers for KML files. Just as web browsers display HTML files, Earth browsers such as Google Earthdisplay KML files. KML files can be compressed using the ZIP format into KMZ archives.
KML for Parcel layer in MapGuide
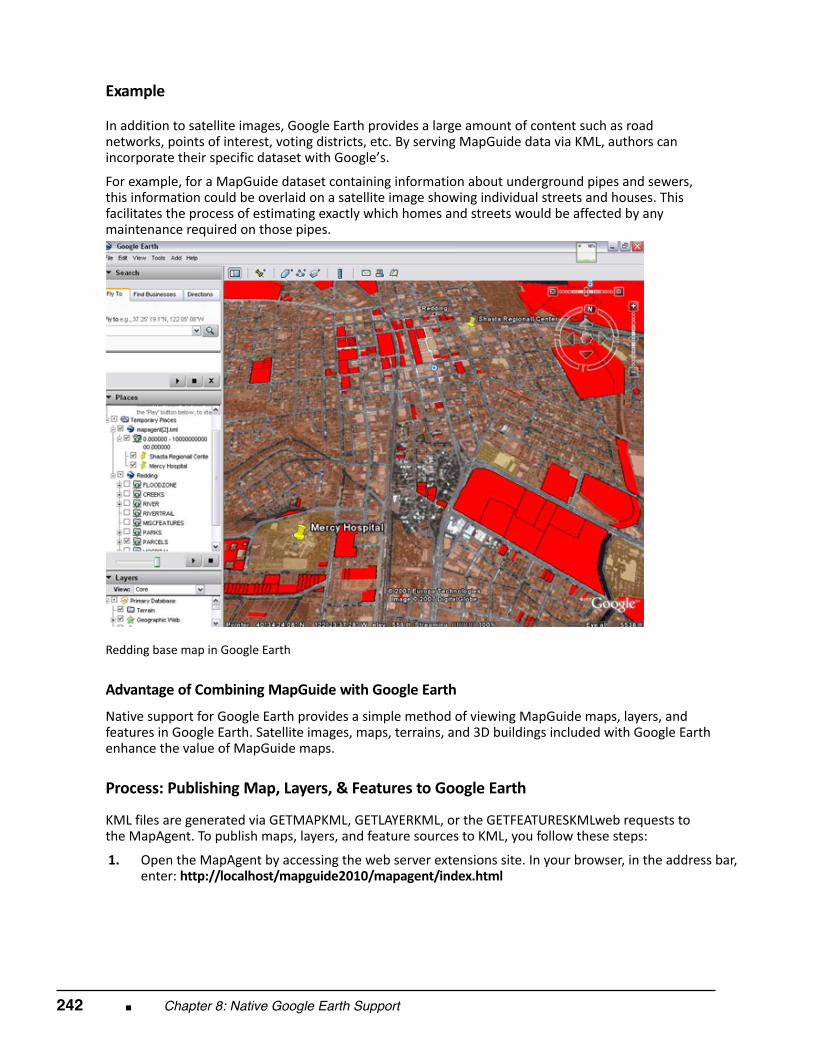
242 ■ Chapter 8: Native Google Earth Support
Example
In addition to satellite images, Google Earth provides a large amount of content such as roadnetworks, points of interest, voting districts, etc. By serving MapGuide data via KML, authors canincorporate their specific dataset with Google’s.
For example, for a MapGuide dataset containing information about underground pipes and sewers,this information could be overlaid on a satellite image showing individual streets and houses. Thisfacilitates the process of estimating exactly which homes and streets would be affected by anymaintenance required on those pipes.
Redding base map in Google Earth
Advantage of Combining MapGuide with Google Earth Native support for Google Earth provides a simple method of viewing MapGuide maps, layers, andfeatures in Google Earth. Satellite images, maps, terrains, and 3D buildings included with Google Earthenhance the value of MapGuide maps.
Process: Publishing Map, Layers, & Features to Google Earth
KML files are generated via GETMAPKML, GETLAYERKML, or the GETFEATURESKMLweb requests tothe MapAgent. To publish maps, layers, and feature sources to KML, you follow these steps:
1.
Open the MapAgent by accessing the web server extensions site. In your browser, in the address bar,enter: http://localhost/mapguide2010/mapagent/index.html
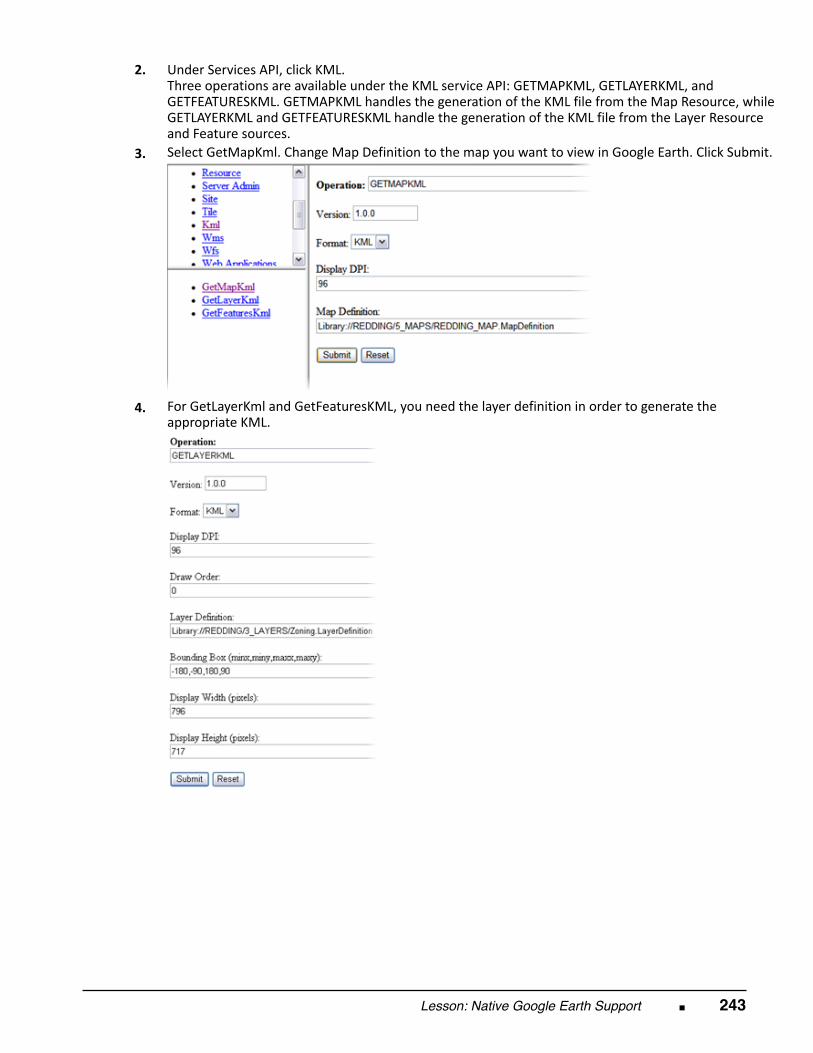
Lesson: Native Google Earth Support ■ 243
2.
Under Services API, click KML. Three operations are available under the KML service API: GETMAPKML, GETLAYERKML, andGETFEATURESKML. GETMAPKML handles the generation of the KML file from the Map Resource, whileGETLAYERKML and GETFEATURESKML handle the generation of the KML file from the Layer Resourceand Feature sources.
3.
Select GetMapKml. Change Map Definition to the map you want to view in Google Earth. Click Submit.
4.
For GetLayerKml and GetFeaturesKML, you need the layer definition in order to generate theappropriate KML.
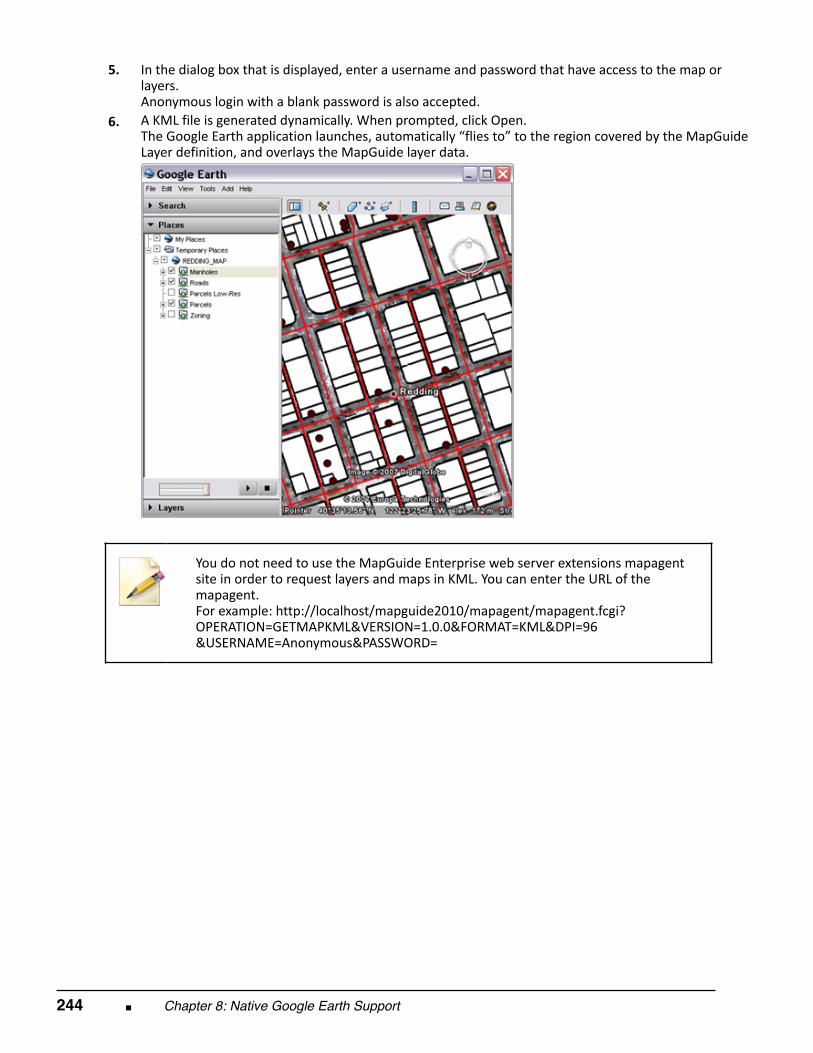
244 ■ Chapter 8: Native Google Earth Support
5.
In the dialog box that is displayed, enter a username and password that have access to the map orlayers. Anonymous login with a blank password is also accepted.
6.
A KML file is generated dynamically. When prompted, click Open. The Google Earth application launches, automatically “flies to” to the region covered by the MapGuideLayer definition, and overlays the MapGuide layer data.
You do not need to use the MapGuide Enterprise web server extensions mapagent
site in order to request layers and maps in KML. You can enter the URL of themapagent.For example: http://localhost/mapguide2010/mapagent/mapagent.fcgi?OPERATION=GETMAPKML&VERSION=1.0.0&FORMAT=KML&DPI=96&USERNAME=Anonymous&PASSWORD=

Chapter Summary ■ 245
Chapter Summary
Having completed this chapter, you can:
■ Explain how to render MapGuide information as KML data in Google Earth.

246 ■ Chapter 8: Native Google Earth Support
Appendix: Additional Resources ■ 247
Appendix
A
Additional Resources
A variety of resources are available to help you get the most from your Autodesk® software. Whetheryou prefer instructor‐led, self‐paced, or online training, Autodesk has you covered. For additional information please refer to the disc that accompanies this training guide. ■ Learning Tools from Autodesk■ Autodesk Certification■ Autodesk Authorized Training Centers (ATC®)■ Autodesk Subscription■ Autodesk Communities
Learning Tools from Autodesk Use your Autodesk software to its full potential. Whether you are a novice or advanced user, Autodeskoffers a robust portfolio of learning tools to help you perform ahead of the curve. ■ Get hands‐on experience with job‐related exercises based on industry scenarios from Autodesk
Official Training Guides, e‐books, self‐paced learning, and training videos.■ All materials are developed by Autodesk subject‐matter experts.■ Get exactly the training you need with learning tools designed to fit a wide range of skill levels and
subject matter—from basic essentials to specialized, in‐depth training on the capabilities of thelatest Autodesk products.
■ Access the most comprehensive set of Autodesk learning tools available anywhere: from yourauthorized partner, online, or at your local bookstore.
■ To find out more, visit http://www.autodesk.com/learningtools.
Autodesk Certification Demonstrate your experience with Autodesk software. Autodesk certifications are a reliable validationof your skills and knowledge. Demonstrate your software skills to prospective employers, accelerateyour professional development, and enhance your reputation in your field.
248 ■ Appendix
Certification Benefits■ Rapid diagnostic feedback to assess your strengths, and identify areas for improvement.■ An electronic certificate with a unique serial number.■ The right to use an official Autodesk Certification logo.■ The option to display your certification status in the Autodesk Certified Professionals database.
For more information: Visit www.autodesk.com/certification to learn more and to take the next steps to get certified.
Autodesk Authorized Training Centers Enhance your productivity and learn how to realize your ideas faster with Autodesk software. Gettrained at an Autodesk Authorized Training Center (ATC) with hands‐on, instructor‐led classes to helpyou get the most from your Autodesk products. Autodesk has a global network of Authorized TrainingCenters which are carefully selected and monitored to ensure you receive high‐quality, results‐oriented learning. ATCs provide the best way for beginners and experts alike to get up to speed. Thetraining helps you get the greatest return on your investment, faster; by building your knowledgein the areas you need the most. Many organizations provide training on our software, but only theeducational institutions and private training providers recognized as ATC sites have met Autodesk'srigorous standards of excellence.
Find an Authorized Training Center With over 2000 ATCs in more than 90 countries around the world, there is probably one close to you.Visit the ATC locator at www.autodesk.com/atc to find an Autodesk Authorized Training Center nearyou. Look for ATC courses offered at www.autodesk.com/atcevents.
Many ATCs also offer end‐user Certification testing. Locate a testing center near you atwww.autodesk.starttest.com.
Autodesk Subscription Autodesk® Subscription is a maintenance and support program that helps you minimize costs,increase productivity, and make the most of your Autodesk software investment. For an attractiveannual fee, you receive any upgrades released during your Subscription term, as well as early accessto product enhancements. Subscription also gives you flexible license terms, so you can run bothcurrent and previous versions (under certain conditions) and use the software on both home andoffice computers. In addition, Subscription gives you access to a variety of tools and information thatsave time and increase productivity, including web support direct from Autodesk, self‐paced learning,and online license management. ■ Autodesk Subscription offers a way to make software costs predictable. Whether a customer opts
for a one‐year subscription or a multiyear contract, the costs are known for the entire term of thecontract.
■ A complete library of interactive learning tools and high‐quality, self‐paced lessons help usersincrease their productivity and master new skills. These short lessons are available on‐demandand complement more in‐depth training provided through Autodesk Authorized Training Centers.
■ Autodesk Subscription makes managing software licenses easier. Customers have added flexibilityto allow their employees to use their Subscription software—in the office or at home. Better yet,designers are entitled to run previous versions of the software concurrently with the latest releaseunder certain conditions.
Appendix: Additional Resources ■ 249
■ Get what you need to stay productive. With web support Autodesk support technicians provideanswers to your installation, configuration, and troubleshooting questions. Web and emailcommunications deliver support straight to your desktop.
■ For more information visit www.autodesk.com/subscription.
Autodesk User Communities Autodesk customers can take advantage of free Autodesk software, self‐paced tutorials, worldwidediscussion groups and forums, job postings, and more. Become a member of an Autodesk Communitytoday!
Free products are subject to the terms and conditions of the end‐user licenseagreement that accompanies download of the software.
Feedback Autodesk understands the importance of offering you the best learning experience possible. If youhave comments, suggestions, or general inquiries about Autodesk Learning, please contact us [email protected].
As a result of the feedback we receive from you, we hope to validate and append to our currentresearch on how to create a better learning experience for our customers.
Useful Links Learning Tools
www.autodesk.com/learningtools
Communitieswww.autodesk.com/community
Certificationwww.autodesk.com/certification
Student Communitywww.students.autodesk.com
Find an Authorized Training Centerwww.autodesk.com/atc
Blogswww.autodesk.com/blogs
Find an Authorized Training Center Coursewww.autodesk.com/atcevents
Discussion Groupswww.discussion.autodesk.com
Autodesk Storewww.store.autodesk.com

250 ■ Appendix


