Page 1
AUTOMATED BRAIN IMAGE SEGMENTATION
SYAHIRAH HUSNA BINTI UDA ZAHLI
This Report Is Submitted In Partial Fulfilment of Requirements for the Bachelor Degree of Electronic Engineering (Computer Engineering)
FACULTY OF ELECTRONICS ENGINEERING AND COMPUTER ENGINEERING
UNIVERSITI TENIKAL MALAYSIA MELAKA
June 2014
Page 2
ii
UNIVERSTI TEKNIKAL MALAYSIA MELAKA
FAKULTI KEJURUTERAAN ELEKTRONIK DAN KEJURUTERAAN KOMPUTER
BORANG PENGESAHAN STATUS LAPORAN
PROJEK SARJANA MUDA II
Tajuk Projek : AUTOMATED BRAIN IMAGE SEGMENTATION
Sesi Pengajian : 1 3 / 1 4
Saya SYAHIRAH HUSNA BINTI UDA ZAHLI……………………………………………... (HURUF BESAR) mengaku membenarkan Laporan Projek Sarjana Muda ini disimpan di Perpustakaan dengan syarat-syarat kegunaan seperti berikut:
1. Laporan adalah hakmilik Universiti Teknikal Malaysia Melaka.
2. Perpustakaan dibenarkan membuat salinan untuk tujuan pengajian sahaja.
3. Perpustakaan dibenarkan membuat salinan laporan ini sebagai bahan pertukaran antara institusi
pengajian tinggi.
4. Sila tandakan ( √ ) :
SULIT*
*(Mengandungi maklumat yang berdarjah keselamatan atau
kepentingan Malaysia seperti yang termaktub di dalam AKTA
RAHSIA RASMI 1972)
TERHAD**
**(Mengandungi maklumat terhad yang telah ditentukan oleh
organisasi/badan di mana penyelidikan dijalankan)
TIDAK TERHAD
Disahkan oleh:
__________________________ ___________________________________
(TANDATANGAN PENULIS) (COP DAN TANDATANGAN PENYELIA)
Tarikh: ……………………….. Tarikh: ………………………..
Page 3
iii
DECLARATION
“Saya akui laporan ini adalah hasil kerja saya sendiri kecuali ringkasan dan petikan
yang tiap-tiap satunya telah saya jelaskan sumbernya.”
Tandatangan : ………………………………………
Nama Penulis : SYAHIRAH HUSNA BINTI UDA ZAHLI.
Tarikh : 5 JUN 2014
Page 4
iv
“Saya/kami akui bahawa saya telah membaca karya ini pada pandangan saya/kami
karya ini adalah memadai dari skop dan kualiti untuk tujuan penganugerahan Ijazah
Sarjana Muda Kejuruteraan Elektronik (Kejuruteraan Komputer).”
Tandatangan : ……………………………………………….
Nama Penyelia : NORHASHIMAH BINTI MOHD SAAD
Tarikh : 5 JUN 2014
Page 5
v
ACKNOWLEDGEMENT
I would like to express my thanks to my supervisor, Norhashimah binti Mohd Saad
for her continuous support, guidance and encouragement during the period of this
project work. Without her guidance I could not manage to complete the project
successfully. I also would like to thank all my friends who had helped me in the
project research work. I would like to thank my parents who also give constant
support and encouragement. Lastly, I want to express my thankful to all peoples who
have supported me directly or indirectly during the completion period of project.
Page 6
vi
ABSTRACT
This project is about image segmentation application to automatically segment the
Magnetic Resonance Imaging (MRI) brain image using thresholding and fuzzy c-
means (FCM) methods. Conventional method of brain MRI segmentation is done
manually by neuro-radiologists which are time consuming and have significant
differences between expertises. Therefore, automatic segmentation would serve as
second option with neuro-radiologists. The objective of the project is to analyze the
automated brain MRI image segmentation by using thresholding and FCM
clustering. Thresholding technique identifies a region based on the pixels with
similar intensity values and provides boundaries in images that contain solid objects
on a contrast background. This technique gives binary output image from a grey
scale image. FCM is an iterative process. The iteration is being repeated until a set
point called the threshold is reached or the process stops when the maximum number
of iterations is reached. The steps include in the project are pre-processing,
segmentation (thresholding and FCM) and performance analysis. FCM method is
more accurate compare to the thresholding which the percentage of accuracy is
45.45% compare to 37.50 %.
Page 7
vii
ABSTRAK
Projek ini adalah mengenai aplikasi penggunaan imej segmentasi automatic yang
bertujuan untuk membahagikan imej otak pengimejan resonans magnetik (MRI)
menggunakan teknik „thresholding‟ dan „fuzzy c-means(FCM)‟. Secara konvensional
proses segmentasi dilakukan secara manual oleh neuro- radiologi yang memakan
masa dan mempunyai perbezaan yang signifikan di antara pakar. Oleh itu,
segmentasi automatik akan menjadi pilihan kedua oleh neuro- radiologi . Objektif
projek ini adalah untuk menganalisis segmen secara automtik menggunakan imej
otak MRI dengan menggunakan teknik „thresholding‟ dan „FCM‟. Teknik
„thresholding‟ mengenal pasti kawasan berdasarkan piksel dengan nilai-nilai
keamatan yang sama dan menyediakan sempadan dalam imej yang mengandungi
objek padu pada latar belakang kontras. Teknik ini memberikan imej output binari
dari imej skala kelabu. FCM adalah satu proses yang berterusan. Lelaran ini diulangi
sehingga titik set dipanggil ambang dicapai atau proses itu berhenti apabila bilangan
maksimum lelaran dicapai. Langkah-langkah yang termasuk dalam projek itu adalah
pra- pemprosesan , segmentasi („thresholding‟ dan „FCM‟) dan analisis prestasi.
Kesimpulannya, kaedah FCM adalah lebih tepat berbanding dengan „thresholding‟
yang peratusan ketepatan adalah 45.45 % berbanding dengan 37.50 %.
Page 8
viii
TABLE OF CONTENTS
TITLE PAGE
Project Title i
Pengesahan Status Laporan ii
Declaration iii
Pengesahan Penyelia iv
Acknowledgement v
Abstract vi
Abstrak vii
Table of Contents viii
List of Figures xi
List of Tables xiii
List of Abbreviations xiv
List of Appendix xv
CHAPTER 1: INTRODUCTION
1.1 Project Background ................................................................................................ 1
1.2 Problem Statement ................................................................................................. 2
1.3 Objectives ............................................................................................................... 3
1.5 Scope of Project ..................................................................................................... 3
1.6 Methodology .......................................................................................................... 3
1.6 Thesis Organization ............................................................................................... 4
Page 9
ix
CHAPTER 2: LITERATURE REVIEW
2.1 Introduction ............................................................................................................ 5
2.2 Neuroimaging ......................................................................................................... 5
2.3 Brain and Its Function ............................................................................................ 6
2.4 Magnetic Resonance Imaging (MRI) ..................................................................... 9
2.5 MRI Imaging Method .......................................................................................... 11
2.6 Diffusion-Weighted Imaging (DWI) ................................................................... 12
2.7 Pre-processing ...................................................................................................... 13
2.8 Image segmentation ............................................................................................. 14
2.9 MRI brain image segmentation ............................................................................ 15
2.10 Thresholding method ......................................................................................... 15
2.11 Fuzzy C-means method ...................................................................................... 16
2.12 Region of Interest (ROI) .................................................................................... 18
2.13 Feature Extraction .............................................................................................. 19
2.14 Classification ...................................................................................................... 19
2.15 Performance Analysis ........................................................................................ 20
2.16 Summary ............................................................................................................ 21
CHAPTER 3: METHODOLOGY
3.1 Introduction .......................................................................................................... 21
3.2 Flowchart of the project ....................................................................................... 22
3.3 Thresholding Algorithm and Flowchart ............................................................... 23
3.4 Fuzzy C-Means (FCM) Algorithm and Flowchart............................................... 25
Page 10
x
3.5 Flowchart of Ground Truth Segmentation ........................................................... 26
3.6 Block diagram of graphical user interface (GUI) ................................................ 29
3.7 Summary .............................................................................................................. 30
CHAPTER 4: RESULT AND DISCUSSION
4.1 Introduction .......................................................................................................... 30
4.2 Graphical User Interface (GUI) ........................................................................... 32
4.3 Pre-processing ...................................................................................................... 34
4.4 Thresholding segmentation .................................................................................. 37
4.5 Fuzzy C-Means ................................................................................................... 43
4.6 Ground truth segmentation ................................................................................... 45
4.7 Analysis of the segmentation result ..................................................................... 45
4.8 Summary .............................................................................................................. 49
CHAPTER 5: CONCLUSION
5.1 Conclusion ........................................................................................................... 50
5.2 Future Work ......................................................................................................... 51
REFERENCES: ........................................................................................................ 52
Page 11
xi
LIST OF FIGURES
Figure 2. 1: Brain and Its Parts[3] ................................................................................ 6
Figure 2. 2:Brain and Functional Areas [3] ................................................................. 7
Figure 2. 3: White Matter and Grey Matter of Brain ................................................... 8
Figure 2. 4: MRI Scanner ............................................................................................. 9
Figure 2. 5: MRI Scanner Cutaway ........................................................................... 10
Figure 2. 6: Diffusion-weighted imaging pulse sequence [6] .................................... 12
Figure 2. 7: Brain Tissue ............................................................................................ 15
Figure 2. 8: Flowchart of FCM clustering ................................................................. 17
Figure 3. 1: Flowchart of the project .......................................................................... 22
Figure 3. 2: Flowchart of the Thresholding segmentation [17] ................................. 24
Figure 3. 3: Flowchart of the FCM segmentation ...................................................... 27
Figure 3. 4: Flowchart of the Ground truth segmentation .......................................... 28
Figure 3. 5: Block diagram of graphical user interface .............................................. 29
Figure 4. 1: Basic flow of thresholding technique ..................................................... 31
Figure 4. 2: Basic flow of FCM technique ................................................................. 31
Figure 4. 3: Original image ........................................................................................ 34
Figure 4. 4 (a): the original normalized image and its histogram. ............................. 35
Figure 4. 5 (a): Image Splitting .................................................................................. 37
Figure 4. 6: Optimal threshold with Gamma-law enhancement ................................ 38
Figure 4. 7: Maximum block histogram ..................................................................... 38
Figure 4. 8: Histogram ROI ....................................................................................... 39
Figure 4. 9: Divergence .............................................................................................. 39
Figure 4. 10: Region of Interest (ROI) ....................................................................... 40
Figure 4. 11: Brain segmentation ............................................................................... 40
Figure 4. 12: Features Boundary ................................................................................ 40
Figure 4. 13: ROI Image ............................................................................................ 41
Page 12
xii
Figure 4. 14: Result of thresholding ........................................................................... 42
Figure 4. 15: Fuzzy C-means Result .......................................................................... 44
Figure 4. 16: Result for ROI image ............................................................................ 45
Figure 4. 17: Bar graph of Segmentation Result ........................................................ 47
Figure 4. 18: Bar graph for Accuracy of Image Segmentation .................................. 47
Figure 4. 19: Bar graph for Percentage of the Segmentation Result .......................... 48
Page 13
xiii
LIST OF TABLES
Table 4. 1: Threshold value of the proposed methods ............................................... 46
Table 4. 2 : Segmentation Result ............................................................................... 46
Table 4. 3: Accuracy of Image Segmentation Result ................................................. 47
Table 4. 4: Percentage of the Segmentation Result.................................................... 48
Page 14
xiv
LIST OF ABBREVIATION
MRI – Magnetic Resonance Imaging
DW-MRI – Diffusion Weight Magnetic Resonance Imaging
FCM – Fuzzy C-Means
DWI - Diffusion Weighted Imaging
WM – White matter
GM – Grey Matter
CSF – Cerebrospinal Fluid
Page 15
xv
LIST OF APPENDIX
NO. TITLE
1. Figure1: Region of Interest(ROI) Segmentation Result
2. Figure2: Threshold value
Page 16
CHAPTER 1
INTRODUCTION
1.1 Project Background
This project is about image segmentation application in medical imaging
which aims to segment the MRI brain image using thresholding and fuzzy c-means
methods. Image segmentation is very important in medical field. In brain magnetic
resonance imaging (MRI), it is been used to detect the brain tissues abnormality,
which is the key for diagnosis treatment and planning. The brain tissues that involve
in brain image segmentation are white matter (WM), grey matter (GM) and
cerebrospinal fluid (CSF) [1]. The changes in the composition of these tissues area
used to determine classification of brain disease such as tumours and stroke. The
objective of this project is to design automated brain MRI image segmentation by
using fuzzy C-means (FCM) clustering method and thresholding segmentation. The
technique will be tested on brain MRI. The goal is to analyse the most accurate
technique that can separate, cluster and extract the brain tissue types and
abnormalities structures in MRI images.
Thresholding method identifies a region based on the pixels with similar
intensity values. This technique provides boundaries in images that contain solid
objects on a contrast background. This technique gives binary output image from a
grey scale image. The main limitation for image segmentation based on thresholding
Page 17
2
is that only two classes are generated and it cannot be used for multi-channel images
[1].To get the desired segmented output we can select either any one or combination
of methods based on the application.
Fuzzy c-means (FCM) image segmentation clustering algorithm has been
commonly use in medical field but the standard FCM algorithm is sensitive to noise.
To overcome the problem a modified FCM algorithm is used by incorporating the
spatial neighbourhood information into the standard FCM algorithm and modifying
the membership weighting of each cluster. The thresholding is the most simple and
commonly used method in image segmentation to detect the contour of the tumour in
brain. Therefore, at the end of project we will conclude which methods can produces
higher accuracy result.
1.2 Problem Statement
The process of brain MRI segmentation is done manually by neuro-
radiologists. The process is time consuming not quantitative, not accurate and have
significant differences between expertises. Therefore, radiologists are continuously
seeking for computerized tools to ease their diagnosis. Automatic segmentation
would serve as compliment and second option with neuro-radiologists. This project
will be able to increase the accuracy and performance analysis of MRI brain image
segmentation. There are many image segmentation techniques in this field but there
is no perfect accuracy. Researchers are continuously seeking for better and
improvement technique form the existed techniques. The purpose of the project is to
design a method for brain MRI image segmentation that can produce the most
accurate performance analysis. Thus, this project can help radiologists to ease their
diagnosis. This project also gives benefits for the researcher in this field.
Page 18
3
1.3 Objectives
The objective of this project:
1. To design method for brain MRI image segmentation.
2. To analyze the automated brain MRI image segmentation by using modified
fuzzy C-means (FCM) clustering method and thresholding segmentation.
3. To analysis which method will produce the more accurate result.
1.5 Scope of Project
The scope of the project is as following:
1. Type of image use is brain diffusion-weighted MRI (DW-MRI).
2. The brain image is focus on normal, tumour and stroke patients.
3. This project concentrates on the process of segmentation and detection of the
abnormalities.
4. MATLAB software will be used to develop the algorithms.
1.6 Methodology
1) Literature Review
Research and information collections of MRI brain image, thresholding
method, fuzzy c-means and manual segmentation. The sources are based on
journals, internet resources and books.
2) Data collection and pre-processing
The type of image been used in DCIM. Pre-processing consists of three steps
which are normalization, background removal and gamma-law
transformation.
3) Manual segmentation by radiologists
Manual segmentation is done by the radiologists using free hand. The dataset
then was transfer to the MATLAB.
Page 19
4
4) Design thresholding method
Thresholding method identifies a region based on the pixels with similar
intensity values.
5) Design FCM method
FCM method is based on iterative process.
6) Verify the performance of both methods.
Compare the thresholding and fuzzy c-means method with the manual
segmentation by the neuro radiologists.
1.6 Thesis Organization
This report contains five chapters. Chapter one describe about introduction of
brain image MRI segmentation using FCM and Thresholding techniques, problem
statement of the project, objective of the project, the purpose of the project that
describe the reason for developing this project, scope of the project and organization
of the report.
Chapter two is literature review about the brain image MRI segmentation.
This chapter review on previous research about the topic related to the project.
Various methods and approaches that related to the project is discussed and
reviewed.
Chapter three explains the methodology of the project. This project will used
thresholding and fuzzy c-means algorithms techniques. The flow chart of the project
and the algorithms use is explained in this chapter.
Chapter four is about results of the MATLAB simulation and discussion
regarding the results. Lastly, chapter five will conclude the project findings and
recommendation for the further study.
Page 20
5
CHAPTER 2
LITERATURE REVIEW
2.1 Introduction
Chapter two is the literature review of the project. In this chapter MRI brain
image, brain image segmentation process and the proposed method used are
explained in details based on various journals, books and internets resources.
2.2 Neuroimaging
Neuroimaging falls into two categories which are structural and functional
imaging. Structural imaging deals with the structure of the brain while functional
imaging used to diagnose metabolic diseases and lesions on a finer. There are many
brain imaging techniques such as Computed Axial Tomography (CAT), diffuse
optical imaging (DOT), Event-related optical signal (EROS), Magnetic resonance
imaging (MRI), functional magnetic resonance imaging (fMRI), Magneto
encephalography(MEG), positron emission tomography (PET) and Single-photon
emission computed tomography (SPECT)[2]. The advantage of MRI is to detect
water molecules. In the brain 70% of brain tissues are water. In this research we
specified into MRI imaging technique.
Page 21
6
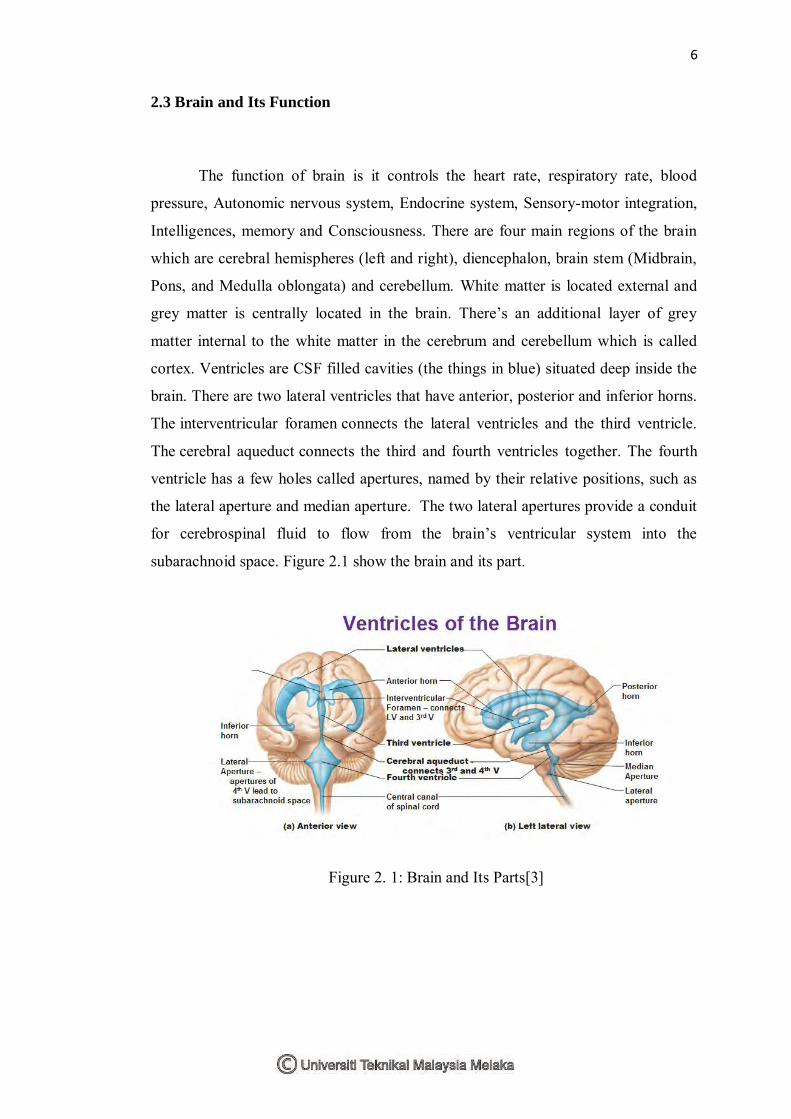
2.3 Brain and Its Function
The function of brain is it controls the heart rate, respiratory rate, blood
pressure, Autonomic nervous system, Endocrine system, Sensory-motor integration,
Intelligences, memory and Consciousness. There are four main regions of the brain
which are cerebral hemispheres (left and right), diencephalon, brain stem (Midbrain,
Pons, and Medulla oblongata) and cerebellum. White matter is located external and
grey matter is centrally located in the brain. There’s an additional layer of grey
matter internal to the white matter in the cerebrum and cerebellum which is called
cortex. Ventricles are CSF filled cavities (the things in blue) situated deep inside the
brain. There are two lateral ventricles that have anterior, posterior and inferior horns.
The interventricular foramen connects the lateral ventricles and the third ventricle.
The cerebral aqueduct connects the third and fourth ventricles together. The fourth
ventricle has a few holes called apertures, named by their relative positions, such as
the lateral aperture and median aperture. The two lateral apertures provide a conduit
for cerebrospinal fluid to flow from the brain’s ventricular system into the
subarachnoid space. Figure 2.1 show the brain and its part.
Figure 2. 1: Brain and Its Parts[3]
Page 22
7
Figure 2. 2:Brain and Functional Areas [3]
Figure 2.2 show that brain and functional areas. White matter is a component
of the central nervous system consists mostly of glial cells and myelinated axons that
transmit signals from one region of the cerebrum to another and between the
cerebrum and lower brain centers. White matter affects how the brain learns and
functions, acting as a relay and coordinating communication between different brain
regions. The white matter is white because of the fatty substance (myelin) that
surrounds the nerve fibers (axons). This myelin is found in almost all long nerve
fibers, and acts as an electrical insulation. This is important because it allows the
messages to pass quickly from place to place. Grey matter (or gray matter)is a major
component of the central nervous system, consisting of neuronal cell
bodies, neuropil (dendrites and myelinated as well as unmyelinated axons), glial cells
(astroglia and oligodendrocytes) and capillaries [4].
Grey matter contains numerous cell bodies and relatively few myelinated
axons, while white matter is composed chiefly of long-range myelinated axon tracts
and contains relatively very few cell bodies. Grey matter contains most of the brain's
neuronal cell bodies which includes regions of the brain involved in muscle control,
and sensory perception such as seeing and hearing, memory, emotions, speech,
decision making, and self-control. 20 % of all oxygen taken in by the body will goes
Page 23
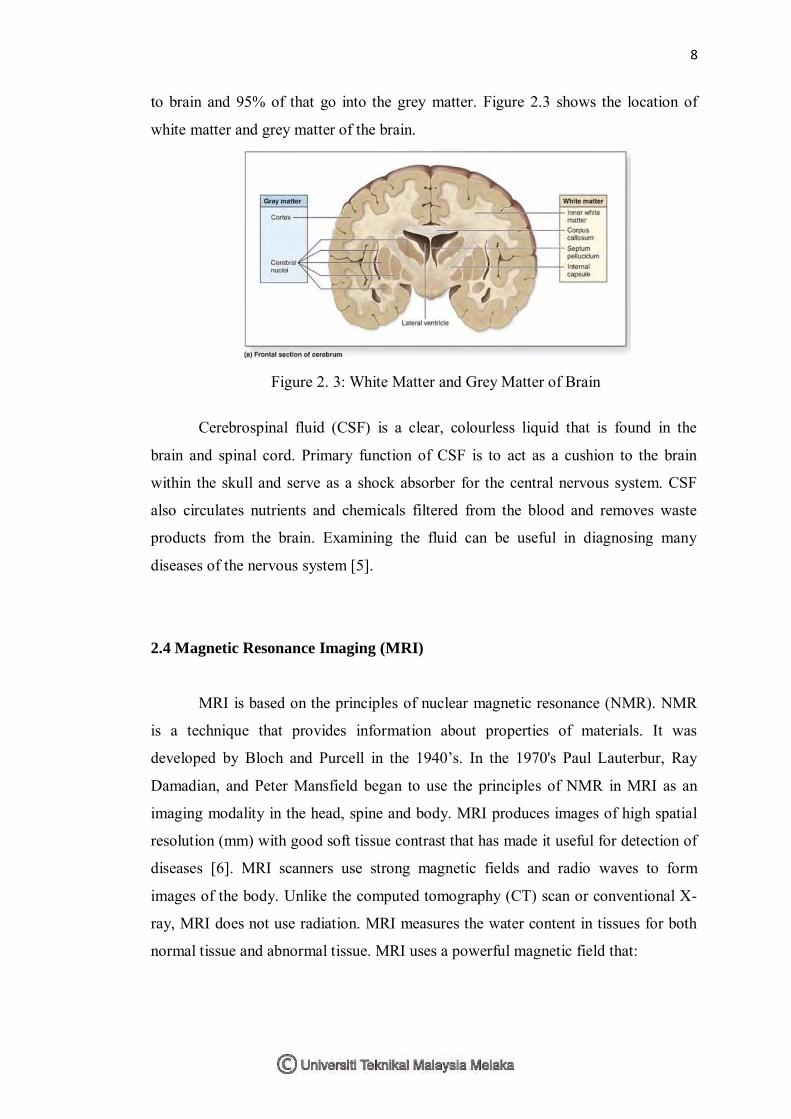
8
to brain and 95% of that go into the grey matter. Figure 2.3 shows the location of
white matter and grey matter of the brain.
Figure 2. 3: White Matter and Grey Matter of Brain
Cerebrospinal fluid (CSF) is a clear, colourless liquid that is found in the
brain and spinal cord. Primary function of CSF is to act as a cushion to the brain
within the skull and serve as a shock absorber for the central nervous system. CSF
also circulates nutrients and chemicals filtered from the blood and removes waste
products from the brain. Examining the fluid can be useful in diagnosing many
diseases of the nervous system [5].
2.4 Magnetic Resonance Imaging (MRI)
MRI is based on the principles of nuclear magnetic resonance (NMR). NMR
is a technique that provides information about properties of materials. It was
developed by Bloch and Purcell in the 1940’s. In the 1970's Paul Lauterbur, Ray
Damadian, and Peter Mansfield began to use the principles of NMR in MRI as an
imaging modality in the head, spine and body. MRI produces images of high spatial
resolution (mm) with good soft tissue contrast that has made it useful for detection of
diseases [6]. MRI scanners use strong magnetic fields and radio waves to form
images of the body. Unlike the computed tomography (CT) scan or conventional X-
ray, MRI does not use radiation. MRI measures the water content in tissues for both
normal tissue and abnormal tissue. MRI uses a powerful magnetic field that:
Page 24
9
1) Makes the hydrogen protons in water molecules line up in the direction of the
magnetic field.
2) Once the hydrogen protons have been lined up, radio waves are used to knock
them out of line.
3) When the radio waves are stopped, the protons relax back into line. As they
relax, the protons release resonance signals that are transmitted to a computer.
Figure 2.4 show the MRI scanner while Figure 2.5 shows the MRI scanner
cutaway. The most commonly use types of MRI scans are the T1-weighted scan and
the T2-weighted scan to measure the relaxation time in different ways. Then
computer programs will translate these data into cross-sectional pictures of the water
in human tissue. Because the layer of myelin that protects nerve cell fibers is fatty, it
repels water. In the areas where the myelin has been damaged by MS, the fat is
stripped away. With the fat gone, the area holds more water, and shows up on an
MRI scan as either a bright white spot or a darkened area depending on the type of
scan that is used. Few examples of MRI scan been used is T1-weighted, T2-weighted
and FLAIR. These are the most commonly scan used in clinical care.
Figure 2. 4: MRI Scanner