Capacity planning is crucial for successful development of enterprise applications. Capacity
planning activities are most consequential during the verification and maintenance phases of
Software Development Life Cycle. During the verification phase, analysts need to execute a large
number of performance tests to build accurate performance models. Performance models help
customers in capacity planning for their deployments. To build valid performance models, the
performance tests must be redone for every release or build of an application. This is a time-
consuming and error-prone manual process, which needs tools and techniques to speed up the
process. In the maintenance phase, when customers run into performance and capacity related
issues after deployment, they commonly engage the vendor of the application for troubleshooting
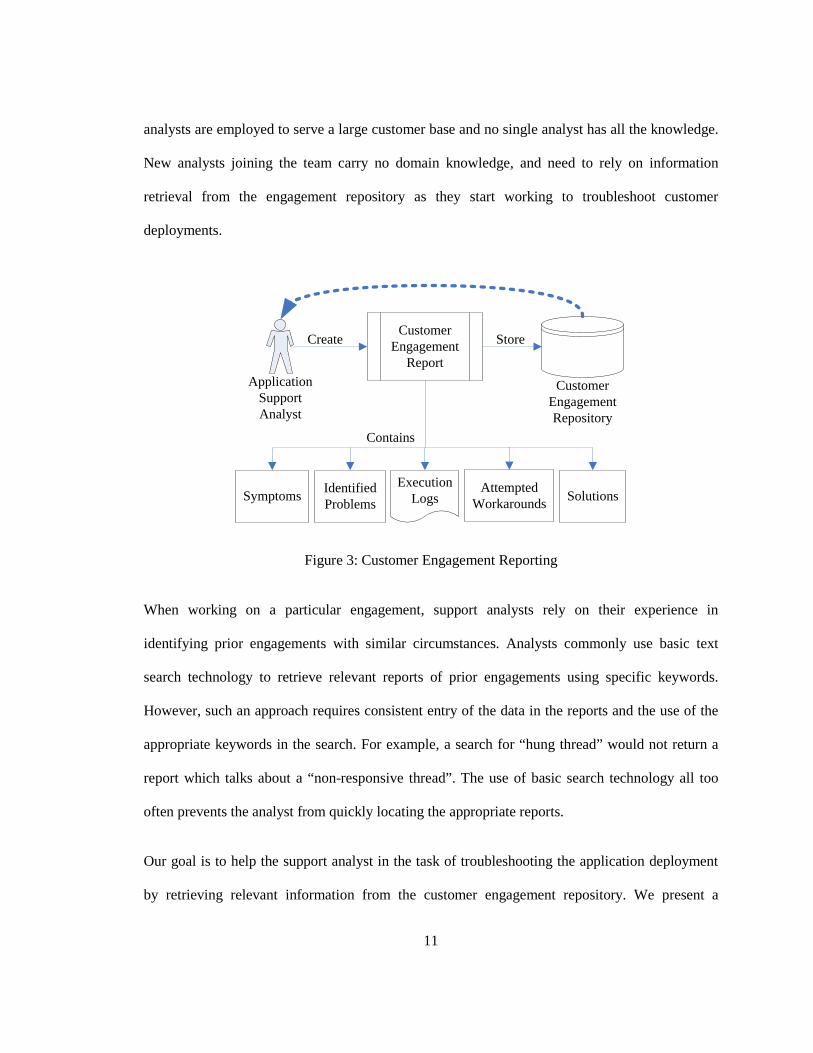
and fine tuning of the troubled deployments. At the end of the engagement, analysts create
engagement report, which contain valuable information about the observed symptoms, attempted
workarounds, identified problems, and the final solutions. Engagement reports are stored in a
customer engagement repository. While information stored in the engagement reports is valuable
in helping analysts with future engagements, no systematic techniques exist to retrieve relevant
reports from such a repository.
In this thesis we present a framework for the systematic and automated building of capacity
calculators during software verification phase. Then, we present a technique to retrieve relevant
reports from a customer engagement repository. Our technique helps analyst fix performance and
capacity related issues in the maintenance phase by providing easy access to information from
relevant reports. We demonstrate our contributions with case studies on an open-source
benchmarking application and an enterprise application.
iii
Acknowledgements
This thesis would not have been possible without the continuous support of my wife and parents
who always supported me and gave me the will to succeed.
I cannot thank enough my supervisor Dr. Ahmed E. Hassan for his continuous support and
advice. Dr Hassan always provided great suggestion and constant motivation throughout my
research career. This has been one of the best memorable experiences of my life.
I sincerely appreciate the valuable feedback from my thesis readers: Dr. Mohammad Zulkernine,
Dr. Tom Dean, and Dr. Jim Cordy.
I am very fortunate to work with the amazing members of Software Analysis and Intelligence Lab
(SAIL). In particular, I would like to thank ZhenMing (Jack) Jiang, Haroon Malik, and Emad
Shihab for all their help and encouragement. A special thanks to Jack for being a close friend ever
since I moved to Canada and started my graduate studies at the University of Victoria. I also
thank Gilbert Hamann and Parminder Flora from the Enterprise Performance Engineering group
at Research In Motion (RIM) for providing me the opportunity to conduct practical research to
help their business.
Finally, I thank my wife again for patiently taking care of our daughter and everything else in life
while I worked away on my research and thesis.
iv
Statement of Originality
I hereby certify that all of the work described within this thesis is the original work of the author.
Any published (or unpublished) ideas and/or techniques from the work of others are fully
acknowledged in accordance with the standard referencing practices.
(Dharmesh Thakkar)
v
Table of Contents
Abstract ............................................................................................................................................ ii
Acknowledgements ......................................................................................................................... iii
Statement of Originality .................................................................................................................. iv
Table of Contents ............................................................................................................................. v
List of Figures ............................................................................................................................... viii
List of Tables .................................................................................................................................. ix
Our first test application is the Dell DVD Store application. The DVD Store (DVD Store 2 or
DS2) application is an open source enterprise software application. The DS2 application is
developed by Dell as a benchmarking workload for white papers and demonstrations of Dell’s
hardware solutions [15]. DS2 seeks to emulate today’s online stores, architecturally and
functionally. DS2 has a three-tier architecture. DS2 includes application server components,
database server components and a load generator engine (client emulator).
The DS2 load generator emulates website users by sending HTTP requests to the application
front-end. The DS2 application front-end encodes the various business rules, such as ordering
new titles, declining an order in case of insufficient inventory. All customers, titles and
transactional data are stored in the database server tier. We chose DS2 over other applications
since it is an open source application which others can download to easily compare our results
with their work.
Experimental Setup
To demonstrate the feasibility of our technique, we need to create a repository of log files. We
generate a large number of log files based on various simulated runs of the application. For each
log file we ensure that we produce other relevant log files. Once we have these log files, we can
pick each log file and use our technique to retrieve other relevant log files. We can then measure
the precision and recall of our technique.
Since the DS2 application is a benchmarking application that is not intended for production
deployment, it is not designed to generate execution logs. So for the purpose of our case study,
63
we instrumented the application code to generate logs for execution events. The main operational
features in the DS2 application are: Create Account, Login, Search the Store, Add to Cart and
Checkout. We instrumented the code so that each of these operational features would generate a
balanced number of execution events (four events each). So we have 20 different execution
events in total.
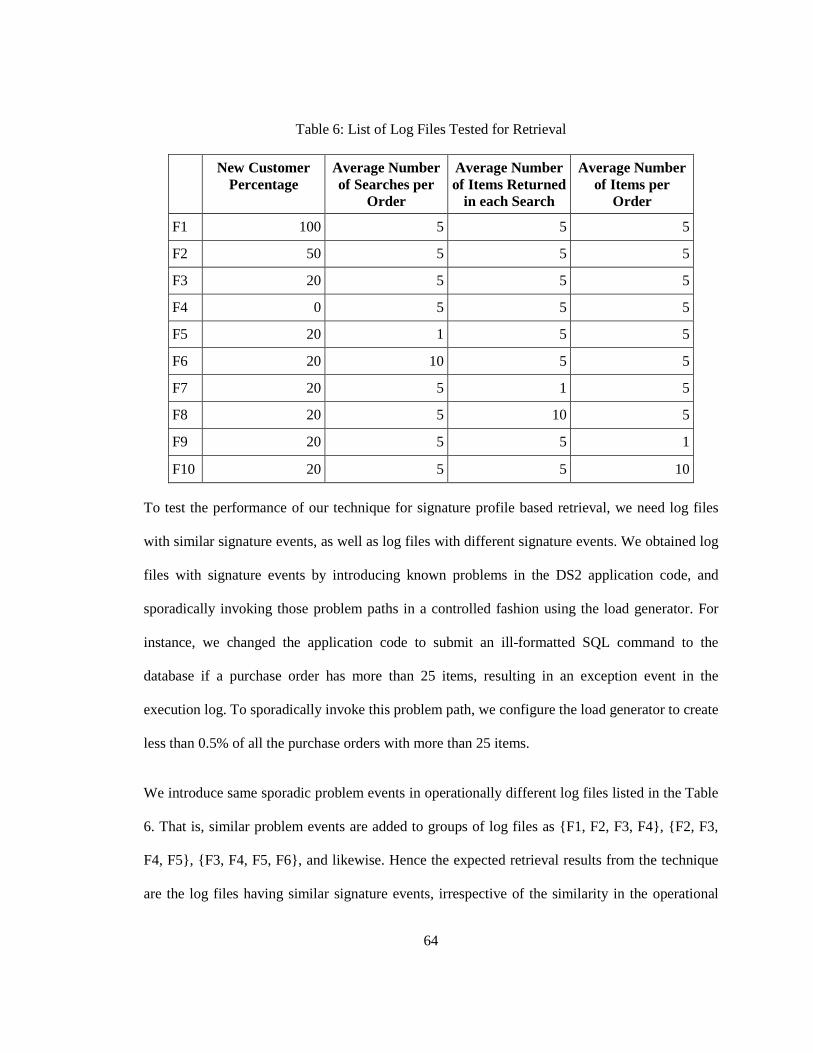
We applied different synthetic workloads and collected the resulting execution log files. Table 6
lists the log files we collected. Each column in the table is a workload parameter, whose unique
value makes operational features exercised in corresponding proportion, leading to unique
execution logs. New Customer Percentage parameter identifies percent of the order cycles that
would exercise the Create Account feature. Its value can be between 0 and 100, its typical value
is 20. Average Number of Searches per Order identifies the number of times the Search operation
should be performed in an order cycle, its typical value is 5 in the application. The remaining two
parameters Average Number of Items Returned in each Search and Average Number of Items per
Order are fairly self-explanatory. To create our repository of logs, we conduct load sessions with
three different settings for each of the parameters – the typical value for the parameter and a value
on either side of the typical value – for each of these parameters, while keeping the other
parameters at their typical value. The resulting list of operational profiles is presented in Table 6,
in which each row is a unique log file.
Since we aim to retrieve relevant log files with similar operational profile, we reran all the load
sessions of Table 6 three times each. Thus, for each log file our technique for similar operational
profile should return the three log files corresponding for the three reruns.
64
Table 6: List of Log Files Tested for Retrieval
New Customer Percentage
Average Number of Searches per
Order
Average Number of Items Returned
in each Search
Average Number of Items per
Order
F1 100 5 5 5
F2 50 5 5 5
F3 20 5 5 5
F4 0 5 5 5
F5 20 1 5 5
F6 20 10 5 5
F7 20 5 1 5
F8 20 5 10 5
F9 20 5 5 1
F10 20 5 5 10
To test the performance of our technique for signature profile based retrieval, we need log files
with similar signature events, as well as log files with different signature events. We obtained log
files with signature events by introducing known problems in the DS2 application code, and
sporadically invoking those problem paths in a controlled fashion using the load generator. For
instance, we changed the application code to submit an ill-formatted SQL command to the
database if a purchase order has more than 25 items, resulting in an exception event in the
execution log. To sporadically invoke this problem path, we configure the load generator to create
less than 0.5% of all the purchase orders with more than 25 items.
We introduce same sporadic problem events in operationally different log files listed in the Table
6. That is, similar problem events are added to groups of log files as {F1, F2, F3, F4}, {F2, F3,
F4, F5}, {F3, F4, F5, F6}, and likewise. Hence the expected retrieval results from the technique
are the log files having similar signature events, irrespective of the similarity in the operational
65
events. That is, the expected result set for F3 are F1, F2, F4, F5; expected result set for F4 are F2,
F3, F5, F6; and likewise.
Experiment Results
Using our technique, we could correctly retrieve the relevant operational profile and relevant
signature profile with 100% precision and 100% recall using both the K-L divergence and cosine
distance metrics.
5.2 Case Study on an Industrial Application
Our second application is a multithreaded enterprise application deployed at many organizations
worldwide. The application provides rich enterprise communication features, such as email and
calendar synchronization. With more than 700 unique execution events (compare to 20 unique
execution events in DS2 application), it provides a base for a fairly complex experiment setup.
5.2.1 Studying Retrieval by Operational Profile
The Application
We studied the effectiveness of our technique on many different experiments. In the subsections
5.2.1.1 to 5.2.1.5, we present these experiments. Although these experiments do not cover all
possible real world operational profile comparison situations, we believe they represent the
breadth of it. Table 7 summarizes results of all the experiments. We discuss each of the
experiments in the following subsections.
Experimental Setup and Results
5.2.1.1 Single Feature Group
In this experiment, we use log files of workloads with a single feature group of the application. A
feature group is a set of related operational features of the application. For example, an enterprise
66
collaboration suite such as Zimbra or Microsoft Exchange Server has feature groups such as
emails, instant messages, calendar, and address book. A feature group has features, for instance,
email feature group has operational features send email, receive email and delete email. In this
experiment, each execution log file is obtained by exercising a different feature group of the
application using a workload generator. We exercised seven individual feature groups of the
application, providing log files that represent seven different operational profiles. Then we rerun
each of the seven workloads three times each, to obtain log files which represent similar
operational profiles. Thus for each log file, our technique is expected to return the three log files
for the three reruns. We have a total of 28 log files, for each which, our technique tries to retrieve
the related log files.
Table 7: Performance of Retrieval using Operational Profiles
Experiment Count of Log Files
K-L Distance Cosine Distance
Precision Recall Precision Recall
Single Feature Group 28 67.71% 90.28% 67.71% 90.28%
Multiple Feature Groups 28 60.71% 80.95% 75.00% 100%
All Feature Groups 12 72.92% 97.22% 62.50% 83.33%
Real World Log Files 12 54.17% 72.22% 68.75% 91.67%
All the Log Files 80 59.93% 79.90% 56.72% 75.62%
5.2.1.2 Multiple Feature Groups
In the previous experiment, the log files were obtained by exercising different feature groups of
the application. Hence, log files corresponding to different feature groups are likely to have few
common events. Only a few events logged by entry point and exit point modules common to
different feature groups will be seen in multiple log files. All other events among those logs
would be different. Naturally, event logs having only a few common events represent vastly
67
different distributions. It is possible to believe that this bias can result in seeing higher
effectiveness of our technique, which is unlikely to exist in real world. Hence, we conduct this
experiment, having incremental addition of feature groups to the log files.
We start this experiment with exercising a single feature group of the application using the
workload generator, and collect the log files. For subsequent log files, we keep adding the feature
groups one by one to the list of exercised feature groups. Thus, we build a repository of seven log
files which represent operational profiles with incremental feature groups exercised in those
profiles. Now we rerun those workloads three times each. Thus we have a pool of 28 log files for
each which, our technique tries to retrieve the related log files. Now we apply our technique to
retrieve the relevant log files. For each log file, the expected relevant log files are its three
siblings from the three reruns, followed by the neighboring log files in which one less and one
more feature group was exercised.
5.2.1.3 All Feature Groups
In the previous experiment, each log file had a mix of feature groups exercised in it. However,
because the feature groups were exercised incrementally, it is obvious that each log file would
exhibit successively more events. Thus the log files are likely to have different set of events. The
set of distributions which have different set of events are likely to show greater distance,
compared to the set of distributions with common events. It is arguable that this can result in
seeing higher effectiveness of our technique in such situations, which are unlikely to exist in real
world. Hence, we conduct this experiment with real world operational profiles.
The log files in this experiment have all the events in common, but differ only in the frequencies
of those events. We conduct multiple load sessions on the application, and exercise all the feature
groups. We make the load sessions to differ only in the intensities of exercising the feature
68
groups. We conduct three load sessions with varying intensities of the seven operational features.
Then we rerun each of the seven load sessions three times each, to obtain log files which
represent similar operational profiles. For each of the 12 log files, the expected relevant log files
are its three siblings from the three reruns.
5.2.1.4 Real World Log Files
In the previous experiment, each log file had a mix of operational features exercised in it.
However, because the operational features were exercised incrementally, it is obvious that each
log file would exhibit successively more events. Thus the log files are likely to have different set
of events. The set of distributions which have different set of events are likely to show greater
distance, compared to the set of distributions with common events. It is arguable that this can
result in seeing higher effectiveness of our technique in such situations, which are unlikely to
exist in real world. Hence, we conduct this experiment with real world operational profiles.
We apply our technique on execution logs from three deployments of the application. However,
we do not know the expected result set, unlike the previous two experiments. So we divide each
log file in four segments, for which relevant log files are being retrieved. Assuming that usage
pattern for any field deployment will not change to a great extent in short duration, we expect that
our technique should retrieve the three segments of the same log file for each of the 12 log file
segments.
5.2.1.5 Combining all the Log Files
In this final experiment for operational profiles, we compare together all the log files generated in
all the previous experiments. As a result, we have some log files that exhibit different operational
feature, some exhibiting incremental addition of operational features, and some have same
operational features, but different intensities. This experiment includes all possible scenarios and
69
a large pool of log files to be compared. It represents the most intense test of accuracy of our
technique. In total, we have 80 different log files profiles – collection of all the log files listed in
experiments discussed in sections 5.2.1.1 to 5.2.1.4. For each log file, the expected relevant log
files are same as described in those sections.
5.2.2 Studying Retrieval by Signature Profile
Experiment Setup
The experiment setup for studying signature profile retrieval needs log files with similar signature
events, as well as log files with different signature events. The startup events are a set of known
signature events in the log files of the application under study. The startup events are logged by
the application at the application startup. The startup events log the state of the environment, such
as list of processes running in the system, system uptime, and configuration parameter values. To
use the startup events as signature events of the log files, we split each of the log files in four
segments. Hence the first segment of each log file contains the startup events, while the
subsequent three segments do not have those. For each first segment of each log file, the expected
relevant log files are the first segments of other log files. For each the first segments, the
remaining segments of the same log file are likely to be operationally similar, but we do not
expect those in the result set as we are trying to retrieve log files based on similar signature
profile.
Experiment Results
We took all the log files from the previous study on the operational profile, except the reruns.
Thus we have 20 log files, which are divided in four segments each. We applied signature profile
based retrieval technique on the first segment of each of the log files. Our technique correctly
70
retrieved the first segment of other logs with 100% precision and 100% recall, even though the
first segment is likely to be operationally closer to the other three segments of the same log.
5.3 Chapter Summary
In this chapter we discussed a list of key case studies that we performed. These studies exercise
our technique in different possible real world and in-the-lab scenarios. We chose an open-source
application and instrumented it to provide us execution logs, so that we can control and enact
different possible real-life logging scenarios. Then we also conduct similar tests on a globally
deployed industrial application. Our tests show promising results – retrieval of related
engagement reports at high precision and high recall, i.e. minimal number of false-positives and
maximum number of related reports successfully retrieved from the repository. In the next
chapter we critically discuss the results.
71
Chapter 6
Results and Limitations
Chapter 3 discussed our framework for building capacity calculators. Chapter 3 also presented
case study of applying our framework for the DS2 test application. Chapter 4 provided the details
of our technique on customer support for capacity planning related issues. Chapter 5 provided
case studies for our technique using the DS2 test application and a widely deployed commercial
application. In this chapter we critically discuss the results and limitations of our framework and
technique.
6.1 Framework for Building Capacity Calculators
The proposed framework is based on our research and experience in measurement based
modeling of two applications: the Dell DS2 application and another large enterprise application.
These applications are complex enterprise applications but they may not represent the entire class
of enterprise applications. Additional steps and limitations may be discovered while applying the
framework to other applications.
We integrated research from other researchers to automate various steps in our framework.
However, limited research was available in a few of the steps, so we employed heuristics in those
steps. One of the key benefits of our framework is that it directs researchers to focus on these
areas. Moreover the encoding of those heuristics in the framework ensures that the repetitive
tasks corresponding to those heuristics are well-documented and could be later revisited by
practitioners.
Some of the dynamic analysis activities are currently not automated in the framework and a
performance analyst must conduct these activities manually. This is our first attempt at building
72
this framework, which can be extended further with research work focusing on each of the
following points.
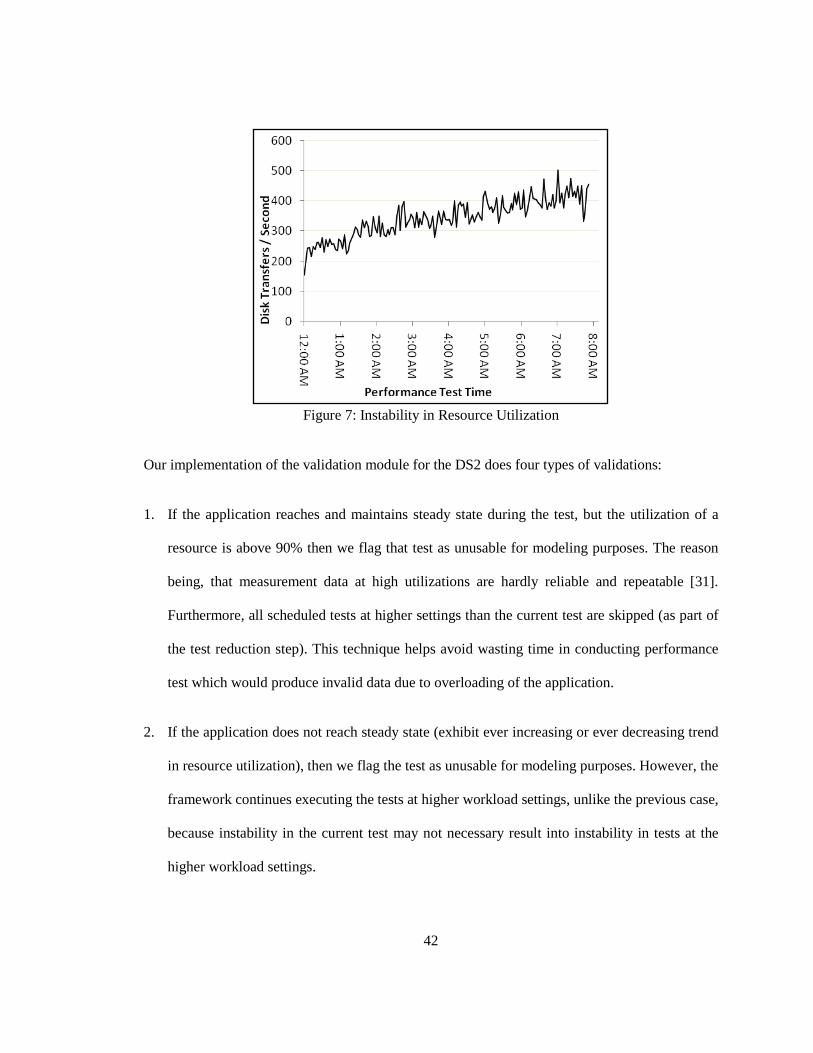
• Adjusting the performance tests to precisely determine various key operational points or
objects, e.g. knee capacity and bottleneck resources. Unless the tests are carefully designed,
the built model can be inaccurate near such operational points.
• Adjusting the performance testing period and lengths of ramp-up and cool-down periods.
This mainly involves determining how long the application takes to reach steady state
condition and how many data points we need in each test, to be confident enough about the
input data and analysis results.
6.2 Technique for Customer Support on Capacity Planning
The case studies discussed in chapter 7 demonstrate the performance of our technique. We
achieved perfect results for the DS2 application due to the simplicity of the application and
balanced instrumentation of all the operational features of the application. For the industrial
application, our technique for operational profile performed well with the K-L divergence metric,
and marginally better with the cosine distance metric. We believe the inaccuracies in the results
for the industrial application stem from these complexities of real world applications:
1. Real world applications often log a large number of events which do not correspond
directly to a particular operational feature, such as idle time events, server health check
events, and startup and shutdown events. Moreover, there can be an imbalance of such
events, which can lead to inaccuracies in the result of our technique. For instance, if the
application generates the health check events more frequently while in idle time, this is
an example of imbalance.
73
F1E2
E1
F2E4
E3
E6
E5
F3E8
E7
E10
E9
400
F1E2
E1
F2E4
E3
E6
E5
F3E8
E7
E10
E9
F1E2
E1
F2E4
E3
E6
E5
F3E8
E7
E10
E9
E12
E11
E12
E11
E12
E11
OP1 OP2 OP3
400
200
400
450
200
400
400
220
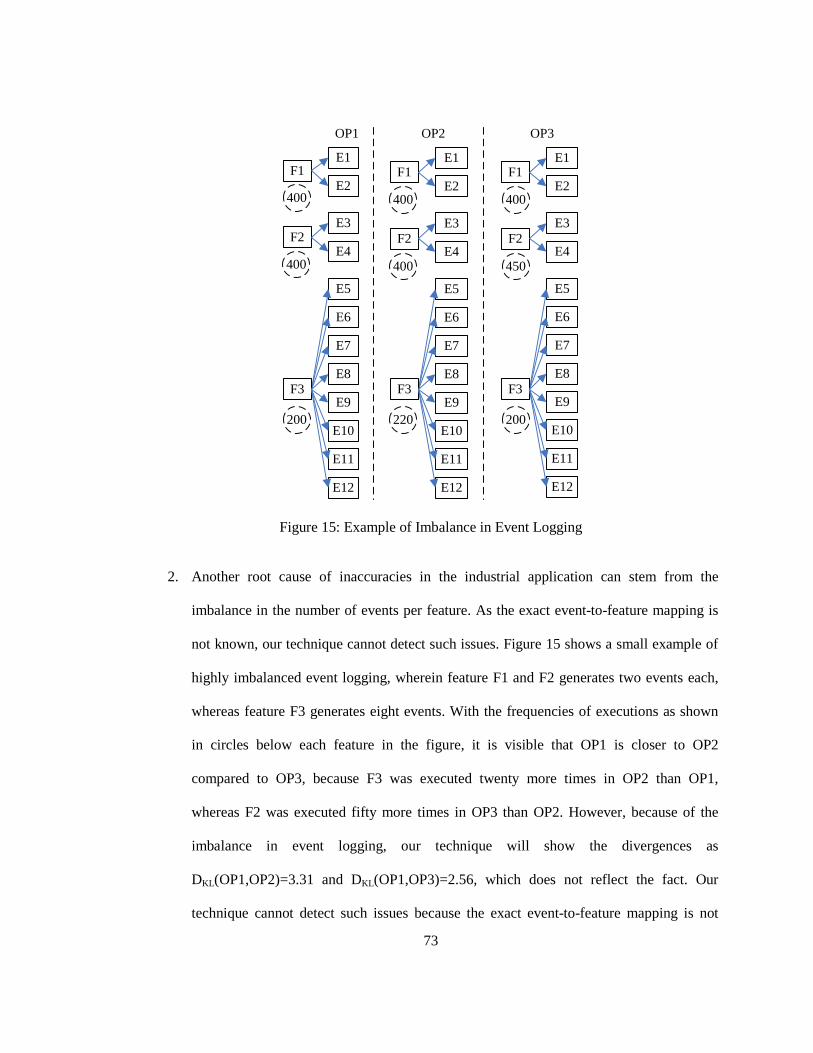
Figure 15: Example of Imbalance in Event Logging
2. Another root cause of inaccuracies in the industrial application can stem from the
imbalance in the number of events per feature. As the exact event-to-feature mapping is
not known, our technique cannot detect such issues. Figure 15 shows a small example of
highly imbalanced event logging, wherein feature F1 and F2 generates two events each,
whereas feature F3 generates eight events. With the frequencies of executions as shown
in circles below each feature in the figure, it is visible that OP1 is closer to OP2
compared to OP3, because F3 was executed twenty more times in OP2 than OP1,
whereas F2 was executed fifty more times in OP3 than OP2. However, because of the
imbalance in event logging, our technique will show the divergences as
DKL(OP1,OP2)=3.31 and DKL(OP1,OP3)=2.56, which does not reflect the fact. Our
technique cannot detect such issues because the exact event-to-feature mapping is not
74
known to our technique. One simple way to handle such wide imbalances is to create
meta-events which group co-occurring events together. These meta-events can be used
for measuring the distance between event distributions. For the example in Figure 15,
events E1 and E2 would be considered one event M1, E3 and E4 would be considered
one event M2, and E5 to E12 would be considered one event M3 since each group of
event is occurring an equal number of times. The M1-M3 events would be used for
measuring the distance between event distributions instead of the E-type events.
Empirical research studies should be evaluated to determine whether they are measuring what
they were designed to assess. In particular, we should examine if our finding that a given log file
is more relevant to a particular log file compared to others is valid and applicable in general; or if
it is due to any flaws in our experimental design. Four types of tests are used [52]: construct
validity, internal validity, external validity, and reliability.
Construct Validity: Construct validity is concerned with the meaningfulness of the
measurements – Do the measurements quantify what we really intend to measure? We claim that
locating related execution logs attached to customer engagement report will help support analysts
in resolving problems sooner. We have not validated this claim, but based on our experience,
locating a relevant case is usually of great value and provides many starting points if not the
needed final solution.
Precision and recall metrics do not capture the internal rank among the retrieved operational
profiles. For example, consider that our technique retrieved OP2, OP3 and OP4 (in that order) but
the actual rank of closeness among these three is OP3, OP2 and OP4 (in that order). The precision
and recall metrics do not seem to reflect such unfairness in retrieving OP3 first instead of OP2.
In our experiments, we did not observe such unfairness. Furthermore, we assume that all the
75
related engagement reports retrieved by our technique are useful to the analyst working on a new
customer engagement.
Internal Validity: Internal validity deals with the concern that there may be other plausible
reasons to explain our results – Can we show that there is a cause and effect relation between
differences in operational profiles and ranking of those by our technique? We assume here that
execution logs capture the operational profile and signature profile of an application. We believe
this is a valid assumption; however, the presence of wide imbalances in event logging, as
discussed above, can invalidate our assumption. Moreover, our case study uses logs from the
same version of an application. We did not test our technique on the execution logs of different
versions. We believe limitations might be observed if there are large changes in the type of
logged events.
External Validity: External validity tackles the issue of the generalization of the results of our
study – Can we generalize our results to other software applications? Although we applied our
technique on a small test application and a complex enterprise application developed by a large
number of practitioners, we only looked at two applications. Therefore our results may not
generalize to other types of applications.
Reliability: Reliability refers to the degree to which someone analyzing the data would reach the
similar results as us. We believe that the reliability of our technique is high. Practitioners and
researchers can easily run the similar tests on their applications (or the DS2 application) to
produce findings specific to these applications, and compare those to our findings.
76
6.3 Chapter Summary
We presented a critical view of the results and limitations our work in this chapter. Our work
seeks to support performance engineering and capacity planning related activities during the
verification and maintenance SDLC phases.
Our framework seeks to bring together difference research and automate the capacity calculator
building process. While the work is implemented in practice, it is still a work in progress. The
performance tests need to be carefully designed, and may be required to be adjusted during the
process to exercise certain important operational points, such as knee capacity and bottleneck
resources. Also, not all steps are automated yet. We have not yet determined precise way to
automatically prune the warm-up and cool-down periods.
Limitations with our customer support technique include noise resulting from events that do not
map to any operational features. Though, we did not find significant effect of such noise events in
our tests with the two applications that we chose to experiment with. Imbalance caused by some
operations logging too many events, while other operations remaining silent may also lead to
impact the accuracy of the technique. Such imbalance can be eliminated by detecting and
replacing co-occurring events with a single meta-event.
77
Chapter 7
Conclusion
7.1 Major Topics Addressed
In chapter 1 we introduce capacity planning and support efforts in practice. Customers of large
scale enterprise applications need to determine the hardware capacity to procure in order to obtain
the desired performance in terms of response time and throughput. To enable capacity planning at
customer site, performance analysts of the vendors need to continuously build and update
capacity calculators for applications. Such capacity calculators are based on measurement based
performance modeling of the application. After deployment, customers often engage the software
vendor when they run into performance and capacity related issues. Continuous customer
engagements allow the software vendors to build a rich knowledgebase – a customer engagement
repository, which has valuable information related to problems and solutions, which can be
immensely helpful in future engagements.
Chapter 1 also discusses the challenges being faced in capacity planning and support, which
provides the motivation for our work. Building of a capacity calculator requires running a large
number of performance tests on the application. Performance testing is often the last step on
already delayed product cycle; hence time is of essence while running the performance tests.
Risks of errors are pretty high because of the manual process of running performance tests. To
alleviate the situation, revelation of performance bugs or mis-configurations of the application
settings result in rerunning of the whole test suite. Challenges in customer support for capacity
issues are also abound. Analysts have to depend on their experience and understanding of the
system to link symptoms to possible solutions. Knowledge from an engagement is often archived
78
in a customer engagement report, but no systematic techniques exist to retrieve that knowledge,
except for applying basic keyword search.
We discuss major related work in chapter 2. We discuss eminent research work related to
capacity planning and performance modeling. We also discuss research works that target specific
steps in our framework for building capacity calculators. Then we present research works from
event correlation domain, as those are related to our log-based technique to retrieve relevant
customer engagement reports. Then research works related to mining of customer engagement
reports are presented. Lastly, we present related research in retrieval of operational profile and
signature profile.
Chapter 3 provides details of our framework for building capacity calculators. We discuss major
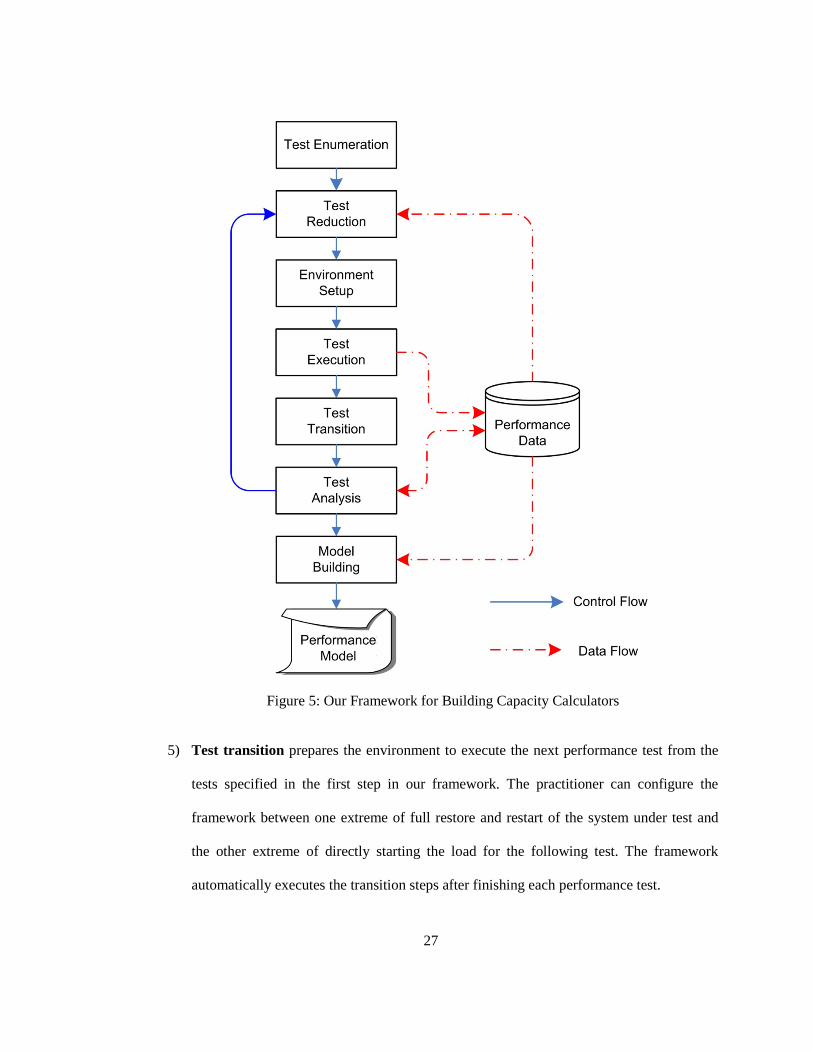
steps of test enumeration, test reduction, environment setup, test execution, test transition, test
analysis and model building. We also present estimated efforts required to customize the
framework from one application to another, one version to another, and one build to another.
In chapter 4, we discuss our technique for customer support for capacity planning. In that, we
discuss how we convert log lines to event distributions, how we identify signature events, and
how we compare event distributions to rank the distributions and associated customer
engagement reports according to its similarity to a give event distribution. We also discuss how
we measure the performance of our technique using precision and recall metrics.
In chapter 5, we discuss the case studies of our customer support technique. We discuss one case
study on an open source large test application: Dell DVD Store, and another case study on a
globally deployed large industrial application. We present our results in operational profile based
retrieval, as well as signature profile based retrieval.
79
We discuss the strengths and limitations of our work in chapter 6. We also discuss the manual
steps involved in our framework, and the sources of errors that affect the results of our technique.
7.2 Major Thesis Contributions
We presented a framework for building capacity calculators for enterprise applications using
measurement based performance modeling. The need for such a framework is felt from the
current challenges in performance modeling practices in industry. These models are produced
through a labor intensive and error prone process which always occurs at the end of already late
release schedules. The contributions of our framework are as follows:
1. It automates the building of measurement based performance models.
2. It works on measurement based performance modeling of large enterprise applications, as
demonstrated by the case studies on the Dell DVD store application and another larger
enterprise application.
3. It brings together various venues of research to support analysts in their day-to-day
activities. Using our framework researchers can explore contributing and fitting their own
research work into the proposed framework. Moreover, analysts can compare various
tools and techniques using the structure of our framework.
4. It is highly customizable to work for a different build, a different version, a different
platform or a different application. Limited efforts are involved in customizing our
framework for other applications and other platforms.
The customer engagement repository contains rich information about symptom, issues, root
causes, workarounds, and resolutions from previous engagements. Retrieval of relevant reports
helps support analysts resolve client issues quicker and better. We presented a technique to
80
analyze the execution logs from the customer engagement repository and retrieve the relevant
execution logs and corresponding customer engagement reports. The contributions of our
technique are as follows:
1. It retrieves relevant reports from customer engagement repository based on similar
operational profile and signature profile. As demonstrated by case studies, it retrieves
such relevant reports with high precision and high recall.
2. It can be applied immediately on an application, since the execution logs of most
applications are readily available and are usually archived in the customer engagement
repository. Our technique can equally aid in remote issue resolution by identifying
relevant engagement reports and recommending resolution steps.
3. It requires no code changes, nor does it require any data collection from customers.
Hence it can be easily adopted by companies and does not depend on a particular
software application, version, build, or platform.
4. It also allows comparing load testing and stress testing execution logs with the customer
execution logs to verify and ensure that the workload being used in load testing and stress
testing is close to real-world customer workloads.
7.3 Future Research
Our work in this thesis seeks to automate, optimize and enhance the performance engineering
activities during verification and maintenance phases of the software development life cycle.
Specifically, we proposed a framework to automate and speed up the performance measurement
and model building process, and a technique to retrieve relevant reports from customer
engagement repository to help support analysts troubleshoot customer deployments. Our
81
technique to retrieve relevant reports from the customer engagement repository is also useful to
ensure that the workload used in load testing and stress testing is close to customer workloads.
However, challenges in performance engineering and capacity planning are many and far from
over. Significant challenges remain in load testing and stress testing, which we plan to address. In
particular, load tests execution needs online analysis of multiple performance counters to
determine:
a) The time point when the system reaches steady state
b) The time points when the test has run long enough for one to be statistically confident
about the average performance
c) whether the performance during a load test is similar to previous load tests
d) instabilities, such as memory leaks, and processor and disk contention
More work is required to unify and automate the processes for performance modeling across the
industry. More attention is required from academia on the use of measurement based techniques,
which have wider acceptance in the industry, compared to other analytical and simulation based
techniques. We intend to continue research work seeking automation of more steps in our
framework for building capacity calculators.
We wish to apply our technique for customer support on other software applications to generalize
our findings across different types of software applications. We also intend to apply and improve
data mining and log correlation techniques in order to improve the retrieval of relevant reports
from a customer engagement repository. We plan to develop techniques to correlate multiple
performance counters from system resources, such as disk, processor, memory, thread pool, and
connection pool, in order to identify bottlenecks in a customer’s environment.
82
7.4 Commercialization
Our framework for building capacity calculators has been developed and is in use at our industrial
research partner, Research In Motion. Practitioners can borrow ideas from our research work to
develop and customize similar framework for their capacity planning of their applications.
We have shown that our technique for customer support for capacity planning successfully
retrieves relevant customer engagement reports with high precision and recall. Measuring the
financial value of our work is difficult, because the financial returns to the software vendor
depend on several factors, such as the number of customers, the face value of the software, and
the use of appropriate software development methodologies. However, we argue that the
customer satisfaction resulting from applying our work in performance engineering of software
applications is invaluable. To commercialize our work, more work is required to combine it with
more features to be able to sell it as a product. Our technique can definitely be added as a feature
in some of the existing commercial log management tools, such as LogLogic [26] and Sensage
[39]. Some of the features available in such commercial log management tools include log
archival, SQL-like querying on the logs, automated analysis to ensure the absence of security
breach, and a number of methods for business intelligence using log analysis.
83
Bibliography
[1] Andrews, J. H. Testing using log file analysis: tools, methods, and issues., 1998. Proceedings of the 13th IEEE International Conference on Automated Software Engineering, (1998), 157-166.
[2] Apache Logging Services Project: log4j, log4cxx and log4net. http://logging.apache.org
[3] Avritzer, A. and Weyuker, E. J. The Role of Modeling in the Performance Testing of E-Commerce Applications. IEEE Transactions on Software Engineering, 30, 12 (2004), 1072-1083.
[4] Courtois, M. and Woodside, M. Using regression splines for software performance analysis. WOSP '00: Proceedings of the 2nd international workshop on Software and performance. (Ottawa, Ontario, Canada). ACM, New York, NY, USA, 2000, 105-114.
[5] Cover, T. M. and Thomas, J. A. Elements of information theory. Wiley-Interscience, New York, NY, USA, 1991.
[6] Cronk, R. N., Callahan, P. H. and Bernstein, L. Rule-based expert systems for network management and operations: an introduction. Network, IEEE, 2, 5; presented (1988), 7-21.
[7] Directive 2006/24/EC of the European Parliament and of the Council. http://eur-lex.europa.eu/LexUriServ/LexUriServ.do?uri=CELEX:32006L0024:EN:HTML
[8] Elbaum, S. and Narla, S. A methodology for operational profile refinement. Proceedings of the Annual Reliability and Maintainability Symposium. 2001. 142-149.
[9] Goldsmith, S. F., Aiken, A. S. and Wilkerson, D. S. Measuring empirical computational complexity. ESEC-FSE '07: Proceedings of the 6th joint meeting of the European software engineering conference and the ACM SIGSOFT symposium on The foundations of software engineering. (Dubrovnik, Croatia). ACM, New York, NY, USA, 2007, 395-404.
[10] Gunther, N. J. Guerrilla Capacity Planning: a Tactical Approach to Planning for Highly Scalable Applications and Services. Springer-Verlag New York, Inc., 2006.
[11] HamouLhadj, A. and Lethbridge, T. C. A survey of trace exploration tools and techniques. CASCON '04: Proceedings of the 2004 conference of the Centre for
Advanced Studies on Collaborative research. (Markham, Ontario, Canada). IBM Press, 2004, 42-55.
[12] Hui, S. C. and Jha, G. Data mining for customer service support. Inf. Manage., 38, 1 (2000), 1-13.
[13] Israr, T. A., Lau, D. H., Franks, G. and Woodside, M. Automatic generation of layered queuing software performance models from commonly available traces. WOSP '05: Proceedings of the 5th international workshop on Software and performance. (Palma, Illes Balears, Spain). ACM, New York, NY, USA, 2005, 147-158.
[14] Jaffe, D., Muirhead T. The Open Source DVD Store Application.
[15] Jaffe, D. and Muirhead, T. The Open Source DVD Store Application.
[16] Jain, R. The art of computer systems performance analysis: Techniques for Experimental Design, Measurement, Simulation, and Modeling. John Wiley & Sons, 1991.
[17] Jakobson, G. and Weissman, M. Real-time telecommunication network management: extending event correlation with temporal constraints. Proceedings of the fourth international symposium on Integrated network management IV. Chapman & Hall, Ltd, London, UK, UK, 1995, 290-301.
[19] JUnitPerf: JUnit test decorators to measure the performance and scalability of functionality contained within existing JUnit tests. http://www.clarkware.com/software/JUnitPerf.html
[20] Juran, J. M., Godfrey A. B. Juran’s Quality Handbook. McGraw-Hill Professional, 1988.
[21] Kounev, S. and Buchmann, A. SimQPN: a tool and methodology for analyzing queueing Petri net models by means of simulation. Perform.Eval., 63, 4 (2006), 364-394.
[22] Kounev, S. and Buchmann, A. Performance Modeling and Evaluation of Large-Scale J2EE Applications. 29th Int. Conf. on Resource Management and Performance Evaluation of Enterprise Computing Systems. (Dallas, Texas, December 7-12, 2003).
[23] Lewis, L. A case-based reasoning approach to the management of faults in communications networks. Proceedings of the Ninth Conference on Artificial Intelligence for Applications, 1993. (1993), 114-120.
[24] Liu, T., Kumaran, S. and Luo, Z. Layered Queueing Models for Enterprise JavaBean Applications. EDOC '01: Proceedings of the 5th IEEE International Conference on Enterprise Distributed Object Computing. IEEE Computer Society, Washington, DC, USA, 2001, 174.
[25] HP LoadRunner Softwar: integrated software performance testing tools. https://h10078.www1.hp.com/cda/hpms/display/main/hpms_content.jsp?zn=bto&cp=1-11-126-17%5E8_4000_100__
[26] LogLogic Enterprise Log Management and Intelligence Platform. http://www.loglogic.com/
[27] Mania D., Murphy J. Framework for predicting the performance of component-based systems. IEEE 10th International Conference on Software, Telecommunications and Computer Networks. (Italy, October 2002).
[28] Menascé, D. A., Almeida, V. A. F., Fonseca, R. and Mendes, M. A. A methodology for workload characterization of E-commerce sites. EC '99: Proceedings of the 1st ACM conference on Electronic commerce. (Denver, Colorado, United States. ACM, New York, NY, USA, 1999, 119-128.
[29] Microsoft Exchange Server messaging and collaborative software. http://www.microsoft.com/exchange/default.mspx
[30] Muirhead T., Jaffe, D. Migrating enterprise databases from Sun servers to the Dell PowerEdge 2850 running Microsoft Windows Server 2003.
[31] Pentakalos, O. and Friedman, M. Windows 2000 performance guide: help for Windows 2000 administrators. O'Reilly & Associates, Inc, Sebastopol, CA, USA, 2002.
[32] The R project for statistical computing. http://www.r-project.org/
[33] Ramanujam, S., Yamany, H. E. and Capretz, M. A. M. An Agent Oriented Approach to Operational Profile Management. International Journal of Intelligent Technology, 1, 4 (2006).
[34] Research In Motion. BlackBerry Enterprise Server for Microsoft Exchange version 4.1 performance benchmarking. http://www.blackberry.com/knowledgecenterpublic/livelink.exe/fetch/2000/8067/645045/7963/7965/1180408/Performance_Benchmarking_Guide.pdf?nodeid=1367404&vernum=0
[35] Research In Motion. Capacity calculator for BlackBerry Enterprise Server 4.1 for Microsoft Exchange. http://www.blackberry.com/select/toolkit/dls/BlackBerry_Enterprise_Server_Version_4.1.0_for_Microsoft_Exchange_Capacity_Calculator.xls
[36] Roberts, D. C. and Grossman, D. A. Modifying the software development life cycle to include software performance assurance. WESCANEX 97: Communications, Power and Computing. Conference Proceedings. , IEEE, (1997), 100-104.
[37] Rothermel, G. and Harrold, M. J. A safe, efficient regression test selection technique. ACM Trans.Softw.Eng.Methodol., 6, 2 (1997), 173-210.
[38] Sankarasetty, J., Mobley, K., Foster, L., Hammer, T. and Calderone, T. Software performance in the real world: personal lessons from the performance trauma team. WOSP '07: Proceedings of the 6th international workshop on Software and performance. (Buenes Aires, Argentina). ACM, New York, NY, USA, 2007, 201-208.
[39] Sensage Log Data Warehouse for security, compliance and systems management. http://www.sensage.com
[40] Sim, S. E. Supporting multiple program comprehension strategies during software maintenance. Masters Thesis, University of Toronto, 1998.
[41] Smith, C. U., Llad\'o, C. M., Cortellessa, V., Marco, A. D. and Williams, L. G. From UML models to software performance results: an SPE process based on XML interchange formats. WOSP '05: Proceedings of the 5th international workshop on Software and performance. (Palma, Illes Balears, Spain, ). ACM, New York, NY, USA, 2005, 87-98.
[42] Sopitkamol, M. and Menascé, D. A. A method for evaluating the impact of software configuration parameters on e-commerce sites. WOSP '05: Proceedings of the 5th international workshop on Software and performance. (Palma, Illes Balears, Spain). ACM, New York, NY, USA, 2005, 53-64.
[43] SOX. Summary of Sarbanes-Oxley Act of 2002. http://frwebgate.access.gpo.gov/cgi-bin/getdoc.cgi?dbname=107_cong_bills&docid=f:h3763enr.tst.pdf
[44] Tan, P., Steinbach, M. and Kumar, V. Introduction to Data Mining, Addison-Wesley Longman Publishing Co., Inc, Boston, MA, USA, 2005.
[45] Thomas, B. The concept of dynamic analysis. ESEC/FSE-7: Proceedings of the 7th European software engineering conference held jointly with the 7th ACM SIGSOFT international symposium on Foundations of software engineering. (Toulouse, France, ). Springer-Verlag, London, UK, 1999, 216-234.
[47] Weimer, W. and Necula, G. C. Mining Temporal Specifications for Error Detection. TACAS 2005: Eleventh International Conference on Tools and Algorithms for the Construction and Analysis of Systems. (April 4-8, 2005).
[48] Woodside, M., Franks, G. and Petriu, D. C. The Future of Software Performance Engineering. FOSE '07: 2007 Future of Software Engineering. IEEE Computer Society, Washington, DC, USA, 2007, 171-187.
[49] Xie, T., Marinov, D. and Notkin, D. Rostra: A Framework for Detecting Redundant Object-Oriented Unit Tests. ASE '04: Proceedings of the 19th IEEE international conference on Automated software engineering. IEEE Computer Society, Washington, DC, USA, 2004, 196-205.
[50] Yang, J., Evans, D., Bhardwaj, D., Bhat, T. and Das, M. Perracotta: mining temporal API rules from imperfect traces. ICSE '06: Proceedings of the 28th international conference on Software engineering. (Shanghai, China, ). ACM, New York, NY, USA, 2006, 282-291.
[51] Yilmaz, C., Krishna, A. S., Memon, A., Porter, A., Schmidt, D. C., Gokhale, A. and Natarajan, B. Main effects screening: a distributed continuous quality assurance process for monitoring performance degradation in evolving software systems. ICSE '05: Proceedings of the 27th international conference on Software engineering. (St. Louis, MO, USA, ). ACM, New York, NY, USA, 2005, 293-302.
[52] Yin, R. K. Case Study Research: Design and Methods. Sage Publications, Thousand Oaks, CA, 1994.
[53] Jiang, Z. M., Hassan, A. E., Hamann, G., Flora, P. An automated approach for abstracting execution logs to execution events. Journal of Software Maintenance and Evolution: Research and Practice, 20, 4 (2008), 249-267.
[55] Zoeteweij, P., Abreu, R. and J.C. van Gemund, A. Software Fault Diagnosis. Springer, 19th IFIP International Conference on Testing of Communicating
Systems and 7th International Workshop on Formal Approaches to Testing of Software, 2007. (Tallinn, Estonia, June 26-29).
[56] Thakkar, D., Hassan, A. E., Hamann, G., Flora, P. A framework for measurement based performance modeling. Proceedings of the 7th International Workshop on Software and Performance. WOSP 2008, Princeton, NJ, USA, June 23-26, 2008, 55-66.
[57] Thakkar, D., Jiang, Z. M., Hassan, A. E., Hamann, G., Flora, P. Retrieving relevant reports from a customer engagement repository. Proceedings of the 24th IEEE International Conference on Software Maintenance. ICSM 2008, September 28 - October 4, 2008, Beijing, China, 117-126.