24
Automated Feature Extraction Assessment Assessment of GA Software and Industry Capability

Automated Feature Extraction Assessment Assessment of GA Software and Industry Capability

Automated Feature Extraction Assessment
Metric Value
Land Area Covered 221,079 sqkm
Land Area Covered 05%
Dwellings Covered 83%
Population Covered 72%
Built-up Areas Covered 99%

Automated Feature Extraction Assessment
NEXIS Methodology
Structure
LUT
GA
Survey COST
Factors
Cadastre Census
Business
Registry VGO
GNAF
Reference datasets
CLUE
7.0 ML
Event
Casualties
Direct Impact
Geospatial Database
Hazard
Models
Earthquake, Wind,
Tsunami, Flood,
Blast, Plume, etc
Injuries,
Fatalities,
Medical costs
People
Buildings Business
Residential
Infrastructure

Study Area – Launceston, TAS
Automated Feature Extraction Assessment
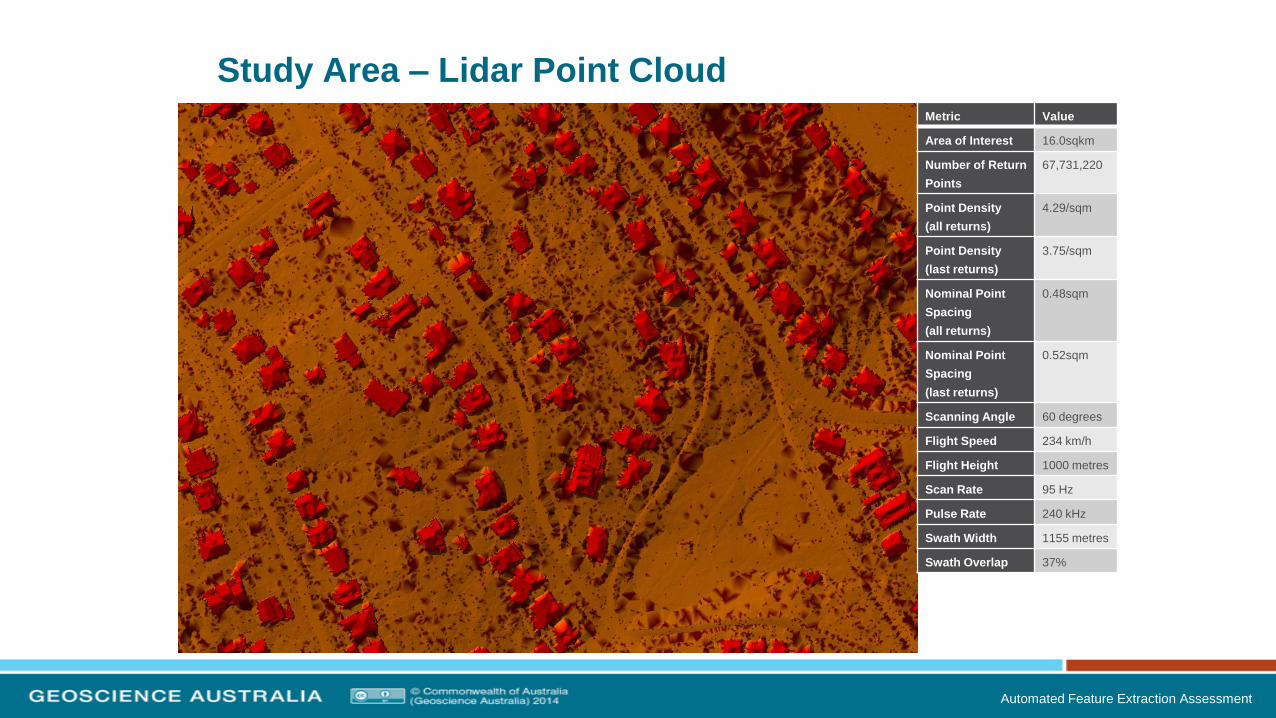
Study Area – Lidar Point Cloud
Automated Feature Extraction Assessment
Metric Value
Area of Interest 16.0sqkm
Number of Return
Points
67,731,220
Point Density
(all returns)
4.29/sqm
Point Density
(last returns)
3.75/sqm
Nominal Point
Spacing
(all returns)
0.48sqm
Nominal Point
Spacing
(last returns)
0.52sqm
Scanning Angle 60 degrees
Flight Speed 234 km/h
Flight Height 1000 metres
Scan Rate 95 Hz
Pulse Rate 240 kHz
Swath Width 1155 metres
Swath Overlap 37%
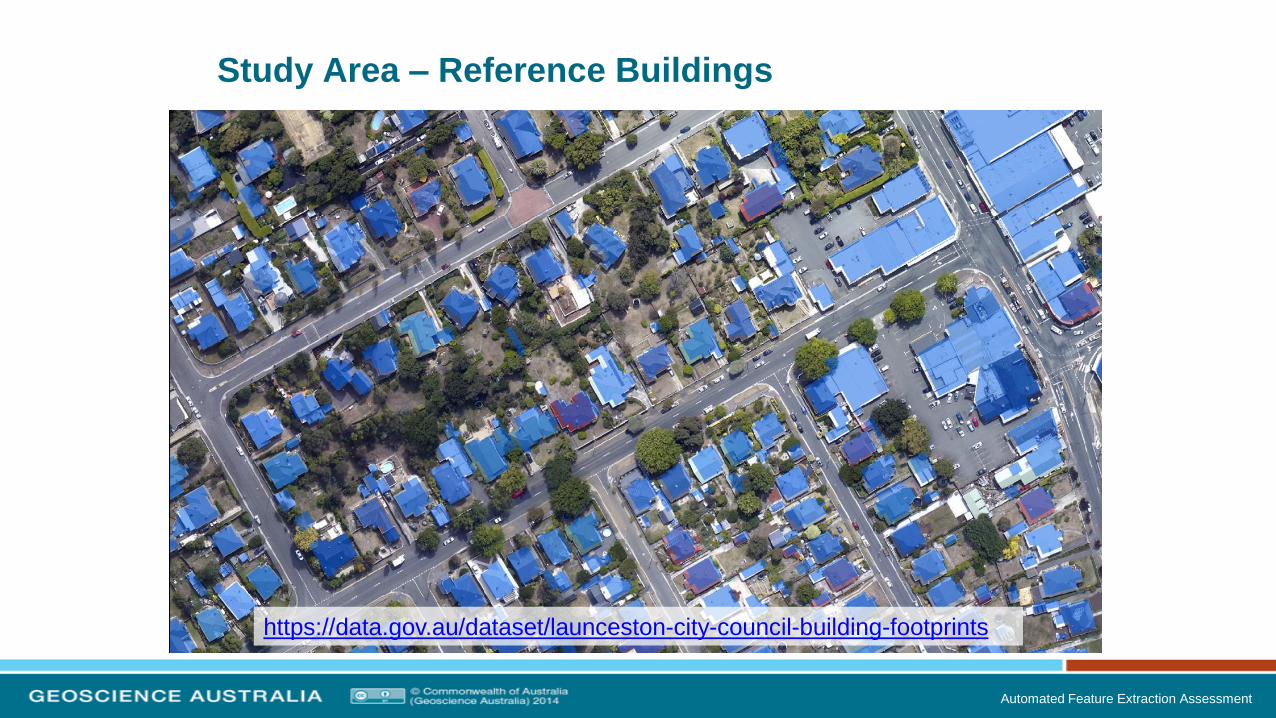
Study Area – Reference Buildings
Automated Feature Extraction Assessment
https://data.gov.au/dataset/launceston-city-council-building-footprints

Desired Data
The objective of this project is to 2D building footprint polygons and their respective
building floor, gutter and maximum height attributes from the supplied classified and/or
unclassified lidar data.
Producers delivered first parse raw output and a cleaned rectangularised version.
Automated Feature Extraction Assessment

Datasets Assessed
In-House Software
• Geoscience Australia’s Building Geometry Model (BGM)
• CRC-SI’s Barista
• CRC-SI’s Building Footprint Extraction (CRCBFE)
• rapidlasso’s LAStools
• QCoherent’s LP360
External Producers
• Advertised on AusTender
• Received 7 bids
• Engaged 5 producers
Automated Feature Extraction Assessment

Automated Feature Extraction Assessment
BGM

Barista
Automated Feature Extraction Assessment
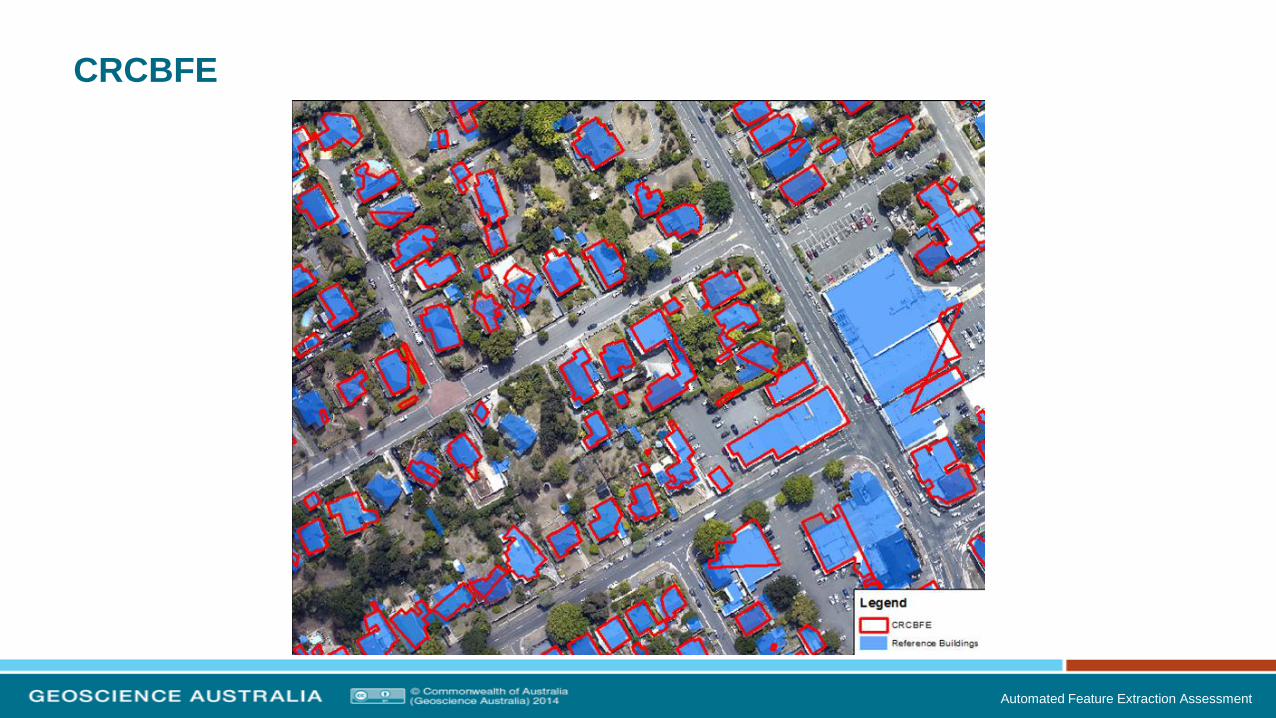
CRCBFE
Automated Feature Extraction Assessment

LAStools
Automated Feature Extraction Assessment

LP360
Automated Feature Extraction Assessment

Example of Produced Dataset
Automated Feature Extraction Assessment

Example of Produced Dataset
Automated Feature Extraction Assessment

Assessment methods
Object-based Assessment
– Evaluation of the presence or absence of spatially-correlated objects
1. Producer’s Accuracy: a measure of completeness
– Proportion of produced buildings that intersect reference buildings
2. User’s Accuracy: a measure of correctness
– Proportion of reference buildings that intersect produced buildings
3. Overall Accuracy: a summary of the two previous measures
– Proportion of above intersecting buildings to total buildings
Automated Feature Extraction Assessment

Assessment results: Object-based
Automated Feature Extraction Assessment
0%
10%
20%
30%
40%
50%
60%
70%
80%
90%
100%
Producer’s Accuracy or completeness
User’s Accuracy or correctness
Overall Accuracy
BGM
Barista
LAStools
LP360 C3 (raw outlines)
LP360 C3 (squared outlines)
LP360 (raw outlines)
LP360 (squared outlines)
CRC footprint extractor
0%
10%
20%
30%
40%
50%
60%
70%
80%
90%
100%
Producer 1
Producer 2
Producer 3
Producer 4
Producer 5

Assessment methods
Horizontal Area-based Assessment
– Evaluation of how well the areas of corresponding datasets coincide on the [X,Y]
plane
Automated Feature Extraction Assessment
Reference Building
Detected Building
True Positive (TP) 1 1
False Positive (FP) 0 1
False Negative (FN) 1 0
True Negative (TN) 0 0
Positive Measures Formula
Producer’s Accuracy TP/(TP+FN)
User’s Accuracy TP/(TP+FP)
Overall Accuracy (TP+TN)/(TP+FP+TN+FN)
Quality Percentage TP/(TP+FP+FN)
Negative Measures Formula
Area Omission Error FN/(FN+TP)
Area Commission Error FP/(TP+FN)
Branching Factor FP/TP
Miss Factor FN/TP

Assessment results: horizontal area-based
Automated Feature Extraction Assessment
0%
5%
10%
15%
20%
25%
30%
Area Omission Error Area Commission Error Branching Factor Miss Factor
BGM
Barista
LAStools
LP360 C3 (raw)
LP360 C3 (squared)
LP360 (raw)
LP360 (squared)
CRCBFE
0%
10%
20%
30%
40%
50%
60%
70%
80%
90%
100%
Producer's Accuracy User's Accuracy Overall Accuracy Quality Percentage
BGM
Barista
LAStools
LP360 C3 (raw)
LP360 C3 (squared)
LP360 (raw)
LP360 (squared)
CRCBFE

Assessment results: horizontal area-based
Automated Feature Extraction Assessment
0%
10%
20%
30%
40%
50%
60%
70%
80%
90%
100%
Producer's Accuracy User's Accuracy Overall Accuracy Quality Percentage
Producer 1
Producer 2
Producer 3
Producer 4
Producer 5
0%
5%
10%
15%
20%
25%
30%
Area Omission Error Area Commission Error Branching Factor Miss Factor
Producer 1
Producer 2
Producer 3
Producer 4
Producer 5

Assessment methods
Vertical Area-based Assessment
– Not a definitive quantitative assessment of height attributes, but it provides a
relative or qualitative comparison of each dataset
– Heights for the reference dataset were assigned as follows:
• Floor height: elevation of the DEM at centroid of feature
• Maximum height: highest building-classified return within feature
• Gutter height: average of building returns within 1 meter of perimeter
Automated Feature Extraction Assessment

Assessment results: Vertical area-based
Automated Feature Extraction Assessment
Floor Height Gutter Height Maximum Height

Conclusion
• Yes you can derive footprints from lidar, depending on your use.
• QA/methodology/consistency of doing it in-house
• We found LAStools to be the best in-house software
• High accuracy
• Fully automated
• Very fast (minutes for AOI)
• Future research into the affect of point density (1-2/sqm)
Automated Feature Extraction Assessment

Jonah Sullivan Spatial Analyst | National Geographic Information Group
Environmental Geoscience Division | GEOSCIENCE AUSTRALIA
Phone: +61 2 6249 9516 Fax: +61 2 6249 9999
Email: [email protected] Web: www.ga.gov.au
Cnr Jerrabomberra Avenue and Hindmarsh Drive Symonston ACT
GPO Box 378 Canberra ACT 2601 Australia
Applying geoscience to Australia’s most important challenges


