Automated Peritoneal Dialysis Is Associatedwith Better Survival Rates Compared toContinuous Ambulatory Peritoneal Dialysis: APropensity Score Matching AnalysisGabriela de Carvalho Beduschi1, Ana Elizabeth Figueiredo2, Marcia Olandoski1,Roberto Pecoits-Filho1, Pasqual Barretti3, Thyago Proenca de Moraes1*, on behalf of allcenters that contributed to the BRAZPD
1 School of Medicine, UNESP, Botucatu, Brazil, 2 Graduate Program in Medicine and Health Sciences,Pontifícia Universidade Católica do Rio Grande do Sul (PUCRS), Porto Alegre, Brazil, 3 School of Medicine,Pontifícia Universidade Católica do Paraná (PUCPR), Curitiba, Brazil
¶ Membership of the centers that contributed to the BRAZPD study can be found in the Acknowledgments.* [email protected]
Abstract
Introduction
The impact of peritoneal dialysis modality on patient survival and peritonitis rates is not fully
understood, and no large-scale randomized clinical trial (RCT) is available. In the absence
of a RCT, the use of an advanced matching procedure to reduce selection bias in large
cohort studies may be the best approach. The aim of this study is to compare automated
peritoneal dialysis (APD) and continuous ambulatory peritoneal dialysis (CAPD) according
to peritonitis risk, technique failure and patient survival in a large nation-wide PD cohort
Methods
This is a prospective cohort study that included all incident PD patients with at least 90 days
of PD recruited in the BRAZPD study. All patients who were treated exclusively with either
APD or CAPD were matched for 15 different covariates using a propensity score calculated
with the nearest neighbor method. Clinical outcomes analyzed were overall mortality, tech-
nique failure and time to first peritonitis. For all analysis we also adjusted the curves for the
presence of competing risks with the Fine and Gray analysis.
Results
After the matching procedure, 2,890 patients were included in the analysis (1,445 in each
group). Baseline characteristics were similar for all covariates including: age, diabetes, BMI,
Data Availability Statement: As foreseen in theinformed consent submitted to all centres, the datafrom the BRAZPD II Study are held at the PontifíciaUniversidade Católica do Paraná. This is for keep theprivacy of patients and clinics involved in the study.Any person can ask for additional information orsubmit a project to use data from BRAZPD II foranalysis, under the supervision of the SteeringCommittee. The administrative structure of theBRAZPD II comprises a steering committee with 3members, one project manager, one project
PD. Mortality rate was higher in CAPD patients (SHR1.44 CI95%1.21-1.71) compared to
APD, but no difference was observed for technique failure (SHR0.83 CI95%0.69-1.02) nor
for time till the first peritonitis episode (SHR0.96 CI95%0.93-1.11).
Conclusion
In the first large PD cohort study with groups balanced for several covariates using propen-
sity score matching, PD modality was not associated with differences in neither time to first
peritonitis nor in technique failure. Nevertheless, patient survival was significantly better in
APD patients.
IntroductionThe association between peritoneal dialysis (PD) modalities and clinical outcomes, namelyperitonitis rates, technique failure and patient survival remains a controversial issue. First, thenumber of studies comparing the influence of modality on peritonitis rates is limited and only3 studies presented a large sample size[1–3]. The initial results in favor of automated peritonealdialysis (APD) have changed over time, and the APD benefit apparently disappears in studiespublished after the year of 2000. These changes may reflect improvements in the continuousambulatory peritoneal dialysis (CAPD) connection systems[4]. On the other hand, the connec-tion systems for APD have also improved throughout the time, but the majority of publishedcomparison studies are based on patients treated during the nineties or early 2,000; only onerecent large study compared peritonitis rates in APD and CAPD, reflecting the connection sys-tem used at the moment in both modalities[3].
Regarding technique survival, there is also no clear differences across PD modalities, withsome data favoring APD[5–7], while other showing no differences between APD and CAPD[8,9]. Finally, information regarding patient survival relies vastly on observational studies,since no randomized controlled trial used mortality as an endpoint. Most of the observationaltrials found no significant differences between the PD modalities[10,11]. Three studies showeda beneficial effect of APD, two of them were single center and one a registry study[6,7,12]. Infact, a large RCT comparing hard clinical outcomes is unlikely to be available in the near futurefor several reasons, including the fact that the medical decision is usually driven by membranecharacteristics and patient preference. In the absence of a RCT, the use of an advanced match-ing procedure to reduce selection bias in large cohort studies may be an adequate alternativefor the comparative analysis between PD modalities.
Therefore, the aim of this study was to compare peritonitis risk, technique failure andpatient survival between modalities in a large PD cohort, trying to minimize the effect of selec-tion bias through an advanced matching technique for several covariates.
MethodsThis is an analysis of the nationwide prospective BRAZPD II cohort, previously described indetails elsewhere[13]. We included all incident adult patients who remained at least 90 days inPD and excluded those who switched modality at any time during the follow-up period.Patients were recruited in 122 centers across the country and data was collected monthly fromDecember 2004 to January 2011. The option not to include patients on PD for less than 90days was taken to avoid the potential influence of prior therapies on clinical outcomes. To
PDModality and Clinical Outcomes
PLOSONE | DOI:10.1371/journal.pone.0134047 July 27, 2015 2 / 12
coordinator and one biostatistician. The study leaderis currently Dr. Roberto Pecoits-Filho and he may becontacted at [email protected].
Funding: This study was funded by BaxterHealthcare. The current data extraction and analysiswas supported by an investigator driven study grantprovided to PUCPR, as part of the Clinical EvidenceCouncil Program from Baxter Healthcare. Thesponsor had no participation in the study design dataanalysis or preparation of the manuscript.
Competing Interests: AF has received consultingfees and a speaker honorarium from BaxterHealthcare. PB has received consulting fees and aspeaker honorarium from Baxter Healthcare. RPFhas received research grants, consulting fees andspeaker honorarium from Baxter Healthcare. TPMhas received consulting fees and speaker honorariumfrom Baxter Healthcare. This does not alter theauthors' adherence to PLOS ONE policies on sharingdata and materials.
minimize the effects of the different comorbidities prevalence across the groups on clinical out-comes, we matched CAPD patients to individuals on APD using several covariates as describedbelow. Hypertension was defined as according to the WHO/ISH criteria, a systolic bloodpressure> 140mmHg and/or diastolic blood pressure> 90mmHg at baseline with or withoutuse of hypertensive medication. The medical ethical committees of all participating centersapproved the study. The list of all ethic review boards that approved the study can be found inthe S5 Table. All patients provided written consent, which was approved by the ethical commit-tee and stored locally only in Portuguese.
Matching procedureA set of covariates was selected to estimate the propensity score. These were: age, body massindex (BMI), center experience, Davies score, diabetes, family income, gender, literacy, PDmodality, race, previous hemodialysis (HD), duration of pre-dialysis care and year of initiationof PD. The propensity score (PS) was calculated using logistic regression, as proposed by Fineand Gray [14], and CAPD patients were matched with APD controls using the nearest neigh-bor technique with a predefined caliper of 0.2. Groups were matched in a ratio of 1:1. Thismatching procedure was done using the MatchIt package for R[15].
Clinical outcomesClinical outcomes were analyzed using both the traditional Cox Proportional Hazards modeland adjusted for the presence of competing risk analysis as proposed by Fine and Gray [14].For patient survival, the event of interest was death from any cause; for technique survival theevent of interest was a defined as switch to HD for any cause, and for peritonitis risk the timeto first peritonitis episode was the event of interest. Competing risks were defined as follows:(1) for mortality, any cause of drop out from therapy apart from death; (2) for technique fail-ure, any cause of drop out from therapy apart from switching from PD to HD and (3) for timeto first peritonitis any cause of drop-out occurred before the first episode of peritonitis. Allpatients still alive at the end of the study were treated as censored.
Sensitivity analysis. We performed a sensitivity analysis aiming to reduce the impact oflacking of data on residual renal function. We categorized our population in two groups: groupI comprising patients with presumed RRF and group II with presumed no RRF. To be allocatedin group I the patient should have at least one measured urinary volume> 100ml along thestudy (this represent in average 10% of our population) or be on diuretics, assuming thatdiuretics are only prescribed to patients with RRF. We then included this variable in the modelafter analyze its effect in univariate analysis.
Statistical analysisContinuous variables were expressed as mean ± SD or median and range, while categoricalvariables (e.g., gender, race, primary renal disease, presence of comorbid conditions, initialtherapy, current PD modality, etc.) were expressed as frequencies or percentages. Data wereanalyzed using Student's t-test and the Chi-square test for categorical variables and ANOVAfor comparison of continuous variables. Normality was checked using the Kolmogorov-Smir-nov test. Cox proportional hazard models were estimated using SPSS 20.0 and sub-hazard dis-tribution using competing risk analysis were calculated with the CRR function available in theCMPRSK package for R. For inclusion in the multivariate model, the covariate should have a pvalue lower than 0.20 in the univariate analysis. Collinearity was checked for all covariatespotential covariates to be included in a model. Assumptions for proportional hazards and
PDModality and Clinical Outcomes
PLOSONE | DOI:10.1371/journal.pone.0134047 July 27, 2015 3 / 12
proportional sub-distribution hazards were checked with residual plots. Statistical significancewas set at the level of p<0.05.
Results
Study population and baseline characteristicsFrom December 2004 to January 2011 9,905 adult patients from 122 centers were recruited inthe study. We excluded all prevalent patients and those having had less than 90 days on PD. Ofthe remaining 5,707 patients, we identified 1,745 who were treated exclusively by CAPD and2,516 by APD. Of those, 1,247 who switched PD modalities, and 199 who presented missingdata were excluded. Mean age was 59.4±16.0 years, 52% were females, 44% were diabetics and36% had history of previous hemodialysis (HD). After match, 2,890 patients were included inthe analysis: 1556 CAPD and 1334 APD patients (Fig 1). All variables were well balanced withthe matching procedure (Table 1); the standardized differences of means between covariatescan be seen in Fig 2.
Clinical outcomesTechnique survival. There were 344 events during the study period, 153 in the CAPD
group and 191 in the APD group. Peritonitis was the main cause of technique failure in bothgroups representing 69.3% (n = 106) and 55.0% (n = 105), respectively for CAPD and APD.
Fig 1. Study Population.
doi:10.1371/journal.pone.0134047.g001
PDModality and Clinical Outcomes
PLOSONE | DOI:10.1371/journal.pone.0134047 July 27, 2015 4 / 12
Ultrafiltration failure occurred in only 2.4% of all patients (n = 70 patients), what represents24% (n = 47) of the technique failures in the APD group and for 15% (n = 23) in the CAPDgroup.
In the multivariate Cox analysis, no significant difference was found between groups (HR0.89; CI95% 0.71–1.10) (Table 2). Adjusted survival curves can be found in Fig 3. After adjust-ments for the presence of competing risks, the absence of differences between groups remained(SHR 0.83; CI95% 0.69–1.02). The covariates included in this model were age, year of entry inPD, BMI, center experience, diabetes, literacy, gender, race and length of pre-dialysis care. Wefound three independent predictors for technique failure: age, center experience and race.Details can be found in the supporting information (S1 Table).
Time to first peritonitis episode. In the CAPD group, 368 patients had at least 1 peritoni-tis episode while in the APD group this number was 391. There was no difference in time to
Table 1. Clinical and demographic characteristics of matched patients.
Variable CAPD (n = 1556) APD (n = 1334) p
Primary Renal Disease 0.08
Hypertension 17.6% 18.1%
Diabetes 35.7% 37.8%
Glomerulonephritis 9.5% 9.4%
Other causes 18.9% 17.3%
Unknown 18.3% 17.4%
Age (years) 59.0±15.8 59.3±16.2 0.7
Biennium 0.9
2005/2006 27.4% 26.6%
2007/2008 39.7% 40.6%
2009/2010 32.9% 32.8%
Body Mass Index (Kg/m2) 24.7±4.4 24.5±4.7 0.1
< 18.5 Kg/m2 5.2% 8.4%
18.5 to 25 Kg/m2 52.7% 51.1%
> 25 Kg/m2 42.1% 40.5%
Cancer (yes) 3.1% 2.2% 0.1
Centre Experience (patient-year) 41.13±23.54 39.91±23.50 0.2
Coronary Artery Disease (yes) 20.8% 22.5% 0.3
Davies Score 0.6
0–1 79.1% 77.7%
2–3 20.9% 22.3%
Diabetes (yes) 43.0% 43.3% 0.9
Education level 1.0
� 4 years 30.0% 30.0%
> 4 years 70.0% 70.0%
Family Income (<2 Braz. Min.Wage)* 64.5% 64.6% 0.9
Gender (female) 46.0% 44.8% 0.6
Hypertension 77.0% 77.1% 0.9
Peripheral Artery Disease (yes) 20.9% 21.2% 0.9
Race (White) 50.3% 49.7% 0.7
Stroke (yes) 1.0% 1.2% 0.3
Time of Pre-dialysis Care (months) 18.05±30.1 17.29±29.7 0.5
* In 2006 one Brazilian minimum wage was equivalent to 128US$ and in 2010 raised to 325US$.
doi:10.1371/journal.pone.0134047.t001
PDModality and Clinical Outcomes
PLOSONE | DOI:10.1371/journal.pone.0134047 July 27, 2015 5 / 12
first peritonitis episode between groups in both the Cox regression analysis (HR 1.04; CI95%0.90 to 1.20) and also considering the presence of competing risks (SHR 0.96; CI95% 0.93 to1.11) (Table 2). For this model we included the following covariates: age, biennium, BMI, can-cer, center experience, coronary artery disease, diabetes, literacy, gender, hypertension, modal-ity, race, peripheral artery disease and length of pre-dialysis care. There were four independentpredictors for time to first peritonitis episode: biennium, cancer, center experience and literacy.Full details can be found in the supporting information (S2 Table). We also analyzed peritonitisrates in both groups. For CAPD there were 0.23 episodes per patient-year and for APD 0.26episodes per patient year.
Mortality. There were 550 events during the study period, 305 in the CAPD group and245 in the APD group. Cardiovascular disease (CVD) was the main cause of death in bothgroups with 137 events for CAPD group (49%) and 110 events for the APD group (45%), fol-lowed by PD non-related infections (n = 104 for CAPD and n = 85 for APD), other causes(n = 38 for CAPD and n = 27 for APD), and peritonitis (n = 19 for CAPD and n = 20 forAPD). In the multivariate Cox analysis, CAPD patients had a higher risk for overall (HR1.47;CI95% 1.24 to 1.75) and cardiovascular mortality (HR1.41; CI95% 1.09 to 1.82) (Table 2).
Fig 2. Standardized differences of means between covariates before and after match.
doi:10.1371/journal.pone.0134047.g002
Table 2. Determinants of Clinical Outcomes taking CAPD as the reference.
Cox Model Competing Risk Model
Hazard ratio CI95% Sub-Hazard Distribution CI95%
Technique Failure 0.89 0.71–1.10 0.83 0.69–1.02
Time to First Peritonitis 1.04 0.90–1.20 0.96 0.93–1.11
PLOSONE | DOI:10.1371/journal.pone.0134047 July 27, 2015 6 / 12
Curves for Cox regression can be found in Fig 3. Results were similar when considering thepresence of competing risks (SHR 1.44; CI95%1.21 to 1.71 and SHR 1.34;CI95% 1.03 to 1.73,respectively for overall and CV mortality). For both analyses, the variables included in themodel were age, year of dialysis initiation, BMI, center experience, coronary artery disease, can-cer, diabetes, educational level, gender, hypertension, race and length of pre-dialysis care. Age,year of initiation of PD, BMI and diabetes were independent predictors of overall mortality.Age, BMI, coronary artery disease and diabetes were independent predictors of CV mortality.Details can be found in the supporting information file: (S3 Table and S4 Table).
Sensitivity analysis. The group of patients without presumed RRF presented a consider-ably risk for mortality at univariate Cox regression model analysis and competing risk analysis(HR 1.71; CI95% 1.44–2.03 and SHR; CI9% respectively). This subgroup also presented a sig-nificant risk for technique failure (HR 1.32; CI95% 1.06–1.65) and for time to first peritonitisepisode (HR 1.32; CI95% 1.13–1.53).
After inclusion of this covariate in the multivariate analysis, CAPD patients remained athigh risk for mortality for all causes (SHR 1.38; CI95% 1.16–1.64) and for CV mortality (SHR1.31; CI95% 1.01–1.69). In addition, no changes were observed for technique failure (SHR 0.82;CI95% 0.66–1.02) and time to first peritonitis (SHR 0.96; CI95% 0.83–1.10) regarding the PDmodality (APD as reference).
Fig 3. Clinical outcomes for Peritoneal Dialysis Modality. Legend: p values for overall mortality andcardiovascular mortality are < 0.01; for technique failure is 0.27 and for time to first peritonitis episode is 0.57.
doi:10.1371/journal.pone.0134047.g003
PDModality and Clinical Outcomes
PLOSONE | DOI:10.1371/journal.pone.0134047 July 27, 2015 7 / 12
DiscussionThis is the first large cohort study to compare hard clinical outcomes between PD modalitiesusing a propensity match score to minimize the effect of unbalanced covariates and taking thepresence of competing risks into account. The main findings of the study were that techniquefailure and time to first peritonitis were similar between modalities, while patient survival wasbetter for patients who remained all the time in APD compared to those treated only withCAPD.
Peritonitis, as expected, was the main cause of technique failure[16]. Both groups presentedsimilar time to the first peritonitis episode. It is noteworthy to mention that the connection sys-tem used by all of our patients did not change along the study period, information that is usu-ally absent in previous reports. The twin bag system was the standard for all CAPD patients,while for APD spike connectors were utilized (luer lock connections are not available in Brazil).Despite the higher number of exchanges need for CAPD patients, time to first peritonitis epi-sode were similar between groups. This finding is in line with previous reports from large andrepresentative cohort studies from patients starting dialysis in early 2000[8–10], and confirm atrend that can be in part attributed to improvements in connection systems, and perhaps to animprovement in clinical practice along the years[13,17]. Similar to our results, Lan et al[3]recently showed similar overall peritonitis rates between APD and CAPD.
PD modality did not affect the rate of transfer of patients to hemodialysis in our cohort.This finding is not surprising in a population in which the main cause of technique failure wassimilar between groups. This scenario could have been different in a hypothetic situation, witha higher prevalence of anuric patients with high transport membrane profile. Ultrafiltrationfailure (UFF) occurred in only 2.4% of the patients in the present study. This is somehowexpected, since the use of APD as the initial therapy in this subgroup was likely driven by fac-tors others than the membrane profile. Instead, patients who switched from CAPD to APD(and excluded from this study) were more likely to present a higher prevalence of high trans-porters with a more challenging volume control. Nevertheless, information regarding mem-brane profile would be helpful to a better interpretation of our results.
Over the past decades reports from different regions compared patient survival between PDmodalities[6–12,18]. The present study is one of the largest comparing outcomes betweenmodalities, and in contrast to previous large cohort studies we show that patients treated withAPD presented better overall and cardiovascular mortality in comparison with patients onCAPD. To the best of our knowledge, only two single center and one registry study found abenefit for patients treated by APD[6,7,12] but the present study is the first to report cardiovas-cular outcomes, which is the main cause of death in dialysis patients. Importantly, we matchedgroups for several important variables that could have influenced outcomes, including (but notrestricting) age, center experience, Davies comorbidity score, diabetes, gender, literacy, coro-nary artery disease at baseline, previous hemodialysis etc. It is important to mention that dataof some recognized risk factors were not available, such as (RRF) and the membrane profile.Nevertheless, the similar prevalence of previous hemodialysis with the exclusion of prevalentPD patients make less likely that a great difference in RFF between groups was present. In addi-tion, our sensitivity analysis adjusted for patients with presumed RRF showed that APDpatients remained with better survival rates.
Given the characteristics of any other observational study it is difficult to clarify the mecha-nisms behind the benefit of APD compared to CAPD in our population. A better volume con-trol could be one explanation, since fluid removal is usually better achieved in APD patients, inparticular the high transporters. Johnson et al reported that APD treatment was associatedwith a significant survival advantage in high transporters compared with CAPD[7]. In
PDModality and Clinical Outcomes
PLOSONE | DOI:10.1371/journal.pone.0134047 July 27, 2015 8 / 12
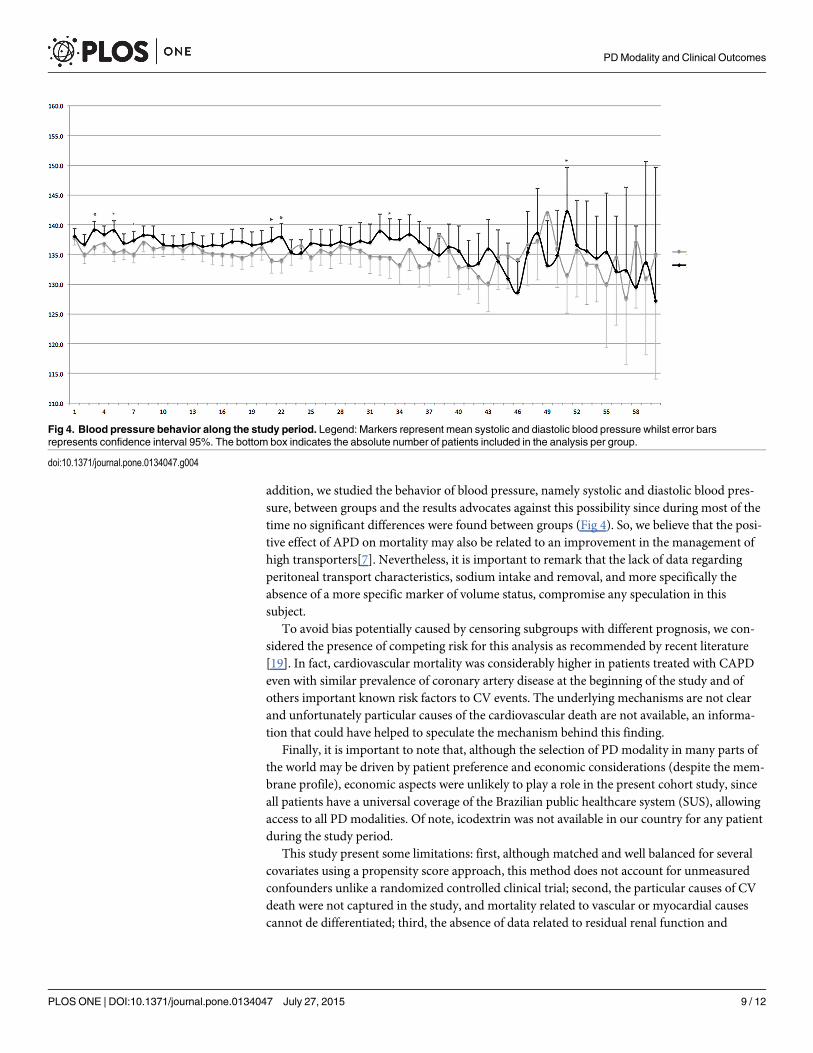
addition, we studied the behavior of blood pressure, namely systolic and diastolic blood pres-sure, between groups and the results advocates against this possibility since during most of thetime no significant differences were found between groups (Fig 4). So, we believe that the posi-tive effect of APD on mortality may also be related to an improvement in the management ofhigh transporters[7]. Nevertheless, it is important to remark that the lack of data regardingperitoneal transport characteristics, sodium intake and removal, and more specifically theabsence of a more specific marker of volume status, compromise any speculation in thissubject.
To avoid bias potentially caused by censoring subgroups with different prognosis, we con-sidered the presence of competing risk for this analysis as recommended by recent literature[19]. In fact, cardiovascular mortality was considerably higher in patients treated with CAPDeven with similar prevalence of coronary artery disease at the beginning of the study and ofothers important known risk factors to CV events. The underlying mechanisms are not clearand unfortunately particular causes of the cardiovascular death are not available, an informa-tion that could have helped to speculate the mechanism behind this finding.
Finally, it is important to note that, although the selection of PD modality in many parts ofthe world may be driven by patient preference and economic considerations (despite the mem-brane profile), economic aspects were unlikely to play a role in the present cohort study, sinceall patients have a universal coverage of the Brazilian public healthcare system (SUS), allowingaccess to all PD modalities. Of note, icodextrin was not available in our country for any patientduring the study period.
This study present some limitations: first, although matched and well balanced for severalcovariates using a propensity score approach, this method does not account for unmeasuredconfounders unlike a randomized controlled clinical trial; second, the particular causes of CVdeath were not captured in the study, and mortality related to vascular or myocardial causescannot de differentiated; third, the absence of data related to residual renal function and
Fig 4. Blood pressure behavior along the study period. Legend: Markers represent mean systolic and diastolic blood pressure whilst error barsrepresents confidence interval 95%. The bottom box indicates the absolute number of patients included in the analysis per group.
doi:10.1371/journal.pone.0134047.g004
PDModality and Clinical Outcomes
PLOSONE | DOI:10.1371/journal.pone.0134047 July 27, 2015 9 / 12
membrane profile which, despite the likelihood of them being similar between groups due asimilar dialysis vintage, does not exclude the possibility of there being a statistically significantdifference; and finally, we were not able to retrieve data of the first peritonitis according to eti-ologies. However, our study has some important strengths: first, the study was based on anational prospective cohort of incident patients; the groups were well balanced for several clini-cal and demographic variables using sophisticated matching procedure; and finally, it is theonly study of our knowledge to take competing risks into account in all analysis.
In conclusion, based in a large contemporary and prospective cohort study, no differenceswere found for technique failure and time to first peritonitis. In contrast, APD offered a betterpatient survival compared to CAPD. These findings may influence on choice of modality andmay stimulate a more broad use of APD.
Supporting InformationS1 Fig. BRAZPD II structure and contacts.(TIF)
S1 Table. Determinants of Overall Mortality.(DOCX)
S2 Table. Determinants of Technique Failure.(DOCX)
S3 Table. Determinants of Time to First Peritonitis Episode.(DOCX)
S4 Table. Determinants of Cardiovascular Mortality (n = 2890).(DOCX)
S5 Table. Ethical Review Boards that approved the study.(DOCX)
AcknowledgmentsThe following centers participated in BRAZPD and contributed to the preparation of this arti-cle: Ameneg, Associaçao Hosp. Bauru, Biocor Hosp. Doencas Cardiologicas, Casa de Saude eMat N. Sra. Perp. Socorro, CDR Curitiba, CDR Goiania, CDR Imperatriz, CDR Sao Jose Pin-hais, CDTR_Centro Dialise Transplante Renal, Centro Nefrologia Teresopolis, Centro Nefro-logico Minas Gerais, Centro Trat. Doencas Renais Joinville, Centro Tratamento Renal ZonaSul, CLINEF Rio De Janeiro, CLINEPA Clinica de Nefrologia da Paraiba, CLINES, Clinese,Clinica do Rim do Carpina, Clinica Evangelico S/C Ltda, Clinica Nefrologia de Franca, Clinicade Nefrologia Santa Rita, Clinica de Nefrologica Sao Goncalo, Clinica Paulista de Nefrologia,Clinica Renal Manaus, Clinica Senhor Do Bonfim, Clinica Senhor Do Bonfim Ltda Filial, Clin-ica Tratamento Renal, Cuiaba Cenec, Clire Clinica de Doencas Renais, Famesp Botucatu, Uni-camp_Univ. Est Campinas, Hosp. Clinicas FMRPUSP, Fundaçao Civil Casa Mis Franca,Fundaçao Inst Mineiro Est Pesq Nefrol, Gamen Rio de Janeiro, Gdf Hospital de Base, HistocomSociedade Civil Ltda, Hosp Univ Prof Edgard Santos, Hosp Benef. Portuguesa Pernambuco,Hospital Cidade Passo Fundo, Hospital Clinica Univ Fed Goias, Hospital E MaternidadeAngelina Caron, Hospital Evangelico Vila Velha Es, Hospital Geral Bonsucesso, Hospital Geralde Goiania, Hospital Infantil Joana de Gusmao, Hospital São Joao Deus, Hospital São Jorge,Hospital São Jose do Avai, Hosp Sao Vicente de Paula_J Pessoa, Hosp Sao Vicente de Paulo,Hospital Servidor do Estado Ipase, Hospital Univ Presidente Dutra Ma, Hospital Universitario
PDModality and Clinical Outcomes
PLOSONE | DOI:10.1371/journal.pone.0134047 July 27, 2015 10 / 12
Antonio Pedro, Hospital Vita Volta Redonda S/A, Iamspe Sao Paulo, Imip, Inst CapixabaDoencas Renais, Inst Capixaba Doencas Renais Cariacica, Inst Capixaba Doencas Renais Serra,Inst do Rim de Fortaleza, Inst do Rim de Marilia, Inst do Rim do Parana S/C Ltda, Inst do RimSanto Antonio da Platina, Inst Hemodialise de Sorocaba, Inst Medicina Nuclear Endocrina,Inst Nefrologia de Mogi Das Cruzes, Inst Nefrologia de Suzano, Inst Nefrologia Souza e Costa,Inst Urologia e Nefrol Barra Mansa, Inst Urologia e Nefrol Sj Rio Preto, Medservsp, Nefrocen-tro, Nefroclinica Caxias do Sul, Nefroclinica Foz do Iguacu, Nefroclinica Uberlandia, NefronClinica Natal, Nefron Contagem, Nephron Pelotas, Nephron São Paulo, Nucleo NefrologiaBelo Horizonte, Pro Nephron, Prorim Campos dos Goitacaze, Puc Porto Alegre, Renalcare Ser-viços Medicos Ltda, Renalcor Angra dos Reis, Renalcor Rio de Janeiro, Renalvida, Rien Rio deJaneiro, Santa Casa de Adamantina, Santa Casa de Jau_Unefro, Santa Casa Dd Marilia, SantaCasa de Ourinhos, Santa Casa de Santo Amaro, Santa Casa de Sao Jose Dos Campos, SantaCasa de Votuporanga, Serv de Nefrologia de Ribeirao Preto, Uerj_Hosp. Clin. Univ. Est. RioDe Janeiro, Uni Rim Joao Pessoa, Unidade Nefrologia Assis, Unirim Unidade de DoençasRenais, Unirim Unidade Renal do Portao, UNTR Unidade Nefrologia Transplante.
We thank Silvia Carreira Ribeiro for helping us formatting the manuscript according to theJournal requirements.
Author ContributionsConceived and designed the experiments: TPM PB RP. Performed the experiments: TPM GCBPB RP MO AF. Analyzed the data: TPMMO. Contributed reagents/materials/analysis tools:TPMMO PB RP. Wrote the paper: TPM PB RP AF MO GCB.
References1. Oo TN, Roberts TL, Collins AJ (2005) A comparison of peritonitis rates from the United States Renal
Data System database: CAPD versus continuous cycling peritoneal dialysis patients. Am J Kidney Dis45: 372–380. PMID: 15685516
2. Nessim SJ, Bargman JM, Austin PC, Nisenbaum R, Jassal SV (2009) Predictors of peritonitis inpatients on peritoneal dialysis: results of a large, prospective Canadian database. Clin J Am SocNephrol 4: 1195–1200. doi: 10.2215/CJN.00910209 PMID: 19406969
3. Lan PG, Johnson DW, McDonald SP, Boudville N, Borlace M, Badve SV, et al. (2014) The associationbetween peritoneal dialysis modality and peritonitis. Clin J Am Soc Nephrol 9: 1091–1097. doi: 10.2215/CJN.09730913 PMID: 24626434
4. Bieber SD, Burkart J, Golper TA, Teitelbaum I, Mehrotra R (2014) Comparative outcomes between con-tinuous ambulatory and automated peritoneal dialysis: a narrative review. Am J Kidney Dis 63: 1027–1037. doi: 10.1053/j.ajkd.2013.11.025 PMID: 24423779
5. Mujais S, Story K (2006) Patient and technique survival on peritoneal dialysis in patients with failedrenal allograft: a case-control study. Kidney Int Suppl: S133–137. PMID: 17080105
6. Sanchez AR, Madonia C, Rascon-Pacheco RA (2008) Improved patient/technique survival and perito-nitis rates in patients treated with automated peritoneal dialysis when compared to continuous ambula-tory peritoneal dialysis in a Mexican PD center. Kidney Int Suppl: S76–80. doi: 10.1038/sj.ki.5002606PMID: 18379553
7. Johnson DW, Hawley CM, McDonald SP, Brown FG, Rosman JB, Wiggins KJ, et al. (2010) Superiorsurvival of high transporters treated with automated versus continuous ambulatory peritoneal dialysis.Nephrol Dial Transplant 25: 1973–1979. doi: 10.1093/ndt/gfp780 PMID: 20097847
8. Badve SV, Hawley CM, McDonald SP, Mudge DW, Rosman JB, Brown FG, et al. (2008) Automatedand continuous ambulatory peritoneal dialysis have similar outcomes. Kidney Int 73: 480–488. PMID:18046315
9. Michels WM, Verduijn M, Boeschoten EW, Dekker FW, Krediet RT, Group NS (2009) Similar survivalon automated peritoneal dialysis and continuous ambulatory peritoneal dialysis in a large prospectivecohort. Clin J Am Soc Nephrol 4: 943–949. doi: 10.2215/CJN.04440908 PMID: 19357244
10. Mehrotra R, Chiu YW, Kalantar-Zadeh K, Vonesh E (2009) The outcomes of continuous ambulatoryand automated peritoneal dialysis are similar. Kidney Int 76: 97–107. doi: 10.1038/ki.2009.94 PMID:19340090
PDModality and Clinical Outcomes
PLOSONE | DOI:10.1371/journal.pone.0134047 July 27, 2015 11 / 12
11. Cnossen TT, Usvyat L, Kotanko P, van der Sande FM, Kooman JP, Carter M, et al. (2011) Comparisonof outcomes on continuous ambulatory peritoneal dialysis versus automated peritoneal dialysis: resultsfrom a USA database. Perit Dial Int 31: 679–684. doi: 10.3747/pdi.2010.00004 PMID: 20829519
12. Sun CY, Lee CC, Lin YY, WuMS (2011) In younger dialysis patients, automated peritoneal dialysis isassociated with better long-term patient and technique survival than is continuous ambulatory perito-neal dialysis. Perit Dial Int 31: 301–307. doi: 10.3747/pdi.2010.00072 PMID: 21282373
13. Moraes TPd, Figueiredo AE, Campos L, Olandoski M, Barretti P, Pecoits-Filho R (2014) Characteriza-tion of the BRAZPD II cohort and description of trends in peritoneal dialysis outcome across time peri-ods. Peritoneal Dialysis International Accepted.
14. Fine JP, Gray RJ (1999) A proportional hazards model for the subdistribution of a competing risk. J AmStat Assoc 94: 494–509.
15. Ho DE, Imai K, King G, Stuart EA (2011) MatchIt: Nonparametric Preprocessing for Parametric CausalInference. Journal of Statistical Software 42: 1–28.
16. Li PK, Szeto CC, Piraino B, Bernardini J, Figueiredo AE, Gupta A, et al. (2010) Peritoneal dialysis-related infections recommendations: 2010 update. Perit Dial Int 30: 393–423. doi: 10.3747/pdi.2010.00049 PMID: 20628102
17. Mehrotra R, Chiu YW, Kalantar-Zadeh K, Bargman J, Vonesh E (2011) Similar outcomes with hemodi-alysis and peritoneal dialysis in patients with end-stage renal disease. Arch Intern Med 171: 110–118.doi: 10.1001/archinternmed.2010.352 PMID: 20876398
18. de Fijter CW, Oe LP, Nauta JJ, van der Meulen J, Verbrugh HA, Verhoef J, et al. (1994) Clinical efficacyand morbidity associated with continuous cyclic compared with continuous ambulatory peritoneal dialy-sis. Ann Intern Med 120: 264–271. PMID: 8291819
19. Verduijn M, Grootendorst DC, Dekker FW, Jager KJ, le Cessie S (2011) The analysis of competingevents like cause-specific mortality—beware of the Kaplan-Meier method. Nephrol Dial Transplant 26:56–61. doi: 10.1093/ndt/gfq661 PMID: 21059831
PDModality and Clinical Outcomes
PLOSONE | DOI:10.1371/journal.pone.0134047 July 27, 2015 12 / 12