Page 1
207180 •-/7_<7 - -. _t__.-
Automated Track Recognition and EventReconstruction in Nuclear Emulsion
P. Deines-Jones 2, M.L. Cherry 2, A. D_browska 1, R. Eolynski 1, W.V. Jones 2,
E.D. Kolganova 4, D. Kudzia 1, B.S. Nilsen 2, A. Olszewski 1, E.A. Pozharova 4,
K. Sengupta 2t, M. Szarska 1, A. Trzupek 1, C.J. Waddington a, J.P. Wefel 2,
B. Wilczynska 1, H. Wilczynski 1, W. Wolter 1, B. Wosiek 1, and K. Wozniak 1
1. Institute of Nuclear Physics, Krakow, Poland
2. Louisiana State University, Baton Rouge, LA USA
3. University of Minnesota, Minneapolis, MN USA
4. Inst. of Theoretical and Experimental Physics, Moscow, Russia
Abstract
The major advantages of nuclear emulsion for detecting charged particles
are its submicron position resolution and sensitivity to minimum ionizing
particles. These must be balanced, however, against the difficult manual
microscope measurement by skilled observers required for the analysis. We
have developed an automated system to acquire and analyze the microscope
images from emulsion chambers. Each emulsion plate is analyzed indepen-
dently, allowing coincidence techniques to be used in order to reject back-
ground and estimate error rates. The system has been used to analyze a
sample of high-multiplicity Pb-Pb interactions (charged particle multiplici-
ties ,-_ 1100) produced by the 158 GeV/c per nucleon 2°SPb beam at CERN.
Automatically reconstructed track fists agree with our best manual mea-
surements to 3%. We describe the image analysis and track reconstruction
techniques, and discuss the measurement and reconstruction uncertainties.
1 Introduction
Nuclear emulsion is an excellent charged particle detector. It combines sensitivity
to minimum ionizing particles (MIPs) with spatial l:esolution superior to the best
electronic techniques available. This combination accounts for emulsion's useful-
ness in high energy cosmic ray experiments [1], neutrino oscillation searches [2],
and analyses of high multiplicity heavy ion interactions [3]. Unfortunately, it has
proven difficult to analyze emulsion in a systematic and automatic way, although
attempts to do so date back at least to the 1950's [4]. Instead, measurement has
https://ntrs.nasa.gov/search.jsp?R=19980017307 2018-09-01T10:17:20+00:00Z
Page 2
been a slow, manual task requiring a high degree of training, a fact which has
limited both the number of analyzed events and the study of systematic errors
in individual datasets. Automatic charge measurement in emulsion has long been
possible in certain circumstances [5], and semi-automatic "bookkeeping" aids have
been employed for some time [6, 7, 8]. But track counting and measurement in
emulsion has remained a labor-intensive task.
Ironically, this difficulty is a consequence of emulsion's advantages - high spa-
tial resolution and sensitivity to MIPs - which make automatic track detection
computationally challenging. In performing manual measurements, one continu-
ally adjusts the microscope's focus slightly and looks for tracks that persist from
the top of the emulsion to the bottom. To imitate this behavior, an automatic
system must acquire many images, each at a slightly different focus depth, and the
image analysis software must search for persistently dark paths through the re-
sulting three-dimensional "focus sequence" of image frames. For this reason, large
quantities of imaging data must be acquired and processed. The analysis routines
must efficiently detect tracks yet reject the background from knock-on electrons,
secondary particle production, etc. Until recently [9, 10], this data acquisition and
analysis was impractical.
The Krakow-Louisiana-Minnesota-Moscow collaboration (KLMM) has devel-
oped a system which automatically measures and reconstructs nuclear interactions
in emulsion "chambers", in which thin emulsion plates are exposed perpendicular
to the beam. The system identifies the particles that emanate from a common
vertex, efficiently rejects background tracks, measures the track space angles, and
provides a rough charge assignment which distinguishes minimum ionizing tracks
from heavier fragments. The overall reconstruction accuracy is 97% or better. We
have used this system to analyze a set of 40 semi-central 158 GeV/c per nucleon
Pb-Pb events with multiplicities ranging from about 600 to 1700, demonstrating
2
Page 3
for the first time the scientific utility of such a system [3, 11].
Section 2 describes the KLMM Pb-Pb emulsion chamber experiment. The
image acquisition is discussed in Section 3, and Sections 4 and 5 cover the image
analysis and track reconstruction procedures.
2 Chamber Design and Exposure
KLMM exposed 32 emulsion chambers to the 158 GeV/c 2°8pb beam accelerated
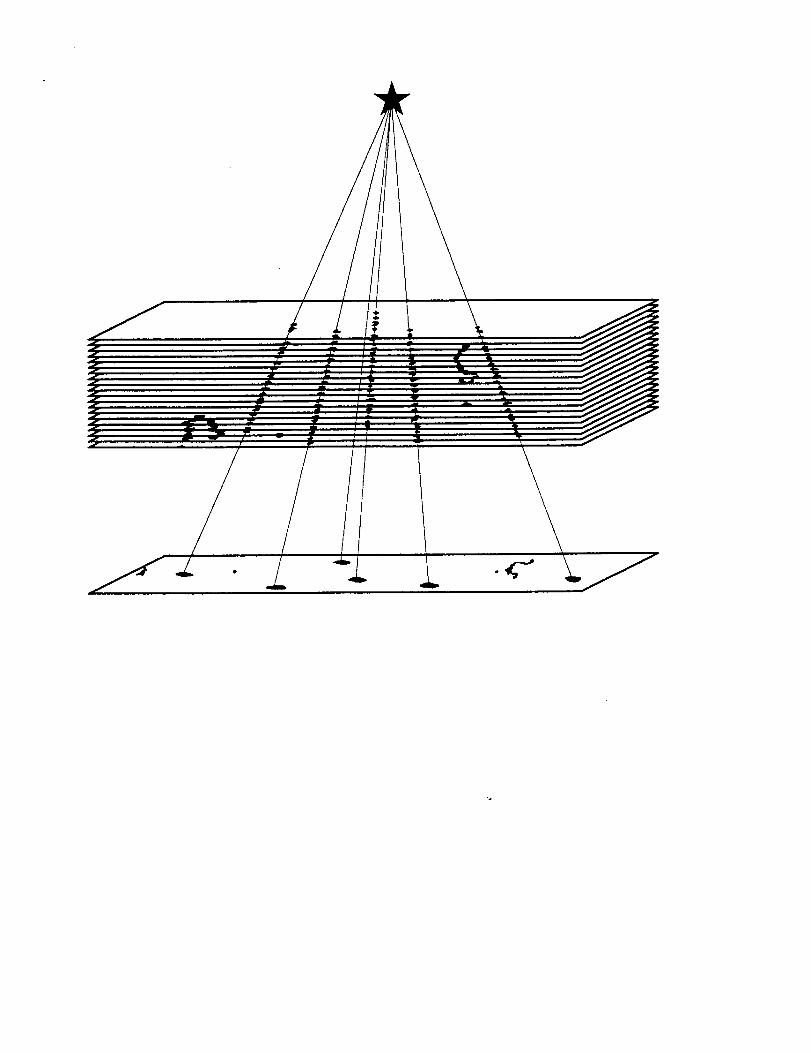
at CERN in December 1994 (CERN experiment EMU-13). The emulsion cham-
bers consist of Pb foil targets and emulsion plates oriented perpendicular to the
beam (Fig. 1). In contrast to stacks of emulsion pellicles oriented parallel to the
beam, emulsion chambers can use pure targets, allowing the study of symmetric
Pb-Pb collisions free from possible target selection biases. Angular measurements
in chambers (as opposed to stacks) are relatively free from systematic uncertain-
ties due to emulsion shrinkage and distortion. Unlike emulsion stacks, however,
chambers measure only forward-going tracks.
By using emulsion only to sample the path of the track, chambers present very
little grammage either to the incident beam or to produced particles, thus reducing
electron pair production and secondary interactions. However, the relatively short
path length in emulsion allows only a rough charge assessment in the chamber
itself. Three slanted pellicles, the most downstream elements of the chamber, can
be used to assign more precise charges to the spectator fragments.
Each emulsion plate consists of a 200 #m thick acrylic base coated with a 55 #m
Fuji ET7B emulsion layer on each side. (Each plate consists of only ,-, 0.06 g/cm 2
of material. Most tracks are fully measured before they pass through 4 such plates.)
The Pb targets and plates have faces measuring 10 cm x 5 cm. Each chamber
holds either 3 or 4 100 #m thick lead target foils. Milled Rohacell spacers 1.00 cm
3
Page 4
and 1.50 cm thick provide accurately known longitudinal distancesnecessaryfor
reconstructionof spaceanglesfrom plate position measurements.
The exposureof the chambersto the 158 GeV/c 2°SPbbeam resulted in an
averageof ,-_ 350 primary 2°SPb ions/cm 2 across the face of the chambers, concen-
trated in three 1.5 x 2 cm 2 beam spots. This density is small enough to ensure a
low delta-ray background and to keep the data cuts due to interactions occurring
too close to a non-interacting primary to an acceptably low level.
3 Event Acquisition
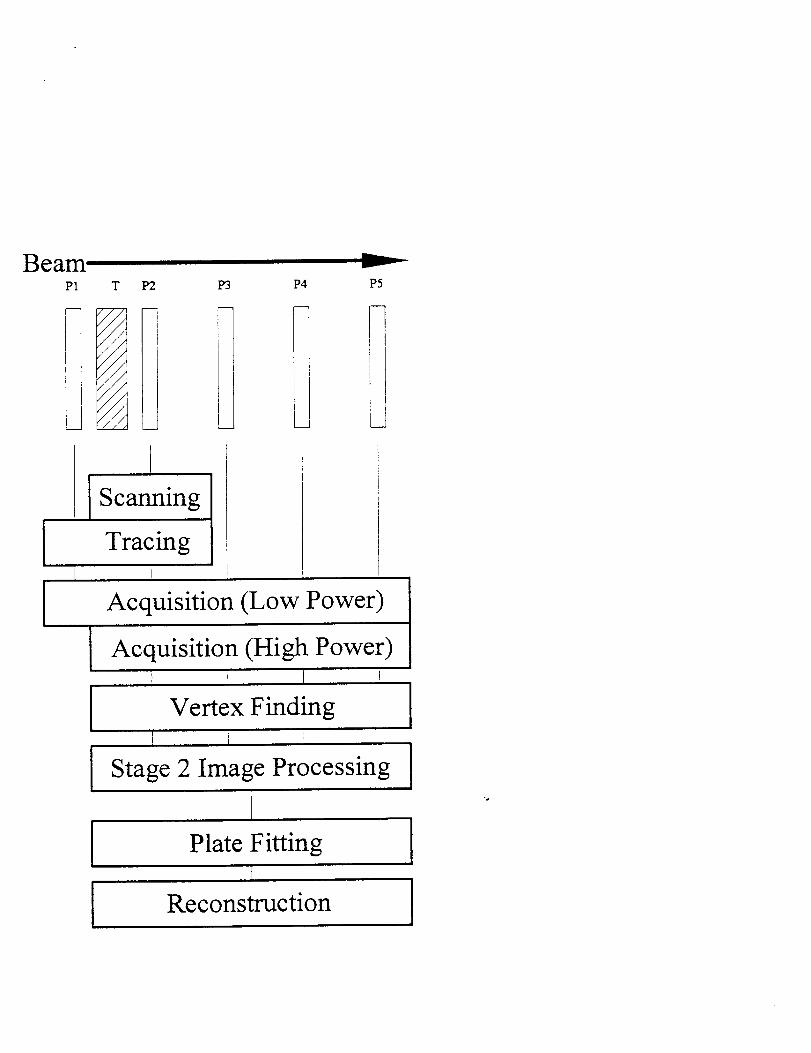
Event reconstruction through the analysis of microscope images is done in three
stages: event acquisition, identification of track candidates in the digitized images
("image analysis"), and reconstruction of the event from the lists of track can-
didates. The entire processing chain is shown in Fig. 2. The data-taking phase
consists of:
* scanning, which locates and selects candidate events for study,
• tracing, which ensures the interaction occurred in a Pb target,
• image acquisition, which records microscope fields around the event in several
plates, each spanning a different range in opening angle.
3.1 Scanning and Tracing
The emulsion plates directly below each target are visually scanned at low mag-
nification (200x) for events. (The scanning procedure for the initial sample of 40
semicentral Pb-Pb events is described in [3].) After the initial scanning selections
are made, each event is examined in all the plates upstream of the interaction
and rejected if the primary was noticeably tess ionizing (approximately 5 charge
units) than nearby Pb tracks or if the primary suffered an additional observable
4
Page 5
interaction. The plates immediately upstream and downstream of the target are ex-
amined, and events which occur in emulsion rather than the Pb target are rejected.
Events with nearby (less than 60 #m) non-interacting primaries which might ob-
scure secondary tracks are also rejected. The plate position of each scanned event
is recorded to 4-0.5 mm. A low-magnification locator image is also recorded, with
the event in the center of the image. The locator image includes nearby non-
interacting primaries, and makes it possible to determine the event position to =h5
#m relative to the nearby non-interacting tracks.
3.2 Image Acquisition
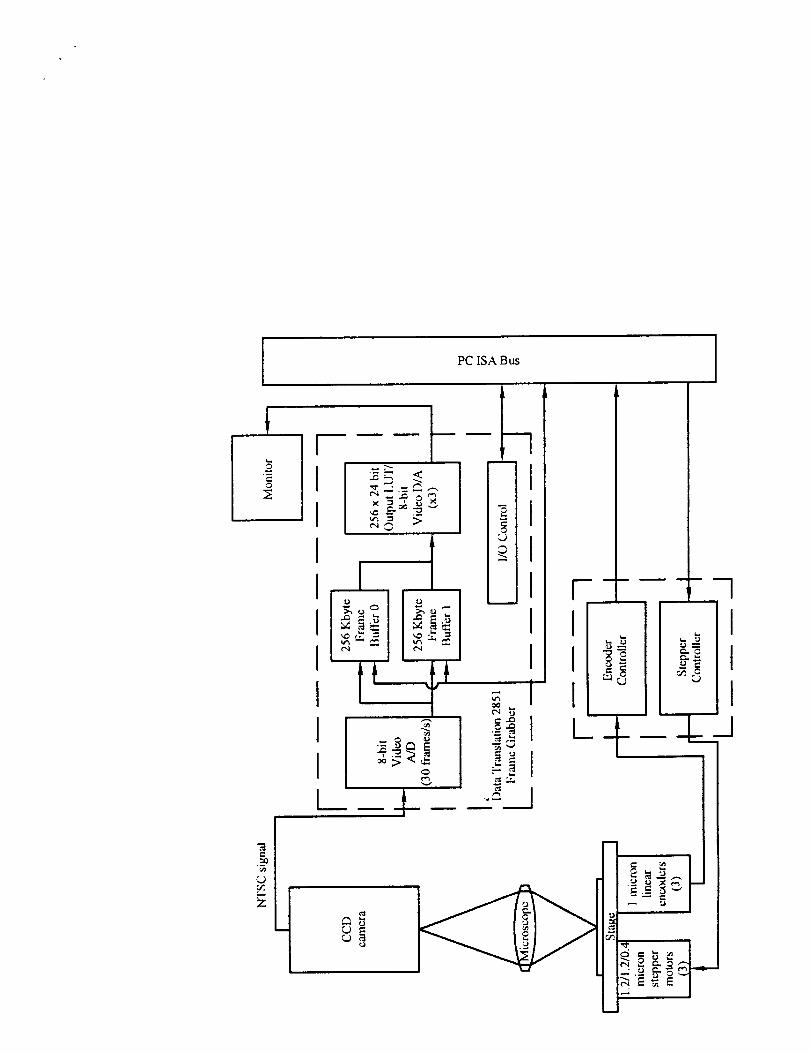
To digitize the emulsion images for event reconstruction, we have constructed
several microscopy systems equipped with PC-controlled stages and CCD cameras
(Fig. 3). In the usual "high-power" mode of operation, a 100x microscope objective
together with a 0.45x coupling lens yields a useful image which is 108 #m x 140 #m,
and which has about a --_ 2 #m depth of field. In the typical "low-power" mode, a
6x objective gives a 2.3 mm x 1.8 mm field of view, with a depth of about 200 #m.
The digitized pictures are 512 pixels x 480 pixels x 8 bits. The microscope stage
is equipped with stepping motors and linear optical encoders on all three axes. It
can be stepped under software control in 1 #m steps in three directions, or it can
be operated manually.
To acquire a focus sequence, the emulsion plate to be imaged is manually
registered to +5 #m with respect to the event's .!ocator image with the aid of
a blink comparator, which can switch between the "live" camera view and the
locator image. During acquisition of a focus sequence, the stage is controlled
by the image acquisition program. This program monitors the CCD image and
begins acquisition starting at the upper surface of the emulsion. It then steps
the focus vertically in 0.8 #m steps until it finds the lower surface, at which time
Page 6
it terminates acquisition and writes the focus sequence to a file. Surfaces are
detected by subtracting consecutive frames and finding the largest absolute residual
in a selected window. If I(z,y,z) is the image brightness at a pixel located at
coordinates (z, y, z) and Az = 0.8#m is the focus step size between consecutive
frames, the focus signal F is
F = max II(x,y,z + Az)- I(x,y, z)l (1)(_,y)
resulting in a focus signal like the example in Fig. 4. (This subtraction works
because there are almost always at least a few grains in focus when the microscope
is focused in the emulsion. Moving the focus 0.8 #m makes these in-focus grains
significantly more blurry and brighter.) To avoid triggering on objects outside
the emulsion, such as dust or air bubbles in the immersion oil (used to optically
couple the microscope objective to the emulsion) this calculation is performed in
four separate windows; the extreme values are discarded and the second highest
value is kept. The focus signal is digitally filtered to debounce the transition and
the result compared to a preset threshold to determine whether the microscope is
focused inside or outside the emulsion [11]. Depending upon the exact emulsion
thickness, approximately 20 frames are acquired in each focus sequence. 1 The
determination of the emulsion thickness is repeatable to +1 #m.
4 Image Analysis
Image analysis begins with a focus sequence of images and ends with a list of track
candidates and their coordinates for that sequence's field of view. The analysis
must efficiently discriminate secondary tracks (the signal) from the various back-
grounds. It must do it quickly, and therefore simply; since 15-20 such fields of view
1Note that 20 x 0.8/am = 16/am is a typical emulsion thickness after development, and is
substantially less than the nominal 55/am pre-development thickness quoted above.
Page 7
are analyzedto reconstructone typical event, speed is an issue if the system is to
be practical. To develop the analysis, the ideas of emulsion "signal" and "back-
ground" need to be articulated precisely enough so that they can be translated into
computer code. The software might be written to hunt for individual _ains, and
then assemble them into tracks; it might treat the tracks themselves as primitive
objects; or it might recognize an interaction vertex as a "gestalt". We have settled
on the last strategy, which provides excellent signal-background separation while
at the same time being computationally practical.
Secondary (i.e., highly relativistic) tracks in emulsion have a straight, ray-like
appearance. Depending on their charge and angle of inclination, they appear either
as a series of distinct grains, randomly distributed along the track, or a more or less
solid track of ionization, perhaps accompanied by occasional delta rays. (A track
which is viewed almost end-on is not resolved into distinct g-rains.) In any case, a
minimum ionizing particle produces on average one developed grain every 3.5 #m
along its path, yielding 16 + 4 grains in 55 #m of emulsion. The individual grains
appear at high power as small regions (_,- 0.5/_m) which are 40-70% as bright as
their surrounding neighborhood. Small angle Coulomb scattering is negligible in
55 microns oI: emulsion for even the lowest energy produced particles. Secondary
interactions are quite rare; the pion nuclear m.f.p, in emulsion is 35 cm. The
geometry of secondary tracks is therefore simple: to a very good approximation,
they are straight tracks that point back to a common vertex.
The physical backgrounds can be grouped into two categories. In the first group
are "random tracks," which are straight but are not associated with the event
under study. The only way to distinguish these real but unrelated tracks from
those which are created by the interaction is by confirming whether or not they
point back to the vertex. The other kind of background tracks are delta rays,which
scatter significantly in a single emulsion layer, and deposit more ionization energy
7
Page 8
in emulsion than more massiveMIPs. Heavy ion beam tracks copiously produce
long-rangedelta rays, and someof theseescapethe emulsionplate in which they
were produced,giving rise to a fairly uniform distribution of delta rays on top of
the local distribution surroundingeachbeam track.
Among the instrumental backgroundsare "chemical fog," consisting of devel-
opedgrainswhich arenot associatedwith any ionizing track, but arean artifact of
the developmentprocess.Emulsionsurfacedefectsmay alsobeprominent enough
to causeproblems,especiallyif the emulsionis thin.
The last kind of background,shadowing, is not strictly a background at all;
rather, it is an instrumental effect. In ordinary transmitted light microscopes,the
light passesthrough the entire two-sidedemulsionplate beforereachingthe eyeor
CCD. Thus, the objects near the planeof focusarenot uniformly illuminated, but
are shadowedby out-of-focusobjects below (and above) them. The magnitude of
the darkeningof the field due to shadowingis of the sameorder of magnitude as
the darknessof the grains themselves.
The natures of the signal and backgroundsgive us someclues about how a
successfultrack recognition algorithm shouldwork. Becausethe individual grains
in a track are not alwaysresolved,and also becausemany or most grains are not
part of secondarytracks, it is reasonableto try to detect the entire track rather
than the grainsof which it is composed.We could thereforeoperationally definea
track to bea straight path through the emulsionwhich hassomeminimum average
darkness.This criterion excludeschemical fog, sincesinglegrainscontribute only
a small amount of darknessto any path through the emulsion.For similar reasons,
it alsodiscriminatesagainstdelta rays. However,becauseof their scattering, delta
rays developmoregrainsthan other MIPs, and sometimesmimic real secondaries,
especially if they are energeticenough to follow more or lessstraight paths for
20-30 #m. We therefore needa secondcriterion - that the dark path be small
Page 9
and compact in the transversedirection in order to ensurethat the particle that
produced the path did not scatter. We accomplishthis by demanding that the
path be darker than similar paths in its local neighborhood [11]. This criterion
alsosolvesthe shadowingproblem, sincewemeasurethe darknessof tracks not in
terms of the intensity of light incident on the plate, but relative to the brightness
in their immediateneighborhood.
Finally, we require that all selectedtracks point back to a common vertex.
It is important to realize that the vertex point one seesin the emulsion does
not correspond directly to the event coordinates of the interaction point due to
emulsion shrinkage and distortion, as well as to the uncertainty in the measurement
reference system. We need to identify tracks which point back to this "apparent
vertex" whose position is known a priori to +5 #m in the transverse direction
and to within 5-50% in the longitudinal direction, relative to the center of the
microscope field of view. (The larger value applies to the plate closest to the
target.) Because of the uncertainty in the apparent vertex position we need to
modify the vertex criterion slightly: we demand that all secondary tracks point to
a common apparent vertex whose position will have to be determined as we search
for tracks.
This new vertex requirement brings us to the conclusion promised above: the
software will search for an apparent vertex, rather than individual tracks. Once
the vertex is found, the individual tracks of which it is composed can then be
identified and characterized. --
Fig. 5 illustrates how the vertex finding is done. For each trial vertex, the
intensity in individual frames is averaged along paths radiating from the trial
vertex. This produces a processed image which can be thought of as what the
emulsion would look like from the standpoint of the trial vertex. Tracks passing
through the trial vertex appear as dark spots, while isolated grains, coincidental
9
Page 10
::__ -("iZ•_
tracks, and delta rays appear washed out. The vertex finder evaluates trial vertices
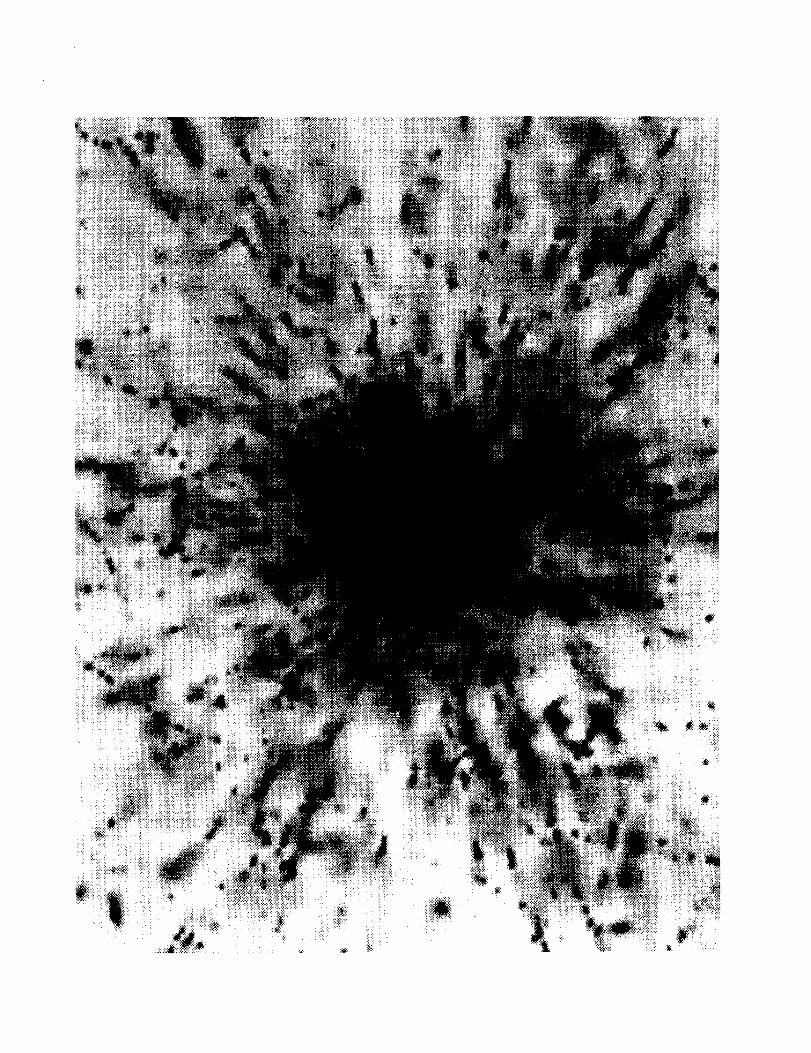
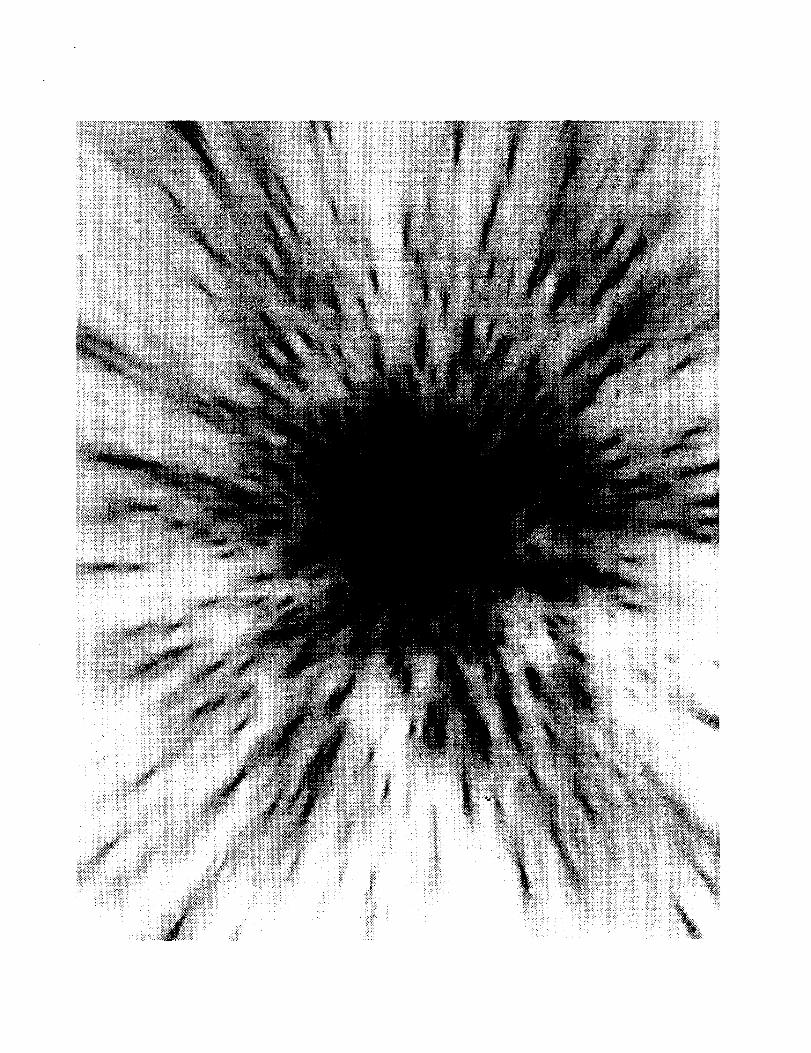
and searches for the one with the maximum number of small dark spots. Fig. 6
compares such a processed or "accumulated" image to one of its constituent frames.
To count the number of tracks in the accumulated image, the vertex finder first
high-pass filters the image, which imposes the compactness criterion by removing
large (diameters greater than 1 #m or so) objects, and also removes the shadowing
bias. The pixel darknesses in the resulting image are then compared to a threshold
(Fig. 7), producing yet another image in which the dark pixels are turned on and
the bright pixels turned off. Each distinct cluster of dark pixels is counted as a
candidate track, and the optimization routine in the vertex finder maximizes the
number of clusters [12] to determine the best apparent vertex and produce the
final accumulated image, which is stored for further analysis [11].
The filtering routine in the vertex finder is optimized for speed, since it is not
necessary to find every single track to accurately determine the apparent vertex
position. The final accumulated image is therefore handed off to a second-stage
image analysis routine which performs essentially the same analysis but in a more
careful manner. Each resulting cluster is centroided to measure the track position.
In addition, each track's darkness is measured by comparing the mean brightness
of pixels around the track centroid to the pixel brightness off-track. The resulting
list of track positions and darknesses of each candidate track is saved for later
submission to the plate fitting and reconstruction routines.
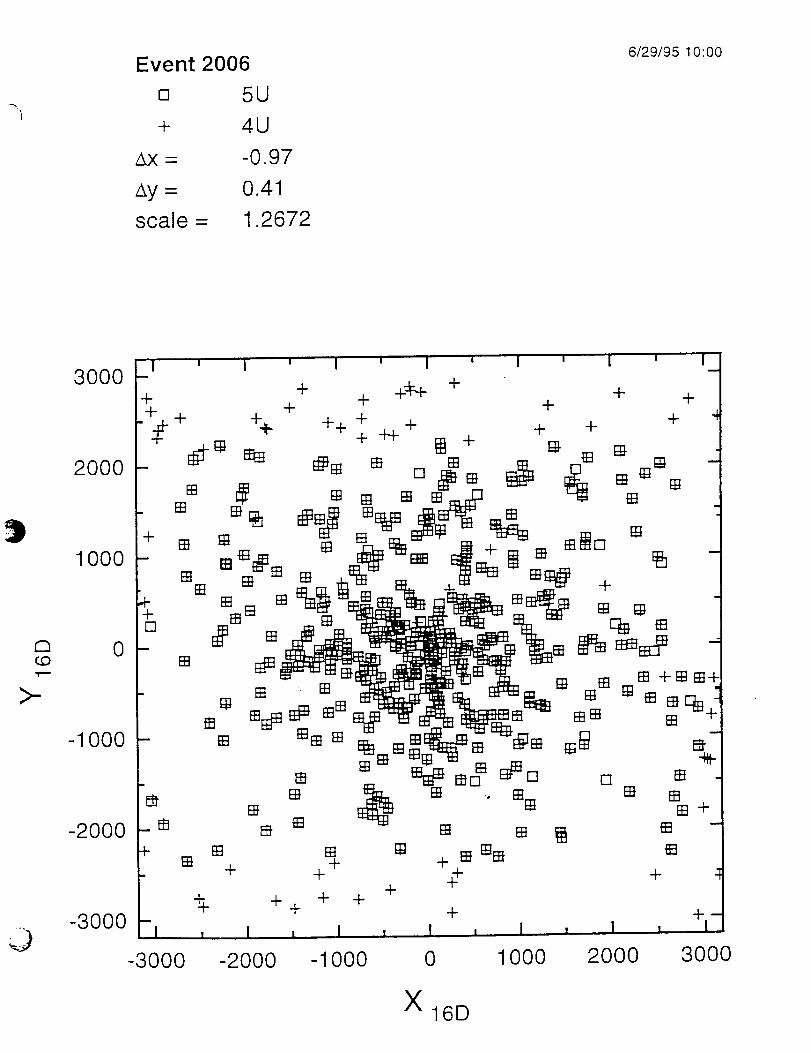
To give a qualitative idea of the acGuracy of the image analysis, track candi-
dates from the same event measured in two different emulsions are compared in
Fig. 8. The measurements in the upstream emulsion have been scaled and shifted
to overlap with the downstream layer. The correspondence is quite good, but, as
expected, there are some candidates in one emulsion that do not appear in the
other. Either a real track was missed in one layer, or background was incorrectly
10
Page 11
identified as a secondarytrack. One canseefrom this comparisonthat it is pos-
sible to cleanthe candidate track lists by comparing consecutiveemulsions. The
vertex finder analyzeseachfield of view independently,and this allows us to use
coincidencetechniquesboth to cleanthe track list and to systematically estimate
backgroundsand efficiencies.To do this, wemust first assembleall of the individ-
ual emulsiontrack lists into a single list for the entire event. This is the subject
of the next section.
5 Reconstruction
The image analysis produces track lists from each individual measured emulsion.
The reconstruction routine must then search all the emulsions for the individual
measurements along each track and join them together to form a single track list.
Reconstruction entails precisely determining the emulsion positions relative to one
another and to the vertex, and then comparing the individual measurements in all
the plates to find the real tracks and reject the background.
When comparing track measurements in two different plates, it frequently is
not straightforward to match pairs of measurements of the same track. In order
to connect the measurement pairs, one must know the relative positions of the
emulsions and the vertex. However, the uncertainties in these positions, which
have been determined from local non-interacting primaries (4-5 #m) and knowledge
of the chamber structure (4- -_300 #m), are far too large for positive assignment
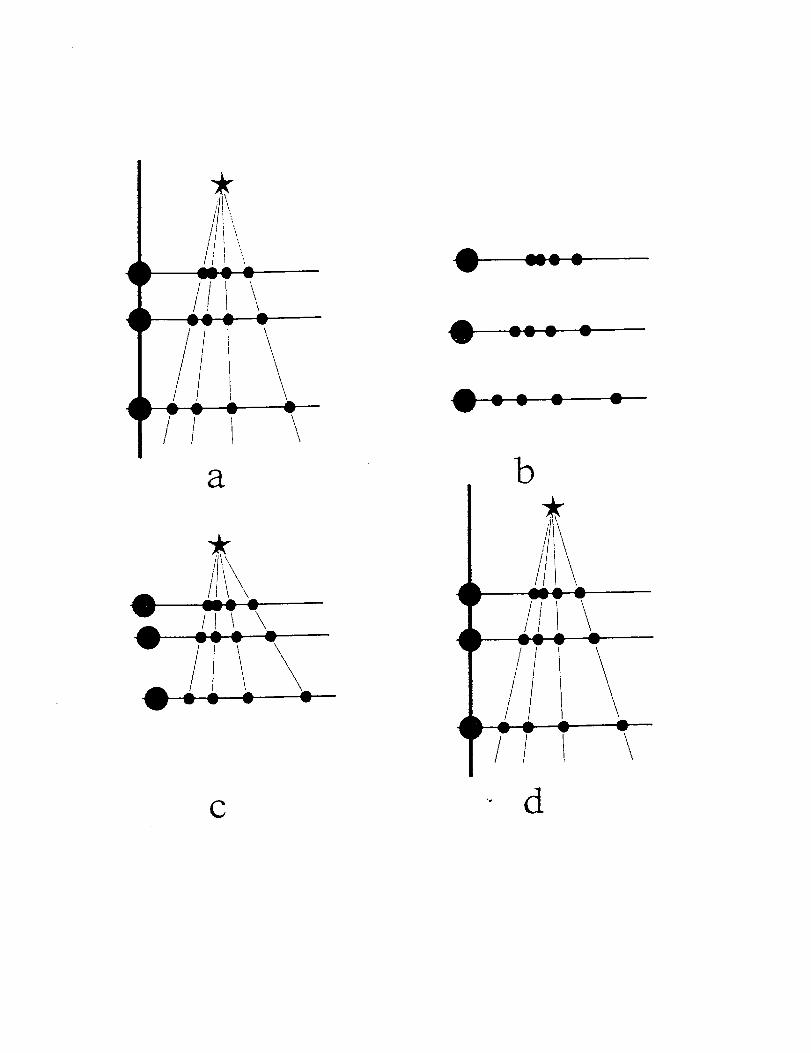
of individual measurements to particular tracks. _'ig. 9 schematically illustrates
the plate alignment problem. Almost all produced particles emitted from the
interaction have virtually straight trajectories [Fig. 9(a)]. After disassembling the
chamber for development and image acquisition, we have imprecise knowledge
of the plate and vertex positions, which makes track reconstruction ambiguous
ll
Page 12
[Fig.9(b)l.
In principle,the apparent verticesprovide information about the plate posi-
tions, but using this information for plate alignment works poorly in practice,
mainly for two reasons. A small amount of linearemulsion distortioncan shift
the apparent vertex horizontallymany microns. In addition,preciseknowledge of
the emulsion shrinkage factor,a function of relativehumidity and temperature,
is required and entailscarefulmanual measurement of every plate at the time of
image acquisition. Instead, the plate alignment is done using pattern matching
software [Fig. 9(c)]. As the figure shows, the pattern matching determines po-
sitions relative to the vertex up to a transverse shift (i.e., an uncertainty in the
direction of the event axis) and a longitudinal scale. The transverse ambiguities
are removed by assuming the event axis is parallel to the local non-interacting
primaries (LPs), and the longitudinal scale is determined using the fiducial spacer.
Once this information is incorporated, the original event geometry is reconstructed
[Fig.9(d)].
The pattern matching algorithm alignsa pair of emulsions by shiftingthe up-
stream emulsion measurements with respect to the downstream points by an offset
(Ax,Ay) and by scaling the upstream measurements by a factor m in order to
maximize the overlap between the two emulsions. To characterize the quality of
the overlap, the figure of merit S that is maximized is
ND$
d 2s = Z (2)i=1
where NDs is the number of tracks in the downstream side, d(,,,)i is the distance
between downstream track i and its nearest neighbor in the upstream emulsion,
and po is set to 1.0 #m. For close pairs (d(,,,) << 1.0 #m), the individual exponential
terms approach
1- (¢_),lPo) _, (3)
12
Page 13
and S is a measure of the sum of the squares of distances between nearest neighbors.
The exponent discounts tracks whose nearest neighbors are more than 1.0 #m away,
as these are likely to be spurious measurements. This fitting procedure is performed
in a pairwise fashion, starting with the most downstream pair of emulsions and
chaining up to the most upstream. For example, the downstream side of plate 5
is fitted to the upstream side of plate 5, which is fitted to the downstream side
of plate 4, which is fitted to the upstream side of plate 4, etc. Every matched
emulsion pair is plotted (e.g., Fig. 8) for visual inspection to confirm the fits. The
fitted longitudinal positions of the emulsion plates are also compared with the
known chamber structure to check for gross fitting errors.
Once the plate matching is complete, direction vectors which cluster together
are assigned to each measurement, and the individual measurements can be grouped
together into track candidates. The direction vector to a point from the vertex is
characterized by (xr_/, yr_/), the point at which the trajectory intersects an arbi-
trary reference plane parallel to the plates at distance z_,l from the vertex. The
direction vector is related to the space angles through
/
tan0 _¢/ 2 2 z= z_o: + y_,:/ _o:,
tan¢ = y,,:/z,.,/. (4)
Qualitatively, a track candidate is a cluster of individual measurements with similar
values of zr,i and y_,: (within ,_l.0 #m). A list of clusters is generated according
to criteria which are unrestrictive enough to include"almost all real tracks, and also
some spurious candidates. The main requirements for a candidate to be considered
a confirmed track are:
• A candidate must be measured in at least two emulsions. This coincidence
requirement efficiently discriminates against residual background.
13
Page 14
• The candidate cannot be missed in more than two consecutive emulsions.
This requirement cuts accidental coincidences, and also tracks which do not
point precisely back to the vertex.
In addition, there are further tests against low-energy tracks and tertiary electron-
positron pairs, and against spurious close pairs (caused by one false measurement
close to a real track). These selections are described in the Appendix.
6 Results
To test the image analysis and reconstruction techniques, two automatically mea-
sured Pb-Pb events, with multiplicities ,-_ 670 and 1300, were checked using the
semi-automatic microscope system at INP in Krakow. The INP system uses a
CCD camera to display the microscope image on a monitor, allowing tracks to be
measured by the operator using a mouse and cursor. These track measurements
are stored in a computer file as they are taken. The events are reconstructed man-
ually as the measurements are taken. A similar test was performed using two 10.6
GeV per nucleon Au-Au events with multiplicities of about 120. The Au chambers
provide a more rigorous test of background rejection (these chambers were exposed
to -,_ 3000 cm -2 primaries), but the Pb events have larger multiplicities, the sec-
ondary tracks more densely populate the plates, and there are marly more plates
applied in the reconstruction (,-,12 for Pb, compared to 3 or 4 for Au). In both
cases, the two methods agree on 97% of the reconstructed tracks. The distribu-
tion of discrepancies is uniform in azimuthal angle within statistical uncertainties,
and the opening angle distribution of the discrepancies is consistent with a flat
detection efficiency in the region of full acceptance (77 > 2.6 or/_ < 0.15 rad).
The main measurement biases can be estimated independently of this com-
parison. The coincidence technique allows the efficiency with which tracks are
14
Page 15
detected to be estimated for every event, plate-by-plate. After the event is re-
constructed, each track is examinedfor "missing" measurements,i.e., emulsions
in which the track could havebeendetected (becauseit waswell-separatedfrom
other tracks) but wasnot seen. A record of missesis kept for every event and
every plate. Similarly, the "singles" backgroundis estimated from the number of
measurementswhich arenot usedin reconstructedtracks, and thus are presumed
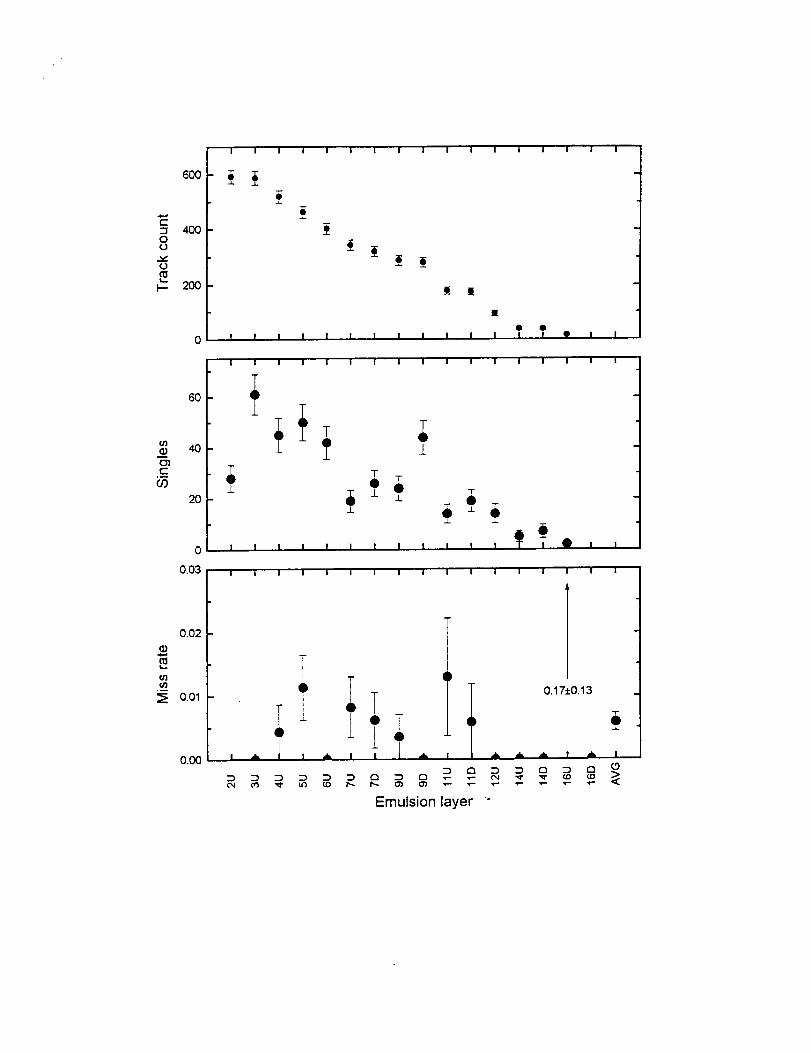
to be background. Fig. 10showsthesediagnosticsfor a sampleevent. Both the
miss rate and the singlesrate are roughly independentof the track density. The
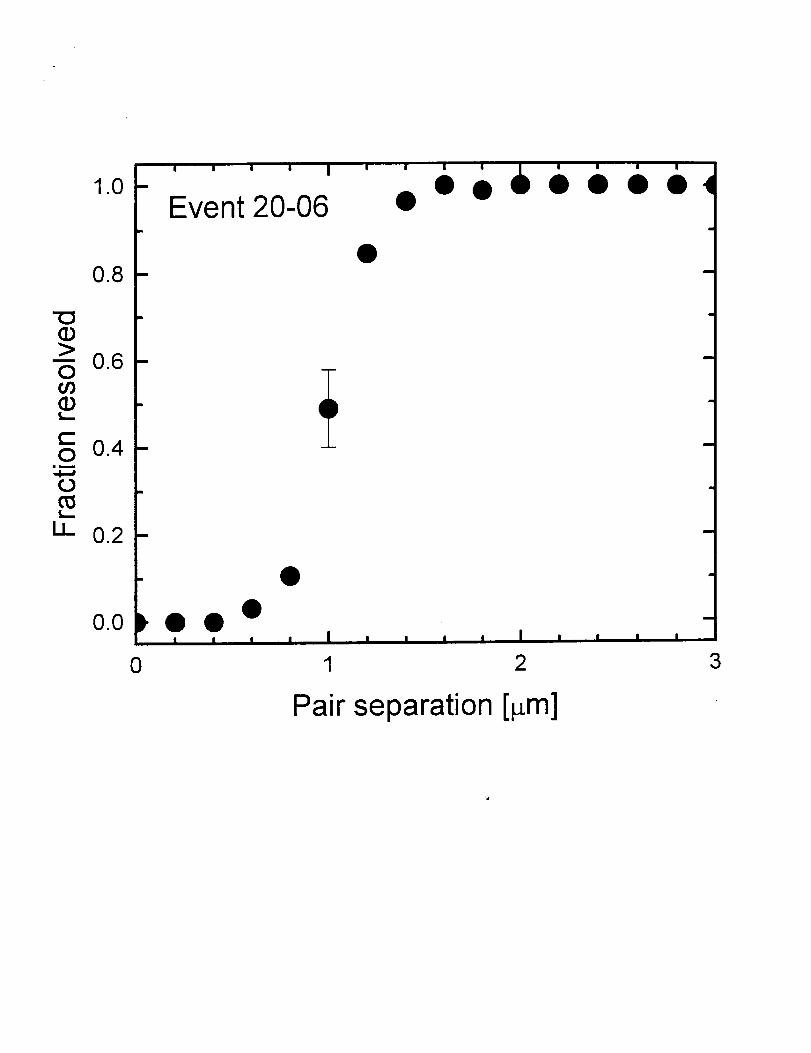
instrumental resolution of closepairs (Fig. 11) is 1.0#m, causingvery closepairs
of tracks to be undercounted. We estimate this bias to be 3%of the track count
for thesehigh multiplicity Pb-Pb events. Combining the biasescalculated from
the measuredefficiencies,singlesrates, and pair resolution (c.f. Appendix), the
overall track counting errors are estimated to be 3% of the track count, in good
agreementwith the comparisonto the semi-automaticmeasurements.
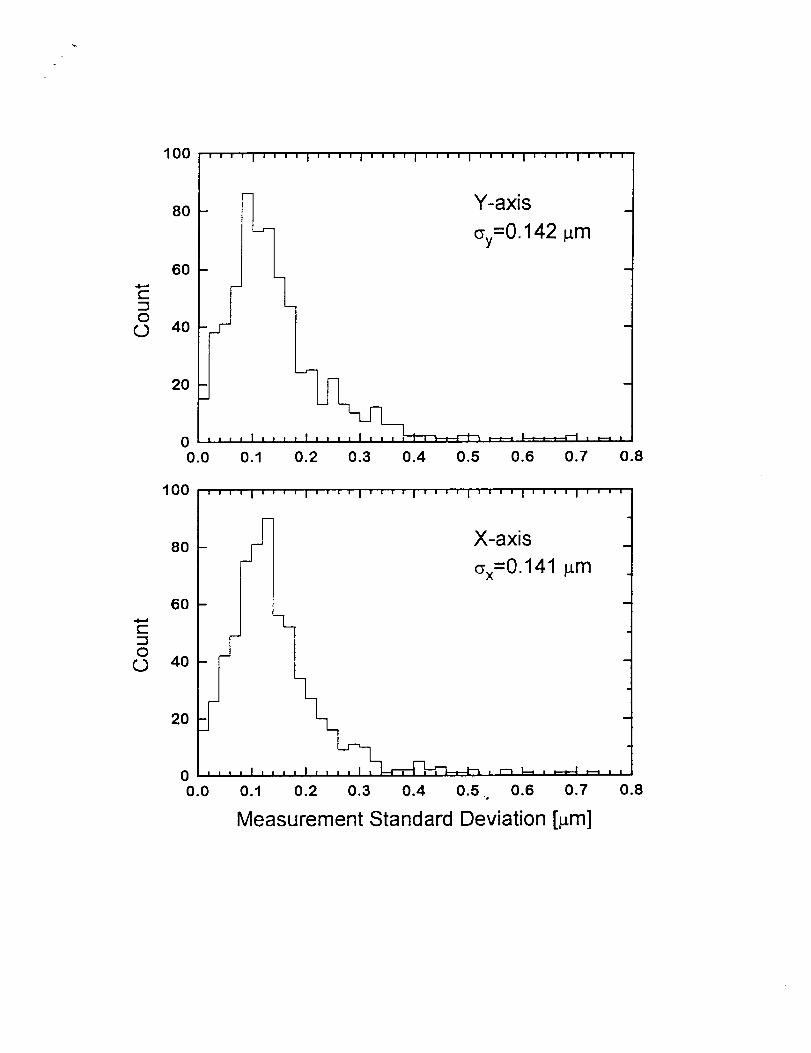
Having establishedthat the reconstruction procedureproduces "clean" track
lists at the level of + 3%, wecan examine the accuracyof the angular measure-
ments. Fig. 12 showsthe standard deviation of individual measurementsabout
their fitted tracks. The meanstandard deviation is 0.14 #m in both the x and
y-directions, and the transversemeasurementuncertainty is therefore 0.20 #m.
Sincethe field of view is about 50#m from center to perimeter, the track opening
angles0 are determined to ,,_ 0.4%, corresponding to an uncertainty _r/ _ 0.005
e A systematic uncertainty in the transversein the pseudorapidity r/ = -In tan 3"
positions derives from the absolute determination of the event axis. Typically, the
last measured plate is 3.3 cm downstream. This results in a typical systematic
uncertainty in the azimuthal angle 8 of 5/_m/3.3 cm = 0.15 mrad in the absolute
positioning of the event with respect to the reference system. The uncertainty in
the longitudinal track positions has a statistical component which is greatest at
15
Page 16
large angles but does not exceed 1%, and an estimated 1% systematic component
due to uncertainty in the fiducial spacer thickness. The overall uncertainty in the
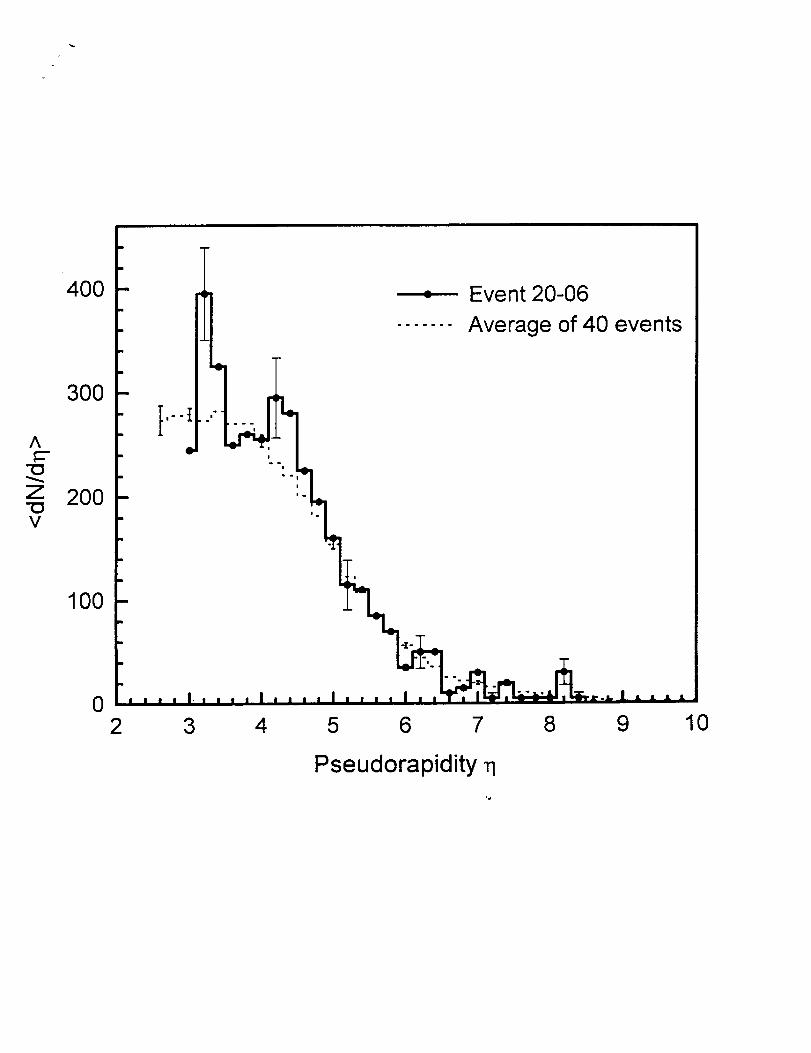
pseudorapidity ranges from ,-- 0.01 at small 77 to 0.03 at 77 = 6. The value of
the pseudorapidity loses significance beyond 7? = 9. Fig. 13 shows a typical pseu-
dorapidity distribution, and the average of 40 high. multiplicity pseudorapidity
distributions.
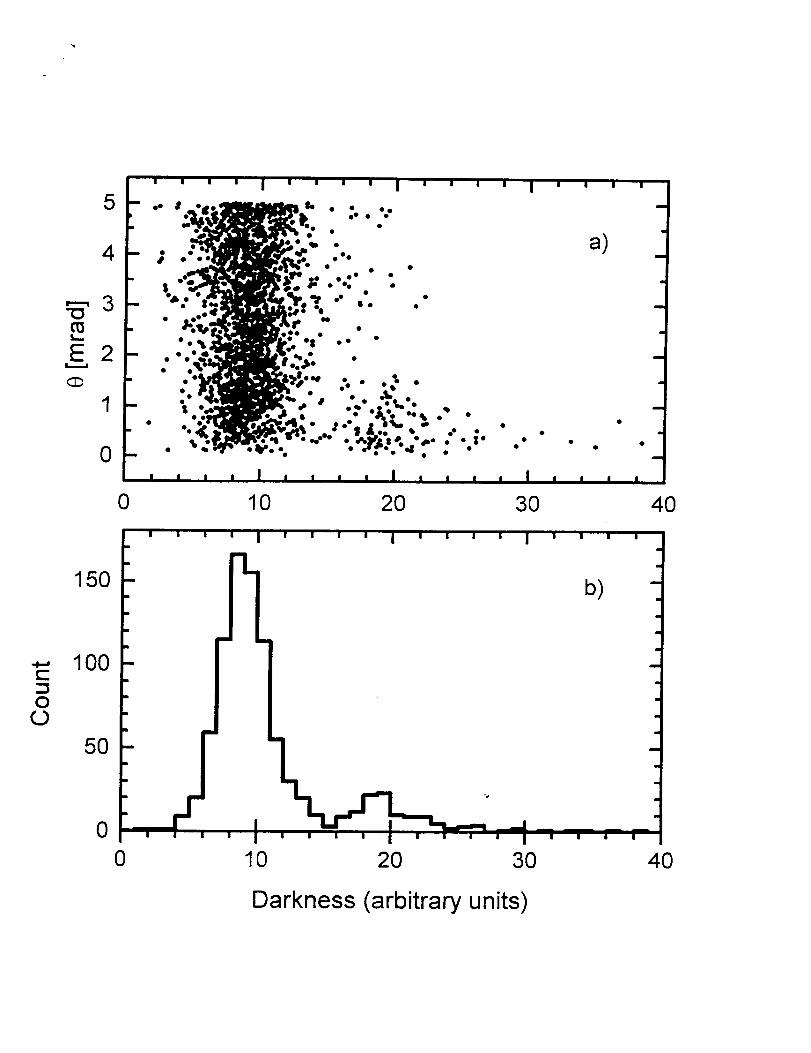
Besides a track's space angle, its other main property is its darkness. Fig. 14
shows the darkness distribution near the interaction axis as a function of opening
angle for 40 semi-central events. Most of the tracks within 5 mrad of the axis are
minimum ionizing, but a more heavily ionizing component can also be observed,
corresponding to spectator alphas and heavier fragments.
Using the automatic system, a single operator can measure and reconstruct
events several times faster than previously possible. Because the analysis can
be performed in parallel on several machines simultaneously, the measurement
"bottleneck" is the image acquisition. With the current setup, a chamber with
20 events can be digitized in 3-5 days, and the analysis can be started while data
from the next chamber is being acquired. A single Pb event is processed on a 166
MHz Pentium in ,-_ 4 hours.
In summary, when the entire analysis chain from image analysis to track re-
construction is tested as a whole, the results agree well with careful manual mea-
surements. Further, automatic measurement opens up new possibilities to rig-
orously understand counting systematics by providing consistent, detailed back-
ground and efficiency measures. Tb_is accomplishment augments one of emulsion's
main strengths: the ability to characterize individual tracks. At the same time, au-
tomation ameliorates emulsion's chief weakness by making the measurement much
faster, simpler, and significantly more repeatable and systematic.
16
Page 17
7 Acknowledgements
This work was partially supported in the U.S. by the National Science Founda-
tion (Grants PHY-921361 and INT-8913051 at LSU) and Department of Energy
(DOE-FG02-89ER40528 at Minnesota), and in Poland by State Committee for Sci-
entific Research grant 2P03B18409 and by Maria Sklodowska-Curie Fund II No.
PAA/NSF-96-256. PD thanks the Louisiana State Board of Regents (LEQSF)
under agreement NASA/LSU-91-96-01 and NASA/LaSPACE under grant NGT-
40039 for their support. Construction of the automated microscope system was
funded by NASA (NAGW-3289 and NAGW-3560) at LSU. We very much ap-
preciate the hetp of the CERN staff, A. Aranas, J. Dugas, and L. Wolf at LSU,
and especially Prof. Y. Takahashi and his EMU-16 colleagues for their generous
assistance.
J Current address: Horizon Comp., 5 Lincoln Hwy, Edison, NJ 08820.
17
Page 18
Figure Captions
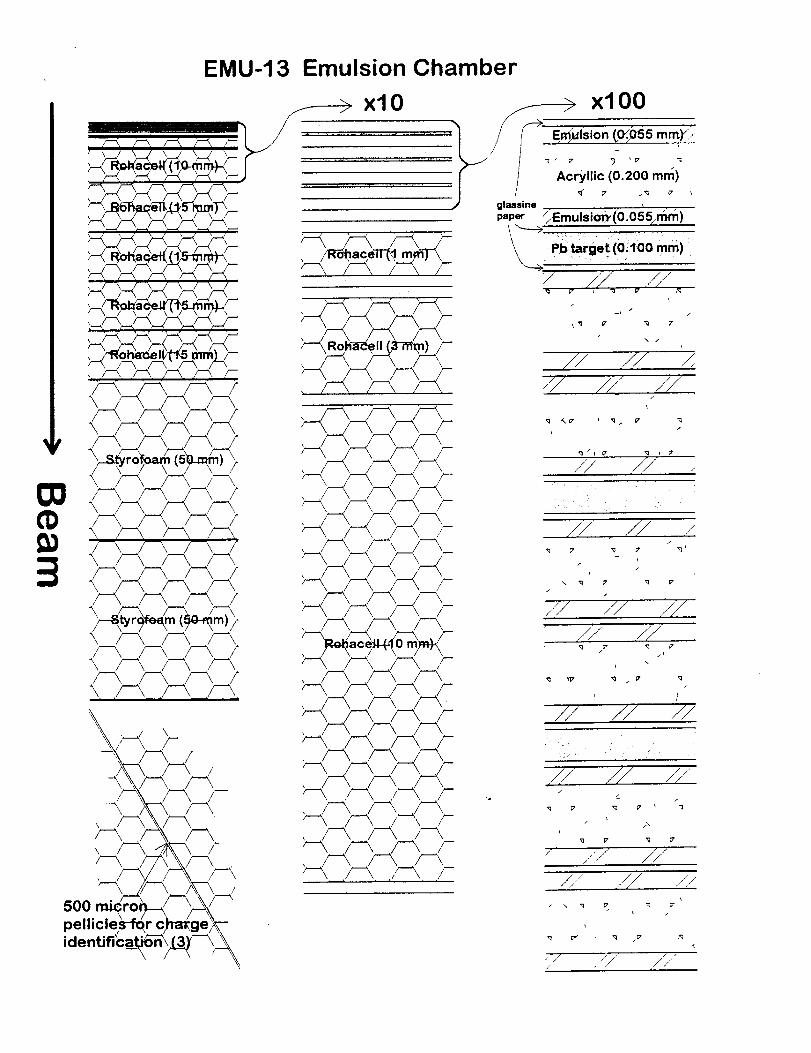
Fig. 1: KLMM Pb chamber used at CERN. A chamber with three target mod-
ules is shown. Some of the chambers had four targets. The right-hand columns
show details of the upstream chamber structure at 10 and 100 times the scale of
the left column. The horizontal scale is arbitrary.
Fig. 2: Overview of the reconstruction analysis chain.
Fig. 3: The LSU automated microscopy system. The monitor can display the
contents of either a stored frame buffer or the "live" digitized image, allowing it
to be used as blink comparator between live and stored images, or between two
stored images.
Fig. 4: Focus signal as a function of focus depth in emulsion. A large signal
indicates the microscope is focused in the emulsion.
Fig. 5: Schematic illustration of the vertex finding process.
Fig. 6: (a) Event 20-06, approximately 80 #m downstream of the interaction
in the Pb foil. The field of view is 140 tim × 80 tim, and the depth of the field is
about 1 tim. The focal plane is 4 tim into the emulsion. (b) Accumulated image
constructed from (a) and 19 other frames in a focus sequence.
Fig. 7: Histogram of filtered image values on every darkness peak. The thresh-
old is individually determined for every field of view based on the position of the
background peak.
Fig. 8: Coincidence of measurements in two emulsions. In the upstream emul-
sion (crosses), which is about 80 tim from the verteX', the tracks in the center of the
field of view are not resolved. The downstream emulsion (squares) is 2.97 times
farther downstream, and the tracks are resolved almost to the event axis. On the
other hand, the upstream emulsion shows wide-angle tracks which have passed out
of the field of view of the downstream emulsion. The units are arbitrary.
18
Page 19
Fig. 9: The plate alignment problem. (a) Plate alignment prior to disassembling
the chamber. The large circles represent a local noninteracting primary; smaller
dots represent shower tracks. (b) Upon disassembly, plate registration is lost. (c)
Pattern matching reconstructs plate positions up to an overall transverse shift and
longitudinal scale. (d) Local noninteracting primaries determine the shift and the
fiducial spacer determines the scale.
Fig. 10: Track count, singles rate, and measurement inefficiency for individual
plates for Event 20-06. (In plate 16, 12 tracks are visible. Two of these are missed
in emulsion 16U, giving rise to a large miss rate in this emulsion.)
Fig. 11: Pair resolution efficiency as a function of pair separation on the emul-
sion plate for a typical event. To calculate the resolution efficiency, two histograms
of track separations are constructed for both fully resolved and unresolved measure-
ments along a sample of reconstructed tracks. At each separation, the resolution
efficiency is then (resolved)/(resolved + unresolved).
Fig. 12: Standard deviations of individual measurements around their fitted
track trajectories.
Fig. 13: Pseudorapidity distributions for a sample event (solid line), and the
average pseudorapidity distribution of 40 high multiplicity events (dotted line) [3].
Fig. 14: Darkness distribution of tracks near the event axis. (a) Track daxkraess
vs. opening angle. (b) Darkness distribution of all tracks in the forward 2 mrad
cone.
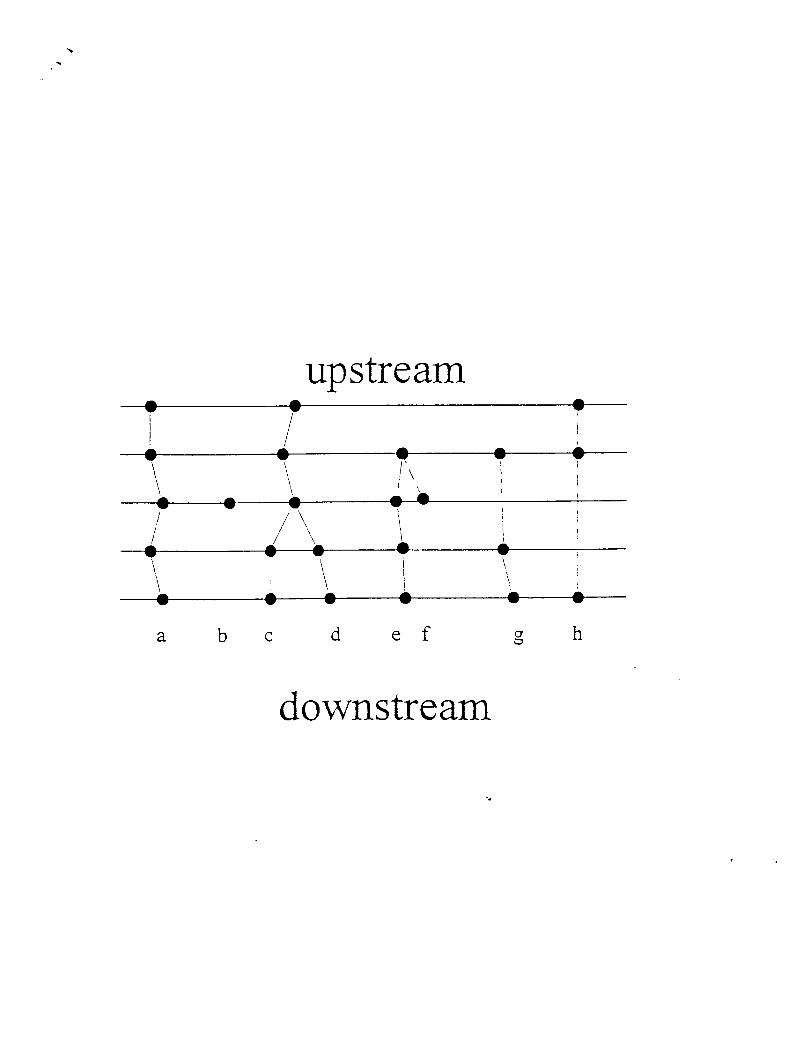
Fig. 15: Features of track candidate clusters. Solid lines connect measurements
in accepted tracks. Dotted lines represent rejected clusters. (a) A cluster consists
of measurements with similar space angles. (b) Isolated single measurements are
rejected. (c,d) Measurements can belong to more than one track. These examples
axe typical of close track pairs. (e,f) A close pair must be confirmed in the next
layer.Track (e) isconfirmed; (f)isnot. (g) Gaps of one emulsion are allowed. (h)
19
Page 20
Caps of more than one emulsion are not allowed.
2O
Page 21
References
[1] T.H. Burnett et al., Nucl. Instr. Methods A 498, 583 (1986).
[2] K. Winter, Proc. 16th Intl. Conf. on Neutrino Astrophysics (Nucl. Phys. B
[Proc. Suppl.] 38, 211) (1995).
[3] P. Deines-Jones et al., Phys. Rev. C 53, 3044 (1996).
[4] C.F. Powell, P.H. Fowler, and D.H. Perkins, The Study of Elementary Parti-
cles by the Photographic Method, London: Pergamon Press, 1959.
[5] P.H. Fowler, Nucl. Instr. Methods 147, 183 (1977).
[6] A. Iyono et al., Nucl. Instr. Methods B 52, 98 (1990).
[7] S. Garpman et al., Nucl. Instr. Methods A 269, 134 (1988).
[8] E. Olson et aI., Proc. 23rd Intl. Cosmic Ray Conf. (Calgary) 4, 718 (1993).
[9] P. Deines-Jones et al., Proc. 23rd Intl. Cosmic Ray Conf. (Calgary) 2, 536
(1993).
[i0] A. Tawfik, private communication (1996); E.Ganssauge, invited talk at the
16 th Intl. Conf. on Nuclear Tracks in Solids, Beijing, China (1992)
[11] P. Deines-Jones, Ph.D. thesis, Lousiana State University (1996).
[12] J. Hoshen and R. Kopelman, Phys. Rev. B 14, 3438 (1976); H. Gould and
J. Tobochnik, An Introduction to Computer Simulation Methods (Part II),
Reading, MA: Addison-Wesley, 1988.
[13] W.H. Press et al., Numerical Recipes in C: The Art of Scientific Computing,
end ed. Cambridge, MA: Cambridge Press, 1992.
21
Page 22
A
A.1
Reconstruction Algorithms
Plate Fitting
Essentially, the plate fitting program is a minimization routine which minimizes
the sum of some measure of distance between nearest neighbors in two adjacent
plates. The standard quantity to minimize is the sum of the squares of the dis-
tances, but in this case, the sum of the squares emphasizes distant pairs which are
physically unrelated. Optimization routines based on summing the squares some-
times converge but are extremely unstable. Instead, we have chosen a function
which acts like the distance squared for small distances, but contributes little to
the sum at large distances (Eq. 2). The detailed behavior of this function appears
to be irrelevant - we have obtained equally good results, for example, by substi-
tuting a lorentzian for the exponential. What is important is the behavior at small
and large distances d,_.
The figure of merit S is a function of the relative transverse plate shifts (/kx,Ay)
and the ratio m of the distances of the downstream plate's distance to the vertex to
the upstream plate's vertex distance. Because of the large number of measurements
in both plates, the function frequently has several local minima. To correctly align
the plates, the routine must find the global minimum. Like the vertex finder, the
plate alignment routine has a first stage grid search followed by a conventional
optimization routine (Powell's Method [13]). To do the grid search, each plate's
track positions are binned into a two-dimensional array representing the field of
view. The downstream plate is binned on a 2 micron square grid. The upstream
coordinates are first transformed according to
xr = m(x - (5)
yr = m(y- Xy)
22
Page 23
and then arealsobinned on a 2 micron grid. The quality of the overlap is found by
calculating a match-to-missratio, where the number of "matches" is the number
of array bins that contain tracks upstream and downstream, and the "misses"
are the number of bins with an upstream track but no downstreamtrack. (The
mean nearest-neighbortrack spacingis roughly 5 #m near the edgesof the plates.
Therefore, the 2 #m array elementsare mostly 0 near the plate edges. The size
of the array elementmust be small enoughthat there are a significant number of
empty elements,but large enoughthat the calculation is performedquickly.) The
grid searchis performedon a 2 #m transversegrid. The scalestep size is chosen
so that a singlestep changesthe upstream positions (xT, YT) by no more than 2
/.tm.
A.2 Reconstruction
Reconstruction starts with the most downstream emulsion, and matches for each
measurement are sought in the next most upstream emulsion. An upstream mea-
surement is considered a possible mate if it falls within 1 #m of the ray joining the
vertex to the downstream measurement. If more than one measurement exists in
the search radius, the nearest is selected. If no match is found in that emulsion,
the next one is searched, and so on. This procedure allows an upstream measure-
ment to be shared among two or more tracks, but ensures a branching structure,
in which two tracks never rejoin downstream.
To be considered a confirmed track, each cluster r_ust pass four tests, illustrated
by the examples in Fig. 15:
Coincidence A track must be measured at least twice. This discriminates against
residual background from the image processing stage. All the clusters in
Fig. 15 except (b) meet this criterion.
23
Page 24
Dispersion The R.MS scatter around the fitted track trajectory must be less than
1.0 #m, corresponding to 5 standard deviations. This cuts tracks that do not
point back accurately to the vertex, as well as low-energy tracks emitted by
the struck target.
Accidental background This tests for random tracks which happen to point
almost toward the vertex, as well as spurious tracks created by background
coincidence. The candidate is vetoed if it is missed in two or more consecutive
emulsions, i.e., if it would be in the CCD field of view and also well-separated
from nearby tracks, but is not measured. Thus, (g) is accepted but (h) is
rejected. The detection efficiency for well-separated tracks is 99% on aver-
age, and tracks are measured in no more than 25 separate emulsions, so the
probability of two or more consecutive misses in a real track is typically less
than 25 x (0.01) _ ,,_ 0.25%.
Close Pair A background measurement in proximity to a real track can imitate
a pair of tracks. To be accepted as a real track, a cluster must have at least
two measurements which belong uniquely to that cluster. In Fig. 15, clusters
(c) and (d) pass this test, but (f) does not. An exception is made for tracks
with a single unique measurement if the unique measurement occurs in the
most downstream measurable emulsion. Such a track is likely to be one of a
close pair which is resolved just before it leaves the field of view.
Systematic errors are estimated on a track by track basis using background and
efficiency information derived from the reconstruction. Values are computed for
four kinds of systematics:
Missing Measurements There is a probability of about 1% that a track will be
missed in a particular emulsion. If the track can only be measured in two
24
Page 25
emulsionsand is missedin one, it is then measuredonly once and is incor-
rectly consideredto be background. If the track can be measuredin three
emulsions,accordingto the consistencytestsabove,it is only rejected if it
is missedin two consecutiveemulsions.The probability that a track will be
missedbecauseof missingmeasurementsdrops rapidly with the number of
possible measurements,and the expectednumber of missed tracks is very
nearly twice the number of double measurementstimes the measurement
inefficiency. For Event 20-06, the expectednumber of missed tracks is ap-
proximately 2 × 171× 0.06 = 2.0 tracks, compared to 762 measured tracks
in all.
Spurious Doubles Spurious doubles are created when a background measure-
ment in one emulsion coincides with a background measurement in another,
or when a random track which nearly points back to the vertex passes through
the field of view. Accidental coincidences are cut if the supposed track is
missing in at least two consecutive emulsions in which it could be measured
if it were real. This cut is only about 50% efficient, since it can only be used
if there are four or more measurable emulsions. In Event 20-06, 8 spurious
doubles were detected, suggesting another 8 remain undetected.
False Close Pairs The main source of false close pairs appears to be single mea-
surements incorrectly identified in image processing as two measurements.
False close pairs are cut if one of the tracks h_ a missing downstream mea-
surement. About 6% (48) tracks were cut on this basis. False close pairs
remain undetected in that sample of tracks which branch only in the most
downstream emulsion. Event 20-06 has 118 such tracks. We estimate that
1_x 118 x 0.062 = 3.6 false close pairs remain undetected.2
Unresolved Close Pairs These are tracks which are too close together to be
25
Page 26
optically resolved.Usingthe measuredinstrumental pair resolution, weesti-
mate that weundercountthe numberof pion tracks by roughly 6 in a typical
high-multiplicity event. In addition, weexpectthat 10-20closeelection pairs
from _.0decayarecountedassingle tracks.
26
Page 27
EMU-13 Emulsion Chamber
// // _.;//_
// // ,
ZI
// . // /.¢
// // //
// ,// ,q 7"" q ;_
\
// // //
.u ¸¸ j / • .
,// // .///
,, //// //
//," //
4
Page 28
BeamP1 T P2 P3 P4
v
P5
, ii i----[
///
/////////
//////
/////////V//V//'
I Scanning
Tracing
J
I Acquisition (Low Power)
Acquisition (High Power)
Vertex Finding [
I
Stage 2 Image Processing ]
Plate Fitting
Reconstruction
Page 29
,'A-e-,0
Z
PC ISA Bus
I
e,,i
II
e,,
II
- Itt_
eq ,_
F wm m _ i
r,.)
-'±'--
Page 30
40
30
i ' I ' I
u
C_
0U..
20
10
040 60
I , I
80 100
Focus Height [#m]
I
120
Page 34
c-
O
0
IOO0
100
10
1
m
m
m
m
m
m
m
m
m
m
m
|
m
m
m
m
m
m
m
m
m
Imlm
' I
hreshold:
0.0758
t
I
0.0
I
0.1
' I ° I
Event 20-06
Plate 4 (upstream)
6749 peaks
0.2 0.3
Darkness
I
0.4
m
im
"M
_mm
a
am
im
aw
0.5
Page 35
Event 2006
[] 5U
+ 4U
Ax = -0.97
Ay = 0.41
scale = 1.2672
6/29/95 10:00
3000
2OOO
O
IOO0
0
>.-
- 1000
-2000
-3000
I
El
F_
[] + ++
+++ + +
i I , I L ! I+
I i I , ! _ +1-
-3000 -2000 -1000 0 1000 2000 3000
X 16D
Page 36
f \, \
a
c
b
// ! \
Page 37
I I I I I I I I I I I I I I I I I
600
i-- 20O 1I I
0 I J i I i , l l l l , l _' _ • i l
I I I I l I I I I I I I I I I I I
60
60 , i w _- T • , ,
0.03 I I I I I I I I I I I I I I I I I
0.02
(_
0.0O i _ _ ,,k i _ ,.L ,.h I -,'.-
::3 Q ::3 ::3 O ::) Q r_:3 ::3 ::3 :) :_ :3 Q _ a _ T- ('_ _r _I" (,,o co <,_
Emulsion layer "
Page 38
1.0
0.8
(D
cO(D
c-O 0.4
0
LL 0.2
0.0
Event 20-06O0 •
0
0
00
I I '
0
. I , , , , I ,
I 2
Pair separation [#m]
3
Page 39
400 .... i .... i .... i .... i .... i .... i .... , ....
,4--.'
c-
OC)
c-
OC)
8O
60
40
20
100
8O
6O
4O
2O
00.0
r] Y-axis _
y-O. 142 #m
i
i
i , , , I , , , , I , , , _ I _ , , _ ,--,---, I--...-,.--,-.4-_ , ,--, ,
0.1 0.2 0.3 0.4 0.5 0.6 0.7 0.8
0
0.0
,,,,i,,,,i,,,,i_,,,i,,,,i,,,,i,,, ,i, ,,,
X-axis
_x=0.141 #m
0.1 0.2 0.3 0.4 0.5 .o 0.6 0.7 0.8
Measurement Standard Deviation [gin]
Page 40
/k
"0
z-0V
400 = Event 20-06
....... Average of 40 events
300
Q "1 i ill
200 '-
100
02 3 4 5 6 7 8 9 10
Pseudorapidity
Page 41
C
0
0
5
4
E 2L=====_
I
0
I I l I l l , ,
a)
. . , , l , , , , I , , , , I , , , ,
0 10 20 30 40
150 _ '
100
5O
0
0
' ' ' I ' ' ' ' I ' ' ' ' I ' ' ' '
b)
10 20 30 40
Darkness (arbitrary units)
Page 42
AW
AW
\AW
//
Av
\\AV
AV
upstreamv
/AW
\\AW
A
W W
, \A AW W
A
/-,- AV v
v
t
AW
A
Av
\,\AW
AV
W
AW
a b C d e f o" h
downstream