AbstractIn a cavitating water jet, cavity clouds emerge and collapse with an unsteady, but periodic tendency where the frequencies depend on the working conditions. The presented work aims at examining and analyze the dynamic behavior and properties of the clouds under different circumstances. Computer vision and image processing were introduced as tools to define the cavitation clouds based on the Contour Recognition technique. A Canny opera-tor and Otsu threshold fragmenting methods were used. The use of these methods allows for a better understanding of the cavitating jet clouds’ behavior based on the pixel inten-sities and shows that for an arbitrary cloud the surface itself has a dynamic feature and depends on the cavity composition. The clouds’ properties could be measured and cor-related to the applied working conditions. Also, the oscillation frequencies of the area of the clouds could be determined. The analysis shows that the quality of the obtained results depends mainly on the input threshold values separating the foreground and background pixels. The difficulty of defining the threshold value is discussed in the paper, as well as the validity of using the Contour Recognition technique in this field.
Cavitation is considered as a complex phenomenon involving high speed, high pressure, multiple phases, phase transition, turbulence, and unstable features. Cavitation bubbles collapsing on the surface normally cause severe damage to the hydraulic equipment such as pumps, screw propellers, and valves. However, the cavitation collapse can be
1 Institute of Nuclear Techniques, Budapest University of Technology and Economics, Budapest, Hungary
2 Department of Thermohydraulics, Center for Energy Research (EK-CER), Budapest, Hungary3 Faculty of Mechanical Engineering, University of Belgrade, Belgrade, Serbia
866 Flow, Turbulence and Combustion (2022) 108:865–893
1 3
utilized for surface modification, enhancement of mechanical properties of materials, surface cleaning, and other application fields. For the practical use of cavitation, a good command of the cavitation aggressivity and a good understanding of its characteristics are required to improve the quality of the effect and to shorten the processing time. For further improvement of cavitating water jet generators, the basic theory of cavitation behavior, impact-pressure distribution, and related parameters should be investigated (Hitoshi et al. 2009; Hutli et al. 2013a, 2016a, b, 2018).
The main concept of the cavitating jet generator is creating the cavitation cloud utilizing vortex cavitation in the shear layer of a high-speed jet submerged in water. Many researchers have shown that the cavitating water jet produces periodical cavi-tation clouds and produces strong impacts through cloud collapsing (Yamaguchi and Shimizu 1987; Vijay et al. 1990; Soyama et al. 1994; Hutli and Nedeljkovic 2008). The cavitation as a tool attracts industrial and healthcare attention (Hutli et al. 2018; Kalu-muck and Chahine 2000; Soyama et al. 2000). The understanding of the cavitation cloud behavior and the dynamics of individual bubbles is essential to increase the application fields of the cavitation. The cavitating jet generator is a tool to create intensive, fast, controllable, coherent structure and severe cavitation phenomenon which is suitable for cavitation study and application.
As the cavitation clouds collapse, the micro-jets, and shock waves are formed, the micro jet velocity and the shock wave intensity depend on the cloud composition and ambient pressure (Reisman et al. 1998). According to the previous studies of the authors (Hutli and Nedeljkovic 2008; Saito and Sato 2006; Sato et al. 2009a), based on the type of cavitation, exposure time and material target, etc., the cloud collapse may lead to plastic deformation, erosion, and failure in the target. The collapse of the cavitation cloud produces consecutive collapses of small clouds or bubbles and forms a complex impulsive pressure field. As an example, the collapse of clouds in the case of cavitating jets or the collapse of the attached cavity cloud on the hydro-files in the case of the cavitation tunnel (Hutli and Nedeljko-vic 2008; Sato et al. 2003; Soyama et al. 1993; Ganesh et al. 2016). Generally, the cloud cavitation shows an unsteady periodic tendency with a periodic shedding/discharging of cavitation clouds and a reentrant motion in a cavity. The relation between the reentrant motion and the shedding cavity was proved; it can be understood by tracing the sheet cavi-tation of hydrofoils in cavitation tunnel (Sato et al. 2001, 2010; Sakoda et al. 2001; Delar et al. 2012). Many authors have studied the flow cavitation in a convergent-divergent noz-zle installed in a cavitation tunnel. The obtained result showed that a reentrant motion on the inside of a cavity and the following formation of periodic cloud cavitation is caused by pressure waves occurrence and its propagation due to a collapse of a cavitation cloud shed downstream (Sato et al. 2001, 2010). In the case of a cavitating water jet, cloud cavita-tion is formed in the nozzle or at a nozzle exit and a jet boundary. There exist some severe pressure waves in the cloud region of the cavitating water jet (Hutli and Nedeljkovic 2008; Sato et al. 2009b, c, 2013; Saito and Sato 2007; Yoshida et al. 2012; Hutli et al. 2013b, c). Using the flow visualization techniques significantly improved the investigation and study-ing methods of cavitating flow, specifically in the analysis of cavitation conditions. This means that, once the cavitation inception is detected, it can be very useful to analyze an image of the phenomenon for an in-depth evaluation of the characteristics of cavitation. A qualitative study of the cavitation phenomenon assisted by human analysis of static images has been made (Merzkirsch 1987; Yang 1989). Also, some experiments on the automatic analysis of cavitation zones employing image processing have been presented in the litera-ture (Yaw-Huei et al. 2017). Many authors have adopted image processing techniques to study and to characterize cavitation, the obtained results show that this technique is a good
867Flow, Turbulence and Combustion (2022) 108:865–893
1 3
tool for analyzing the cavitation phenomenon (De Lucia and Anguzza 1994; Baldassarre et al. 1998; Yaw-Huei et al. 2017).
The outcome of image processing can be the image itself with a modification or a set of parameters related to a certain object in the image. In image processing, image analy-sis, image pattern recognition, computer vision, and human vision the edge detection is assumed as a classical and important technique that is an essential step in image processing and analysis. It is used to provide the geometrical “boundaries” information of the inter-rogation area “object” in the image. The information about the shapes and the reflectance in an image is useful for image segmentation, registration, and identification aims. In the threshold evaluation method of edge detection, the variation in intensity that occurs in the image is stated as the edge. The gradient values of pixels exceeding a certain threshold are considered as edge pixels. The fundamental steps in the edge detection process which are used to identify the points in the image where clear changes occur in the intensity are filter-ing (refining) enhancement (intensification), and edge magnitude threshold (Gonzalez and Woods 2008; Larry 1975). Another fundamental step in image processing, image analysis, image pattern recognition, and computer vision is image segmentation. Segmentation is the process that subdivides an image into its constituent parts or objects based on features such as color, shade, pattern, etc. Adjacent regions differ concerning the same characteris-tics. One possibility to classify each pixel to the correct part of the image is to define the edges of the regions. The main edge detection techniques are presented in the publications to make image segmentation such as Sobel, Prewitt, Roberts, Canny, Expectation–Maxi-mization (EM) algorithm, Otsu, and Genetic algorithm. Implementation of segmentation and object recognition using the mentioned techniques are studied in Kokkinos and Mara-gos (2009), Zhang (1996), Nida and Musbah (2015). The Canny algorithm can be used in extracting the object’s contour clearly by using five steps: noise reduction, gradient calcula-tion, non-maximum suppression, double threshold, and edge tracking. Its final edge detec-tion step keeps only those edge pixel candidates whose gradient falls between a minimal and a maximal threshold level. The Otsu algorithm can calculate the high threshold value, which is significant to the Canny algorithm to detect the object edges. Based on the experi-mental result, the Otsu algorithm improves the quality of extracting the edge of the Canny algorithm and achieves the appropriate result finally.
This paper presents an attempt to trace and analyze high-speed video camera records to obtain useful information about the manner of cavitating jet behavior in space and in time. The aforementioned image processing techniques are used for quantifying cavitation structure, edge detection, and morphological analysis. The distribution characteristics and shape and area statistics of the cavitation are established. A simple MatLab image process-ing software is built and tested for this purpose. The created Matlab software allows us to analyze an unlimited number of images with high speed and quality, especially in search-ing for patterns that are not possible to be done by the human eye.
1.1 Test Rig Description and the Most Important Parameters
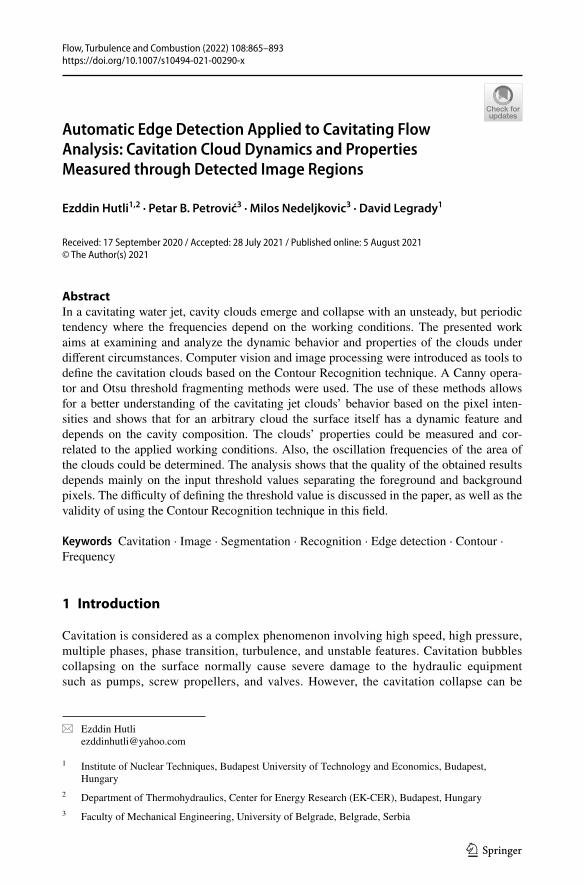
The schematic diagram of the cavitating jet generator, test chamber, and nozzle are shown in Fig. 1a–c, respectively. A plunger pump of 450 bar capacity was used to inject the fluid into the test chamber through the nozzle. The applied nozzle inlet diameters ( din ) were 1 and 0.45 mm and the outlet diameters ( dout ) were 0.45 and 1 mm for a convergent and divergent nozzle, respectively. The hydrodynamic and thermal parameters of the cavitating jet are the upstream pressure (injection pressure) P1 (0–450 bar), downstream pressure P2 (1—5.22 bar)
868 Flow, Turbulence and Combustion (2022) 108:865–893
1 3
which represents pressure inside the test chamber, the flow rate ( Q , m3/s), the exit-jet velocity ( Vj m/s), temperature sensors at different positions (inlet, outlet, and inside the test chamber), and the cavitation number ( � ). Both the flow rate and cavitation number are expressed as func-tions of P1 and P2 . To find the discharge coefficient ( K ) of different nozzle diameters, the flow rate of each nozzle was measured precisely. This coefficient was used to calculate the flow rate at given upstream and downstream pressures. Then the flow rate was used to calculate the exit jet velocity ( Vj ) which was subsequently used to calculate the cavitation number as in Eq. (1) ( Vj is under the assumption of one phase flow). The calculation was done automatically using Lab-View software which was used for controlling the cavitating jet machine and data acquisition. In addition, we measured the variation of the cavitation number at given upstream and downstream pressures at constant temperature and nozzle geometry to find the optimum operating point from the � & P1 curves for given hydrodynamic conditions. Table 1. presents the hydrodynamic and geometrical conditions.
(1)� =
P2 − Pv
0.5�V2
j
Fig. 1 Schematic diagram of a the cavitating jet generator (1- plunger pump, 2—filter, 3—regulating valve, 4—temperature sensor, 5—high-pressure transducer, 6—test chamber, 7—low-pressure transducer, 8—safety valve, 9—tank, 10—circulation pump, 11—heat exchanger, 12—energy dissipater, 13—pressure gauge, 14—flow indicator), b test chamber and accessories, and (c) nozzle geometry and inlet flow direc-tions
869Flow, Turbulence and Combustion (2022) 108:865–893
1 3
where Pv is the saturation vapor pressure at the working temperature, and � is the working fluid density. Both Pv and � are a function of the temperature, they are calculated automati-cally using the LabView.
1.2 Error Analysis of the Measured Quantities
The upstream pressure ( P1 ) and downstream pressure ( P2 ) were measured at the inlet and outlet of the test chamber, respectively. The manufacturer calibrated the pressure transduc-ers and accuracy certificates were issued for a maximum error of + 0.2/-0.21%FS. As the flow rate was determined using P1 and P2 values from previous nozzle calibration, its deter-mination uncertainty is also in the order of ± 0.3%FS.
2 Motivations and Methods
The unsteady behavior of rapid fracture and break-off of the cavitating jet, as well as the development and collapse of cavitation clouds on the impinging surface, are still points of the theoretical and experimental investigations to understand their mechanisms. If the unsteady behavior and the jet structure and dynamics are clarified in detail, expectedly, the jet working capacity may drastically be improved.
This work aims to find a model to describe the mechanisms of cavitation behavior in different stages, to discover relations among different parameters related to cavitation. To increase the efficiency of using the cavitation in different fields the control of the behavior and shedding/discharging of cavitation must properly be carried out. For this purpose, the visualization of a high-speed submerged cavitating jet using a high-speed camera has been done under different working conditions. The obtained fast movies were analyzed using computer image processing techniques.
The shape is considered as a powerful visual tool for recognizing objects in images, segmenting images into regions corresponding to individual objects, and for understand-ing the 3d structures of scenes. However, to achieve useful shape information, a reliable method is needed for detecting fragments of object boundaries, which is a difficult prob-lem in itself (Konrad and David 2008; Lei et al. 2008). Generally, the changes in image brightness are related to the events and the changes in the properties of the object in the image. In our case, the cavity cloud is representing the object in the image. In our primary analysis, it was found that the discontinuities which may appear in image brightness prob-ably are related to many factors such as irregularity in surface characteristics, changes in object properties from point to point (compositions of the cloud are not the same), and homogeneity of illumination. This interpretation which will later be presented in detail is
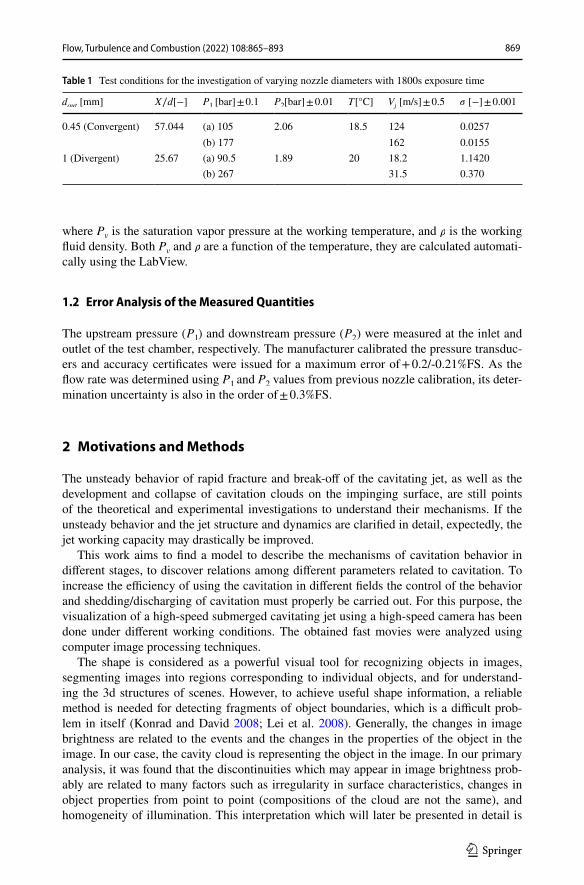
Table 1 Test conditions for the investigation of varying nozzle diameters with 1800s exposure time
870 Flow, Turbulence and Combustion (2022) 108:865–893
1 3
done based on the results in the publications (Barrow and Tenenbaum 1981; Nosrati et al. 2013). The analysis of the primary result of using the image processing technique to study the cavitation reveals that in some cases the edges extracted from images may be discon-nected because of the segmentation or by the discontinuities in image brightness as it has been mentioned earlier, i.e. the edge lines are not connected. Missing edge segments and false edges are not matching to the examined object in the image – thus complicating the subsequent task of interpreting the result, as it shown later. The obtained result is in good agreement with that in the publications (Lindeberg 1998; Sezgin and Sankur 2003). The combination of the expected benefits and difficulties of using this technique motivated us to do this work. In the Cloud Contour Recognition technique, the Canny edge detection operator was used; this operator was developed by John F. Canny in 1986 and uses a multi-stage algorithm to detect a wide range of edges in images.
Otsu’s method was used to automatically perform histogram shape-based image thresh-olding and to reduce the gray level image to a binary image. The algorithm assumes that the image to be thresholded contains two classes of pixels (e.g. foreground (cavity’s body) and background (rest of the frame)) then calculates the optimum threshold separating those two classes so that their combined spread (intra-class variance) is minimal (Otsu 1979).
2.1 Analysis and Processing of Cavitation Jet Video Recording
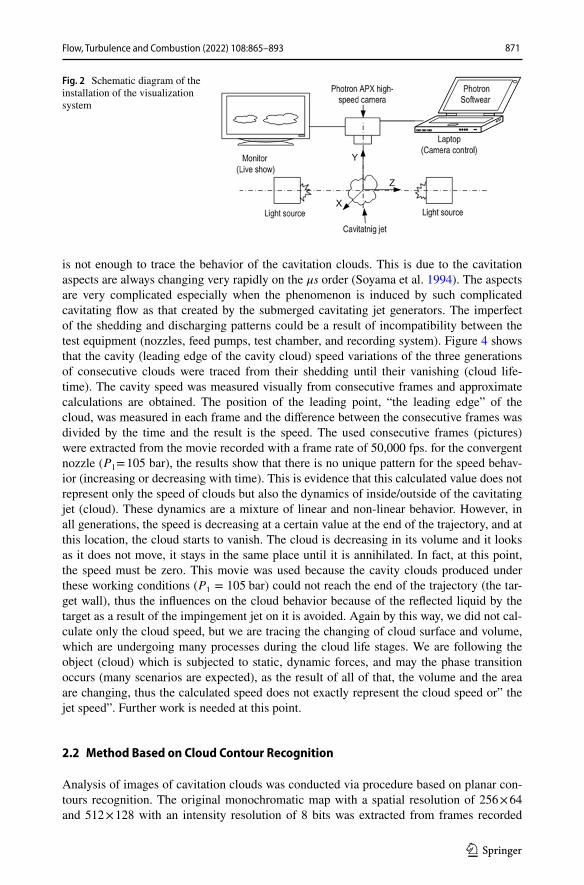
The images were extracted from the video recording that was captured with a Photron APX high-speed video camera that can capture a maximum frame number of 100,000 f/s. The degree of resolution is depending on the chosen frame rate, the resolution decreases by increase the frame rate (Photron Apx Camera). The fast camera system applied allows good performance visualization with very high frame rates. However, the photo resolution was the restriction factor for operating with the highest frame rates. As an example, Fig. 3 shows the result obtained by the visualization with the higher frame rate (50,000 f/s), but then the resolution had to be lowered to 256 × 64. Normally the visualization was recorded with lower frame rates (24,000 f/s) but with better resolution 512 × 128 (Figs. 7a, b and 8a, b).
Therefore the visualization was started with a high frame rate 50,000 f/s then decreased to 24000f/s to increase the resolution. To make the analysis the extracted images from recorded movies were saved as a series of images in JPEG format using the commercial software (Photron Fastcam Viewer PFV Version 2.1) provided by the camera manufacturer. The JPEG format was not introduced to improve the resolution of the images but to save the huge number of the extracted images from movies. The obtained images were subjected to the image processing algorithm described in the following paragraphs. The area of inter-est is started from the nozzle exit to the target (specimen) at the end of the jet trajectory. The distance between the nozzle exit and the target is 25.67 mm. This work aimed to study the behavior of cavitation clouds and to quantify the properties of the cloud shape and to correlate these properties with working conditions (geometrical and hydrodynamic condi-tions). These properties were calculated using pixel properties of the image as explained in the next section. Because of the information insufficiency on the change rate of images, the phenomena in the view of the high-speed movie are clearer compared to those of the still pictures.
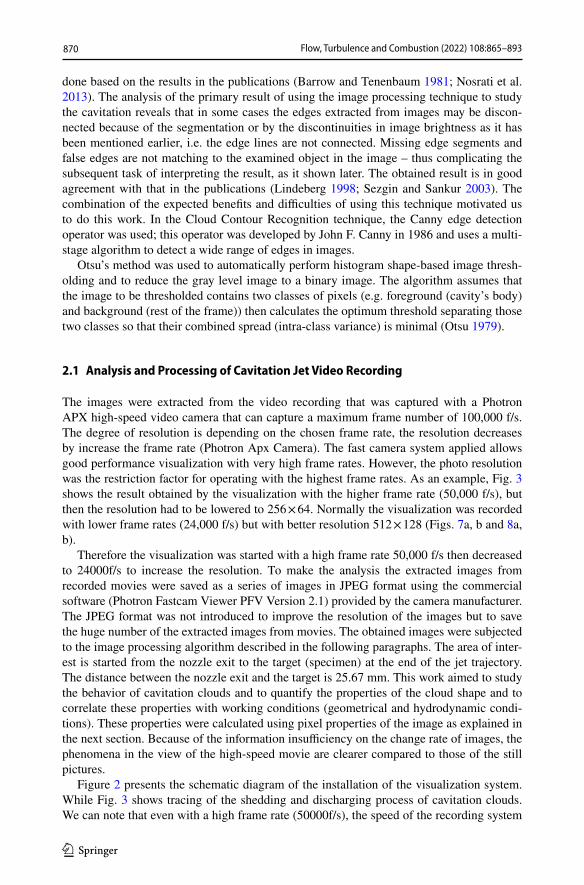
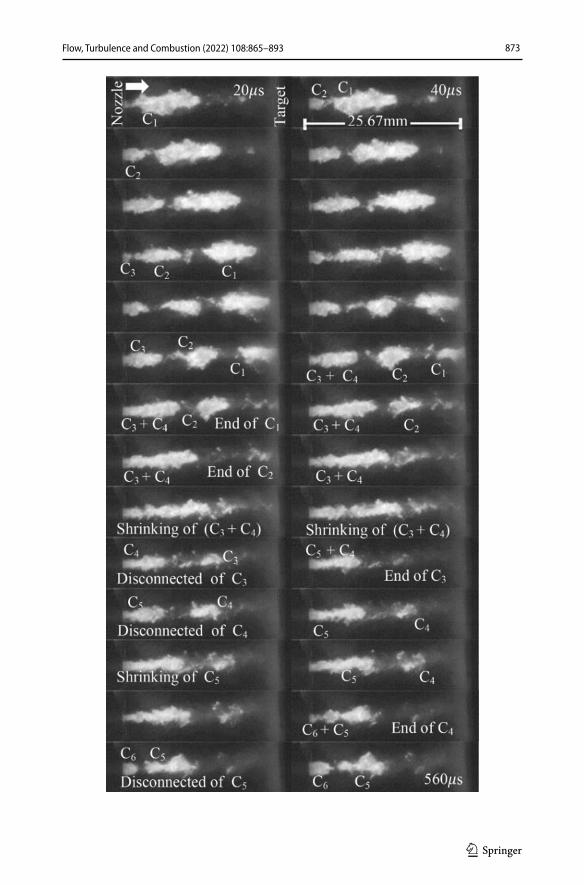
Figure 2 presents the schematic diagram of the installation of the visualization system. While Fig. 3 shows tracing of the shedding and discharging process of cavitation clouds. We can note that even with a high frame rate (50000f/s), the speed of the recording system
871Flow, Turbulence and Combustion (2022) 108:865–893
1 3
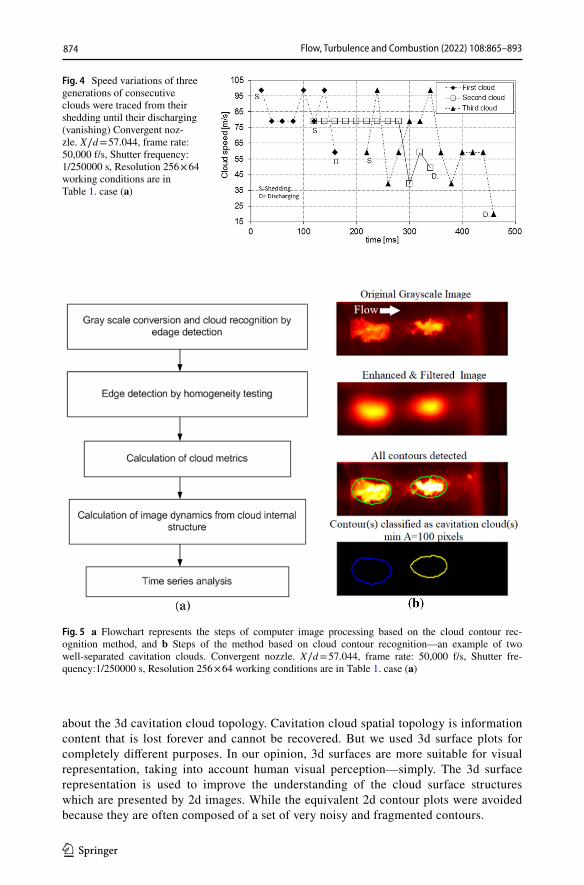
is not enough to trace the behavior of the cavitation clouds. This is due to the cavitation aspects are always changing very rapidly on the �s order (Soyama et al. 1994). The aspects are very complicated especially when the phenomenon is induced by such complicated cavitating flow as that created by the submerged cavitating jet generators. The imperfect of the shedding and discharging patterns could be a result of incompatibility between the test equipment (nozzles, feed pumps, test chamber, and recording system). Figure 4 shows that the cavity (leading edge of the cavity cloud) speed variations of the three generations of consecutive clouds were traced from their shedding until their vanishing (cloud life-time). The cavity speed was measured visually from consecutive frames and approximate calculations are obtained. The position of the leading point, “the leading edge” of the cloud, was measured in each frame and the difference between the consecutive frames was divided by the time and the result is the speed. The used consecutive frames (pictures) were extracted from the movie recorded with a frame rate of 50,000 fps. for the convergent nozzle ( P1 = 105 bar), the results show that there is no unique pattern for the speed behav-ior (increasing or decreasing with time). This is evidence that this calculated value does not represent only the speed of clouds but also the dynamics of inside/outside of the cavitating jet (cloud). These dynamics are a mixture of linear and non-linear behavior. However, in all generations, the speed is decreasing at a certain value at the end of the trajectory, and at this location, the cloud starts to vanish. The cloud is decreasing in its volume and it looks as it does not move, it stays in the same place until it is annihilated. In fact, at this point, the speed must be zero. This movie was used because the cavity clouds produced under these working conditions ( P1 = 105 bar) could not reach the end of the trajectory (the tar-get wall), thus the influences on the cloud behavior because of the reflected liquid by the target as a result of the impingement jet on it is avoided. Again by this way, we did not cal-culate only the cloud speed, but we are tracing the changing of cloud surface and volume, which are undergoing many processes during the cloud life stages. We are following the object (cloud) which is subjected to static, dynamic forces, and may the phase transition occurs (many scenarios are expected), as the result of all of that, the volume and the area are changing, thus the calculated speed does not exactly represent the cloud speed or” the jet speed”. Further work is needed at this point.
2.2 Method Based on Cloud Contour Recognition
Analysis of images of cavitation clouds was conducted via procedure based on planar con-tours recognition. The original monochromatic map with a spatial resolution of 256 × 64 and 512 × 128 with an intensity resolution of 8 bits was extracted from frames recorded
Fig. 2 Schematic diagram of the installation of the visualization system
872 Flow, Turbulence and Combustion (2022) 108:865–893
1 3
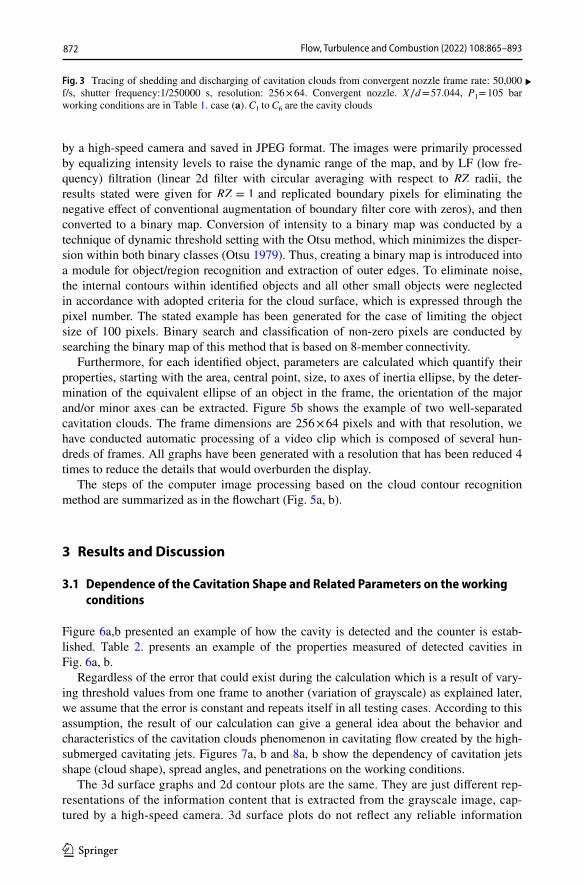
by a high-speed camera and saved in JPEG format. The images were primarily processed by equalizing intensity levels to raise the dynamic range of the map, and by LF (low fre-quency) filtration (linear 2d filter with circular averaging with respect to RZ radii, the results stated were given for RZ = 1 and replicated boundary pixels for eliminating the negative effect of conventional augmentation of boundary filter core with zeros), and then converted to a binary map. Conversion of intensity to a binary map was conducted by a technique of dynamic threshold setting with the Otsu method, which minimizes the disper-sion within both binary classes (Otsu 1979). Thus, creating a binary map is introduced into a module for object/region recognition and extraction of outer edges. To eliminate noise, the internal contours within identified objects and all other small objects were neglected in accordance with adopted criteria for the cloud surface, which is expressed through the pixel number. The stated example has been generated for the case of limiting the object size of 100 pixels. Binary search and classification of non-zero pixels are conducted by searching the binary map of this method that is based on 8-member connectivity.
Furthermore, for each identified object, parameters are calculated which quantify their properties, starting with the area, central point, size, to axes of inertia ellipse, by the deter-mination of the equivalent ellipse of an object in the frame, the orientation of the major and/or minor axes can be extracted. Figure 5b shows the example of two well-separated cavitation clouds. The frame dimensions are 256 × 64 pixels and with that resolution, we have conducted automatic processing of a video clip which is composed of several hun-dreds of frames. All graphs have been generated with a resolution that has been reduced 4 times to reduce the details that would overburden the display.
The steps of the computer image processing based on the cloud contour recognition method are summarized as in the flowchart (Fig. 5a, b).
3 Results and Discussion
3.1 Dependence of the Cavitation Shape and Related Parameters on the working conditions
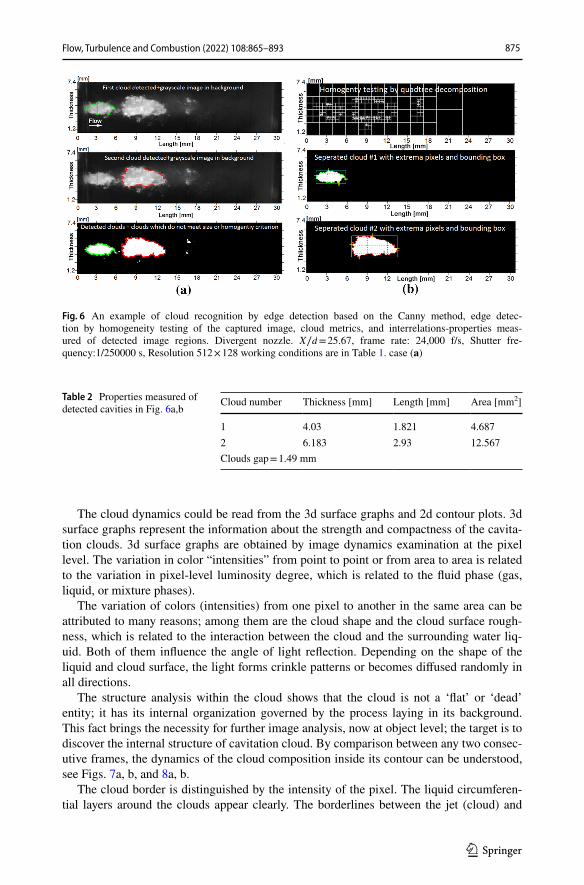
Figure 6a,b presented an example of how the cavity is detected and the counter is estab-lished. Table 2. presents an example of the properties measured of detected cavities in Fig. 6a, b.
Regardless of the error that could exist during the calculation which is a result of vary-ing threshold values from one frame to another (variation of grayscale) as explained later, we assume that the error is constant and repeats itself in all testing cases. According to this assumption, the result of our calculation can give a general idea about the behavior and characteristics of the cavitation clouds phenomenon in cavitating flow created by the high-submerged cavitating jets. Figures 7a, b and 8a, b show the dependency of cavitation jets shape (cloud shape), spread angles, and penetrations on the working conditions.
The 3d surface graphs and 2d contour plots are the same. They are just different rep-resentations of the information content that is extracted from the grayscale image, cap-tured by a high-speed camera. 3d surface plots do not reflect any reliable information
Fig. 3 Tracing of shedding and discharging of cavitation clouds from convergent nozzle frame rate: 50,000 f/s, shutter frequency:1/250000 s, resolution: 256 × 64. Convergent nozzle. X∕d = 57.044, P1 = 105 bar working conditions are in Table 1. case (a). C1 to C6 are the cavity clouds
▸
873Flow, Turbulence and Combustion (2022) 108:865–893
1 3
874 Flow, Turbulence and Combustion (2022) 108:865–893
1 3
about the 3d cavitation cloud topology. Cavitation cloud spatial topology is information content that is lost forever and cannot be recovered. But we used 3d surface plots for completely different purposes. In our opinion, 3d surfaces are more suitable for visual representation, taking into account human visual perception—simply. The 3d surface representation is used to improve the understanding of the cloud surface structures which are presented by 2d images. While the equivalent 2d contour plots were avoided because they are often composed of a set of very noisy and fragmented contours.
Fig. 4 Speed variations of three generations of consecutive clouds were traced from their shedding until their discharging (vanishing) Convergent noz-zle. X∕d = 57.044, frame rate: 50,000 f/s, Shutter frequency: 1/250000 s, Resolution 256 × 64 working conditions are in Table 1. case (a)
Fig. 5 a Flowchart represents the steps of computer image processing based on the cloud contour rec-ognition method, and b Steps of the method based on cloud contour recognition—an example of two well-separated cavitation clouds. Convergent nozzle. X∕d = 57.044, frame rate: 50,000 f/s, Shutter fre-quency:1/250000 s, Resolution 256 × 64 working conditions are in Table 1. case (a)
875Flow, Turbulence and Combustion (2022) 108:865–893
1 3
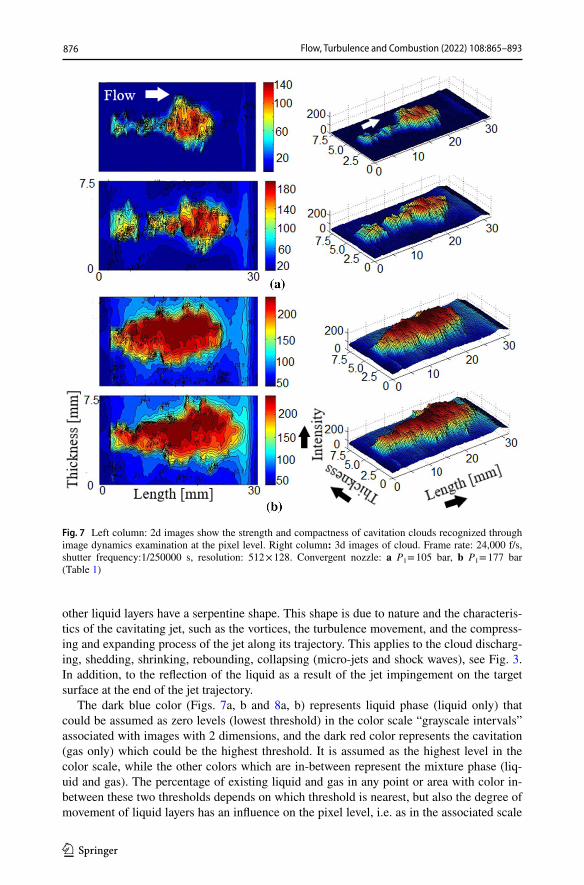
The cloud dynamics could be read from the 3d surface graphs and 2d contour plots. 3d surface graphs represent the information about the strength and compactness of the cavita-tion clouds. 3d surface graphs are obtained by image dynamics examination at the pixel level. The variation in color “intensities” from point to point or from area to area is related to the variation in pixel-level luminosity degree, which is related to the fluid phase (gas, liquid, or mixture phases).
The variation of colors (intensities) from one pixel to another in the same area can be attributed to many reasons; among them are the cloud shape and the cloud surface rough-ness, which is related to the interaction between the cloud and the surrounding water liq-uid. Both of them influence the angle of light reflection. Depending on the shape of the liquid and cloud surface, the light forms crinkle patterns or becomes diffused randomly in all directions.
The structure analysis within the cloud shows that the cloud is not a ‘flat’ or ‘dead’ entity; it has its internal organization governed by the process laying in its background. This fact brings the necessity for further image analysis, now at object level; the target is to discover the internal structure of cavitation cloud. By comparison between any two consec-utive frames, the dynamics of the cloud composition inside its contour can be understood, see Figs. 7a, b, and 8a, b.
The cloud border is distinguished by the intensity of the pixel. The liquid circumferen-tial layers around the clouds appear clearly. The borderlines between the jet (cloud) and
Fig. 6 An example of cloud recognition by edge detection based on the Canny method, edge detec-tion by homogeneity testing of the captured image, cloud metrics, and interrelations-properties meas-ured of detected image regions. Divergent nozzle. X∕d = 25.67, frame rate: 24,000 f/s, Shutter fre-quency:1/250000 s, Resolution 512 × 128 working conditions are in Table 1. case (a)
Table 2 Properties measured of detected cavities in Fig. 6a,b
Cloud number Thickness [mm] Length [mm] Area [mm2]
1 4.03 1.821 4.6872 6.183 2.93 12.567Clouds gap = 1.49 mm
876 Flow, Turbulence and Combustion (2022) 108:865–893
1 3
other liquid layers have a serpentine shape. This shape is due to nature and the characteris-tics of the cavitating jet, such as the vortices, the turbulence movement, and the compress-ing and expanding process of the jet along its trajectory. This applies to the cloud discharg-ing, shedding, shrinking, rebounding, collapsing (micro-jets and shock waves), see Fig. 3. In addition, to the reflection of the liquid as a result of the jet impingement on the target surface at the end of the jet trajectory.
The dark blue color (Figs. 7a, b and 8a, b) represents liquid phase (liquid only) that could be assumed as zero levels (lowest threshold) in the color scale “grayscale intervals” associated with images with 2 dimensions, and the dark red color represents the cavitation (gas only) which could be the highest threshold. It is assumed as the highest level in the color scale, while the other colors which are in-between represent the mixture phase (liq-uid and gas). The percentage of existing liquid and gas in any point or area with color in-between these two thresholds depends on which threshold is nearest, but also the degree of movement of liquid layers has an influence on the pixel level, i.e. as in the associated scale
Fig. 7 Left column: 2d images show the strength and compactness of cavitation clouds recognized through image dynamics examination at the pixel level. Right column: 3d images of cloud. Frame rate: 24,000 f/s, shutter frequency:1/250000 s, resolution: 512 × 128. Convergent nozzle: a P1 = 105 bar, b P1 = 177 bar (Table 1)
877Flow, Turbulence and Combustion (2022) 108:865–893
1 3
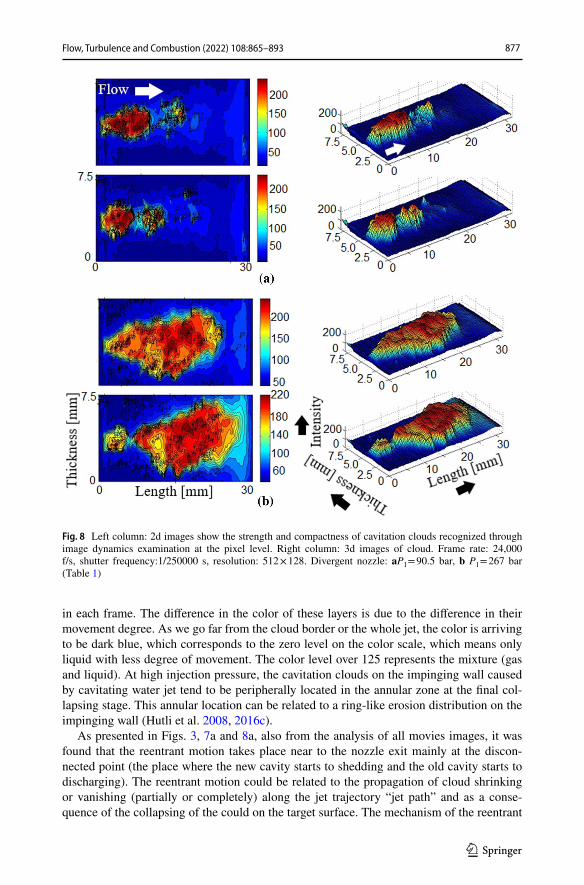
in each frame. The difference in the color of these layers is due to the difference in their movement degree. As we go far from the cloud border or the whole jet, the color is arriving to be dark blue, which corresponds to the zero level on the color scale, which means only liquid with less degree of movement. The color level over 125 represents the mixture (gas and liquid). At high injection pressure, the cavitation clouds on the impinging wall caused by cavitating water jet tend to be peripherally located in the annular zone at the final col-lapsing stage. This annular location can be related to a ring-like erosion distribution on the impinging wall (Hutli et al. 2008, 2016c).
As presented in Figs. 3, 7a and 8a, also from the analysis of all movies images, it was found that the reentrant motion takes place near to the nozzle exit mainly at the discon-nected point (the place where the new cavity starts to shedding and the old cavity starts to discharging). The reentrant motion could be related to the propagation of cloud shrinking or vanishing (partially or completely) along the jet trajectory “jet path” and as a conse-quence of the collapsing of the could on the target surface. The mechanism of the reentrant
Fig. 8 Left column: 2d images show the strength and compactness of cavitation clouds recognized through image dynamics examination at the pixel level. Right column: 3d images of cloud. Frame rate: 24,000 f/s, shutter frequency:1/250000 s, resolution: 512 × 128. Divergent nozzle: aP1 = 90.5 bar, b P1 = 267 bar (Table 1)
878 Flow, Turbulence and Combustion (2022) 108:865–893
1 3
motion in the case of cavitating jets is not the same as in the case of cavitation sheet on the hydrofoils (cavitating flow on hydrofoils or plates).
3.2 Cloud Cavitation Dynamics and Properties Measured of Detected Image Regions
In the frames, the exit of the nozzle was chosen as the original point of the starting cavita-tion, therefore the direction of the nozzle center axis is the x-axis and the directions normal to is assumed as y or z-axis along the impinging target surface. The region where the gray level changes rapidly in the frame means that the cavitation cloud rapidly disappears or appears.
The appearance and disappearance region of the cloud are expressed as a white lumi-nescence and a dark blue, respectively (Figs. 7a,b and 8a,b). Through this process of image analysis, it is possible to quantitatively estimate the high-speed phenomena such as the rapid and consecutive collapse of cavitation clouds. The white-colored portion corresponds to a zone of cavitating jet issued from the nozzle exit located at the left side of the picture frame, and sometimes the nozzle holder part also appears to be partly white because of the light reflection. The picture near the right edge region appears obscure because the jet is spread over an impinging target.
Figure 5b shows the steps done on the images before the properties are measured and after the statistical analysis is done. The image is converted to grayscale as mentioned ear-lier, then the image is enhanced and filtered, and in the last step, the contours are detected according to the threshold value which varies from zero to one (this could be the main source of error). In the end, the contours are classified as cavitation clouds. Any object area with less than 100 pixels is not counted as a cavitation event.
As we can see, the contours are taken only for the concrete solid cavitation, while the fogs that also appear are not counted or not considered. The boundary lines between the clouds and the rest are not easy to define.
Looking at Fig. 5b, one can notice that, there is a region or area along the jet trajec-tory where the gray level changes rapidly which means that the cavitation cloud rapidly disappears or appears. The appearance region of the cloud is expressed as a luminescent white and the disappearance “vanish” region is foggy (Fig. 3). Figures 7b and 8b repre-sent the surface structure and the 3d competence structure “reconstruction” of the cavita-tion clouds, the dependency of the cavitation cloud dynamics on the working conditions is clear. The cavitation dynamics include the dynamic of the cloud “object” with itself (vari-ation of the composition with time “own dynamic”) and the dynamic of a moving cloud “object” (acceleration and de-acceleration etc.).
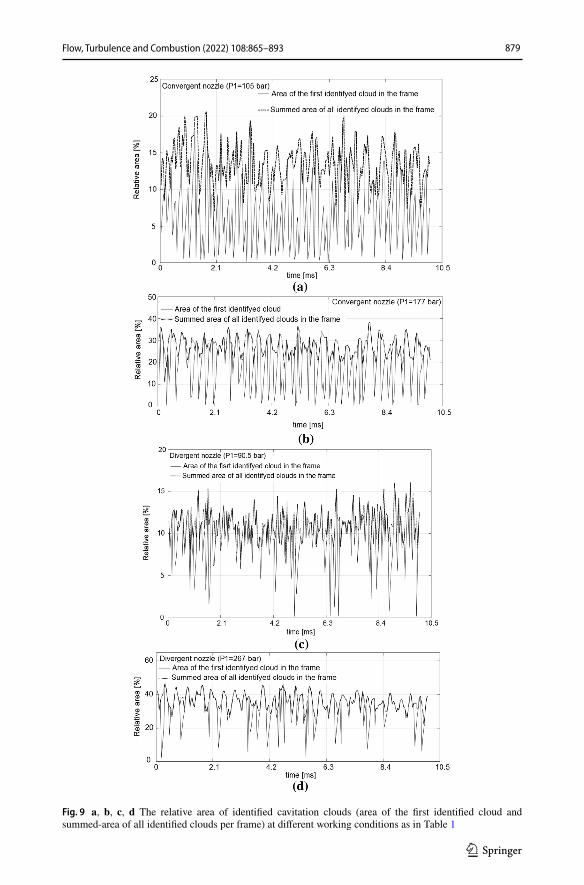
Figure 9 shows the relative area of identified cavitation clouds meaning the ratio of the area of the first identified cloud in the frame and the summed area of all identified clouds per frame. As we can see, the summed area is bigger than the first cloud and this means that the jet can appear as one big cloud or as many separated clouds. This phenomenon is clearer in the case of high injection pressure (P1). Regardless of the nozzle shape being convergent or divergent, the cloud area can also be used as a good indicator for the jet pen-etration and its spreading angle. The fluctuation of both cloud areas (first and summed) is a good indicator of the periodical behavior of shedding / discharging clouds, and also, the jet fluctuations or oscillations are periodical processes. As it may also be seen, the produced clouds are different in terms of shape and area; therefore, they are also different in their energy content.
879Flow, Turbulence and Combustion (2022) 108:865–893
1 3
Fig. 9 a, b, c, d The relative area of identified cavitation clouds (area of the first identified cloud and summed-area of all identified clouds per frame) at different working conditions as in Table 1
880 Flow, Turbulence and Combustion (2022) 108:865–893
1 3
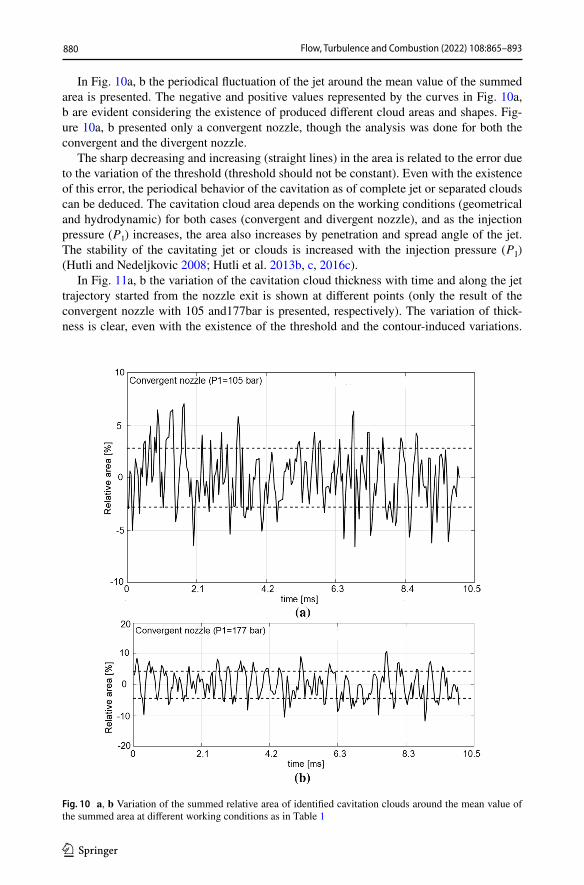
In Fig. 10a, b the periodical fluctuation of the jet around the mean value of the summed area is presented. The negative and positive values represented by the curves in Fig. 10a, b are evident considering the existence of produced different cloud areas and shapes. Fig-ure 10a, b presented only a convergent nozzle, though the analysis was done for both the convergent and the divergent nozzle.
The sharp decreasing and increasing (straight lines) in the area is related to the error due to the variation of the threshold (threshold should not be constant). Even with the existence of this error, the periodical behavior of the cavitation as of complete jet or separated clouds can be deduced. The cavitation cloud area depends on the working conditions (geometrical and hydrodynamic) for both cases (convergent and divergent nozzle), and as the injection pressure ( P1 ) increases, the area also increases by penetration and spread angle of the jet. The stability of the cavitating jet or clouds is increased with the injection pressure ( P1 ) (Hutli and Nedeljkovic 2008; Hutli et al. 2013b, c, 2016c).
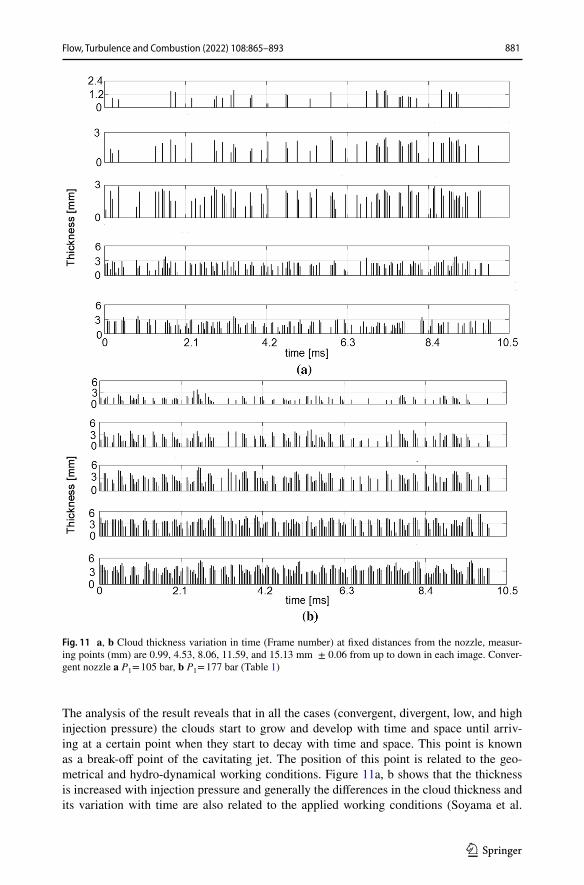
In Fig. 11a, b the variation of the cavitation cloud thickness with time and along the jet trajectory started from the nozzle exit is shown at different points (only the result of the convergent nozzle with 105 and177bar is presented, respectively). The variation of thick-ness is clear, even with the existence of the threshold and the contour-induced variations.
Fig. 10 a, b Variation of the summed relative area of identified cavitation clouds around the mean value of the summed area at different working conditions as in Table 1
881Flow, Turbulence and Combustion (2022) 108:865–893
1 3
The analysis of the result reveals that in all the cases (convergent, divergent, low, and high injection pressure) the clouds start to grow and develop with time and space until arriv-ing at a certain point when they start to decay with time and space. This point is known as a break-off point of the cavitating jet. The position of this point is related to the geo-metrical and hydro-dynamical working conditions. Figure 11a, b shows that the thickness is increased with injection pressure and generally the differences in the cloud thickness and its variation with time are also related to the applied working conditions (Soyama et al.
Fig. 11 a, b Cloud thickness variation in time (Frame number) at fixed distances from the nozzle, measur-ing points (mm) are 0.99, 4.53, 8.06, 11.59, and 15.13 mm ± 0.06 from up to down in each image. Conver-gent nozzle a P1 = 105 bar, b P1 = 177 bar (Table 1)
882 Flow, Turbulence and Combustion (2022) 108:865–893
1 3
1994, 1993; Hutli and Nedeljkovic 2008; Hutli et al. 2013b, c). Also under the assumption of symmetry existence, the cloud thickness variation of the jet clouds in respect to the hori-zontal axis could be established but to due to the size of the paper only the results related to the vertical axis are presented.
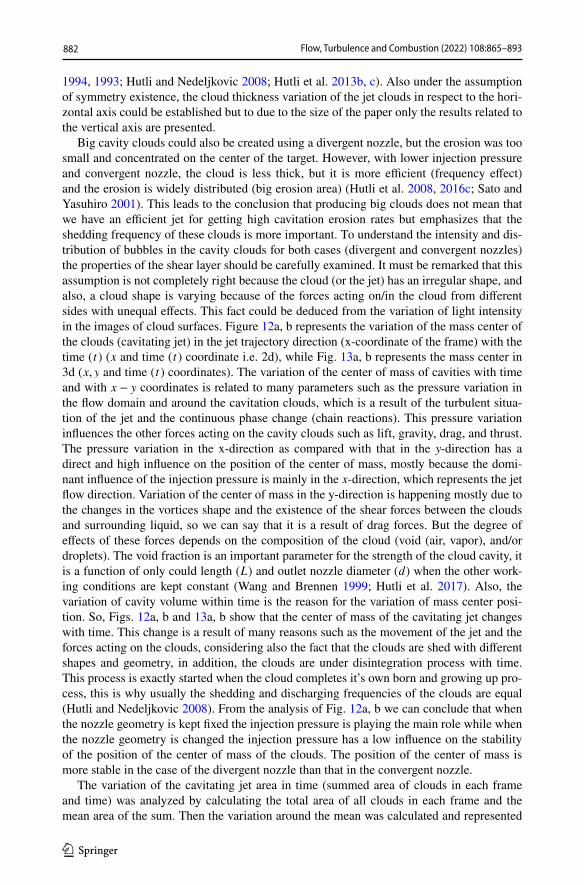
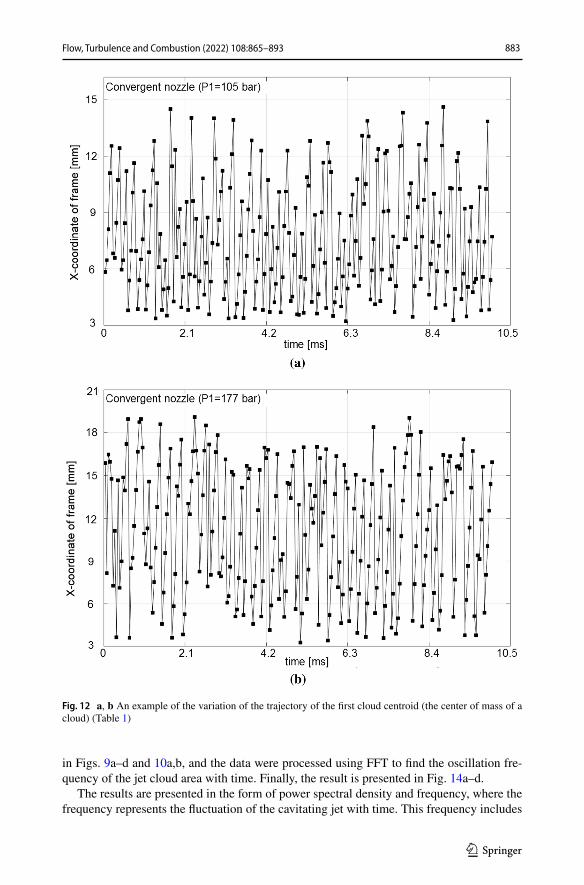
Big cavity clouds could also be created using a divergent nozzle, but the erosion was too small and concentrated on the center of the target. However, with lower injection pressure and convergent nozzle, the cloud is less thick, but it is more efficient (frequency effect) and the erosion is widely distributed (big erosion area) (Hutli et al. 2008, 2016c; Sato and Yasuhiro 2001). This leads to the conclusion that producing big clouds does not mean that we have an efficient jet for getting high cavitation erosion rates but emphasizes that the shedding frequency of these clouds is more important. To understand the intensity and dis-tribution of bubbles in the cavity clouds for both cases (divergent and convergent nozzles) the properties of the shear layer should be carefully examined. It must be remarked that this assumption is not completely right because the cloud (or the jet) has an irregular shape, and also, a cloud shape is varying because of the forces acting on/in the cloud from different sides with unequal effects. This fact could be deduced from the variation of light intensity in the images of cloud surfaces. Figure 12a, b represents the variation of the mass center of the clouds (cavitating jet) in the jet trajectory direction (x-coordinate of the frame) with the time ( t ) ( x and time ( t ) coordinate i.e. 2d), while Fig. 13a, b represents the mass center in 3d ( x, y and time ( t ) coordinates). The variation of the center of mass of cavities with time and with x − y coordinates is related to many parameters such as the pressure variation in the flow domain and around the cavitation clouds, which is a result of the turbulent situa-tion of the jet and the continuous phase change (chain reactions). This pressure variation influences the other forces acting on the cavity clouds such as lift, gravity, drag, and thrust. The pressure variation in the x-direction as compared with that in the y-direction has a direct and high influence on the position of the center of mass, mostly because the domi-nant influence of the injection pressure is mainly in the x-direction, which represents the jet flow direction. Variation of the center of mass in the y-direction is happening mostly due to the changes in the vortices shape and the existence of the shear forces between the clouds and surrounding liquid, so we can say that it is a result of drag forces. But the degree of effects of these forces depends on the composition of the cloud (void (air, vapor), and/or droplets). The void fraction is an important parameter for the strength of the cloud cavity, it is a function of only could length ( L ) and outlet nozzle diameter ( d ) when the other work-ing conditions are kept constant (Wang and Brennen 1999; Hutli et al. 2017). Also, the variation of cavity volume within time is the reason for the variation of mass center posi-tion. So, Figs. 12a, b and 13a, b show that the center of mass of the cavitating jet changes with time. This change is a result of many reasons such as the movement of the jet and the forces acting on the clouds, considering also the fact that the clouds are shed with different shapes and geometry, in addition, the clouds are under disintegration process with time. This process is exactly started when the cloud completes it’s own born and growing up pro-cess, this is why usually the shedding and discharging frequencies of the clouds are equal (Hutli and Nedeljkovic 2008). From the analysis of Fig. 12a, b we can conclude that when the nozzle geometry is kept fixed the injection pressure is playing the main role while when the nozzle geometry is changed the injection pressure has a low influence on the stability of the position of the center of mass of the clouds. The position of the center of mass is more stable in the case of the divergent nozzle than that in the convergent nozzle.
The variation of the cavitating jet area in time (summed area of clouds in each frame and time) was analyzed by calculating the total area of all clouds in each frame and the mean area of the sum. Then the variation around the mean was calculated and represented
883Flow, Turbulence and Combustion (2022) 108:865–893
1 3
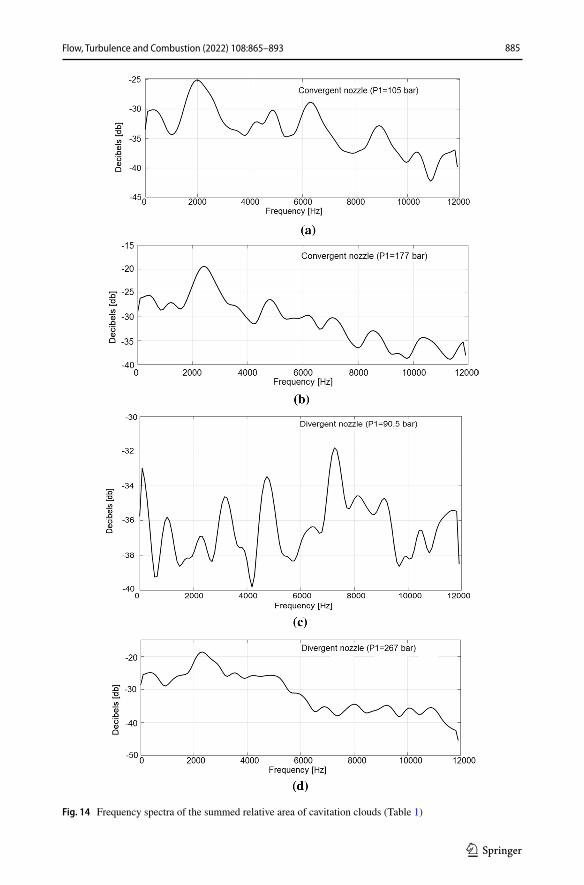
in Figs. 9a–d and 10a,b, and the data were processed using FFT to find the oscillation fre-quency of the jet cloud area with time. Finally, the result is presented in Fig. 14a–d.
The results are presented in the form of power spectral density and frequency, where the frequency represents the fluctuation of the cavitating jet with time. This frequency includes
Fig. 12 a, b An example of the variation of the trajectory of the first cloud centroid (the center of mass of a cloud) (Table 1)
884 Flow, Turbulence and Combustion (2022) 108:865–893
1 3
many frequencies such as shedding, discharging, the natural oscillation of clouds (natu-ral oscillation process of individual bubbles), pressure oscillation in the test chamber, and injection pressure fluctuation (pump frequency). We have a peak that is rather reproduc-ible around 2 kHz for three of the four investigated cases (convergent nozzle with P1 = 105 and 177 bar, divergent nozzle with P1 = 267 bar) and we have the first peak around 1 kHz ( divergent nozzle with P1 = 90.5 bar) which is much bigger than the pump frequency (23.66 Hz). The power spectral density function (PSD) is used to represent the strength of the variations (energy or power) as a function of frequency. In other words, it shows at which frequencies the variations are strong and at which frequencies the variations are weak. The unit of PSD is energy or power per frequency (width) and one can obtain energy within a specific frequency range by integrating PSD within that frequency range. Compu-tation of PSD is done here directly by the FFT method and it can be done by computing the autocorrelation function and then by its transformation.
In Fig. 14a–d the existence of many frequencies at low injection pressure ( P1 ) (low exit-jet velocity ( Vj )) can be attributed to the weakening of vortex formation and the increase of 3d disturbance on the separated shear layer (instability of vortex). This leads to the produc-tion of unstable cavitation clouds with different dimensions (Hutli et al. 2017; Sato and Yasuhiro 2001). The comparison between convergent and divergent cases at low injection pressure reveals that the cavitating jet produced using a convergent nozzle is more stable
Fig. 13 a, b An example for the variation of the trajectory of the first cloud centroid (center of mass of cloud) in three dimensions ( x − y coordinates of the frame and time ( t ) or frame number)) (Table 1)
885Flow, Turbulence and Combustion (2022) 108:865–893
1 3
Fig. 14 Frequency spectra of the summed relative area of cavitation clouds (Table 1)
886 Flow, Turbulence and Combustion (2022) 108:865–893
1 3
than that using a divergent nozzle. This can be related to a shorter length of the cavitating area in the case of a divergent nozzle, which means that the small cavitating area cannot persist under the influence of forces acting on it. The cavitation area is not stable with time and it depends on the working conditions. The variation of the area is also related to many other factors such as forces acting on the clouds, the percentage of the vapor in the cloud (void fraction), and the bubble oscillation and interactions inside the clouds (Hutli and Nedeljkovic 2008; Hutli et al. 2017; Sato and Yasuhiro 2001). The obtained results are to be trusted and they represent a very detailed picture of the phenomenon and more research has to be done to get the complete picture of it.
At high injection pressure in the two cases (divergent and convergent nozzle), the vari-ation of the area has one or two dominant frequencies. Also, at a high injection pressure, the stability of the cavitating jet produced by using a convergent nozzle is more stable as compared with that using the divergent nozzle. In general, we can say that the jet is more stable at high injection pressure (Hutli and Nedeljkovic 2008).
3.3 Up‑and Downstream Pressure Fluctuation and Cavity Behavior
The behavior of the cavitation clouds depends on the up-and downstream pressure ( P1 , and P2 respectively), the nozzle geometry, liquid properties, and working temperature. Water flows from the left to the right side from the nozzle exit. Figures 7a,b and 8a,b show an image analysis result and indicate the change of the cloud region, the growing and shrink-ing motion of the whole cloud region (see Fig. 3). In the macro-level analysis, based on the processed photos as in Figs. 7a, b and 8a, b generally, we can say that for both divergent and convergent nozzle geometry, the cavity length and Thickness grow longer when the upstream pressure becomes higher, that is, exit jet velocity increases higher, while for the downstream pressure it is vice versa. In a micro-level analysis based on the results obtained with the computer image processing technique where the pressure fluctuation is consid-ered, we can say that the change in cavity length and Thickness are affected by upstream pressure fluctuation. The frequency of upstream pressure fluctuation is almost in conso-nance with the rotational speed of the used plunger pump (1420 rpm (23.66 Hz). Thus, the upstream pressure fluctuation caused by the pulsation of the plunger pump will affect the periodic behavior of cavity length and Thickness i.e. shape and geometry. Therefore, one of the main factors of the periodic tendency in cavity length and Thickness is considered to be the upstream pressure fluctuation (upstream pressure fluctuation accompanied by veloc-ity fluctuation) and the downstream pressure and fluid temperature effect (Hutli and Ned-eljkovic 2008; Hutli et al. 2008, 2016c, 2017; Sato and Yasuhiro 2001).
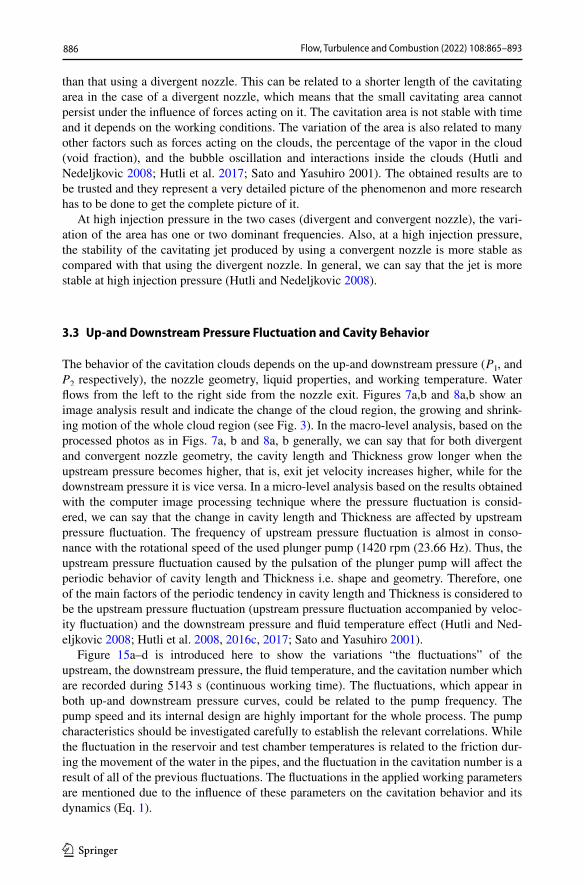
Figure 15a–d is introduced here to show the variations “the fluctuations” of the upstream, the downstream pressure, the fluid temperature, and the cavitation number which are recorded during 5143 s (continuous working time). The fluctuations, which appear in both up-and downstream pressure curves, could be related to the pump frequency. The pump speed and its internal design are highly important for the whole process. The pump characteristics should be investigated carefully to establish the relevant correlations. While the fluctuation in the reservoir and test chamber temperatures is related to the friction dur-ing the movement of the water in the pipes, and the fluctuation in the cavitation number is a result of all of the previous fluctuations. The fluctuations in the applied working parameters are mentioned due to the influence of these parameters on the cavitation behavior and its dynamics (Eq. 1).
887Flow, Turbulence and Combustion (2022) 108:865–893
1 3
Even the time of the visualization process is small but still, the fluctuations of the main parameters should be considered. Figure 15a–d showed the difficulty to control the oper-ating parameters of the complicated dynamic system such as the cavitating jet generator. The fluctuations of the applied parameters should be considered mainly when the system is used for a long working period, for example, cavitation erosion testing, materials testing, etc.
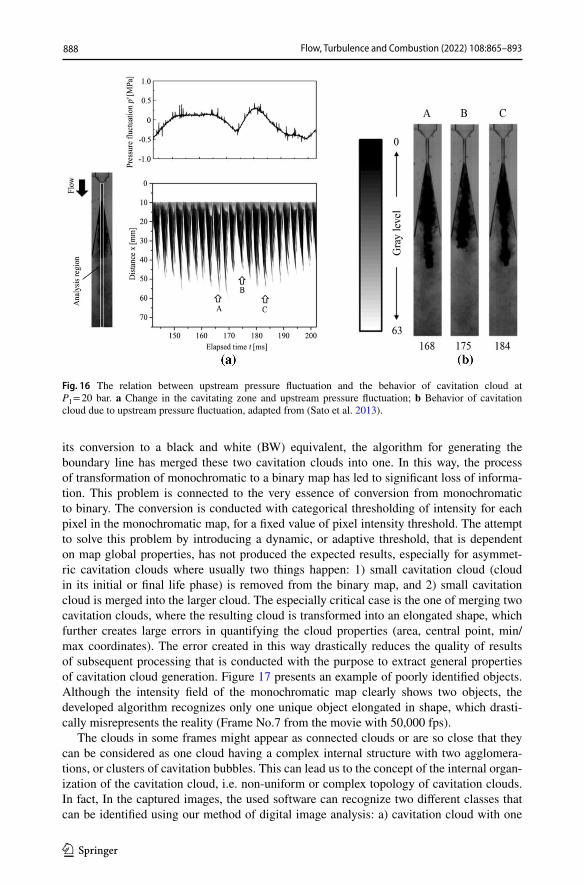
Sato et al. (2013) have investigated precisely the behavior of the cavity (cavitation clouds) under pressure fluctuation at certain applied upstream pressure. Figure 16a,b is presented here to show the dependence of the cavitation cloud behavior on the upstream pressure fluctuation at certain working pressure (P1 = 20 bar). Even there is a clear dif-ference in the dimensions and geometries between their nozzles and our nozzles, but the general behavior of the obtained cavitation clouds (regardless of the geometries and the dimensions of the used nozzles) should be similar. Because we are interested in the behav-ior of clouds after the shedding process, therefore, the earlier mentioned parameters ( P1 , and P2 ) assumed to be the main parameters that influence the cloud behavior because those parameters are essential parameters for calculating the cavitation number ( � ) as in Eq. 1. � is a number used as an indicator to indicate qualitatively (Existence) and quantitatively (intensity) the cavitation phenomenon (Hutli et al. 2020).
3.4 The Validity of the Method
The key problem of this method is setting the threshold for transforming the mono-chromatic to a binary map. To illustrate this, an example of two poorly separated cavi-tation clouds with asymmetric size is further discussed. After frame preprocessing and
Fig. 15 Variation of parameters a the upstream pressure, b the downstream pressure, c fluid temperature in the test chamber and the reservoir, and d cavitation number, respectively, recorded for 5143 s continuous working time
888 Flow, Turbulence and Combustion (2022) 108:865–893
1 3
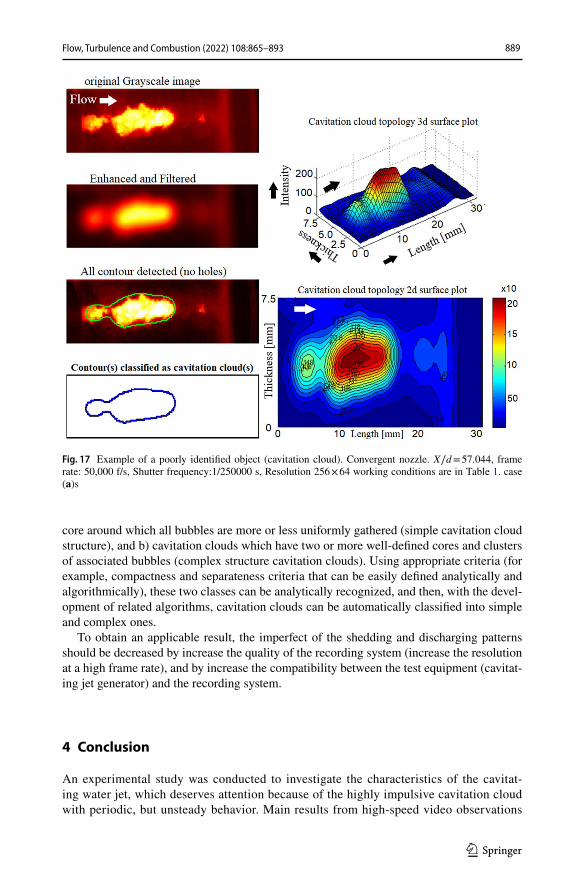
its conversion to a black and white (BW) equivalent, the algorithm for generating the boundary line has merged these two cavitation clouds into one. In this way, the process of transformation of monochromatic to a binary map has led to significant loss of informa-tion. This problem is connected to the very essence of conversion from monochromatic to binary. The conversion is conducted with categorical thresholding of intensity for each pixel in the monochromatic map, for a fixed value of pixel intensity threshold. The attempt to solve this problem by introducing a dynamic, or adaptive threshold, that is dependent on map global properties, has not produced the expected results, especially for asymmet-ric cavitation clouds where usually two things happen: 1) small cavitation cloud (cloud in its initial or final life phase) is removed from the binary map, and 2) small cavitation cloud is merged into the larger cloud. The especially critical case is the one of merging two cavitation clouds, where the resulting cloud is transformed into an elongated shape, which further creates large errors in quantifying the cloud properties (area, central point, min/max coordinates). The error created in this way drastically reduces the quality of results of subsequent processing that is conducted with the purpose to extract general properties of cavitation cloud generation. Figure 17 presents an example of poorly identified objects. Although the intensity field of the monochromatic map clearly shows two objects, the developed algorithm recognizes only one unique object elongated in shape, which drasti-cally misrepresents the reality (Frame No.7 from the movie with 50,000 fps).
The clouds in some frames might appear as connected clouds or are so close that they can be considered as one cloud having a complex internal structure with two agglomera-tions, or clusters of cavitation bubbles. This can lead us to the concept of the internal organ-ization of the cavitation cloud, i.e. non-uniform or complex topology of cavitation clouds. In fact, In the captured images, the used software can recognize two different classes that can be identified using our method of digital image analysis: a) cavitation cloud with one
Fig. 16 The relation between upstream pressure fluctuation and the behavior of cavitation cloud at P1 = 20 bar. a Change in the cavitating zone and upstream pressure fluctuation; b Behavior of cavitation cloud due to upstream pressure fluctuation, adapted from (Sato et al. 2013).
889Flow, Turbulence and Combustion (2022) 108:865–893
1 3
core around which all bubbles are more or less uniformly gathered (simple cavitation cloud structure), and b) cavitation clouds which have two or more well-defined cores and clusters of associated bubbles (complex structure cavitation clouds). Using appropriate criteria (for example, compactness and separateness criteria that can be easily defined analytically and algorithmically), these two classes can be analytically recognized, and then, with the devel-opment of related algorithms, cavitation clouds can be automatically classified into simple and complex ones.
To obtain an applicable result, the imperfect of the shedding and discharging patterns should be decreased by increase the quality of the recording system (increase the resolution at a high frame rate), and by increase the compatibility between the test equipment (cavitat-ing jet generator) and the recording system.
4 Conclusion
An experimental study was conducted to investigate the characteristics of the cavitat-ing water jet, which deserves attention because of the highly impulsive cavitation cloud with periodic, but unsteady behavior. Main results from high-speed video observations
Fig. 17 Example of a poorly identified object (cavitation cloud). Convergent nozzle. X∕d = 57.044, frame rate: 50,000 f/s, Shutter frequency:1/250000 s, Resolution 256 × 64 working conditions are in Table 1. case (a)s
890 Flow, Turbulence and Combustion (2022) 108:865–893
1 3
and the image processing and analysis based on the thresholds’ edge detection are sum-marized as follows:
• The existence of a reentrant motion towards the nozzle exit is leading to the periodic shedding of the cavitation cloud. The reentrant motion starts around the exit region of the nozzle and can be related to the propagation of cloud shrinking or vanishing along with the jet.
• The present image processing and analysis methods based on the thresholds edge detection and the tracing of clouds make it possible to grasp the occurrence and disappearance of small bubbles in cavitation clouds and are more effective on the motion analysis of cavitation cloud dynamic life.
• At high injection pressure, the collapsing of the cavitation clouds on the impinging wall caused by cavitating water jet tend to be peripherally located in the annular zone at the final collapsing stage. This annular location can be related to a ring-like erosion distribution on the impinging wall.
• The frequency of cavitating jet oscillation depends on both geometrical and hydro-dynamic conditions.
• If it is possible to recognize and categorically separate any single cloud, it is also possible to describe the statistically global behavior of the cavitation process in terms of cloud formation frequency and variation of cloud size and cloud lifetime.
• The obtained results could be trusted, they represent a detailed picture of the phe-nomenon, and more research has to be done to get the complete picture of it.
• At the current state of the investigation, we cannot firmly state that with our method we can identify interactive cavity behavior, as reliable as the isolated one, which we practically confirmed in this paper.
• Recognizing cavitation clouds and the ability of the software (Matlab) to track them through several successive frames has been done, this is one of the very interesting outcomes of our methodological approach.
• This software is able not only to detect a particular cavitation cloud but also to track it accurately through several frames and thus synthesize its trajectory in time and space. Also, its internal development, because the cavitation clouds change over time. In the used Matlab codes; the geometric properties for each cavitation cloud were extensively parameterized. So, in addition to simple tracking in time and space, it is possible to associate an impressive amount of different features and track their development in space in time for each cavitation cloud.
In future work, erosion and dilation as morphological operations in the image pro-cessing field will be used to measure the properties, calculate the frequency based on the cavity shape. Based on the obtained results, the next paper is intended to discuss the accuracy with which the technique predicts cavitation flow and behavior in space and time, identifying cavitation parameters (area, length, volume, etc.) and properties (intensity, composition, etc.).
Acknowledgements The first author would like to express his gratitude to the Ministry of Science in Libya, for support through his research activity and the Libyan Ministry of Higher Education, who paid EPFL-LMH for using the facility. This paper in the memory of our colleague counsellor Imre Nagy from nuclear fuel department in Center for Energy Research Budapest, Hungary.
Funding Open access funding provided by ELKH Wigner Research Centre for Physics.
891Flow, Turbulence and Combustion (2022) 108:865–893
1 3
Open Access This article is licensed under a Creative Commons Attribution 4.0 International License, which permits use, sharing, adaptation, distribution and reproduction in any medium or format, as long as you give appropriate credit to the original author(s) and the source, provide a link to the Creative Com-mons licence, and indicate if changes were made. The images or other third party material in this article are included in the article’s Creative Commons licence, unless indicated otherwise in a credit line to the material. If material is not included in the article’s Creative Commons licence and your intended use is not permitted by statutory regulation or exceeds the permitted use, you will need to obtain permission directly from the copyright holder. To view a copy of this licence, visit http:// creat iveco mmons. org/ licen ses/ by/4. 0/.
References
Baldassarre, A., Maurizio De Lucia, M., Paolo, N.: Real-time detection of cavitation for hydraulic turboma-chines. Real-Time Imag. 4, 403–416 (1998)
Barrow, H.G., Tenenbaum, J.M.: Interpreting line drawings as three-dimensional surfaces. Artif. Intell. 17, 75–116 (1981)
De Lucia, M. & Anguzza, G.: Visualization and Image Processing to Study the Cavitation Process in Hydraulic Turbomachinery, Conference of Modelling Testing & Monitoring for Hydro Power plants, Budapest, Hun-gary, The International Journal on Hydropower & DAMS, pp. 383–390 (1994)
Delar, M., Khlifa, I., Fuzier, S., Adama, M.M., Coutier-Delgosha, O.: Scale effect on unsteady cloud cavitation. Exp. Fluids 53, 1233–1250 (2012). https:// doi. org/ 10. 1007/ s00348- 012- 1356-7
Ganesh, H., Mäkiharju, S., Ceccio, S.: Bubbly shock propagation as a mechanism for sheet-to-cloud transition of partial cavities. J. Fluid Mech. 802, 37–78 (2016). https:// doi. org/ 10. 1017/ jfm. 2016. 425
Gonzalez, R C., Woods, R.E.: Digital Image Processing, Prentice-Hall, pp. 1–3. ISBN 978–0–13–168728–8 (2008)
Hitoshi, S., Nishizawa, K., Mikami, M.: Enhancement of cavitation aggressivity around a cavitating jet by injecting low-speed water jet for cavitation peening, Proceedings of the 7th International Symposium on Cavitation CAV2009 – Paper No. 12, Ann Arbor, Michigan, USA (2009). https:// pdfs. seman ticsc holar. org/ 0b6f/ d5597 f835e 83c71 575b2 61586 a5bdb 2ee215. pdf
Hutli, E., Nedeljkovic, M.: Frequency in shedding/discharging cavitation clouds determined by visualization of a submerged cavitating jet. Trans. ASME J. Fluids Eng., 130(021304): 1–8 (2008)
Hutli, E., Nedeljkovic M., Radović N.: Mechanics of submerged jet cavitating action: material properties, expo-sure time and temperature effects on erosion. Arch. Appl. Mech., 78, 329 341 (2008)
Hutli, E., Nedeljkovic, M., Radovic, N.: Nano-and micro-scale surface modification of fcc materials using high submerged cavitating water jet, Plasmonics, pp.8:843–849. https:// doi. org/ 10. 1007/ s11468- 013- 9481-6 (2013)
Hutli, E., Alteash, O., Ben Raghisa, M., Nedeljkovic, M., Ilic, V.: Appearance of high submerged cavitating jet: the cavitation phenomenon and sono-luminescence. Thermal Sci. Sci. J. 17, 1151–1161 (2013b)
Hutli, E., Abouali, S., Ben Hucine, M., Mansour, M., Nedeljkovic, M., Ilic, V.: Influence of hydrodynamic con-ditions and nozzle geometry on appearance of high submerged cavitating jets. Thermal Sci. Sci. J. 17, 1139–1149 (2013c)
Hutli, E., Bonyár, A., Oszetzky, D., Nedeljkovic, M.: Plastic deformation and modification of surface character-istics in nano-and micro-levels and enhancement of electric field of FCC materials using cavitation phe-nomenon. Mech. Mater. 92, 289–298 (2016a)
Hutli, E., Nedeljkovic, M., Bonyár, A., Radovic, N., Llic, V., Debeljkovic, A.: The ability of using the cavitation phenomenon as a tool to modify the surface characteristics in micro- and in nano-level. Tribol. Int. 101, 88–97 (2016b)
Hutli, E., Nedeljkovic, M., Radovic, N., Bonyár, A.: The relation between the high speed submerged cavitating jet behaviour and the cavitation erosion process. Int. J. Multiph. Flow 83, 27–38 (2016c)
Hutli, E., Nedeljkovic, M., Bonyár, A., Légrády, D., D., : Experimental study on the influence of geometrical parameters on the cavitation erosion characteristics of high speed submerged jets. Exp. Thermal Fluid Sci. 80, 281–292 (2017)
Hutli, E., Nedeljkovic, M., Bonyár, A.: Controlled modification of the surface morphology and roughness of stainless steel 316 by a high speed submerged cavitating water jet. Appl. Surf. Sci. 458, 293–304 (2018). https:// doi. org/ 10. 1016/j. apsusc. 2018. 07. 007
Hutli, E., Nedeljkovic, M., Czifrus, S.: Study and analysis of the cavitating and non-cavitating jets part two: parameters controlling the jet action and a new formula for cavitation number calculation. Thermal Sci. Sci. J. 24, 407–419 (2020)
Kalumuck, K. M. Chahine, G. L.: The use of cavitating jets to oxidize organic compounds in water. Trans. ASME J. Fluids Eng., 122, 465–470 (2000)
892 Flow, Turbulence and Combustion (2022) 108:865–893
1 3
Kokkinos L., Maragos P.: Synergy between object recognition and image segmentation using expectation and maximization algorithm, IEEE Trans. Pattern Anal. Mach. Intell. (PAMI), 31, 1486–1501 (2009)
Konrad, S., David, S.: Object detection by global contour shape. Pattern Recogn. 41, 3736–3748 (2008)Larry, S.D.: A survey of edge detection techniques. Comput. Graphics Image Process. 4, 248–270 (1975)Lei Zhai L., Dong, S., Ma, H.: Recent Methods and Applications on Image Edge Detection, Proceedings of
the International Workshop on Education Technology and Training & International Workshop on Geo-science and Remote Sensing, Vol. (01) Ettandgrs, IEEE Computer Society, Washington, DC, pp. 332–335 (2008)
Lindeberg, T.: Edge detection and ridge detection with automatic scale selection. Int. J. Comput. Vision 30, 117–154 (1998)
Merzkirsch, W.: Flow Visualization. Academic Press (1987)Nida M.Z., Musbah J.A.: Survey on image segmentation techniques. Proc. Comput. Sci., 65, 797–806 (2015)Nosrati M., Karimi R., Hariri M., Malekian K.: Edge detection techniques in processing digital images: investi-
gation of canny algorithm and gabor method. World Appl. Programm., 3, 116–121 (2013)Otsu, N.: A threshold selection method from gray-level histograms. IEEE Trans. Syst. Man Cybern. 9, 62–66
(1979)Photron Apx Camera http:// www. photr on. com/ index. phpReisman, G. E., Wang, Y.-C., Brennen, C. E.: Observations of shock waves in cloud cavitation. J. Fluid Mech.,
355, 255–283 (1998)Saito, Y. Sato, K.: instantaneous behavior of cavitation clouds at impingement of cavitating water-jet. In: Proc.
of Sixth International Symposium on Cavitation, CAV2006, on CD-ROM (2006)Saito, Y., Sato, K.: Bubble collapse propagation and pressure wave at periodic cloud cavitation. In: Proceedings
of the 6th International Conference on Multiphase Flow, Leipzig, pp. 1–8 (2007)Sakoda, M., Yakushiji, R., Maeda, M., Yamaguchi, H.: Mechanism of cloud cavitation generation on a 2-D
Hydrofoil, Proceedings of the 4th International Symposium on Cavitation, Pasadena, pp. 1–8 (2001)Sato, K., SaitoY., Nakamura, H.: Self-exciting behavior of cloud-like cavitation and micro-vortex cavities on the
shear layer. In: Proceedings of the 1st Symposium on Advanced Fluid Information, Sendai, pp. 263–268 (2001)
Sato, K., Yasuhiro, S.: Unstable cavitation behavior in a circular-cylindrical orifice flow, CAV2001:sessiona9.003 and JSEM Int. J. Ser. B, 45, 638–645 (2001 & 2003)
Sato, K., Shimojo, S., Watanabe, J.: Observations of Chain-Reaction Behavior at Bubble Collapse Using Ultra-High-Speed Video Camera, Proc. of ASME Cavitation and Multiphase Flow Forum, FEDSM2003–45002, 1–6, on CD-ROM (2003)
Sato, K., Ohjimi, S., Sugimoto, Y.: Collapsing and impulsive behavior of cavitation clouds on cavitating water-jet impinging on solid wall. Trans. JSME 75, 47–56 (2009a)
Sato K., Sugimoto Y., and Ohjimi, S.: Pressure-wave formation and collapse of cavitation clouds impinging on solid wall in a submerged water jet, In: Proceedings of the 7th International Symposium on Cavitation, Ann Arbor, pp. 1–11 (2009)
Sato K., Sugimoto Y., Ohjimi, S.: Structure of periodic cavitation clouds in submerged impinging water-jet issued from horn-type nozzle, In: Proceedings of the 9th Pacific Rim International Conference on Water Jetting Technology, Koriyama, pp. 1–9 (2009)
Sato, K., Wada, Y., Noto, Y., Sugimoto, Y.: Reentrant motion in cloud cavitation due to cloud collapse and pres-sure wave propagation. In: Proceedings of ASME 2010 3rd Joint US-European Fluids Summer Meeting, Mont- real, Quebec, pp. 7–11 (2010)
Sato, K., Taguchi, Y., Hayashi, S.: High-Speed Observation of periodic cavity behavior in a convergent-diver-gent nozzle for cavitating water jet. J. Flow Control Meas. Visual. 1, 102–107 (2013)
Sezgin, M., Sankur, B.: Survey over image thresholding techniques and quantitative performance evaluation. J. Electron. Imaging 13, 146–165 (2003)
Soyama, H., Yamauchi, Y., Sato, K., Ikohagi, T.O., R., Oshima R., : High-speed observation of ultra high-speed cavitating submerged water jets. Trans. Japan Soc. Mech. Eng. Ser. B 59, 3714–3719 (1993)
Soyama, H., Yamauchi, Y., Adachi, Y., Shindo, T., Oba, R. Sato, K.: High-Speed Cavitation-Cloud Observa-tions Around High-Speed Submerged Water Jets. In: Proc. 2nd International Symposium on Cavitation, pp. 225–230 (1994)
Soyama, H., Park, J. D., Saka, M.: Use of cavitating jet for introducing compressive residual stress. Trans. ASME, J. Manuf. Sci. Eng., 122, 83–89
Vijay, M. M., Zou, C., Tavoularis, S.: A study of the characteristics of cavitating water jets by photography and erosion, In: Proc. of Tenth International Conference, Jet Cutting Technology, pp. 37–67. (1990)
Wang, Y.C., Brennen, C.E.: Numerical computation of shock waves in a spherical cloud of cavitation bubbles. J. Fluids Eng, 121, 872–880. ISSN 0098–2202 (1999)
893Flow, Turbulence and Combustion (2022) 108:865–893
1 3
Yamaguchi, A., Shimizu, S.: Erosion due to Impingement of Cavitating Jet. Trans. ASME J. Fluids Eng. 109, 442–447 (1987)
Yang, W.-J.: Handbook of Flow Visualization. Taylor & Francis (1989)Yaw-Huei, L., Yi-Chih, C., Yu-Chi, C.: Experimental investigations on cavitations of marine propellers using
quantitative image-based methods. J. Mar. Sci. Technol. 25, 158–165 (2017)Yoshida, T., Iida, H., Yoshida, A., Yamamoto, K.: High-speed observation of unsteady behavior of bubble
clouds split from cavitating jet. In: Proceedings of the 21st International Conference on Water Jetting, Ottawa, pp. 307–317 (2012)
Zhang, Y.J.: A survey on evaluation methods for image segmentation. Pattern Recogn. 29, 1335–1346 (1996)
Publisher’s Note Springer Nature remains neutral with regard to jurisdictional claims in published maps and institutional affiliations.