Page 1
INTERNATIONAL JOURNAL ON SMART SENSING AND INTELLIGENT SYSTEM VOL. 8. NO. 1, MARCH 2015
720
AUTOMATIC FETAL ORGANS DETECTION AND
APPROXIMATION IN ULTRASOUND IMAGE
M. Anwar Ma’sum, Wisnu Jatmiko, Budi Wiweko and Anom Bowolaksono
Faculty of Computer Science, Universitas Indonesia
Kampus Baru UI Depok – 16424, Jawa Barat, Indonesia
Emails: [email protected] , [email protected]
Submitted: Nov. 6, 2014 Accepted: Jan. 30, 2015 Published: Mar. 1, 2015
Abstract— This paper proposed a system for detecting and approximating of a fetus in an
ultrasound image. The fetal organs in the ultrasound image are detected using Multi Boundary
Classifier based Adaboost.MH. The results of the fetal detection is then approximated
Randomized Hough Transform and the whole showed a mean accuracy of 95.80%. The mean of
the Hamming Error 0.019 and the Kappa coefficient value reaches 0.890.The proposed method
has the best performancefor fetal organ detection. This is proven by the Hamming Error, the
accuracy, and tthe Kappa Coefficient. The hitrate for fetal’s head, fetal’s femur, fetal’s humerus,
and fetal’s abdomen are 95%, 97%, 97%, and 93% respectively. From the Experiment result, it is
concluded that using detection by only usig the approximation method could not perform better
than the previous methods.
Index terms: ultrasound, automated system, fetal organ, detection, approximation, boosting,
Hough transform.
Page 2
M. Anwar Ma’sum, Wisnu Jatmiko, Budi Wiweko and Anom Bowolaksono, AUTOMATIC FETAL ORGANS DETECTION AND APPROXIMATION IN ULTRASOUND IMAGE
721
I. IINTRODUCTION
Periodic monitoring the growth of fetus is important in order to prevent the fetus from any growth
disorder. Periodic monitoring the growth of fetus is also important to reduce the infant mortality rate. In
Indonesia, the infant mortality rate is considered very high. The data provided by the Indonesian
Demographic and Health Survey in 2007 proves that the number of infant mortality reaches 34 to 1000
births. The number is very alarming, especially when it could be prevnted by doing regular monitoring
of the fetus.
Ideally, during a medical check up, an ultrasound device is used to monitor the growth of the fetus. The
imge acquired from the ultrasound will be used to extract the biometry of the fetus. The sequence of the
fetus biometry data is then used to determine the growth of the fetus. In Indonesia, however, several
hospitals, clinics, and public health centres could not provide the number of ultrasound needed to check
all of the patient. In addition to that, the hospitals and obstretrician is not evenly spread on all areas of
Indonesia.
To try and solve that issue, we propose a fetal growth monitoring intellegent system. This intellegent
system will monitor the fetal growth periodically and it will be implemented as a portable ultrasound
device. The main purpose of this system is for early detection of the fetal growth bu measuring the fetus
biometry, which includesCrown Rump Length (CRL), Biparietal Diameter (BPD), Head Circumference
(HC), Femur Length (FL), Humerus Length (HL), and Abdominal Circumference (AC).After it is
monitored, the resuts could be sent to be verified by an obstetrician using a telehealth information
system taht supports this system.
This system will be implemented in three phases. The startng phase will be focused on developing the
software of this system which will be divided into several modules.. The next phase will be focused on
developing the portable ultrasound device and also perfecting it. The final phase will be focused on the
telehealth system development. Currently, the research is in the early stages, where the intellegent
system software for detecting the fetus abnormality is being developed. The first module in is to
segment the fetal organs from the image that is obtained from an ultrasound image. The next module
will approximate the organsto fit the shape of the organs. For the fetal abdomen and fetal head, an
ellipse curve is used to approximate the shape. The fetal femur and the fetal humerus will be
approximated using a line curve.The goal of this approximation is to detect abnormalities in the groth of
the fetus.
Page 3
INTERNATIONAL JOURNAL ON SMART SENSING AND INTELLIGENT SYSTEM VOL. 8. NO. 1, MARCH 2015
722
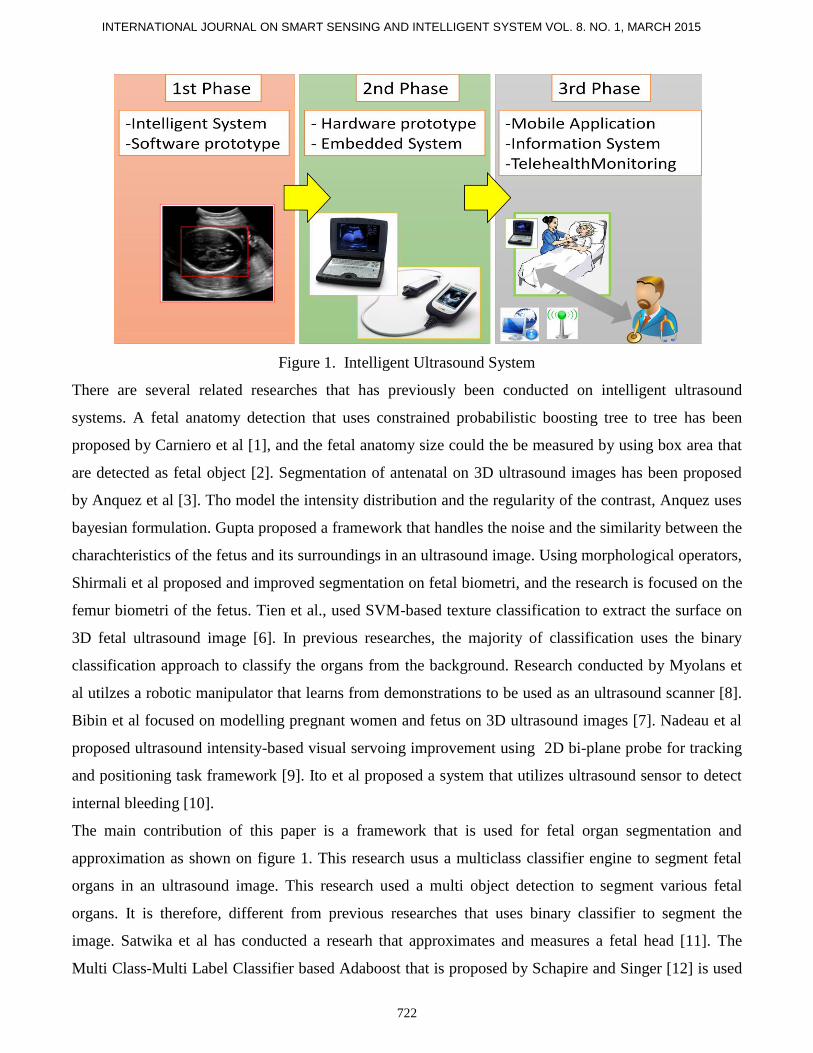
Figure 1. Intelligent Ultrasound System
There are several related researches that has previously been conducted on intelligent ultrasound
systems. A fetal anatomy detection that uses constrained probabilistic boosting tree to tree has been
proposed by Carniero et al [1], and the fetal anatomy size could the be measured by using box area that
are detected as fetal object [2]. Segmentation of antenatal on 3D ultrasound images has been proposed
by Anquez et al [3]. Tho model the intensity distribution and the regularity of the contrast, Anquez uses
bayesian formulation. Gupta proposed a framework that handles the noise and the similarity between the
charachteristics of the fetus and its surroundings in an ultrasound image. Using morphological operators,
Shirmali et al proposed and improved segmentation on fetal biometri, and the research is focused on the
femur biometri of the fetus. Tien et al., used SVM-based texture classification to extract the surface on
3D fetal ultrasound image [6]. In previous researches, the majority of classification uses the binary
classification approach to classify the organs from the background. Research conducted by Myolans et
al utilzes a robotic manipulator that learns from demonstrations to be used as an ultrasound scanner [8].
Bibin et al focused on modelling pregnant women and fetus on 3D ultrasound images [7]. Nadeau et al
proposed ultrasound intensity-based visual servoing improvement using 2D bi-plane probe for tracking
and positioning task framework [9]. Ito et al proposed a system that utilizes ultrasound sensor to detect
internal bleeding [10].
The main contribution of this paper is a framework that is used for fetal organ segmentation and
approximation as shown on figure 1. This research usus a multiclass classifier engine to segment fetal
organs in an ultrasound image. This research used a multi object detection to segment various fetal
organs. It is therefore, different from previous researches that uses binary classifier to segment the
image. Satwika et al has conducted a researh that approximates and measures a fetal head [11]. The
Multi Class-Multi Label Classifier based Adaboost that is proposed by Schapire and Singer [12] is used
Page 4
M. Anwar Ma’sum, Wisnu Jatmiko, Budi Wiweko and Anom Bowolaksono, AUTOMATIC FETAL ORGANS DETECTION AND APPROXIMATION IN ULTRASOUND IMAGE
723
as a classifier in this paper. Adaboost.MH Classifier could be boosted for classifying multiclass problem
amd it is proposed by Schapire and Freund [13]. The Adaboost itself is an ensemble technique that
utilizes wighted voting from the.The combination produced by the Adaboost.MH Classifier method will
have better performance the the best classifier combined. This has been proven mathematically by Roli
et al [14].The Adaboost.MH. classifier is combined with multi boundary classifier and the
multiboundary classifier is used as a weak classifier. The Multi boundaru classifier is formulated as the
secon contribution by the author. After that, Randomized Hough Transform (RHT) approximation is
used to approximate the fetal organ. This paper is an extension of previous work that combined object
detection and shape approximation for fetal organs segmentation [15]. Another approach is using super
pixel based classification [16]. In previous study we have also proposed an optimization of ellipse curve
approximation using Particle Swarm Optimization (PSO) [17]. The details of this method will be further
explained in the methodology section. The tele-ultrasound system developed in this study will be
integrated with tele-cardiology developed in previous research to form an integrated telehealth system
[18][19].
The next section of this paper will explain the methodologies used in this paper. The next section
discusses the experiment results and analysis. Finally, the last section will explain briefly about abou the
conclusion of this study.
II. METHODOLOGY
This section will explain the methodology of this research. In this research, we used 2D ultrasound
images as input. There are five steps used in this research, as seen in figure 2. The first step is training
and sample generation from dataset. The second step is Haar feature extraction. The third step is feature
selection and ensemble classifier. Then the classifier is used to detect fetal organ within ultrasound
image. The next step is fetal organ approximation in the detected area. The last step is evaluation. There
are two types of evaluation in this paper, fetal object detection (classification) evaluation, and fetal
object approximation evaluation.
Page 5
INTERNATIONAL JOURNAL ON SMART SENSING AND INTELLIGENT SYSTEM VOL. 8. NO. 1, MARCH 2015
724
Figure 2. Research methodology
A. Dataset
The ultrasound images that are used in this research are taken from the patient by physi. The fetal
head, abdomen, femur, and humerus is going to be approximated.The Dataset has recieved annotation
from medical experts. After the data has been automatically approximated by the system, it will be
decided whether the approximation is correct (hit) by comparing it with the doctor’s annotation.The
dataset samples could be viewed in Figure 3.
Figure 3. USG Dataset
Page 6
M. Anwar Ma’sum, Wisnu Jatmiko, Budi Wiweko and Anom Bowolaksono, AUTOMATIC FETAL ORGANS DETECTION AND APPROXIMATION IN ULTRASOUND IMAGE
725
In this paper, we compares proposed classifier algorithm with various classifiers. To verify classifiers
performance, we also use benchmark dataset, beside USG dataset. Benchmark dataset we used are USPS
and MNIST dataset. They are hand written images of number, from 0 to 9. USPS and MNIST images
are shown in figure 4.
Figure 4. Benchmark Dataset
B. Training and Testing Sample Generation
The system need training data as reference of fetal organs. Therefore, system can detect fetal organs
after training process. There are four kinds of fetal organs must be detected by system. Hence, there are
five class data must be generated as the training data, four classes of fetal organs and background.
Images generated as training sample in this research is shown in figure 5.
(a) (b)
(c) (d)
Page 7
INTERNATIONAL JOURNAL ON SMART SENSING AND INTELLIGENT SYSTEM VOL. 8. NO. 1, MARCH 2015
726
Figure 5. Training sample generated (a) Fetal head (b) Fetal abdomen (c) Fetal femur (d) Fetal humerus
(e) Background sample
After training and testing sample generated, then the samples were resized into fixed image size. In this
research, USG samples are resized into 20x20 sized image. USPS data is provided in the fixed 16x16
sized images, and MNIST data is provided in the fixed 28x28 sized images. Therefore, USPS and
MNIST data are not necessary to be resized.
C. Feature Extraction
The samples are transformed into the feature space after the training samples are generated. In object
detection, there are two types of well-known feature: Haar feature and local binary pattern (LBP)
feature. In the previous researches, LBP is used by Ahonen in face detection [21] and Haar feature
developed by Viola and Jones in face detection research [20].This research uses Haar feature, because in
the preliminary experiment, fetal abdomen could not be distinguished by using LBP features, whereas
using Haar features, the background and the main features could still be distinguished.. Therefore in
thisresearch, Haar features is more suitable The rectangular kernel in the Haar features is shown in
figure 6(a).
(a)
Page 8
M. Anwar Ma’sum, Wisnu Jatmiko, Budi Wiweko and Anom Bowolaksono, AUTOMATIC FETAL ORGANS DETECTION AND APPROXIMATION IN ULTRASOUND IMAGE
727
(b)
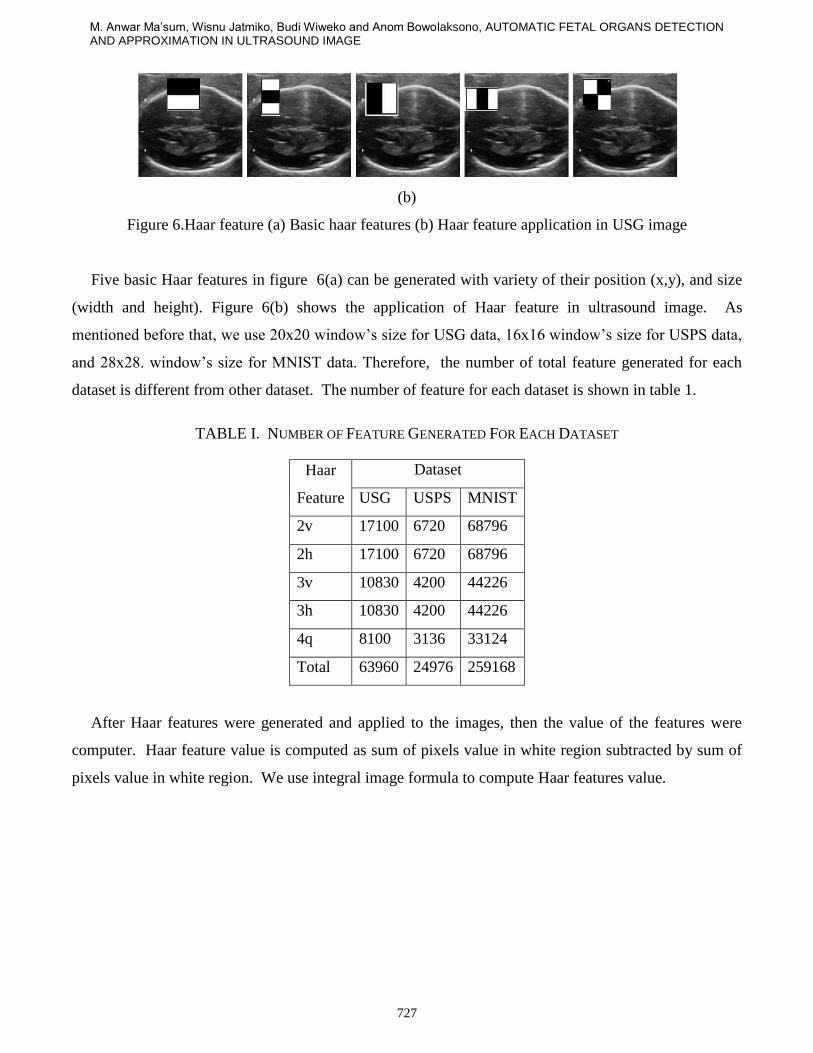
Figure 6.Haar feature (a) Basic haar features (b) Haar feature application in USG image
Five basic Haar features in figure 6(a) can be generated with variety of their position (x,y), and size
(width and height). Figure 6(b) shows the application of Haar feature in ultrasound image. As
mentioned before that, we use 20x20 window’s size for USG data, 16x16 window’s size for USPS data,
and 28x28. window’s size for MNIST data. Therefore, the number of total feature generated for each
dataset is different from other dataset. The number of feature for each dataset is shown in table 1.
TABLE I. NUMBER OF FEATURE GENERATED FOR EACH DATASET
Haar
Feature
Dataset
USG USPS MNIST
2v 17100 6720 68796
2h 17100 6720 68796
3v 10830 4200 44226
3h 10830 4200 44226
4q 8100 3136 33124
Total 63960 24976 259168
After Haar features were generated and applied to the images, then the value of the features were
computer. Haar feature value is computed as sum of pixels value in white region subtracted by sum of
pixels value in white region. We use integral image formula to compute Haar features value.
Page 9
INTERNATIONAL JOURNAL ON SMART SENSING AND INTELLIGENT SYSTEM VOL. 8. NO. 1, MARCH 2015
728
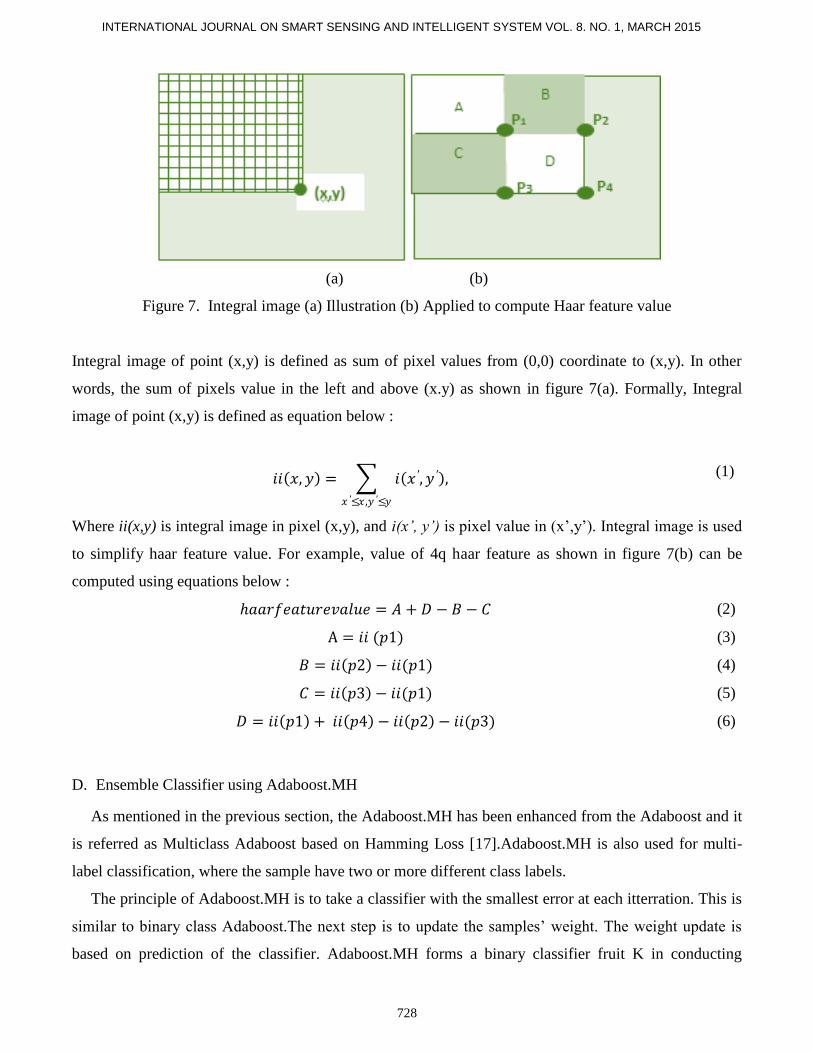
(a) (b)
Figure 7. Integral image (a) Illustration (b) Applied to compute Haar feature value
Integral image of point (x,y) is defined as sum of pixel values from (0,0) coordinate to (x,y). In other
words, the sum of pixels value in the left and above (x.y) as shown in figure 7(a). Formally, Integral
image of point (x,y) is defined as equation below :
𝑖𝑖 𝑥, 𝑦 = 𝑖 𝑥 ′, 𝑦 ′ ,
𝑥 ′≤𝑥 ,𝑦 ′≤𝑦
(1)
Where ii(x,y) is integral image in pixel (x,y), and i(x’, y’) is pixel value in (x’,y’). Integral image is used
to simplify haar feature value. For example, value of 4q haar feature as shown in figure 7(b) can be
computed using equations below :
𝑎𝑎𝑟𝑓𝑒𝑎𝑡𝑢𝑟𝑒𝑣𝑎𝑙𝑢𝑒 = 𝐴 + 𝐷 − 𝐵 − 𝐶 (2)
A = 𝑖𝑖 (𝑝1) (3)
𝐵 = 𝑖𝑖 𝑝2 − 𝑖𝑖(𝑝1) (4)
𝐶 = 𝑖𝑖 𝑝3 − 𝑖𝑖(𝑝1) (5)
𝐷 = 𝑖𝑖 𝑝1 + 𝑖𝑖 𝑝4 − 𝑖𝑖 𝑝2 − 𝑖𝑖(𝑝3) (6)
D. Ensemble Classifier using Adaboost.MH
As mentioned in the previous section, the Adaboost.MH has been enhanced from the Adaboost and it
is referred as Multiclass Adaboost based on Hamming Loss [17].Adaboost.MH is also used for multi-
label classification, where the sample have two or more different class labels.
The principle of Adaboost.MH is to take a classifier with the smallest error at each itterration. This is
similar to binary class Adaboost.The next step is to update the samples’ weight. The weight update is
based on prediction of the classifier. Adaboost.MH forms a binary classifier fruit K in conducting
Page 10
M. Anwar Ma’sum, Wisnu Jatmiko, Budi Wiweko and Anom Bowolaksono, AUTOMATIC FETAL ORGANS DETECTION AND APPROXIMATION IN ULTRASOUND IMAGE
729
multiclass classification. K represents the number of classes and the base classifier combined is a vector
with K elements f the binary classifier.The K elements also represents the class labels. The vector
element could worth -1 or 1. The Value 1 on the j-th elements means that the sample is predicted as a
member of class j. Given a sample set X = { x1 , x2 , ... xn }, each sample has m features { f1 , f2 , ... fm } ,
and the class labels Y = { y1 , y2 , ... , yn . }.The weight of each sample in X will be represented as a
vector with K elements. Each elements represents the weight of the vector samples to the corresonding
class.Each ofthe sample has K weight values, corresponding to each class wi = { wi,1, wi,2, ... wi,n}. So
each weight is also represented as a vector with K elements.Fist, the initiation is on the sample weights
is performed using the following equation:
𝑤𝑖 ,𝑙 =
1
2𝑛 , 𝑖𝑓 (𝑦𝑖 ,𝑙 = 1)
1
2𝑛 𝐾 − 1 , 𝑜𝑡𝑒𝑟𝑤𝑖𝑠𝑒( 𝑦 = −1)
(7)
Theclassifier that has the smalles error is considered as the best classifier and it is chosen by the
Adaboost.MH. The error in this method is the hamming loss error.It is expressed in this following
equation:
𝐸𝐻 = 𝑤𝑖,𝑙 { sign 𝑓𝑙 𝑥𝑖 𝑦𝑖,𝑙 }𝐾
𝑙=1
𝑛
𝑖=1
(8)
It could also be calculated using the error margin by the following equation:
𝐸𝑍 = 𝑤𝑖 ,𝑙 exp (−𝑓𝑙 𝑥𝑖 . 𝑦𝑖,𝑙 ) 𝐾
𝑙=1
𝑛
𝑖=1
(9)
The bese classifier is a vector with K elements, where each element is a binary classifer. The base
classifier is expressed using the following equation:
(𝑥)𝑡 = 𝐯 (𝑥) (10)
Page 11
INTERNATIONAL JOURNAL ON SMART SENSING AND INTELLIGENT SYSTEM VOL. 8. NO. 1, MARCH 2015
730
Where is base classifier’s coefficient, v is voting vector that has K element (v = {+1,-1}K) and is
binary classifier. The Margin error value in equation (9) could be minimized if using v value as
expressed by the following equation:
𝑣𝑙 = +1 , 𝑖𝑓
𝑙+>
𝑙−
−1 , 𝑜𝑡𝑒𝑟𝑤𝑖𝑠𝑒 l=1,…,K
(11)
And value as following equation:
𝛼 =1
2ln
(𝑙+
| 𝑣𝑙 = +1 + 𝑙−
| 𝑣𝑙 = −1 )𝐾𝑙=1
(𝑙−
| 𝑣𝑙 = +1 + 𝑙+
| 𝑣𝑙 = −1 )𝐾𝑙=1
(12)
Where 𝑙−
is weighted error per-class :
𝑙−
= 𝑤𝑖,𝑙 | { 𝑙 𝑥𝑖 𝑦𝑖 ,𝑙 }
𝑛
𝑖=1
(13)
and 𝑙+
𝑙+
= 𝑤𝑖 ,𝑙 | { 𝑙 𝑥𝑖 = 𝑦𝑖 ,𝑙 }
𝑛
𝑖=1
(14)
The classification edge()is maximized duringtraining process (𝑥). It is expressed with the following
equation:
() = 𝑤𝑖,𝑙 . 𝑣𝑙 .𝑙 𝑥𝑖 . 𝑦𝑖,𝑙
𝐾
𝑙=1
𝑛
𝑖=1
(15)
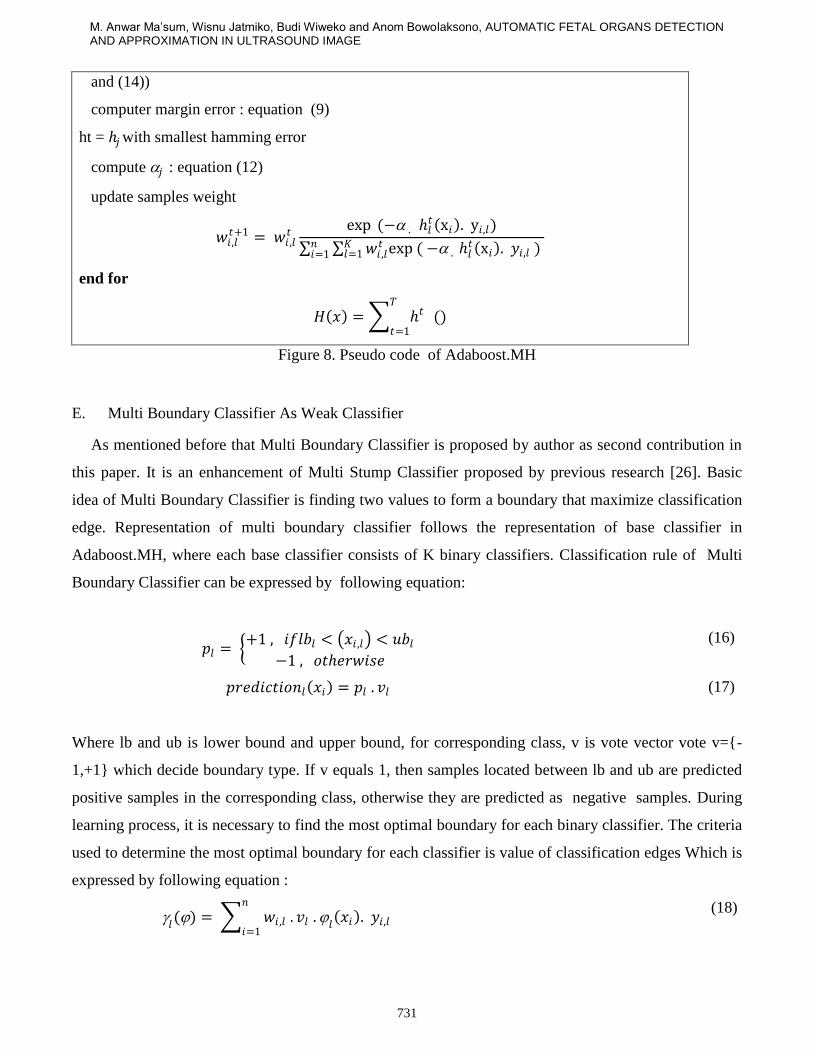
Iteratively, training process of Adaboost.MH can be written as pseudo code in figure 8.
Algorithm 2.1 : Adaboost.MH
Given samples X= {x1,…XN}
Init weight, equation (7)
For (t =1 to T)
for each feature j, train base classifier hj = 𝑗 v𝑗𝑗
compute edge of 𝑗 : equation (15)
compute 𝑙−
and 𝑙+
for l = 1,…K using (equation (13)
Page 12
M. Anwar Ma’sum, Wisnu Jatmiko, Budi Wiweko and Anom Bowolaksono, AUTOMATIC FETAL ORGANS DETECTION AND APPROXIMATION IN ULTRASOUND IMAGE
731
and (14))
computer margin error : equation (9)
ht = 𝑗 with smallest hamming error
compute 𝑗 : equation (12)
update samples weight
𝑤𝑖 ,𝑙𝑡+1 = 𝑤𝑖 ,𝑙
𝑡 exp (− . 𝑙𝑡 x𝑖 . y𝑖,𝑙)
𝑤𝑖 ,𝑙𝑡 exp ( − . 𝑙
𝑡 x𝑖 . 𝑦𝑖,𝑙 ) 𝐾𝑙=1
𝑛𝑖=1
end for
𝐻 𝑥 = 𝑡 ()𝑇
𝑡=1
Figure 8. Pseudo code of Adaboost.MH
E. Multi Boundary Classifier As Weak Classifier
As mentioned before that Multi Boundary Classifier is proposed by author as second contribution in
this paper. It is an enhancement of Multi Stump Classifier proposed by previous research [26]. Basic
idea of Multi Boundary Classifier is finding two values to form a boundary that maximize classification
edge. Representation of multi boundary classifier follows the representation of base classifier in
Adaboost.MH, where each base classifier consists of K binary classifiers. Classification rule of Multi
Boundary Classifier can be expressed by following equation:
𝑝𝑙 = +1 , 𝑖𝑓𝑙𝑏𝑙 < 𝑥𝑖 ,𝑙 < 𝑢𝑏𝑙
−1 , 𝑜𝑡𝑒𝑟𝑤𝑖𝑠𝑒
(16)
𝑝𝑟𝑒𝑑𝑖𝑐𝑡𝑖𝑜𝑛𝑙 𝑥𝑖 = 𝑝𝑙 . 𝑣𝑙 (17)
Where lb and ub is lower bound and upper bound, for corresponding class, v is vote vector vote v={-
1,+1} which decide boundary type. If v equals 1, then samples located between lb and ub are predicted
positive samples in the corresponding class, otherwise they are predicted as negative samples. During
learning process, it is necessary to find the most optimal boundary for each binary classifier. The criteria
used to determine the most optimal boundary for each classifier is value of classification edges Which is
expressed by following equation :
𝑙() = 𝑤𝑖 ,𝑙 . 𝑣𝑙 .𝑙
𝑥𝑖 . 𝑦𝑖,𝑙
𝑛
𝑖=1
(18)
Page 13
INTERNATIONAL JOURNAL ON SMART SENSING AND INTELLIGENT SYSTEM VOL. 8. NO. 1, MARCH 2015
732
To form an optimum boundary, first sample must be sorted increasingly based their feature. In this
state lower bound value is set by minimum feature value, and upper bound set by maximum feature
value. Then lower bound and upper bound is adjusted iteratively to find the boundary with maximum
classification edge. Training process of Multi Boundary Classifier can be done by following steps
below:
1. Initiate lower bound and upper bound
𝑙𝑏𝑙 = −𝑛𝑢𝑚𝑒𝑟𝑖𝑐 max . (19)
𝑢𝑏𝑙 = +𝑛𝑢𝑚𝑒𝑟𝑖𝑐 max . (20)
numeric (max), is maximum numeric of data type used.
2. Initiate 1-side half edge (1l+, and 1l−), 2-side half edge (2l+, and 2l−), and best 2-side half
edge (best_2l+, and best_2l−) with 0. 1-side half edge is value of edge (positive and
negative) for various lower bound value, whereas 2-side edge is value of edge (positive and
negative) for various lower bound and upper bound value. During training process, classifier
will find the best (maximum) 2-side half edge
3. Initiate lower index (i) and upper index (j) for iteration process. Lower index is pointer to
sample started from lowest feature value. Upper index is pointer to sample started from highest
feature value.
𝑖𝑖𝑛𝑑𝑒𝑥 𝑠 . (21)
𝑗𝑖𝑛𝑑𝑒𝑥 𝑁 . (22)
4. Iterate lower index to the next sample
𝑖𝑖 + 1 (23)
a. Add sample weight to e 1-sides half edge
If 𝑤𝑖 ,𝑙 . 𝑦𝑖 ,𝑙 < 0
1𝑙+1𝑙+ − (𝑤𝑖,𝑙 . 𝑦𝑖 ,𝑙 ) (24)
Otherwise
1𝑙−1𝑙− + (𝑤𝑖 ,𝑙 . 𝑦𝑖 ,𝑙 ) (25)
b. Copy 1-side half edge value to 2-side half edge.
1𝑙+1𝑙+ (26)
2𝑙−1𝑙− (27)
c. Calculate vector vote (v) based on 2-side half edge
𝑣𝑙𝑠𝑖𝑔𝑛 (2𝑙+ − 2𝑙−) (28)
Page 14
M. Anwar Ma’sum, Wisnu Jatmiko, Budi Wiweko and Anom Bowolaksono, AUTOMATIC FETAL ORGANS DETECTION AND APPROXIMATION IN ULTRASOUND IMAGE
733
d. Check if current 2-side half is greater than best half edge. If so, update best half edge and
lower bound (lb).
If ( (2𝑙+ − 2𝑙−) . 𝑣𝑙) > ( (𝑏𝑒𝑠𝑡𝑙+ − 𝑏𝑒𝑠𝑡𝑙−
). 𝑏𝑒𝑠𝑡_𝑣𝑙) 𝑡𝑒𝑛:
𝑏𝑒𝑠𝑡_𝑙+2𝑙+ (29)
𝑏𝑒𝑠𝑡_𝑙−2𝑙+ (30)
𝑏𝑒𝑠𝑡_𝑣𝑙𝑣𝑙 (31)
𝑙𝑏𝑙1
2 𝑓𝑒𝑎𝑡𝑢𝑟𝑒 (𝑥𝑖 + 𝑓𝑒𝑎𝑡𝑢𝑟𝑒 𝑥𝑖−1 )
(32)
5. Check possibility to adjust upper bound given lb value from previous process. First, upper index
(j) is set to N (sample whose highest feature value). Then iteratively, upper index is iterated to
previous sample until its value equal to lower index. In each iteration, 2-side half edge will be
updated by following procedures :
𝑗 j − 1 (33)
a. Add sample weight to 2-side half edges.
If 𝑤𝑗 ,𝑙 . 𝑦𝑗 ,𝑙 < 0
2𝑙+2𝑙+ − (𝑤𝑗 ,𝑙 . 𝑦𝑗 ,𝑙 ) (34)
otherwise
2𝑙−2𝑙− + (𝑤𝑗 ,𝑙 . 𝑦𝑗 ,𝑙 ) (35)
b. Calculate vector vote (v) based on 2-side half edges using equation (26-27).
c. Check if current 2-side half is greater than best half edge as same as process 3.d. If so, update
best half edge using equation (29), (30), and (31). Then, upper bound (ub) is updated using
equation below :
𝑢𝑏𝑙1
2 𝑓𝑒𝑎𝑡𝑢𝑟𝑒 (𝑥𝑖 + 𝑓𝑒𝑎𝑡𝑢𝑟𝑒 𝑥𝑖+1 )
(36)
6. Process number 5 and 6 is done for all class label l (1,2,..,N).
7. Classification edge of the trained classifier can be measured by following equation:
() = 𝑏𝑒𝑠𝑡_𝑣𝑙 . 𝑏𝑒𝑠𝑡_𝑙
𝐾
𝑙=1
(37)
F. Hough Transform For Fetal Organ Approximation
The fetal organs are approximated to fit their shape after it has been detected by the system. The
Randomized Hough Transform (RHT) will be used for the fetal organ approximation. The RHT itself is
an improvement from the Hough Transform by randomizing the voting process sample points [22].
Page 15
INTERNATIONAL JOURNAL ON SMART SENSING AND INTELLIGENT SYSTEM VOL. 8. NO. 1, MARCH 2015
734
Although it haas been used to detect line curves in the beginning, the Hough transform method has been
widely used for detection of many kinds of polygons and circles [22]. The idea is to transform the curve
equation from the image to a parameter space.For example, a line in a Cartesian coordinate (x,y) can be
described using this following equation:
𝑦 = 𝑚𝑥 + 𝑛 (38)
where m acts as gradient (slope line) and n is the intercept of the line on y-axis. Each line is unique if we
transform it using the following way. A point (yk,xk) can be represented in Hough space by following
equation [22]:
𝑚 =𝑦𝑘
𝑥𝑘−
1
𝑥𝑘𝑛
(39)
Another example of Hough Transform is ellipse curve detection where the ellipse equation can be
described as follows
𝑥 − 𝑥𝑐 2
𝑎2+
𝑦 − 𝑦𝑐 2
𝑏2= 1
(40)
(xc,yc) is the representation of the center points of an ellipse. The a semi-major and the b semi-minor
axes of the ellipse. The ellipse equation also takes the rotation of the ellipse (θ) into account. The more
general ellipse equation could be described as follows:
𝑥𝑐𝑜𝑠θ + ysinθ 2
𝑎2+
xsinθ − ycosθ 2
𝑏2= 1
(41)
To determine the ellipse parameter if the points of the space are already known, then previous ellipse
equation is modified into following formula
𝑥2 + 𝑦2 − 𝑈 𝑥2 − 𝑦2 − 2𝑉𝑥𝑦 − 𝑅𝑥 − 𝑆𝑦 − 𝑇 = 0 (42)
where each of the variables of equation (35) can be determined by following set of equations
𝑒 = 𝑏
𝑎
(43)
𝑈 = 1 − 𝑒2
1 + 𝑒2cos 2𝜃
(44)
𝑉 =1 − 𝑒2
1 + 𝑒2sin 2𝜃
(45)
Page 16
M. Anwar Ma’sum, Wisnu Jatmiko, Budi Wiweko and Anom Bowolaksono, AUTOMATIC FETAL ORGANS DETECTION AND APPROXIMATION IN ULTRASOUND IMAGE
735
𝑅 = 2𝑥𝑐 1 − 𝑈 − 2𝑦𝑐𝑉 (46)
𝑆 = 2𝑦𝑐 1 − 𝑈 − 2𝑥𝑐𝑉 (47)
𝑇 =2𝑎2𝑏2
𝑎2 + 𝑏2−
𝑥𝑐𝑅
2−
𝑦𝑐𝑆
2
(48)
In order to extract the value of each of the ellipse parameters [a, b, x0, y0, θ] following equations can be
used:
𝑥0 = 𝑆𝑉 + 𝑅 + 𝑅𝑈
2(1 − 𝑈2 − 𝑉2)
(49)
𝑦0 = 𝑅𝑉 + 𝑆 − 𝑆𝑈
2 1 − 𝑈2 − 𝑉2
(50)
𝑎 = 2𝑇 + 𝑥0𝑅 + 𝑦0𝑆
2 1 − 𝑈2 + 𝑉2
(51)
𝑏 = 2𝑇 + 𝑥0𝑅 + 𝑦0𝑆
2 1 + 𝑈2 + 𝑉2
(52)
𝜙 =1
2arctan
𝑉
𝑈
(53)
In order to solve equation (42), we require at least 5 coordinate points from the ellipse. To solve this
equation, an accumulator of 5 dimensions is needed to solve ellipse equation using Hough Transform.
III. EXPERIMENT AND RESULT
The prototype system of this research is implemented using C++ language, with additional libraries
such as Open Computer Vision (OpenCV) and Multiboos Library [23][24]. In this paper there are two
experiments conducted. The initial experiment is to measure the performance of the classifier. It uses
three types of performance measurements: hamming loss error, accuracy, and kappa coefficient. The
hamming error mathematical expression is shown in equation (2) in the previous section. The
mathematical formua of accuracy could be written as the following equation.
𝑎𝑐𝑐𝑢𝑟𝑎𝑐𝑦 =𝑇𝑃 + 𝑇𝑁
𝑁
(54)
TP represents the true positive rate while the TN represents the true negative rate. N is the number of
sample used. The accuracy is defined as percentage of sample that has been correctly classified by the
Page 17
INTERNATIONAL JOURNAL ON SMART SENSING AND INTELLIGENT SYSTEM VOL. 8. NO. 1, MARCH 2015
736
system. The mathematical formula of Kappa coefficient formula could be expressed by the following
equation:
𝑘 =𝑃 𝑎 − 𝑃(𝑒)
1 − 𝑃(𝑒)
(55)
P(a) is the percentage of the agreement, while P(e) is the chance that the agreement will occur. The
Kappa statistic is represented as k. In this paper, the classifier performance in various number features
and it is also compared with other various method. In this case, we compare the performance of the
propoed mehod with Adaboost.MH based on Stump Algorithm, Product of Stump, and Tree that have
already been proposed by the previous research[26]. The performance of this method is also compared
with Adaboost based on Learning Vector Quantization that is proposed by the previous researcher[27].
The second experiment will measure the fetal organs approximation performance. The shape
approximation is located in the area that has been detected as a fetal organ. The method used in this
experiment is the hit rate measurement method.
A. Classification Performance on Data USG
As explained before, the first experiment is conducted to measure classification performance. The
curve of classifiers hamming error toward various number of features selected is shown in figure 9.
Curve of classifiers accuracy toward various number of features selected is shown in figure 10.
Whereas curve of classifiers kappa toward various number of features selected is shown in figure 11.
Based on the figure 9, it can be said that the value of the lowest hamming error is obtained by
Adaboost.MH with Multi Boundary Classifier as base classifier . Figure 10 shows that proposed method
has highest accuracy in almost variety of number of features selected. In addition, from Figure 11. Also
confirms that the kappa coefficient for multi boundary classifier is also the highest among classifiers
tested in this research.
Page 18
M. Anwar Ma’sum, Wisnu Jatmiko, Budi Wiweko and Anom Bowolaksono, AUTOMATIC FETAL ORGANS DETECTION AND APPROXIMATION IN ULTRASOUND IMAGE
737
Figure 9. Plot of Classifiers Hamming Error
Figure 10. Plot of Classifiers Accuracy
Page 19
INTERNATIONAL JOURNAL ON SMART SENSING AND INTELLIGENT SYSTEM VOL. 8. NO. 1, MARCH 2015
738
Figure 11. Kappa Coefficient of Classifiers
Figure 12.Classification performance on USG data
Classifiers performance measurements can be summarize in figure12. Figure 12 shows that ranking
of classifiers based on those three performance measurements have same trend, except rank of
AdaboostMH-Single Stump
AdaboostMH-Multi Stump
AdaboostMH-Multi
Boundary
AdaboostMH-Product of
Multi Stump
AdaboostMH-Tree
AdaboostMH-LVQ
Accuracy 0.941 0.944 0.958 0.902 0.935 0.951
Kappa 0.854 0.863 0.897 0.741 0.838 0.881
Hamming Error 0.032 0.025 0.019 0.042 0.031 0.029
0.000
0.200
0.400
0.600
0.800
1.000
1.200
Page 20
M. Anwar Ma’sum, Wisnu Jatmiko, Budi Wiweko and Anom Bowolaksono, AUTOMATIC FETAL ORGANS DETECTION AND APPROXIMATION IN ULTRASOUND IMAGE
739
Adaboost.MH-LVQ and Adaboost.MH-Multi Stump measured by Hamming Error. Figure 12 show that,
the proposed method, Adaboost.MH-Multi Boundary Classifier has the best performance among them,
measured from Hamming Error, Accuracy, and Kappa. The second rank is Adaboost.MH-LVQ,
followed by Adaboost.MH-Multi Stump, Adaboost.MH-Single Stump, Adaboost.MH-Tree, and the
last is Aadaboost.MH Product of Multi Stump.
After measured classifier performance, we compare performance among classifiers tested. In this
paper we use pairwise comparison method. From 200 test case used, we compare performance of every
classifier to other classifier. The process like head to head competition. Then, we build a matrix
represent the result of the competition. Cell (i,j) represent number of classifier-i win against classifiers j
from 200 test cases. In the opposite, cell (j,i) number of classifier-j win against classifiers i from 200 test
cases. Table II shows pair-wise comparison of the classifiers for USG data based on those three
measurements. In those tables, A is code for Adaboost.MH-Single Stump, B is code for Adaboost.MH-
Multi Stump, C is code for Adaboost.MH-Multi Boundary, D is code for Adaboost.MH-Product of
Multi Stump, E is code for for Adaboost.MH-Tree and F is Code for Adaboost.MH-LVQ. Those tables
shows that proposed method has the best performance among all classifiers. Furthermore, from 200
tests cased used, proposed method win more than 190 times in every head to head comparison with other
classifier. In other word, proposed method has more than 95% win rate compared to other classifiers
based on hamming error, accuracy, and kappa indicator.
TABLE II. PAIRWISE COMPARISON RESULT OF THE CLASSIFIERS ON USG DATA
Accuracy Comparison Kappa Comparison Hamming Error Comparison
A B C D E F A B C D E F A B C D E F
A 31 4 177 156 85 A 32 3 186 150 68 A 10 3 143 178 71
B 169 5 198 168 142 B 168 5 200 170 138 B 190 2 199 195 187
C 196 195 199 197 198 C 197 195 199 198 198 C 197 198 198 198 197
D 23 2 1 63 19 D 14 0 1 45 7 D 57 1 2 120 74
E 45 32 3 137 31 E 50 30 2 155 23 E 22 5 2 80 7
F 115 58 2 181 169 F 132 62 2 193 177 F 129 13 3 126 193
Then, classifier is used to detect fetal organ in the USG Image. The results of fetal organs detection
are shown in figure 13.
Page 21
INTERNATIONAL JOURNAL ON SMART SENSING AND INTELLIGENT SYSTEM VOL. 8. NO. 1, MARCH 2015
740
Figure 13. Results of fetal organs detection
Page 22
M. Anwar Ma’sum, Wisnu Jatmiko, Budi Wiweko and Anom Bowolaksono, AUTOMATIC FETAL ORGANS DETECTION AND APPROXIMATION IN ULTRASOUND IMAGE
741
B. Classification Performance on USPS Data
As verification, we also measure classifiers performance using USPS benchmark dataset. In this
experiment , we also use same measurement methods, they are Hamming error, accuracy, and kappa.
Table VI shows that proposed method has the best performance among all classifiers. The difference of
accuracy between proposed method and compared classifiers is more than 3.5%, and difference of kappa
between proposed method and compared classifiers is more than 0.04 except for Adaboost.MH-Multi
Stump. However, compared to Adaboost.MH-Multi Stump, proposed method has no significant
difference in performance, especially for accuracy and kappa.
To verify classifier performance for USPS data, we also apply pair wise comparison to the classifiers.
Table III shows pair-wise comparison of the classifiers for USPS data based on those three
measurements. Code all classifiers are the same as code in previous sub section. Table III shows that
proposed method almost win compared to other classifiers measured from Hamming error. Based on
Hamming error factor its chance of winning in head to head comparison is almost 100%. However,
measured from accuracy and kappa, proposed method just has 55% chance of winning against
Adaboost.MH-Multi Stump. Whereas compared to other classifiers its chance of winning is almost
100% measured from accuracy and kappa.
Figure 14. Classification performance on USPS data
AdaboostMH-Single Stump
AdaboostMH-Multi Stump
AdaboostMH-Multi
Boundary
AdaboostMH-Product of
Multi Stump
AdaboostMH-Tree
AdaboostMH-LVQ
Accuracy 0.872 0.891 0.893 0.865 0.859 0.862
Kappa 0.851 0.877 0.879 0.854 0.840 0.845
Hamming Error 0.031 0.025 0.024 0.029 0.034 0.037
0.000
0.100
0.200
0.300
0.400
0.500
0.600
0.700
0.800
0.900
1.000
Page 23
INTERNATIONAL JOURNAL ON SMART SENSING AND INTELLIGENT SYSTEM VOL. 8. NO. 1, MARCH 2015
742
TABLE III. PAIRWISE COMPARISON RESULT OF THE CLASSIFIERS ON USPS DATA
Accuracy Comparison Kappa Comparison Hamming Error Comparison
A B C D E F A B C D E F A B C D E F
A
1 1 167 192 178 A 1 1 167 192 178 A 1 0 21 192 184
B 199
89 199 200 200 B 199 89 199 200 200 B 199 1 198 198 200
C 199 111
199 200 200 C 199 111 199 200 200 C 200 199 200 200 200
D 33 1 1
80 51 D 33 1 1 80 51 D 179 2 0 197 185
E 8 0 0 120
45 E 8 0 0 120 45 E 8 2 0 3 92
F 22 0 0 149 155
F 22 0 0 149 155 F 16 0 0 15 108
C. Classification Performance on Data MNIST
As second verification, we also measure classifiers performance using MNIST benchmark dataset.
Figure 15 shows that proposed method has the best performance among all classifiers. The difference of
accuracy between proposed method and compared classifiers is more than 3 %, and difference of kappa
between proposed method and compared classifiers is more than 0.03.
To verify classifier performance for MNIST data, we also apply pair wise comparison to the
classifiers. Table IV shows pair-wise comparison of the classifiers for MNIST data based on Hamming
error, accuracy and kappa. Code all classifiers are the same as code in USG and USPS data. Table IV
show that proposed method has almost 100% chance of winning in pair-wise comparison with other
method, measured by Hamming error, accuracy and kappa.
Page 24
M. Anwar Ma’sum, Wisnu Jatmiko, Budi Wiweko and Anom Bowolaksono, AUTOMATIC FETAL ORGANS DETECTION AND APPROXIMATION IN ULTRASOUND IMAGE
743
Figure 15. Classification performance on MNIST data
TABLE IV. COMPARISON RESULT OF THE CLASSIFIERS ON MNIST DATA
Accuracy Comparison Kappa Comparison Hamming Error Comparison
A B C D E F A B C D E F A B C D E F
A
3 1 199 133 10 A 3 0 200 135 10 A 0 0 200 104 9
B 197
0 199 199 196 B 197 0 199 199 197 B 200 0 200 200 199
C 199 200
199 199 198 C 200 200 200 200 199 C 200 200 200 200 200
D 1 1 1
3 0 D 0 1 0 6 1 D 0 0 0 6 1
E 67 1 1 197
0 E 65 1 0 194 1 E 96 0 0 194 4
F 190 4 2 200 200
F 190 3 1 199 199 F 191 1 0 199 196
AdaboostMH-Single Stump
AdaboostMH-Multi Stump
AdaboostMH-Multi
Boundary
AdaboostMH-Product of
Multi Stump
AdaboostMH-Tree
AdaboostMH-LVQ
Accuracy 0.740 0.856 0.892 0.691 0.751 0.833
Kappa 0.711 0.840 0.880 0.656 0.723 0.814
Hamming error 0.079 0.033 0.028 0.091 0.068 0.052
0.000
0.100
0.200
0.300
0.400
0.500
0.600
0.700
0.800
0.900
1.000
Page 25
INTERNATIONAL JOURNAL ON SMART SENSING AND INTELLIGENT SYSTEM VOL. 8. NO. 1, MARCH 2015
744
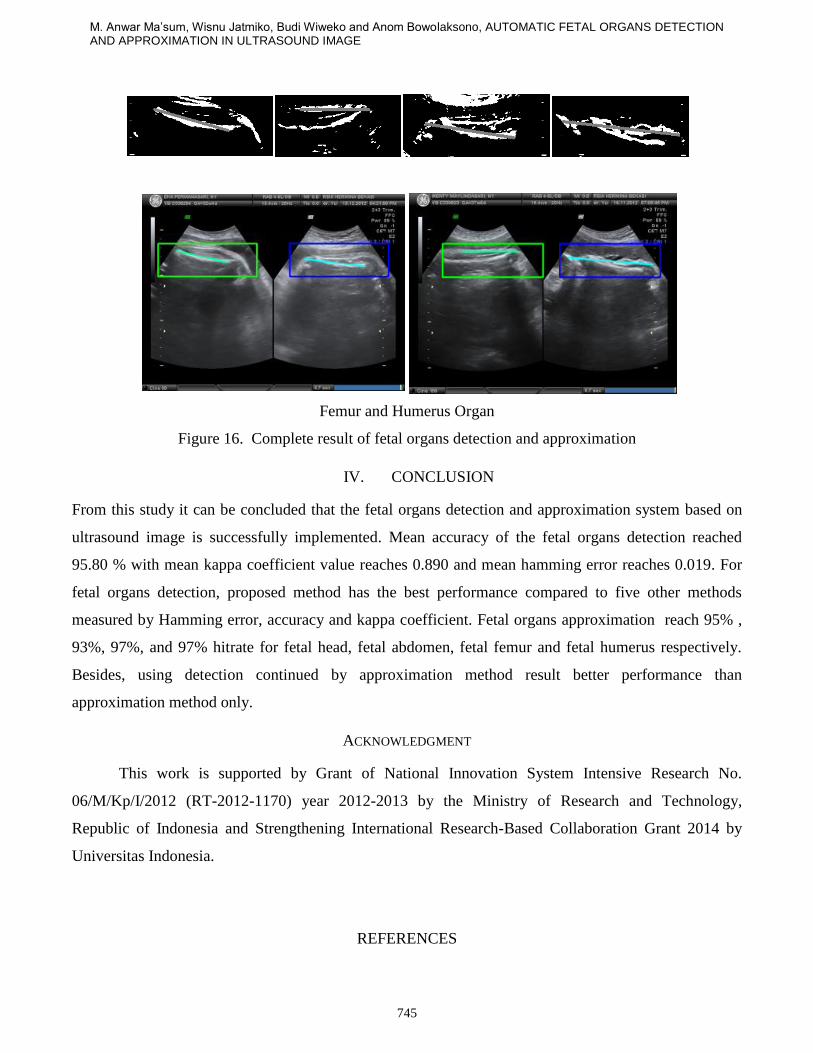
D. Fetal Organs Approximation Performance
Approximation Performance evaluation of fetal organs approximation is shown in table V. AS shown
in figure VIII that approximation method using detection continued by approximation method is better
than using approximation method only. Besides the difference performance (hit rate) is quite significant
which is more than 10%. Complete result of detection and approximation process is shown in figure 16.
TABLE V. COMPARISON RESULT OF THE CLASSIFIERS ON MNIST DATA
Organ
Methods
Detection+PHT Detection+RHT Detection+IRHT RHT IRHT EPSOHT
Head - 0.95 0.93 0.81 0.84 0.77
Abdomen - 0.92 0.93 0.76 0.81 0.72
Femur 0.97 0.83 0.86 0.62 0.72 -
Humerus 0.97 0.87 0.91 0.56 0.66 -
Head and Abdomen Organ
Page 26
M. Anwar Ma’sum, Wisnu Jatmiko, Budi Wiweko and Anom Bowolaksono, AUTOMATIC FETAL ORGANS DETECTION AND APPROXIMATION IN ULTRASOUND IMAGE
745
Femur and Humerus Organ
Figure 16. Complete result of fetal organs detection and approximation
IV. CONCLUSION
From this study it can be concluded that the fetal organs detection and approximation system based on
ultrasound image is successfully implemented. Mean accuracy of the fetal organs detection reached
95.80 % with mean kappa coefficient value reaches 0.890 and mean hamming error reaches 0.019. For
fetal organs detection, proposed method has the best performance compared to five other methods
measured by Hamming error, accuracy and kappa coefficient. Fetal organs approximation reach 95% ,
93%, 97%, and 97% hitrate for fetal head, fetal abdomen, fetal femur and fetal humerus respectively.
Besides, using detection continued by approximation method result better performance than
approximation method only.
ACKNOWLEDGMENT
This work is supported by Grant of National Innovation System Intensive Research No.
06/M/Kp/I/2012 (RT-2012-1170) year 2012-2013 by the Ministry of Research and Technology,
Republic of Indonesia and Strengthening International Research-Based Collaboration Grant 2014 by
Universitas Indonesia.
REFERENCES
Page 27
INTERNATIONAL JOURNAL ON SMART SENSING AND INTELLIGENT SYSTEM VOL. 8. NO. 1, MARCH 2015
746
[1] Statistics Indonesia (Badan Pusat Statistik (BPS)) and Macro In-ternational, Indonesia
Demographic and Health Survey 2007.Calverton, Maryland, USA: BPS and Macro
International,2008.
[2] Carneiro, G., Georgescu, B., Good, S., Comaniciu, D. "Detection and Measurement of Fetal
Anatomies from Ultrasound Images using a Constrained Probabilistic Boosting Tree,"Medical
Imaging, IEEE Transactions on , vol.27, no.9, pp.1342,1355, Sept. 2008
[3] Anquez, J., Angelini, E.D., Grange, G., Bloch, I., "Automatic Segmentation of Antenatal 3-D
Ultrasound Images," Biomedical Engineering, IEEE Transactions on , vol.60, no.5, pp.1388,1400,
May. 2013
[4] Gupta, L., Sisodia, R.S., Pallavi, V., Firtion, C., Ramachandran, G., "Segmentation of 2D fetal
ultrasound images by exploiting context information using conditional random fields,"
Engineering in Medicine and Biology Society,EMBC, 2011 Annual International Conference of
the IEEE , vol., no., pp.7219,7222, Aug. 30 2011-Sept. 3 2011.
[5] Shrimali, V., Anand, R.S., Kumar, V., "Improved segmentation of ultrasound images for fetal
biometry, using morphological operators," Engineering in Medicine and Biology Society, 2009.
EMBC 2009. Annual International Conference of the IEEE , vol., no., pp.459,462, 3-6 Sept. 2009
[6] Tien Dung Nguyen, Sang Hyun Kim, Kim Nam Chul, "Surface Extraction Using SVM-Based
Texture Classification for 3D Fetal Ultrasound Imaging," Communications and Electronics, 2006.
ICCE '06. First International Conference on , vol.,no., pp.285,290, 10-11 Oct. 2006.
[7] Bibin, L., Anquez, J., de la Plata Alcalde, J.P., Boubekeur, T., Angelini, E.D., Bloch, I. "Whole-
body pregnant woman modeling by digital geometry processing with detailed uterofetal unit based
on medical images,"Biomedical Engineering, IEEE Transactions on , vol.57, no.10, pp.2346,2358,
Oct. 2010
[8] Mylonas, G.P., Giataganas, P., Chaudery, M., Vitiello, V., Darzi, A., Guang-Zhong Yang,
"Autonomous eFAST ultrasound scanning by a robotic manipulator using learning from
demonstrations," Intelligent Robots and Systems (IROS), 2013 IEEE/RSJ International Conference
on , vol., no., pp.3251,3256, 3-7 Nov. 2013
[9] Caroline N., Krupa, Alexandre, "Improving ultrasound intensity-based visual servoing: Tracking
and positioning tasks with 2D and bi-plane probes," Intelligent Robots and Systems (IROS), 2011
IEEE/RSJ International Conference on , vol., no., pp.2837,2842, 25-30 Sept. 2011
Page 28
M. Anwar Ma’sum, Wisnu Jatmiko, Budi Wiweko and Anom Bowolaksono, AUTOMATIC FETAL ORGANS DETECTION AND APPROXIMATION IN ULTRASOUND IMAGE
747
[10] Ito, K.., Sugano, S., Iwata, H., "Internal bleeding detection algorithm based on determination of
organ boundary by low-brightness set analysis," Intelligent Robots and Systems (IROS), 2012
IEEE/RSJ International Conference on , vol., no., pp.4131,4136, 7-12 Oct. 2012.
[11] Satwika, I.P., Tawakal, M.I., Imaduddin, Z., Jatmiko, W., "Efficient incomplete ellipse detection
based on minor axis for ultrasound fetal head approximation," Advanced Computer Science and
Information Systems (ICACSIS), 2012 International Conference on , vol., no., pp.191,195, 1-2
Dec. 2012
[12] Schapire, R. E., & Singer, Y., "Improved boosting algorithms using confidence-rated predictions,"
Machine Learning,37, pp. 297-336. 1999.
[13] Freund, Y., & Schapire, R. E., "A decision-theoretic generalization of on-line learning and an
application to boosting".Journal of Computer and System Sciences,55, pp.119,139. 1997.
[14] Fumera, G., Roli, F. "A theoretical and experimental analysis of linear combiners for multiple
classifier systems," Pattern Analysis and Machine Intelligence, IEEE Transactions on , vol.27,
no.6, pp.942-956, June 2005
[1]. Ma’sum, M.A., Jatmiko W., Tawakal M.I., and Afif F.A. "Automated Fetal Organ Detection And
Approximation in Ultrasound Images using Boosting Classifier and Hough Transform." Advanced
Computer Science and Information Systems (ICACSIS), 2014 International Conference on ,vol.,
no., pp.455-461, 18-19 Oct. 2014
[15] Rahmatullah R., Ma’sum, M. A., Aprinaldi1, Mursanto P., and Wiweko B. "Automatic Fetal
Organs Segmentation Using Multilayer Super Pixel and Image Moment Feature." Advanced
Computer Science and Information Systems (ICACSIS), 2014 International Conference on , vol.,
no., pp.415-421, 18-19 Oct. 2014
[16] Satwika, I.P., Habibie, I., Ma’sum, M.A., Febrian, A., and Budianto, E. "Particle Swarm
Optimation based 2-Dimensional Randomized Hough Transform for Fetal Head Biometry
Detection and Approximation in Ultrasound Imaging." Advanced Computer Science and
Information Systems (ICACSIS), 2014 International Conference on ,pp.463-468, 18-19 Oct. 2014
[17] Isa, Sani Muhamad, et al. "Performance Analysis of ECG Signal Compression using SPIHT."
International Journal On Smart Sensing And Intelligent Systems 6.5 (2013): 2011-2039.
[18] Imah, Elly Matul, Wisnu Jatmiko, and T. Basaruddin. "Electrocardiogram for Biometrics by using
Adaptive Multilayer Generalized Learning Vector Quantization (AMGLVQ): Integrating Feature
Page 29
INTERNATIONAL JOURNAL ON SMART SENSING AND INTELLIGENT SYSTEM VOL. 8. NO. 1, MARCH 2015
748
Extraction and Classification." International Journal on Smart Sensing and Intelligent Systems 6.5
(2013) : 1891-1917
[19] P. Viola and M. Jones, “Rapid object detection using a boosted cascade of simple features,” in
IEEE Computer Society Conference on Computer Vision and Pattern Recognition (CVPR), vol. 1,
pp. 511–518. December 2001.
[20] Ahonen, T., Hadid, A., and Pietikainen, M. Face Recognition with Local Binary Patterns.
Computer Vision – ECCV 2004 (2004), 469–481.
[21] R. McLaughlin, "Randomized Hough Transform: Improved Ellipse Detection with Comparition,"
Pattern Recognition Letters, vol. 19, no. 3-4, pp. 299-305, 1998.
[22] M. Nixon and A. Aguado, “Feature Extraction & Image Pocessing Second Edition”. London:
Elsevier Ltd. 2008.
[23] Bradski, G., & Kaehler, “Learning OpenCV: Computer vision with the OpenCV library”. O'reilly.
2008
[24] Benbouzid, D., Busa-Fekete, R., Casagrande, N., Collin, F. D., & Kégl, B. "MultiBoost: a multi-
purpose boosting package". The Journal of Machine Learning Research, 13, pp 549-553. 2012.
[25] N. K. Suryadevara and S. C. Mukhopadhyay, “Determining Wellness Through An Ambient
Assisted Living Environment”, IEEE Intelligent Systems, May/June 2014, pp. 30-37.
[26] Kégl, B., & Busa-Fekete, R. "Boosting products of base classifiers". In Proceedings of the 26th
Annual International Conference on Machine Learning (pp. 497-504). June 2009
[27] Xiang, Liu et all . "Research of Improved LVQ Neural Network by Adaboost Algorithm" Journal
of Applied Science 13 (14) pp. 2658-2663. 2013.