Automatic Layer Generation for Scar Transmurality Visualization S. Reiml 1,4 , T. Kurzendorfer 1,4 , D. Toth 2,5 , P. Mountney 6 , M. Panayiotou 2 , J. M. Behar 2,3 , C. A. Rinaldi 2,3 , K. Rhode 2 , A. Maier 1 and A. Brost 4 1 Pattern Recognition Lab, Friedrich-Alexander-University Erlangen-Nuremberg, Germany 2 Department of Biomedical Engineering, King’s College London, United Kingdom 3 Department of Cardiology, Guy’s and St. Thomas’ NHS Foundation Trust 4 Siemens Healthcare GmbH, Forchheim, Germany 5 Siemens Healthcare Ltd, London, United Kingdom 6 Medical Imaging Technologies, Siemens Healthcare, Princeton, NJ [email protected]Abstract. In 2014, about 26 million people were suffering from heart failure. Symptomatic heart failure is treated by cardiac resynchroniza- tion therapy. However, 30 % to 50 % do not clinically respond after the implantation of a biventricular pacemaker. To improve the success rate, the quantification of a patient’s scar burden is very important. Late- gadolinium-enhanced magnetic resonance imaging is used to visualize regions of scarring in the left ventricle. Scar is very hard to visualize and interpret in 3-D. To solve this, an automated scar layer generation method is proposed. The scar is divided into layers and an interactive scrolling is provided. This method allows for precise treatment planning. With the scar layer visualization, eight clinical experts were asked to decide if the scar is epicardial or endocardial. The correct location was identified in 93.75 % of the cases using the scar layer visualization. 1 Introduction Heart failure affected in 2014 about 26 million people worldwide [1]. Symp- tomatic heart failure is often treated by cardiac resynchronization therapy (CRT). Patients eligible for CRT undergo a minimally invasive procedure for implanta- tion of a biventricular pacemaker, often called CRT device [2]. The localisation and quantification of scar tissue in the myocardium of the left ventricle (LV) is crucial to increase the success rate of CRT [3, 4]. However, the myocardial scar distribution can be challenging to interpret, in particular the transmurality. Transmurality is present when the scar extends from the en- docardium to the epicardium. The problem in CRT is that about 30 % to 50 % of the patients do not respond clinically [5]. One of the main reasons of non response is considered to be suboptimal placement of the left ventricular pacing lead. Pacing in areas of myocardial infarction has less effect, because scar tissue is not electrical conductive. To improve the success rate, precise scar information is required for choosing the optimal pacing location.
Transcript
Automatic Layer Generation for ScarTransmurality Visualization
S. Reiml1,4, T. Kurzendorfer1,4, D. Toth2,5, P. Mountney6, M. Panayiotou2,J. M. Behar2,3, C. A. Rinaldi2,3, K. Rhode2, A. Maier1 and A. Brost4
Abstract. In 2014, about 26 million people were suffering from heartfailure. Symptomatic heart failure is treated by cardiac resynchroniza-tion therapy. However, 30 % to 50 % do not clinically respond after theimplantation of a biventricular pacemaker. To improve the success rate,the quantification of a patient’s scar burden is very important. Late-gadolinium-enhanced magnetic resonance imaging is used to visualizeregions of scarring in the left ventricle. Scar is very hard to visualizeand interpret in 3-D. To solve this, an automated scar layer generationmethod is proposed. The scar is divided into layers and an interactivescrolling is provided. This method allows for precise treatment planning.With the scar layer visualization, eight clinical experts were asked todecide if the scar is epicardial or endocardial. The correct location wasidentified in 93.75 % of the cases using the scar layer visualization.
1 Introduction
Heart failure affected in 2014 about 26 million people worldwide [1]. Symp-tomatic heart failure is often treated by cardiac resynchronization therapy (CRT).Patients eligible for CRT undergo a minimally invasive procedure for implanta-tion of a biventricular pacemaker, often called CRT device [2].
The localisation and quantification of scar tissue in the myocardium of theleft ventricle (LV) is crucial to increase the success rate of CRT [3, 4]. However,the myocardial scar distribution can be challenging to interpret, in particularthe transmurality. Transmurality is present when the scar extends from the en-docardium to the epicardium. The problem in CRT is that about 30 % to 50 %of the patients do not respond clinically [5]. One of the main reasons of nonresponse is considered to be suboptimal placement of the left ventricular pacinglead. Pacing in areas of myocardial infarction has less effect, because scar tissueis not electrical conductive. To improve the success rate, precise scar informationis required for choosing the optimal pacing location.
2 Reiml et al.
(a) (b) (c) (d)
Fig. 1. (a) 2-D visualization of the scar transmurality in a bull’s eye plot. (b) 3-D meshvisualization with the left ventricle’s endocardium (dark red) and the 3-D scar distribu-tion (light purple). (c) 2-D short axis Cine image of the LV for anatomy segmentation.(d) 2-D short axis LGE image of the LV for scar tissue quantification.
The state-of-the-art for assessing the viability of the myocardium is late-gadolinium-enhanced magnetic resonance imaging (LGE-MRI). The anatomy issegmented from Cine MRIs, where the contours of the myocardium are moreclearly visible compared to the LGE-MRI scan [6]. Most methods available con-sider a semi-automatic approach for scar segmentation [7, 9].
Currently, there are two methods for the visualization of scar transmurality.The first method is the mapping of scar information to a so-called bull’s eye plot(BEP), as shown Fig. 1 (a). Scar transmurality is presented as percentage foreach segment of the BEP. The drawbacks of this approach are the non-anatomicalvisualization of the LV as a BEP and the missing information about the scar’slocation within the myocardium. Furthermore, no 3-D guidance is possible. Thesecond method is to visualize the scar as a 3-D mesh, see Fig. 1 (b). The advan-tage of this approach is the 3-D anatomical visualization. The disadvantage ofthis method is that there is no information about scar transmurality.
While Reiml et al. showed different scar visualization methods [8], in thiswork a novel method for 3-D scar layer generation is presented. We propose aninteractive 3-D scar location and transmurality visualization method.
2 Scar Layer Generation
In this section, the interactive visualization technique for 3-D scar transmuralityis described. The main method consists of five steps, as depicted in Fig. 2.
MRI Segmentation: In the first step, the endocardium and epicardium aresegmented from anatomical MRI scans. After the delineation of the myocardium,the anatomical scan is registered to the LGE-MRI, which is used for the seg-mentation of the scar tissue [7]. This tissue is segmented using a semi automaticapproach [9]. Examples of Cine MRI and LGE-MRI are depicted in Fig. 1(c, d).The output of the segmentation is a mask containing the blood pool, the my-ocardium and the information about the myocardial scar, see Fig. 2 second boxfor a single slice.
Automatic Scar Layer Generation 3
MRISegmentation
AnatomyDelineation
LayerComputation
Scar LayerExtraction
MeshGeneration
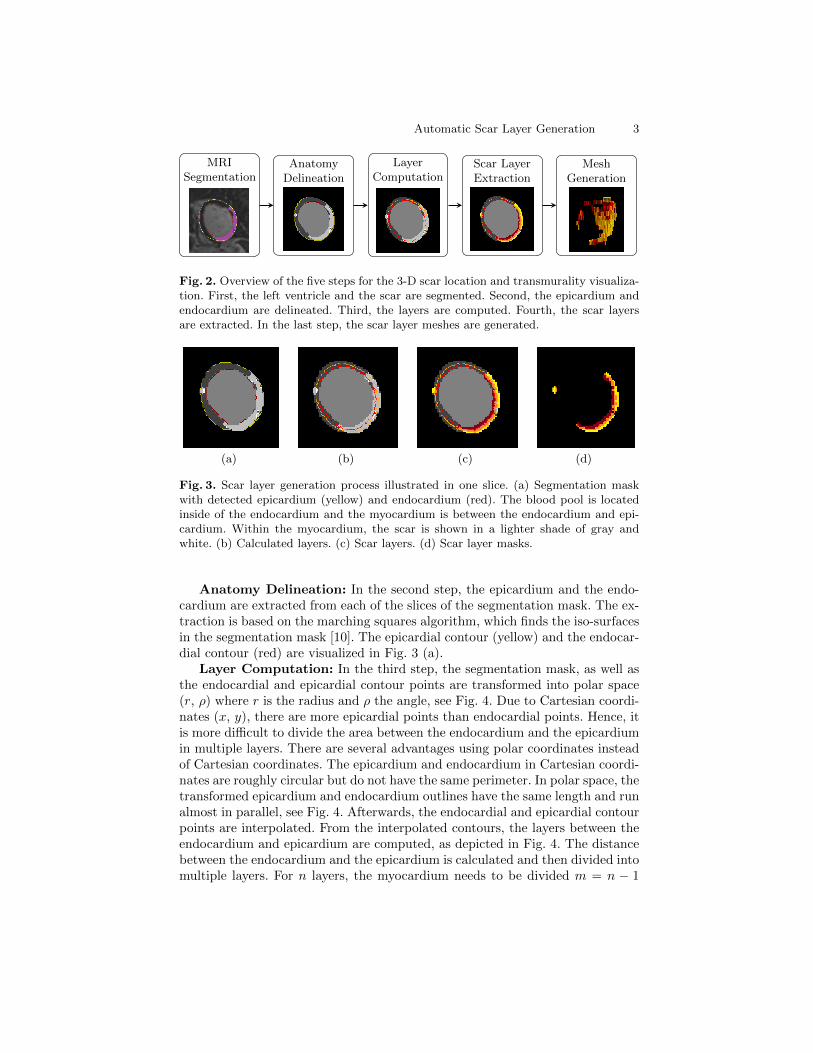
Fig. 2. Overview of the five steps for the 3-D scar location and transmurality visualiza-tion. First, the left ventricle and the scar are segmented. Second, the epicardium andendocardium are delineated. Third, the layers are computed. Fourth, the scar layersare extracted. In the last step, the scar layer meshes are generated.
(a) (b) (c) (d)
Fig. 3. Scar layer generation process illustrated in one slice. (a) Segmentation maskwith detected epicardium (yellow) and endocardium (red). The blood pool is locatedinside of the endocardium and the myocardium is between the endocardium and epi-cardium. Within the myocardium, the scar is shown in a lighter shade of gray andwhite. (b) Calculated layers. (c) Scar layers. (d) Scar layer masks.
Anatomy Delineation: In the second step, the epicardium and the endo-cardium are extracted from each of the slices of the segmentation mask. The ex-traction is based on the marching squares algorithm, which finds the iso-surfacesin the segmentation mask [10]. The epicardial contour (yellow) and the endocar-dial contour (red) are visualized in Fig. 3 (a).
Layer Computation: In the third step, the segmentation mask, as well asthe endocardial and epicardial contour points are transformed into polar space(r, ρ) where r is the radius and ρ the angle, see Fig. 4. Due to Cartesian coordi-nates (x, y), there are more epicardial points than endocardial points. Hence, itis more difficult to divide the area between the endocardium and the epicardiumin multiple layers. There are several advantages using polar coordinates insteadof Cartesian coordinates. The epicardium and endocardium in Cartesian coordi-nates are roughly circular but do not have the same perimeter. In polar space, thetransformed epicardium and endocardium outlines have the same length and runalmost in parallel, see Fig. 4. Afterwards, the endocardial and epicardial contourpoints are interpolated. From the interpolated contours, the layers between theendocardium and epicardium are computed, as depicted in Fig. 4. The distancebetween the endocardium and the epicardium is calculated and then divided intomultiple layers. For n layers, the myocardium needs to be divided m = n − 1
4 Reiml et al.
Fig. 4. Transformed mask image into polar space with computed layers (red and or-ange) between the endocardium and epicardium.
(a) (b) (c) (d) (e)
Fig. 5. (a) Endocardium (dark red) with one scar mesh in purple. (b) Endocardiumwith three scar layers. (c) Endocardium with two scar layers. (d) Endocardium withone scar layer. (e) Fluoroscopic image with overlaid endocardium and 3-D scar layers.
times. For each angle ρ, m values within the myocardium are calculated. Af-ter the delineation of the n layers in polar space, they are transformed back toCartesian coordinates, see Fig. 3 (b-d). In this work, the number of layers isset to three. For the placement of the lead, it is useful to have an epicardial, amid-myocardial and an endocardial layer to decide where the scar is located.
Scar Layer Extraction: In the fourth step, the previously defined layersand the scar mask are compared using logical operations. For three scar layers,the myocardium was divided twice, as depicted in Fig. 3 (b). The first defined lineis next to the endocardium and the second defined line is close to the epicardium.The first filled layer L1 is defined as the area within the first subdivision layer.The second filled layer L2 is defined as the area within the second subdivisionline. The third layer L3 is the area within the epicardium. Then the filled layersare logically compared with the scar mask S and the three individual scar layermasks S1, S2 and S3, where S1 = L1∧S, S2 = L1∧L2∧S and S3 = L1∧L2∧L3∧Sare obtained. The result is depicted in Fig. 3 (c, d).
Mesh Generation: The final step is to extend the 3-D scar mask with theslice thickness, as just a limited number of slices are available. The scar contoursare extracted as 3-D surface meshes using the marching cubes algorithm [10].The image coordinates are transformed to patient coordinates to position thescar layers at the same position as the original scar mesh, see Fig. 5 for anexample.
3 Visualization
In this section, two visualization methods are proposed.
Automatic Scar Layer Generation 5
Interactive Scrolling: The subdivision of the scar mesh into several scarlayers enables an interactive peeling of the scar in 3-D. It can be scrolled fromepicardium to endocardium and vice versa as depicted in Fig. 5 (b-d). The in-teractive adding and removing of the scar layers allows for a good localization,where the scar starts and ends, as well as an assessment of transmurality. If thescar is fully transmural, all scar layers are add up.
Overlay: The 3-D scar layers can be overlaid onto fluoroscopic images, asdepicted in Fig. 5 (d). This visualization method can be used during the in-tervention. For the overlay, the epicardial mesh of the LV is registered to thefluoroscopic image. Then, the epicardium, the endocardium, the scar mesh andthe scar layers can be visualized in different colors. The colors and opacity canbe adapted manually. Meshes, which the physician is not interested in, can behidden. This supports the physician during the intervention, as only the requiredand important information is visible.
4 Evaluation and Results
The scar layer visualization was evaluated using seven clinical data sets, ac-quired with a Siemens MAGNETOM Aera 1.5T scanner (Siemens HealthcareGmbH, Erlangen). For the evaluation, two tests are created. In the first test,nine physicians are shown four cases. For each case, two visualization methodsare presented: the segmented LV overlaid with the 3-D scar mesh and the seg-mented LV overlaid with the scar layer visualization. They are asked to decidewhich visualization method they would prefer. In 80.55 % cases, the clinical ex-perts prefer the scar layer visualization, in 16.67 % cases they prefer the 3-D scarmesh and in 2.78 % cases they do not have a preference.
In the second test, eight physicians are shown six 3-D scar meshes and sixscar layer meshes. For each visualization method, they should decide if the scaris epicardial or endocardial. The results are shown in Table 1. These two ex-periments show, that with the scar layer visualization, the clinicians can easilychoose an optimal lead placement location as they can decide whether the scaris epicardial or endocardial.
5 Discussion and Conclusion
In this paper, a novel method for interactive visualization of the scar informa-tion is presented. In CRT, the lead of the electrode is commonly placed on theepicardium. Precise information about the location and transmurality of the scaris needed, as it is electrically almost non-conductive. The results show that theclinicians could easier decide about the scar location. The precise control overhow the scar transmurality is visualized in 3-D allows the user to see the scar lo-cation to the extent of transmurality. An interactive scrolling through scar layersis realized, such that scar layers are added or removed from the visualization.The epicardium and the scar meshes can be further overlaid onto fluoroscopicimages. The overlay of the meshes can be used to guide an intervention.
6 Reiml et al.
3-D Scar Mesh Scar Layer Meshes
Correct 18.75 % 93.75 %
Wrong 6.25 % 6.25 %
No Determination 75.00 % 0.00 %
Table 1. Evaluation with eight clinical experts and twelve scar meshes. They shoulddecide for each mesh if the scar is epicardial, endocardial or they could not determine.
Acknowledgements and Disclaimer: The authors are grateful for the support from the Innovate UK grant 32684-234174. The research was supported by the National Institute for Health Research (NIHR) Biomedical ResearchCentre based at Guy’s and St. Thomas’ NHS Foundation Trust and King’s College London. The views expressedare those of the authors and not necessarily those of the NHS, NIHR or the Department of Health. Concepts andinformation presented are based on research and are not commercially available.
References
1. Ponikowski P, Anker SD, AlHabib KF, Cowie MR, Force TL, Hu S, et al. Heart fail-ure: preventing disease and death worldwide. ESC Heart Failure. 2014 sep;1(1):4–25.
3. Kurzendorfer T, Brost A, Forman C, Schmidt M, Tillmanns C, Hornegger J. Semi-Automatic Segmentation and Scar Quantification of the Left Ventricle in 3-D LateGadolinium Enhanced MRI. In: 32nd Annual Scientific Meeting of the ESMRMB;2015. p. 318–319.
4. Cochet H, Denis A, Ploux S, Lumens J, Amraoui S, Derval N, et al. Pre-andIntra-Procedural Predictors of Reverse Remodeling After Cardiac Resynchroniza-tion Therapy: An MRI Study. Journal of Cardiovascular Electrophysiology. 2013jun;24(6):682–691.
5. Daubert JC, Saxon L, Adamson PB, Auricchio A, Berger RD, Beshai JF, et al. 2012EHRA/HRS expert consensus statement on cardiac resynchronization therapy inheart failure: implant and follow-up recommendations and management. Europace.2012 jun;14(9):1236–1286.
6. Tao Q, Piers SR, Lamb HJ, van der Geest RJ. Automated Left Ventricle Segmenta-tion in Late Gadolinium-Enhanced MRI for Objective Myocardial Scar Assessment.Journal of Magnetic Resonance Imaging. 2014 nov;42(2):390–399.
7. Jolly MP, Xue H, Grady L, Guehring J. Combining Registration and MinimumSurfaces for the Segmentation of the Left Ventricle in Cardiac Cine MR Images.In: Medical Image Computing and Computer-Assisted Intervention–MICCAI 2009.Springer; 2009. p. 910–918.
8. Reiml S, Toth D, Panayiotou M, Fahn B, Karim R, Behar JM, et al. InteractiveVisualization for Scar Transmurality in Cardiac Resynchronization Therapy. In:SPIE Medical Imaging. vol. 9786; 2016. p. 97862S–97862S–8.
9. Karim R, Bhagirath P, Claus P, Housden RJ, Chen Z, Karimaghaloo Z, et al. Eval-uation of state-of-the-art segmentation algorithms for left ventricle infarct from lateGadolinium enhancement MR images. Medical Image Analysis. 2016 may;30:95–107.
10. Lorensen W, Cline H. Marching Cubes: A High Resolution 3D Surface ConstructionAlgorithm. CM Siggraph Computer Graphics. 1987 jul;21:163–169.


![Cesarean Scar Pregnancy Profile and Therapeutic Outcome ... · the myometrial layer and implant on a Caesarean scar [5]. A Caesarean scar pregnancy is, however, Research Article.](https://static.documents.pub/doc/80x56/6020b3f42a03761d1f7702d9/cesarean-scar-pregnancy-profile-and-therapeutic-outcome-the-myometrial-layer.jpg)


