Page 1
Corresponding author: Paolo Melillo. [email protected] 2014, Dubrovnik, Croatia, 7-11 September 2014
AHP
Automatic prediction of vascular events
by Heart Rate Variability analysis
in hypertensive patientsP. Melillo1, P. Scala1, N. De Luca2, L. Pecchia1,3
1 SHARE Project, Italy2 University of Naples, Italy3 University of Warwick, The United Kingdom
[email protected]
Page 2
AHP
Corresponding author: Paolo Melillo. [email protected] 2014, Dubrovnik, Croatia, 7-11 September 2014
2/12
INTRODUCTION
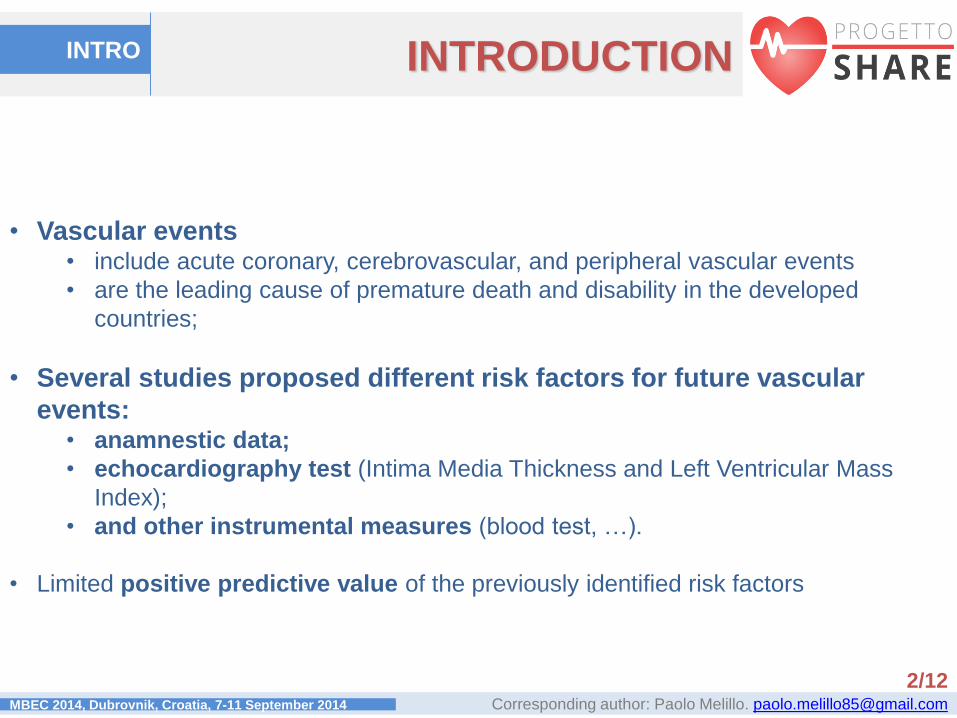
• Vascular events• include acute coronary, cerebrovascular, and peripheral vascular events
• are the leading cause of premature death and disability in the developed
countries;
• Several studies proposed different risk factors for future vascular
events:• anamnestic data;
• echocardiography test (Intima Media Thickness and Left Ventricular Mass
Index);
• and other instrumental measures (blood test, …).
• Limited positive predictive value of the previously identified risk factors
INTRO
Page 3
AHP
Corresponding author: Paolo Melillo. [email protected] 2014, Dubrovnik, Croatia, 7-11 September 2014
3/12
GOALS
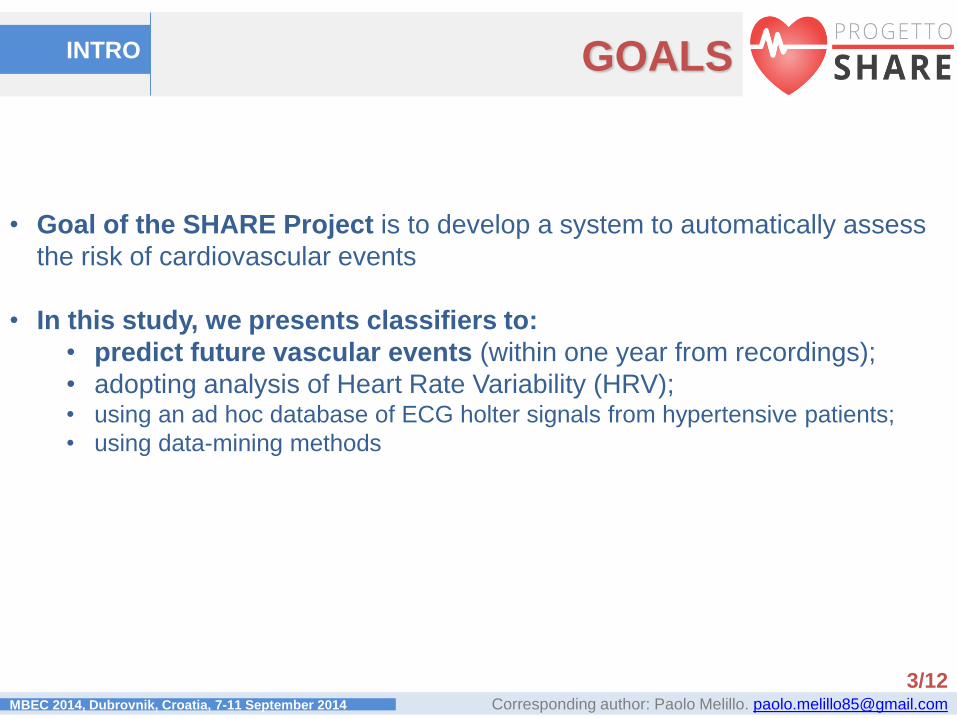
• Goal of the SHARE Project is to develop a system to automatically assess
the risk of cardiovascular events
• In this study, we presents classifiers to:
• predict future vascular events (within one year from recordings);
• adopting analysis of Heart Rate Variability (HRV);• using an ad hoc database of ECG holter signals from hypertensive patients;
• using data-mining methods
INTRO
Page 4
AHP
Corresponding author: Paolo Melillo. [email protected] 2014, Dubrovnik, Croatia, 7-11 September 2014
4/12
SAMPLE DATA and HRVMETHODS
• Ad hoc database of hypertensive patients:
• 142 subject aged 55 and over (1 year follow-up)
• 17 experienced a major vascular event
• 125 free of vascular event
• HRV linear and non-linear analysis
Page 5
AHP
Corresponding author: Paolo Melillo. [email protected] 2014, Dubrovnik, Croatia, 7-11 September 2014
5/12
FEATURE SELECTION AND
CLASSIFICATIONMETHODS
• Long-term recording (concurrent analysis of all 30-minute segments)
• Principal Component Analysis to extract the most informative features
• RUSBoost, hybrid classification method (Undersampling and Boosting)
to handle unbalanced dataset
• subject-based ROC curve analysis and 10-fold person-independent
crossvalidation to estimate performance:
• accuracy (ACC);
• sensitivity (SEN);
• specificity (SPE);
• area under the curve (AUC).
Page 6
AHP
Corresponding author: Paolo Melillo. [email protected] 2014, Dubrovnik, Croatia, 7-11 September 2014
6/12
FEATURE SELECTION AND
CLASSIFICATIONMETHODS
• Short-term recording (analysis of a 30-minute randomly chosen segment)
• Oversamplig (SMOTE) to handle small and unbalanced dataset
• Comparison of different data-miming approach:
• Naïve Bayes classifier (NB);
• Classification tree C4.5;
• Random Forest (RF);
• AdaBoost (AB);
• Support Vector Machine (SVM);
• Multilayer perceptron (MLP).
• ROC curve and 10-fold crossvalidation to estimate performance:
• area under the curve (AUC);
• accuracy (ACC);
• sensitivity (SEN);
• specificity (SPE).
Page 7
AHP
Corresponding author: Paolo Melillo. [email protected] 2014, Dubrovnik, Croatia, 7-11 September 2014
CLINICAL FEATURES
OF THE STUDY SAMPLERESULTS
Measures Low-risk subjects High-risk subjects
Age (years) 71.4±7 74.1±6.5
Sex (female) 41 (33.6) 8 (47.1)
Family history of hypertension 41 (33.6) 7 (41.2)
Family history of stroke 10 (8.2) 3 (17.6)
Smoking 35 (28.7) 5 (29.4)
Diabetes 18 (14.8) 3 (17.6)
Diastolic Blood Pressure (mmHg) 76.3±9.1 73.5±8.4
Systolic Blood Pressure (mmHg) 136.6±19.5 141.7±23.5
Total Cholesterol (mg/dl) 175.7±35.1 182.9±42.7
IMT (mm) 2.3±0.7 2.4±1.1
LVMi (g/m2) 130.1±26.1 140.2±25.1
EF () 59.3±10.9 57.8±13
7/12
No significant differences in the baseline clinical features
Page 8
AHP
Corresponding author: Paolo Melillo. [email protected] 2014, Dubrovnik, Croatia, 7-11 September 2014
CLASSIFICATION
PERFORMANCERESULTS
8/12
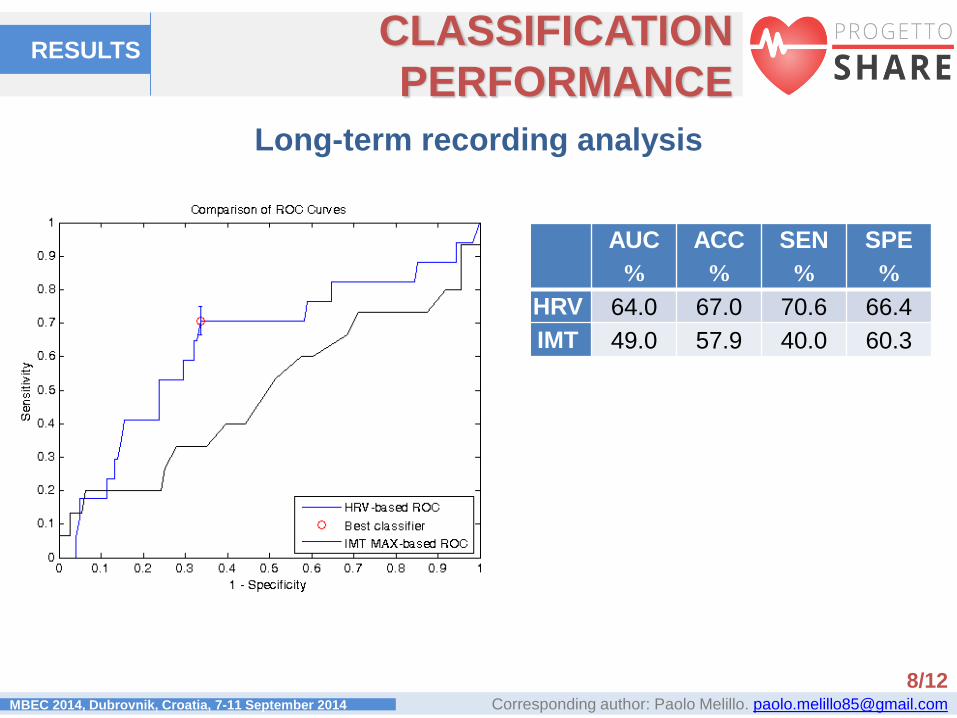
Long-term recording analysis
AUC
%
ACC
%
SEN
%
SPE
%
HRV 64.0 67.0 70.6 66.4
IMT 49.0 57.9 40.0 60.3
Page 9
AHP
Corresponding author: Paolo Melillo. [email protected] 2014, Dubrovnik, Croatia, 7-11 September 2014
CLASSIFICATION
PERFORMANCERESULTS
9/12
Short-term recording analysis
AUC
%
ACC
%
SEN
%
SPE
%
MLP 95.4 90.2 94.1 88.0
RF 94.6 89.1 83.8 92.0
AB 90.9 87.0 77.9 92.0
NF 87.5 78.2 88.2 72.8
SVM 83.2 83.4 82.4 84.0
C4.5 80.8 78.8 60.3 88.8
LVMi 63.5 69.5 41.2 73.9
IMT 49.0 57.9 40.0 60.3
Melillo et al, Plos One, under revision
Page 10
AHP
Corresponding author: Paolo Melillo. [email protected] 2014, Dubrovnik, Croatia, 7-11 September 2014
CLASSIFICATION MODELRESULTS
10/12
Short-term
recording analysis
Depressed HRV associated with High-Risk classification
HFLO>0.031 s
Low Risk
Classification
YES
α2>0.997
NO
Low Risk
Classification
YES
NO
LFnLO>45.1%
Low Risk
Classification
YES
High Risk
Classification
YESNO
Low Risk
Classification
NO
LFpeakLO>0.07
Hz
Melillo et al, Plos One, under revision
Page 11
AHP
Corresponding author: Paolo Melillo. [email protected] 2014, Dubrovnik, Croatia, 7-11 September 2014
11/12
DISCUSSIONS
• Good results in automatic risk assessment of future vascular events
• Most previous studies focused on risk factors and not on predictive
models;
• Few study focusing on HRV prediction of cardiac mortality in patients
after acute events (acute coronary syndrome, acute myocardial
infarction)
• LVM and IMT are considered as powerful predictors of vascular events;
• HRV-based classifiers showed better prognostic capacity compared with
LVM and IMT
• Limits of this study:
• Small sample size (no independent dataset for model selection
evaluation)
• Short follow-up length (twelve months)
• Singh A and Guttag JV (2011) A comparison of non-symmetric entropy-based classification trees and support vector
machine for cardiovascular risk stratification. Engineering in Medicine and Biology Society,EMBC, 2011 Annual
International Conference of the IEEE. pp. 79-82.
• Song T, Qu XF, Zhang YT, Cao W, Han BH, et al. (2014) Usefulness of the heart-rate variability complex for predicting
cardiac mortality after acute myocardial infarction. BMC Cardiovascular Disorders 14: 59.
DISCUSSIONS
Page 12
AHP
Corresponding author: Paolo Melillo. [email protected] 2014, Dubrovnik, Croatia, 7-11 September 2014
12/12
CONCLUSIONS
• We developed a risk assessment system for future vascular events
within 12 months from the recording
• completely automatic;
• using HRV analysis;
• based on data-mining methods including intelligible model (i.e.
classification tree / if-then rules).
• Further developments:
• Larger dataset
• Longer follow-up period
• New / other HRV indexes (i.e. point process time-frequency analysis)
• Other non-invasive measurement
• Integration in a web application (SHARE project web portal)
CONCLUSION
Page 13
AHP
Corresponding author: Paolo Melillo. [email protected] 2014, Dubrovnik, Croatia, 7-11 September 2014
Thank you!Dr. Paolo Melillo
PI SHARE Project
[email protected]