Automatic processing, quality assurance and serving of real-time weather data Matthew Williams , Dan Cornford, Lucy Bastin, Richard Jones, Stephen Parker Knowledge Engineering Group, Aston University, Birmingham, B4 7ET, UK article info Article history: Received 6 October 2009 Received in revised form 5 May 2010 Accepted 20 May 2010 Available online 13 October 2010 Keywords: User-contributed data UncertML INTAMAP Data quality Interpolation abstract Recent advances in technology have produced a significant increase in the availability of free sensor data over the Internet. With affordable weather monitoring stations now available to individual meteorology enthusiasts, a reservoir of real time data such as temperature, rainfall and wind speed can now be obtained for most of the world. Despite the abundance of available data, the production of usable information about the weather in individual local neighbourhoods requires complex processing that poses several challenges. This paper discusses a collection of technologies and applications that harvest, refine and process this data, culminating in information that has been tailored toward the user. In this instance, this allows a user to make direct queries about the weather at any location, even when this is not directly instrumented, using interpolation methods provided by the INTAMAP project. A simplified example illustrates how the INTAMAP web processing service can be employed as part of a quality control procedure to estimate the bias and residual variance of user contributed temperature observations, using a reference standard based on temperature observations with carefully controlled quality. We also consider how the uncertainty introduced by the interpolation can be communicated to the user of the system, using UncertML, a developing standard for uncertainty representation. & 2010 Elsevier Ltd. All rights reserved. 1. Introduction The term ‘mashup’ in Web development refers to the combina- tion of different services and data into a single integrated tool. This paper discusses a mashup in which weather data from hundreds of individual sensors is harvested, refined and processed using several interoperable standards, to provide information that has been customised to a user’s requirements. To support the practical use of this data, streamlined interfaces have been developed that provide access for small footprint devices, e.g. mobile phones. The combi- nation of these technologies results in a tool capable of navigating seemingly complex data and providing answers to highly specific queries such as ‘‘What is the temperature in my garden right now?’’ and ‘‘Will the roads be icy on my way home?’’. Section 2 introduces the mashup architecture with an overview of the data flow. Section 3 details the harvesting process and the interface to the data. Section 4 notes the importance of uncertainty propagation through the system, and describes the methods and standards used to achieve this. Section 5 discusses the refining and processing stages that occur as part of the INTAMAP interpolation service. 1 Section 6 describes a technique used to estimate the uncertainty of the user-contributed data, using the INTAMAP service, and Section 7 gives more detail on client applications that use the framework to gather information that has been tailored for them. Finally, we gather conclusions and insights in Section 8. 2. Overview The system discussed in this paper provides access to user- contributed weather data through open standards. Wrapping Weather Underground data with an interoperable interface allows more structured access than presently available. The system also provides a mechanism for estimating the uncertainty and bias of the Weather Underground data; providing users with more detailed information. The interfaces used within the system employ the latest tech- nologies from the Open Geospatial Consortium (OGC). The OGC is a standards organisation that develops and maintains XML standards for geospatial services. Specifically, a Sensor Observation Service (SOS) (Na and Priest, 2007) interface provides an access layer to the underlying weather data. A SOS interface provides the basic create, update, retrieve and delete functionality, commonly associated with databases, for sensor-observed data. Data can be filtered spatially, temporally or by specific attribute values. The uncertainty estimation process is provided by the INTAMAP (INTerpolation and Automated MAPping) project. INTAMAP is a Web Processing Service (WPS) (Schut, 2007), providing near real-time interpolation Contents lists available at ScienceDirect journal homepage: www.elsevier.com/locate/cageo Computers & Geosciences 0098-3004/$ - see front matter & 2010 Elsevier Ltd. All rights reserved. doi:10.1016/j.cageo.2010.05.010 Corresponding author. E-mail address: [email protected] (M. Williams). 1 http://www.intamap.org Computers & Geosciences 37 (2011) 353–362
Transcript
Computers & Geosciences 37 (2011) 353–362
Contents lists available at ScienceDirect
Computers & Geosciences
0098-30
doi:10.1
� Corr
E-m1 ht
journal homepage: www.elsevier.com/locate/cageo
Automatic processing, quality assurance and serving of real-time weather data
Matthew Williams �, Dan Cornford, Lucy Bastin, Richard Jones, Stephen Parker
Knowledge Engineering Group, Aston University, Birmingham, B4 7ET, UK
a r t i c l e i n f o
Article history:
Received 6 October 2009
Received in revised form
5 May 2010
Accepted 20 May 2010Available online 13 October 2010
Recent advances in technology have produced a significant increase in the availability of free sensor data
over the Internet. With affordable weather monitoring stations now available to individual meteorology
enthusiasts, a reservoir of real time data such as temperature, rainfall and wind speed can now be
obtained for most of the world. Despite the abundance of available data, the production of usable
information about the weather in individual local neighbourhoods requires complex processing that
poses several challenges.
This paper discusses a collection of technologies and applications that harvest, refine and process this
data, culminating in information that has been tailored toward the user. In this instance, this allows a user
to make direct queries about the weather at any location, even when this is not directly instrumented,
using interpolation methods provided by the INTAMAP project. A simplified example illustrates how the
INTAMAP web processing service can be employed as part of a quality control procedure to estimate the
bias and residual variance of user contributed temperature observations, using a reference standard based
on temperature observations with carefully controlled quality. We also consider how the uncertainty
introduced by the interpolation can be communicated to the user of the system, using UncertML, a
developing standard for uncertainty representation.
& 2010 Elsevier Ltd. All rights reserved.
1. Introduction
The term ‘mashup’ in Web development refers to the combina-tion of different services and data into a single integrated tool. Thispaper discusses a mashup in which weather data from hundreds ofindividual sensors is harvested, refined and processed using severalinteroperable standards, to provide information that has beencustomised to a user’s requirements. To support the practical use ofthis data, streamlined interfaces have been developed that provideaccess for small footprint devices, e.g. mobile phones. The combi-nation of these technologies results in a tool capable of navigatingseemingly complex data and providing answers to highly specificqueries such as ‘‘What is the temperature in my garden right now?’’and ‘‘Will the roads be icy on my way home?’’.
Section 2 introduces the mashup architecture with an overviewof the data flow. Section 3 details the harvesting process and theinterface to the data. Section 4 notes the importance of uncertaintypropagation through the system, and describes the methods andstandards used to achieve this. Section 5 discusses the refining andprocessing stages that occur as part of the INTAMAP interpolationservice.1 Section 6 describes a technique used to estimate theuncertainty of the user-contributed data, using the INTAMAP
ll rights reserved.
s).
service, and Section 7 gives more detail on client applicationsthat use the framework to gather information that has beentailored for them. Finally, we gather conclusions and insights inSection 8.
2. Overview
The system discussed in this paper provides access to user-contributed weather data through open standards. WrappingWeather Underground data with an interoperable interface allowsmore structured access than presently available. The system alsoprovides a mechanism for estimating the uncertainty and biasof the Weather Underground data; providing users with moredetailed information.
The interfaces used within the system employ the latest tech-nologies from the Open Geospatial Consortium (OGC). The OGC is astandards organisation that develops and maintains XML standardsfor geospatial services. Specifically, a Sensor Observation Service(SOS) (Na and Priest, 2007) interface provides an access layer to theunderlying weather data. A SOS interface provides the basic create,update, retrieve and delete functionality, commonly associated withdatabases, for sensor-observed data. Data can be filtered spatially,temporally or by specific attribute values. The uncertaintyestimation process is provided by the INTAMAP (INTerpolationand Automated MAPping) project. INTAMAP is a Web ProcessingService (WPS) (Schut, 2007), providing near real-time interpolation
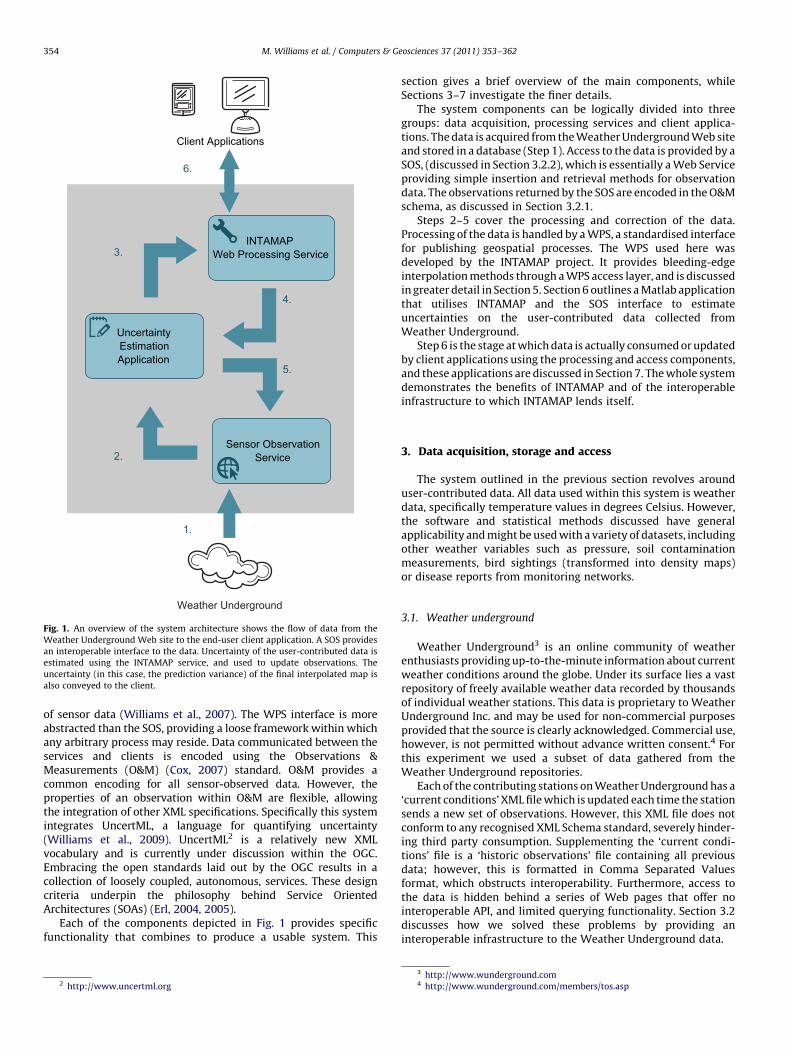
Fig. 1. An overview of the system architecture shows the flow of data from the
Weather Underground Web site to the end-user client application. A SOS provides
an interoperable interface to the data. Uncertainty of the user-contributed data is
estimated using the INTAMAP service, and used to update observations. The
uncertainty (in this case, the prediction variance) of the final interpolated map is
also conveyed to the client.
M. Williams et al. / Computers & Geosciences 37 (2011) 353–362354
of sensor data (Williams et al., 2007). The WPS interface is moreabstracted than the SOS, providing a loose framework within whichany arbitrary process may reside. Data communicated between theservices and clients is encoded using the Observations &Measurements (O&M) (Cox, 2007) standard. O&M provides acommon encoding for all sensor-observed data. However, theproperties of an observation within O&M are flexible, allowingthe integration of other XML specifications. Specifically this systemintegrates UncertML, a language for quantifying uncertainty(Williams et al., 2009). UncertML2 is a relatively new XMLvocabulary and is currently under discussion within the OGC.Embracing the open standards laid out by the OGC results in acollection of loosely coupled, autonomous, services. These designcriteria underpin the philosophy behind Service OrientedArchitectures (SOAs) (Erl, 2004, 2005).
Each of the components depicted in Fig. 1 provides specificfunctionality that combines to produce a usable system. This
2 http://www.uncertml.org
section gives a brief overview of the main components, whileSections 3–7 investigate the finer details.
The system components can be logically divided into threegroups: data acquisition, processing services and client applica-tions. The data is acquired from the Weather Underground Web siteand stored in a database (Step 1). Access to the data is provided by aSOS, (discussed in Section 3.2.2), which is essentially a Web Serviceproviding simple insertion and retrieval methods for observationdata. The observations returned by the SOS are encoded in the O&Mschema, as discussed in Section 3.2.1.
Steps 2–5 cover the processing and correction of the data.Processing of the data is handled by a WPS, a standardised interfacefor publishing geospatial processes. The WPS used here wasdeveloped by the INTAMAP project. It provides bleeding-edgeinterpolation methods through a WPS access layer, and is discussedin greater detail in Section 5. Section 6 outlines a Matlab applicationthat utilises INTAMAP and the SOS interface to estimateuncertainties on the user-contributed data collected fromWeather Underground.
Step 6 is the stage at which data is actually consumed or updatedby client applications using the processing and access components,and these applications are discussed in Section 7. The whole systemdemonstrates the benefits of INTAMAP and of the interoperableinfrastructure to which INTAMAP lends itself.
3. Data acquisition, storage and access
The system outlined in the previous section revolves arounduser-contributed data. All data used within this system is weatherdata, specifically temperature values in degrees Celsius. However,the software and statistical methods discussed have generalapplicability and might be used with a variety of datasets, includingother weather variables such as pressure, soil contaminationmeasurements, bird sightings (transformed into density maps)or disease reports from monitoring networks.
3.1. Weather underground
Weather Underground3 is an online community of weatherenthusiasts providing up-to-the-minute information about currentweather conditions around the globe. Under its surface lies a vastrepository of freely available weather data recorded by thousandsof individual weather stations. This data is proprietary to WeatherUnderground Inc. and may be used for non-commercial purposesprovided that the source is clearly acknowledged. Commercial use,however, is not permitted without advance written consent.4 Forthis experiment we used a subset of data gathered from theWeather Underground repositories.
Each of the contributing stations on Weather Underground has a‘current conditions’ XML file which is updated each time the stationsends a new set of observations. However, this XML file does notconform to any recognised XML Schema standard, severely hinder-ing third party consumption. Supplementing the ‘current condi-tions’ file is a ‘historic observations’ file containing all previousdata; however, this is formatted in Comma Separated Valuesformat, which obstructs interoperability. Furthermore, access tothe data is hidden behind a series of Web pages that offer nointeroperable API, and limited querying functionality. Section 3.2discusses how we solved these problems by providing aninteroperable infrastructure to the Weather Underground data.
M. Williams et al. / Computers & Geosciences 37 (2011) 353–362 355
While user-contributed data is vast in quantity, it may varydrastically in quality. Issues such as quality of sensing equipmentand location of sensor will affect the accuracy and precision of anyobserved values. Quantifying these uncertainties probabilisticallyallows more informed and sophisticated processing, for examplethrough a Bayesian framework (Gelman et al., 2003). WeatherUnderground currently does not provide any uncertaintyinformation with the observation data, and so Section 6 outlinesa technique for estimating these uncertainties using interpolation.The reference level for this technique is based on temperaturemeasurements from the UK’s Met Office,5 which have well-characterised uncertainty.
This section discusses solutions to several important issues withWeather Underground data, namely:
�
no recognised interoperable standard for describingobservation data, � no interoperable interface to query and access the data, and � no quantified uncertainty information.
These are issues which are likely to arise with many user-contributed data networks, so these solutions could be adapted tomany other contexts.
3.2.1. Observations and measurements
Weather Underground data does not conform to a recognisedXML standard, and is therefore cumbersome and difficult tointegrate into existing standards-compliant software. For thepurpose of the system outlined in Section 2, the Observations &Measurements (O&M) standard was adopted. O&M was developedand agreed by the OGC, and is a conceptual model and encodingfor describing observations (Cox, 2007). The conceptual modeloutlined in the O&M specification is perfectly suited to describingdata recorded at weather stations, and consequently is idealfor encoding data from the Weather Underground. The baseof the model can be broken down into a feature of interest,i.e. the observation target (which usually includes a geospatialcomponent), and an observed result. Further information iscaptured within other properties, some of which are detailedbelow:
observedProperty: The phenomenon for which the resultdescribes an estimate.
Procedure: A description of the process used to generate theresult, typically described using the Sensor Model Language (Bottsand Robin, 2007).
resultQuality: Quality information about the observed value.This is pertinent to the third issue outlined in Section 3.2.
Utilising the O&M language as a transportation device lays thefoundations of an interoperable weather data exchange platform.To build on these foundations we employ another OGC standard,the Sensor Observation Service.
3.2.2. Sensor observation service
With the standard closed interface, access to and subsequentprocessing of the Weather Underground data is difficult. Providingan open, XML-based, API opens up this wealth of information forconsumption by standards-compliant software. The Sensor Obser-vation Service (SOS) standard (Na and Priest, 2007) complementsO&M by providing a series of methods for accessing observationdata. The SOS is a Web Service which outputs requested
5 http://www.metoffice.gov.uk
observations in the form of an O&M instance document. Byutilising the OGC Filter encoding specification (Vretanos, 2005),complex queries can be performed, filtering by time, space, sensoror phenomenon.
The SOS employed in this system was built around the 52 NorthSOS implementation.6 Currently, no existing SOS implementationprovides the functionality to serve observations with attacheduncertainties. For the purposes of this system, therefore, wedeveloped an extension of the 52 North SOS that allowsuncertainty to be included in the SOS output through the use ofUncertML. This extension provides the functionality to describeobservation errors by a variety of means; as statistics (variance,standard deviation etc), as a set of quantiles, or as probabilitydistributions. The generated UncertML is inserted into the O&MresultQuality property. UncertML is discussed in detail in thefollowing section.
4. Propagating uncertainty through a series of interoperableservices
Uncertainty exists within all data measured by sensors, and themagnitude of this uncertainty increases greatly in the case of user-contributed data. Issues such as poor quality measuring equip-ment, ill-positioned sensors and observation operator errors allcontribute to unreliable measurements. Processing this datathrough models, such as interpolation, propagates these uncer-tainties, and this is a particularly important consideration in thecase of spatially referenced data, where recorded sensor locationmay also be unreliable Heuvelink (1998). In order to optimallyutilise any data (for example, within a decision making supporttool) users require as complete a numerical description of itsuncertainties as possible.
Traditionally, environmental models and decision support toolshave been implemented as tightly coupled, legacy softwaresystems (Rizzoli and Young, 1997). When migrating to a looselycoupled, interoperable framework, as discussed here, a languagefor describing and exchanging uncertainty is essential. UncertML, alanguage capable of describing and exchanging probabilisticrepresentations of uncertainty, was used throughout this system.
4.1. UncertML overview
UncertML is an XML language capable of quantifying uncer-tainty in the form of various statistics, probability distributions orseries of realisations. This section provides a brief overview ofUncertML; for a complete guide we refer the user to Williams et al.(2009).
All uncertainty types discussed here (e.g., the Statistic, theDistribution and the Realisations) inherit from theAbstractUncertaintyType element (Fig. 2). This allows alltypes to be interchanged freely, giving an abstract notion of‘uncertainty’, whether it be described by summary statistics,density functions or through a series of simulations. It should benoted that the scope of UncertML does not extend to issues coveredby other XML schemata including units of measure and the natureof the measured phenomena. This separation of concerns isdeliberate, and allows UncertML to describe uncertainty in abroad range of contexts.
4.1.1. Statistics
Most statistics are described using the Statistic type inUncertML. As with all types in UncertML, the Statistic
Fig. 2. An overview of the UncertML package dependencies.
M. Williams et al. / Computers & Geosciences 37 (2011) 353–362356
references a dictionary via the definition attribute. It is thissemantic link, combined with a value property, that enables asingle XML element to describe a host of different statistics. Listing1 shows an UncertML fragment describing the statistic ‘mode’.
Listing 1. A Statistic describing the mode value of a randomvariable.
UncertML also provides two aggregate statistic types. TheStatisticsRecord is used to group numerous different statisticsand the StatisticsArray is a concise method for encodingvalues of the same statistic type. Aggregates may be used withinone another, i.e. aStatisticsArrayofStatisticsRecords andvice versa.
4.1.2. Distributions
Within UncertML, parametric distributions are syntacticallysimilar to statistics. However, semantically, distributions provide acomplete description of a random variable and are therefore anintegral component. The Distribution type in UncertML is usedto describe any parametric distribution; the addition of ‘para-meters’ instead of a single value differentiates the Distributionfrom the Statistic (Listing 2).
Listing 2. A Gaussian Distribution with mean and varianceparameters.
A DistributionArray allows multiple distributions to beencoded concisely. Types for describing mixture models andmultivariate distributions also exist.
4.1.3. Realisations
In some situations, a user may not be able to simply representthe uncertainties of the data with which they are working. In such asituation, a sample from the random quantity might be provided,allowing uncertainty to be described implicitly. Within UncertMLthis is achieved using the Realisations type.
4.2. Propagating UncertML through interoperable services
UncertML was integrated into several key areas throughout thesystem outlined in Section 2. Firstly, the access and storage of theuser-contributed data is handled by an extended (i.e., ‘uncertainty-enabled’) implementation of the 52 North Sensor ObservationService (Section 3). Secondly, the INTAMAP Web ProcessingService, which provides advanced interpolation methods in anautomatic context, can utilise UncertML-encoded information. Theonly mandatory input to INTAMAP is a collection of observationsencoded in the Observations & Measurements schema. Whereobservation errors are known, they are encoded as UncertML andincluded in the O&M instance. In this system the observationscame directly from the UncertML-enabled SOS. Thirdly, the outputof the INTAMAP service is an UncertML document includingany propagated uncertainties. Client applications are then ableto produce visualisations of the predictions and accompanyinguncertainty.
5. INTAMAP
Providing weather information that has been tailored towardthe user relies on either knowing the weather at the user’s location,or, more frequently, predicting the weather at the user’s locationusing observed data at known locations. This process of predictionis typically called interpolation. The INTAMAP (INTeroperabilityand Automated MAPping) project provides an open interfaceto complex geostatistical algorithms (Williams et al., 2007).Combining an interoperable interface and automated interpo-lation methods allows INTAMAP to be accessed by inexperiencedgeostatistical users.
M. Williams et al. / Computers & Geosciences 37 (2011) 353–362 357
INTAMAP uses, as an interface, the interoperable frameworkprovided by the OGC’s Web Processing Service (WPS) specification.This framework supplies a formal structure that enables thedescription of any geostatistical process through its inputs andoutputs. INTAMAP has a single mandatory input—a series ofobservations encoded in the Observations & Measurements stan-dard. However, several other optional inputs exist to allow the userto customise the work flow. Using these options, a user can, forexample, specify the prediction locations using GeographyMarkup Language (GML) (Portele, 2007), or request exceedanceprobabilities using UncertML. Ultimately, however, the capacity ofINTAMAP to automate many choices is what makes the serviceaccessible. For example, if users supply the bare minimum inputs,without specifying an algorithm or supplying a GML-encodedspatial domain for their results, the service will select the mostappropriate interpolation algorithm based on the statisticalcharacteristics of the input observations, and will automaticallycalculate the extent and resolution of the output maps, based ontheir spatial arrangement. This allows users to easily test andexplore INTAMAP’s capabilities, and refine their requirements asthey learn more about the options offered. A typical output ofINTAMAP is the mean (predicted value) and prediction variance (ameasure of uncertainty), encoded in UncertML, at a single location,at several locations or over a regular grid. Complementing the WebProcessing Service is an Application Programming Interface (API)written in Java. This API handles XML writing and parsing, allowingINTAMAP to be integrated into existing Java applications with veryfew lines of code. Tools within the API also allow the creation,where applicable, of GeoTiff files to visualise the results.
Behind the WPS interface lies an interpolation engine written inthe statistical language ‘R’.7 Several differing interpolation methodsare available, catering for a range of scenarios. Automap (Hiemstraet al., 2008) provides an automatic implementation of OrdinaryKriging. For contexts where the data contains extreme values, or‘‘hot spots’’, a Copula Kriging method (Kazianka and Pilz, 2009) isprovided. A third method, Projected Spatial Gaussian Process (PSGP)(Ingram et al., 2008) addresses two issues:
�
the cubic growth in computational complexity for likelihoodbased inference in Gaussian process models (model-basedgeostatistics) which limits their application to smallish datasets of less than 2000 observations; � the inability of most geostatistical methods to deal with non-
Gaussian errors on observations, or non-linear sensor models.
The first point makes PSGPs particularly useful when tacklinglarge datasets (more than 2000 observations). However, it is thesecond point that enables the PSGP method to propagate theobservation errors within the user-contributed data. INTAMAP isable to select an appropriate interpolation method for a specificdataset using several criteria; data characteristics (e.g., the pre-sence of extreme values); time constraints; and the presence orabsence of quantified uncertainties on the observations.
6. Using INTAMAP to estimate observation error on user-contributed data
The data obtained from Weather Underground is submitted by arange of users, who will apply differing levels of quality control totheir data, and site their sensors in a wide variety of locations andexposures. In contrast, weather data collected by professionalmeteorological services undergoes rigorous quality control, and
7 http://www.r-project.org
is collected under standardised conditions, including specificationof the instrument housing and height, the surrounding enclosureand the exposure of the site (Oke, 1982). When instruments (and inparticular the thermometers which we consider here) are sited inurban areas, their readings are likely to be strongly affected by themicro-climates that exist around buildings. These micro-climates,which can particularly affect readings from easily accessiblemonitoring locations such as domestic homes and gardens, arelargely related to changes in thermal storage and associatedradiative balance (World Meteorological Organization, 1983). Itis also quite possible that some instruments might not be correctlyscreened from direct radiation, or are attached to walls that arethemselves exposed. In the following section we explore howstatistical methods, based on using the INTAMAP web service, canbe used in a simplistic manner to estimate the observation bias andresidual observation variance in these user-contributed data. Wenote that the methods applied here are intended to be illustrative.Therefore, they often employ rather simplistic assumptions, whichwill be discussed later.
In order to address the issue of bias in the Weather Undergrounddata, we need to determine a reference level or standard. In thiswork we use temperature observations from the Met Officesynoptic observing network, (denoted TMO), which were obtainedfrom the British Atmospheric Data Centre. Hourly temperature datawere obtained at 203 synoptic stations covering the UK for the 27May 2009. This day was chosen because it was relatively challen-ging to the simplifying assumptions made in the analysis. A warmfront was crossing the UK from the west, with clearer conditionsover northern Scotland, thus the weather situation was complex,with cloudy skies over most of the UK, a situation that might beexpected to minimise any biases due to micro-climatic effects, butclearer skies over the north and east of Britain which could showsignificant biases. The Weather Underground temperature data(denoted TWU) was also obtained for the same period, and theobservations closest in time to the hourly synoptic data wereselected for each site, so long as they were within 15 min of thesynoptic observation time.
A gross outlier removal method excluded all observationsoutside the range �25 3C to þ30 3C which is climatologicallyreasonable. The aim of the outlier removal is to remove outliersin the Weather Underground data that are the result of instrumentfailure, transmission errors and other processes which producevery implausible observations. Visualising the resulting datareveals no further clearly defined outliers. After this selectionaround 500 Weather Underground stations were available foreach hour.
A more sophisticated treatment of outliers is possible, andultimately desirable, for automated preprocessing and qualitycontrol of user-contributed data. Several detailed reviews on thetopic offer and evaluate techniques which will be of value forfurther development of such systems. These include algorithmcomparison and benchmarking exercises for interpolating noisydata, such as the Spatial Interpolation Comparison (EUR, 2003,2005), and more detailed considerations of spatial outliers (pointswhose values are particularly unusual in the context of their localspatial neighbourhoods) (Shekhar et al., 2003; Chawla and Sun,2006). Spatial outliers are especially important in the context ofautomated decision support because of the capacity of ‘falsepositive’ values to trigger alerts and the opposing need tocapture genuine extreme events (Sharma et al., 1999; Pilz andSpock, 2008). A number of studies have considered how existingstatistical methods to detect clusters and spatial outliers mightbe extended for automated systems (Patil and Taillie, 2003;Brenning and Dubois, 2008) while recognising the influence ofheterogeneous covariates (Goovaerts and Jacquez, 2004). This bodyof work offers some robust solutions for future quality control
M. Williams et al. / Computers & Geosciences 37 (2011) 353–362358
Web Services; however, for this simple exploratory example, suchtreatment was not deemed necessary.
Algorithm 1. Outline of the simple bias estimation algorithmapplied to the Weather Underground data.
1:
Remove gross outliers from the Weather Underground data 2: Randomly split the Met Office data into training and
validation sets
3: for hour ¼ 1 to 24 do 4: Use the psgp method on the INTAMAP system to predict
T WU using TMO with a variance estimated to be 0:36 3C2
5:
Compute dTWU ¼ TWU�T WU
6:
end for 7: Compute Tbias
WU ¼ E½dTWU �
8:
Compute TvarWU ¼ var½dTWU �
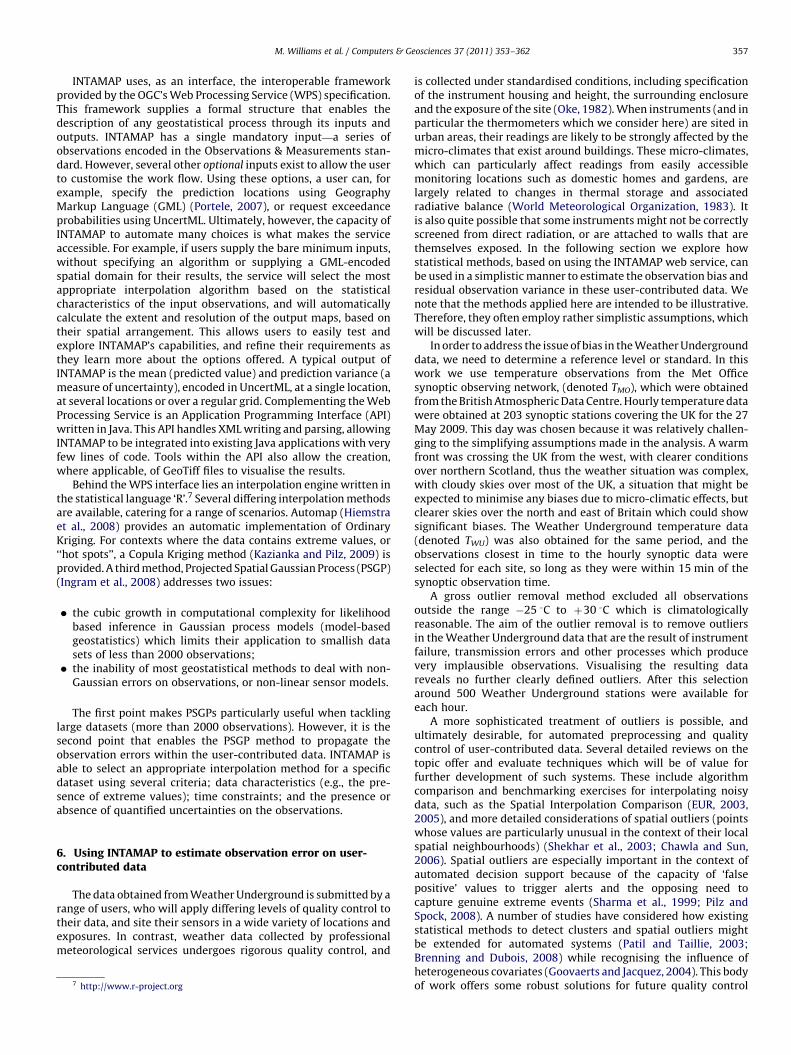
Fig. 3. Predicted versus observed temperatures for Weather Underground (blue
crosses) and Met Office (red circles) stations at 09:00 on the 27 May 2009. (For
interpretation of the references to color in this figure legend, the reader is referred to
the web version of this article.)
The basic idea of this analysis is that we employ the INTAMAPinterpolation system to predict the temperature at the WeatherUnderground locations, based on the Met Office synoptic stationobservations, which we assume are unbiased. In order to withholda set of observations for validation of our approach the synopticstation data is split into two halves using random sampling. Onehalf is used for prediction at the Weather Underground locationsand the other half retained for validation. Since random sampling isused for the locations of the training and validation sets, it ispossible that the results could be sensitive to this partition;however, a sensitivity analysis reveals that the results shown inthe paper are stable with respect to this partition, presumablybecause 100 stations is a sufficiently large number to attainreasonable coverage of Britain. A summary of the overall approachis shown in Algorithm 1. The approach is very simplistic,but illustrates well the dangers of using uncorrected user-contributed data.
Fig. 3 shows a plot of predicted versus observed temperatures. Itis well known that temperatures are extremely sensitive toelevation, particularly in locations such as Britain (Cornford andThornes, 1996). Therefore, prior to all interpolation a linear trend inboth x, y and elevation is removed. The trend model is estimatedusing least squares methods, which is strictly not appropriate heredue to the correlated residuals, but does allow the INTAMAP serviceto be used without modification. A more refined version couldemploy universal kriging or regression kriging (Hengl et al., 2007),however, for this illustration the differences are likely to be small.The typical lapse rates estimated for the period examined rangefrom 3.5 to 5:1 3C=km, and the inclusion of the lapse rates improvesthe estimation of the variograms in the interpolation process asmight be expected. The residual process is spatially correlated and avariogram is fitted in the INTAMAP system with range parameterstypically between 100 and 200 km, sill variances typically 2 3C2 andnuggets typically 0:5 3C2, this varying with time of day. The averageminimum distance between Met Office stations in the training datais � 40 km making spatial prediction of the regression residualsusing kriging appropriate. The predictions are based on the trainingset of Met Office stations, and are made at both WeatherUnderground and Met Office validation set locations. It isimmediately clear that the Weather Underground stations aresignificantly biased, being typically some 2 3C warmer than mightbe expected (the mean bias is 2:34 3C and the standard deviation is1:09 3C). The validation set of Met Office stations remainsessentially unbiased. The scatter is reduced for the Met Officestations compared to earlier work which ignored the effect ofelevation. The scatter for the Weather Underground stations islarger, and is not significantly changed by the addition of elevation
as a predictor, suggesting that there might be other factors affectingthese which are not connected to elevation.
Looking at the statistics of the bias and residual variance based onthese predictions, on average the Weather Underground stations aresignificantly positively biased (although not all are), and many haverather large residual variances (Fig. 4). The positive bias might beexpected—Weather Underground stations are often sited in urbanareas, since they are often in the owners’ gardens, which tend to bemore sheltered and closer to large buildings than the standard MetOffice enclosures. Fig. 4 shows that while many Weather Undergroundstations are significantly biased, some are not biased at all with respectto the synoptic station measurements. This emphasises the degree ofvariability in the estimated biases—a single bias estimate for thewhole Weather Underground station network would not be sufficient.The same pattern can be seen in the variance.
Fig. 5 shows the spatial distribution of both the estimated bias(colour) and variance (size) at the Weather Underground siteswhere data was available for the full 24-hour study period. Thereare interesting patterns in this plot, but it is rather difficult toascribe these to specific causes—they might be related tometeorological conditions, social differences in the locations ofinstruments and local environment, or, most likely, a combinationof the above. It should also be noted that the bias correction will bemost reliable when the Met Office stations are close to the WeatherUnderground stations, due to the use of a random field model. If thismethod for bias estimation were to be used in a more seriousapplication, further developments of the model would be requiredand more extensive model validation would be necessary to ensurethe robustness of the results.
Such a bias-corrected set of observations from Weather Under-ground could have two important advantages, as follows.
Firstly, it would allow Weather Underground data to be usedas standardised data inputs in a wide variety of applicationdomains—for example:
�
monitoring climate change; � numerical weather model data assimilation streams; � mapping surface air temperature to explore vegetation growth
in the UK.
Fig. 4. Histograms of the estimated bias (left) and residual variance (right) for Weather Underground temperatures for 27 May 2009.
Fig. 5. Mapping the estimated bias (colour) and residual variance (symbol size) for
Weather Underground temperatures for 27 May 2009. (For interpretation of the
references to color in this figure legend, the reader is referred to the web version of
this article.)
M. Williams et al. / Computers & Geosciences 37 (2011) 353–362 359
with the caveats that to make full use of the data a more completecharacterisation of the micro-meteorological environment of thestations would be required. There might be some concern that suchprocessed data would not be suitable for monitoring climatechange, because the bias correction is based on the referencestations (the Met Office network). However, this network is care-fully quality controlled and represents the best estimate we have ofsurface climate change. An interesting point for future analysiswould be to monitor how the bias and variance changes withchanging climate – do the micro-climatic effects change as climatechanges? If these data were to be used in a climate change setting itis important that a more rigorous error analysis and propagationshould be performed. In the data assimilation context the corrected
measurements would have realistic error variances, which woulddown-weight the impact of less representative observation loca-tions, but still allow the observations to be used. If furtherpredictors were available, the variance in the observations mightbe explained as a bias dependent on, for example, local sitecharacteristics. This would allow a further bias correction ineach observation and increase the information content (in avariance/entropy reduction sense) making the observation moreuseful for data assimilation.
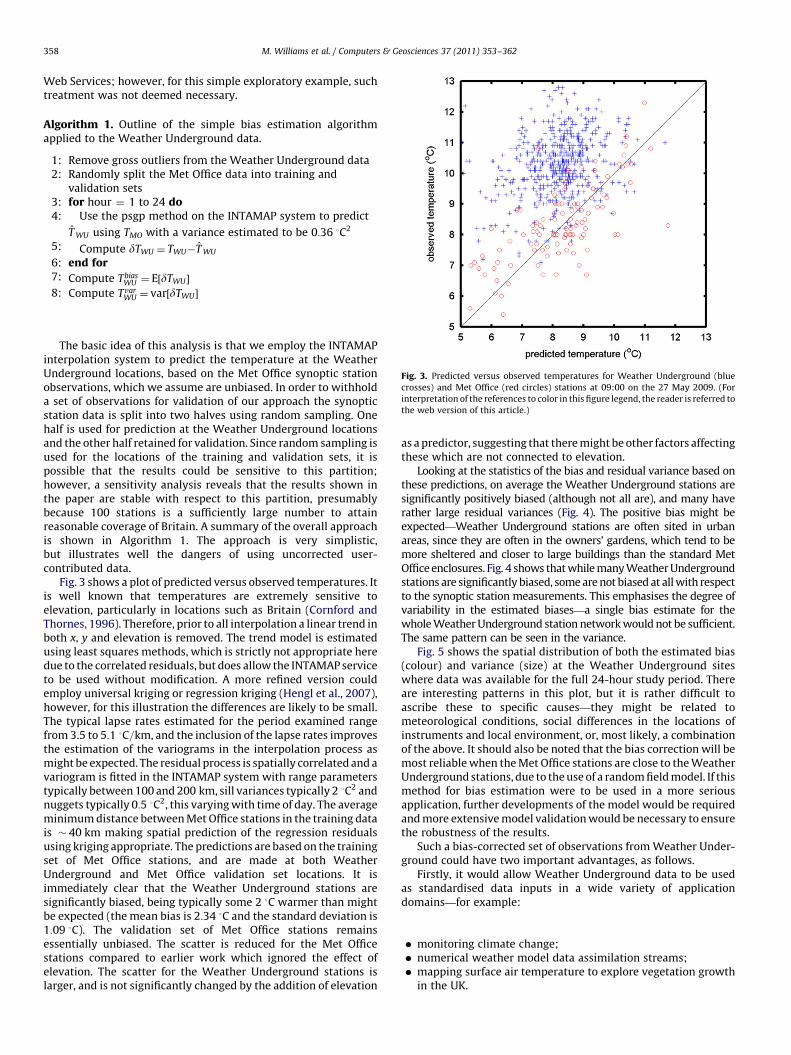
Secondly, it would allow Weather Underground users to estab-lish the bias and uncertainties in their observations, which couldhelp identify siting problems and lead to improved instrumentlocation practice amongst amateur weather recorders. Fig. 6 showsthe effect of the bias correction. Here the INTAMAP interpolationservice is employed twice for each hour of Weather Undergroundobservations - once correcting for bias and using the estimatedvariance (from the procedure described above), once using the rawdata. As expected, the predictions at the Met Office test locations(i.e., the validation data locations which were not used in the biasestimation at all) are almost totally unbiased if the WeatherUnderground data is bias corrected, and the root mean squareprediction error is greatly improved using the bias correction andvariance estimates. Note that there remains a time-varying signalin the bias correction which indicates that, unsurprisingly, thetime-stationary bias model is probably too simplistic.
We note that the approach described herein is an initial attemptto address the uncertainty in user-contributed data, and has severalpotentially significant limitations:
�
we do not account for external variables and their influence onsurface air temperature, other than elevation; � we treat the bias and variance as being constant in time; � we do not fully utilise the uncertainty in the predictions from
the INTAMAP system in computing the bias and variance;
� spatial outliers are not explicitly identified or removed in this
instance;
� we do not iterate the algorithm to further improve the
performance.
In further work it would be possible to develop a more completeBayesian framework for estimating the uncertainties on this user-contributed data (particularly where a reference data set isavailable), based on a spatio-temporal modelling approach,much like Kalman filtering (Kalman and Bucy, 1961). This oughtto include as additional external inputs as many factors as
Fig. 6. Testing the bias correction, using corrected and raw Weather Underground
data to predict at the withheld Met Office stations. Prediction bias (left) and root
mean square error (right) for 27 May 2009.
M. Williams et al. / Computers & Geosciences 37 (2011) 353–362360
possible that would help in explaining the variation in surface airtemperatures, including elevation, distance to coast, urbanisationand a range of other micro-meterological factors.
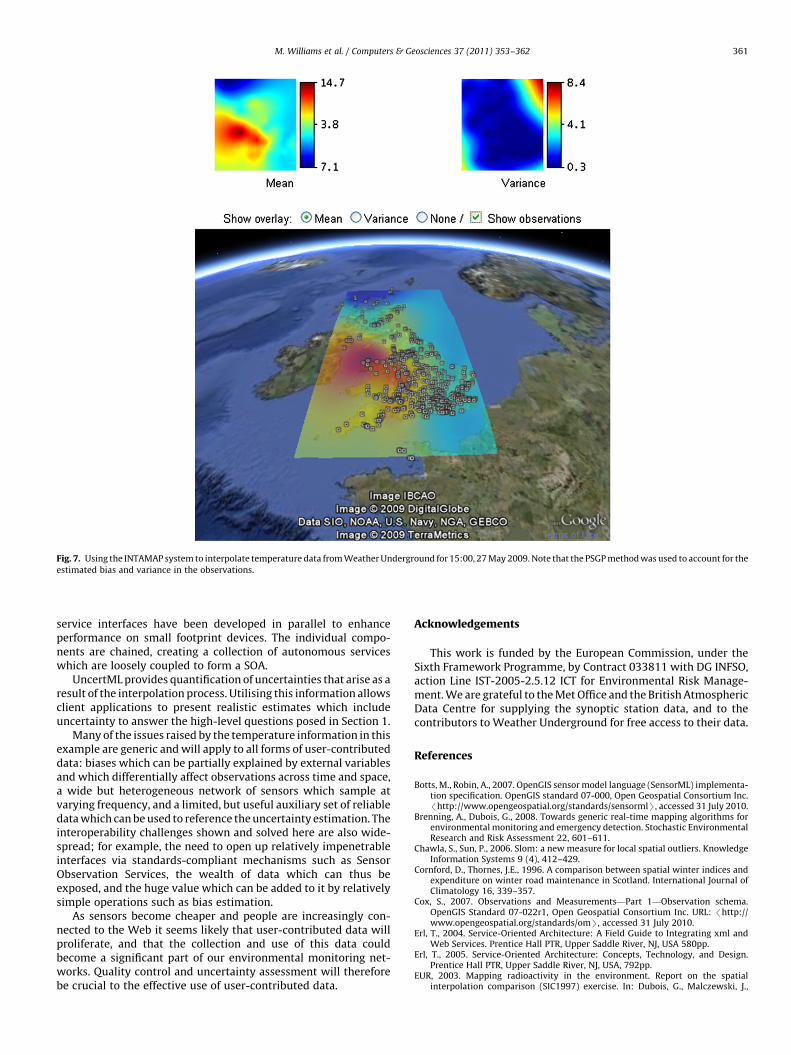
Having estimated the bias and residual variance of the WeatherUnderground stations, we have exploited the ability of the PSGPmethod on the INTAMAP interpolation Web service to produce aninterpolation for the whole of the UK. This interpolation used theWeather Underground data and accounted for the spatially varyingbias and variance in the observations. The resulting interpolation,displayed on Google Earth, is shown in Fig. 7. To our knowledge thisis the first bias-corrected map of temperatures to be produced fromuser-contributed data at this level of detail.
7. Clients for using and contributing data
The framework developed here provided a basis for severalinteresting client applications to be developed. This section dis-cusses two of these applications, demonstrating their operation.
7.1. Contributing data with a mobile device
The mobile client8 was developed using Java Mobile Edition andcan run on any device which supports this platform. Interpolation
8 http://www.intamap.org/tryMobileClient.php
requests and map images are sent and received via the Internetusing any available data connection supported by the device(e.g. WiFi, 3G). The client contains several features that havebeen simplified to allow operation on low-powered mobiledevices, in addition to keeping the transferred data packets to aminimum.
The internal GPS receiver of a supported device is used toretrieve the longitude and latitude of the user. The client thendownloads map images from OpenStreetMap on which the currentlocation of the user is clearly pinpointed with a red marker.
The client can retrieve the latest temperature readings from theSOS using a simplified Web interface. This interface relies on HTTPGET requests rather than XML and returns comma separated values(x, y, z). Sacrificing some of the functionality provided by an XMLinterface allows a typical SOS response to be reduced in size from2.1 Megabytes to 13 kilobytes (a factor of 165). Only the observa-tions that are within the boundaries of the current view areretrieved.
With a strong emphasis on user-contributed data, it is of courseimportant to allow clients to upload information as well as access it.Therefore, users can also create and plot their own observations inaddition to those retrieved from the SOS. A location can be chosenby either selecting a point on the map, using the current GPScoordinates of the device, or by entering the coordinates manually.Once the coordinates have been entered a temperature value isspecified and the data is stored.
The user can submit interpolation requests to INTAMAP usingthe current data plotted on the screen. The client formats the datainto an XML document which is then sent to a lightweightINTAMAP proxy. The response contains URLs to images represent-ing the mean and variance of the interpolated data. These imagescan then be transparently placed over the existing map images.
The user can also inspect any given point on the interpolatedmap. A location is chosen using the cursor, and the client submits aninterpolation request. The mean and variance values for thatparticular location are calculated by the server and returned tothe client. Information regarding the chosen point is then displayedin a pop-up box.
7.2. Demonstrating INTAMAP using google earth
The INTAMAP project provides powerful interpolation methodsthrough a simple XML interface. However, the overheads of theWPS interface mean it is not trivial to quickly realise the function-ality of INTAMAP. For this reason a Web-based client applicationbuilt around the Google Earth browser plugin was developed. Theclient, available at http://www.intamap.org, uses an HTML form tosubmit data to INTAMAP. Data should be formatted as commaseparated x, y, z values. If the uncertainty of your data has beenquantified as a standard deviation (perhaps using the techniqueoutlined in Section 6) then this can be included as a fourth column.Google Earth works using latitude and longitude values, so if yourdata is projected into some coordinate system you must specify theEPSG code of that system. Clicking the ‘interpolate’ button sendsthe data to INTAMAP, resulting in two image overlays: thepredicted values and the variance. The images seen in Fig. 7were generated using this Google Earth client.
8. Discussion and conclusions
This paper has demonstrated how integrating various technol-ogies into a ‘mashup’ application provides a complex system,usable by the general public. Implementing a SOS interfaceprovides a gateway into the system that can satisfy a variety ofclient applications. Due to the verbosity of XML payloads, simple
Fig. 7. Using the INTAMAP system to interpolate temperature data from Weather Underground for 15:00, 27 May 2009. Note that the PSGP method was used to account for the
estimated bias and variance in the observations.
M. Williams et al. / Computers & Geosciences 37 (2011) 353–362 361
service interfaces have been developed in parallel to enhanceperformance on small footprint devices. The individual compo-nents are chained, creating a collection of autonomous serviceswhich are loosely coupled to form a SOA.
UncertML provides quantification of uncertainties that arise as aresult of the interpolation process. Utilising this information allowsclient applications to present realistic estimates which includeuncertainty to answer the high-level questions posed in Section 1.
Many of the issues raised by the temperature information in thisexample are generic and will apply to all forms of user-contributeddata: biases which can be partially explained by external variablesand which differentially affect observations across time and space,a wide but heterogeneous network of sensors which sample atvarying frequency, and a limited, but useful auxiliary set of reliabledata which can be used to reference the uncertainty estimation. Theinteroperability challenges shown and solved here are also wide-spread; for example, the need to open up relatively impenetrableinterfaces via standards-compliant mechanisms such as SensorObservation Services, the wealth of data which can thus beexposed, and the huge value which can be added to it by relativelysimple operations such as bias estimation.
As sensors become cheaper and people are increasingly con-nected to the Web it seems likely that user-contributed data willproliferate, and that the collection and use of this data couldbecome a significant part of our environmental monitoring net-works. Quality control and uncertainty assessment will thereforebe crucial to the effective use of user-contributed data.
Acknowledgements
This work is funded by the European Commission, under theSixth Framework Programme, by Contract 033811 with DG INFSO,action Line IST-2005-2.5.12 ICT for Environmental Risk Manage-ment. We are grateful to the Met Office and the British AtmosphericData Centre for supplying the synoptic station data, and to thecontributors to Weather Underground for free access to their data.
References
Botts, M., Robin, A., 2007. OpenGIS sensor model language (SensorML) implementa-tion specification. OpenGIS standard 07-000, Open Geospatial Consortium Inc./http://www.opengeospatial.org/standards/sensormlS, accessed 31 July 2010.
Brenning, A., Dubois, G., 2008. Towards generic real-time mapping algorithms forenvironmental monitoring and emergency detection. Stochastic EnvironmentalResearch and Risk Assessment 22, 601–611.
Chawla, S., Sun, P., 2006. Slom: a new measure for local spatial outliers. KnowledgeInformation Systems 9 (4), 412–429.
Cornford, D., Thornes, J.E., 1996. A comparison between spatial winter indices andexpenditure on winter road maintenance in Scotland. International Journal ofClimatology 16, 339–357.
Cox, S., 2007. Observations and Measurements—Part 1—Observation schema.OpenGIS Standard 07-022r1, Open Geospatial Consortium Inc. URL: /http://www.opengeospatial.org/standards/omS, accessed 31 July 2010.
Erl, T., 2004. Service-Oriented Architecture: A Field Guide to Integrating xml andWeb Services. Prentice Hall PTR, Upper Saddle River, NJ, USA 580pp.
Erl, T., 2005. Service-Oriented Architecture: Concepts, Technology, and Design.Prentice Hall PTR, Upper Saddle River, NJ, USA, 792pp.
EUR, 2003. Mapping radioactivity in the environment. Report on the spatialinterpolation comparison (SIC1997) exercise. In: Dubois, G., Malczewski, J.,
M. Williams et al. / Computers & Geosciences 37 (2011) 353–362362
de Cort, M. (Eds.), Technical Report, Office for Official Publications of theEuropean Communities, Luxembourg, 268pp.
EUR, 2005. Automatic mapping algorithms for routine and emergency monitoringdata. Report on the Spatial Interpolation Comparison (SIC2004) exercise. In:Dubois, G. (Ed.), Technical Report, Office for Official Publications of the EuropeanCommunities, Luxembourg, 152pp.
Gelman, A., Carlin, J.B., Stern, H.S., Rubin, D.B., 2003. Bayesian Data Analysis (CRCTexts in Statistical Science), second ed. Chapman & Hall, London 696pp.
Goovaerts, P., Jacquez, G., 2004. Accounting for regional background and populationsize in the detection of spatial clusters and outliers using geostatistical filteringand spatial neutral models: the case of lung cancer in Long Island, New York.International Journal of Health Geographics 3, 14.
Hengl, T., Heuvelink, G.B.M., Rossiter, D.G., 2007. About regression-kriging: fromequations to case studies. Computers & Geosciences 33, 1301–1315.
Heuvelink, G., 1998. Error Propagation in Environmental Modelling with GIS. Taylorand Francis, London 150pp.
Hiemstra, P.H., Pebesma, E.J., Twenhofel, C.J.W., Heuvelink, G.B., 2008. Automaticreal-time interpolation of radiation hazards: prototype and system architectureconsiderations. International Journal of Spatial Data Infrastructures Research 3,58–72.
Ingram, B., Cornford, D., Csato, L., 2008. Robust automatic mapping algorithms in anetwork monitoring scenario. In: Atkinson, P.M., Lloyd, C.D. (Eds.), geoENV VII:Geostatistics for Environmental Applications. Springer, Netherlands, pp.359–370.
Kalman, R., Bucy, R., 1961. New results in linear filtering and prediction theory.Transactions of the American Society of Mechanical Engineers, Journal of BasicEngineering, Series D 83, 95–108.
Kazianka, H., Pilz, J., 2009. Bayesian spatial modeling and interpolation usingcopulas. In: Proceedings StatGIS09: GeoInformatics for Environmental Surveil-lance, Milos, Greece /http://www.math.uni-klu.ac.at/stat/Tagungen/statgis/2009/StatGIS2009_Kazianka_1.pdfS, accessed 31 July 2010.
Na, A., Priest, M., 2007. OpenGIS Sensor Observation Service (SOS) encodingstandard. OpenGIS standard 06-009r6, Open Geospatial Consortium Inc. URL:/http://www.opengeospatial.org/standards/sosS, accessed 31 July 2010.
Oke, T.R., 1982. The energetic basis of the urban heat island. Quarterly Journal of theRoyal Meteorological Society 108, 1–24.
Patil, G., Taillie, C., 2003. Geographic and network surveillance via scan statistics forcritical area detection. Statistical Science 18, 457–465.
Pilz, J., Spock, G., 2008. Why do we need and how should we implement bayesian krigingmethods. Stochastic Environmental Research and Risk Assessment 22, 621–632.
Portele, C., 2007. OpenGIS Geography Markup Language (GML) encoding standard.OpenGIS Standard 07-036, Open Geospatial Consortium Inc. URL:/http://www.opengeospatial.org/standards/gmlS, accessed 31 July 2010.
Rizzoli, A.E., Young, W.J., 1997. Delivering environmental decision support systems:software tools and techniques. Environmental Modelling and Software 12,237–249.
Schut, P., 2007. OpenGIS Web Processing Service 1.0.0. OpenGIS standard 05-007r7,Open Geospatial Consortium Inc. URL: /http://www.opengeospatial.org/standards/wpsS, accessed 31 July 2010.
Sharma, P., Khare, M., Chakrabarti, S.P., 1999. Application of extreme value theory forpredicting violations of air quality standards for an urban road intersection.Transportation Research Part D: Transport and Environment 4 (3), 201–216.
Shekhar, S., Lu, C.-T., Zhang, P., 2003. A unified approach to detecting spatial outliers.GeoInformatica 7, 139–166.
Vretanos, P.A., 2005. OpenGIS filter encoding implementation specification. Open-GIS Standard 04-095, Open Geospatial Consortium Inc. URL: /http://www.opengeospatial.org/standards/filterS, accessed 31 July 2010.
Williams, M., Cornford, D., Bastin, L., Pebesma, E., 2009. Uncertainty markuplanguage (UncertML). OpenGIS Discussion Paper 08-122r2, Open GeospatialConsortium Inc. URL: /http://portal.opengeospatial.org/files/?artifact_id=33234S, accessed 31 July 2010.
Williams, M., Cornford, D., Ingram, B., Bastin, L., Beaumont, T., Pebesma, E., Dubois,G., 2007. Supporting interoperable interpolation: the INTAMAP approach. In:Swayne, D.A., Hrebicek, J. (Eds.), Proceedings International Symposium onEnvironmental Software Systems, Prague.
World Meteorological Organization, 1983. Guide to Meteorological Instruments andMethods of Observation. World Meteorological Organization 8, fifth Edition,Geneva, Switzerland, 681pp.