Journal of Healthcare Engineering · Vol. 6 · No. 4 · 2015 Page 649–672 649 Automatic Wheezing Detection Based on Signal Processing of Spectrogram and Back-Propagation Neural Network Bor-Shing Lin, PhD 1* ; Huey-Dong Wu, MD 2 and Sao-Jie Chen, PhD 3 1 Department of Computer Science and Information Engineering, National Taipei University, New Taipei City, Taiwan 2 Department of Integrated Diagnostics and Therapeutics, National Taiwan University Hospital, Taipei, Taiwan 3 Department and Graduate Institute of Electrical Engineering, National Taiwan University, Taipei, Taiwan Submitted April 2015. Accepted for publication August 2015. ABSTRACT Wheezing is a common clinical symptom in patients with obstructive pulmonary diseases such as asthma. Automatic wheezing detection offers an objective and accurate means for identifying wheezing lung sounds, helping physicians in the diagnosis, long-term auscultation, and analysis of a patient with obstructive pulmonary disease. This paper describes the design of a fast and high-performance wheeze recognition system. A wheezing detection algorithm based on the order truncate average method and a back-propagation neural network (BPNN) is proposed. Some features are extracted from processed spectra to train a BPNN, and subsequently, test samples are analyzed by the trained BPNN to determine whether they are wheezing sounds. The respiratory sounds of 58 volunteers (32 asthmatic and 26 healthy adults) were recorded for training and testing. Experimental results of a qualitative analysis of wheeze recognition showed a high sensitivity of 0.946 and a high specificity of 1.0. Keywords: Asthma, wheezing detection, bilateral filtering, order truncate average, back- propagation neural network 1. INTRODUCTION In 2012, the number of noninstitutionalized adults and children in the United States having asthma are 18.7 million and 6.8 million, respectively [1]. In asthmatic or chronic obstructive pulmonary disease (COPD) patients, wheezes have been reported to be adventitious respiratory sounds generated during forced exhalation maneuvers. Wheezes are musical, adventitious, and continuous lung sounds. The waveform of a wheezing sound contains one or more sinusoidal components, explaining its musicality. *Corresponding author: Bor-Shing Lin, Department of Computer Science and Information Engineering, National Taipei University, 151, University Rd., San Shia District, New Taipei City, 23741 Taiwan. Phone: +886-2-86741111 ext. 67123. Fax: +886-2-26744448. E-mail: [email protected]. Other authors:[email protected]; [email protected].
1Department of Computer Science and Information Engineering, National TaipeiUniversity, New Taipei City, Taiwan
2Department of Integrated Diagnostics and Therapeutics, National Taiwan UniversityHospital, Taipei, Taiwan
3Department and Graduate Institute of Electrical Engineering, National TaiwanUniversity, Taipei, Taiwan
Submitted April 2015. Accepted for publication August 2015.
ABSTRACTWheezing is a common clinical symptom in patients with obstructive pulmonary diseases such asasthma. Automatic wheezing detection offers an objective and accurate means for identifyingwheezing lung sounds, helping physicians in the diagnosis, long-term auscultation, and analysisof a patient with obstructive pulmonary disease. This paper describes the design of a fast andhigh-performance wheeze recognition system. A wheezing detection algorithm based on the ordertruncate average method and a back-propagation neural network (BPNN) is proposed. Somefeatures are extracted from processed spectra to train a BPNN, and subsequently, test samples areanalyzed by the trained BPNN to determine whether they are wheezing sounds. The respiratorysounds of 58 volunteers (32 asthmatic and 26 healthy adults) were recorded for training andtesting. Experimental results of a qualitative analysis of wheeze recognition showed a highsensitivity of 0.946 and a high specificity of 1.0.
1. INTRODUCTIONIn 2012, the number of noninstitutionalized adults and children in the United Stateshaving asthma are 18.7 million and 6.8 million, respectively [1]. In asthmatic or chronicobstructive pulmonary disease (COPD) patients, wheezes have been reported to beadventitious respiratory sounds generated during forced exhalation maneuvers. Wheezesare musical, adventitious, and continuous lung sounds. The waveform of a wheezingsound contains one or more sinusoidal components, explaining its musicality.
*Corresponding author: Bor-Shing Lin, Department of Computer Science and Information Engineering,National Taipei University, 151, University Rd., San Shia District, New Taipei City, 23741 Taiwan. Phone:+886-2-86741111 ext. 67123. Fax: +886-2-26744448. E-mail: [email protected]. Otherauthors:[email protected]; [email protected].
650 Automatic Wheezing Detection Based on Signal Processing of Spectrogram and Back-Propagation Neural Network
Thus, distinct peaks can be observed in the frequency domain [2]. According to theupdated definitions in the most recent Computerized Respiratory Sound Analysis(CORSA) standards, the dominant frequency of a wheeze is typically greater than 100Hz, with the duration greater than 100 ms [3]. The transmission of a wheezing soundthrough the airway is better detected than the transmission through the lung to the surfaceof the chest wall. Thus, higher frequency sounds are detected more clearly over thetrachea compared to the chest [4]. The high frequency components of breath sounds areabsorbed mainly by the lung tissue [5]. The frequency of a wheeze lies in the range of100–2500 Hz.
In previous research on the respiratory sounds of asthmatic patients, differentalgorithms have been developed to detect and analyze wheezes. The moststraightforward methods for automatic detection involve searching for peaks in thefrequency domain [6–10]. In spectral analysis, wheezes are seen as narrow peaks in thepower spectrum, generally below 2000 Hz. Diagnostic failures often result from the shifting of the dominant frequency of a wheeze or the noise power being greater thanthat of wheezes. Algorithms proposed in the aforementioned studies are simple and fast;however, they are not very reliable and sensitive. To increase the sensitivity of wheezedetection based on successive spectra, combinations of algorithms and classificationmodels have been proposed [11–14]. These approaches involve feature extraction andmodel comparison, both of which improve wheezing recognition. However, because thecoefficients of classification models must be adjusted empirically, these approaches are inconvenient and increase the complexity of the algorithms. Thus, while theseapproaches enable precise wheezing detection, they are slow. Recent attempts to achievehigher sensitivity and efficient detection performance include the consideration of a setof criteria in the time-frequency domain [15–23]. These criteria pertain to the duration,pitch range, and magnitude of wheezes in the time-frequency representation of thewheezes obtained through spectrogram analysis. The objective of these studies was toautomatically locate and identify wheezing episodes from sound recordings on the basisof well-defined criteria. These threshold criteria were used several times to empiricallygenerate a normalized spectrum for detecting the maximum number of spectrum peaksunrelated to background noise. Thus, it is difficult to reproduce a wheezing detectionsystem in different measuring environments and to obtain the maximal number ofharmonics of wheezing episodes. In a recent study [24], a spirometer was employed toassist detection of wheezing. This mechanism provides the most accurate wheezingdetection. However, it is inconvenient for long-term monitoring.
The objective of the current study is to investigate a method that involves image-processing techniques based on the normalized spectrogram recorded from lung soundsfor identifying similar lung sounds. The proposed method enables visualizing wheezingcharacteristics, facilitating the search for horizontal or nearly horizontal edges of thespectrogram. The order truncate average (OTA) method is employed to overcome thedrawbacks observed in the study of Homs-Corbera et al. [18]. The proposed method canbe used for all sound levels, and enables identifying the most wheezing episodes in ashort time. The back-propagation neural network (BPNN) is used to learn the featuresof wheezes in automatic wheezing recognition. After the BPNN is trained, it canprecisely classify wheezing and non-wheezing without airflow data.
2. METHODS2.1. Overview of the SystemVarious types of equipment and techniques exist for obtaining respiratory sounds [25].The automatic wheezing detection system proposed in the current study was developedin accordance with CORSA standards and on the basis of previous studies [26–32].Figure 1 shows a diagram of the system, consisting of hardware and software. Thehardware consists of a sensor, a pre-amplifier, a band-pass filter (BPF), and a finalamplifier prior to analog-to-digital converter (ADC). The purpose of the BPF is to reducethe heart, muscle, and contact noises. The designed bandwidth of BPF is from 60 Hz to4 kHz for both lung and trachea sound analysis. A Butterworth low-pass filter (LPF) offourth-order with 4 kHz cut-off and a fourth-order Bessel high-pass filter (HPF) are usedto form the BPF. One single Quad Op-amp (MC34074, Motorola, Inc., USA) is used inboth the HPF and LPF implementations, connected as 4 active filter stages (each of order 2) in cascade. The amplifiers increase the amplitude of the captured signal suchthat the full ADC range can be optimally used, and sometimes to adjust the impedanceof the sensor. The sensor is realized using an electret condenser microphone (ECM,KEC-2738, Kingstate Electronics Corp., Taipei, Taiwan) with the bell of a stethoscope(3M Littmann Classic S. E.) fixed by hand between the skin surface and the microphone.
In clinical experiments, the hardware device collected and amplified the respiratorysounds. The digitization of sounds was performed by a soundcard (CS4297A) boundedin an IBM laptop (A22M, P-III 1 GHz). A 2 kHz bandwidth appears to be sufficient forstudies of wheeze, but extending the bandwidth to 4 kHz is a perfect choice for theanalysis of both adventitious sounds and upper-airway sounds. A standardized samplingrate applied in many industry standard sound facilities is 44.1 kHz, which is rather highfor respiratory sound studies.
In this study, we focused on algorithms. All algorithms were implemented on a laptopby MATLAB 7.0 (The MathWorks, Inc., Natick, MA, USA). The software performedsignal processing and involved using a neural network, as shown in Figure 1. The recorded respiratory sounds were first processed by an OTA signal-processingalgorithm, and were then sent to the BPNN. Finally, the BPNN program performedtraining and wheezing recognition.
Analog circuit
Pre-amplifier
Band-passfilter
Finalamplifier
Battery + 5V
Laptop
ECM wrapped
inside the tube
Signal processing Neural network
Software
Hardware
Figure 1. Block diagram of the automatic wheezing detection system.
2.2. Signal Processing Using Order Truncate Average MethodMusical wheezing characteristics were determined using a fundamental frequency andits harmonics. Because wheezing is continuous, the resulting spectrogram containsquasi-horizontal lines indicating the strong presence of a determined frequency duringa period of time. Figure 2 shows part of a spectrogram of a typical tracheal wheezingsound. It is clear that wheeze episodes (bounding boxes of dotted line in Figure 2) canbe easily distinguished as edges distinct from the background sound components.
However, the edges that represent wheeze episodes are difficult for a computer torecognize because of blurring or spot formation resulting from noise. To enableautomatic recognition by a computer, a wheeze detecting algorithm based on OTAfiltering of a spectrogram was developed to retain edges defining wheeze episodes andto eliminate unwanted noise.
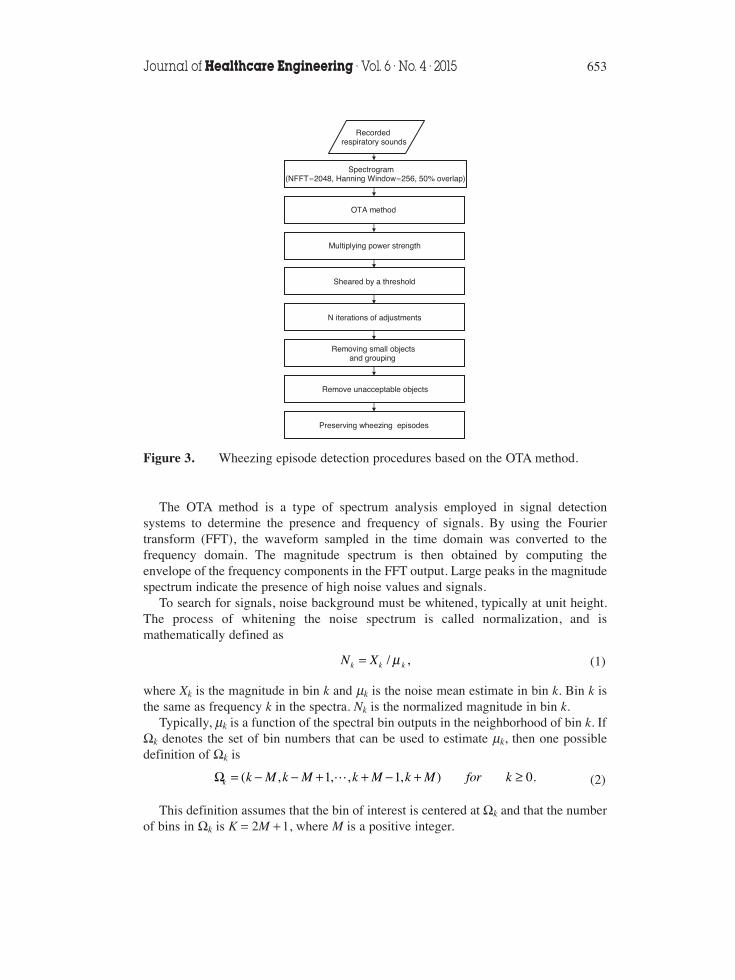
The objective of the proposed OTA algorithm is to preserve the maximum numberof wheezing episodes. A schematic representation of the OTA algorithm is depicted inFigure 3. Each step and its respective results can be described as follows:
1) Spectrogram: Initially, each recorded respiratory sound file is loaded, and thelength of the discrete Fourier transform (DFT), the type and length of the timewindow, and the overlapping percentage are defined. A DFT with 2048 pointsachieves an adequate frequency resolution of 2.15 Hz/pixel. The Hanningwindow acquires a rather smooth and acceptable spectral leakage, and itslength is approximately 58 ms. The overlap of the window is approximately50%. The time scale interval in the spectrogram is 29 ms, which provided anappropriate time resolution for wheezes.
2) OTA Method: The spectrogram is three-dimensional, indicating time,frequency, and power. The frequency-power plane of the spectrogram isacquired in sequence and then processed using the OTA method. Mostfrequency peaks are preserved after OTA processing.
652 Automatic Wheezing Detection Based on Signal Processing of Spectrogram and Back-Propagation Neural Network
Time (sec)
Fre
quen
cy (
Hz)
0 1 2 3 4 5 6 7 8 90
200
400
600
800
1000
1200
1400
1600
1800
Figure 2. Part of a spectrogram of a typical tracheal wheezing sound.
The OTA method is a type of spectrum analysis employed in signal detectionsystems to determine the presence and frequency of signals. By using the Fouriertransform (FFT), the waveform sampled in the time domain was converted to thefrequency domain. The magnitude spectrum is then obtained by computing theenvelope of the frequency components in the FFT output. Large peaks in the magnitudespectrum indicate the presence of high noise values and signals.
To search for signals, noise background must be whitened, typically at unit height.The process of whitening the noise spectrum is called normalization, and ismathematically defined as
(1)
where Xk is the magnitude in bin k and μk is the noise mean estimate in bin k. Bin k isthe same as frequency k in the spectra. Nk is the normalized magnitude in bin k.
Typically, μk is a function of the spectral bin outputs in the neighborhood of bin k. IfΩk denotes the set of bin numbers that can be used to estimate μk, then one possibledefinition of Ωk is
(2)
This definition assumes that the bin of interest is centered at Ωk and that the numberof bins in Ωk is K = 2M + 1, where M is a positive integer.
μ=N X / ,k k k
Ω = − − + + − + ≥k M k M k M k M for k( , 1, , 1, ) 0.k
Once an appropriate definition of Ωk has been chosen, the manner of using the binvalues in Ωk to obtain the noise mean μk should be determined. The simplest estimatoris the sample mean
(3)
If Ωk were to contain only noise, this estimator would be the optimal linear estimatorbecause the sample mean is the minimum variance unbiased linear estimator. However,when signals are present in Ωk, μk can be biased severely upwards, thereby renderingthe normalized outputs Nk in eqn. (1) considerably low.
The OTA normalizer was developed by Wolcin in 1978 [33]. The following stepsdescribe the OTA method:
(a) The K bin values in Ωk are ordered to form a new sequence (Y1, Y2, …, Yk), whereY1 is the smallest bin value and Yk is the highest bin value.
(b) The sample median YM is identified, and all bins having values greater than rYM
are excluded (the value for r is given later). Assume that L bins remain after theexclusion process.
(c) The noise mean estimate μk is then obtained using the L remaining bins:
(4)
(d) In a similar manner, the shearing threshold for the OTA normalizer is defined as
(5)
where MM is the theoretical mean-to-median ratio and SGMM is the theoretical sigma-to-median ratio.
3) Multiplication with Power Strength: After OTA processing, we obtained manyfrequency peaks in each frequency-power plane. Some peaks were of interest,but other peaks were not required. To retain only the peaks of interest, eachpoint on the frequency-power plane was multiplied by its original strength.Wheezes always have high strength, and therefore, wheezing peaks are likelyto increase upon multiplication with their original strength. In this manner,more wheezing episodes can be preserved, similar to the preservation ofwheeze harmonics.
4) Shearing Using a Threshold: To preserve the high-amplitude components, alimiter algorithm was developed. Because different sounds can be recordedusing different techniques, different recorded signals may correspond todifferent recording levels. To ensure that recording levels have the samelimitation, an adapted threshold is required. To achieve the optimalperformance, the threshold should be appropriate for the properties of breath
T rY MM SGMM Y
M Y
2
1
2In 2 2 4 4 In 2 ,
M M
M
1 2 1 2π π{ }[ ]( )
( ) ( )
= = + ×⎡⎣ ⎤⎦
= + −
∑μ =∈Ω
X
K.k
i
i k
∑μ ==
Y
L.k
i
i
L
1
654 Automatic Wheezing Detection Based on Signal Processing of Spectrogram and Back-Propagation Neural Network
sounds. Figures 4 and 5 show typical spectral variations during one breath.Figure 4 represents the power spectra of a wheezing subject, while Figure 5represents those of a healthy subject. Normal tracheal sounds correspond to abroad peak and appear almost randomly. By contrast, wheezing produces asmall number of well-defined peaks in the power spectrum. This difference
Figure 4. Power spectra over the trachea for a wheezing sound.
0
10
20
30
40
500
200400
600800
1000
0
200
400
Frequency (Hz)
Time (sec)
Pow
er (
dB)
Figure 5. Power spectra over the trachea for a normal sound.
emphasizes the importance of amplitude criteria, such as the criterion used inthe current study for distinguishing between normal and abnormal spectra.From the aforementioned properties of breath sounds, we can infer that thewheezing sounds have a larger standard deviation of power spectra than thatof normal sounds. Thus, we defined an optimal threshold (Th1) as follows:
(6)
where C1 is a constant obtained from experiments, mlocal is the mean of all points in afrequency-power plane, and σlocal is the standard deviation of all points in thefrequency-power plane.
5) Adjustments Involving N Iterations: After the preceding step, the spectrogramstill contains considerable noise and unwanted episodes. Therefore, a newthreshold (Th2) is used to further filter unwanted episodes. Considering thedifference between the properties of wheezing and those of normal sounds,eqn. (6) is adjusted to obtain
(7)
where C2 is a constant obtained from experiments. C1 and C2 are estimatedexperimentally as constant values with the goal of preserving the most complete shapesand maximum number of wheezing episodes.
After the power plane is sheared using this threshold, the noise power spectra ofnormal breath sounds are eliminated. In particular, peaks such as the wheezing peaksare preserved. This shearing method can be reused by employing the same threshold.
6) Removal of Small Spots and Grouping: After three shearing iterations, manyquasi-horizontal lines and small spots are likely to exist. First, the small spotsare removed and then the broken wheezing episodes are grouped. Analgorithm is applied to connect separate episodes when the start and end pointsof the two episodes are close on the spectrogram. The grouping algorithmdeveloped in this study considers the time, frequency, and amplitude proximityof the previously detected wheezing peaks. This algorithm scans the time-frequency plane and searches for ungrouped wheezing peaks. When a wheezeis found, the algorithm attempts to group it with other peaks as follows:(a) It searches for ungrouped peaks at a time distance of 29 ms. If there are
peaks at this distance, the algorithm performs a frequency proximity check,only retaining wheezes within 50 Hz of the original wheeze.
(b) If there are no peaks fulfilling these conditions, the algorithm searches forungrouped peaks at a time distance of 58 ms. A frequency proximity checkis then performed, and only the peaks within 65 Hz are retained.
(c) The wheeze with the amplitude closest in value to the amplitude of theoriginal wheezing peak is grouped with a new longer wheeze.
σ= ×
ThC m
,local
local2
2
σ= ×
ThC m
,local
local1
1
656 Automatic Wheezing Detection Based on Signal Processing of Spectrogram and Back-Propagation Neural Network
(d) The entire process is repeated by considering the final grouped peak as thenew starting peak, until no peak close to this one is found. Once the processis terminated, the entire wheeze is defined.
7) Removal of Unacceptable Objects: According to the definition of wheezing, allwheezes with durations shorter than 100 ms were eliminated.
8) Preservation of Wheezing Episodes: By combining figures obtained fromabove steps, we obtain a final figure. This figure presents all detected wheezeswith their corresponding strengths.
2.3. Back-Propagation Neural NetworkAn artificial neural network (ANN) is a powerful data-modeling tool that can captureand represent complex input/output relationships. Motivation for the development ofneural network technology stemmed from a desire to develop an artificial system thatcould perform intelligent tasks comparable to the human brain. Currently, the back-propagation architecture is the most frequently applied, effective, and user-friendlymodel for complex, multilayered networks. Its most notable advantage is that it can beused for obtaining nonlinear solutions to ill-defined problems [34–36].
The layout of an ANN filter, shown in Figure 6, is similar to that of the human neuralsystem. It comprises numerous interconnected processing elements (PEs). The ANNfilter typically consists of an input layer of input nodes, one or more hidden layers ofPEs, and an output layer that also consists of PEs. In this study, a feed-forwardmultilayer perceptron, which produces an output response to input signals in thenetwork by propagating in the forward direction only, was used.
In this study, five input parameters are extracted from processed wheezing episodes.These parameters are presented in Figure 7 and defined as follows:
1) VT: The time duration of a wheezing episode.2) VF: The frequency range of a wheezing episode.
3) VExt: The area/boundary of a wheezing episode , where A is the area
of a wheezing episode.4) VStd: The normalized power spectra, equivalent to the local standard deviation
of a wheezing episode/global standard deviation of the entire spectrogram.5) VSlope: The slope of a wheezing episode.VT, VF, and VExt can provide the shape of an episode. According to the shapes, the
wheezes present in the episode can be effectively detected. If VStd is high, it indicatesthe possibility of a wheezing episode being present in the spectrogram. The finalparameter, VSlope, provides the slope of a wheezing episode. In most wheezing cases, theshape of wheezing episode appears as a quasi-horizontal line in a spectrogram. If theslope is close to 0 or 1, the episode may not be a wheezing episode.
After choosing appropriate parameters to extract processed wheezing episodes, we built a BPNN for training and testing the respiratory sound samples. To enhance theBPNN performance, we chose an appropriate training set size and an appropriatenetwork structure. A common approach used for BPNN training in medical domains isto divide the collection of data samples into two groups based on a cutoff date; thetraining samples correspond to earlier dates, and the test samples correspond to laterdates, simulating the prospective use of the BPNN.
All steps in the wheezing recognition process are presented in Figure 8. In theproposed BPNN, we required two groups of recorded respiratory sounds; one was fortraining and the other was for testing. After training the BPNN, we fixed the weightsand biases of the BPNN. The test samples were then sent to the BPNN for classification.
×
⎛
⎝⎜⎜⎜
⎞
⎠⎟⎟⎟
A
V VT F
658 Automatic Wheezing Detection Based on Signal Processing of Spectrogram and Back-Propagation Neural Network
VF
VT
Spectrogram
Wheezing episode VSlope
A
Figure 7. Definition of parameters used for extracting wheezing features.
In this study, the following conditions were considered for determining the trainingset size and BPNN structure:
1) Input Nodes and Output Node: By following all signal processing steps forspectograms presented in Section 2.2, we can identify wheezing episodes. Fromthese episodes, we choose the longest ten based on time duration. For each selectedepisode, we can extract three features such as (VT, VF, VExt), four features such as(VT, VF, VExt, VStd) and (VT, VF, VExt, VSlope), or five features such as (VT, VF, VExt,VStd, VSlope). Thus, we can obtain 30, 40, or 50 input nodes according to the numberof features chosen. Furthermore, we have only one output node that outputs “1” fora wheezing respiratory sound, and “0” for a normal respiratory sound.
2) Hidden Layers and Neuron Numbers: A typical BPNN has an input layer, anoutput layer, and at least one hidden layer. There is no theoretical limit on thenumber of hidden layers, but it is typically one or two. Another factor to consideris the neuron number in each hidden layer. When designing a neural network, onecrucial parameter difficult to determine is the number of neurons in the hiddenlayers. The hidden layer is responsible for the internal representation of the dataand information transformation in the input and output layers. Therefore, anoptimal design for the number of neurons in the hidden layer is required.
In this study, we used (in, n1, out) and (in, n1, n2, out) to construct a BPNN. Here, inis the number of input nodes, n1 (between 15 and 200) is the number of neurons inHidden Layer 1, n2 (between 30 and 100) is the number of neurons in Hidden Layer 2,and out is the number of nodes in the output layer.
3) Learning Factor: To address the problem of training speed, attention was devotedto the learning factor during the development of the back-propagation software.As suggested by McClelland [37], the weights were updated once every completecycle through the training samples rather than after each training sample. Thisprocess is known as batch training, or weight update by epoch, and it reduces the
Figure 8. Flow chart for the wheezing recognition process involving the BPNN.
number of computations required at each step. The back-propagation algorithm,similar to other numerical algorithms, can become unstable if the steps are toolarge. McClelland recommends 1/n as an appropriate size for the learning rate,where n is the total number of nodes in the network.
In the current study, we ignored the training time. Thus, we used a small and fixedlearning factor to achieve stable convergence. In all experiments, the learning factorwas 0.02, and the accumulated absolute error was less than 5 × 10⁻⁸.
3. RESULTS3.1. ParticipantsThe respiratory sounds of 58 volunteers in the National Taiwan University Hospital(NTUH) were recorded to prepare for training and testing. The physician grouped 58volunteers into training and test subjects, and marked all recorded sounds as wheezingor non-wheezing. The training subjects were of two types, as shown in Table 1. Thetraining subjects consisted of 13 stable, asthmatic adults who had been without anyacute exacerbation for 2 months, and 10 normal adults without any reported respiratorypathology. The test subjects were 35 volunteers, including 19 asthmatic adults and 16normal adults, as shown in Table 2. After training the BPNN, we fixed the weights andbiases of the BPNN. The test samples were then sent to the BPNN for classification.
3.2. ExperimentsIn this subsection, the effectiveness of the proposed algorithm is shown and discussed.First, wheeze recognition based on OTA filtering of the spectrogram was performed toclassify segmented respiratory sounds. The high accuracy and robustness of wheezerecognition were demonstrated using wheezing and normal data sets. For example, weused Figures 9(a) to 12(d) to represent all steps in Section 2.2 to enhance the features
660 Automatic Wheezing Detection Based on Signal Processing of Spectrogram and Back-Propagation Neural Network
Figure 9. Results obtained using the OTA method for a wheezing sound: (a) original spectrogram, (b) strength before and after the OTA methodwas applied, (c) spectrogram obtained after shearing by using a threshold,and (d) all point values of a frequency-power plane before and aftershearing using a threshold.
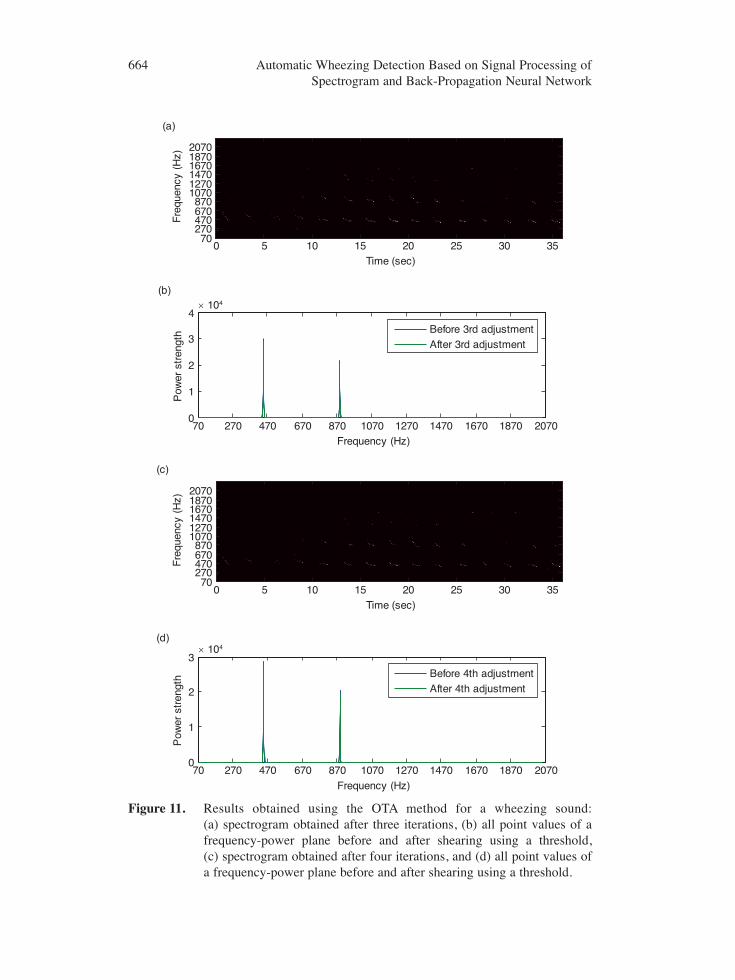
of wheezes in a wheezing respiratory sound. Many wheezes are evident at thedominant frequencies where harmonics are clear. By contrast, the spectrogram of anormal respiratory sound is almost bare or contains only a few objects. Thespectrogram obtained is shown in Figure 9(a). The result of OTA processing is shownin Figure 9(b). Figure 9(c) shows a spectrogram in which each frequency-power planeis sheared using a threshold. Figure 9(d) shows all point values of a frequency-powerplane before and after shearing using the threshold. Figures 10(a) to (d) and 11(a) to(d) show the spectrogram after one to four iterations as well as all point values of afrequency-power plane before and after shearing using the Th2 threshold. In theproposed system, three iterations are sufficient to eliminate unwanted episodes andpreserve peak components. The results of removing small spots and grouping areshown in Figures 12(a) and 12(b), respectively. Figure 12(c) shows the result ofremoval of unacceptable objects. Eventually, by combining figures obtained fromFigures 9(a) to 12(c), we obtain Figure 12(d). This figure presents all detected wheezeswith their corresponding strengths.
After signal processing of the spectrogram, the extracted features of preserved peakcomponents are sent to BPNN for training and classification. Two-layer and three-layerBPNNs with one and two nonlinear hidden layers, respectively, were applied. In thetwo-layer BPNN, Hidden Layer 1 was formed using a log-sigmoid transfer function,and the output layer was formed using a linear transfer function. In the three-layerBPNN, Hidden Layer 1 was formed using a tan-sigmoid transfer function, HiddenLayer 2 was formed using a tan-sigmoid transfer function, and the output layer wasformed using a linear transfer function. The value of the output at an output neuronrepresents the probability of wheeze occurrence; “1” represents “most likely,” whereas“0” represents “most unlikely.”
Eventually, a series of experimental tests were conducted by considering differentinput nodes, different numbers of neurons in the hidden layers, and different numbersof layers. Results based on the 30 inputs extracted from the three features (VT, VF, VExt)are shown in Table 3. Results based on the 40 inputs extracted from the four features(VT, VF, VExt, VStd)are presented in Table 4. Results based on the 40 inputs extractedfrom the four features (VT, VF, VExt, VSlope) are shown in Table 5. Results based on the50 inputs extracted from the five features (VT, VF, VExt, VStd, VSlope)are presented inTable 6. In Tables 3 though 6, the estimated system performance (PER) is dependent onsensitivity (SE) and specificity (SP) as defined below:
(8)
(9)
(10)
=+
Sensitivity SETrue Positive TP
True Positive TP False Negative FN( )
( )
( ) ( )
=+
Specificity SPTrue Negative TN
True Negative TN False Positive FP( )
( )
( ) ( )
= ×Performance PER SE SP( )
662 Automatic Wheezing Detection Based on Signal Processing of Spectrogram and Back-Propagation Neural Network
Figure 10. Results obtained using the OTA method for a wheezing sound: (a) spectrogram obtained after one iteration, (b) all point values of afrequency-power plane before and after shearing using a threshold, (c) spectrogram obtained after two iterations, and (d) all point values ofa frequency-power plane before and after shearing using a threshold.
664 Automatic Wheezing Detection Based on Signal Processing of Spectrogram and Back-Propagation Neural Network
Time (sec)
(a)
(b)
(c)
(d)
Fre
quen
cy (
Hz)
0 5 10 15 20 25 30 3570
270470670870
107012701470167018702070
Time (sec)
Fre
quen
cy (
Hz)
0 5 10 15 20 25 30 3570
270470670870
107012701470167018702070
70 270 470 670 870 1070 1270 1470 1670 1870 20700
1
2
3× 10⁴
Frequency (Hz)
Pow
er s
tren
gth Before 4th adjustment
After 4th adjustment
70 270 470 670 870 1070 1270 1470 1670 1870 20700
1
2
3
4× 10⁴
Frequency (Hz)
Pow
er s
tren
gth Before 3rd adjustment
After 3rd adjustment
Figure 11. Results obtained using the OTA method for a wheezing sound: (a) spectrogram obtained after three iterations, (b) all point values of afrequency-power plane before and after shearing using a threshold, (c) spectrogram obtained after four iterations, and (d) all point values ofa frequency-power plane before and after shearing using a threshold.
Figure 12. Results obtained using the OTA method for a wheezing sound: (a) spectrogram obtained after removing small spots, (b) spectrogramacquired after grouping, (c) spectrogram obtained after removingunacceptable objects, (d) spectrogram containing all detected wheezeswith their corresponding strengths.
4. DISCUSSIONThe proposed wheeze detection system has high sensitivity and high specificity, butalso shows erroneous detection. The factors related to the erroneous detection will bediscussed below. The performance of the BPNN is affected by many factors, includingthe number of input nodes, the number of hidden layers, and the number of neurons. Weanalyzed the experimental results to obtain the optimal parameters of the BPNN.
666 Automatic Wheezing Detection Based on Signal Processing of Spectrogram and Back-Propagation Neural Network
Table 3. Wheeze recognition results for the three features (VT, VF, VExt)
4.1. Input NodesIn Section 2.3, we propose four types of input nodes. After the experimental tests wereconducted, we found that the 50 input nodes extracted from the five features (VT, VF,VExt, VStd, VSlope) showed the highest average performance, and the 40 input nodesextracted from the four features (VT, VF, VExt, VStd) showed the poorest averageperformance. The average performance comparison is presented in Figure 13. Theaforementioned experimental results show that the shape (VT, VF, VExt) and slope (VSlope)
of a wheezing episode have strong effects on wheezing recognition. However, thenormalized power spectra (VStd) has a weaker effect. We infer that both the noise andwheezing episodes have high power, which explains the weaker effect of thenormalized power spectra.
4.2. Hidden Layers and Number of NeuronsThere are no rules for selecting the number of hidden layers and the number of neurons.However, the experimental results demonstrate that two hidden layers show higheraverage performance than the others. The average performance comparison is shown inFigure 14. We selected 50 inputs and a three-layer BPNN structure. The performancecomparison for neuron selections is shown in Figure 15.
668 Automatic Wheezing Detection Based on Signal Processing of Spectrogram and Back-Propagation Neural Network
0.8550.86
0.8650.87
0.8750.88
0.8850.89
0.8950.9
0.9050.91
30 40* 40 50Input nodes
Ave
rag
e pe
rfo
rman
ce
*Four features(VT, VF, VExt, VStd)
Figure 13. Average performance comparison of input nodes.
0.84
0.85
0.86
0.87
0.88
0.89
0.9
0.91
0.92
0.93
30 40* 40 50
Input nodes
Ave
rage
per
form
ance
2 Layers 3 Layers
*Four features (VT, VF, VExt, VStd)
Figure 14. Comparison of the average performance with different numbers ofhidden layers.
From the series of experimental tests, we finally chose 50 input nodes (in, n1, n2, out) =(50, 100, 50, 1) as the BPNN structure. With this simple structure, the proposed systemhas high sensitivity and high specificity for wheezing detection. The method effectivelyadapts to different sound volumes from different recording machines and resists theinterference of environment noise. Depending on the wheezing properties, thephysician can add more features to improve the rate of wheezing recognition.Regarding erroneous recognition, when reviewing the incorrect recognitions, thesewheezing sounds appear very weak even for the physician to recognize. Therefore, aweak or noisy wheezing sound is the limitation in our proposed system. Reasons forerroneous recognition are discussed below:
1) Erroneous wheezing episodes may be preserved using the OTA method. In thesignal- processing algorithm, the OTA method was used to preserve themaximum number of wheezing episodes. However, high-power noise may bepreserved in some thresholds. To avoid the preservation of erroneouswheezing episodes and high-power noise, we should improve the OTA methodand use noise reduction techniques.
2) Appropriate wheezing features should be chosen for extracting wheezingepisodes. The experimental results revealed that the shape (VT, VF, VExt) and slope(VSlope) of a wheezing episode have strong effects on wheezing recognition. Toenhance wheezing recognition performance, we should identify new wheezingfeatures to be used as inputs to the BPNN, such as Tw/TCycle, where Tw is theduration of a wheezing episode and TCycle is the duration of a respiratory cycle.
3) A larger number of subjects are required to improve the validation of theproposed wheeze recognition system. In the future, we intend to include alarger number of subjects for training and testing. We can even exchange thetraining and test subjects to achieve cross-verification, making the proposedsystem more accurate in wheezing recognition.
Figure 15. Performance comparison for different numbers of neurons.
In this study, the proposed method not only provides a visual and auditory tool forclinicians, but also helps them to develop advanced diagnosis tools for pulmonarydiseases. In clinic, some weak wheezing sounds are hard to recognize, especially foryoung physicians. The senior physicians can utilize our system to teach juniorphysicians in visual and auditory forms. After clinic, junior physicians can review thepatients’ records using our proposed system. The source code of our system wasdeveloped in Matlab, and can be easily modified to develop advanced algorithms forthe diagnosis of pulmonary diseases.
5. CONCLUSIONSA novel algorithm based on the OTA method was developed to detect wheezes withhigh performance, and to overcome the drawbacks in previous studies. The algorithmprovides not only an automatic diagnosis, but also processed data to physicians. Thetreated spectrogram is shown on a computer screen before automatic recognition. Theresults of the experiments indicate that this algorithm can be useful in clinicaldiagnostics, mainly when the analysis is to be repeated for a number of respiratorycycles of a patient. The proposed wheeze detecting algorithm showed high sensitivity(0.946) and specificity (1.0) in the qualitative analysis of wheezes without the use ofairflow data. Improvements are required for increased accuracy in detecting theduration of wheeze episodes. New wheezing features should be identified for use in the algorithm based on the OTA method. Also, a larger number of subjects should beincluded for training and testing.
ACKNOWLEDGEMENTSThis research was partly supported by Ministry of Science and Technology in Taiwan(R. O. C.), under grants MOST 103-2218-E-305-001, MOST 103-2218-E-305-003, andMOST 104-2221-E-305-006.
CONFLICT OF INTERESTThe authors indicated no potential conflicts of interest.
REFERENCES[1] Centers for Disease Control and Prevention (CDC). Asthma. 2012. http://www.cdc.gov/nchs/
fastats/asthma.htm. Accessed March 8, 2015.
[2] Sovijärvi ARA, Malmberg LP, Charbonneau G, Vanderschoot J. Characteristics of breath sounds andadventitious respiratory sounds. European Respiratory Review. 2000, 77(10):591–596.
[3] Sovijärvi ARA, Dalmasso F, Vanderschoot J, Malmberg LP, Righini G, Stoneman SAT. Definition ofterms for applications of respiratory sounds. European Respiratory Review. 2000, 77(10):597–610.
[4] Fenton TR, Pasterkamp H, Tal A, Chernick V. Automated spectral characterization of wheezing inasthmatic children. IEEE Transactions on Biomedical Engineering. 1985, 32(1):50–55.
[5] Wodicka GR, Stevens KN, Golub HL, Cravalho EG, Shannon DC. A model of acoustic transmissionin the respiratory system. IEEE Transactions on Biomedical Engineering. 1989, 36(9):925–934.
[6] Shabtai-Musih Y, Grotberg JB, Gavriely N. Spectral content of forced expiratory wheezes during air,He, and SF6 breathing in normal humans. Journal of Applied Physiology. 1992, 72(2):629–635.
670 Automatic Wheezing Detection Based on Signal Processing of Spectrogram and Back-Propagation Neural Network
[7] Xu J, Chen Q, Zhang Y, Liu S. Spectrum analysis of lung sounds. Proceedings of the 11th AnnualInternational Conference of the IEEE Engineering in Medicine and Biology Society. 1989,5:1676–1677.
[8] Hadjileontiadis LJ, Panas SM. Nonlinear analysis of musical lung sounds using the bicoherence index.Proceedings of the 19th Annual International Conference of the IEEE Engineering in Medicine andBiology Society. 1997, 3:1126–1129.
[9] Jané R, Salvatella D, Fiz JA, Morera J. Spectral analysis of respiratory sounds to access bronchodilatoreffect in asthmatic patients. Proceedings of the 20th Annual International Conference of the IEEEEngineering in Medicine and Biology Society. 1998, 6(6):3203–3206.
[10] Jané R, Cortés S, Fiz JA, Morera J. Analysis of wheezes in asthmatic patients during spontaneousrespiration. Proceedings of the 26th Annual International Conference of the IEEE Engineering inMedicine and Biology Society. 2004, 2:3836–3839.
[11] Forkheim KE, Scuse D, Pasterkamp H. A comparison of neural network models for wheeze detection.Proceedings of IEEE Communication, Power, and Computing Conference. 1995, 1:214–219.
[12] Bahoura M, Pelletier C. New parameters for respiratory sound classification. Proceedings of IEEEElectrical and Computer Engineering Conference. 2003, 3:1457–1460.
[13] Bahoura M, Pelletier C. Respiratory sounds classification using Gaussian mixture models.Proceedings of IEEE Electrical and Computer Engineering Conference. 2004, 3:1309–1312.
[15] Waris M, Helistö P, Haltsonen S, Saarinen A, Sovijärvi ARA. A new method for automatic wheezedetection. Technology and Health Care. 1998, 6(1):33–40.
[16] Taplidou SA, Hadjileontiadis LJ, Penzel T, Gross V, Panas SM. WED: An efficient wheezing-episodedetector based on breath sounds. Proceedings of the 25th Annual International Conference of the IEEEEngineering in Medicine and Biology Society. 2003, 3:2531–2534.
[17] Taplidou SA, Hadjileontiadis LJ, Kittsas IK, Panoulas KI. On applying continuous wavelet transformin wheeze analysis. Proceedings of the 26th Annual International Conference of the IEEE Engineeringin Medicine and Biology Society. 2004, 2:3832–3835.
[18] Homs-Corbera A, Fiz JA, Morera J, Jané R. Time-frequency detection and analysis of wheezes duringforced exhalation. IEEE Transactions on Biomedical Engineering. 2004, 51(1):182–186.
[19] Lin BS, Lin BS, Wu HD, Chong FC, Chen SJ. Wheeze recognition based on 2D bilateral filtering ofspectrogram. Biomedical Engineering Applications, Basis & Communications. 2006, 18:128–137.
[20] Lin BS. Using back-propagation neural network for automatic wheezing detection. PhD dissertation,National Taiwan University, Taiwan, 2006.
[21] Taplidou SA, Hadjileontiadis LJ. Analysis of wheezes using wavelet higher order spectral features.IEEE Transactions on Biomedical Engineering. 2010, 57(7):1596–1610.
[22] Jin F, Krishnan S, Sattar F. Adventitious sounds identification and extraction using temporal–spectraldominance-based features. IEEE Transactions on Biomedical Engineering. 2011, 58(11):1596–1610.
[23] Uwaoma C, Mansingh G. Detection and Classification of Abnormal Respiratory Sounds on aResource-constraint Mobile Device. International Journal of Applied Information Systems. 2014,7(11):35–40.
[24] Kwan AM, Fung AG, Jansen PA, Schivo M, Kenyon NJ, Delplanque JP, Davis CE. Personal lungfunction monitoring devices. IEEE Sensors Journal. 2015, 15(4):2238–2247.
[25] Earis JE, Cheetham BMG. Current methods used for computerized respiratory sound analysis.European Respiratory Review. 2000, 77(10):586–590.
[26] Cheetham BMG, Charbonneau G, Giordano A, Helistö P, Vanderschoot J. Digitization of data forrespiratory sound recordings. European Respiratory Review. 2000, 77(10):621–624.
[27] Piirlä P, Sovijärvi ARA, Earis JE, Rossi M, Dalmasso F, Stoneman SAT, Vanderschoot J. Reportingresults of respiratory sound analysis. European Respiratory Review. 2000, 77(10):636–640.
[28] Jones A, Jones D, Kwong K, SC S. Acoustic performance of three stethoscope chest pieces.Proceedings of the 20th Annual International Conference of the IEEE Engineering in Medicine andBiology Society. 1998, 6(6):3219–3222.
[29] Scanlon MV. Acoustically monitor physiology during sleep and activity. Proceedings of the 1st JointBMES/EMBS Conference. 1999, 2:787.
[30] Moussavi Z. Vocal noise cancellation from respiratory sounds. Proceedings of the 23th AnnualInternational Conference of the IEEE Engineering in Medicine and Biology Society. 2001,3:2001–2003.
[31] Jamieson G, Cheetham BMG, Moruzzi JL, Earis JE. Digital signal processing of lung sound. IEEColloquium on Digital Signal Processing in Instrumentation. 1992, (9):7/1–7/4.
[32] Sun XQ, Cheetham BMG, Evans KG, Earis JE. Estimation of analogue pre-filtering characteristics forCORSA standardization. Technology and Health Care. 1998, 6(4):275–283.
[33] Struzinski WA, Lowe ED. A performance comparison of four noise background normalizationschemes proposed for signal detection systems. The Journal of the Acoustical Society of America.1984, 76(6):1738–1742.
[34] Long X, Cleveland WL, Yao YL. A new preprocessing approach for cell recognition. IEEETransactions on Information Technology in Biomedicine. 2005, 9(3):407–412.
[35] Shen S, Sandham W, Granat M, Sterr A. MRI fuzzy segmentation of brain tissue using neighborhoodattraction with neural-network optimization. IEEE Transactions on Information Technology inBiomedicine. 2005, 9(3):459–467.
[36] Walczak S. Artificial neural network medical decision support tool: predicting transfusionrequirements of ER patients. IEEE Transactions on Information Technology in Biomedicine. 2005,9(3):468–474.
[37] Heermann PD, Khazenie N. Classification of multispectral remote sensing data using a back-propagation neural network. IEEE Transactions on Geoscience and Remote Sensing. 1992,30(1):81–88.
672 Automatic Wheezing Detection Based on Signal Processing of Spectrogram and Back-Propagation Neural Network