AbstractIn many parts of the world, uncontrolled fires in sparsely populated areas are a major concern as they can quickly grow into large and destructive conflagrations in short time spans. Detecting these fires has traditionally been a job for trained humans on the ground, or in the air. In many cases, these manned solutions are simply not able to survey the amount of area necessary to maintain sufficient vigilance and coverage. This paper investigates the use of unmanned aerial systems (UAS) for automated wildfire detection. The proposed system uses low-cost, consumer-grade electronics and sensors combined with various airframes to create a system suitable for automatic detection of wildfires. The system employs automatic image processing techniques to analyze captured images and autonomously detect fire-related features such as fire lines, burnt regions, and flammable material. This image recognition algorithm is designed to cope with environmental occlusions such as shadows, smoke and obstructions. Once the fire is identified and classified, it is used to initialize a spatial/temporal fire simulation. This simulation is based on occupancy maps whose fidelity can be varied to include stochastic elements, various types of vegetation, weather conditions, and unique terrain. The simulations can be used to predict the effects of optimized firefighting methods to prevent the future propagation of the fires and greatly reduce time to detection of wildfires, thereby greatly minimizing the ensuing damage. This paper also documents experimental flight tests using a SenseFly Swinglet UAS conducted in Brisbane, Australia as well as modifications for custom UAS.
IntroductionHistorically, brush fires have dictated the shape of the Australian brush by consistently burning away large swaths of the Australian landscape. As the human population of Australia continues to increase, these widespread fires have become a significant hazard to the people and the land due to globalization and climate change. According to the office of Australian Emergency Management, authorities respond to an average of 54,000 bush fires each summer. The costs of these disasters include destruction of property, insurance
costs, damage to water supply, environmental damage, and nearly 200 deaths since the year 2000. In 2009 alone, there were over 2.5 billion dollars in damages, hence the significant research on brush fire detection and prevention in Australia [1].
One of the primary methods used by Australian authorities to detect fires is the Sentinel system. This system uses satellite imagery to detect the wildfires. However, this method, and similar methods are limited to favorable weather conditions, strong heat sources, a 1.5 km accuracy, and do not include the size of the fire. These methods have assisted authorities in combating and identifying fires but firefighting is still an extremely dangerous task that could be made safer, and simpler, with the help of aerial technology, specifically UAS technology [2].
UAS have the potential to remove human beings from dangerous tasks such as on-site fire line detection. UAS could also diminish the cost of manned aerial vehicle operations, such as helicopters, and reduce the risk of human fatality in the process. The purpose of this research is to utilize UAS in an efficient and inexpensive manner to detect bush fires with a consumer grade RGB visual camera. This method can provide a faster and more accurate approach to the issue.
The viability of using UAS for fire detection has been studied in the past. Currently, the National Aeronautics and Space Administration (NASA) is working to utilize small unmanned aerial systems (UAS) platforms outfitted with visual and infrared cameras to conduct aerial reconnaissance of fire prone regions. It is NASA's hope to replace the fire detection planes that fly over the Great Dismal Swamp National Wildlife Refuge with their UAS platform for the United States Department of the Interior's Fish and Wildlife Service [3]. Another group with the University of Seville in Spain is looking into similar solutions with visual and infrared cameras using multiple rotor craft working in collaboration to patrol an area to identify fires [4], [5].
The aim of this publication is to develop the field of aerial fire detection in the hope of making UAS a viable option for fire identification. Specifically, in this project, a UAS was equipped with a visual camera and was used to patrol the Australian brush to look for simulated fires.
Automatic Wildfire Detection and Simulation using Optical Information from Unmanned Aerial Systems
2015-01-2474
Published 09/15/2015
Christopher W. Lum, Alexander Summers, Brian Carpenter, and Angel RodriguezUniversity of Washington
Matthew DunbabinQueensland University of Technology
CITATION: Lum, C., Summers, A., Carpenter, B., Rodriguez, A. et al., "Automatic Wildfire Detection and Simulation using Optical Information from Unmanned Aerial Systems," SAE Technical Paper 2015-01-2474, 2015, doi:10.4271/2015-01-2474.
Downloaded from SAE International by Christopher Lum, Tuesday, September 15, 2015
Fire identification was achieved through the use of image processing algorithms that searched for the simulated fires in a scene. Once fires were identified, occupancy maps were created and a simulation performed to predict the potential spread of the fire over space and time. Knowing where the fire will be next would help firefighters mitigate the effects of the brush fires and ultimately take this technology one step closer to becoming a practical firefighting tool.
Experimental Hardware and Methodology
Experimental HardwareIn the experiment, a light-weight autonomous aircraft, the Swinglet UAS, equipped with a 16MP camera was utilized to capture aerial images of the survey area. An onboard GPS determined the 3-dimensional position of the Swinglet and communicated this information to the ground control station (GCS) via a radio module. A flight plan for the Swinglet was created using an aerial path defining software (eMotion 2). This software allowed for manipulation of waypoints, altitude, and picture events, over a given survey area of chosen dimensions. All set attributes were altered by the density of chosen flight paths and photo overlay. A GCS operator monitored the flight path of the Swinglet during transit to and from each waypoint to ensure airspace and flight path integrity. During each photo event the power to the motor was terminated to grant a vibration free period for the photo to be taken clearly. Once the Swinglet reached the home waypoint, the GCS operator requested the UAS to land. Upon recovery, images were uploaded to the GCS computer and checked for quality [6].
SwingletThe aircraft and associated ground station components are shown in Figure 1.
Figure 1. Swinglet UAS consisting of the aircraft, camera, GCS and manual control unit. Image from of SenseFly.com.
eMotion 2Pre-flight testing was available through the combination of eMotion 2™ and Google Earth ™ software. The software allowed the simulation of the UAS flight plans over the true test location.
The mission planning procedure of the eMotion 2 software required using Google Earth to acquire a satellite image of the survey site that would be overlaid on the geographic map found in eMotion 2. The area of interest could then be identified and enclosed by a custom boundary set within eMotion 2. Complex boundaries are possible,
however the particular area of interest at the experiment site allowed for a rectangular boundary to be sufficient. Within the set boundaries, the eMotion 2 software determines waypoints and transit paths that can be customized. All waypoints during the flight were set to an average altitude of 75 meters with 20 meter turn radii. The aircraft home way point acts as the starting point of its path as well as the termination and safe landing location. Mission parameters were manipulated to meet the optimal flight plan, altitude for a desired cm/pixel resolution, total area covered, and external inputs (such as wind conditions). Simulations display deviation of flight path due to real world issues such as low battery or constant and strong wind conditions, allowing for alteration under these factors [7].
Field ExperimentThe goal of the field experiment was to generate data sets of fires in the Australian outback that could be used to test the image processing and fire simulation algorithms. Experiments were conducted at the Samford Ecological Research Facility (SERF) in Brisbane, Australia [8]. Due to the dangerous nature of live fires in the Australian bush, a substitute for a live fire was required. The chosen substitute was flagging tape of varying color (orange/yellow) and width (5 & 15 cm). Mock fires were created using this fire substitute with the intent of creating fire lines similar to that of a bush fire. Acting as a baseline, a circular fire in an open field was used during the first flight to act as the target as seen in Figure 2.
Figure 2. Aerial view of a simulated circular fire at SERF.
Ground Station and Controls (GCS)The ground control station consisted of a computer installed with eMotion 2 software and a radio module that communicated to the Swinglet. The GCS allowed for on-site mission planning and modification. Parameters consisting of ground covered, mission time, and resolution were fixed and could be uploaded to the UAS wirelessly. Safe control of the UAS from GCS is achieved by commanding the UAS to the home waypoint, and forced landing at any time.
Experimental Conditions and Flight ParametersFlight conditions during the experimental procedure were favorable. Fairly low environmental disturbances were present (i.e. low wind speed and good visibility). Since the experimental conditions, shown
Downloaded from SAE International by Christopher Lum, Tuesday, September 15, 2015
in Table 1, were similar to the calibration test conditions, the Swinglet data was able to accurately capture images with the required resolution [6].
Table 1. Atmospheric conditions during flight testing.
Image Processing and Fire Detection
The Theoretical Algorithm and ProcedureAfter obtaining images from the Swinglet, image processing tools were utilized to create an algorithm that could detect and highlight the simulated fire line on to the original image. Before processing the images taken during the experiment, an image of a real fire was used to test the effectiveness of the algorithm. The picture used to test the image processing techniques used can be seen in Figure 3.
Figure 3. Aerial Photo of an actual fire used to test image processing algorithms.
The initial step, and key component of the algorithm, was converting the original red, green, blue (RGB) image of the fire into a modified grayscale image that mapped the color of the fire to the highest intensity. Standard algorithms and implementations can be used for this mapping. A major disadvantage of a standard image grayscale conversion is that the user is unable to specify how a given RGB value is mapped to intensity. Therefore, a custom mapping from the RGB triplet to an intensity scalar is used. This algorithm computes the Euclidean 2-norm distance between a pixel in question and the desired fire color. The intensity is then mapped to be a function of this distance in color space. The end effect is that colors that are closer to the desired fire color are mapped to a higher intensity while the rest are obscured as shown in Figure 4. The custom conversion thus allowed for the isolation of the color of the fire line alone which improved upon the default grayscale function that assigned the smoke a similar intensity to the fire line.
Figure 4. Normal grayscale image (left), customized grayscale to isolate the fire from the smoke (right).
To accentuate the fire line, a threshold from the customized grayscale image was employed. This threshold was mapped from a desired RGB value. However, it should be noted that the exact color to be mapped for the threshold may be varied since not all fires will burn at the exact same color depending on the type of fuel and environmental factors. In addition, different photographing conditions may produce different results even for the same fire, i.e., images obtained during a very bright period as opposed to overcast conditions will yield fires of slightly different colors captured by the Swinglet. By considering the aggressiveness of the filter within the custom grayscale function, it was possible to include all of the fire line while simultaneously excluding other objects that are close to the color of the fire. A higher threshold causes only pixels that are close to the color of interest to be mapped at a high intensity. Likewise, a lower threshold causes pixels that are not as close to the color of interest to be mapped at a high intensity. Further image processing was achieved after the appropriate intensity map was created. To isolate the fire line from the rest of the image, an edge function was applied as seen in Figure 5. This returns a binary image after specifying a threshold value.
Figure 5. Edge function applied to the isolated fire line.
This binary image was then morphologically closed. By doing so, image pixels were dilated followed by erosion. The structuring element chosen specified how the image was being dilated and eroded. In this case, the target was to find lines in the image; therefore a linear structuring element was used. Essentially, the morphological operation first made the image brighter and then proceeded to make the image darker in an attempt to restore a more continuous fire line, making it more prominent by eliminating the random pixels possibly picked up earlier in the algorithm.
Finally, the perimeter function was used to outline the final result. The morphological operations and applied perimeter process can be seen in Figure 6.
Downloaded from SAE International by Christopher Lum, Tuesday, September 15, 2015
The perimeter could then be highlighted with a specified color to represent a bush fire front. The highlighted image was then superimposed back onto the original RGB image. This final RGB image with a highlighted fire line can be seen in Figure 7.
Though most fires are similar, the colors and intensity may vary given wind, time, shadow, and vegetation conditions. Also, as mentioned earlier, lighting of the images captured may not be consistent due to weather conditions, such as brightness from the sun. When the colors of the fire image are not within reasonable range of the default color specified to distinguish the fire line, the performance begins to deteriorate. Therefore, the algorithm was designed to allow for online parameter tuning to adapt to these changing scenarios.
In this study, to determine the spatial extent of the fire front, multiple images collected by the Swinglet UAS were transformed into a single ortho-rectified image. A structure-from-motion program such as AgiSoft PhotoScan Pro is capable of creating such otho-rectified imagery as well as 3-dimensional models. These types of modeling are increasingly common for making three dimensional models of cities and construction sites. The level of detail and accuracy may be relatively low but this is somewhat mitigated by its ability to function in dynamic environments as multiple pictures are used to construct the 3D model [9]. For the purposes of this experiment, this type of software is sufficient since the Swinglet is capable of rapidly surveying an area while obtaining the necessary pictures to build a 3D model that accurately describes where the fire was when the pictures were taken.
Figure 6. Morphological close (Top), Perimeter function applied (Bottom).
Figure 7. RGB image with fire line highlighted in green.
The images captured by the Swinglet were aligned and a point cloud was created with corresponding GPS data. From there, a mesh was built to stitch the images together. Here, the overlap of the images was necessary to yield a continuous orthophoto. Additionally, model texture was added to the mesh creating the resulting ortho-rectified image as shown in Figure 8. This image could be used as input to the image processing algorithm. This technique has applications for aerial mapping, terrain modeling, and other types of environmental monitoring.
Figure 8. Orthorectified photo of SERF site with simulated fire lines.
Image Processing ResultsFigure 2 shows an artificial fire created at SERF which consists of red and yellow flagging tape in a circle. This image was used as input to the previously described image processing algorithm (without the edge and perimeter functions). The result was then highlighted in green and superimposed on the original image as shown in Figure 9.
Figure 9. Intensity Map (left), Morphological close (middle), Image with perimeter highlighted (right).
Downloaded from SAE International by Christopher Lum, Tuesday, September 15, 2015
In addition to the simple fire case of Figure 9, other fire scenarios of varying complexity were constructed at SERF to evaluate algorithm performance. In Figure 10, the flagging tape was placed under a tree where it was more difficult to see from the aerial view of the Swinglet. The variation in brightness due to the casting shadow of the trees also contributed to the difficulty in visually detecting the fire line.
Interestingly, from the original image even a human observer would have difficulty seeing this potential fire. Of course, in this case there was no smoke which potentially would make it easier for humans to detect. The effect of smoke on fire detection is an area for future work.
As shown in Figure 11, the flagging tape was highlighted in red, indicated the algorithm was able to successfully detect of the artificial fire despite the more difficult conditions [10].
Figure 10. SERF simulated fire under tree with shadow occlusions. Fire bounded by white rectangle.
Figure 11. Detection results of the SERF mock fire under trees. Areas of detected fire are highlighted in red.
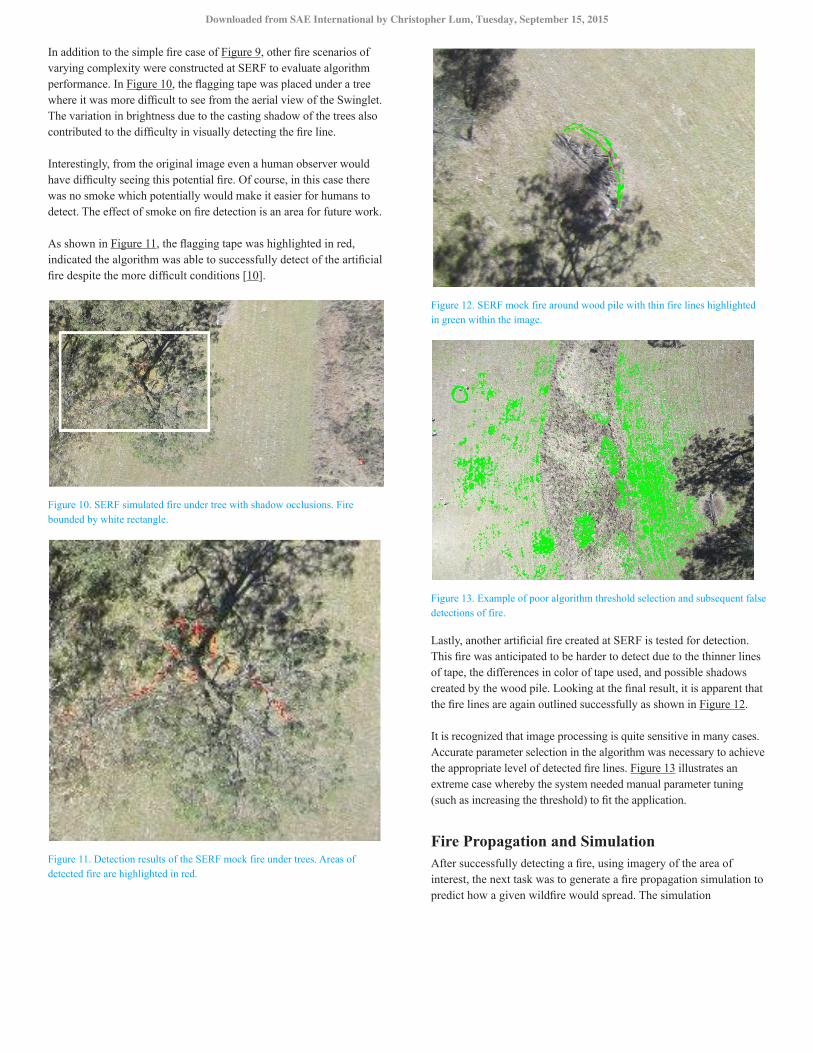
Figure 12. SERF mock fire around wood pile with thin fire lines highlighted in green within the image.
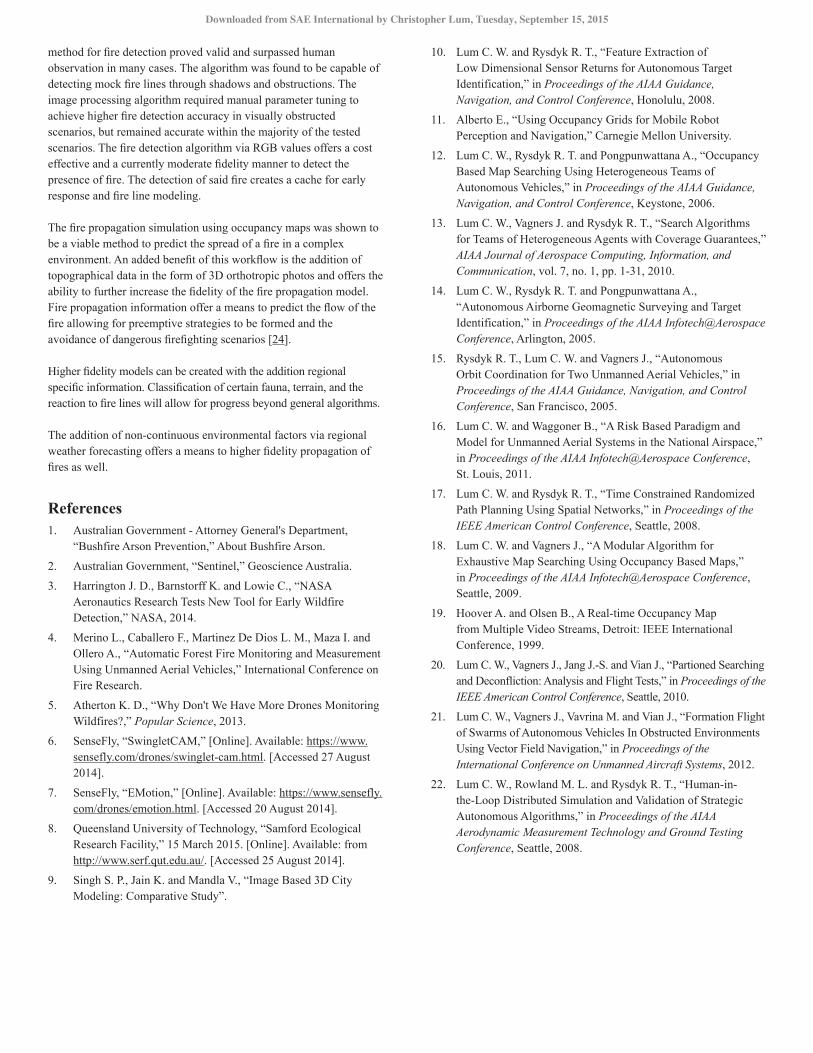
Figure 13. Example of poor algorithm threshold selection and subsequent false detections of fire.
Lastly, another artificial fire created at SERF is tested for detection. This fire was anticipated to be harder to detect due to the thinner lines of tape, the differences in color of tape used, and possible shadows created by the wood pile. Looking at the final result, it is apparent that the fire lines are again outlined successfully as shown in Figure 12.
It is recognized that image processing is quite sensitive in many cases. Accurate parameter selection in the algorithm was necessary to achieve the appropriate level of detected fire lines. Figure 13 illustrates an extreme case whereby the system needed manual parameter tuning (such as increasing the threshold) to fit the application.
Fire Propagation and SimulationAfter successfully detecting a fire, using imagery of the area of interest, the next task was to generate a fire propagation simulation to predict how a given wildfire would spread. The simulation
Downloaded from SAE International by Christopher Lum, Tuesday, September 15, 2015
environment was based on a method of discretizing the environment into a series of 2D rectangular cells. Each of these cells represented the state of the physical world at a given location. The collection of cells is often referred to as an occupancy map. This framework has been successfully and widely used in the fields of computer perception and map building [11], [12], [13].
The system operates as a finite state machine where the state of each cell can transitions to another state after an appropriate event occurs. The fire propagation algorithm updated each cell state based on its previous state and surroundings thus creating a means for predicting potential fire propagation pathways.
Within this study, occupancy maps cell states were varied to simulate scenarios of varying environments. Cell states were created to represent various flammable terrain, inflammable terrain, burnt zones, actively burning fires of various intensities, and even firefighting zones. Each cell was given a numeric number matching the aforementioned states and grids of these cells simulating the environment surrounding the detected fire were thus manually created. The size of the occupancy map and resolution were tunable parameters and followed the developer's discretion [14].
The Theoretical Algorithm and ProcedureAn occupancy map takes the form of a matrix. The cells of this matrix hold values that relate the matrix to a set of states. An example of a simple wildfire model would have a discrete set of states of
(1)
where
s1 = unburnt flammable material (green)
s2 = burning flammable material (red)
s3 = inflammable material (grey)
s4 = burnt material (black)
A visual example of a wild fire occupancy map can be seen in Figure 14. Here a fire is burning outside of an inflammable barrier which protects the unburnt flammable material.
Figure 14. Visual representation of occupancy map.
The occupancy map is referred to as the state of the world, xw(k), as it represents the state of the fire in the environment at the given time step, k. Knowing this, the occupancy map can be propagated forward in time so that the state changes based on an algorithm designed to determine the next state from the current state of the cell and the state of the surroundings cells. The state of the finite state machine can include the state of the world for several prior time steps, thereby allowing a degree of temporal dependence on the model.
(2)
The importance of recording past states increases as more complex fire propagation algorithms are used. This is due to the fact that fires may burn for longer than one time step or the manner in which a state transitions to another may be considered in the next propagation step.
In order for a flammable cell to burn, a fire cell must be detected at one of the four neighboring cells (North, East, South, or West). The fire algorithms takes into consideration the flammability levels of the terrain. The flammability of cells was modeled under the premise that the cells physical moisture content, describing environments from damp vegetation to dry brush, would affect the flammability of that cell. Other cells were created such that the cell state was permanently inflammable to mark areas such as rocks or rivers, where fire propagation among cells was impossible. A logic tree can be seen in Figure 15 demonstrating the possible state flow with time.
Figure 15. Finite state machine model for cell state transformation within the wildfire propagation model.
A series of algorithms were created to simulate different models of propagating fires. Common across each algorithm was the presence of a function to determine proximity to cells signaling fire status and the effect this presence would have on the current cell. Namely the fire algorithm would use the current state of a given cell's neighbors based on the x-y position within the occupancy map matrix.
Algorithms varied from deterministic to stochastic in nature. Stochastic models made use of a probability factor added to each cell and varied between simulations allowing for different results with each iteration. Deterministic models have no stochastic factors and
Downloaded from SAE International by Christopher Lum, Tuesday, September 15, 2015
thus generate repeatable outcomes. The probability factor within the stochastic algorithm altered the flammability of each cell. In other words, the cell would ignite in reference to a setting of different thresholds, demonstrated in the pseudo-code shown below.
The stochastic method replicates the uncertainty of reality by having each cell behave uniquely. The stochastic elements allow for unpredictable actions, and offer new situations. The threshold could be altered to change algorithm probabilities to match a fire on a very hot, dry site or a fire on a damp site where the humidity is higher or rainfall was recently recorded. No end result of a simulation will be identical but each simulation would exhibit similar trends. True propagation scenarios can be found via the summation of stochastic trials over a given region.
Complex algorithms simulated fire propagation under the influence of wind conditions [15]. These simulations directed the movement of fire lines to coincide with wind direction. Wind can be either deterministic or stochastic. In deterministic propagation the algorithm is altered to allow fire passage to flow in one direction if wind speed exceeds a certain value, or propagates more slowly with each time step.
Fire Simulation ResultsThe simulations of fire propagation varied in complexity and were made to model experimental scenarios and practical applications of interest. Some simulations consisted of relatively simple cell states and environmental conditions.
The first fire simulation designed was that of a circular, artificial fire created during experimentation at SERF with wind coming from the Northeast, shown in Figure 16. This was accomplished by having an active cell only be affected by the status of cells to the North and East.
Figure 16. Simulation of two fires with a Northeasterly wind.
Within this simulation a flammable field was ignited at 2 spots to simulate multiple lightning strikes as a source of ignition. In the model, the wind pushes the fire to the Southwest, as would be expected in a real world fire with a Northeasterly wind. The small patches of unburnt material after the fire had passed indicate areas where the stochastic nature of the model allowed a cell to remain
unburnt long enough for the fire to pass. Modeling the wind was accomplished by running the cell states in the same manner as previous simulations, but in this iteration the cells were only affected by the neighboring cells to the North and East. The second simulation modeled an experimental fire at SERF with the addition of a fire break line to demonstrate firefighting efforts, shown in Figure 17.
Figure 17. Fire simulation with fire break lines.
It should be noted that the inflammable lake and fire line have not burned. The wind has directed the fire to the Southwest once more. The fire line, marked in orange also funneled the fire toward the lake and stopped its passage south of the fire line.
A model of a simulated fire at SERF can be seen in Figure 18. This scenario simulates a dry area, seen as yellow and brown, and a wet forested area, seen in green. This fire algorithm follows the previously described algorithm properties. The propagation from Figure 18 does involve a long burn (seen in red) which transitions into a shorter burn (seen yellow) and propagates outward unimpeded by wind.
Figure 18. Stochastic model of simulated SERF fire with varying cell states.
The simulation proves viable as the area of flammable material is entirely burnt while the wet areas remain mostly intact. These results match those expected of an area like this. If Figure 18 were to be a deterministic model, we would see that if one tree in the forest burned, all of the trees would burn. This model can be seen to be stochastic since the fire burns inconsistently within the forested regions of Figure 18 due to the threshold of each individual forest cell possessing different properties or flammability, just like a real forest.
Downloaded from SAE International by Christopher Lum, Tuesday, September 15, 2015
The simulation displayed in Figure 19 was designed to model the effects firefighting techniques could have on the propagation of brush fires at the SERF. Within the model, a fire was set along a dry river bed that would cause an unobstructed fire to eventually burn down the house present at the SERF. The digging of a fire line, seen in black, around the house was also included to simulate efforts from a firefighting team working towards combating the fire to save the house.
Figure 19. SERF fire with fire lines.
It was found that the digging of fire lines was viable and capable method of preserving the flammable area. The fire lines were designed to propagate at the same rate as a fire in one direction only. This decision was made to simulate the efforts of one team of onsite fire fighters digging in a single, optimized direction. This scenario demonstrates how the system could be altered and updated to account for real time alterations to the environments by firefighters, or to theorize possible firefighting scenarios to find an optimal firefighting plan.
The final example seen in Figure 20 demonstrates an alternative algorithm simulation of the SERF environment. This scenario has a weak Southeasterly wind to impede the propagation of the 3 small fires in the opposite direction.
Figure 20. Simulation of SERF fire.
The simulation demonstrates the ability to mimic certain occurrences, such as trees, seen as brown protected by a green layer, that require more time in contact with a fire to burn, but in turn burn longer once ignited as denoted by the red squares. The alternative algorithm proves viable as the flammable area is burnt while the wet areas are not burned consistently. The presence of wind and the stochastic nature of the propagation lead to some flammable areas remaining unburnt, an event that proves true in reality. In this scenario wet areas surrounding the river can be seen to have dried but not burnt, another realistic possibility.
These simulations demonstrate how the occupancy maps can be manually created and manipulated to accurately simulate controlled scenarios. By generating these occupancy maps the UAS could go
from fire detection to fire monitoring, providing real time information concerning the fire location as well as providing probable propagation routes based on current conditions.
Future Work
Merging Detection and SimulationThe next logical step is to merge the fire detection and fire propagation system into a multi-faceted algorithm capable of completing both through a series of event triggers as shown in Figure 21.
The final system could involve a UAS being sent to an area of high fire probability with the goal of detecting a fire. The UAS could scan until a fire detection event is triggered by the image processing algorithm. The UAS would then notify the presence of this fire to the GCS which would then visually confirm the fire and disseminate the information to emergency response teams once the fire was confirmed. The UAS would then create an orthorectified photo of the fire and its surrounding terrain via its RGB camera. This information could once again be disseminated to emergency response teams to allow for an effective first response [16]. In addition, the orthophoto could then be propagated forward in time, via the propagation algorithm, allowing for continuously effective response to the expected fire course and even allow for early warnings to be sent to populated areas [17]. This is a possible desired event flow of a UAS fire monitoring system.
Figure 21. Block diagram of the final fire detection system.
RGB Landscape to Occupancy Map MethodAn alternative method for occupancy map creation was developed to avoid the manual creation of occupancy maps from a given RGB photo. The previous method involved examination of an aerial photo and designation of cell states by a human operator. The alternative method takes an aerial photo and directly converts the given image into an occupancy map with automatically designated cell states.
The algorithm requires an RGB photo of a given landscape and smoothed terrain data. Pixels of varying RGB values are sectioned of into cells of an overlaid grid on the photo. The pixels within each cell are then averaged to find the overall mean RGB value that describes the cell terrain within that specific cell. This method avoids the presence of small outliers which may affect fire detection such as reflections, shadows, or rooftops. This type of simulation has been used in the past, including its use to build small occupancy maps based on real time video rates [18], [19].
Downloaded from SAE International by Christopher Lum, Tuesday, September 15, 2015
An occupancy map can then be created that describes the true environment of an aerial photo. An aerial survey can be taken and stored to maintain an environmental map of given areas with high fire probability. An example of the RGB to occupancy map conversion can be seen in Figure 22.
Figure 22. Landscape to occupancy map conversion.
Following occupancy map conversion, RGB data for each cell was noted and converted into an appropriate cell state. Each cell was given a specified level of fire resistance which defined its status as burning, unburnt, or burnt. The cell state for each cell was set to an initial value above the burning threshold and then altered based on its RGB value. Cell states describing areas of varying tolerance and inflammability were detected using a method similar to that of RGB fire detection. Areas detected with moisture, denoted by a green hue, were considered more fire resistant and thus the fire resistance of those cells was modified to account for this. The opposite occurred with areas of low moisture, denoted by a yellow hue.
The algorithm then propagated each cell forward and altered the cell states based on surrounding cells. The presence of fire near a cell changed the internal fire resistance of each cell until the fire had passed or the cell itself was burning. The change in fire resistance accounts for the number of burning cells in contact with a given cell and increases with the number of burning neighboring cells. Once the threshold has been passed, the cell begins to burn and will change cell state regardless of whether or not the cell is currently surrounded by fire. The rate of fire resistance loss due to burning can be adapted to match the given detected material. Once the cell completely loses its internal fire resistance the cell will be in the burnt state and thus no longer has an effect on the surroundings. This algorithm allows cells to remain unburnt should nearby cells burn out before contact is held for enough time steps to pass the burning threshold. An example fire can be seen in Figure 23.
Figure 23. Fire propagation using landscape to occupancy map algorithm.
The fire seen in red propagates outward, the area enclosed by the fire is considered burnt and is denoted in black, and all other cell colors denote remaining fire resistance above the burning threshold.
It should be noted that this method is only viable if the picture is taken from a top down angle. Any sky caught by the camera will be assumed part of the environment to be modeled and given a cell state. The top view method is viable as this was the likely manner of camera mounting on a UAS. Future models could include the ability to model the sky as inflammable region, but regardless of this the propagation rate will be skewed as the angle is off so objects near the fire will burn at the same rate as objects near the camera despite variations in size, density, etc. which will need to be taken into account in future models.
UAS ApplicationThe University of Washington is currently constructing the Topography and Ecology Data Drone (TEDD,) which is a UAS capable of mapping an area of interest in a cost effective manner. This current system will act as an example platform for the creation of a fire detecting UAS [20], [21].
TEDD offers the two main requirements for an effective detection and monitoring system of this type, a downward facing RGB camera and a capable GPS unit. The RGB camera would be connected to a simple target computer capable of computing the less computationally strenuous RGB detection algorithm. Once successful fire detection is triggered, the UAS will begin to circle the area and create a spread of RGB photos and send this information back to ground control along with the GPS and pose coordinates of each picture location. The UAS will remain in this circling pattern until ground control either confirms or denies the fire detection. A denial will lead to a command of the UAS to ignore this area. If confirmed the system will move radially outward creating a basic landscape for initial propagation.
At this point the GCS operator may designate areas of importance where fire propagation information is required to be more accurate. The UAS will continue to radially move outward to a set distance before returning to its initial position above the fire. The process will then be repeated allowing for updated fire propagation models to be created until the fire is contained or the operation is terminated by ground control [22].
First ResponseShould a system such as this become effective in fire monitoring and cost, the next step would be to create a first response system capability. Such a UAS would be capable of dropping a flame retardant payload capable of dealing with small fires, and may be able to bias the propagation direction of medium sized fires for firefighting or preservation purposes [23]. This area is open to further investigation and will require cooperation between multiple federal departments.
Summary/ConclusionsThis paper has proposed an algorithm for the detection and simulation of fire propagation from UAS collected imagery. The image processing algorithm used only RGB images and proved effective in identifying fire fronts. The accuracy of this algorithm as a
Downloaded from SAE International by Christopher Lum, Tuesday, September 15, 2015
method for fire detection proved valid and surpassed human observation in many cases. The algorithm was found to be capable of detecting mock fire lines through shadows and obstructions. The image processing algorithm required manual parameter tuning to achieve higher fire detection accuracy in visually obstructed scenarios, but remained accurate within the majority of the tested scenarios. The fire detection algorithm via RGB values offers a cost effective and a currently moderate fidelity manner to detect the presence of fire. The detection of said fire creates a cache for early response and fire line modeling.
The fire propagation simulation using occupancy maps was shown to be a viable method to predict the spread of a fire in a complex environment. An added benefit of this workflow is the addition of topographical data in the form of 3D orthotropic photos and offers the ability to further increase the fidelity of the fire propagation model. Fire propagation information offer a means to predict the flow of the fire allowing for preemptive strategies to be formed and the avoidance of dangerous firefighting scenarios [24].
Higher fidelity models can be created with the addition regional specific information. Classification of certain fauna, terrain, and the reaction to fire lines will allow for progress beyond general algorithms.
The addition of non-continuous environmental factors via regional weather forecasting offers a means to higher fidelity propagation of fires as well.
References1. Australian Government - Attorney General's Department,
“Bushfire Arson Prevention,” About Bushfire Arson.
2. Australian Government, “Sentinel,” Geoscience Australia.
3. Harrington J. D., Barnstorff K. and Lowie C., “NASA Aeronautics Research Tests New Tool for Early Wildfire Detection,” NASA, 2014.
4. Merino L., Caballero F., Martinez De Dios L. M., Maza I. and Ollero A., “Automatic Forest Fire Monitoring and Measurement Using Unmanned Aerial Vehicles,” International Conference on Fire Research.
5. Atherton K. D., “Why Don't We Have More Drones Monitoring Wildfires?,” Popular Science, 2013.
6. SenseFly, “SwingletCAM,” [Online]. Available: https://www.sensefly.com/drones/swinglet-cam.html. [Accessed 27 August 2014].
7. SenseFly, “EMotion,” [Online]. Available: https://www.sensefly.com/drones/emotion.html. [Accessed 20 August 2014].
8. Queensland University of Technology, “Samford Ecological Research Facility,” 15 March 2015. [Online]. Available: from http://www.serf.qut.edu.au/. [Accessed 25 August 2014].
9. Singh S. P., Jain K. and Mandla V., “Image Based 3D City Modeling: Comparative Study”.
10. Lum C. W. and Rysdyk R. T., “Feature Extraction of Low Dimensional Sensor Returns for Autonomous Target Identification,” in Proceedings of the AIAA Guidance, Navigation, and Control Conference, Honolulu, 2008.
11. Alberto E., “Using Occupancy Grids for Mobile Robot Perception and Navigation,” Carnegie Mellon University.
12. Lum C. W., Rysdyk R. T. and Pongpunwattana A., “Occupancy Based Map Searching Using Heterogeneous Teams of Autonomous Vehicles,” in Proceedings of the AIAA Guidance, Navigation, and Control Conference, Keystone, 2006.
13. Lum C. W., Vagners J. and Rysdyk R. T., “Search Algorithms for Teams of Heterogeneous Agents with Coverage Guarantees,” AIAA Journal of Aerospace Computing, Information, and Communication, vol. 7, no. 1, pp. 1-31, 2010.
14. Lum C. W., Rysdyk R. T. and Pongpunwattana A., “Autonomous Airborne Geomagnetic Surveying and Target Identification,” in Proceedings of the AIAA Infotech@Aerospace Conference, Arlington, 2005.
15. Rysdyk R. T., Lum C. W. and Vagners J., “Autonomous Orbit Coordination for Two Unmanned Aerial Vehicles,” in Proceedings of the AIAA Guidance, Navigation, and Control Conference, San Francisco, 2005.
16. Lum C. W. and Waggoner B., “A Risk Based Paradigm and Model for Unmanned Aerial Systems in the National Airspace,” in Proceedings of the AIAA Infotech@Aerospace Conference, St. Louis, 2011.
17. Lum C. W. and Rysdyk R. T., “Time Constrained Randomized Path Planning Using Spatial Networks,” in Proceedings of the IEEE American Control Conference, Seattle, 2008.
18. Lum C. W. and Vagners J., “A Modular Algorithm for Exhaustive Map Searching Using Occupancy Based Maps,” in Proceedings of the AIAA Infotech@Aerospace Conference, Seattle, 2009.
19. Hoover A. and Olsen B., A Real-time Occupancy Map from Multiple Video Streams, Detroit: IEEE International Conference, 1999.
20. Lum C. W., Vagners J., Jang J.-S. and Vian J., “Partioned Searching and Deconfliction: Analysis and Flight Tests,” in Proceedings of the IEEE American Control Conference, Seattle, 2010.
21. Lum C. W., Vagners J., Vavrina M. and Vian J., “Formation Flight of Swarms of Autonomous Vehicles In Obstructed Environments Using Vector Field Navigation,” in Proceedings of the International Conference on Unmanned Aircraft Systems, 2012.
22. Lum C. W., Rowland M. L. and Rysdyk R. T., “Human-in-the-Loop Distributed Simulation and Validation of Strategic Autonomous Algorithms,” in Proceedings of the AIAA Aerodynamic Measurement Technology and Ground Testing Conference, Seattle, 2008.
Downloaded from SAE International by Christopher Lum, Tuesday, September 15, 2015
23. Ueunten K., Lum C. W., Creigh A. A. and Tsujita K., “Conservative Algorithms for Automated Collision Awareness for Multiple Unmanned Aerial Systems,” in Proceedings of the IEEE Aerospace Conference, Big Sky, 2015.
24. Lum C. W., Gauksheim K. R., Vagners J. and McGeer T., “Assessing and Estimating Risk of Operating Unmanned Aerial Systems in Populated Areas,” in Proceedings of the AIAA Aviation Technology, Integration, and Operations Conference, 2011.
Contact InformationChristopher [email protected](206) 685-1182University of WashingtonBox 352400Seattle, WA 98195-2400
AcknowledgmentsFirst and foremost, the authors would like to thank Stephanie Gardner, Cathryne Jordan, and Kesia Ceniceros from the University of Washington (UW) for coordinating the study abroad research program with Queensland University of Technology (QUT). The authors would also like to thank QUT for hosting our research team and providing support for this project. First and foremost, Michael Warren was incredibly helpful and generous in supporting this experiment and resulting data reduction. This project would not have been possible without his expert advice. We would also like to acknowledge the Institute for Future Environments and the Samford Ecological Research Facility (SERF) for allowing and enabling flight experiments on their facilities. We would like to thank Baptiste Tripard from SenseFly for providing educational software licenses for the Swinglet control software.
The Engineering Meetings Board has approved this paper for publication. It has successfully completed SAE’s peer review process under the supervision of the session organizer. The process requires a minimum of three (3) reviews by industry experts.
All rights reserved. No part of this publication may be reproduced, stored in a retrieval system, or transmitted, in any form or by any means, electronic, mechanical, photocopying, recording, or otherwise, without the prior written permission of SAE International.
Positions and opinions advanced in this paper are those of the author(s) and not necessarily those of SAE International. The author is solely responsible for the content of the paper.
ISSN 0148-7191
http://papers.sae.org/2015-01-2474
Downloaded from SAE International by Christopher Lum, Tuesday, September 15, 2015