Q Pulse No: POCT-VR-031 Version No: 1.0 Date: July 2017 Page 1 of 19 Automation of urinalysis at the Point of Care across Imperial College Healthcare NHS Trust – a pilot project Project lead and author: Olubunmi Martindale-Sheldon Co-investigators: Gareth John, Kate Agunabor, Wilbert Gwangwadza and Edwin Turner Senior responsible officer and report approver: Prof Tricia Tan 1. Introduction POCT urinalysis involves carrying out urine chemistry tests at the Point of care, nearer to the patients. The POCT urinalysis reagent strips allow for the measurements of the following in urine: Bilirubin, Blood, Glucose, Ketones, Leukocytes, Nitrite, pH, Protein, Specific Gravity and Urobilinogen (depending on the strip type). These measurements are used to assist diagnosis in the following areas: kidney function, urinary tract infections, metabolic disorders (such as diabetes mellitus) and liver function. The urinalysis strips also measure physical characteristics including acid-base balance and urine concentration. POCT urinalysis is in use across all Divisions in over 150 clinical areas within Imperial Healthcare NHS Trust, with an annual usage figure of >300,000 test strips (based on 2013/2014 figures received from Pharmacy). POCT urinalysis is generally used in the Trust to screen patients so that only positive samples are sent to the Lab for confirmation or further analysis. It is generally recommended that the original sample be sent to the laboratory if any of the following analytes are positive: Blood, Protein, Nitrite or Leukocyte. 1.1 Background POCT urine chemistry analysis is currently being done manually (dipstick method) across the majority of clinical areas requiring this service at Imperial College Healthcare NHS Trust. The dipstick method is based on colour development and it relies on the ability of the user to accurately interpret the colour type and intensity. This method is subjective and open to interpretational error. Test results are transcribed into patient notes with potential for transcription error. No quality assurance procedures such as Internal Quality Control or External Quality Assurance (IQC or EQA) are in place and it is difficult to prevent use by untrained staff. There is significant potential for erroneous results and inappropriate/delayed patient management (e.g. missed cases of urinary tract infection [UTI]). It is anticipated that automating the processes from testing through to reporting will significantly minimise the risks to patient safety whilst safeguarding staff and the Trust (in cases of litigation or patient queries). The automated readers have a QC and operator lock-out facility ensuring only trained staff can use the device and appropriate QC checks are carried out prior to patient test. Test results will automatically transmit to electronic patient records – saving staff’s time and eliminating possible transcription errors. Results will be readily accessible and traceable with a full audit trail. The safety and governance measures associated with the fully automated systems will enable the Trust to demonstrate compliance with relevant quality standards such as MHRA/UKAS and achieve accreditation for the service.
Transcript
Q Pulse No: POCT-VR-031 Version No: 1.0 Date: July 2017
Page 1 of 19
Automation of urinalysis at the Point of Care across Imperial College Healthcare NHS Trust – a
pilot project
Project lead and author: Olubunmi Martindale-Sheldon
Co-investigators: Gareth John, Kate Agunabor, Wilbert Gwangwadza and Edwin Turner
Senior responsible officer and report approver: Prof Tricia Tan
1. Introduction
POCT urinalysis involves carrying out urine chemistry tests at the Point of care, nearer to the patients.
The POCT urinalysis reagent strips allow for the measurements of the following in urine: Bilirubin,
Blood, Glucose, Ketones, Leukocytes, Nitrite, pH, Protein, Specific Gravity and Urobilinogen
(depending on the strip type). These measurements are used to assist diagnosis in the following
areas: kidney function, urinary tract infections, metabolic disorders (such as diabetes mellitus) and
liver function. The urinalysis strips also measure physical characteristics including acid-base balance
and urine concentration.
POCT urinalysis is in use across all Divisions in over 150 clinical areas within Imperial Healthcare
NHS Trust, with an annual usage figure of >300,000 test strips (based on 2013/2014 figures received
from Pharmacy).
POCT urinalysis is generally used in the Trust to screen patients so that only positive samples are
sent to the Lab for confirmation or further analysis. It is generally recommended that the original
sample be sent to the laboratory if any of the following analytes are positive: Blood, Protein, Nitrite or
Leukocyte.
1.1 Background
POCT urine chemistry analysis is currently being done manually (dipstick method) across the majority
of clinical areas requiring this service at Imperial College Healthcare NHS Trust.
The dipstick method is based on colour development and it relies on the ability of the user to
accurately interpret the colour type and intensity. This method is subjective and open to
interpretational error. Test results are transcribed into patient notes with potential for transcription
error. No quality assurance procedures such as Internal Quality Control or External Quality Assurance
(IQC or EQA) are in place and it is difficult to prevent use by untrained staff. There is significant
potential for erroneous results and inappropriate/delayed patient management (e.g. missed cases of
urinary tract infection [UTI]).
It is anticipated that automating the processes from testing through to reporting will significantly
minimise the risks to patient safety whilst safeguarding staff and the Trust (in cases of litigation or
patient queries). The automated readers have a QC and operator lock-out facility ensuring only
trained staff can use the device and appropriate QC checks are carried out prior to patient test. Test
results will automatically transmit to electronic patient records – saving staff’s time and eliminating
possible transcription errors. Results will be readily accessible and traceable with a full audit trail.
The safety and governance measures associated with the fully automated systems will enable the
Trust to demonstrate compliance with relevant quality standards such as MHRA/UKAS and achieve
accreditation for the service.
Q Pulse No: POCT-VR-031 Version No: 1.0 Date: July 2017
Page 2 of 19
This project involves piloting automated readers and assessing the benefits over the manual dipstick
method, with the hope of rolling urinalysis automation to the rest of the Trust.
1.2 Aim
• The aim of the project is to pilot use of fully networked automated readers and assess the benefits of this method over the manual dipstick method and semi-automated method (automation without IT connectivity to electronic patient records). Benefits measured will include data quality, governance, cost and any efficiency or time savings that may result.
• At the end of the study, a report will be submitted to the sponsor of this project – Patient Safety Translational Research Centre (PTRSC), Imperial College London.
• If the pilot demonstrates significant benefits to both patients and the Trust, the study report will be taken forward to the Trust management with recommendations to consider funding and rolling out fully networked systems to all areas carrying out urinalysis.
2. Materials & Methods
The project was implemented in two stages:
Stage 1 – IT/Connectivity
This stage involved installing the fully automated readers in relevant clinical areas and connecting
these analysers to the Laboratory information system (Sunquest) and Hospital information system
(Cerner) so as to allow automatic data transfer from the analysers via Sunquest to Cerner.
The process includes:
• Virtual server build
• Loading the analyser data management system software (RAPIDComm V5.0) on to the server
• Installing network Points in clinical areas and installing the analysers
• Implementing ADT feed in to RAPIDComm
• Testing results sent to RAPIDComm
• Cerner urinalysis tests build
• Interfacing RAPIDComm in to Cerner
• Carrying out end to end acceptability testing
Results and associated data must be able to transfer successfully from the analysers via Sunquest to
Cerner for this stage of the project to be successful.
It is worth mentioning that this aspect of the project had to be completed before any significant
progress could be made with the project.
Stage 2 – actual testing/piloting
This stage involved piloting the automated readers and comparing this method of testing to the
manual method.
Q Pulse No: POCT-VR-031 Version No: 1.0 Date: July 2017
Page 3 of 19
2.1 Automated reader used in the Study
Name of analyser Siemens Clinitek Status+ urine chemistry analyser The analyser can be used as a stand-alone device or can be connected to Laboratory/Hospital information systems
Intended use The analyser is intended for the measurement of the following in urine: Albumin, Bilirubin, Blood (Occult), Creatinine, Glucose, Ketone, Leukocytes, Nitrite, pH, Protein-to-Creatinine Ratio, Albumin-to-Creatinine Ratio, Specific Gravity, Urobilinogen, and Human Chorionic Gonadotropin (hCG), depending on the reagent in use on the device. The analyser can be used for Urinalysis testing and can also be used for urine hCG (pregnancy) testing. This study however focuses on the urinalysis aspect which uses the Multistix urinalysis reagent (detailed below)
Assay methodology The analyser uses the principle of reflectance photometry to read and evaluate the Multistix urinalysis test strips. Light from light emitting diodes (LEDs) inside the instrument illuminates a fixed “read area” on the reagent strip. Light reflected off the test strip pads is subsequently detected by the instrument’s detector. The amount of light reflected at specific wavelengths from the test strip pads depends on the degree of colour change in the pads and is directly related to the concentrations of the measured analytes in the urine sample. The reflected light is then converted by the instrument’s microprocessor and software into clinically meaningful results shown on the display screen or printed by the integrated printer.
Total assay time < 2 minutes
Sample type Fresh urine sample (no preservatives)
• Sample mixed before testing and tested within two hours after voiding. If unable to test within the recommended time, specimens can be refrigerated, and returned to room temperature before testing.
• Contamination of the urine specimen with skin cleansers containing chlorhexidine may affect protein test results. Work areas and specimen containers should always be free of detergents and other contaminating substances.
Temperature range of assay The optimum operating range of the analyser is 22-26°C; at temperatures below 22°C, urobilinogen and leukocyte results may be erroneously low and at temperatures above 26°C, high. This is because strip reactivity increases with temperature.
Reagents storage and stability
Siemens Multistix urinalysis test strips are firm plastic strips immobilised with separate reagent areas (test pads). At Imperial NHS, the Multistix 8SG reagent strips are in use which measures: Blood, Glucose, Ketones, Leukocytes, Nitrite, pH, Protein and Specific Gravity. The test strips are stable at 15–30°C until the manufacturer’s expiry date. They must be kept away from direct sunlight, moisture and heat to avoid altering reagent reactivity. Desiccant must be retained in the reagent container with the lid tightly replaced at all times.
QC materials & stability Siemens IQC Chek-Stix Combo (2 levels – positive and negative controls). These are stable at 15–30°C until the manufacturer’s expiry date Prepared control solutions are stable for 3hrs after preparation at temperatures below 30°C.
Method of calibration The analyser is self-calibrating. The analyser automatically performs a system check (“self-test”) each time it is turned on and each time a test is run using the white calibration bar on the test strip table. DO NOT move or bump the test table while the instrument is calibrating.
Q Pulse No: POCT-VR-031 Version No: 1.0 Date: July 2017
Page 4 of 19
Onboard analyser storage The analyser memory can store up to 950 patient test results, and 200 authorized operators at any one time. This information is stored in the memory whether the analyser is powered on or off For stand-alone systems, once test results reaches 950, the first one is overwritten and so on.
2.2 Participating Clinical areas
Nine clinical areas of medium to high urinalysis strip usage were chosen at random. These areas
were grouped into three and each group represents a method type. This is to enable a direct
comparison of the three methods under study (i.e. manual, semi-automated and fully automated
methods).
Group 1: Manual dipstick method
• A&E, St. Mary’s Hospital
• Gynae OPD, Hammersmith Hospital
• Main OPD, Charing Cross Hospital
These areas carried out the urine tests manually.
Group 2: Semi-automated method
• Renal OPD, St. Mary’s Hospital
• Renal OPD, Hammersmith Hospital
• 7 North, Charing Cross Hospital
These areas carried out urinalysis with the aid of an automated reader. However, the readers are not
connected to the laboratory information system (Sunquest) or hospital information system (Cerner),
resulting in the need for the test results to be manually transcribed from the analyser print-outs to the
electronic patient record (Cerner).
Group 3: Fully automated method
• Planned Investigative Unit (PIU), St. Mary’s Hospital
• Lewis Suite, Hammersmith Hospital
• Clinical Decision unit, Charing Cross Hospital
These areas carried out urinalysis using automated readers which have been connected to both
Sunquest and Cerner.
2.3 Samples used
For this study, the following samples were used:
• Internal quality control (IQC) reference materials provided by the device manufacturer
• External quality assurance (EQA) reference materials provided by an independent EQA scheme provider (WEQAS)
• Fresh patient urine samples
The same sets of samples were processed using all three methods and resulting data & processes
compared. The methods will be evaluated for data quality, governance or lack of this, cost and
time/efficiency savings.
Q Pulse No: POCT-VR-031 Version No: 1.0 Date: July 2017
Page 5 of 19
Reference standards for comparison purposes:
• For IQC, references will be made to the supplied manufacturer’s reference ranges
• For EQA, reference will be to the consensus values provided by the EQA scheme organiser
• For patient samples, a competent POCT staff will first process the samples (using an automated reader) before handing the samples over to clinical staff to process on all three methods.
• Samples chosen at random (10 samples) will be sent to the Microbiology Lab and results compared against those obtained by the competent POCT staff to ensure reference results are in good agreement with the Lab method results.
2.4 Measurements
2.4.1 Data Quality
The same sets of samples were processed using all three methods and the resulting data &
processes compared.
• IQC sample – same sets of IQC material (negative & positive levels) reconstituted by POCT
staff were given to clinical staff to analyse for all three methods. This was done over several
days to allow for different members of staff to process these thereby reflecting the normal
practice.
• EQA sample – six different distributions of EQA (a total of 18 samples) were analysed by
clinical staff using all three methods.
• Patient sample – >90 urine samples were analysed using all three methods.
We will assess:
• Results accuracy – how each method compares to the reference values for all the sample
types (i.e. patient, EQA and IQC samples). Scoring is based on the total number of correctly
resulted analytes (when compared with the reference values) expressed as a percentage of
the total number of analytes tested (see Appendix 1 – data quality spreadsheet).
• Transcription error rate – percentage of incompletely or incorrectly recorded results
2.4.2 Governance
For this aspect of the study, audits were carried out assessing data over a 3-month period for all three
methods, specifically looking at training, quality assurance (IQC & EQA), result recording, reagents
traceability as well as the ability to accurately trace operators of POCT kits and patients tested using
the kits based on the records kept. Results were audited against UKAS requirements.
The audit was carried out with the aid of questionnaires used to collate responses to the quality
questions below:
• Are operators trained & certified? Is there evidence of this?
• Have appropriate IQC been done? Is there evidence of this?
• Does the clinical area participate in an appropriate EQA scheme?
• Are the reagents used for testing traceable (e.g. in case of recall)?
• Are operator and patients identifiable along with test results?
• Does the test result reporting/format meet the minimum criteria required by UKAS ISO 15189/22870 standards?
Q Pulse No: POCT-VR-031 Version No: 1.0 Date: July 2017
Page 6 of 19
2.4.3 Cost and efficiency savings
This aspect of the study assesses the time used by staff to carry out urinalysis (from testing through
to reporting), identify wastage (if any) due to unnecessary duplicate testing, and whether any
condition may have been missed.
• Staff time – to assess this, we will calculate the average time taken for each method and
estimate the cost of this in staff time
• False Positives – results for 99 patient samples processed by all three methods were
compared to the reference values and any false positives identified per sample. This is based
on the assumption that if any of the following analytes (Blood, protein, nitrite or leukocyte) is
positive at the Point of Care, the original sample will be sent to the Lab for re-
testing/confirmation. A false positive result would mean sending more samples to the Lab
than necessary thereby wasting the Trust’s resources and patient’s time.
• False Negatives – results for 99 patient samples processed by all three methods were
compared to the reference values and any false negatives identified per sample. This is
based on the assumption that if all the following analytes (Blood, protein, nitrite or leukocyte)
is negative at the Point of Care, the original sample will not be sent to the Lab resulting in
possible misdiagnosis/inappropriate care for patients.
3 Results
3.1 Data Quality
3.1.1 Results accuracy
Patient samples
A total of 99 patient samples were processed using all three methods and the results compared
against the reference values generated by competent POCT staff.
Comments: The automated methods performed at least 15% better than the manual method.
However, the findings indicated that a 13-15% error rate still occurs in general for POCT urinalysis
regardless of the method used.
70%
85%
87%
0% 20% 40% 60% 80% 100%
Manual
Semi-automated
Fully automated
Accuracy using patient samples
Q Pulse No: POCT-VR-031 Version No: 1.0 Date: July 2017
Page 7 of 19
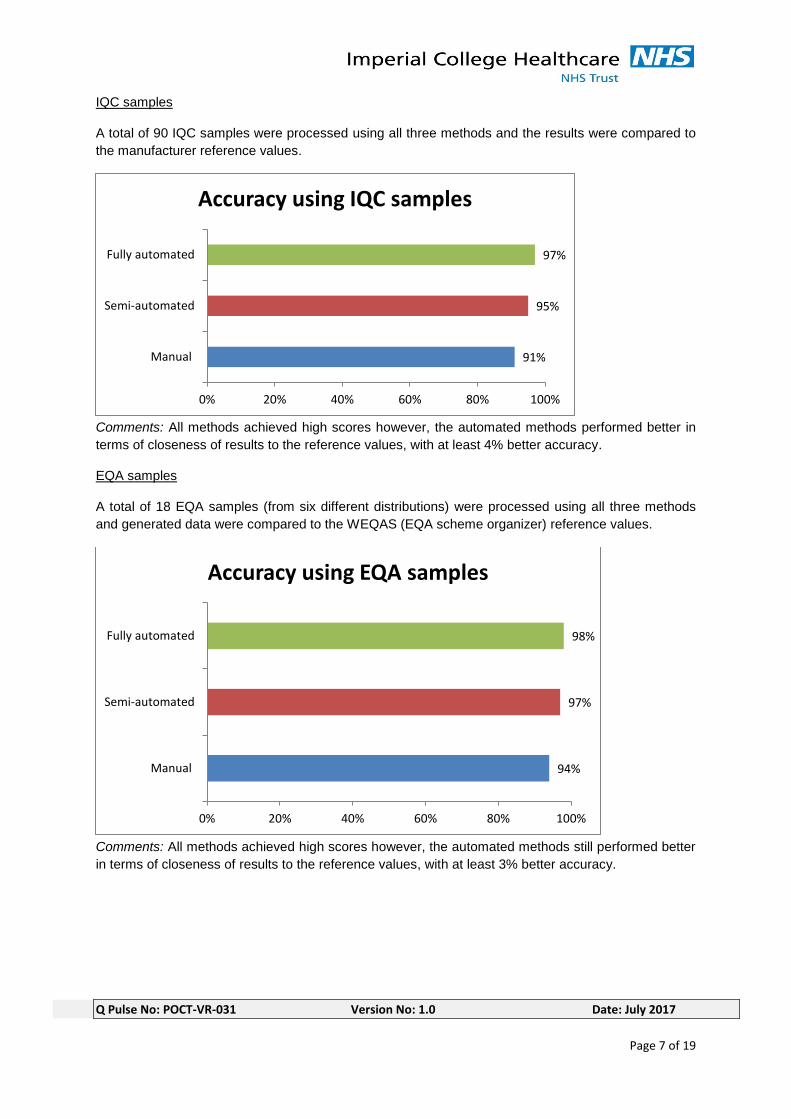
IQC samples
A total of 90 IQC samples were processed using all three methods and the results were compared to
the manufacturer reference values.
Comments: All methods achieved high scores however, the automated methods performed better in
terms of closeness of results to the reference values, with at least 4% better accuracy.
EQA samples
A total of 18 EQA samples (from six different distributions) were processed using all three methods
and generated data were compared to the WEQAS (EQA scheme organizer) reference values.
Comments: All methods achieved high scores however, the automated methods still performed better
in terms of closeness of results to the reference values, with at least 3% better accuracy.
91%
95%
97%
0% 20% 40% 60% 80% 100%
Manual
Semi-automated
Fully automated
Accuracy using IQC samples
94%
97%
98%
0% 20% 40% 60% 80% 100%
Manual
Semi-automated
Fully automated
Accuracy using EQA samples
Q Pulse No: POCT-VR-031 Version No: 1.0 Date: July 2017
Page 8 of 19
3.1.2 Transcription error rate
A total of 99 patient samples were processed using all three methods and records were checked for
any transcription error.
Comments:
• No transcription errors were observed for the fully automated method. Although the analyser
prints out the results, the users did not have to manually enter the results on Cerner as the
results are automatically transmitted to the electronic patient records.
• For the Semi-automated method, the analysers are not linked to the electronic patient records
so results are printed out from the analyser and manually transcribed into the patient’s record.
The transcription error rate for this method was 9% of the total results.
Note: the results print out on a thermal paper which fades overtime hence the need to manually
transcribe the results for a more permanent record.
• For the manual method, most clinical staff tend to write results on a paper and then manually
transcribe into Cerner. The transcription error rate for the manual system was 14%, which is
the highest error rate observed (compared to the other methods).
3.1.3 Microbiology method versus POCT reference method (patient samples only)
Due to the unavailability of a corresponding Lab method for all the analytes on the urinalysis test strip,
trained POCT staff provided the reference values for patient samples by first processing the samples
(using an automated reader) before handing them over to clinical staff to process. This part of the
study is an additional measure to validate the POCT reference method and ensure the results
compare well with the Lab method.
10 patient samples selected at random were sent to the microbiology Lab for MC&S and the results
compared to those obtained by competent POCT staff (using the automated reader). There are only
two tests on the strips with corresponding Lab method (Blood and leukocytes) so only these two were
considered in the scoring. Scoring is based on the total number of correctly resulted analytes (when
compared with the reference values) expressed as a percentage of the total number of analytes under
consideration.
90% of the POCT reference results were in agreement with the Microbiology lab results (please see
Appendix 1 for data).
14%
9%
0%
0% 5% 10% 15% 20%
Manual
Semi-automated
Fully automated
Results incompletely/incorrectly recorded in Cerner
Q Pulse No: POCT-VR-031 Version No: 1.0 Date: July 2017
Page 9 of 19
3.2 Governance
3.2.1 Training audit
UKAS accreditation requirement for training: “Only personnel who have completed the training and
demonstrated competence shall carry out POCT. Records of training/attestation (or certification) and
of retraining and re-attestation (or recertification) shall be retained.” (ISO 22870; 5.1.4b)
Training records for clinical staff processing samples in each of the method group were checked. The
figure below demonstrates the observed findings:
Comments: There was no evidence to demonstrate the training and competency of staff carrying out
urinalysis in the manual areas. However, all staff using the automated systems have documented
evidence of training and competency.
3.2.2 IQC audit
UKAS requirement for IQC:
“The laboratory shall design quality control procedures that verify the attainment of the intended
quality of results.” (ISO 15189; 5.6.2.1) “The laboratory shall have a procedure to prevent the release
of patient results in the event of quality control failure.” (ISO 15189; 5.6.2.3) “Frequency of internal QC
should be specified for each device.” (ISO 22870; 5.6.6c)
All participating clinical areas were audited over a 3-month period to check compliance with IQC
procedures for all three methods. These findings are presented in the table and the figure below:
IQC (audit over 3 months)
Questions Manual Semi-automated Fully automated
Does the area carry out IQC testing? No Yes Yes
Is the frequency of IQC testing in line with the Standard operating procedures (SOP) No SOP in place Yes in 67% of the areas Yes
Method of recording IQC data? Not done or recorded POCT record book Electronic
Are staff able to use device if IQC fails? Yes Yes in 67% of areas No
0%
100%
100%
0% 20% 40% 60% 80% 100%
Manual
Semi-automated
Fully automated
Operators with documented record of training
Q Pulse No: POCT-VR-031 Version No: 1.0 Date: July 2017
Page 10 of 19
Comments:
• The manual areas are not carrying out IQC checks and also do not have a standard operating
procedures (SOP) which is an essential ISO requirement for safe use of POCT. SOP is in
place for the two automated methods (semi and fully automated).
• The semi-automated method areas carry out IQC checks but not at the recommended
frequency. Also, staff are able to use the device without carrying out IQC checks or if IQC
fails.
• The fully automated system areas carry out IQC checks in line with recommended
frequencies. The system makes it impossible for staff to use the device without carrying out
appropriate IQC checks. Also, the device will only permit use if the IQC checks have been
passed.
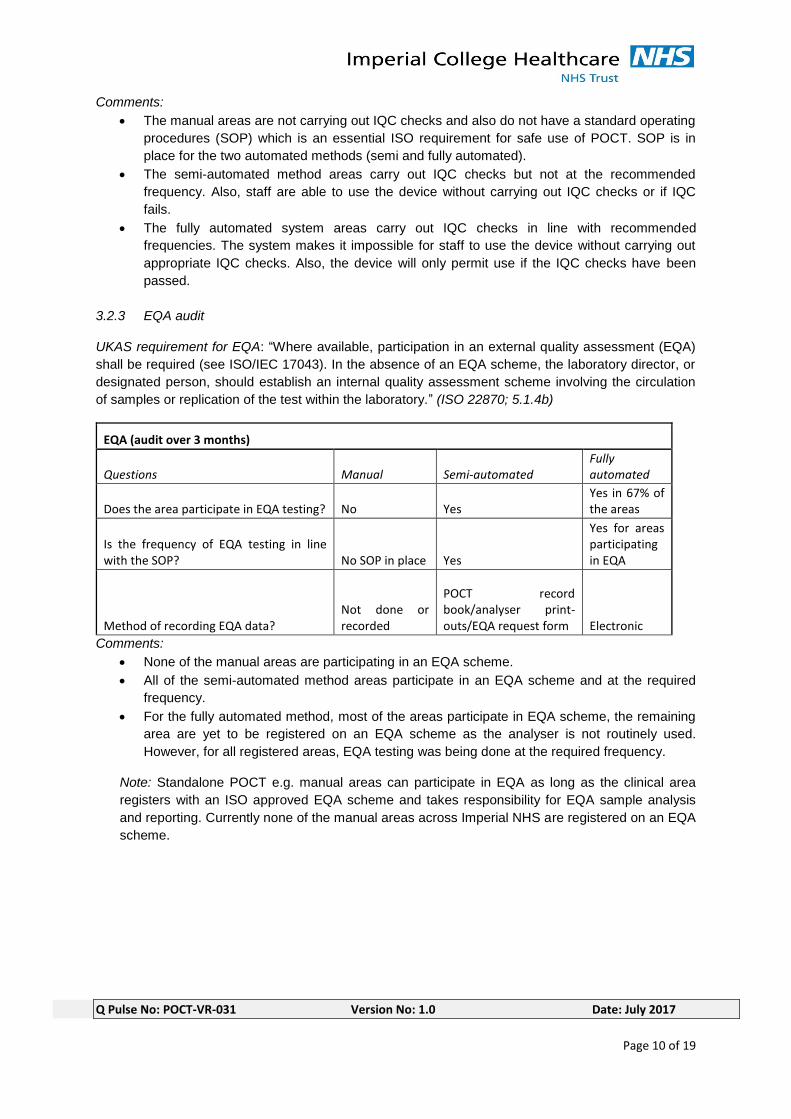
3.2.3 EQA audit
UKAS requirement for EQA: “Where available, participation in an external quality assessment (EQA)
shall be required (see ISO/IEC 17043). In the absence of an EQA scheme, the laboratory director, or
designated person, should establish an internal quality assessment scheme involving the circulation
of samples or replication of the test within the laboratory.” (ISO 22870; 5.1.4b)
EQA (audit over 3 months)
Questions Manual Semi-automated Fully automated
Does the area participate in EQA testing? No Yes Yes in 67% of the areas
Is the frequency of EQA testing in line with the SOP? No SOP in place Yes
Yes for areas participating in EQA
Method of recording EQA data? Not done or recorded
POCT record book/analyser print-outs/EQA request form Electronic
Comments:
• None of the manual areas are participating in an EQA scheme.
• All of the semi-automated method areas participate in an EQA scheme and at the required
frequency.
• For the fully automated method, most of the areas participate in EQA scheme, the remaining
area are yet to be registered on an EQA scheme as the analyser is not routinely used.
However, for all registered areas, EQA testing was being done at the required frequency.
Note: Standalone POCT e.g. manual areas can participate in EQA as long as the clinical area
registers with an ISO approved EQA scheme and takes responsibility for EQA sample analysis
and reporting. Currently none of the manual areas across Imperial NHS are registered on an EQA
scheme.
Q Pulse No: POCT-VR-031 Version No: 1.0 Date: July 2017
Page 11 of 19
3.2.4 Reagent audit
UKAS requirement for reagent records: “A record shall be kept of materials and reagents purchased
for POCT that allows an audit trail with regard to any particular test performed.” (ISO 22870; 5.3.2e)
Reagents (audit over 3 months)
Questions Manual Semi-automated Fully automated
Of FIVE randomly reviewed time points (five different days), number of times the Lot Number of the reagent was recorded (%) 0% 87% 100%
Method of recording reagent information? Not recorded POCT record book/Electronic Electronic
Are staff able to use device expired reagents using this method Yes Yes in 67% of the areas No
Comments:
• For the manual areas, there is no evidence that reagents lot numbers were being recorded.
This makes it difficult to ascertain which reagent is used for any particular test e.g. in case of
clinical incidents, product recalls, etc. Also, staff are able to use expired reagents with this
method which is against manufacturer’s recommendation and may invalidate patient results.
• For the semi-automated areas, staff were recording reagent information but not all of the time.
Also, staff are able to use expired reagents with this method in some of the clinical areas.
• For the fully automated areas, reagent information (lot number, expiry date etc) are
automatically logged onto the system and the device will not allow staff to use expired
reagent.
3.2.5 Result recording
UKAS requirement for Reporting of results: “POCT results shall be permanently recorded in the patient’s medical record. The identity of the person performing the test should be recorded.” (ISO 22870; 5.8.3) 99 patient samples were given to clinical staff to process for all 3 methods. Records were subsequently checked to ensure all results have been entered on to Cerner (patient permanent record system).
9%
3%
12%
0% 5% 10% 15% 20%
Manual
Semi-automated
Fully automated
Patient results not recorded in Cerner
Q Pulse No: POCT-VR-031 Version No: 1.0 Date: July 2017
Page 12 of 19
Comments:
• For the manual system, 9% of patient results were not recorded in the patient permanent
record (Cerner).
• For the semi-automated system, 3% were not recorded on Cerner. However, these
results are held on the analysers until they are deleted off the system (the analyser can
only hold up to 950 patient results at any one time) so it is still possible to lose results if
not manually transcribed onto Cerner.
• For the fully automated system, 12% of the patient results were not available on Cerner at
the time of the audit due to IT connection issues. However results are stored on the
instrument data manager (RapidComm) so results are never lost. Also, based on the
information provided by the device manufacturer, these results should automatically
transmit to the patient records on Cerner once IT link is restored. Further audit will need
to be carried out to verify this assumption.
Operator Identification (traceability) UKAS requirement: “POCT results shall be reported with
necessary details…. The identity of the person performing the test should be recorded.” (ISO 22870;
5.8.2 & 5.8.3)
An audit over a 3-month period was carried out to check if IQC tests could be traced back to the
operators, please see findings in the figure below:
Comments: For the manual method, no IQC was done or recorded but for the automated systems
(semi and fully automated), all staff involved in the IQC testing were identifiable.
An audit over a 3-month period was carried out to check if EQA tests carried out could be traced back
to the operators, please see findings in the figure below:
Comments: For the manual method, no EQA was done or recorded but for the automated systems
(semi and fully automated), all staff involved in the EQA testing were identifiable.
0%
100%
100%
0% 20% 40% 60% 80% 100%
Manual
Semi-automated
Fully automated
IQC tests where operator identifiable
0%
100%
100%
0% 20% 40% 60% 80% 100%
Manual
Semi-automated
Fully automated
EQA tests where operator identifiable
Q Pulse No: POCT-VR-031 Version No: 1.0 Date: July 2017
Page 13 of 19
99 patient samples were processed using all three methods. Patient records (on Cerner) were subsequently checked to see if patient results could be traced back to the personnel that carried out the urine tests. Please see the figure below for findings:
Comments:
• For the manual method, 19% of the operators were not correctly recorded.
• For the semi-automated method, 3% of the operators were not recorded. A review of the
data showed that this 3% non-compliance was due to not recording the patient results at
all on Cerner. As such, for all results entered onto Cerner, the operators were correctly
recorded.
• For the fully automated system, 12% of the operators were not on Cerner. Also, review of
the data indicated that this 12% non-compliance was due to results yet to transmit on to
Cerner at the time of the audit. As such, for all results recorded onto Cerner for this
method, the operators were correctly recorded.
3.3 Cost and efficiency savings
3.3.1 Time taken by clinical staff per method (from testing through to reporting)
Comments: The figure above indicates that using a fully automated system will save 17 minutes per
test on average. As we process about 300,000 samples per annum, this equates to an estimated cost
saving of about £1,066,750 in staff time (see table below for details):
81%
97%
88%
0% 20% 40% 60% 80% 100%
Manual
Semi-automated
Fully automated
Operators correctly recorded in cerner
19
11
2
0 5 10 15 20
Manual
Semi-automated
Fully automated
Time taken to process samples (minutes)
Q Pulse No: POCT-VR-031 Version No: 1.0 Date: July 2017
Page 14 of 19
nurse band 5 salary mid-point £24,547
nurse mid-point hourly cost £12.55
Salary data Source https://www.rcn.org.uk/employment-and-pay/nhs-pay-scales-2017-18
Note: Different grades of staff carry out urinalysis in the Trust including healthcare assistants, nurses and doctors. For the purpose of this cost estimate, a band 5 nurse was considered appropriate.
Time saving per test (minutes) 17
number of tests per year 300000
total time saving (minutes) 5100000
total time saving (hours) 85000
total cost saving per year in staff time £1,066,750
Staff time saving may not always result in an overall financial savings however it may well result in time better spent in other areas of care.
3.3.2 False Positives
POCT should screen out negatives so only true positives are sent to the Microbiology Lab for
Microscopy, culture and sensitivity tests (MC&S).
For this part of the study, 99 patient samples processed using all three methods were compared to
the reference values and any false positives identified per sample. A false positive result would mean
sending the samples to the Lab for re-testing resulting in delay for patients waiting on test results as
well as waste of Trust’s resources both at the Point of Care and in the Lab.
Comments: With the manual method, at least 7% more samples will have to be sent to the Lab for
retesting compared to the automated methods.
3.3.3 False Negatives
For this part of the study, 99 patient samples processed using all three methods were compared to
the reference values and any false negatives identified per sample. False negatives can result in
misdiagnosis/inappropriate care for patients, as samples are generally not analysed any further if they
test negative.
9%
2%
1%
0% 5% 10% 15% 20%
Manual
Semi-automated
Fully automated
Duplicate testing
Q Pulse No: POCT-VR-031 Version No: 1.0 Date: July 2017
Page 15 of 19
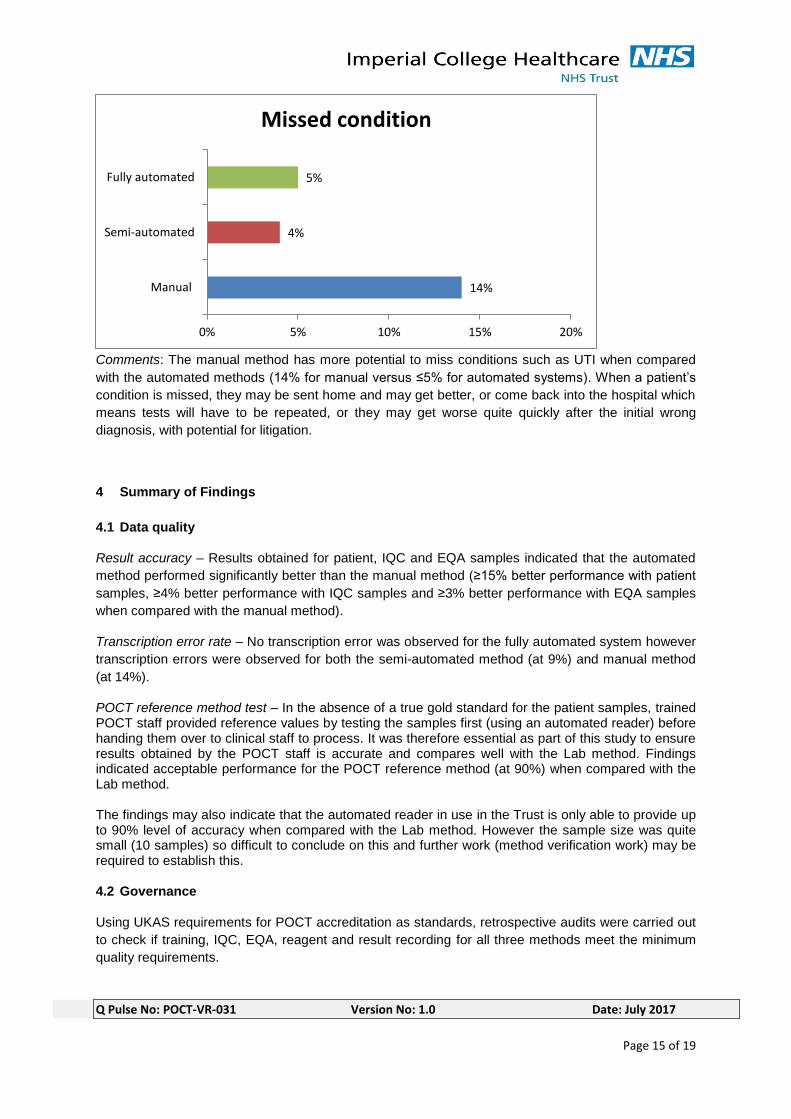
Comments: The manual method has more potential to miss conditions such as UTI when compared
with the automated methods (14% for manual versus ≤5% for automated systems). When a patient’s
condition is missed, they may be sent home and may get better, or come back into the hospital which
means tests will have to be repeated, or they may get worse quite quickly after the initial wrong
diagnosis, with potential for litigation.
4 Summary of Findings
4.1 Data quality
Result accuracy – Results obtained for patient, IQC and EQA samples indicated that the automated
method performed significantly better than the manual method (≥15% better performance with patient
samples, ≥4% better performance with IQC samples and ≥3% better performance with EQA samples
when compared with the manual method).
Transcription error rate – No transcription error was observed for the fully automated system however
transcription errors were observed for both the semi-automated method (at 9%) and manual method
(at 14%).
POCT reference method test – In the absence of a true gold standard for the patient samples, trained POCT staff provided reference values by testing the samples first (using an automated reader) before handing them over to clinical staff to process. It was therefore essential as part of this study to ensure results obtained by the POCT staff is accurate and compares well with the Lab method. Findings indicated acceptable performance for the POCT reference method (at 90%) when compared with the Lab method. The findings may also indicate that the automated reader in use in the Trust is only able to provide up to 90% level of accuracy when compared with the Lab method. However the sample size was quite small (10 samples) so difficult to conclude on this and further work (method verification work) may be required to establish this. 4.2 Governance
Using UKAS requirements for POCT accreditation as standards, retrospective audits were carried out
to check if training, IQC, EQA, reagent and result recording for all three methods meet the minimum
quality requirements.
14%
4%
5%
0% 5% 10% 15% 20%
Manual
Semi-automated
Fully automated
Missed condition
Q Pulse No: POCT-VR-031 Version No: 1.0 Date: July 2017
Page 16 of 19
Training – only the two automated methods had evidence of staff training, no training or competency
record are available for the manual method.
IQC checks – only the two automated methods had evidence of IQC checks, no IQC checks are
carried out for the manual method. The IQC checks for the semi-automated method were however not
conducted at the required frequency; the method could also be used if IQC fails. For the fully
automated method, the system will not allow use if IQC fails or if not done at the required frequency.
Also, IQC are manually recorded in log books for the semi-automated method but are kept
electronically for the fully automated system without any need for transcription.
EQA scheme participation – Staff in the manual areas do not participate in external quality
assessment scheme, only those using the automated methods do.
Standard operating procedure (SOP) – No SOP in place for the manual method, only the automated
methods have SOPs.
Reagent audit – No evidence to show that reagent information (e.g. lot numbers) were being recorded
for the manual method, these are however being recorded for the automated methods. For the semi-
automated method however, this was not being recorded at all times. Also, for both manual and semi-
automated methods, staff were able to use expired reagents however this is not possible with the fully
automated systems as the system will reject any expired reagents.
Result recording – There is potential for patient test results not to be recorded for the manual and
semi-automated method, but the fully automated system mitigates this. The study findings indicated
that 9% of patient results were not recorded for the manual method. This reduced to 3% for the semi-
automated method. However for the fully automated method, 12% were not recorded at the time of
the audit due to IT connection issues although the assumption is that these results will automatically
transmit once IT links are restored. Results are however permanently stored on the instrument data
manager. Further work should be carried out to verify that interface issue does not lead to loss of data
and that results will indeed automatically transmit to Cerner once IT links are restored. It is worth
mentioning that users always get a print-out of test results for immediate patient care pending data
transfer to Cerner thus incurring no delay in patient management.
Operator identification – All staff involved in IQC and EQA sample processing were identifiable for the
two automated methods, the manual methods are not participating in EQA or IQC checks. For patient
samples, 19% of users were not recorded for the manual method. This reduced to 3% for the semi-
automated method. For the fully automated system, 12% of the results were still waiting to be
transmitted due to IT connection issues however, for all patient results recorded onto Cerner for this
method, the operators were correctly recorded.
4.3 Cost and efficiency savings
Time taken by staff to process sample (from testing through to reporting) – The manual method takes
about 19 minutes to complete, this is reduced to 11 minutes for the semi-automated method whilst the
fully automated method takes 2 minutes. Using a fully automated method will therefore save 17
minutes per test on average. The Trust processes about 300,000 samples per annum so this equates
to an estimated cost saving of about £1,066,750 in staff time.
Duplicate testing – With the manual method, at least 7% more samples will have to be sent to the Lab
for retesting when compared to the automated methods.
Missed conditions – The manual method has more potential to miss conditions such as UTI when
compared with the automated methods (14% for manual versus ≤5% for automated systems).
Q Pulse No: POCT-VR-031 Version No: 1.0 Date: July 2017
Page 17 of 19
5 Conclusions
The two automated methods performed significantly better than the manual method in all areas
assessed (data quality, governance, cost and efficiency). However the fully automated system
demonstrated more benefits over the semi-automated method (stand-alone analyser) specifically by:
• eliminating transcription error
• ensuring appropriate quality control checks are carried out and passed, prior to device use
• allowing for automatic logging and storage of reagent information whilst also ensuring the
integrity of reagents used (i.e. ensuing only in-date reagents can be used on the device)
• ensuring all results (patients, IQC, EQA) are appropriately recorded with no loss of data
• ensuring operators are correctly recorded with the required level of detail to allow for
traceability
• significantly reducing the amount of time spent per sample with potential cost savings
It is worth mentioning though that the fully automated system relies on active IT links and there were
times during the course of this pilot project that results were not transmitting across to the patient
electronic records due to IT connection issues. However, the data remained on the analyser and were
also permanently stored on the instrument data manager. In addition, the analysers provided result
print-outs for immediate patient care therefore no negative impact on patients.
6 Recommendations
Use of the fully automated system will enable the Trust to provide a safer and more efficient POCT
urinalysis service than currently, as well as meet relevant accreditation standards. The fully
automated method has QC and operator lock-out facilities which can be centrally and remotely
managed by the Pathology POCT team to ensure analysers can only be used by competent staff and
only when appropriate QC checks have been done. A fully automated system will ensure consistency,
standardisation (e.g. of units) and improved level of accuracy (than currently) whilst significantly
saving on staff time.
Based on the findings from this study, we would recommend the use of fully automated system over
the manual or semi-automated methods. The required IT links for the analysers have been put in
place as a result of this pilot project so any new analyser can easily be connected to the hospital
information system. There is however a need to test the capability of the established IT links in
handling a larger roll-out especially as we have previously identified some issues with data
transmission to Cerner.
The implementation of fully automated testing will have capital and ongoing cost implications and this
should be considered prior to implementation.
Q Pulse No: POCT-VR-031 Version No: 1.0 Date: July 2017
Page 18 of 19
Appendix 1 – Study data (raw data)
Data quality spreadsheet
Data quality ALL.xlsx
Microbiology vs POCT reference results
Micro vs POCT reference results.xlsx
IQC/EQA/Reagent Audit data
Audit data ALL.xlsx
Cost and efficiency data
Cost & Efficiency data ALL.xlsx
Appendix 2 – Data Summary
Data summary table ALL.xlsx
Q Pulse No: POCT-VR-031 Version No: 1.0 Date: July 2017
Page 19 of 19
Acknowledgements
• Project sponsor – Patient Safety Translational Research Centre (PSTRC) Imperial College
London (part of the National Institute for Health Research [NIHR])
• Patient Safety Challenge Dragon’s Den panel of judges – Prof. the Lord Ara Darzi, Yasmin
Alibhai-Brown, Martin Bromiley and Shona Maxwell
• Participating clinical areas – staff and responsible managers
• Microbiology Laboratory – staff and responsible managers
• Darragh Murphy – Pharmacy department
• Stephen Snewin – Pathology
• Phil Brown – Pathology
• Charlotte Mustoe – Pathology
• Yehani Wedatilake – Pathology
• Manfred Almeida – Pathology
• Oluwaseun Wete – Pathology
• Ozlem Yasar – Pathology
• Liakim Ladipo – Pathology IT
• Dr Paul Holloway
• Trust Cerner team
• Siemens
• Wales External Quality Assessment Scheme (WEQAS) – EQA provider