+ All Categories
Home > Documents > AUTOMOTIVE Latest Global Fuel Economy and CO2 … · Latest Global Fuel Economy and CO 2 Compliance...

AUTOMOTIVE Latest Global Fuel Economy and CO2 … · Latest Global Fuel Economy and CO 2 Compliance...

Date post: 11-Nov-2018
Category:
Upload: dinhkien
View: 217 times
Download: 0 times
Share this document with a friend
28
© 2016 IHS MARKIT © 2016 IHS Markit. All Rights Reserved. Latest Global Fuel Economy and CO 2 Compliance Prognosis A focus on China, Europe, and the United States AUTOMOTIVE Andrew Fulbrook, Director. Global – Powertrain and Compliance P: +44 (0) 20 3159 3455 [email protected] 27 October 2016 | Shanghai, China
Transcript

© 2016 IHS MARKIT© 2016 IHS Markit. All Rights Reserved.

Latest Global Fuel Economy and CO2 Compliance PrognosisA focus on China, Europe, and the United States

AUTOMOTIVE

Andrew Fulbrook, Director. Global – Powertrain and Compliance

P: +44 (0) 20 3159 3455

[email protected]

27 October 2016 | Shanghai, China

Contents

© 2016 IHS Markit

AGENDA 3

REGULATORY PERFORMANCE IN 2015 Enacted regulation 4 U.S CAFÉ performance 6 EU28 CO2 performance 8 China CAFC performance 9

REGULATORY PROPOSALS BEYOND 2015 Target trajectory convergence 11 United States 12 EU28 13 China 14Challenges and consequences 15

IHS MARKIT REGULATORY 2020–21 PERFORMANCE FORECAST Forecast methodology 18 What is VPaC? 19 US CAFÉ, EU28 CO2, China CAFC 20

BASELINE TECHNOLOGY FORECASTS Technology demand prognosis –Global 22 Why 48V MHEV? 23

SUMMARY Summary 27

2

Automotive Conference – Shanghai | 27 October 2016Automotive Conference – Shanghai | 27 October 2016

© 2016 IHS Markit 3

Enacted regulationConvergence began in 2015

Regulatory performance in 2015

Gap closed to 40g/km eqv.

Automotive Conference – Shanghai | 27 October 2016

© 2016 IHS Markit 4

Source: IHS Markit

• It is necessary to meet the target, or face a penalty?

• Hardware is ready for the regulation, but is the consumer?

• Follow the methodology of developed markets

• Lack of clarity causes planning issues

• Coming from a low base and so proportionately much harder to reach target than developed markets

• Plan for the fuel consumption regulation, but no details now

• Very cost sensitive markets, and slow to introduce regulation

Done

Doing

Planning

Enacting regulationMatching the mature market target is one thing; executing is another

Regulatory performance in 2015Automotive Conference – Shanghai | 27 October 2016

© 2016 IHS Markit 5

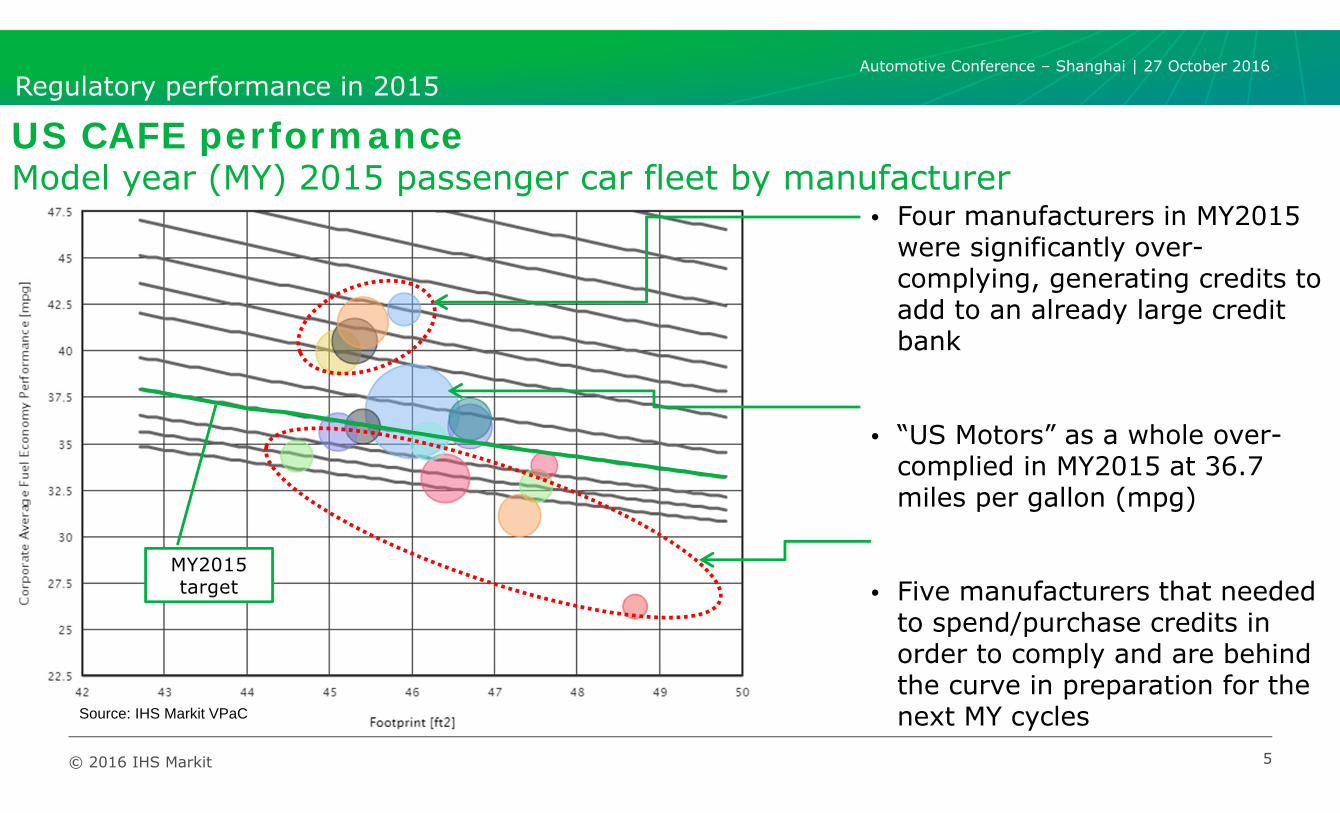
• Four manufacturers in MY2015 were significantly over-complying, generating credits to add to an already large credit bank

• “US Motors” as a whole over-complied in MY2015 at 36.7 miles per gallon (mpg)

• Five manufacturers that needed to spend/purchase credits in order to comply and are behind the curve in preparation for the next MY cyclesSource: IHS Markit VPaC

Regulatory performance in 2015

US CAFE performanceModel year (MY) 2015 passenger car fleet by manufacturer

MY2015 target

Automotive Conference – Shanghai | 27 October 2016

© 2016 IHS Markit 6

Source: IHS Markit VPaC

Regulatory performance in 2015

US CAFE performanceMY2015 light truck fleet by manufacturer

Source: IHS Markit VPaC

• Five truck manufacturers in MY2015 were over-complying, generating credits for future use, or to sell to those below the line

• “US Motors” as a whole come close, but did not quite achieve target in MY2015 at 26.2 mpg

• Four volume manufacturers that needed to spend/purchase credits in order to comply and are behind the curve in preparation for the next MY cycles

MY2015 target

Automotive Conference – Shanghai | 27 October 2016

© 2016 IHS MARKIT

• Diesel downsized engine with significant mass actions• Mostly in A- and B-segments, MPVs• SUV market is slowly being explored

• Sales in A- and B-segments are compensating high take rates of SUVs

• Noticeable improvements from start-stop system

7

Regulatory performance in 2015

EU CO2 performanceCalendar year (CY) 2015 passenger car fleet

CY2015 target

• An intensely competitive Europe met the 2015 average CO2 target, achieving a status of 119.6 g/km.

• The average mass of new cars sold in the European Union (1381 kg) remained broadly the same as compared with 2014.

• Diesel made up 52% of EU sales, with a 50% sales increase for BEVs compared with 2014. However, overall PHEV and BEV share was just 1.3%.

Automotive Conference – Shanghai | 27 October 2016

© 2016 IHS Markit

Regulatory performance in 2015

China CAFC performanceCY2015 passenger car fleet—domestic and import

Source: IHS Markit VPaC

CY2015 target(s)

• A number of low volume manufacturers in CY2015 missed Phase 3 compliance, yet encouragingly, a larger amount of manufacturers, both domestic and imports complied, some of them significantly, proving that they have the tech strategy ready for Phase 4

• “China Motors” as a whole hit the precise target of 6.9L in 2015

Automotive Conference – Shanghai | 27 October 2016

Contents

© 2016 IHS Markit

AGENDA 3

REGULATORY PERFORMANCE IN 2015 Enacted regulation 4 US CAFÉ performance 6 EU28 CO2 performance 8 China CAFC performance 9

REGULATORY PROPOSALS BEYOND 2015 Target trajectory convergence 11 United States 12 EU28 13 China 14Challenges and consequences 15

IHS MARKIT REGULATORY 2020–21 PERFORMANCE FORECAST Forecast methodology 18 What is VPaC? 19 US CAFÉ, EU28 CO2, China CAFC 20

BASELINE TECHNOLOGY FORECASTS Technology demand prognosis –Global 22 Why 48V MHEV? 23

SUMMARY Summary 27

9

Automotive Conference – Shanghai | 27 October 2016

© 2016 IHS Markit 10

150

140

130

120

110

100

902015 2016 2017 2018 2019 2020 2021 2022 2023 2024 2025

KSA: 142g/km in 2020Mexico: 145g/km in 2016

Brazil: 138g/km in 2017

India: 130g/km in 2017

Korea: 97g/km in 2020US & Canada: 97g/km in 2025

Japan: 122g/km in 2020

China: 164g/km in 2015

EU: 120g/km in 2015

India: 113g/km in 2022

EU: 95g/km in 2020

China: 117g/km in 2020

China: 95g/km in 2025

Regulatory proposals beyond 2015Target trajectory convergenceMarkets start to align below 100g/km equivalent

Automotive Conference – Shanghai | 27 October 2016

© 2016 IHS Markit 11

175 g/mile of CO2 in 2025 46.3 mpg in 2025 (unadjusted)

37–39 mpg (real world)• Fleet car/truck mix• 2012 final rule was 67/33% in 2025• Reference for TAR is 52/48% in 2025

• Footprint based standards will likely not change• TAR shows that MY 2022–25 standards can be achieved through advanced gasoline vehicle

technologies• Low-cost electrification

Regulatory proposals beyond 2015United States currently reviewing its regulationCAFÉ and GHG midterm review TAR process

Automotive Conference – Shanghai | 27 October 2016

© 2016 IHS Markit 12

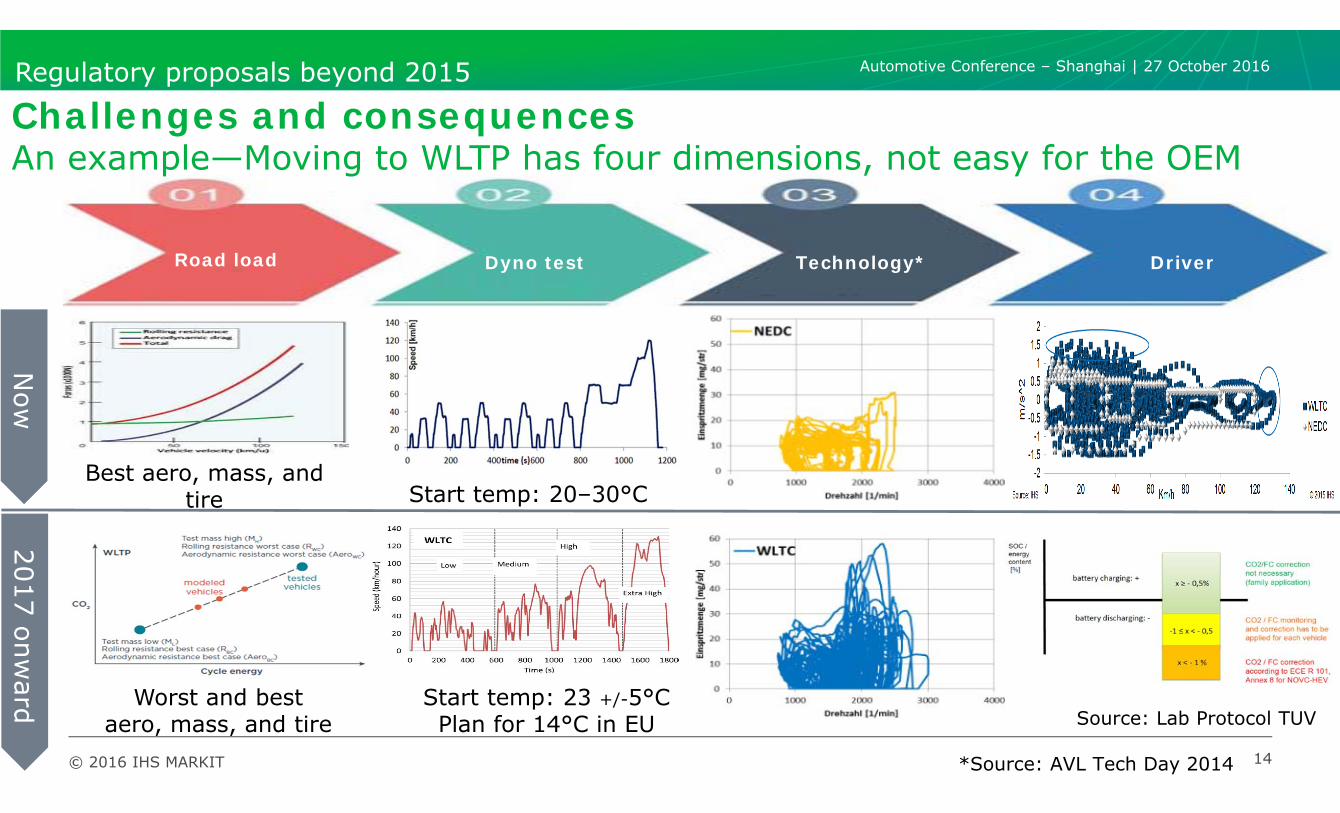
Regulatory proposals beyond 2015EU28 always reviewing its regulation2015 thru 2030 pegged at 48% reduction max

Image Source: Institute for Automotive Engineering (ika), RWTH Aachen University, Germany (2015 Aachen conference)Data Source: EUROPEAN ENVIRONMENTAL AGENCY (EEA) Monitoring CO2 emissions from passenger cars and vans Copenhagen, Denmark, 2015

Automotive Conference – Shanghai | 27 October 2016

© 2016 IHS Markit 13

FC V W CAFC corporateaveragefuelconsumption

ForPHEVs*andEVs2016‐2017W 52018‐2019W 32020W 2

Energysavingvehicle*2016‐2017W 3.02018‐2019W 2.52020W 1.5

Notes: PHEV should meet E-range>= 50KMEnergy saving vehicle should meeting the fuel consumption <=2.8L/100km

3.0X

Regulatory proposals beyond 2015China Phase IV now releasedAttention now turns to 4L for Phase V for 2025?

Automotive Conference – Shanghai | 27 October 2016

© 2016 IHS MARKIT 14

Road load Dyno test Technology* Driver

Best aero, mass, and tire

Worst and best aero, mass, and tire

Start temp: 20–30°C

Start temp: 23 +/-5°CPlan for 14°C in EU

*Source: AVL Tech Day 2014

Source: Lab Protocol TUV

Now

2017 onward

Regulatory proposals beyond 2015

Challenges and consequences An example—Moving to WLTP has four dimensions, not easy for the OEM

Automotive Conference – Shanghai | 27 October 2016

© 2016 IHS MARKIT 15

0%

5%

10%

15%

20%

25%

30%

35%

30%

35%

40%

45%

50%

55%

60%

CY2014

CY2015

CY2016

CY2017

CY2018

CY2019

CY2020

CY2021

CY2022

CY2023

CY2024

CY2025

CY2026

CY2027

CY2028

April 2015 Fcst Diesel Pass Car Sales % April 2016 Fcst Diesel Pass Car Sales %April 2016 Fcst EU28 MHEV Pass Car Sales % April 2016 Fcst EU28 PHEV Pass Car Sales %

Source: VPaC Technology Analytics

© 2016 IHS Markit

Pas

sen

ger

car

-d

iese

l m

arke

t sh

are

(EU

28

)

MH

EV a

nd

PH

EV m

arke

t sh

are

(EU

28

)

NEDC target 95 g CO2/km WLTC CO2 target

Regulatory proposals beyond 2015

Challenges and consequences How WLTP, NOX,and CO2 are now changing the diesel landscape in Europe

EU7+ CO2 targetFull WLTPRDE CF 1.5RDE CF 2.1 WLTC kick-off

Automotive Conference – Shanghai | 27 October 2016

Contents

© 2016 IHS MARKIT

AGENDA 3

REGULATORY PERFORMANCE IN 2015 Enacted regulation 4 US CAFÉ performance 6 EU28 CO2 performance 8 China CAFC performance 9

REGULATORY PROPOSALS BEYOND 2015 Target trajectory convergence 11 United States 12 EU28 13 China 14Challenges and consequences 15

IHS MARKIT REGULATORY 2020–21 PERFORMANCE FORECAST Forecast methodology 18 What is VPaC? 19 US CAFÉ, EU28 CO2, China CAFC 20

BASELINE TECHNOLOGY FORECASTS Technology demand prognosis –Global 22 Why 48V MHEV? 23

SUMMARY Summary 27

16

Automotive Conference – Shanghai | 27 October 2016

© 2016 IHS MARKIT 17

Source: IHS Markit

Vehicle production

Plant composition

OEM objectives

Consumer preference analysis

CERA scenariosShutdown effects

Supply chain logistics

Tooling investments

Legislation, regulation, and taxation

ICE powertrain production and

sales

Legislation regulation and taxation

Energy storage

Infrastructure

Incentives and credits

Fuel price

Mech tech

xEVProduction and sales

IHS Markit regulatory 2020–21 performance forecast

Forecast methodologyOverarching boundary considerations

Automotive Conference – Shanghai | 27 October 2016

© 2016 IHS MARKIT 18

Forecasts for 61,000 unique vehicle-

powertrain combinations

Up to 200 technical attributes per vehicle

• VPaC is a web-based vehicle energy and performance analytics software suite.

• Vehicle energy demand versus propulsion energy are computed for all possible vehicle fleet combinations.

• The software is designed for strategy planning and competitive vehicle analysis.

• Drawing on IHS Automotive SBPT as input, it considers entire forecast fleets and individual vehicles, not just current fleets or single-vehicle simulations.

• VPaC puts CO2, FC and FE computation into the competitive context and expands the appeal beyond traditional engineering.

IHS Markit regulatory 2020–21 performance forecast

What is VPaC?Automotive Conference – Shanghai | 27 October 2016

© 2016 IHS MARKIT 19

• Some manufacturers are very close toPhase 4; we see the correct strategy atthe right time; incentives tweak required

• However, clearly some manufacturers arenot planning effectively for thecompliance challenge. Similar to the US inthat much greater NEV is required, butenough consumer pull is hard to envisage

IHS Markit regulatory 2020–21 performance forecast

US CAFE, EU28 CO2, China CAFCPassenger car only

Source: VPaC Compliance

CY2021 target

CY2020 target(s)

MY2021 target

• Some manufacturers will comply inEurope given our baseline tech splitforecast, although the fleet as a whole isexpected to miss by 10%

• However, we can quite easily envisage theEU28 fleet complying to 95g with someminor adjustments to mix. 2025 becomesthe challenge for Europe

• The most challenging geography. Macroconditions lead to a tech demand splitforecast that is not conducive tocompliance. Much greater electrification isthe solution, but the demand pull is hard toenvisage

• Having said this, there are three OEMs thatdespite the macro environment, arecoming from such a high base that theywill comply

Automotive Conference – Shanghai | 27 October 2016

Contents

© 2016 IHS Markit

AGENDA 3

REGULATORY PERFORMANCE IN 2015 Enacted regulation 4 US CAFÉ performance 6 EU28 CO2 performance 8 China CAFC performance 9

REGULATORY PROPOSALS BEYOND 2015 Target trajectory convergence 11 United States 12 EU28 13 China 14Challenges and consequences 15

IHS MARKIT REGULATORY 2020–21 PERFORMANCE FORECAST Forecast methodology 18 What is VPaC? 19 US CAFÉ, EU28 CO2, China CAFC 20

BASELINE TECHNOLOGY FORECASTS Technology demand prognosis –Global 22 Why 48V MHEV? 23

SUMMARY Summary 27

20

Automotive Conference – Shanghai | 27 October 2016

© 2016 IHS MARKIT

0%10%20%30%40%50%60%

EV

PHEV

GD

I-T

Die

sel

A8+ CVT

DCT

AW

D/4

WD

CY2015 CY2025

21

Baseline technology forecasts

Technology demand prognosis – GlobalMajor technology sets only – passenger car & SUV sales

0%10%20%30%40%50%60%70%80%

EV

PHEV

GD

I-T

Die

sel

A8+ CVT

DCT

AW

D/4

WD

CY2015 CY2025

0%10%20%30%40%50%60%70%

EV

PHEV

GD

I-T

Die

sel

A8+ CVT

DCT

AW

D/4

WD

CY2015 CY2025

Automotive Conference – Shanghai | 27 October 2016

© 2016 IHS MARKIT 22

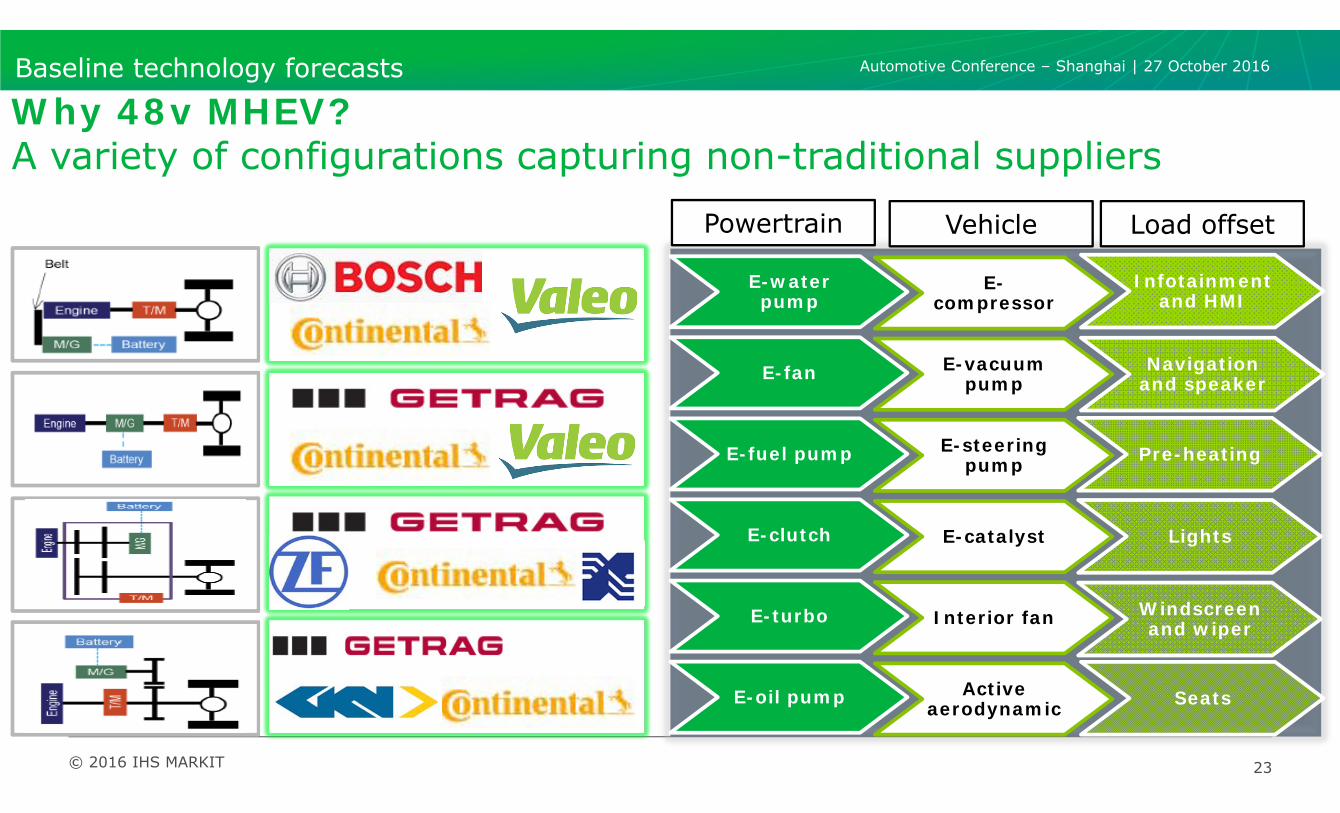
• 12V provides very limited scope to reduce CO2. High voltage is expensive. Hence, the right blendis of mild hybrid with different cost-benefit ratio to encourage CO2 reduction.

• Up to 15% fuel economy improvement, with Load offset and Better energy harvesting

12V

48V belt

48V crank

ChargingStart-stop

RecuperationSlow speed start-stopTorque boost

Torque assist and boostStart-stop < 20KphE-sailing, coasting, creeping

Fuel economy benefit

Baseline technology forecasts

Why 48v MHEV?More than just a stepping stone and its globally applicable

0%

5%

10%

15%

20%

25%

48V M

HEV

EU

28Sal

es

48V M

HEV

U.S

Sal

es

48V M

HEV

Chi

naSal

es

CY2015 CY2025

Automotive Conference – Shanghai | 27 October 2016

© 2016 IHS MARKIT 23

E-water pump

E-fan

E-fuel pump

E-clutch

E-turbo

E-oil pump

Infotainment and HMI

Navigation and speaker

Pre-heating

Lights

Windscreen and wiper

Seats

E-compressor

E-vacuum pump

E-steering pump

E-catalyst

Interior fan

Active aerodynamic

Powertrain Vehicle Load offset

Baseline technology forecasts

Why 48v MHEV?A variety of configurations capturing non-traditional suppliers

Automotive Conference – Shanghai | 27 October 2016

© 2016 IHS Markit

China Gov. target in 2020:NEV annual production = 2 million(Passenger Car + LCV + HCV)

24

Source: IHS Markit0.1 0.2 0.3 0.4 0.5 0.7 0.8 0.9 1.0 1.1 1.20.1 0.1 0.2 0.3 0.5 0.8 1.2 1.4 1.7 1.9 2.1

0.1 0.2 0.2 0.3 0.4 0.4 0.4 0.4 0.3 0.30.1 0.4

1.42.4

3.34.5

6.5

8.7

2011 2013 2015 2017 2019 2021 2023 2025

Plug-In Hybrid+

Battery EV

Mild Hybrid+

Full Hybrid

China government definition for NEV• Benefit in CAFC• Subsidy by government

China government definition for energy-saving vehicle• Benefit in CAFC• Subsidy by some local government

Units: Million vehicles

Policy orientationPHEV+BEV

Market orientationMild Hybrid/48V

Tier1 promote and play important role in 48V

Initial stage for xEVDemo application

PHEV+BEV=0.21M in 2015 0.4L/100km FC reduction

Baseline technology forecasts

Why 48v MHEV?Policy vs. cost vs. consumer – The rise of the MHEV in China

Automotive Conference – Shanghai | 27 October 2016

Contents

© 2016 IHS Markit

AGENDA 3

REGULATORY PERFORMANCE IN 2015 Enacted regulation 4 US CAFÉ performance 6 EU28 CO2 performance 8 China CAFC performance 9

REGULATORY PROPOSALS BEYOND 2015 Target trajectory convergence 11 United States 12 EU28 13 China 14Challenges and consequences 15

IHS MARKIT REGULATORY 2020–21 PERFORMANCE FORECAST Forecast methodology 18 What is VPaC? 19 US CAFÉ, EU28 CO2, China CAFC 20

BASELINE TECHNOLOGY FORECASTS Technology demand prognosis –Global 22 Why 48V MHEV? 23

SUMMARY Summary 27

25

Automotive Conference – Shanghai | 27 October 2016

© 2016 IHS Markit

• Global vehicle CO2, fuel economy, and fuel consumption regulations are continually tightening, resulting in significant increases in research and development spending and planning complexity.

• A sole focus on internal combustion engine (ICE) improvement will not be sufficient to achieve the upcoming targets in United States, EU28, or China. Electrification and vehicle measures reducing rolling resistance and aero drag are required.

• CO2 emissions reduction technologies also add costs to vehicles for being CO2 compliant. Therefore, every type of electrification is monitored by car manufacturers and potential car buyers with regard to its cost-benefit ratio.

• WLTC introduction is expected to reduce the gap between certified and real-world fuel economy CO2figures. However, overall vehicle development costs will likely increase.

• Scenarios developed using VPaC show that the industry HAS the hardware to meet the regulation, but not the consumer demand in our baseline scenario.

• It is particularly hard to envisage the necessary consumer demand being present in the United States.

26

Summary

SummaryIn general

Automotive Conference – Shanghai | 27 October 2016

© 2016 IHS Markit

• CAFC regulation now dominates the technology roadmap for auto manufacturers in China.

• Both joint venture and domestic OEM’s in China are facing serious challenges to meet the CAFC regulation in 2020 and 2025, although the joint ventures will leverage oversees experience and hardware sets.

• The luxury/premium vehicle has a proportionately stronger compliance headwind compared to volume manufacturers, despite the margin available to spend.

• Neither traditional technology nor NEV on its own will be enough to meet the CAFC regulation separately in 2020 and 2025. A difficult consumer pull outlook for NEV’s will result in OEM’s and the government needing to lean on the ESV (Energy Saving Vehicle).

• Comprehensive solutions will lead to more complex technology roadmap for OEM’s; increasingly, planners need to consider the balance of consumption, performance, cost, and regulation.

27

Summary

SummarySpecific to China

Automotive Conference – Shanghai | 27 October 2016

IHS MarkitTM COPYRIGHT NOTICE AND DISCLAIMER © 2016 IHS Markit.

No portion of this presentation may be reproduced, reused, or otherwise distributed in any form without prior written consent of IHS Markit. Content reproduced or redistributed with IHS Markit permission must display IHS Markit legal notices and attributions of authorship. The information contained herein is from sources considered reliable, but its accuracy and completeness are not warranted, nor are the opinions and analyses that are based upon it, and to the extent permitted by law, IHS Markit shall not be liable for any errors or omissions or any loss, damage, or expense incurred by reliance on information or any statement contained herein. In particular, please note that no representation or warranty is given as to the achievement or reasonableness of, and no reliance should be placed on, any projections, forecasts, estimates, or assumptions, and, due to various risks and uncertainties, actual events and results may differ materially from forecasts and statements of belief noted herein. This presentation is not to be construed as legal or financial advice, and use of or reliance on any information in this publication is entirely at your own risk. IHS Markit and the IHS Markit logo are trademarks of IHS Markit.

IHS Markit Customer Care:[email protected]: +1 800 IHS CARE (+1 800 447 2273)Europe, Middle East, and Africa: +44 (0) 1344 328 300Asia and the Pacific Rim: +604 291 3600


Recommended