48


2
AUTOMOTIVE NEWS EUROPE COVER STORY
www.autonewseurope.com JULY 2016
Knowledge built for market leadership
© 2016 PwC. All rights reserved. PwC refers to the PwC network and/or one or more of its member firms, each of which is a separate legal entity. Please see www.pwc.com/structure for further details. This content is for general information purposes only, and should not be used as a substitute for consultation with professional advisors.
From knowledge comes informed decisions. That’s why business leaders are looking for insight on today’s complex issues. And why we provide perspective on issues such as corporate governance, operations, regulation, talent, operations, cyber security, strategy and new platforms for growth. To gain additional insight on these and other issues of importance to your automotive business, visit www.pwc.com/auto

3
AUTOMOTIVE NEWS EUROPE
www.autonewseurope.comMARCH 2017
ISSUE HIGHLIGHTS
The European Commission is set to reshape the landscape of the global
auto industry later this year when it agrees on even more stringent carbon emission targets for the next decade. The new goals could mark the beginning of the end for vehicles powered by tra-ditional combustion engines in the EU, the world’s largest economic bloc. Our cover story assess the potential effects (Pages 6-10).
PSA Group CEO Carlos Tavares is con-cerned that the mayors of the world’s biggest cities -- especially those in Eu-rope -- will have a powerful say in which powertrains will rule the roads. Tavares supports making the air in cities cleaner, he just has a different idea on how to achieve the goal (Page 46).
Tavares is a very busy man. Having suc-cessfully turned around PSA, at press time he was aggressively pursuing a game-changing tie-up with General Mo-tors’ European brands, Opel and Vaux-hall. PSA and GM have been working together successfully for years, he said, pointing to the new Opel/Vauxhall Crossland X, which will spawn models for Peugeot and Citroen, as a prime ex-ample of what the companies could do if they merge. We look at the key events in Opel’s recent past that left it in posi-tion to part ways with GM after nearly a century together (Pages 16-17).
Clearing the air
Peugeot will highlight its autonomous driving technology at the Geneva auto show with a self-driving, shooting brake concept car called the Instinct. For a look at other key Geneva debuts, see our show preview on Pages 20-21.
SUVs and crossovers benefited most from Europe’s sales surge last year.
Combined sales of models such as the Renault Captur, Nissan Qashqai, BMW X1 and Jaguar F-Pace increased 22 percent to nearly 3.8 million units. That rise easily outpaced the overall mar-ket’s 6.5 percent increase to 15 million.
Our exclusive annual by-segment anal-ysis of the European market based on data from JATO Dynamics shows that SUVs and crossovers accounted for a quarter of the region’s total vehicle sales in 2015, up from 21 percent in 2015 and 20 percent in 2014. To find out which other segments are on the rise, and which ones are declining, see Pages 39-42. ANE
Sizzling SUVs
Our Latest Launches section showcases two brands -- Mini and Nissan -- that are counting on their newest models to shake things up (Pages 24 & 26).
Enjoy the issue!
Luca Ciferri,
Associate Publisher and Editor
Daimler’s new r&d boss, Ola Kaellenius, believes the auto industry is at a ma-jor crossroads as megatrends such as connectivity, autonomous drive, shared services and electrification combine to shape the future market. He shared his views on those key topics (Page 12).
Since creating the iconic looks of the first Audi TT, Peter Schreyer has dreamed of designing a true sports car. He joined Kia in 2006 and six years later he was promoted to Hyundai Motor Group vice president and chief design officer. Al-though this put him in control of styling at all the company’s brands, Schreyer’s sports car remained in a drawer. Then an opportunity arose to put that passion into a completely different project (Page 14).
Over the past two years, Renault has overtaken Ford and Opel to become the second-largest brand in Europe by unit sales, riding the momentum from a wave of stylish new models, especially in the hot crossover segment. But analysts say that success will be harder to maintain in 2017 (Page 18).
Hybrid and plug-in hybrid sales grew an impressive 30 percent to just over 400,000 in Europe last year, but the real impact in the midterm will be made by mild hybrids, analysts predict. By 2025 mild hybrids will capture 18 percent of the European market (Pages 22-23).
More on the WebPlease visit Automotive News Europe’s Geneva auto show Web page for the latest news and photos at:
autonewseurope.com/geneva

4
AUTOMOTIVE NEWS EUROPE
www.autonewseurope.com MARCH 2017
INSIDE THIS ISSUE
KEITH CRAINPublishing Director
KC CRAINGroup Publisher
JASON STEINPublisher
LUCA CIFERRIAssociate Publisher & Editor+39 348 274 00 [email protected]
DAVE VERSICALDirector of Group Editorial Operations+1 313 446 [email protected]
DOUGLAS A. BOLDUCManaging Editor+49 (0) 171 424 6373dbolduc@ autonews.com
PAUL MCVEIGHManaging Editor+49 (0) 176 7835 3951pmcveigh@ autonews.com
James Clark (UK), Nick Gibbs (UK), Christiaan Hetzner (Germany), David Jolley (Germany), Mary Raetz (U.S.), Heather Rowe (U.S.), Peter Sigal (France)Correspondents
ADVERTISINGEUROPE
THOMAS HERINGERCommercial Director Europe+ 49 (0) 8153 907 [email protected]
GEORGIA CHAPMANDirector of European Marketing and Events+49 (0) 89 5795 [email protected]
USA
KAREN RENTSCHLERManaging Director, Sales and Events+1 313 446 [email protected]
KOREA
JUNG-WON SUHSinsegi Media Inc.+82 2 785 [email protected]
CIRCULATIONJAMIE TUNISON Marketing Coordinator +1 313 446 1642 [email protected]
SUBSCRIPTION SERVICESInternational number +1 313-446-0450 Toll free from the US +1 877-812-1584 [email protected]
Published byCrain Communications Inc1155 Gratiot Ave. ❚ Detroit MI 48207. USA
All contents Copyright 2017. No part of this publication may be reproduced, stored in a retrieval system or transmitted in any form or by any means, electronic or mechanical, photocopying, recording or otherwise without the permission of the publisher.All rights reserved.
www.autonewseurope.com
INSIDE THE JANUARY & 1-MONTH NUMBERS
29 European sales by country and brandNetherland, Latvia, Poland were big monthly winners
30 European top 50 Ford Fiesta, VW Tiguan make solid gains
31 Top 10 sellers in key markets New feature shows leaders in 27 countries
33 European sales by modelBMW X1, Fiat Tipo, Hyundai SantaFe help lift their brands
39 Segment stars of 2016SUV sales surge to a landmark high
26 Goal-oriented Nissan plots Micra’s return to top 10 in subcompact segment
SUPPLIERS27 Tailored solution
Tata Steel looks to expand high-margin product to volume brands
28 CutawaySee who has parts in the new Land Rover Discovery
FINAL WORD46 Power players
Why city mayors may dictate which cars will rule the roads
43 European production by brandAston Martin, Maserati, DS make double-digit gains
44 Turkey salesJanuary sales rise 9%; Renault models benefit
45 Russia salesJanuary sales fall 5%; Kia Rio takes early lead
CONTENTS3 Issue highlights
COVER STORY6 Brave new world
Tougher EU emissions rules put the traditional engine’s future in doubt
Q&A12 Trend tracker
Daimler r&d boss outlines Mercedes’ self-driving, EV, connectivity plans
14 Design drivenHow Peter Schreyer channeled his passion to make a sports car into Kia’s new sedan
AUTOMAKERS16 Finding the right fit
How Opel/Vauxhall and PSA are already successfully cooperating
18 Holding its ground Renault faces tough task staying Europe’s No. 2 brand as product push slows
20 Showtime in Geneva DS 7 Crossback, Range Rover Velar, Seat Ibiza among crucial unveilings
22 Gaining ground Full-, plug-in hybrid sales rise fast but new tech could shake up sector
LATEST LAUNCHES24 Size matters
Mini maxes out with Countryman premium compact SUV
COVER DESIGN: Joerg Hunner/iStock
Hyundai Motor Chief Design Officer Peter Schreyer
14
@autonewseurope
45
AUTOMOTIVE NEWS EUROPE DATA
www.autonewseurope.com
MARCH 2017
AvtoVAZ ................... 16,334 15,577 5% 16,334 15,577 5%
Datsun ....................... 1,107 1,001 11% 1,107 1,001 11%
Infiniti ....................... 379 298 27% 379 298 27%
Nissan ........................ 4,230 4,494 –6% 4,230 4,494 –6%
Renault ..................... 5,208 5,014 4% 5,208 5,014 4%
RENAULT-NISSAN ...... 27,258 26,384 3% 27,258 26,384 3%
KIA ............................. 10,306 9,049 14% 10,306 9,049 14%
Audi .......................... 935 905 3% 935 905 3%
Skoda ........................ 3,571 3,556 0% 3,571 3,556 0%
Volkswagen .............. 4,581 4,455 3% 4,581 4,455 3%
Volkswagen vans ..... 305 323 –6% 305 323 –6%
VW GROUP ................ 9,392 9,239 2% 9,392 9,239 2%
Genesis ...................... 6 0 – 6 0 –
Hyundai .................... 6,694 8,010 –16% 6,694 8,010 –16%
HYUNDAI GROUP ...... 6,700 8,010 –16% 6,700 8,010 –16%
Lexus ......................... 1,000 1,085 –8% 1,000 1,085 –8%
Toyota ....................... 3,831 6,064 –37% 3,831 6,064 –37%
TOYOTA GROUP ........ 4,831 7,149 –32% 4,831 7,149 –32%
Mercedes-Benz ......... 2,471 3,206 –23% 2,471 3,206 –23%
Mercedes-Benz vans 246 260 –5% 246 260 –5%
Smart ......................... 20 12 67% 20 12 67%
DAIMLER .................... 2,737 3,478 –21% 2,737 3,478 –21%
GAZ LCV ..................... 2,307 1,851 25% 2,307 1,851 25%
FORD .......................... 2,253 2,242 1% 2,253 2,242 1%
BMW ......................... 1,758 1,919 –8% 1,758 1,919 –8%
Mini ........................... 70 76 –8% 70 76 –8%
BMW GROUP ............. 1,828 1,995 –8% 1,828 1,995 –8%
Cadillac ..................... 78 48 63% 78 48 63%
Chevrolet .................. 1,734 1,201 44% 1,734 1,201 44%
GM ............................. 1,812 1,249 45% 1,812 1,249 45%
UAZ ............................ 1,735 1,930 –10% 1,735 1,930 –10%
MAZDA ...................... 1,513 1,411 7% 1,513 1,411 7%
MITSUBISHI ................ 1,076 1,323 –19% 1,076 1,323 –19%
LIFAN .......................... 929 1,244 –25% 929 1,244 –25%
Jaguar ....................... 134 34 294% 134 34 294%
Land Rover ............... 401 500 –20% 401 500 –20%
JAGUAR LAND ROVER 535 534 0% 535 534 0%
Citroen ...................... 265 220 21% 265 220 21%
Peugeot .................... 227 196 16% 227 196 16%
PSA GROUP ................ 492 416 18% 492 416 18%
RAVON ....................... 445 0 – 445 0 –
SUBARU ..................... 303 422 –28% 303 422 –28%
SUZUKI ....................... 265 571 –54% 265 571 –54%
Alfa Romeo .............. 0 2 – 0 2 –
Chrysler ..................... 0 3 – 0 3 –
Fiat ............................ 122 164 –26% 122 164 –26%
Jeep ........................... 92 76 21% 92 76 21%
FIAT CHRYSLER .......... 214 245 –13% 214 245 –13%
CHERY ........................ 205 280 –27% 205 280 –27%
PORSCHE .................... 151 311 –51% 151 311 –51%
Acura ......................... 0 47 – 0 47 –
Honda ....................... 123 190 –35% 123 190 –35%
HONDA GROUP ......... 123 237 –48% 123 237 –48%
GEELY ......................... 120 555 –78% 120 555 –78%
CHANGAN .................. 93 34 174% 93 34 174%
VOLVO ....................... 72 16 350% 72 16 350%
DFM ............................ 54 91 –41% 54 91 –41%
ISUZU ......................... 41 57 –28% 41 57 –28%
IVECO ......................... 35 47 –26% 35 47 –26%
FAW ........................... 33 35 –6% 33 35 –6%
ZOTYE ........................ 28 0 – 28 0 –
BRILLIANCE ................ 13 114 –89% 13 114 –89%
BAW ........................... 10 13 –23% 10 13 –23%
HYUNDAI LCV ............ 4 0 – 4 0 –
FOTON ....................... 3 0 – 3 0 –
SSANGYONG ............. 0 153 – 0 153 –
HAIMA ....................... 0 40 – 0 40 –
DAEWOO ................... 0 1,269 – 0 1,269 –
Total ........................... 77,916 81,994 –5% 77,916 81,994 –5%
Russia vehicle sales by manufacturer – January
Jan. Jan. Percent 1 mos. 1 mos. Percent
2017 2016 change 2017 2016 change
1 Kia Rio
5,693 2 Lada Granta
4,624 3 Lada Vesta
4,088 4 Hyundai Solaris
2,886 5 Hyundai Creta
2,565 6 VW Polo
2,550 7 Skoda Rapid
1,981 8 Renault Duster
1,848 9 Chevrolet Niva
1,67010 Lada 4x4
1,62711 Lada X-ray
1,57812 Kia Sportage
1,56513 Lada Largus
1,56214 Renault Kaptur
1,51915 Toyota Camry
1,32716 VW Tiguan
1,28817 Skoda Octavia
1,24818 Nissan X-Trail
1,20619 Toyota RAV4
1,15020 Lada Priora
1,14321 Mazda CX-5
1,11522 Lada Kalina
1,02523 Datsun On-Do
1,01424 Nissan Qashqai
1,01025 Mitsubishi Outlander
943
January 2017 Top 25 Sellers Ranking based on new car and LCV sales in Russia
Source: AEB Automobile Manufacturers Committee
1 Lada Granta 7,377
2 Hyundai Solaris 5,626
3 Kia Rio
3,553 4 Toyota RAV4
2,816 5 VW Polo
2,655 6 Kia Sportage
2,407 7 Renault Duster
2,379 8 Lada Largus
2,065 9 Lada Vesta
1,64310 Lada 4x4
1,60911 Skoda Rapid
1,56012 Renault Logan
1,48113 Lada Priora
1,38614 Skoda Octavia
1,36515 Kia Cee’d
1,19616 Chevrolet Niva
1,18217 Toyota Camry
1,14618 Lada Kalina
1,14019 Nissan Qashqai
1,07320 Renault Sandero
1,04321 Toyota Land Cruiser
1,01422 Mazda CX-5
97523 Daewoo Gentra
95724 UAZ Patriot
85625 Nissan Almera
854
January 2016 Top 25 Sellers Ranking based on new car and LCV sales in Russia

5
AUTOMOTIVE NEWS EUROPE COVER STORY
www.autonewseurope.com MARCH 2017

6
AUTOMOTIVE NEWS EUROPE COVER STORY
www.autonewseurope.com MARCH 2017
Why tougher EU emissions rules put the combustion engine’s future in doubt
CHRISTIAAN [email protected]
The European Commission is set to reshape the landscape of the global
auto industry later this year when it agrees on even more stringent carbon emission targets for the next decade that could mark the beginning of the end for traditional combustion-pow-ered vehicles in the world’s largest economic bloc.
Experts believe regulators, most likely in the third quarter, could dramatically slash the future amount of greenhouse gases produced by new passenger cars in a bid to reverse rising emissions from the road transport sector in time for the European Union to meet its 2030 target. Brussels has committed to a binding CO2 cut of at least 40 percent on 1990 levels as part of the first global pact to combat climate change signed in Paris. Automakers currently must reduce their CO2 emissions in Europe to 95 grams per kilometer by 2021.
Major powertrain trends such as down-sizing and turbocharging were the result of pressure from EU regulators in the past. It’s fair to say the next round of tar-gets, which could include limits for both 2025 and 2030, will have an even more
drastic effect on the automakers’ pow-ertrain strategies.
Major metropolitan areas such as Paris, Madrid, Athens and Oslo are already planning to ban diesels in the city cen-ters in the coming years to tackle smog problems. By the end of the next de-cade, European new-car sales of mod-els with full or partially electrified drive-trains are expected to surpass those of vehicles with traditional combustion engines (see graphic, Page 7).
Speaking on behalf of vehicle manu-facturers in his role as president of in-dustry association ACEA, Daimler CEO Dieter Zetsche sounded worried last month when the conversation turned to the further de-carbonization of road transport.
“We need to pull every lever at our dis-posal, including hybrids, fuel cell, gas and battery-electric vehicles,” he said during ACEA’s annual reception in Brus-sels last month.
Electric powerThe move toward electromobility comes at a time when manufacturers are al-ready pouring billions of euros into de-veloping autonomous and connected cars. Alternative drivetrains will require
investments of more than 40 billion euros by 2020 by the German auto in-dustry alone, according to the VDA, the country’s auto association, making the push to reducing carbon emissions the greatest challenge facing automakers.
While new business models can be created by selling mobility-on-demand packages, real-time parking information or robotized ride-hailing services, the po-tential to generate fresh revenue growth simply by offering cleaner, eco-friendly cars is largely non-existent. Customers are unwilling to pay extra solely to im-prove ambient air quality, despite the es-timated 100 million euros in incremental costs per each gram of CO2 reduction undertaken by carmakers such as the Volkswagen Group.
Currently, each manufacturer is subject to weight-based limits that require the fleet CO2 average to reach 95g/km by 2021 based on New European Driving Cycle (NEDC) guidelines.
By comparison the ceiling for 2015 was 130g/km, which the industry easily met with a level of 119.5g/km even though plug-in hybrids and battery-electric ve-hicles comprised only 1 percent of the overall new car fleet at the time. Under new regulations, this target could poten-
Under new regulations, automakers may have to slash CO2 emissions to as low as 68g/km by 2025. Such a move would put automakers under pressure to switch to powertrains that emit very few tailpipe pollutants.
Brave new world
Phot
o: iS
tock
phot
o
7
AUTOMOTIVE NEWS EUROPE COVER STORY
www.autonewseurope.comMARCH 2017
tially sink as low as 68g/km for 2025 – a reduction by half in the space of just a decade. That’s roughly the same amount of time between the initial development of a new car and the end of the model’s life cycle. Meeting such a limit would undoubtedly require a substantial pen-etration of electrified cars, tough even for a company such as Toyota with its fuel-efficient fleet of gasoline-electric hybrids. The VW brand, for example, estimates it would have to sell 1 million battery-electric vehicles in 2025 alone, compared with the tens of thousands it currently sells, to meet future emissions targets around the world.
During a speech in January, VW brand sales chief Juergen Stackmann told his German dealers at a gathering in Bonn that “global environmental standards are expected to be intensified drasti-cally” starting in the next decade.
Another challenge facing automakers in Europe is that they will need to comply with the so-called Real Driving Emissions (RDE) test procedure starting in Septem-ber (see box, Page 10). Originally intro-duced to address excess nitrogen oxide (NOx) emissions from diesels, now ex-perts believe the RDE test can also help with reducing CO2. Certified NEDC fuel consumption for plug-in hybrids for ex-ample is about 30 percent to 40 percent lower than in real life use.
As a consequence, German supplier Schaeffler estimates that half of the 111 million vehicles produced globally in 2025 will no longer be powered purely
by internal combustion engines as out-put of hybrids gains speed. Over the fol-lowing five years, the share of battery-electric vehicles produced is expected to double, reaching 30 percent in 2030 and matching the number of vehicles made with combustion engines by then.
Schaeffler ally Continental acknowl-edges that the two companies may be able to increase sales of their fuel-saving solutions, such as their 48-volt mild hy-brids, as automakers race to reach the new targets but Continental CEO Elmar Degenhart refutes speculation the com-panies will profit from this.
“We all are sitting in the same boat,” De-genhart told Automotive News Europe. “What’s not good for our customers can-not be good for us suppliers.”
Cost dilemmaThe problem is when it comes time to pass on the added costs from carbon emissions compliance, even aspirational brands struggle. Porsche said last year its affluent car buyers won’t open their
wallets wider to pay the extra 10,000 euros needed to build a plug-in hybrid version of the Panamera or Cayenne, forcing the company to swallow a chunk of the costs itself. Daimler r&d chief Ola Kaellenius, Zetsche’s likely successor as CEO, said the automaker had little choice but to offer the plug-in hybrid version of its flagship Mercedes-Benz S class at the same price as the equivalent version with a traditional powertrain. Customers pay for horsepower, not CO2 savings, he said, underlining that the added complexity is the carmaker’s problem. Industry analysts say one key reason for that is that the fuel-usage levels touted by automakers can only be achieved in the utopian world of labora-tory test benches.
“Given the urgency and ambition of the Paris [Agreement] commitments, legisla-tion should be designed in a way that in-centivizes manufacturers to optimize tech-nology to lower CO2 emissions in reality rather than adapting to the test cycles,” scientists wrote in a report sent to the Eu-ropean commission last November.
In its annual Mind the Gap study, Brus-sels-based advocacy group Transport & Environment refuted official EU statistics that showed a continued improvement in CO2 emissions from new cars. Analyzing third-party fuel consumption data, T&E argued that only Toyota would have met its 2015 target in real life. T&E concluded that roughly two-thirds of the improve-ment in CO2 emissions over 2008 levels existed only on paper because of testing-procedure loopholes, blasting the results as “no longer having any credibility” and estimating the hidden fuel costs to mo-torists at 549 euros a year.
New testsTo address this weakness, the EU is phasing in a new method to measure emissions to create “a strong incentive for the deployment of low-carbon mobil-
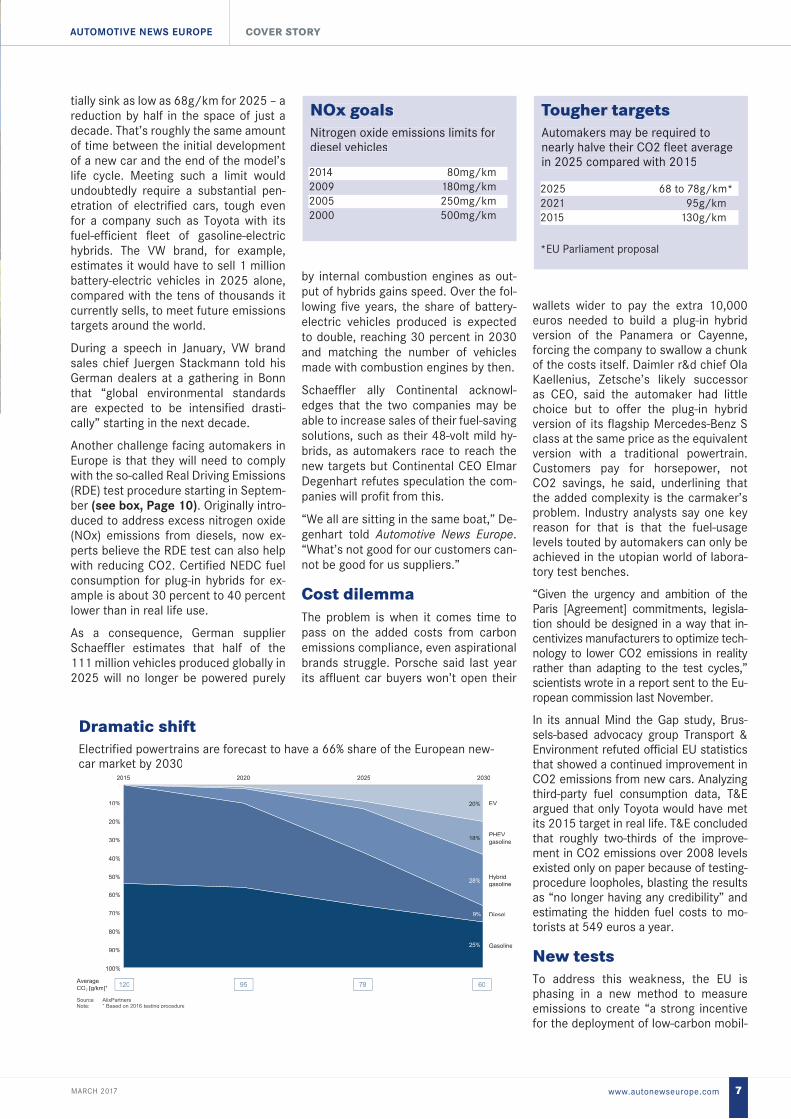
NOx goals Nitrogen oxide emissions limits for diesel vehicles
2014 80mg/km2009 180mg/km2005 250mg/km2000 500mg/km
Tougher targets Automakers may be required to nearly halve their CO2 fleet average in 2025 compared with 2015
2025 68 to 78g/km*2021 95g/km2015 130g/km
*EU Parliament proposal
25
Powertrain mix estimate all cars Europe 2015 to 2030 assuming lowest TCO to achieve expected CO2 targets, registration of new cars (%)
Overall shift to electrified vehicles by 2030 replacing diesel which is expected to have a small share of additional sales post 2030
www.alixpartners.com
Key model findings
• By 2030, alternative powertrains will significantly substitute conventional powertrains.
• Diesel will lose high share to alternative powertrains from 2020 –not cheap enough to compete with gasoline and not clean enough to compete with APVs.
• Hybrids will gain significant share from 2020, PHEVs and EVs from 2025 as battery cell costs fall and charging infrastructure rolls out.
Source: AlixPartnersNote: * Based on 2016 testing procedure
120 95 78 60Average CO2 [g/km]*
20%
18%
28%
9%
25%
100%
90%
80%
70%
60%
50%
40%
30%
20%
10%
-202520202015
Gasoline
Diesel
Hybridgasoline
PHEVgasoline
EV
2030
Market mix changes
Source: AlixPartnersNote: * Based on 2016 testing procedure
120 95 78 60Average CO2 [g/km]*
20%
18%
28%
9%
25%
100%
90%
80%
70%
60%
50%
40%
30%
20%
10%
-202520202015
Gasoline
Diesel
Hybridgasoline
PHEVgasoline
EV
2030
Dramatic shift Electrified powertrains are forecast to have a 66% share of the European new-car market by 2030

8
AUTOMOTIVE NEWS EUROPE COVER STORY
www.autonewseurope.com MARCH 2017
ity technologies,” according to Brussels. Starting this September, it will begin re-placing the outdated and largely discred-ited NEDC cycle with the more robust Worldwide harmonized Light vehicles Test Procedure (WLTP) that better cap-tures real driving behavior.
This, however, complicates things since the post-2021 targets are therefore no longer directly comparable. T&E, for ex-ample, argues the Commission should propose a 2025 target of 80g/km based on the more strenuous WLTP guidelines, complemented by an additional real driv-ing test that ensures CO2 emissions are no higher than 10 percent above lab conditions rather than the 40 percent discrepancy of today.
One German official argued that the EU should only impose relative targets on each carmaker rather than an absolute figure given the lack of experience with the new cycle. The problem is none of this is really helping the overarching goal of reducing greenhouse gas emissions within the EU.
Although new cars are becoming cleaner each year, the overall carbon footprint from road transport has been growing since 1990, making it the only major sector of the economy heading in the wrong direction. According to the most current data from the European Envi-ronmental Agency published last June, road transport increased its CO2 output by 6.6 million metric tons in 2014 com-pared with 2013.
That was the largest increase of any sec-tor of the EU’s economy that year and meant that road transport was respon-sible for about 20 percent of total green-house gas emissions across the bloc. While part of this is due to the weakness of the NEDC system in measuring on-road emissions, another factor is that EU roads have an existing fleet of 250 million cars, which are estimated to be 9.7 years old on average.
“We would like to see proposals which do not only concentrate on new cars but also on the whole fleet,” said VDA President Matthias Wissmann, hoping to shift some of the burden away from manufacturers.
One failed proposal involved including road transport in Europe’s cap-and-trade system, effectively forcing drivers to pay for it in the form of higher fuel prices.
Currently, ACEA is calling for incentives to renew the aging car fleet or receive cred-its for Intelligent Transportation Systems
(ITS) such as truck platooning – it even has a website called reducingCO2together.eu.
German influenceWissmann, who is a former transportation minister from Chancellor Angela Merkel’s political party, used to have an easier lob-
bying job. When the 95g/km target was due to be passed during an EU summit in June 2013, Merkel intervened at the last minute on behalf of Wissmann’s au-tomotive members. She pushed for more lenient limits that would protect the sale of large premium sedans and SUVs -- the hallmark of companies such as BMW and Mercedes. Merkel, however, has since signed up to the Paris Agreement and must deliver on her own CO2 commit-ments, prompting T&E’s Greg Archer to say that he doesn’t expect any last-sec-ond changes to the new emissions regu-lations for automakers.
“There is no way that Germany can achieve its own targets on transport for 2030 unless there are significant im-provements in the efficiency of conven-tional vehicles,” Archer told Automotive News Europe. “The position of Germany is likely going to be much more nuanced than it has been in the past simply be-cause it has its own climate plan.”
Making matters worse is the negative backlash against all automakers in the wake of VW Group’s cheating on emissions tests. The scandal revealed the industry-wide use of legal loopholes to circumvent tailpipe emission limits as soon as vehicles are off the test bench and on the road. As a result, all vehicle emissions -- nitrogen
A portable emissions measurement system (PEMS) is pictured on the Citroen C4 during testing near Paris. The system is used to calculate a car’s fuel consumption, CO2 and NOx during real world driving.
Public health is at stake. We have no time to lose.
Elzbieta BienkowskaEU Industry Commissioner
Continued on Page 10▼

9
AUTOMOTIVE NEWS EUROPE COVER STORY
www.autonewseurope.comMARCH 2017

10
AUTOMOTIVE NEWS EUROPE COVER STORY
www.autonewseurope.com MARCH 2017
WHAT DOES RDE MEAN?Starting in September, the Real Driv-ing Emissions (RDE) test procedure will determine whether a new model can be put on the market. This test is being introduced because of a grow-ing discrepancy in the on-road emis-sions such as nitrogen oxides (NOx) and particle numbers from passenger vehicles compared with the results obtained by laboratory testing. Ac-cording to European Commission data, even the newest diesel models sold in Europe exceed the NOx limit by 400% on average in real driving conditions compared to laboratory testing. Tailpipe pollutants will be measured by portable emission mea-suring systems (PEMS) that are at-tached to cars that are driven on the road using random acceleration and deceleration patterns.
WHAT DOES WLTP MEAN?The new Worldwide harmonized Light vehicles Test Procedure (WLTP) is a certification laboratory test that takes effect starting in September for all new vehicle types, replacing the New European Driving Cycle (NEDC), which was last amended in the 1990s. After a period where both are employed, WLTP will be the exclusive method for measuring CO2 and fuel consumption starting 2020 under current plans.
WHY INTRODUCE IT?Consumers pay more at the pump be-cause of the inaccuracy of the NEDC, while governments that tax cars on their CO2 output miss out on reve-nue, and the problem is getting worse over time. Scientists reporting to the European Commission in November last year cited 8 different studies that together determined the gap between
the certified and real life levels wid-ened from 8% in 2001 to 38% in 2013 on average.
HOW DOES THE NEDC WORK AND CAN THE TEST BE TRICKED?Before a car can be certified, the roll-ers on the stationary lab bench that spin in place as the wheels turn must first be properly calibrated. This is done to mimic forces acting against the vehicle, such as wind drag and tire rolling resistance. Think of it as putting a car on a treadmill and then providing variable difficulty levels. This lab setting, the “road load coef-ficient,” is determined by the coast-down test made on a flat road, which measures how long it takes for a car traveling in neutral to come to a standstill from a given starting speed. Carmakers tape up body panel gaps, overinflate tires, use special lubri-cants to reduce mechanical friction and even remove the side mirrors to maximize this distance and achieve an artificially easier lab setting. Un-like in the U.S., carmakers have suc-ceeded in classifying road load coef-ficients as a trade secret in Europe.
HOW DOES WLTP DIFFER FROM NEDC?It uses a more realistic driving cycle derived from a database of 800,000km of in-use vehicle data. At 30 minutes in duration, the WLTP is 50 percent longer than the NEDC test, it covers more than twice as much ground in kilometer terms and includes an extra urban phase where speeds can reach 130 kph. Accelerations represent 44% under WLTP rather than 21% for the NEDC and are nowhere as gentle and constant as with NEDC. Previous off-cycle technologies -- such as the air
conditioner -- that run directly off the engine will no longer be shut off. Few-er parameters are imprecisely defined.
WHAT IMPLICATIONS DOES THIS CHANGE HAVE?The NEDC has long idling phases equivalent to about a quarter of the test. WLTP has half that share. This will eliminate the CO2 bonus from start-stop systems, but the WLTP is particularly friendly toward 48-volt mild hybrids, which are considered a cost-effective means of downsizing engines further without sacrificing acceleration or torque. Additionally, WLTP requires CO2 emission levels for every version of a car a customer can purchase, rather than one low-spec base version.
WHO WILL USE THE WLTP TEST?Under development since September 2009 by United Nations body UNECE as a global standard, the European Union will be the first to implement it. Other countries participated in pool-ing data, and as a result Japan has committed to using WLTP, with India and Korea expected to follow. While China provided input, it remains un-clear whether it will also adopt the test cycle. The U.S. withdrew in 2010, with experts saying U.S. officials nev-er saw the need for change having had a more effective fuel consump-tion test than NEDC to begin with.
WHAT REMAINS UNCLEAR?Automakers in Europe want the 2021 fleet CO2 target of 95g/km to be mea-sured using NEDC rules rather than under WLTP figure as new versions of existing models sold will undoubtedly be engineered to perform better under the older, easier test. ANE
Explaining the key terms
oxide (NOx), fine particulate matter, CO2 -- have come under far greater scrutiny. This could undermine hopes the Commission will strike the more favorable balance be-tween economic and environmental inter-ests that manufacturers would like. Last December may have marked a water-
shed moment in which consumer advo-cacy groups notched a victory over the auto industry. EU member states forced an across-the-board cleanup of tailpipe pollutants in September 2018, requiring the retrofit of particle filters to trap soot from cars equipped with gasoline direct injection engines.
In a statement sent by the VDA, German carmakers lashed out at their own gov-ernment in Berlin for failing to veto the
decision, flatly condemned it as “impossi-ble” to implement in the time allowed and warned as many as half a million fewer cars would be built that year as a result.
“The Commission’s determination to make car emissions testing increasingly robust is paying off,” said EU Industry Commissioner Elzbieta Bienkowska in an ominous signal to carmakers at the time. “Public health is at stake. We have no time to lose.” ANE
Continued from Page 8▼

11
AUTOMOTIVE NEWS EUROPE COVER STORY
www.autonewseurope.com MARCH 2017

12
AUTOMOTIVE NEWS EUROPE Q&A
www.autonewseurope.com MARCH 2017
Daimler r&d boss outlines Mercedes’ self-driving, EV, connectivity plans
Trend tracker QADaimler’s new r&d boss, Ola Kaelle-
nius, believes the auto industry is at a major crossroads as megatrends such as connectivity, autonomous drive, shared services and electrification com-bine to shape the future market. The Swedish executive succeeded Daimler’s long-serving r&d chief, Thomas Weber, in January and is considered a front-runner to succeed CEO Dieter Zetsche when his contract expires in 2019. Kaellenius has worked at Daimler since 1993. He is the former head of sales at Mercedes-Benz Cars and has also headed the compa-ny’s AMG performance unit. He recently spoke with Automotive News Europe As-sociate Publisher and Editor Luca Ciferri.
Do you believe the automotive indus-try is at a crossroads? Yes, we are in the middle of a transfor-mation process. There are four technical megatrends shaping this transforma-tion, we call them CASE, which is short for connectivity, autonomous drive, shared services and electrification. The breakthroughs that we have had in the last few years will lead to an actualiza-tion of these trends in the next five to 10 years and this could change the face of the auto industry.
Does Daimler expect to benefit from these trends? We’re in a strong position on every one and we are putting further resources into them to make sure Daimler remains one of the leading companies in the future.
Is artificial intelligence (AI) now the leading technology for autonomous driving and is it ready? I remember hearing a lot about artificial intelligence 20 or 25 years ago. Every-body was talking about it. Then it went quiet for 20 years, not least because writ-ing line code for every eventuality would end up creating a very thick book that would need computing power like there was no tomorrow. That’s why it stalled. In the last three to four years, there’s been an absolute breakthrough in how you can apply software to address this
problem. We couldn’t have done it the old way. Now the technological building blocks capable of taking on this chal-lenge are really coming together.
What do you need for AI in a car to be safe, redundant AI interfaces? In terms of the computing power to run the autonomous system, we will rely on one computer to make it simple. But, for some systems in the car, like steering and braking where in a case of the loss of electrical power you must use muscle power to make sure the car stays on the road, you are going to have to look at redundancies.
Will we see a mid-cycle face-lift of the S class this summer and will there be new autonomous driving features added to your flagship? We’re coming with more new features on the next S class. For example, I think this is the first time any production car links the map to the sensor data in an in-telligent way for an application that you can actually buy.
Could you explain? Let me give you one example: Take a curvy highway somewhere in the U.S. where the speed limit is 55 mph (about 80 kph). This highway might have some corners that are so tight that it wouldn’t be very comfortable to go through them at 55 mph. Maybe you should go through at 50 mph or at 45 mph. As a driver, you would just slow down. Most assistance systems up to this point, however, can’t do that. That’s why we have linked the sensors to the map material. The map knows that you’re getting to this corner so it automatically slows the car to the appropriate speed to take the corner and then accelerates to the set speed once you are through the curves.
How good is your current semi-auton-omous technology at handling curves?
One of the challenges with semi-auto-mated drive is radius as a course and exactness. Clearly you don’t want to be a meter off and end up with half of your
car on the other side of the road. The narrower the corner, the more difficult this is. Our current level of our driver assistance systems, especially at high speeds, could do 80 percent of all au-tobahns in Germany and maybe 10 to 20 percent of the smaller roads. The new system, where we have worked up even sharper cornering ability and further devel-oped our sensing technology, can now do approximately 80 percent of the smaller highways in Germany as well. ANE
Meet r&d boss❚ NAME: Ola Kaellenius
❚ TITLE: Daimler Board Member for Group Research and Mercedes-Benz Cars Development
❚ AGE: 47
❚ MAIN CHALLENGES: Keep-ing Daimler ahead of sweeping changes around connectivity, autonomous driving and electrifi-cation; managing the expansion of Mercedes’ portfolio to more than 40 models.

13
AUTOMOTIVE NEWS EUROPE COVER STORY
www.autonewseurope.com MARCH 2017

14
AUTOMOTIVE NEWS EUROPE Q&A
www.autonewseurope.com MARCH 2017
How Schreyer channeled his passion to make a sports car into the Kia Stinger
Design driven QAPeter Schreyer, the man responsible
for the iconic looks of the first Audi TT coupe, has dreamed of designing a true sports car for Kia since the Korean auto-maker hired him away from the Volkswa-gen Group in 2006. Despite his success at Kia, which in 2012 earned him a promo-tion to Hyundai Motor Group vice presi-dent and chief design officer and put him in control of styling at all the company’s brands, Schreyer’s sports car remained in a drawer. Then an opportunity arose to put that passion into a completely differ-ent project. The result is the Kia Stinger. Schreyer discussed the sport sedan’s gen-esis with Automotive News Europe Associ-ate Publisher and Editor Luca Ciferri at the Stinger’s European preview in Milan, Italy.
How did you start with the Stinger?I had a sports car on my mind for years. It was almost a dream for me [since I arrived at Kia]. I had hoped to use a rear-wheel-drive layout for the car be-cause you can get completely different proportions that way. After we did the South Korea-only K9 large sedan with rwd [Kia Europe design boss) Gregory Guillaume said we should collaborate on something based on this architec-ture because we are both passionate about sports cars. The result was the Stinger, which is something special. It is the first rwd sporty sedan from Kia that was designed since day one for in-ternational markets.
Where did you look for inspiration?In the 1970s you had fantastic Gran Tur-ismo models from Maserati, such as the Ghibli, that offered performance, com-fort and style. The idea was to make a modern interpretation of the GT.
Was the first example of this the GT concept unveiled at the 2011 Frank-furt auto show?Yes, it was so well received by the media, dealers and customers that the top management in Korea started to consider making a business case for the car so we started to work to-ward production.
Is it fair to say the Stinger is a real-ity because the design of the concept was so compelling?Absolutely. And after seeing it the busi-ness side of the company became ex-cited and really wanted to make it hap-pen. For us it was a dream come true. I became more and more hopeful the car would make it to production when I kept seeing big smiles on the faces of top management when we presented the various evolutions of the project.
Why was it called the “red model” within Kia?The code-name was CK but after we had presented the styling model painted in a special shade of red that everyone liked it became known as the red model with-in the entire company.
As a car goes from concept to produc-tion the design is usually toned down. Did that also happen with the Stinger?Designers always aspire to make the production car as close to the concept as possible, but you face a lot of tech-nical and safety issues, ranging from pedestrian protection requirements to C-pillar visibility. Overall, I am happy with the Stinger’s final look. I also have to admit that the front of the production car is better than the concept because we had more time to refine it.
Will there be black stripes on the hoods on all models? If so, isn’t that just decoration?They are on all models and I do not see them as decoration. You need to differen-tiate your design from your competitors and graphic elements are needed some-times, otherwise you just make a box.
Which of the Stinger’s design charac-teristics will be transferred to future Kia models? Every new model influences the next ones. You will see some sportier Kia cars in the future.
Will China get the Stinger?China is such a big market with different
demands and sports sedans like this are also going to work there, sooner or later.
Will there be a Stinger wagon?A wagon is not planned at the moment.
Do you still dream of one day penning a roadster for Kia, Hyundai or eventu-ally Genesis?Yes, it would be nice to have something like this, but it is much more difficult to get approval [for a roadster] because you will never sell it in high volumes. The Stinger has the potential to sell in signifi-cant numbers. ANE
Meet the design boss❚ NAME: Peter Schreyer
❚ TITLE: Hyundai Motor Group President and Chief Design Officer
❚ AGE: 63
❚ MAIN CHALLENGE: Differentiat-ing the styling of Hyundai, Kia and Genesis brands.

15
AUTOMOTIVE NEWS EUROPE COVER STORY
www.autonewseurope.com MARCH 2017
Your Latest Features on Full Display
It can stream rear video to optimize the rearward view. Run home automation scenes
with the push of a button. Display ADAS alerts in the ideal, heads-up location.
Automatically pay tolls and facilitate transactions.
The Full Display Mirror®. It’s not just high-tech, it’s Gentex. www.gentex.com/fdm
HomeLink® car-to-home automation
Mirror-integrated LCD display
LCD adjustment controls
ADAS alerts and driver information
Integrated toll payment module

16
AUTOMOTIVE NEWS EUROPE AUTOMAKERS
www.autonewseurope.com MARCH 2017
Finding the right fitHow Opel/Vauxhall and PSA are already successfully cooperating
CHRISTIAAN [email protected]
The new Crossland X, which Opel/Vauxhall is taking on tour around Eu-
rope this month, shares many character-istics found in the brand’s other cars. The so-called “floating roof” comes from the Adam, ergonomic seats are also found in the Insignia and the OnStar concierge service derives from parent General Mo-tors. Engineers claim the crossover drives like a German car too, meaning it is stable in the curves without sacrificing comfort.
Underneath, however, the mechanical innards are all French. To save costs, essentially every part in the Cross-land X that the customer doesn’t see is shared with the new Citroen C3 Air-cross. Not even the 1.6-liter diesels come from Opel.
If it’s up to GM CEO Mary Barra, the Crossland X will mark a new beginning for Opel and Vauxhall – one without GM. The U.S. carmaker looks to extricate itself from Europe by offloading its two brands onto Citroen’s parent, the PSA Group. Im-mediately following the announcement that in 2016 it took a $257 million loss at Opel/Vauxhall, this time on the back of Brexit-related currency headwinds, Barra voiced her frustration at yet an-
other breakeven target GM’s European arm failed to achieve. Despite nearly two decades of restructuring programs, cut-backs and plant closures, Opel/Vauxhall remained mired in red ink. Meanwhile once-struggling rivals Ford of Europe and PSA have been able to return to profit.
‘Not satisfied’“We’re not satisfied with these results and the team is focused on mitigating the effects,” Barra told investors last month, just days before it was revealed she and GM were in advanced talks with Opel’s platform provider over a sale to the French parent. PSA Group CEO Car-los Tavares says the Crossland X is the blueprint for how the two companies can successfully work together, which he says they have been doing without any problems for four years. He believes those benefits would only expand from closer cooperation, something the two companies have been discussing since last November.
Tavares is confident PSA can make a dif-ference. “We think we could help Opel because three years ago PSA was in a similar position,” the CEO said. “Opel is ready to listen to us.”
Another key factor pushing Opel toward
PSA is that Europe’s car market is ex-pected to stagnate this year on the back of a forecast decline for UK sales due to uncertainty about the country’s exit from the EU, ensuring further losses for Opel this year. In addition, major elections are being held across the EU that could de-termine the fate of the single currency, especially if Marine Le Pen, who has said she would hold a referendum on whether to abandon the euro, is elected French President in May. An expected sales re-bound in Russia this year also won’t help because Opel pulled out of the market in 2015 to prevent further losses.
Forecaster IHS Markit highlighted late last month the harsh reality, saying the industry risk in mature markets is at the highest level it has been since the Lehm-an Brothers collapse in 2008, which helped spark the global economic crisis. “Political uncertainty could cause a sig-nificant rift in light vehicle sales both in the U.S. and Europe, as both regions are undergoing fluctuations in policy, leader-ship and other dynamics,” said Henner Lehne, senior director, global vehicle group for IHS Markit.
Under that scenario, perhaps it is wise for GM not to have Opel and Vauxhall, although the automaker balked at the chance to discard the brands eight years
Illus
trat
ion:
Aut
omot
ive
New
s Eu
rope
/iSt
ockp
hoto

17
AUTOMOTIVE NEWS EUROPE AUTOMAKERS
www.autonewseurope.comMARCH 2017
ago because management wanted to maintain a presence in Europe. When the U.S. automaker found itself insol-vent in 2009 and unable to fund Opel, the subsidiary was put up for sale at the insistence of the German govern-ment. Once GM emerged financially strengthened from its pre-packaged bankruptcy, however, it called off the disposal. The uncertainty over Opel/Vauxhall’s future, however, left a per-manent mark on the business.
Positive signalsWhen Opel CEO Karl-Thomas Neumann joined in March 2013, the year European new-car sales hit bottom, the GM sub-sidiary had just postponed yet another breakeven target after losses soared to $1.9 billion in the previous year. With Neumann in charge, GM agreed to fund 4 billion euros worth of investments through 2016. It even held its first board of directors meeting in Opel’s German headquarters to demonstrate the par-ent’s steadfast commitment.
In return Neumann pledged that by 2022 Opel/Vauxhall would deliver an 8 percent European market share and an operating margin of 5 percent. The first test of that goal was attaining profitability last year. While Opel failed, it was a lot closer to making money than it had been in nearly two decades. Since Neumann joined four years ago, Opel managed to halt a market share slide it had suffered since Europe-an car sales peaked in 2007.
Key new models such as the Astra were winning important prizes, sales were slowly growing, and Opel’s once-disas-trous image in Germany was on the mend, helped by ads that took advantage of Opel’s underdog status.
Turning around a chronic money-loser such as Opel/Vauxhall is no small feat. Whether it is Fritz Henderson, Carl-Pe-ter Forster, Nick Reilly, Karl-Friedrich Stracke, Steve Girsky or Neumann – the list of executives that had their shot at making GM’s European operations prof-itable is long. And all ultimately failed.
Said Tavares: “I have a high respect for the work that Neumann and his team did at Opel, but you cannot continue to lose money for more than a decade and
burn 1 billion euros in cash each year.” He added that he doesn’t think you can plan the future if you do not manage to deliver results in the short term.
Model offensiveAs talks continue about Opel/Vauxhall’s future without GM the company has start-ed the biggest model offensive in its his-tory, with seven launches this year that are expected to help it become Europe’s second-largest automaker by sales next year, according to an IHS forecast (see chart, left). The new models include the revamped Insignia sedan as well as the Ampera-e, a purpose-built full-electric car with a certified range of more than 500 km. Largely based on the Chevrolet Bolt, the Ampera-e beats Volkswagen brand’s ID electric car to market by three years. At press time, Neumann was re-portedly mapping out the transformation of Opel into an electric car brand. Perhaps that is why the otherwise Twitter-friendly CEO only could muster a tepid endorse-ment for the deal on social media: “In principle, an affiliation with PSA makes sense,” he tweeted, even though he nev-er once supported deeper ties with the French carmaker in the past when asked.
Despite Neumann’s possible reserva-tions about the deal, Tavares believes the combined entity could sell 5 million units a year in the midterm and reach a profitability level close to PSA’s cur-rent target, which is a 6 percent margin. “There is an opportunity to create a Eu-ropean car champion resulting from the combination of a French company and a German company with a strong UK brand,” he said.
-- Luca Ciferri and Peter Sigal contributed
Race for second placeOpel/Vauxhall is expected to rise to No. 2 in European sales next year but slide into 4th place behind the Renault and Ford brands by 2021
Source: IHS Automotive
5002017 2018 2019 2020 2021
1,000
1,500
2,000
The Opel/Vauxhall Crossland X shares its platform with the Citroen C3 Air-cross. The small crossover, which is made at Opel’s plant in Zaragoza, Spain, is one of seven new models Opel will launch in 2017.
Volkswagen
FordRenaultOpel
in ’000s

18
AUTOMOTIVE NEWS EUROPE AUTOMAKERS
www.autonewseurope.com MARCH 2017
Holding its groundRenault faces tough task staying Europe’s No. 2 brand as product push slows
PETER [email protected]
Over the past two years, Renault has overtaken Ford and Opel to become
the second-largest brand in Europe by unit sales, riding the momentum from a wave of stylish new models, especially in the hot crossover segment. But ana-lysts say that success will be harder to maintain in 2017 as growth in the overall European market slows and the product pipeline empties out. The European auto market is widely expected to increase by only about 2 percent in 2017, compared with 6.5 percent last year.
“It’s probably easier to have strong growth when the market is growing it-self,” said Alexis Albert, a Paris-based analyst on the automotive sector at Bar-clays. “The market will be less support-ive than it was in 2016.”
Ian Fletcher, a principal analyst at IHS Automotive, said: “I don’t think it’s nec-essarily going to be an easy time for them, but given the foundations that have been put in place now going to-ward the next decade, they are looking reasonably positive.”
IHS forecasts that Renault will finish as Europe’s second-largest brand again in 2017 with a volume of 1.17 million, fol-lowed by Ford (1.04 million) and Opel/Vauxhall (997,650).
Last year Renault sold a company-re-cord 1,100,880 vehicles in Europe, a 13 percent gain over 2015, according to industry association ACEA. That left it behind No. 1 Volkswagen brand’s 1.72 million sales but ahead of Ford and Opel/Vauxhall. Renault’s rise last year followed an 11 percent increase in 2015 and a 9 percent increase in 2014.
Last month Renault also reported a 38 percent surge in operating profit to 3.28 billion euros in 2016 on 51.2 billion euros in revenue. That helped Renault increase its profit margin to 6.4 percent from 5.2 percent in 2015, meeting a key target one year early. The success caused Renault to set new goals, includ-ing a 7 percent operating margin and 70 billion euros in revenue by 2022.
No blockbusters in ’17While Renault will continue to benefit in its home region from recently launched products such as the new Scenic, which is one of Europe’s top-selling minivans, there are no “blockbuster” new models planned for 2017, Albert said. He added that the downside to introducing so many models in a short time span is that it can overwhelm the sales force, which then fo-cuses on selling the vehicles that are easi-est to move, such as the Kadjar compact crossover. Similarly, he said, “once you get your sales force and customers used to so many new cars, it becomes more difficult to sustain that kind of growth rate.”
In addition, Renault’s closest competi-tors are keeping up the pressure. Prod-ucts such as the Opel/Vauxhall Grand-land X and Crossland X crossovers, which are built under a 4-year-old joint development deal between the General Motors subsidiary and PSA Group, are scheduled to reach the market starting this year. Ford, which posted a record $1.2 billion profit in Europe in 2016, will also continue to make a strong push in SUVs, said Dominic O’Brien, an analyst at Exane BNP Paribas in London. “The competition’s not going to get any eas-
ier,” O’Brien said. “You could probably imagine that this will be an incrementally more competitive year [for Renault].”
Brexit & diesel probeThat could be complicated somewhat by geopolitical events, including close-ly watched presidential elections in France, the Netherlands and Germany, and the effects of Britain’s exit from the European Union. And in the wake of the Volkswagen Group’s emissions-cheating scandal, combined with increased pres-sure from France and other European countries to further reduce emissions, the region’s consumers are starting to turn away from diesel engines. Renault is vulnerable to the trend, as about 54 per-cent of the company’s sales in France, and 51 percent in Europe, are diesel powered, a spokeswoman said. Renault has also come under scrutiny by French authorities, who have opened an investi-gation into suspected cheating on emis-sions testing. The company has denied any wrongdoing, and analysts urged cau-tion about the matter. “We don’t know the full details, let alone which way this is going to come out,” O’Brien said. “We have no reason to believe this is on the same scale as Volkswagen.” ANE
Helped by the Clio, Europe’s best-selling subcompact, Renault raced past Ford to No. 2 in sales behind the VW brand.

19
AUTOMOTIVE NEWS EUROPE COVER STORY
www.autonewseurope.com MARCH 2017
We’re moving millions – increasingly clean and efficient.
borgwarner.com
There is no more important technological challenge for the automotive industry today than the commitment of building more eco-friendly vehicles. Therefore, improving fuel economy and reducing emissions are the main objectives within our technology development of combustion engines. Whether new combustion processes, automatic start-stop systems or increasingly strict emissions requirements – we have innovative solutions ready for every technological challenge.

20
AUTOMOTIVE NEWS EUROPE AUTOMAKERS
www.autonewseurope.com MARCH 2017
Show starsFast cars in spotlight at Geneva
Citroen Citroen will compete in the hot-selling subcompact SUV/crossover segment with the C-Aircross, which is based on the new C3 hatchback. The concept previews the produc-tion car that will replace the C3 Picasso small minivan. The production C-Aircross will be built in Opel’s plant in Zaragoza, Spain, alongside its siblings, the Opel/Vauxhall Crossland X and a Peugeot version.
DS Automobiles DS Automobiles will unveil a new flagship, the DS 7 Cross-back. The compact crossover is expected to go on sale in Europe later this year as a rival to German premium models. It shares its EMP2 platform with the Peugeot 3008 and up-coming Opel/Vauxhall Grandland X. The DS 7 Crossback is also likely to have all-wheel-drive and plug-in hybrid versions.
Ferrari Ferrari’s 812 Superfast will be the brand’s most powerful se-ries production car to date. Its naturally aspirated 6.5-liter V-12 engine makes 798 hp and pushes the car to a top speed of 340 kph (211 mph) with acceleration from 0 to 100 kph (62 mph) in 2.9 seconds. It’s the first Ferrari to have electric power steering.
Ford The new Fiesta will get advanced safety features such as adap-tive cruise control and lane-keeping assist that are not yet common in subcompacts. The upscale equipment will help the Fiesta meet demand for advanced technology from custom-ers downsizing from larger models and will help distance the car from the new Ka Plus subcompact, which targets budget customers in Europe.
Hyundai Hyundai will debut the new i30 compact wagon. The wagon’s trunk capacity has grown to be among the biggest in the seg-ment at 602 liters, with space rising to 1,650 liters when the rear seats are folded flat. The car gets advanced active safety equipment already on the new i30 hatchback such as autono-mous emergency braking, smart cruise control and driver at-tention alert.
This year’s Geneva auto show will highlight a mix of super-cars, SUVs and mainstream models. PSA’s DS brand and
Land Rover’s Range Rover will show new SUVs aimed at buy-ers in a hot segment looking for luxury. Citroen’s C-Aircross concept previews the brand’s new entry in the subcompact crossover segment, while Porsche and Hyundai target practi-cal buyers with new wagons. Among the supercar highlights will be Ferrari’s most powerful series production model to date and Chinese-backed Techrules’ Tesla Model S fighter styled by Giorgetto Giugiaro.
Here are some key debuts:
Citroen C-Aircross concept
Ferrari 812 Superfast
DS 7 Crossback
Ford Fiesta Hyundai i30 wagon

21
AUTOMOTIVE NEWS EUROPE AUTOMAKERS
www.autonewseurope.comMARCH 2017
Italdesign Italdesign, Audi’s design and engineering subsidiary, will unveil the Zerouno supercar priced at 1.5 million euros ($1.6 mil-lion) plus taxes. The company’s new bespoke division, Italde-sign Automobili, intends to build five examples of the two-seat carbon-fiber car. It has a 5.2-liter V-10 engine also used in top-end versions of the Audi R8 and can accelerate from 0 to 100 kph (62 mph) in 3.2 seconds.
Kia Kia hopes customer loyalty, along with new connectivity and safety features, will help lift sales of the Picanto in the price-sensitive minicar segment. Picanto buyers are “extremely loy-al” to the brand compared with customers for other Kia cars and the market as a whole, Kia Europe Chief Operating Officer Michael Cole said. Kia is discontinuing the three-door version due to slowing demand.
Opel/Vauxhall Opel hopes the new Insignia’s advanced technology, ride com-fort and sleek design will help to stem the loss of midsize seg-ment customers to premium rivals such as the BMW 3 series. The sedan gets a new name, the Insignia Grand Sport. Opel says the car’s optional torque vectoring all-wheel-drive system that improves grip and handling is a segment first. The Insignia Grand Tourer wagon will also debut.
PorscheThe Panamera Sport Turismo, Porsche’s first wagon, will com-pete with the Mercedes-Benz CLS Shooting Brake to appeal to customers looking for luxury, a sporty drive and practicality. Porsche sees Europe as the main market for the wagon, which is based on the latest Panamera four-door variant, but it will also sell the car in the U.S. and China, where wagons are less popular.
Land Rover Land Rover will expand its Range Rover lineup with the Velar, a sporty SUV that will be a rival to the Porsche Macan. The Velar will be positioned between the entry-level Range Rover Evoque and the more expensive Range Rover Sport. The Velar is the first Land Rover to use Jaguar Land Rover’s D7A all-wheel/rear-wheel-drive platform that underpins the XE midsize sedan and F-Pace SUV sold by sister brand Jaguar.
Techrules Chinese startup Techrules’ supercar was styled by the Ital-ian father-son design team of Gior-getto and Fabrizio Giugiaro. The car has an aircraft-inspired three-seat cockpit design. It’s the production version of the 1,030-hp GT96 concept unveiled in Geneva last year. The car will be powered by a hybrid powertrain that uses a micro-turbine to generate electricity to charge a battery pack.
More on the WebPlease visit Automotive News Europe’s stand-alone Geneva auto show Web page for the latest news and photos at:
autonewseurope.com/geneva
stand-alone Geneva auto show Web page
Opel Insignia Grand Sport
Seat Ibiza
Range Rover Velar
PorschePanamera
KiaPicanto
Italdesign Zerouno
Techrules concept
sporty SUV that will be a rival to the Porsche Macan. The Velar will be positioned between the entry-level Range Rover Evoque and the more expensive Range Rover Sport. The Velar is the first Land Rover to use Jaguar Land Rover’s D7A all-wheel/rear-wheel-drive platform that underpins the XE midsize sedan and F-Pace SUV sold by sister brand Jaguar.
Techrules Chinese startup Techrules’ supercar was styled by the Ital-ian father-son design team of Gior-getto and Fabrizio Giugiaro. The car has an aircraft-inspired three-seat cockpit design. It’s the production version of the 1,030-hp GT96 concept unveiled in Geneva last year. The car will be powered by a hybrid powertrain that uses a micro-turbine to generate electricity to charge a battery pack.
Techrules concept
is based on the latest Panamera four-door variant, but it will also sell the car in the U.S. and China, where wagons are less popular.
Seat Ibiza
due to slowing demand.
PorscheThe Panamera Sport Turismo, Porsche’s first wagon, will com-
Land Rover Land Rover will expand its Range Rover lineup with the Velar, a
Range Rover Velar
PorschePanamera
for the latest news and photos at:
autonewseurope.com/geneva
Opel Insignia Grand Sport
Seat Seat’s latest Ibiza is the first Volkswagen Group model to use the MQB A0 architecture for smaller cars that will also under-pin the new VW Polo. The platform has enabled Seat to im-prove the car’s driving dynamics, ride quality and driving com-fort. Safety technology will include adaptive cruise control and traffic jam assist, which can accelerate and decelerate the car in traffic congestion.

22
AUTOMOTIVE NEWS EUROPE AUTOMAKERS
www.autonewseurope.com MARCH 2017
Gaining groundFull-hybrid, plug-in hybrid sales rise fast but new tech could shake up sector
NICK [email protected]
Hybrid and plug-in hybrid sales grew an impressive 30 percent to just
over 400,000 in Europe last year, but the real impact in the midterm will be made by mild hybrids, analysts predict. By 2025 mild hybrids will capture 18 per-cent of the European market, IHS Auto-motive forecasts. That’s compared with 6 percent for plug-in hybrids, 3 percent for full hybrids and 3 percent for full-elec-tric vehicles in the same time frame.
Currently, the big growth is in full hybrids, largely because of Toyota’s increasing success in Europe. Expanding a technol-ogy that is enormously successful in its home market of Japan, the automaker last year launched hybrid versions of the RAV4 and CH-R compact SUVs, which joined gasoline-electric versions of the Auris compact and Yaris subcompact hatchbacks already on sale in Europe.
Last year Toyota sold 232,699 hybrids across Europe, a rise of 47 percent from the year before, according to data from market researchers JATO Dynamics. Of those, 41,814 were the new RAV4 hybrid, putting it third behind the Yaris and Auris hybrid models. Lexus was the next biggest hybrid brand with sales of 41,372.
Apart from minicars, Toyota is commit-ted to offering hybrid variants through-out its entire range, Toyota Europe CEO Johan van Zyl told Automotive News Europe last summer. The automaker wants hybrids to account for half of its total European sales by 2020, up from 31 percent at the time of interview. Van Zyl said he expected 70 percent of C-HR sales to be hybrid. The car is not available with a diesel engine. Now that Peugeot is winding down its diesel hybrid program, Toyota’s rivals for hybrid sales in Europe are limited to Kia and Hyundai, which last year launched the Niro and Ioniq compacts, respectively. The Ioniq is also available as an EV.
Plug-in hybrids expandHyundai and Kia will add plug-in hybrid ver-sions of both cars later this year, further ex-panding a market that now offers far more choice to consumers than either the full
hybrid or EV segments. Plug-in hybrid sales in Europe rose by 19 percent to 112,300 last year as new models helped drive de-mand. Europe’s best-seller by a wide mar-gin was once again the Mitsubishi Out-lander PHEV, which has been the region’s leader in the fledgling niche since 2014. Demand for the car, however, dropped 33 percent to 21,149 last year as German automakers started to gain share in the sector (see table, above, right).
The Volkswagen Passat GTE rose to sec-ond from seventh in 2015 after sales climbed 176 percent. The Passat GTE also took advantage of a 37 percent drop for the former No. 2 in the sector, the GTE
version of the VW Golf, which fell to third. Also seeing strong growth in the segment were the Mercedes-Benz C 350 e, Volvo XC90 T8 Twin Engine, BMW 330e and BMW 225xe Active Tourer.
Sales of plug-in hybrids in Europe have already overtaken those of full-electric vehicles and will continue to grow more strongly than EVs in the near term, IHS Automotive powertrain analyst Vijay Subramanian believes. But he warns the growth is precarious.
The Mitsubishi Outlander remained Europe’s No. 1-selling plug-in hybrid in 2016 despite a 33% decline in sales.
Mixed results European sales of all electrically as-sisted cars in 2016; change from 2015
Full hybrids 294,800 +37%Plug-in hybrids 112,300 +19%Electric vehicles 89,500 +4.8%Extended-range EVs 6,900 -4.1%Fuel-cell cars 108 -2.7%
Source: JATO Dynamics
The leaders Europe’s top-selling plug-in hybrids
1. Mitsubishi Outlander 21,149 -33% 2. VW Passat GTE 13,327 176% 3. VW Golf GTE 11,104 -37% 4. Mercedes C 350 e 10,056 73% 5. Volvo XC90 T8 9,777 236% 6. BMW 330 e 8,708 new 7. Audi A3 e-tron 6,589 -46% 8. BMW 225xe 6,047 new 9. BMW X5 xDrive 40e 5,664 202%10. Audi Q7 e-tron 3,732 new
Source: JATO Dynamics

23
AUTOMOTIVE NEWS EUROPE AUTOMAKERS
www.autonewseurope.comMARCH 2017
Changing incentivesThe Netherlands was by far the biggest European market for plug-in hybrids in 2015, but last year the country slipped below the UK and Norway after sales halved. The collapse was because the government withdrew generous incen-tives for company car drivers on discov-ering from fuel-card data that drivers weren’t plugging them in. Instead of re-ducing CO2 levels, the incentives were in danger of increasing them.
Incentives are important because plug-in hybrids are more expensive than con-ventional models. In the UK, the largest market in Europe for both conventional and plug-in hybrids, the new Toyota Prius plug-in hybrid starts at 34,895 pounds [40,800 euros] before a 2,500-pound government incentive is applied. The Prius hybrid starts at 24,100 pounds.
Despite the high purchase price, plug-in hybrids are popular in the UK and
other markets because the current EU-wide NEDC fuel-economy testing cycle is very generous to plug-in models. The low CO2 figure it generates for plug-in hybrids make them eligible for attrac-tive tax incentives. Those perks could be reduced if the forthcoming real-driv-ing emissions (RDE) element of the re-vamped fuel economy test records more realistic figures.
“The dramatic fall in PHEV [plug-in hybrid electric vehicle] demand in the Nether-lands confirms how dependent they are on incentives,” JATO analyst Felipe Mu-noz said. “The only real advantage they have is the incentive they can get.”
Automakers are responding by accen-tuating the other positives of plug-in hy-brid models, such as performance.
“It has this additional boost that comes on top of the gasoline propulsion that really gives you an edge. It’s fantastic,” BMW’s board member responsible for
the Mini brand, Peter Schwarzenbauer, said about the new Mini Countryman plug-in hybrid, the brand’s first. The car uses a version of the drivetrain found on the BMW 225xe Active Tourer.
Even so, Schwarzenbauer admits that adding the variant to the Countryman’s portfolio is a gamble. “We have studied all plug-in hybrids and cannot see a clear trend. In some markets it’s booming, other markets it’s zero,” he told Auto-motive News Europe at the Los Angeles auto show last November.
Rival technology Automakers and suppliers are clearer on the advantages of cheaper mild hybrids. In the first phase of the technology, a small 48-volt electric motor connects to the crankshaft to provide a low-cost power boost from a battery topped up with energy recovered during braking and deceleration.
The Suzuki Baleno and Ignis SVHS (Smart Hybrid Vehicle by Suzuki) were the first vehicles to offer a 48-volt mild hybrid in Europe, but Renault is about to make an even bigger splash with the imminent arrival of its first model with the technology, the Scenic Hybrid As-sist. Renault will extend the technology from its popular minivan to the Megane compact model line later this year. The vehicles will use a 48-volt system from supplier Continental, which pre-dicts the number of cars using these lower voltage hybrid drives will reach 4 million worldwide by 2020, rising to 25 million by 2025.
Renault will use them on diesel mod-els initially, but ultimately the technol-ogy will be applied to gasoline-powered cars to help reduce European auto-makers’ dependence on diesels. VW believes the technology will remove the need for the smaller 1.6-liter diesel engine altogether. “In a time not so far away, people will go for petrol engines in combination with a mild hybrid,” Volkswagen’s head of research and de-velopment, Frank Welsch, told the UK’s Autocar magazine in February.
The technology is cheap enough to be-come mainstream, Continental’s board member for its powertrain division, Jose Avila, told Automotive News Europe. “Typically a manufacturer says that an acceptable compromise for fuel econo-my versus cost is 50 euros per gram of CO2 savings,” he said. “This technology gets very close to that.” ANE
The VW Passat GTE rose to No. 2 on Europe’s list of top-selling plug-in hybrids last year because of a 176% sales rise.
European sales of plug-in hybrids climbed 19% last year with rising demand for models such as the Mercedes C 350 e.

24
AUTOMOTIVE NEWS EUROPE LATEST LAUNCHES
www.autonewseurope.com MARCH 2017
The Countryman gets more of an SUV look. Its classic Mini grille and headlights are less prominent.
Mini maxes out with CountrymanThe Mini Countryman has grown to
become the BMW subsidiary’s big-gest model to date and it is likely to re-main the marque’s maximum-sized car. “There will not be a larger Mini for the foreseeable future,” said the brand’s boss, Sebastian Mackensen.
The new Countryman is 200mm longer and 30mm wider than the first-gener-ation model and now competes in the compact class, the first Mini to do so. BMW’s board member for Mini, Peter Schwarzenbauer, said the Countryman will stand out against more practical compacts because of its distinctive look. “Mini is a style icon and the Countryman has lots of emotional appeal,” he said.
The Countryman, which first appeared in 2010, had to grow because customers, especially in the U.S. and China, wanted more room as well as additional safety equipment and comfort features.
The Countryman’s bigger size means more units of the model are likely to be sold for use as a sole family car rather than as a second or third car. The new Countryman has significantly more head and shoulder space for the driver and front seat passenger, along with ample room for three passengers in the rear. Its luggage compartment’s volume is 450 liters, 220 liters more than the pre-decessor, and the space can be extend-ed to 1,390 liters, up from 1,170 liters.
The Countryman shares parent BMW Group’s front-wheel/all-wheel drive plat-form with other models such as the BMW X1 and 2-series minivans. The Country-man will be the first Mini to get a plug-in hybrid version, which will have a 40km full-electric driving range when it goes on sale in June. That’s a few months af-ter the launch of the gasoline and diesel versions of the car.
Mini’s global sales increased 12 per-cent last year to a record 338,466 and BMW expects the Countryman to help increase the brand’s volume this year despite political uncertainty in key mar-kets such as the UK and U.S.
– Paul McVeigh
❚ Launch date: February (Europe); March (rest of world)
❚ Base price: 26,500 euros (Germany)
❚ Main rivals: Mercedes GLA, Audi Q2
❚ Where built: Born, Netherlands
❚ Lowest CO2 emissions: 118g/km (diesel); 49g/km (plug-in)
The Basics❚ Technology: Features include cam-era-based active cruise control, colli-sion warning with city braking func-tion, road sign detection. ❚ Connectivity: A personal mobility assistant will calculate the best de-parture time to drive to appointments based on address data and calendar information saved by the driver.
Fast Facts
❚ Novelty feature: A “picnic bench” that folds out of the luggage com-partment and seats two people.

25
AUTOMOTIVE NEWS EUROPE COVER STORY
www.autonewseurope.com MARCH 2017
OPTIMIZE
DES
IGN
CUT
T H E E X P E R T I S E T O D R I V E C H A N G E
You can’t deliver extraordinary products if you don’t excel atordinary operations. From design through product development to manufacturing, Lectra’s professional services and innovative technology optimize your manufacturing process for fabric and leather car interiors, as well as airbags. We ensure that you can sustain your performance and have the flexibility to surmount current and future challenges.
Those who demand more, demand Lectra.
TO OPERATIONAL EXCELLENCE.
ON THE ROAD
STAY ONE STEP AHEAD
Get more at demandmore.lectra.com
26
AUTOMOTIVE NEWS EUROPE LATEST LAUNCHES
www.autonewseurope.com MARCH 2017
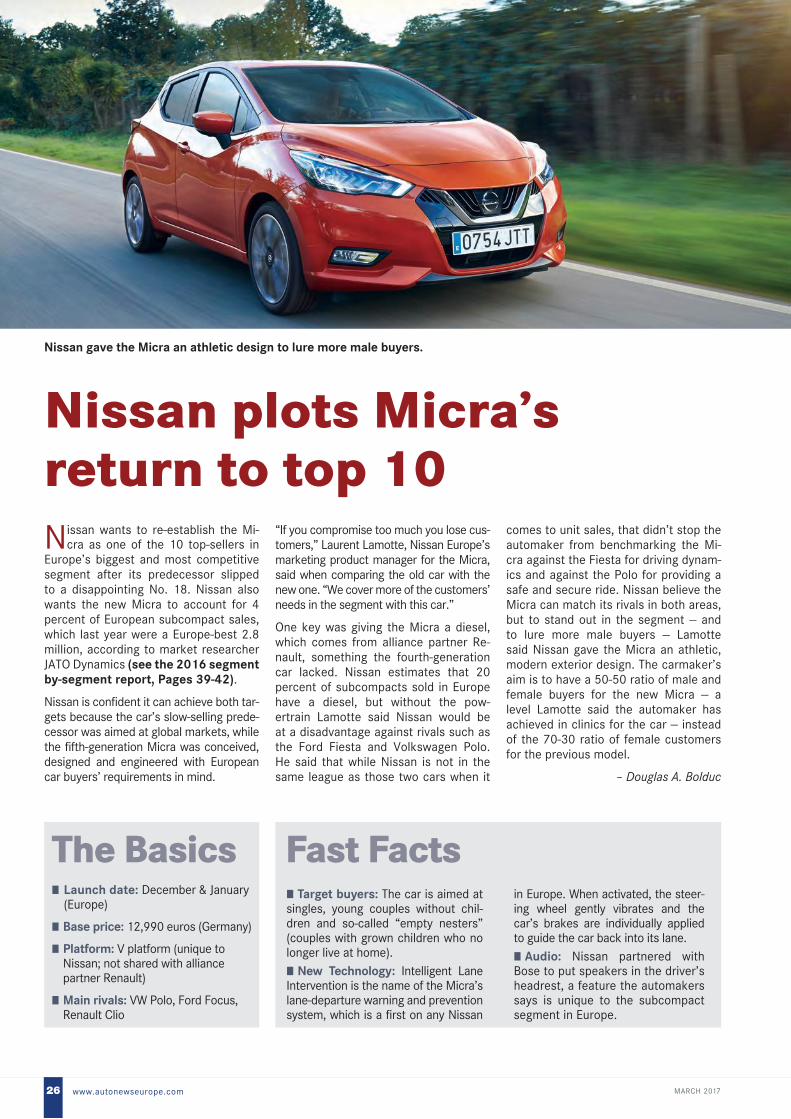
Nissan gave the Micra an athletic design to lure more male buyers.
Nissan plots Micra’s return to top 10Nissan wants to re-establish the Mi-
cra as one of the 10 top-sellers in Europe’s biggest and most competitive segment after its predecessor slipped to a disappointing No. 18. Nissan also wants the new Micra to account for 4 percent of European subcompact sales, which last year were a Europe-best 2.8 million, according to market researcher JATO Dynamics (see the 2016 segment by-segment report, Pages 39-42).
Nissan is confident it can achieve both tar-gets because the car’s slow-selling prede-cessor was aimed at global markets, while the fifth-generation Micra was conceived, designed and engineered with European car buyers’ requirements in mind.
“If you compromise too much you lose cus-tomers,” Laurent Lamotte, Nissan Europe’s marketing product manager for the Micra, said when comparing the old car with the new one. “We cover more of the customers’ needs in the segment with this car.”
One key was giving the Micra a diesel, which comes from alliance partner Re-nault, something the fourth-generation car lacked. Nissan estimates that 20 percent of subcompacts sold in Europe have a diesel, but without the pow-ertrain Lamotte said Nissan would be at a disadvantage against rivals such as the Ford Fiesta and Volkswagen Polo. He said that while Nissan is not in the same league as those two cars when it
comes to unit sales, that didn’t stop the automaker from benchmarking the Mi-cra against the Fiesta for driving dynam-ics and against the Polo for providing a safe and secure ride. Nissan believe the Micra can match its rivals in both areas, but to stand out in the segment -- and to lure more male buyers -- Lamotte said Nissan gave the Micra an athletic, modern exterior design. The carmaker’s aim is to have a 50-50 ratio of male and female buyers for the new Micra -- a level Lamotte said the automaker has achieved in clinics for the car -- instead of the 70-30 ratio of female customers for the previous model.
– Douglas A. Bolduc
❚ Launch date: December & January (Europe)
❚ Base price: 12,990 euros (Germany)
❚ Platform: V platform (unique to Nissan; not shared with alliance partner Renault)
❚ Main rivals: VW Polo, Ford Focus, Renault Clio
The Basics❚ Target buyers: The car is aimed at singles, young couples without chil-dren and so-called “empty nesters” (couples with grown children who no longer live at home).❚ New Technology: Intelligent Lane Intervention is the name of the Micra’s lane-departure warning and prevention system, which is a first on any Nissan
Fast Factsin Europe. When activated, the steer-ing wheel gently vibrates and the car’s brakes are individually applied to guide the car back into its lane.❚ Audio: Nissan partnered with Bose to put speakers in the driver’s headrest, a feature the automakers says is unique to the subcompact segment in Europe.

27
AUTOMOTIVE NEWS EUROPE SUPPLIERS
www.autonewseurope.comMARCH 2017
Tailored solutionTata Steel looks to expand key product beyond BMW to volume brands
NICK [email protected]
Hurt by rising steel imports from China, Tata Steel in Europe is ag-
gressively pushing its higher-margin tailored blanks business to generate more income. A recent 4-million pound (4.7-million euro) investment at the Indian company’s UK plant has tripled production of tailored blanks, which are primarily used by premium automakers such as BMW Group.
Tata Steel is looking to expand its business with volume automakers by showing them the weight-saving benefits of the technol-ogy. “We’re seeing more and more use among automakers as they look to reduce CO2 levels,” said Lee Coates, head of Tata Steel’s automotive center at its factory in Wolverhampton, central England.
Hampering the sales pitch is the fact that it’s a costly process. Tata Steel ri-val ArcelorMittal, the self-proclaimed world leader in supplying laser-welded blanks, estimates that the cost of a tai-lor-welded door blank can be 30 percent more than the cost of the coil material to make the door. However, overall savings can range from 5 percent to 20 percent once the wider benefits -- less time and effort spent welding and seam-sealing in the body shop -- are factored in.
Laser welding two or more thicknesses of steel together has been around since the 1990s, but the cost is dropping as the technology improves. The newest of Tata Steel’s two laser-welding machines can produce 2,500 pieces an hour. Combined, the two machines can make 2.3 million pieces a year, up from 750,000 in 2014. “What has developed is the speed and ac-curacy of the laser technology,” said Kevin Edgar, Tata’s head of marketing for auto-motive, who added that the company’s first machine functioned at one-tenth of the pace now possible. “There’s a real economy of scale,” Edgar said.
Right now, the plant’s biggest customer for its tailored blanks is BMW Group, which takes about half the output. The end products include the doors for the new Mini and the rear-seat back for the
BMW 5 series and 7 series. The BMW models have five separate thicknesses of steel welded together, the most the plant can combine. The two lines are now running at 90 percent capacity with three shifts during weekdays.
Coates admits that mainstream manu-facturers are proving harder to convince. “If you’ve not worked with laser welding
you might think there’s more of a risk. It’s about education,” Coates said. ArcelorMittal claims a laser-weld seam makes a part stronger rather than creat-ing a weakness.
The benefits to Tata Steel are easy to see. Coates estimates that tailored blanks account for about 7 percent of the automotive output by weight from the firm’s plant but bring in about 20 percent of the factory’s revenue.
Expanding higher-margin sales was a key aim stated in the Indian supplier’s financial report for its 2015-16 financial year, in which it talked about “unlock-ing the potential of steel.” The pressure from cheap Chinese steel imports had become so bad that Tata Steel planned to sell its money-losing UK business last year. That would have had a huge effect on UK automotive manufacturers, which buy a third of their steel from Tata.
But China has also moved into tailor-welded blanks. In 2013, Chinese steel giant Wuhan Iron and Steel Corporation (WISCO) bought German steelmaker ThyssenKrupp’s tailor-welded blank busi-ness for an undisclosed amount. At the time of the deal the firm claimed to have a 40 percent global market share. ANE
Tata Steel estimates that tailored blanks account for just 7% of automotive output by weight at its UK plant but 20% of the factory’s revenue.
What are the benefits of tailor-welded blanks? Tailored blanks are pre-stamped parts with two or more thicknesses of steel laser welded together. Tata Steel says it can join 0.6mm grade steel to 3.0mm grade. This allows au-tomakers to reduce weight where it’s not safety critical but keep strength in the areas where it is. This is be-coming more relevant as automak-ers scrutinize every part to decrease weight as they push to improve fuel economy and cut emissions. In Eu-rope, tailor-welded blanks are largely used in cars, but in the U.S. automak-ers use them to lighten chassis rails on pickup trucks. ANE

28
AUTOMOTIVE NEWS EUROPE SUPPLIERS
www.autonewseurope.com MARCH 2017
Suppliers to the new Land Rover Discovery
ACTIVE GRILLE SHUTTER SYSTEM [UPPER + LOWER]ROECHLINGCOOLANT HOSES [AJ200 ENGINE] CIKAUTXOCOATINGS FOR FASTENERS MAGNI GROUPOIL PUMP CLIP [TIER 2] EFC INTERNATIONALCONRODS AMTEK TEKFORSIDE DOOR HINGESMULTIMATICSEAT STRUCTURESBROSECYLINDER HEADNEMAKIGNITION COILDENSO
FENDER GASKETTEKSPANTANDEM PUMPRHEINMETALLPEDAL CONTROLSMETHODEAUXILIARY RADIATORCALSONIC KANSEISECONDARY BULKHEAD SYSTEM BATZELECTRONICALLY SCANNING RADARDELPHICOOLING FLUID QUICK CONNECTORSARAYMONDEXTERIOR MIRRORSSAMVARDHANA MOTHERSON
REAR FUEL PUMP DRIVE BELT AND TENSIONERDAYCO
ARMREST STRUCTURE MOULDING [TIER 2]COBA PLASTICS
TRANMSISSION OIL PAN MODULE [TIER 2] IBS FILTRAN
AIR SUSPENSION PIPES KONGSBERG
PROP SHAFT DAMPERS VIBRACOUSTIC
BELLHOUSING COVER WOCO
EXHAUST STUD MACLEAN-FOGG
REAR NAMEPLATESRG GLOBAL
AXLE SYSTEM ZF
SUNVISOR TEXTILEGUILFORD
COCKPIT ASSEMBLY DRAEXLMAIER
DOOR FRAME FINISHERDR. SCHNEIDER
FRONT AND REAR BRAKE DISCS BREMBO
ELECTRONIC TORQUE MANAGER GKN
TRANSMISSION OIL PAN MODULE [TIER 2] FILTRAN
TORQUE HINGES [USED IN FLOOR EXTENSION]REELL PRECISION MANUFACTURING
INTELLIGENT SEAT FOLD SENSOR FOR OCCUPANT DETECTION IEE
Suppliers wanted! If you are a supplier and have questions or want your information considered for our cutaway features, contact James Clark at [email protected] or visit www.supplierbusiness.com
Image source: Land Rover
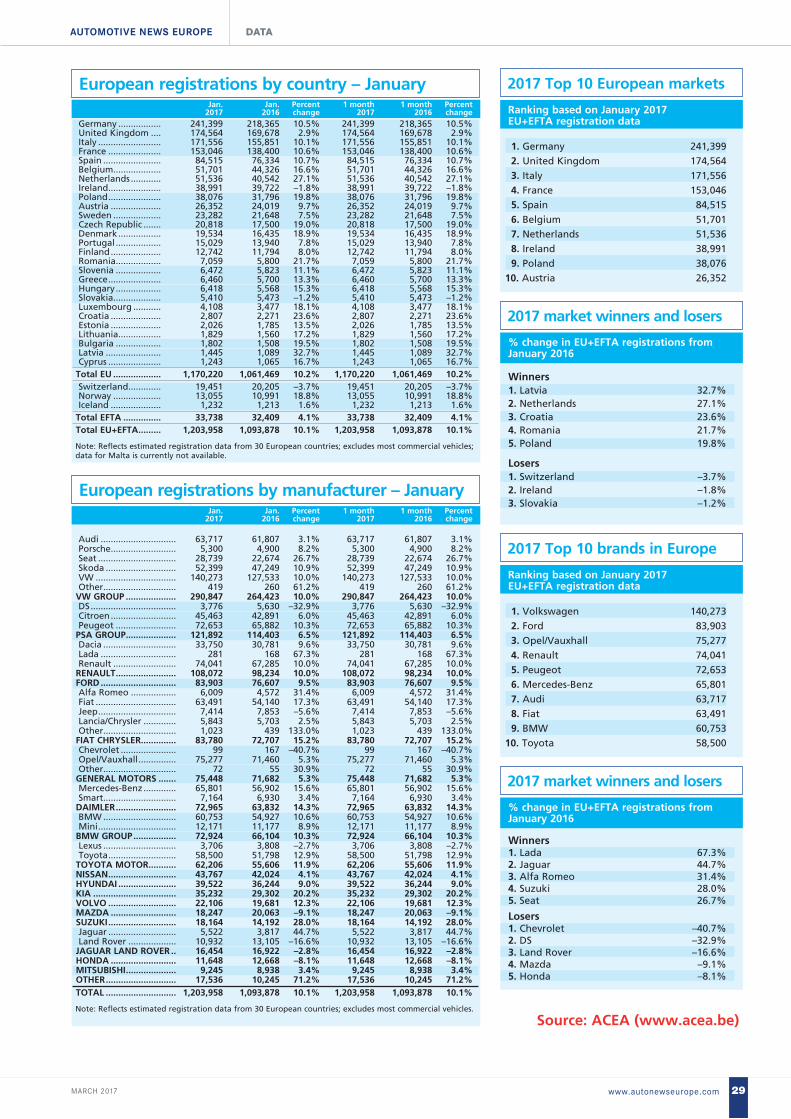
29
AUTOMOTIVE NEWS EUROPE DATA
www.autonewseurope.comMARCH 2017
European registrations by country – January Jan. Jan. Percent 1 month 1 month Percent 2017 2016 change 2017 2016 change Germany ................. 241,399 218,365 10.5% 241,399 218,365 10.5% United Kingdom .... 174,564 169,678 2.9% 174,564 169,678 2.9% Italy ......................... 171,556 155,851 10.1% 171,556 155,851 10.1% France ..................... 153,046 138,400 10.6% 153,046 138,400 10.6% Spain ....................... 84,515 76,334 10.7% 84,515 76,334 10.7% Belgium ................... 51,701 44,326 16.6% 51,701 44,326 16.6% Netherlands ............ 51,536 40,542 27.1% 51,536 40,542 27.1% Ireland ..................... 38,991 39,722 –1.8% 38,991 39,722 –1.8% Poland ..................... 38,076 31,796 19.8% 38,076 31,796 19.8% Austria .................... 26,352 24,019 9.7% 26,352 24,019 9.7% Sweden ................... 23,282 21,648 7.5% 23,282 21,648 7.5% Czech Republic ....... 20,818 17,500 19.0% 20,818 17,500 19.0% Denmark ................. 19,534 16,435 18.9% 19,534 16,435 18.9% Portugal .................. 15,029 13,940 7.8% 15,029 13,940 7.8% Finland .................... 12,742 11,794 8.0% 12,742 11,794 8.0% Romania .................. 7,059 5,800 21.7% 7,059 5,800 21.7% Slovenia .................. 6,472 5,823 11.1% 6,472 5,823 11.1% Greece ..................... 6,460 5,700 13.3% 6,460 5,700 13.3% Hungary .................. 6,418 5,568 15.3% 6,418 5,568 15.3% Slovakia ................... 5,410 5,473 –1.2% 5,410 5,473 –1.2% Luxembourg ........... 4,108 3,477 18.1% 4,108 3,477 18.1% Croatia .................... 2,807 2,271 23.6% 2,807 2,271 23.6% Estonia .................... 2,026 1,785 13.5% 2,026 1,785 13.5% Lithuania ................. 1,829 1,560 17.2% 1,829 1,560 17.2% Bulgaria .................. 1,802 1,508 19.5% 1,802 1,508 19.5% Latvia ...................... 1,445 1,089 32.7% 1,445 1,089 32.7% Cyprus ..................... 1,243 1,065 16.7% 1,243 1,065 16.7% Total EU ................... 1,170,220 1,061,469 10.2% 1,170,220 1,061,469 10.2% Switzerland ............. 19,451 20,205 –3.7% 19,451 20,205 –3.7% Norway ................... 13,055 10,991 18.8% 13,055 10,991 18.8% Iceland .................... 1,232 1,213 1.6% 1,232 1,213 1.6% Total EFTA ............... 33,738 32,409 4.1% 33,738 32,409 4.1% Total EU+EFTA ......... 1,203,958 1,093,878 10.1% 1,203,958 1,093,878 10.1%
Note: Reflects estimated registration data from 30 European countries; excludes most commercial vehicles; data for Malta is currently not available.
Source: ACEA (www.acea.be)
Audi .............................. 63,717 61,807 3.1% 63,717 61,807 3.1% Porsche .......................... 5,300 4,900 8.2% 5,300 4,900 8.2% Seat ............................... 28,739 22,674 26.7% 28,739 22,674 26.7% Skoda ............................ 52,399 47,249 10.9% 52,399 47,249 10.9% VW ................................ 140,273 127,533 10.0% 140,273 127,533 10.0% Other ............................. 419 260 61.2% 419 260 61.2% VW GROUP .................... 290,847 264,423 10.0% 290,847 264,423 10.0% DS .................................. 3,776 5,630 –32.9% 3,776 5,630 –32.9% Citroen .......................... 45,463 42,891 6.0% 45,463 42,891 6.0% Peugeot ........................ 72,653 65,882 10.3% 72,653 65,882 10.3% PSA GROUP .................... 121,892 114,403 6.5% 121,892 114,403 6.5% Dacia ............................. 33,750 30,781 9.6% 33,750 30,781 9.6% Lada .............................. 281 168 67.3% 281 168 67.3% Renault ......................... 74,041 67,285 10.0% 74,041 67,285 10.0% RENAULT ........................ 108,072 98,234 10.0% 108,072 98,234 10.0% FORD .............................. 83,903 76,607 9.5% 83,903 76,607 9.5% Alfa Romeo .................. 6,009 4,572 31.4% 6,009 4,572 31.4% Fiat ................................ 63,491 54,140 17.3% 63,491 54,140 17.3% Jeep ............................... 7,414 7,853 –5.6% 7,414 7,853 –5.6% Lancia/Chrysler ............. 5,843 5,703 2.5% 5,843 5,703 2.5% Other ............................. 1,023 439 133.0% 1,023 439 133.0% FIAT CHRYSLER .............. 83,780 72,707 15.2% 83,780 72,707 15.2% Chevrolet ...................... 99 167 –40.7% 99 167 –40.7% Opel/Vauxhall ............... 75,277 71,460 5.3% 75,277 71,460 5.3% Other ............................. 72 55 30.9% 72 55 30.9% GENERAL MOTORS ....... 75,448 71,682 5.3% 75,448 71,682 5.3% Mercedes-Benz ............. 65,801 56,902 15.6% 65,801 56,902 15.6% Smart ............................. 7,164 6,930 3.4% 7,164 6,930 3.4% DAIMLER ........................ 72,965 63,832 14.3% 72,965 63,832 14.3% BMW ............................. 60,753 54,927 10.6% 60,753 54,927 10.6% Mini ............................... 12,171 11,177 8.9% 12,171 11,177 8.9% BMW GROUP ................. 72,924 66,104 10.3% 72,924 66,104 10.3% Lexus ............................. 3,706 3,808 –2.7% 3,706 3,808 –2.7% Toyota ........................... 58,500 51,798 12.9% 58,500 51,798 12.9% TOYOTA MOTOR ........... 62,206 55,606 11.9% 62,206 55,606 11.9% NISSAN ........................... 43,767 42,024 4.1% 43,767 42,024 4.1% HYUNDAI ....................... 39,522 36,244 9.0% 39,522 36,244 9.0% KIA ................................. 35,232 29,302 20.2% 35,232 29,302 20.2% VOLVO ........................... 22,106 19,681 12.3% 22,106 19,681 12.3% MAZDA .......................... 18,247 20,063 –9.1% 18,247 20,063 –9.1% SUZUKI ........................... 18,164 14,192 28.0% 18,164 14,192 28.0% Jaguar ........................... 5,522 3,817 44.7% 5,522 3,817 44.7% Land Rover ................... 10,932 13,105 –16.6% 10,932 13,105 –16.6% JAGUAR LAND ROVER .. 16,454 16,922 –2.8% 16,454 16,922 –2.8% HONDA .......................... 11,648 12,668 –8.1% 11,648 12,668 –8.1% MITSUBISHI .................... 9,245 8,938 3.4% 9,245 8,938 3.4% OTHER ............................ 17,536 10,245 71.2% 17,536 10,245 71.2% TOTAL ............................ 1,203,958 1,093,878 10.1% 1,203,958 1,093,878 10.1%
Note: Reflects estimated registration data from 30 European countries; excludes most commercial vehicles.
European registrations by manufacturer – January Jan. Jan. Percent 1 month 1 month Percent 2017 2016 change 2017 2016 change
2017 Top 10 European markets
1. Germany 241,399 2. United Kingdom 174,564 3. Italy 171,556 4. France 153,046 5. Spain 84,515 6. Belgium 51,701 7. Netherlands 51,536 8. Ireland 38,991 9. Poland 38,07610. Austria 26,352
Ranking based on January 2017 EU+EFTA registration data
Winners1. Latvia 32.7%2. Netherlands 27.1%3. Croatia 23.6%4. Romania 21.7%5. Poland 19.8%
Losers1. Switzerland –3.7%2. Ireland –1.8%3. Slovakia –1.2%
2017 market winners and losers
% change in EU+EFTA registrations from January 2016
2017 Top 10 brands in Europe
1. Volkswagen 140,273 2. Ford 83,903 3. Opel/Vauxhall 75,277 4. Renault 74,041 5. Peugeot 72,653 6. Mercedes-Benz 65,801 7. Audi 63,717 8. Fiat 63,491 9. BMW 60,75310. Toyota 58,500
Ranking based on January 2017 EU+EFTA registration data
2017 market winners and losers
Winners1. Lada 67.3%2. Jaguar 44.7%3. Alfa Romeo 31.4%4. Suzuki 28.0%5. Seat 26.7%
Losers1. Chevrolet –40.7%2. DS –32.9%3. Land Rover –16.6%4. Mazda –9.1%5. Honda –8.1%
% change in EU+EFTA registrations from January 2016
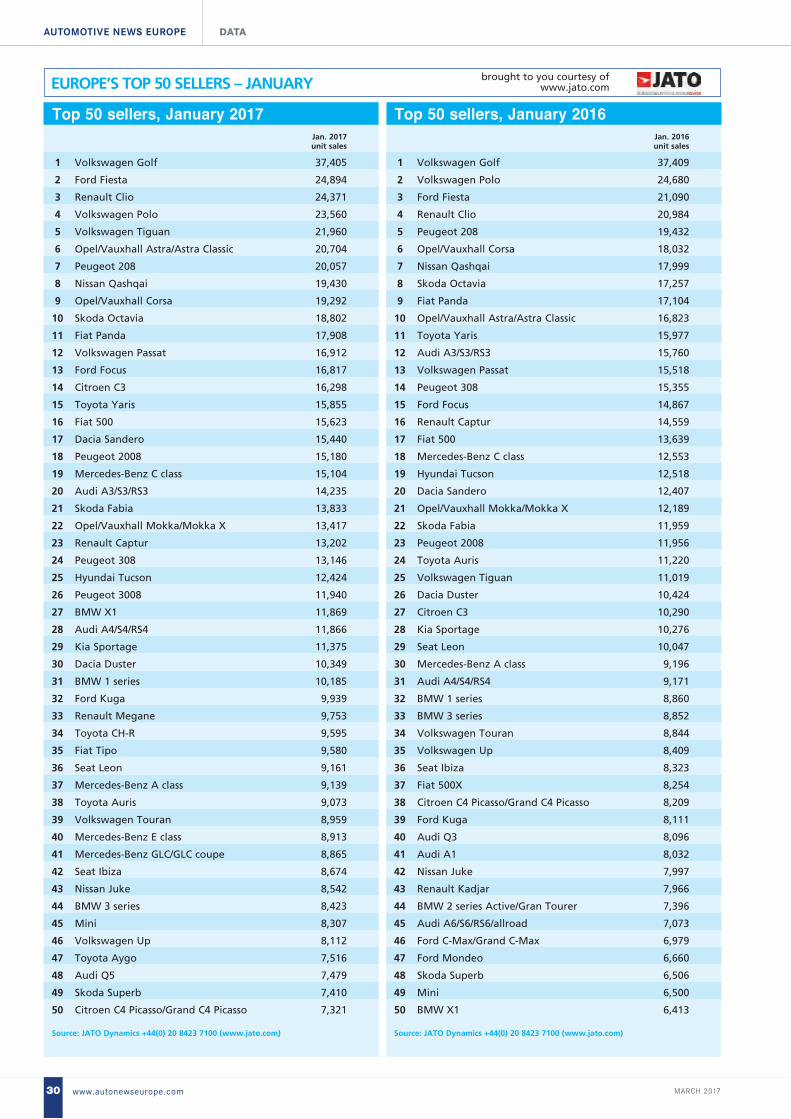
30
AUTOMOTIVE NEWS EUROPE DATA
www.autonewseurope.com MARCH 2017
EUROPE’S TOP 50 SELLERS – JANUARY brought to you courtesy of www.jato.com
Top 50 sellers, January 2017 Jan. 2017 unit sales
1 Volkswagen Golf 37,405
2 Ford Fiesta 24,894
3 Renault Clio 24,371
4 Volkswagen Polo 23,560
5 Volkswagen Tiguan 21,960
6 Opel/Vauxhall Astra/Astra Classic 20,704
7 Peugeot 208 20,057
8 Nissan Qashqai 19,430
9 Opel/Vauxhall Corsa 19,292
10 Skoda Octavia 18,802
11 Fiat Panda 17,908
12 Volkswagen Passat 16,912
13 Ford Focus 16,817
14 Citroen C3 16,298
15 Toyota Yaris 15,855
16 Fiat 500 15,623
17 Dacia Sandero 15,440
18 Peugeot 2008 15,180
19 Mercedes-Benz C class 15,104
20 Audi A3/S3/RS3 14,235
21 Skoda Fabia 13,833
22 Opel/Vauxhall Mokka/Mokka X 13,417
23 Renault Captur 13,202
24 Peugeot 308 13,146
25 Hyundai Tucson 12,424
26 Peugeot 3008 11,940
27 BMW X1 11,869
28 Audi A4/S4/RS4 11,866
29 Kia Sportage 11,375
30 Dacia Duster 10,349
31 BMW 1 series 10,185
32 Ford Kuga 9,939
33 Renault Megane 9,753
34 Toyota CH-R 9,595
35 Fiat Tipo 9,580
36 Seat Leon 9,161
37 Mercedes-Benz A class 9,139
38 Toyota Auris 9,073
39 Volkswagen Touran 8,959
40 Mercedes-Benz E class 8,913
41 Mercedes-Benz GLC/GLC coupe 8,865
42 Seat Ibiza 8,674
43 Nissan Juke 8,542
44 BMW 3 series 8,423
45 Mini 8,307
46 Volkswagen Up 8,112
47 Toyota Aygo 7,516
48 Audi Q5 7,479
49 Skoda Superb 7,410
50 Citroen C4 Picasso/Grand C4 Picasso 7,321
Source: JATO Dynamics +44(0) 20 8423 7100 (www.jato.com)
Top 50 sellers, January 2016 Jan. 2016 unit sales
1 Volkswagen Golf 37,409
2 Volkswagen Polo 24,680
3 Ford Fiesta 21,090
4 Renault Clio 20,984
5 Peugeot 208 19,432
6 Opel/Vauxhall Corsa 18,032
7 Nissan Qashqai 17,999
8 Skoda Octavia 17,257
9 Fiat Panda 17,104
10 Opel/Vauxhall Astra/Astra Classic 16,823
11 Toyota Yaris 15,977
12 Audi A3/S3/RS3 15,760
13 Volkswagen Passat 15,518
14 Peugeot 308 15,355
15 Ford Focus 14,867
16 Renault Captur 14,559
17 Fiat 500 13,639
18 Mercedes-Benz C class 12,553
19 Hyundai Tucson 12,518
20 Dacia Sandero 12,407
21 Opel/Vauxhall Mokka/Mokka X 12,189
22 Skoda Fabia 11,959
23 Peugeot 2008 11,956
24 Toyota Auris 11,220
25 Volkswagen Tiguan 11,019
26 Dacia Duster 10,424
27 Citroen C3 10,290
28 Kia Sportage 10,276
29 Seat Leon 10,047
30 Mercedes-Benz A class 9,196
31 Audi A4/S4/RS4 9,171
32 BMW 1 series 8,860
33 BMW 3 series 8,852
34 Volkswagen Touran 8,844
35 Volkswagen Up 8,409
36 Seat Ibiza 8,323
37 Fiat 500X 8,254
38 Citroen C4 Picasso/Grand C4 Picasso 8,209
39 Ford Kuga 8,111
40 Audi Q3 8,096
41 Audi A1 8,032
42 Nissan Juke 7,997
43 Renault Kadjar 7,966
44 BMW 2 series Active/Gran Tourer 7,396
45 Audi A6/S6/RS6/allroad 7,073
46 Ford C-Max/Grand C-Max 6,979
47 Ford Mondeo 6,660
48 Skoda Superb 6,506
49 Mini 6,500
50 BMW X1 6,413
Source: JATO Dynamics +44(0) 20 8423 7100 (www.jato.com)

31
AUTOMOTIVE NEWS EUROPE DATA
www.autonewseurope.comMARCH 2017
EUROPE’s TOP 10 SELLERS IN 27 KEY MARKETS brought to you courtesy of
www.jato.com
1 Volkswagen Golf 1,392 990 41% 2 Volkswagen Tiguan 973 332 193% 3 Skoda Octavia 672 836 –20% 4 Volkswagen Polo 625 611 2% 5 Skoda Fabia 597 519 15% 6 Volkswagen Transporter 596 387 54% 7 Renault Clio 563 481 17% 8 Opel Astra/Astra Classic 487 346 41% 9 Seat Leon 463 323 43% 10 Seat Ateca 408 0 –
Jan. Jan. Jan. %rank 2017 2016 chng.
Au
stri
a
1 Opel Corsa 1,399 855 64% 2 Renault Clio 1,186 930 28% 3 BMW X1 1,083 403 169% 4 Hyundai Tucson 1,030 798 29% 5 Skoda Octavia 894 733 22% 6 Peugeot 2008 887 692 28% 7 Peugeot 208 794 628 26% 8 Mercedes-Benz C class 782 699 12% 9 Citroen C3 775 428 81% 10 BMW 1 series 745 446 67%
Jan. Jan. Jan. %rank 2017 2016 chng.
Bel
giu
m
1 Nissan Qashqai 68 65 5% 2 Toyota Yaris 55 48 15% 3 Ford Fiesta 54 49 10% 4 Ford Focus 31 12 158% 5 Volkswagen Golf 31 22 41% 6 Nissan Juke 31 17 82% 7 Kia Sportage 30 31 –3% 8 Nissan X-Trail 28 9 211% 9 Suzuki Vitara/G. Vitara/XL-7 27 27 0% 10 Volvo XC60 26 22 18% 10 Honda HR-V 26 13 100%
Jan. Jan. Jan. %rank 2017 2016 chng.
Cyp
rus
1 Skoda Octavia 2,183 2,454 –11% 2 Skoda Fabia 1,591 1,627 –2% 3 Skoda Rapid 968 839 15% 4 Skoda Superb 896 872 3% 5 VW Brand Golf 708 282 151% 6 Volkswagen Passat 578 353 64% 7 Skoda Yeti 547 433 26% 8 Hyundai i30 523 401 30% 9 Hyundai ix20 350 227 54% 10 Dacia Dokker 348 200 74%
Jan. Jan. Jan. %rank 2017 2016 chng.
Cze
ch R
epu
blic
1 Peugeot 208 1,227 783 57% 2 Volkswagen Up 750 633 18% 3 Volkswagen Polo 638 353 81% 4 Hyundai i10 559 384 46% 5 Toyota Aygo 553 550 1% 6 Nissan Qashqai 553 273 103% 7 Toyota Yaris 539 580 –7% 8 Opel Astra/Astra Classic 467 197 137% 9 Kia Picanto 455 377 21% 10 Volkswagen Golf 444 208 113%
Jan. Jan. Jan. %rank 2017 2016 chng.
Den
mar
k 1 Honda CR-V 95 103 –8% 2 Toyota RAV4 88 35 151% 3 Renault Clio 88 27 226% 4 Volkswagen Passat 81 61 33% 5 Skoda Octavia 66 65 2% 6 Volkswagen Golf 66 42 57% 7 Kia Sportage 65 20 225% 8 Toyota Avensis 58 73 –21% 9 Skoda Superb 54 30 80% 10 Volkswagen Tiguan 50 13 285%
Jan. Jan. Jan. %rank 2017 2016 chng.
Esto
nia
1 Skoda Octavia 845 552 53% 2 Nissan Qashqai 632 450 40% 3 Opel Astra/Astra Classic 469 364 29% 4 Volkswagen Golf 439 387 13% 5 Ford Focus 348 389 –11% 6 Toyota Yaris 345 275 25% 7 Toyota Auris 325 383 –15% 8 Toyota Avensis 314 366 –14% 9 Volkswagen Passat 312 347 –10% 10 Volkswagen Tiguan 285 42 579%
Jan. Jan. Jan. %rank 2017 2016 chng.
Fin
lan
d
1 Renault Clio 8,710 5,992 45% 2 Peugeot 208 8,266 7,687 8% 3 Citroen C3 6,763 4,610 47% 4 Peugeot 2008 5,665 4,274 33% 5 Peugeot 3008 5,658 2,210 156% 6 Peugeot 308 5,031 6,114 –18% 7 Dacia Sandero 4,665 4,195 11% 8 Renault Captur 4,216 4,933 –15% 9 Renault Scenic/G. Scenic 3,435 2,284 50% 10 Renault Megane 2,922 2,271 29%
Jan. Jan. Jan. %rank 2017 2016 chng.
Fran
ce
1 Volkswagen Golf 11,210 13,303 –16% 2 Volkswagen Passat 7,188 6,201 16% 3 Volkswagen Tiguan 6,696 4,432 51% 4 Volkswagen Polo 5,970 5,893 1% 5 Mercedes-Benz C class 5,942 4,822 23% 6 Opel Astra/Astra Classic 5,180 4,818 8% 7 BMW X1 5,131 1,857 176% 8 Audi A4/S4/RS4 4,549 3,360 35% 9 Volkswagen Touran 4,498 3,889 16% 10 Skoda Octavia 4,426 3,372 31%
Jan. Jan. Jan. %rank 2017 2016 chng.
Ger
man
y
1 Toyota Yaris 597 439 36% 2 Nissan Qashqai 302 165 83% 3 Peugeot 208 241 193 25% 4 Opel Astra/Astra Classic 224 146 53% 5 Renault Clio 202 194 4% 6 Volkswagen Polo 198 155 28% 7 Fiat Panda 191 136 40% 8 Volkswagen Golf 158 120 32% 9 Hyundai i20 148 47 215% 10 Opel Corsa 145 290 –50%
Jan. Jan. Jan. %rank 2017 2016 chng.
Gre
ece
1 Suzuki Vitara/G. Vitara/XL-7 452 476 –5% 2 Skoda Octavia 352 343 3% 3 Opel Astra/Astra Classic 308 310 –1% 4 Ford Focus 186 154 21% 5 Ford Kuga 168 70 140% 6 Volkswagen Passat 162 173 –6% 7 Dacia Duster 162 145 12% 8 Volkswagen Golf 160 105 52% 9 Fiat 500 149 55 171% 10 Toyota Yaris 119 68 75%
Jan. Jan. Jan. %rank 2017 2016 chng.
Hu
ng
ary
1 Hyundai Tucson 1,899 2,472 –23% 2 Ford Focus 1,550 1,603 –3% 3 Ford Fiesta 1,421 1,279 11% 4 Nissan Qashqai 1,349 1,025 32% 5 Volkswagen Golf 1,305 1,247 5% 6 Toyota Corolla 1,195 1,359 –12% 7 Skoda Octavia 1,104 1,133 –3% 8 Toyota Yaris 993 1,051 –6% 9 Kia Sportage 811 522 55% 10 Opel Astra/Astra Classic 756 710 6%
Jan. Jan. Jan. %rank 2017 2016 chng.
Irel
and
1 Fiat Panda 14,908 13,500 10% 2 Fiat 500 6,209 4,597 35% 3 Lancia Ypsilon 5,784 5,560 4% 4 Renault Clio 4,851 4,568 6% 5 Fiat Tipo 4,485 1,342 234% 6 Volkswagen Golf 4,410 3,990 11% 7 Ford Fiesta 4,197 3,895 8% 8 Fiat 500L 3,511 4,422 –21% 9 Fiat Punto 3,502 3,206 9% 10 Dacia Sandero 3,405 2,010 69%
Jan. Jan. Jan. %rank 2017 2016 chng.
Ital
y
1 Skoda Octavia 93 40 133% 2 Volkswagen Passat 74 36 106% 3 Kia Cee’d 60 17 253% 4 Volkswagen Golf 55 31 77% 5 Volkswagen Tiguan 55 14 293% 6 Nissan Qashqai 51 53 -4% 7 Kia Sportage 51 17 200% 8 Toyota RAV4 50 22 127% 9 Ford Fiesta 41 3 1267% 10 Peugeot 2008 35 28 25%
Jan. Jan. Jan. %rank 2017 2016 chng.
Latv
ia
1 Fiat 500 186 127 46% 2 Toyota RAV4 82 18 356% 3 Volkswagen Tiguan 80 25 220% 4 Skoda Octavia 78 46 70% 5 Volkswagen Passat 73 31 135% 6 Toyota Auris 58 21 176% 7 Nissan Qashqai 58 71 –18% 8 Skoda Superb 55 24 129% 9 Kia Sportage 50 23 117% 10 Volkswagen Caddy 45 26 73%
Jan. Jan. Jan. %rank 2017 2016 chng.
Lith
uan
ia
1 Renault Clio 166 62 168% 2 Volkswagen Golf 154 113 36% 3 Audi A3/S3/RS3 113 77 47% 4 Volkswagen Tiguan 95 25 280% 5 BMW X1 94 59 59% 6 Mercedes-Benz GLC 77 33 133% 7 Volkswagen Polo 67 49 37% 8 Volvo V40 62 32 94% 9 BMW 4 series 62 73 –15% 10 Hyundai Tucson 58 33 76%
Jan. Jan. Jan. %rank 2017 2016 chng.
Luxe
mb
ou
rg
1 Volkswagen Polo 2,209 2,204 0% 2 Volkswagen Up 1,958 2,030 –4% 3 Volkswagen Golf 1,550 1,964 –21% 4 Volkswagen Tiguan 1,520 176 764% 5 Kia Picanto 1,169 1,084 8% 6 Opel Astra/Astra Classic 1,130 468 141% 7 Renault Clio 1,092 755 45% 8 Ford Fiesta 1,054 915 15% 9 Opel Karl 918 825 11% 10 Opel Corsa 825 379 118%
Jan. Jan. Jan. %rank 2017 2016 chng.
Net
her
lan
ds
1 Volkswagen Golf 684 951 –28% 2 BMW i3 622 294 112% 3 Volkswagen Passat 515 236 118% 4 Toyota RAV4 473 328 44% 5 Volvo XC90 411 215 91% 6 Skoda Octavia 358 213 68% 7 Nissan Leaf 352 284 24% 8 Toyota Yaris 343 317 8% 9 Mercedes-Benz GLC 289 53 445% 10 Toyota Auris 280 300 –7%
Jan. Jan. Jan. %rank 2017 2016 chng.
No
rway

32
AUTOMOTIVE NEWS EUROPE DATA
www.autonewseurope.com MARCH 2017
EUROPE’s TOP 10 SELLERS IN 27 KEY MARKETS brought to you courtesy of
www.jato.com
1 Skoda Fabia 1,788 1,689 6% 2 Skoda Octavia 1,492 1,398 7% 3 Opel Astra/Astra Classic 1,360 1,049 30% 4 Toyota Yaris 1,160 1,011 15% 5 Volkswagen Golf 1,104 932 18% 6 Toyota Auris 995 904 10% 7 Skoda Rapid 961 797 21% 8 Ford Focus 734 616 19% 9 Opel Corsa 724 614 18% 10 Hyundai Tucson 719 568 27%
Jan. Jan. Jan. %rank 2017 2016 chng.
Pola
nd
1 Renault Clio 655 526 25% 2 BMW 1 series 515 322 60% 3 Volkswagen Polo 478 402 19% 4 Citroen C3 434 365 19% 5 Opel Corsa 434 367 18% 6 Peugeot 2008 418 178 135% 7 Mercedes-Benz A class 396 350 13% 8 Nissan Qashqai 390 297 31% 9 Peugeot 208 390 572 –32% 10 Renault Megane 315 204 54%
Jan. Jan. Jan. %rank 2017 2016 chng.
Port
ug
al
1 Dacia Logan 1,257 993 27% 2 Dacia Duster 528 345 53% 3 Skoda Octavia 280 227 23% 4 Ford Focus 251 166 51% 5 Skoda Rapid 228 157 45% 6 Renault Megane 226 41 451% 7 Volkswagen Polo 206 50 312% 8 Volkswagen Passat 196 126 56% 9 Dacia Dokker 188 370 –49% 10 Renault Clio 185 194 –5%
Jan. Jan. Jan. %rank 2017 2016 chng.
Ro
man
ia
1 Skoda Octavia 414 436 –5% 2 Skoda Fabia 356 342 4% 3 Skoda Rapid 257 206 25% 4 Opel Astra/Astra Classic 206 253 –19% 5 Kia Cee’d 172 168 2% 6 Skoda Superb 153 105 46% 7 Volkswagen Golf 128 139 –8% 8 Volkswagen Polo 127 59 115% 9 Suzuki Vitara/G. Vitara/XL-7 115 171 –33% 10 Hyundai Tucson 105 140 –25%
Jan. Jan. Jan. %rank 2017 2016 chng.
Slo
vaki
a
1 Renault Clio 492 645 –24% 2 Volkswagen Golf 266 286 –7% 3 Dacia Sandero 228 97 135% 4 Volkswagen Tiguan 201 39 415% 5 Skoda Octavia 184 231 –20% 6 Renault Captur 174 94 85% 7 Renault Megane 150 48 213% 8 Hyundai Tucson 136 92 48% 9 Nissan Juke 132 14 843% 10 Skoda Fabia 130 155 –16%
Jan. Jan. Jan. %rank 2017 2016 chng.
Slo
ven
ia
1 Seat Ibiza 2,404 1,261 91% 2 Seat Leon 2,274 2,484 –8% 3 Volkswagen Golf 2,004 2,073 –3% 4 Opel Corsa 1,936 1,576 23% 5 Dacia Sandero 1,880 1,247 51% 6 Opel Astra/Astra Classic 1,709 1,630 5% 7 Nissan Qashqai 1,704 1,461 17% 8 Opel Zafira 1,557 1,214 28% 9 Peugeot 208 1,504 1,213 24% 10 Toyota Auris 1,503 1,541 –2%
Jan. Jan. Jan. %rank 2017 2016 chng.
Spai
n
1 Volkswagen Golf 1,333 1,235 8% 2 Volvo V90 1,315 0 – 3 Volvo XC60 1,173 611 92% 4 Volvo V60 1,137 703 62% 5 Volkswagen Passat 1,118 971 15% 6 Volkswagen Tiguan 673 223 202% 7 Volvo V40 590 678 –13% 8 BMW 5 series 530 250 112% 9 Volkswagen Polo 405 632 –36% 10 Audi A6/S6/RS6/Allroad 397 437 –9%
Jan. Jan. Jan. %rank 2017 2016 chng.
Swed
en
1 Skoda Octavia 782 846 –8% 2 Volkswagen Transporter 394 311 27% 3 Mercedes-Benz C class 378 385 –2% 4 Seat Alhambra 351 174 102% 5 Volkswagen Golf 338 635 –47% 6 Mercedes-Benz GLC 337 246 37% 7 Volkswagen Tiguan 315 113 179% 8 Dacia Sandero 294 217 35% 9 Skoda Fabia 289 297 –3% 10 Volkswagen Polo 279 331 –16%
Jan. Jan. Jan. %rank 2017 2016 chng.
Swit
zerl
and
1 Ford Fiesta 8,495 8,353 2% 2 Volkswagen Golf 5,455 3,813 43% 3 Ford Focus 4,796 4,285 12% 4 Mercedes-Benz C class 4,230 3,022 40% 5 Vauxhall Astra/Astra Classic 4,065 3,185 28% 6 Nissan Juke 3,929 3,446 14% 7 Vauxhall Corsa 3,898 4,803 –19% 8 Nissan Qashqai 3,500 4,839 –28% 9 Audi A3/S3/RS3 3,118 3,227 –3% 10 Kia Sportage 3,063 1,876 63%
Jan. Jan. Jan. %rank 2017 2016 chng.
Un
ited
Kin
gd
om
We’re covering mobility like no one else. • A new section on the autonews.com website
• A new weekly Mobility Report newsletter
• The second season of our Futurismo podcast
Don’t miss out on this forward-reaching coverage of car sharing, self-driving cars, privacy issues, vehicle-to-vehicle connectivity and much more.
LAUNCHES MARCH 6
LAUNCHES MARCH 6
Sign up for the newsletter today:
autonews.com/mobility

33
AUTOMOTIVE NEWS EUROPE DATA
www.autonewseurope.comMARCH 2017
V8/V12 Vantage ............... 49 39 49 39 DB9 ................................... 10 36 10 36 Vanquish ........................... 27 19 27 19 Rapide ............................... 21 9 21 9 Other ................................ 174 7 174 7 ASTON MARTIN .................. 281 110 281 110 Niva ................................... 160 116 160 116 Other ................................ 2 0 2 0 Total Lada .......................... 162 116 162 116 AVTOVAZ ............................ 162 116 162 116 1 series .............................. 10,185 8,860 10,185 8,860 2 series .............................. 2,089 1,754 2,089 1,754 2 series Active/Gran Tourer 7,124 7,396 7,124 7,396 3 series .............................. 8,423 8,852 8,423 8,852 4 series .............................. 4,194 4,125 4,194 4,125 5 series .............................. 4,792 5,134 4,792 5,134 6 series .............................. 237 373 237 373 7 series .............................. 847 907 847 907 Z4 ...................................... 50 144 50 144 X1 ...................................... 11,869 6,413 11,869 6,413 X3 ...................................... 2,916 3,766 2,916 3,766 X4 ...................................... 1,863 1,887 1,863 1,887 X5 ...................................... 3,100 2,916 3,100 2,916 X6 ...................................... 972 1,063 972 1,063 i3 ....................................... 1,858 952 1,858 952 i8 ....................................... 84 119 84 119 Other ................................ 16 19 16 19 Total BMW ........................ 60,619 54,680 60,619 54,680 Mini ................................... 8,307 6,500 8,307 6,500 Countryman/Paceman ..... 1,264 2,767 1,264 2,767 Clubman ........................... 2,579 1,954 2,579 1,954 Total Mini .......................... 12,150 11,221 12,150 11,221 Phantom ........................... 2 8 2 8 Ghost ................................ 19 22 19 22 Wraith ............................... 30 21 30 21 Dawn ................................ 14 0 14 0 Other ................................ 1 0 1 0 Total Rolls-Royce .............. 66 51 66 51 BMW GROUP ...................... 72,835 65,952 72,835 65,952 A class ............................... 9,139 9,196 9,139 9,196 B class ................................ 4,511 4,281 4,511 4,281 CLA .................................... 4,941 5,075 4,941 5,075 C class ................................ 15,104 12,553 15,104 12,553 E class ................................ 8,913 5,551 8,913 5,551 S class ................................ 927 1,103 927 1,103 CLS .................................... 532 611 532 611 SLK .................................... 67 636 67 636 SLC .................................... 460 14 460 14 SL ....................................... 107 111 107 111 AMG GT ............................ 112 208 112 208 Citan ................................. 539 371 539 371 V class ............................... 2,068 2,034 2,068 2,034 Vito/Viano ........................ 1,090 772 1,090 772 Sprinter ............................. 456 612 456 612 GLA ................................... 4,201 4,529 4,201 4,529 GLC/GLC coupe ................. 8,865 5,749 8,865 5,749 GLK ................................... 7 83 7 83 GLE/M class ....................... 2,258 2,310 2,258 2,310 GLE coupe ......................... 1,026 836 1,026 836 G class ............................... 425 319 425 319 GL/GLS class ...................... 378 246 378 246 Other ................................ 153 34 153 34 Total Mercedes-Benz ........ 66,279 57,234 66,279 57,234 ForTwo .............................. 4,793 4,109 4,793 4,109 ForFour ............................. 2,494 2,837 2,494 2,837 Other ................................ 0 1 0 1 Total Smart ........................ 7,287 6,947 7,287 6,947 DAIMLER ............................. 73,566 64,181 73,566 64,181 DR5 ................................... 13 19 13 19 Other ................................ 28 26 28 26 DR MOTOR COMPANY ...... 41 45 41 45 MiTo .................................. 1,187 780 1,187 780 Giulietta ............................ 2,846 3,724 2,846 3,724 Giulia ................................ 1,894 0 1,894 0 4C ...................................... 40 36 40 36 Other ................................ 3 5 3 5 Total Alfa Romeo ............... 5,970 4,545 5,970 4,545 300C .................................. 1 0 1 0 Grand Voyager/Town & Country 0 3 0 3 Other ................................ 1 1 1 1 Total Chrysler .................... 2 4 2 4 Dodge ................................ 18 20 18 20
Jan. Jan. 1 month 1 month 2017 2016 2017 2016
500 .................................... 15,623 13,639 15,623 13,639 Panda ................................ 17,908 17,104 17,908 17,104 Punto ................................ 4,737 4,685 4,737 4,685 Tipo ................................... 9,580 1,447 9,580 1,447 500X .................................. 7,305 8,254 7,305 8,254 124 Spider ......................... 622 0 622 0 500L .................................. 4,845 6,404 4,845 6,404 Freemont .......................... 1 465 1 465 Fiorino/Qubo .................... 1,049 840 1,049 840 Doblo ................................ 679 599 679 599 Talento ............................. 167 0 167 0 Ducato .............................. 829 853 829 853 Other ................................ 13 30 13 30 Total Fiat ........................... 63,358 54,320 63,358 54,320 Renegade ......................... 5,792 5,765 5,792 5,765 Compass ............................ 0 35 0 35 Wrangler .......................... 307 317 307 317 Cherokee/Liberty .............. 422 729 422 729 Grand Cherokee ............... 875 1,006 875 1,006 Other ................................ 3 1 3 1 Total Jeep .......................... 7,399 7,853 7,399 7,853 Ypsilon .............................. 5,831 5,674 5,831 5,674 Delta ................................. 1 0 1 0 Voyager ............................ 0 28 0 28 Total Lancia ....................... 5,832 5,702 5,832 5,702 GranTurismo ..................... 11 23 11 23 GranCabrio ....................... 8 10 8 10 Ghibli ................................ 239 348 239 348 Quattroporte .................... 43 57 43 57 Levante ............................. 693 0 693 0 Other ................................ 7 0 7 0 Total Maserati ................... 1,001 438 1,001 438 Other .................................. 43 31 43 31 FIAT CHRYSLER ................... 83,623 72,913 83,623 72,913 458 Italia ........................... 1 20 1 20 488 .................................... 96 77 96 77 California .......................... 23 44 23 44 FF ....................................... 2 7 2 7 F12 .................................... 24 36 24 36 Other ................................ 6 11 6 11 FERRARI ............................. 152 195 152 195 Ka ...................................... 39 3,158 39 3,158 Ka+ .................................... 3,996 0 3,996 0 Fiesta ................................. 24,894 21,090 24,894 21,090 Focus ................................. 16,817 14,867 16,817 14,867 Mondeo ............................ 4,681 6,660 4,681 6,660 B-Max ................................ 2,641 3,037 2,641 3,037 C-Max/Grand C-Max ......... 6,578 6,979 6,578 6,979 S-Max ................................ 2,552 3,371 2,552 3,371 Galaxy ............................... 813 1,558 813 1,558 Ecosport ............................ 5,073 4,364 5,073 4,364 Kuga ................................. 9,939 8,111 9,939 8,111 Transit/Tourneo ................ 437 215 437 215 Mustang ........................... 926 1,268 926 1,268 Other ................................ 3,495 2,836 3,495 2,836 FORD MOTOR ..................... 82,881 77,514 82,881 77,514 Geely .................................. 1 1 1 1 V40 .................................... 4,755 4,783 4,755 4,783 S60 .................................... 632 762 632 762 V60 .................................... 3,496 2,845 3,496 2,845 V70/XC70 .......................... 298 2,975 298 2,975 S80 .................................... 1 127 1 127 S90/V90 ............................. 690 0 690 0 XC60 .................................. 6,203 5,211 6,203 5,211 XC90 .................................. 3,169 2,829 3,169 2,829 Other ................................ 109 6 109 6 Total Volvo ........................ 19,353 19,538 19,353 19,538 GEELY GROUP .................... 19,354 19,539 19,354 19,539 Cadillac .............................. 74 48 74 48 Matiz/Spark ...................... 0 34 0 34 Aveo .................................. 0 13 0 13 Cruze ................................. 8 3 8 3 Malibu .............................. 0 1 0 1 Trax ................................... 7 6 7 6 Captiva .............................. 0 3 0 3 Camaro ............................. 80 12 80 12 Other ................................ 54 49 54 49 Total Chevrolet ................. 149 121 149 121 Agila ................................. 0 3 0 3 Karl/Viva ........................... 4,483 5,862 4,483 5,862 Adam ................................ 3,341 4,004 3,341 4,004 Corsa ................................. 19,292 18,032 19,292 18,032 Astra/Astra Classic ............ 20,704 16,823 20,704 16,823
Jan. Jan. 1 month 1 month 2017 2016 2017 2016
EUROPE SALES BY MODEL, JANUARY brought to you courtesy of
www.jato.com

34
AUTOMOTIVE NEWS EUROPE COVER STORY
www.autonewseurope.com MARCH 2017
WLTP - IT’S COMINGSEPTEMBER 2017JATO HAVE THE SOLUTION.From September the way emissions are measured and calculated will undergo radical change.
At JATO, we’re leveraging our 30-year heritage of world-class data collection and management expertise to create a WLTP solution that allows manufacturers and leasing service providers to keep doing business as usual, with minimum complexity.
For Manufacturers:A way of translating complex CO2 calculations into a language that leasing service providers can understand
Visibility of the signifi cant movement in the competitive landscape
For Leasing Service Providers:A way of collating a vast amount of manufacturers emissions data
CO2 emissions data that drives correct pricing
Compliancy with WLTP

35
AUTOMOTIVE NEWS EUROPE AUTOMAKERS
www.autonewseurope.comMARCH 2017
WLTP - IT’S COMING
FOR MORE INFORMATION VISIT: WWW.JATO.COM/JATO-WLTPEMAIL: [email protected] OR CALL: +44 (0) 20 8423 7100
OUR KNOWLEDGE IS YOUR POWER
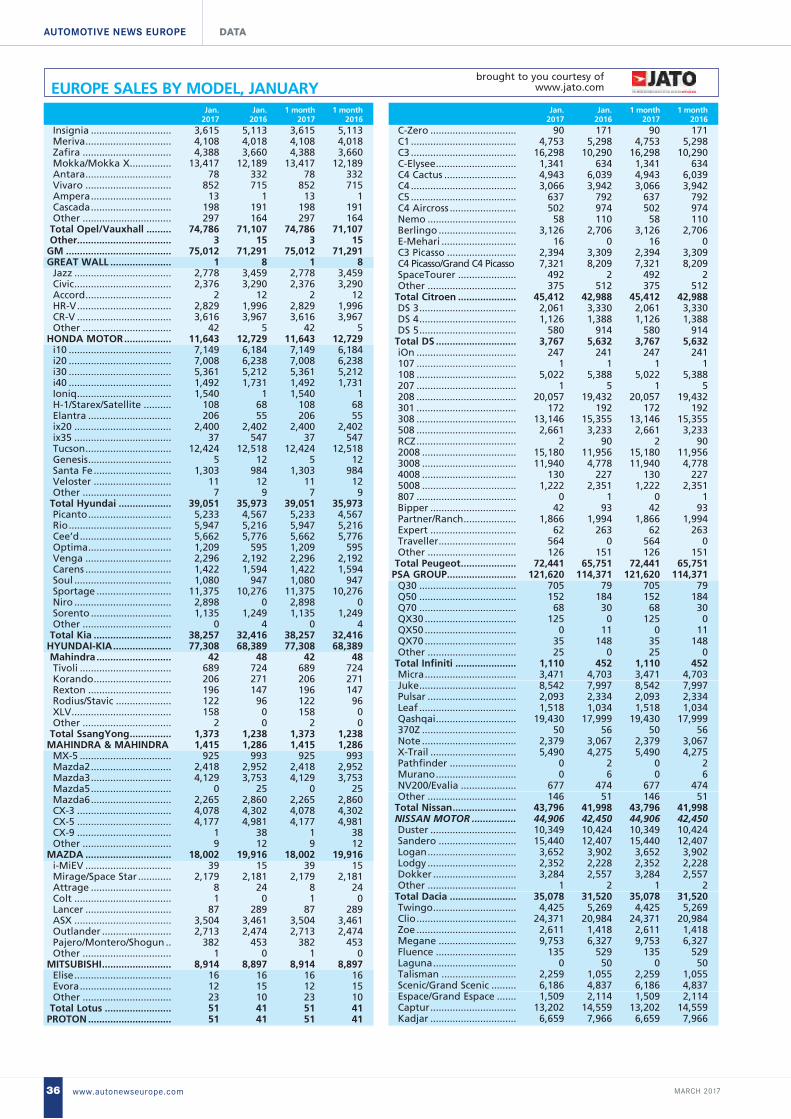
36
AUTOMOTIVE NEWS EUROPE DATA
www.autonewseurope.com MARCH 2017
Insignia ............................. 3,615 5,113 3,615 5,113 Meriva ............................... 4,108 4,018 4,108 4,018 Zafira ................................ 4,388 3,660 4,388 3,660 Mokka/Mokka X ............... 13,417 12,189 13,417 12,189 Antara ............................... 78 332 78 332 Vivaro ............................... 852 715 852 715 Ampera ............................. 13 1 13 1 Cascada ............................. 198 191 198 191 Other ................................ 297 164 297 164 Total Opel/Vauxhall ......... 74,786 71,107 74,786 71,107 Other .................................. 3 15 3 15 GM ...................................... 75,012 71,291 75,012 71,291 GREAT WALL ...................... 1 8 1 8 Jazz ................................... 2,778 3,459 2,778 3,459 Civic ................................... 2,376 3,290 2,376 3,290 Accord ............................... 2 12 2 12 HR-V .................................. 2,829 1,996 2,829 1,996 CR-V .................................. 3,616 3,967 3,616 3,967 Other ................................ 42 5 42 5 HONDA MOTOR ................. 11,643 12,729 11,643 12,729 i10 ..................................... 7,149 6,184 7,149 6,184 i20 ..................................... 7,008 6,238 7,008 6,238 i30 ..................................... 5,361 5,212 5,361 5,212 i40 ..................................... 1,492 1,731 1,492 1,731 Ioniq .................................. 1,540 1 1,540 1 H-1/Starex/Satellite .......... 108 68 108 68 Elantra .............................. 206 55 206 55 ix20 ................................... 2,400 2,402 2,400 2,402 ix35 ................................... 37 547 37 547 Tucson ............................... 12,424 12,518 12,424 12,518 Genesis .............................. 5 12 5 12 Santa Fe ............................ 1,303 984 1,303 984 Veloster ............................ 11 12 11 12 Other ................................ 7 9 7 9 Total Hyundai ................... 39,051 35,973 39,051 35,973 Picanto .............................. 5,233 4,567 5,233 4,567 Rio ..................................... 5,947 5,216 5,947 5,216 Cee’d ................................. 5,662 5,776 5,662 5,776 Optima .............................. 1,209 595 1,209 595 Venga ............................... 2,296 2,192 2,296 2,192 Carens ............................... 1,422 1,594 1,422 1,594 Soul ................................... 1,080 947 1,080 947 Sportage ........................... 11,375 10,276 11,375 10,276 Niro ................................... 2,898 0 2,898 0 Sorento ............................. 1,135 1,249 1,135 1,249 Other ................................ 0 4 0 4 Total Kia ............................ 38,257 32,416 38,257 32,416 HYUNDAI-KIA ..................... 77,308 68,389 77,308 68,389 Mahindra ........................... 42 48 42 48 Tivoli ................................. 689 724 689 724 Korando ............................ 206 271 206 271 Rexton .............................. 196 147 196 147 Rodius/Stavic .................... 122 96 122 96 XLV .................................... 158 0 158 0 Other ................................ 2 0 2 0 Total SsangYong ............... 1,373 1,238 1,373 1,238 MAHINDRA & MAHINDRA 1,415 1,286 1,415 1,286 MX-5 ................................. 925 993 925 993 Mazda2 ............................. 2,418 2,952 2,418 2,952 Mazda3 ............................. 4,129 3,753 4,129 3,753 Mazda5 ............................. 0 25 0 25 Mazda6 ............................. 2,265 2,860 2,265 2,860 CX-3 .................................. 4,078 4,302 4,078 4,302 CX-5 .................................. 4,177 4,981 4,177 4,981 CX-9 .................................. 1 38 1 38 Other ................................ 9 12 9 12 MAZDA ............................... 18,002 19,916 18,002 19,916 i-MiEV ............................... 39 15 39 15 Mirage/Space Star ............ 2,179 2,181 2,179 2,181 Attrage ............................. 8 24 8 24 Colt ................................... 1 0 1 0 Lancer ............................... 87 289 87 289 ASX ................................... 3,504 3,461 3,504 3,461 Outlander ......................... 2,713 2,474 2,713 2,474 Pajero/Montero/Shogun .. 382 453 382 453 Other ................................ 1 0 1 0 MITSUBISHI ......................... 8,914 8,897 8,914 8,897 Elise ................................... 16 16 16 16 Evora ................................. 12 15 12 15 Other ................................ 23 10 23 10 Total Lotus ........................ 51 41 51 41 PROTON .............................. 51 41 51 41
C-Zero ............................... 90 171 90 171 C1 ...................................... 4,753 5,298 4,753 5,298 C3 ...................................... 16,298 10,290 16,298 10,290 C-Elysee ............................. 1,341 634 1,341 634 C4 Cactus .......................... 4,943 6,039 4,943 6,039 C4 ...................................... 3,066 3,942 3,066 3,942 C5 ...................................... 637 792 637 792 C4 Aircross ........................ 502 974 502 974 Nemo ................................ 58 110 58 110 Berlingo ............................ 3,126 2,706 3,126 2,706 E-Mehari ........................... 16 0 16 0 C3 Picasso ......................... 2,394 3,309 2,394 3,309 C4 Picasso/Grand C4 Picasso 7,321 8,209 7,321 8,209 SpaceTourer ..................... 492 2 492 2 Other ................................ 375 512 375 512 Total Citroen ..................... 45,412 42,988 45,412 42,988 DS 3 ................................... 2,061 3,330 2,061 3,330 DS 4 ................................... 1,126 1,388 1,126 1,388 DS 5 ................................... 580 914 580 914 Total DS ............................. 3,767 5,632 3,767 5,632 iOn .................................... 247 241 247 241 107 .................................... 1 1 1 1 108 .................................... 5,022 5,388 5,022 5,388 207 .................................... 1 5 1 5 208 .................................... 20,057 19,432 20,057 19,432 301 .................................... 172 192 172 192 308 .................................... 13,146 15,355 13,146 15,355 508 .................................... 2,661 3,233 2,661 3,233 RCZ .................................... 2 90 2 90 2008 .................................. 15,180 11,956 15,180 11,956 3008 .................................. 11,940 4,778 11,940 4,778 4008 .................................. 130 227 130 227 5008 .................................. 1,222 2,351 1,222 2,351 807 .................................... 0 1 0 1 Bipper ............................... 42 93 42 93 Partner/Ranch ................... 1,866 1,994 1,866 1,994 Expert ............................... 62 263 62 263 Traveller ............................ 564 0 564 0 Other ................................ 126 151 126 151 Total Peugeot .................... 72,441 65,751 72,441 65,751 PSA GROUP ......................... 121,620 114,371 121,620 114,371 Q30 ................................... 705 79 705 79 Q50 ................................... 152 184 152 184 Q70 ................................... 68 30 68 30 QX30 ................................. 125 0 125 0 QX50 ................................. 0 11 0 11 QX70 ................................. 35 148 35 148 Other ................................ 25 0 25 0 Total Infiniti ...................... 1,110 452 1,110 452 Micra ................................. 3,471 4,703 3,471 4,703 Juke ................................... 8,542 7,997 8,542 7,997 Pulsar ................................ 2,093 2,334 2,093 2,334 Leaf ................................... 1,518 1,034 1,518 1,034 Qashqai ............................. 19,430 17,999 19,430 17,999 370Z .................................. 50 56 50 56 Note .................................. 2,379 3,067 2,379 3,067 X-Trail ............................... 5,490 4,275 5,490 4,275 Pathfinder ........................ 0 2 0 2 Murano ............................. 0 6 0 6 NV200/Evalia .................... 677 474 677 474 Other ................................ 146 51 146 51 Total Nissan ....................... 43,796 41,998 43,796 41,998 NISSAN MOTOR ................ 44,906 42,450 44,906 42,450 Duster ............................... 10,349 10,424 10,349 10,424 Sandero ............................ 15,440 12,407 15,440 12,407 Logan ................................ 3,652 3,902 3,652 3,902 Lodgy ................................ 2,352 2,228 2,352 2,228 Dokker .............................. 3,284 2,557 3,284 2,557 Other ................................ 1 2 1 2 Total Dacia ........................ 35,078 31,520 35,078 31,520 Twingo .............................. 4,425 5,269 4,425 5,269 Clio .................................... 24,371 20,984 24,371 20,984 Zoe .................................... 2,611 1,418 2,611 1,418 Megane ............................ 9,753 6,327 9,753 6,327 Fluence ............................. 135 529 135 529 Laguna .............................. 0 50 0 50 Talisman ........................... 2,259 1,055 2,259 1,055 Scenic/Grand Scenic ......... 6,186 4,837 6,186 4,837 Espace/Grand Espace ....... 1,509 2,114 1,509 2,114 Captur ............................... 13,202 14,559 13,202 14,559 Kadjar ............................... 6,659 7,966 6,659 7,966
Jan. Jan. 1 month 1 month 2017 2016 2017 2016
Jan. Jan. 1 month 1 month 2017 2016 2017 2016
EUROPE SALES BY MODEL, JANUARY brought to you courtesy of
www.jato.com

37
AUTOMOTIVE NEWS EUROPE COVER STORY
www.autonewseurope.com MARCH 2017
Where the European Automotive Industry MeetsMark your calendar for the 20th annual Automotive News Europe Congress.
ane-congress.comExclusive Lead Sponsor:
June 20-21, 2017 • Barcelona, Spain
Host Sponsor: Diamond Sponsors:
Silver Sponsors:Gold Sponsors: Bronze Sponsor:
Luca de MeoPresidentSEAT
Jim FarleyPresidentFord of Europe
Didier LeroyEVP, Chief Competitive OfficerToyota Motor Co.
Hakan SamuelssonCEOVolvo
Hildegard WortmannSVP Brand BMWBMW
FEATURED SPEAKERS INCLUDE:
BOOK BY APRIL 14 AND SAVE 200 EUROS!
Platinum Sponsor:

38
AUTOMOTIVE NEWS EUROPE DATA
www.autonewseurope.com MARCH 2017
Koleos ............................... 0 16 0 16 Kangoo ............................. 1,559 1,485 1,559 1,485 Trafic ................................. 840 639 840 639 Other ................................ 84 133 84 133 Total Renault ..................... 73,593 67,381 73,593 67,381 RENAULT GROUP .............. 108,671 98,901 108,671 98,901 RENAULT-NISSAN ............... 153,577 141,351 153,577 141,351 MG3 .................................. 161 294 161 294 MG6 .................................. 0 19 0 19 MG GS ............................... 44 0 44 0 Total MG ............................ 205 313 205 313 SAIC ..................................... 205 313 205 313 Impreza ............................. 51 50 51 50 XV ..................................... 796 716 796 716 Legacy/Outback ................ 508 608 508 608 Forester ............................. 988 781 988 781 BRZ .................................... 58 23 58 23 Levorg ............................... 240 313 240 313 Other ................................ 3 4 3 4 SUBARU .............................. 2,644 2,495 2,644 2,495 Alto ................................... 0 1 0 1 Celerio .............................. 2,471 2,103 2,471 2,103 Splash ................................ 0 1 0 1 Swift .................................. 2,377 3,538 2,377 3,538 Baleno ............................... 1,810 2 1,810 2 Jimny ................................. 936 802 936 802 Ignis .................................. 2,797 0 2,797 0 SX4 .................................... 52 22 52 22 Vitara/Grand Vitara/XL-7 . 5,694 6,067 5,694 6,067 SX4 S-Cross ....................... 2,199 1,615 2,199 1,615 Other ................................ 2 2 2 2 SUZUKI ................................ 18,338 14,153 18,338 14,153 XE ...................................... 1,736 2,295 1,736 2,295 XF ...................................... 1,158 1,085 1,158 1,085 XJ ...................................... 130 208 130 208 F-Type ............................... 216 295 216 295 F-Pace ................................ 2,566 0 2,566 0 XK ..................................... 0 1 0 1 Other ................................ 5 6 5 6 Total Jaguar ...................... 5,811 3,890 5,811 3,890 Defender .......................... 2 60 2 60 Discovery Sport ................ 3,728 3,481 3,728 3,481 Discovery .......................... 80 1,140 80 1,140 Range Rover Evoque ....... 5,098 4,958 5,098 4,958 Range Rover Sport ........... 2,385 2,260 2,385 2,260 Range Rover ..................... 1,267 1,175 1,267 1,175 Other ................................ 46 13 46 13 Total Land Rover ............... 12,606 13,087 12,606 13,087 TATA MOTORS ................... 18,417 16,977 18,417 16,977 Model S ............................. 787 779 787 779 Model X ............................ 641 1 641 1 Other ................................ 5 7 5 7 TESLA MOTORS .................. 1,433 787 1,433 787 Daihatsu ............................ 0 1 0 1 CT ...................................... 614 662 614 662 IS ....................................... 565 493 565 493 GS ...................................... 196 262 196 262 NX ..................................... 1,504 1,229 1,504 1,229 RX ...................................... 635 699 635 699 RC ...................................... 135 220 135 220 Other ................................ 4 6 4 6 Total Lexus ........................ 3,653 3,571 3,653 3,571 iQ ...................................... 0 1 0 1 Aygo ................................. 7,516 6,235 7,516 6,235 Yaris .................................. 15,855 15,977 15,855 15,977 Auris .................................. 9,073 11,220 9,073 11,220 Corolla .............................. 2,304 2,177 2,304 2,177 Prius .................................. 1,272 579 1,272 579 Prius+ ................................ 543 528 543 528 Avensis .............................. 2,369 3,572 2,369 3,572 Verso-S .............................. 0 120 0 120 Verso ................................. 2,226 2,152 2,226 2,152 C-HR .................................. 9,595 0 9,595 0 RAV4 ................................. 6,821 5,458 6,821 5,458 Land Cruiser ..................... 450 572 450 572 GT 86 ................................. 96 86 96 86 Proace ............................... 36 1 36 1 Other ................................ 222 22 222 22 Total Toyota ...................... 58,378 48,700 58,378 48,700 TOYOTA MOTOR ................ 62,031 52,272 62,031 52,272
A1 ...................................... 4,916 8,032 4,916 8,032 A3/S3/RS3 .......................... 14,235 15,760 14,235 15,760 A4/S4/RS4 .......................... 11,866 9,171 11,866 9,171 A5/S5/RS5 .......................... 3,629 3,473 3,629 3,473 A6/S6/RS6/allroad ............. 5,730 7,073 5,730 7,073 A7/S7/RS7 .......................... 511 792 511 792 A8/S8 ................................. 558 638 558 638 TT ...................................... 913 2,090 913 2,090 R8 ...................................... 84 168 84 168 Q3 ..................................... 6,230 8,096 6,230 8,096 Q5 ..................................... 7,479 4,163 7,479 4,163 Q7 ..................................... 2,512 2,911 2,512 2,911 Other ................................ 50 59 50 59 Total Audi .......................... 58,713 62,426 58,713 62,426 Continental GT/GTC ......... 158 138 158 138 Flying Spur ........................ 78 43 78 43 Mulsanne .......................... 23 27 23 27 Bentayga .......................... 108 0 108 0 Other ................................ 2 1 2 1 Total Bentley ..................... 369 209 369 209 Bugatti ............................... 1 0 1 0 Huracan ............................ 33 29 33 29 Aventador ........................ 19 21 19 21 Total Lamborghini ............ 52 50 52 50 718/Boxster ....................... 415 472 415 472 Cayman ............................. 10 388 10 388 911 .................................... 902 1,205 902 1,205 Panamera ......................... 660 247 660 247 Macan ............................... 2,140 1,406 2,140 1,406 Cayenne ............................ 1,129 1,168 1,129 1,168 Other ................................ 27 16 27 16 Total Porsche ..................... 5,283 4,902 5,283 4,902 Altea ................................. 0 43 0 43 Alhambra .......................... 2,504 2,081 2,504 2,081 Mii ..................................... 1,008 1,303 1,008 1,303 Ibiza .................................. 8,674 8,323 8,674 8,323 Leon .................................. 9,161 10,047 9,161 10,047 Toledo ............................... 546 881 546 881 Ateca ................................. 6,657 0 6,657 0 Other ................................ 2 4 2 4 Total Seat .......................... 28,552 22,682 28,552 22,682 Citigo ................................ 2,458 2,359 2,458 2,359 Fabia ................................. 13,833 11,959 13,833 11,959 Rapid ................................. 5,420 4,773 5,420 4,773 Octavia .............................. 18,802 17,257 18,802 17,257 Superb .............................. 7,410 6,506 7,410 6,506 Roomster .......................... 0 12 0 12 Yeti ................................... 3,889 4,125 3,889 4,125 Kodiaq .............................. 184 0 184 0 Other ................................ 13 45 13 45 Total Skoda ....................... 52,009 47,036 52,009 47,036 Up ..................................... 8,112 8,409 8,112 8,409 Polo ................................... 23,560 24,680 23,560 24,680 Golf ................................... 37,405 37,409 37,405 37,409 Golf Sportsvan .................. 5,846 6,190 5,846 6,190 Jetta .................................. 907 1,031 907 1,031 Passat ................................ 16,912 15,518 16,912 15,518 CC ...................................... 146 579 146 579 Phaeton ............................ 0 25 0 25 Beetle ................................ 1,573 1,419 1,573 1,419 Scirocco ............................. 519 625 519 625 Eos ..................................... 0 1 0 1 Touran .............................. 8,959 8,844 8,959 8,844 Sharan ............................... 2,349 2,343 2,349 2,343 Tiguan ............................... 21,960 11,019 21,960 11,019 Touareg ............................ 1,217 1,597 1,217 1,597 Caddy ................................ 4,954 3,811 4,954 3,811 Transporter/Caravelle/Multivan/ Shuttle/T5/T6 ................... 4,817 4,413 4,817 4,413 Other ................................ 189 202 189 202 Total VW ............................ 139,425 128,115 139,425 128,115 VW GROUP ......................... 284,404 265,420 284,404 265,420 OTHER ................................. 697 446 697 446 OTHER (China automakers) . 0 1 0 1 GRAND TOTAL .................... 1,188,607 1,091,708 1,188,607 1,091,708 Note: Excludes models registered as commercial vehicles. Europe sales by model are compiled using sales data from the following countries: Austria, Belgium, Cyprus, Czech Republic, Denmark, Estonia, Finland, France, Germany, Great Britain, Greece, Hungary, Iceland, Ireland, Italy, Latvia, Lithuania, Luxembourg, Netherlands, Norway, Poland, Portugal, Romania, Slovakia, Slovenia, Spain, Sweden and Switzerland.
Source: JATO Dynamics +44(0) 20 8423 7100 (www.jato.com)
Jan. Jan. 1 month 1 month 2017 2016 2017 2016
Jan. Jan. 1 month 1 month 2017 2016 2017 2016
EUROPE SALES BY MODEL, JANUARY brought to you courtesy of
www.jato.com

39
AUTOMOTIVE NEWS EUROPE DATA
www.autonewseurope.comMARCH 2017
Surging sales Surging sales European 2015 full-year segment European 2015 full-year segment winners and loserswinners and losers
Premium Compact SUV & Crossover +40%Large Minivan +33%Premium Medium SUV & Crossover +30%Premium Large SUV & Crossover +22%Compact SUV & Crossover +21%Convertible +21%Small SUV & Crossover +20%Premium Coupe +14%Exotic +9.4%Midsize Premium +7.5%Electric +6.9%Total market +6.5%Compact Premium +5.2%Entry Premium +3.7%Subcompact +2.4%Upper Premium +2.1%Compact +1.9%Midsize -0.0%Minicar -1.2%Large Premium -2.3%Coupe -6.0%Premium Convertible -6.2%Compact Minivan -6.6%Small Minivan -8.4%Large SUV & Crossover -12%
Source: JATO Dynamics
Record results2016 full-year sales and market share for Europe’s SUV/crossover segments
Compact 1,445,611 9.6%Small 1,260,176 8.4%Premium Medium 410,978 2.7%Premium Compact 338,428 2.3%Premium Large 271,014 1.8%Large 70,473 0.5%Total 3,796,680 25%
Source: JATO Dynamics
The Nissan Qashqai (left) was Europe’s top-selling crossover last year with a volume of more than 235,000. The BMW X1 (right) was No. 1 among premium SUVs with sales that topped 97,000 units.
Sizzling hot SUVsLed by the Nissan Qashqai and BMW X1, crossovers accounted for 25% of Europe’s sales last year
LUCA [email protected]
European demand for SUVs and cross-overs of any size and price showed no
signs of slowing last year, which is why the models benefited disproportionately from the region’s better-than-expected sales in 2016. Combined sales of models that included the Renault Captur, Nis-san Qashqai, BMW X1 and even the ag-ing Volvo XC60 increased 22 percent to nearly 3.8 million units, according to data from JATO Dynamics. That rise easily out-paced the overall market’s 6.5 percent increase to 15 million. In addition, SUVs and crossovers accounted for a quarter of all European passenger vehicle sales last year, up from 21 percent in 2015.
While torrid demand for SUVs and cross-overs has put increased pressure on minivans for years, the downward trend for people movers could be reversing because of the arrival of new products. Last year the new Ford S-Max and Gal-axy helped the large minivan segment to rebound by a third, boosting the sector’s sales above 200,000. The arrival of the new Renault Scenic could have a similar effect on the compact minivan segment, which declined 6.6 percent last year. The segment should also benefit from continued strong demand for the new Volkswagen Touran, which was up by 52 percent to 112,850 units in 2016.
SUVs and crossovers (see chart, above, right) also continue to steal sales from hatchbacks, sedans and wagons.
The Small SUV and crossover segment grew 20 percent to 1.26 million units last year while traditional subcompacts,
led by the Renault Clio and Volkswagen Polo hatchbacks, lost share.
Similarly, the compact SUV and cross-over sector rose 21 percent to 1.45 mil-lion units while traditional alternatives, led by the VW Golf hatchback, lost share.
When it comes to big models, European consumers turned to premium large SUVs and crossovers, whose sales increased by 22 percent to 271,014 units last year. Conversely, large SUVs and crossovers from volume brands declined by 12 per-cent to 70,473, making it the only SUV segment to suffer a decline, JATO’s figures show (see tables, Pages 40-42).
The addition of an SUV or crossover to an automaker’s European portfolio can be a game-changer, Seat CEO Luca de Meo said, pointing to the Spanish auto-maker’s launch of the Ateca compact SUV last year and its plans to join the small SUV sector with the Arona this year. “Previously Seat competed in half of the European market, with the Ateca and Arona it rises to three-quarters,” he told Automotive News Europe.
Overall winners Europe’s fastest-growing segment last year was premium compact SUVs and crossovers, which had a 40 percent gain to 338,428 units. The new BMW X1 took a comfortable lead in the sector by dou-bling sales to 97,218.
The subcompact segment remained Eu-rope’s largest with sales of 2.82 million units, a 2.4 percent increase that ex-tended its lead over the region’s second-largest segment, compacts. ANE

40
AUTOMOTIVE NEWS EUROPE DATA
www.autonewseurope.com MARCH 2017
2016 2015 change 1. Fiat 500L/500L Living 85,283 86,555 -1.5% 2. Opel/Vauxhall Meriva 49,347 53,612 -8.0% 3. Ford B-Max 40,622 46,400 -12.5% 4. Citroen C3 Picasso 37,210 39,902 -6.7% 5. Hyundai ix20 33,745 35,426 -4.7% 6. Kia Venga 26,245 28,637 -8.4% 7. Kia Soul 9,243 10,409 -11.2% 8. Toyota Verso-S 371 4,993 -92.6% 9. Opel/Vauxhall Agila 20 2,059 -99.0% 10. Ford Fusion 16 13 +23.1% Segment total 282,112 308,064 -8.4%
SMALL MINIVAN 2016 2015 change 1. Volkswagen Touran 112,850 74,197 +52.1% 2. Citroen C4 Picasso/ Grand C4 Picasso 106,524 111,907 -4.8% 3. Ford C-Max/Grand C-Max 82,087 85,650 -4.2% 4. Renault Scenic/Grand Scenic 79,743 108,842 -26.7% 5. Opel/Vauxhall Zafira 53,170 56,228 -5.4% 6. Toyota Verso 31,463 32,022 -1.7% 7. Peugeot 5008 28,068 31,615 -11.2% 8. Dacia Lodgy 26,700 23,025 +16.0% 9. Kia Carens 20,619 22,137 -6.9% 10. Toyota Prius+ 6,840 7,073 -3.3% Segment total 554,256 593,500 -6.6%
COMPACT MINIVAN
2016 2015 change 1. Volkswagen Beetle 15,882 14,866 +6.8% 2. Mazda MX-5 14,063 6,805 -- 3. Smart FortTwo 14,050 2,755 -- 4. Volkswagen Golf 5,203 13,815 -62.3% 5. Ford Mustang 4,539 1,366 -- 6. Opel/Vauxhall Cascada 4,395 4,458 -1.4% 7. Fiat 124 Spider 3,753 0 -- 8. DS 3 2,750 3,051 -9.9% 9. Chevrolet Camaro 118 93 +26.9% 10. Renault Megane 65 1,670 -96.1% Segment total 64,889 53,783 +20.6%
CONVERTIBLE & ROADSTER 2016 2015 change 1. Renault Megane 13,184 11,748 +12.2% 2. Ford Mustang 10,866 3,523 -- 3. Volkswagen Scirocco 10,769 12,115 -11.1% 4. Opel/Vauxhall Astra GTC 6,971 12,752 -45.3% 5. Toyota GT 86 1,598 1,668 -4.2% 6. Nissan 370Z 628 589 +6.6% 7. Chevrolet Camaro 490 274 +78.8% 8. Peugeot RCZ 467 4,188 -88.8% 9. Subaru BRZ 335 416 -19.5% 10. Dodge Challenger 263 306 -14.1% Segment total 45,849 48,759 -6.0%
COUPE
2016 2015 change 1. Volkswagen Passat 208,861 228,067 -8.4% 2. Skoda Superb 87,557 51,343 +70.5% 3. Opel/Vauxhall Insignia 73,454 88,939 -17.4% 4. Ford Mondeo 71,501 79,794 -10.4% 5. Peugeot 508 37,443 43,591 -14.1% 6. Toyota Avensis 35,079 33,378 +5.1% 7. Renault Talisman 34,351 1,802 -- 8. Mazda6 29,546 30,760 -3.9% 9. Hyundai i40 20,218 25,098 -19.4% 10. Kia Optima 9,582 3,264 -- Segment total 644,404 644,444 -0.0%
MIDSIZE 2016 2015 change 1. Volkswagen Golf 481,823 511,305 -5.8% 2. Opel/Vauxhall Astra 246,127 183,056 +34.5% 3. Skoda Octavia 231,764 219,508 +5.6% 4. Ford Focus 214,509 234,489 -8.5% 5. Peugeot 308 195,579 214,006 -8.6% 6. Seat Leon 147,122 144,157 +2.1% 7. Renault Megane 136,412 110,577 +23.4% 8. Toyota Auris 129,993 130,967 -0.7% 9. Volkswagen Golf Sportsvan 90,913 108,280 -16.0% 10. Kia Cee’d 78,088 74,821 +4.4% Segment total 2,631,638 2,582,727 +1.9%
COMPACT
2016 2015 change 1. Renault Clio 315,677 306,568 +3.0% 2. Volkswagen Polo 312,503 305,586 +2.3% 3. Ford Fiesta 300,557 314,591 -4.5% 4. Opel/Vauxhall Corsa 264,992 269,940 -1.8% 5. Peugeot 208 248,952 230,816 +7.9% 6. Toyota Yaris 194,447 184,512 +5.4% 7. Skoda Fabia 178,599 162,569 +9.9% 8. Dacia Sandero 174,153 152,207 +14.4% 9. Citroen C3 134,620 124,251 +8.3% 10. Seat Ibiza 122,244 119,675 +2.1% Segment total 2,824,136 2,758,071 +2.4%
SUBCOMPACT 2016 2015 change 1. Fiat Panda 191,696 173,410 +10.5% 2. Fiat 500 184,517 180,898 +2.0% 3. Volkswagen Up 95,602 103,342 -7.5% 4. Hyundai i10 85,700 86,377 -0.8% 5. Toyota Aygo 85,416 86,710 -1.5% 6. Renault Twingo 85,037 96,212 -11.6% 7. Peugeot 108 63,509 68,928 -7.9% 8. Citroen C1 62,629 64,076 -2.3% 9. Opel Karl/Vauxhall Viva 57,087 28,547 -- 10. Kia Picanto 54,921 54,223 +1.3% Segment total 1,182,329 1,196,675 -1.2%
MINICAR

41
AUTOMOTIVE NEWS EUROPE DATA
www.autonewseurope.comMARCH 2017
2016 2015 change 1. Audi A3 181,073 187,094 -3.2% 2. Mercedes A class 142,737 120,499 +18.5% 3. BMW 1 series 132,563 131,243 +1.0% 4. BMW 2-series Active Tourer/GT 102,550 86,506 +18.5% 5. Volvo V40 75,323 81,431 -7.5% 6. Mercedes B class 70,297 77,068 -8.8% 7. Mercedes CLA 66,839 62,549 +6.9% 8. Alfa Romeo Giulietta 41,629 41,833 -0.5% 9. Mini Countryman/Paceman 37,537 45,227 -17.0% 10. Mini Clubman 35,707 6,269 -- Segment total 894,310 849,807 +5.2%
COMPACT PREMIUM 2016 2015 change 1. Audi A4 163,756 124,995 +31.0% 2. Mercedes C class 150,032 165,525 -9.4% 3. BMW 3 series 143,918 143,499 +0.3% 4. Volvo V60 44,928 45,365 -1.0% 5. BMW 4 series GC 38,346 35,903 +6.8% 6. Jaguar XE 24,510 16,610 +47.6% 7. Alfa Romeo Giulia 10,484 0 -- 8. Volvo S60 8,570 9,190 -6.7% 9. Lexus IS 6,217 7,777 -20.1% 10. Infiniti Q50 2,735 3,047 -10.2% Segment total 593,956 552,489 +7.5%
MIDSIZE PREMIUM
2016 2015 change 1. Mini* 136,043 136,603 -0.4% 2. Audi A1 97,050 92,309 +5.1% 3. Lancia/Chrysler Ypsilon 67,076 59,245 +13.2% 4. Alfa Romeo MiTo 12,963 13,894 -6.7% 5. Lancia Musa 9 4 -- 6. Aston Martin Cygnet -- 1 -- Segment total 313,141 302,056 +3.7%
*Includes hatchback, Cabrio, Roadster and Coupe
ENTRY PREMIUM 2016 2015 change 1. Volkswagen Touareg 17,533 22,560 -22.3% 2. Hyundai Santa Fe 16,014 14,574 +9.9% 3. Jeep Cherokee 9,738 12,524 -22.2% 4. Ford Edge 9,249 11 -- 5. Toyota Land Cruiser 6,502 6,253 +4.0% 6. Mitsubishi Pajero/ Montero/Shogun 5,593 5,944 -5.9% 7. Fiat Freemont 3,054 13,813 -77.9% 8. SsangYong Rexton 2,236 2,227 +0.4% 9. Dodge Durango 171 209 -18.2% 10. Mazda CX-9 153 1,065 -85.6% Segment total 70,473 80,322 -12.3%
LARGE SUV & CROSSOVER
2016 2015 change 1. Nissan Qashqai 235,233 233,085 +0.9% 2. Volkswagen Tiguan 181,024 149,139 +21.4% 3. Hyundai Tucson 157,652 41,046 -- 4. Kia Sportage 138,943 106,256 +30.8% 5. Renault Kadjar 129,044 49,502 -- 6. Ford Kuga 119,760 102,761 +16.5% 7. Toyota RAV4 70,687 52,070 +35.8% 8. Nissan X-Trail 61,135 40,515 +50.9% 9. Skoda Yeti 60,245 64,678 -6.9% 10. Mazda CX-5 55,641 56,416 -1.4% Segment total 1,445,611 1,190,702 +21.4%
COMPACT SUV & CROSSOVER 2016 2015 change 1. Renault Captur 217,393 195,896 +11.0% 2. Peugeot 2008 176,401 155,551 +13.4% 3. Opel/Vauxhall Mokka/Mokka X 164,947 164,017 +0.6% 4. Dacia Duster 143,220 127,717 +12.1% 5. Fiat 500X 106,277 74,901 +41.9% 6. Nissan Juke 98,238 102,794 -4.4% 7. Suzuki Vitara 77,523 45,780 +69.3% 8. Jeep Renegade 76,938 54,699 +40.7% 9. Ford EcoSport 57,274 39,883 +43.6% 10. Mazda CX-3 53,547 24,574 -- Segment total 1,260,176 1,051,395 +19.9%
SMALL SUV & CROSSOVER
2016 2015 change 1. Ford S-Max 40,751 17,835 -- 2. Volkswagen Sharan 32,691 36,500 -10.4% 3. Seat Alhambra 31,920 27,264 +17.1% 4. Mercedes V class 29,203 22,822 +28.0% 5. Renault Espace/G.Espace 27,184 21,245 +28.0% 6. Ford Galaxy 20,378 10,438 +95.2% 7. Mercedes Vito/Viano 15,023 10,902 +37.8% 8. Hyundai H1/Starex 2,401 903 -- 9. SsangYong Rodius 1,811 1,701 +6.5% 10. Lancia/Chrysler Voyager 123 2,019 -93.9% Segment total 201,623 151,993 +32.7%
LARGE MINIVAN 2016 2015 change 1. Renault Zoe 21,297 18,499 +15.1% 2. Nissan Leaf 18,391 15,338 +19.9% 3. BMW i3 15,035 11,883 +26.5% 4. Tesla Model S 12,398 16,686 -25.7% 5. Volkswagen e-Golf 6,491 11,066 -41.3% 6. Kia Soul EV 4,452 5,931 -24.9% 7. Hyundai Ioniq 4,005 2 -- 8. Tesla Model X 3,699 0 -- 9. Mercedes B class e-cell 3,502 2,776 +26.2% 10. Volkswagen e-Up 2,579 2,927 -11.9% Segment total 99,265 92,895 +6.9%
ELECTRIC

42
AUTOMOTIVE NEWS EUROPE DATA
www.autonewseurope.com MARCH 2017
2016 2015 change 1. Volvo XC60 83,391 77,343 +7.8% 2. Audi Q5 70,591 64,773 +9.0% 3. Mercedes GLC 66,489 18,018 -- 4. Land Rover Discovery Sport 47,897 32,145 +49.0% 5. BMW X3 47,782 45,850 +4.2% 6. Porsche Macan 25,113 23,447 +7.1% 7. BMW X4 25,098 23,551 +6.6% 8. Jaguar F-Pace 20,273 0 -- 9. Lexus NX 17,550 16,583 +5.8% 10. Mercedes GLC Coupe 6,281 2 -- Segment total 410,978 315,775 +30.1%
PREMIUM MIDSIZE SUV & CROSSOVER 2016 2015 change 1. Bentley Continental GT/GTC 1,690 1,632 +3.6% 2. Audi R8 1,425 1,109 +28.5% 3. Ferrari 488 1,301 251 -- 4. Ferrari California 715 849 -15.8% 5. Maserati Quattroporte 707 817 -13.5% 6. Aston Martin V8/V12 Vantage 664 710 -6.5% 7. Bentley Flying Spur 655 554 +18.2% 8. Lamborghini Huracan 561 499 +12.4% 9. Ferrari F12 392 299 +31.1% 10. Lamborghini Aventador 345 250 +38.0% Segment total 11,333 10,358 +9.4%
EXOTIC
2016 2015 change 1. BMW X5 37,776 38,598 -2.1% 2. Volvo XC90 35,976 20,713 +73.7% 3. Audi Q7 33,906 21,104 +60.7% 4. Range Rover Sport 28,501 28,678 -0.6% 5. Mercedes GLE 27,105 7,819 -- 6. Porsche Cayenne 17,483 17,990 -2.8% 7. Range Rover 13,628 14,520 -6.1% 8. Mercedes GLE Coupe 13,500 5,425 -- 9. Jeep Grand Cherokee 13,263 13,812 -4.0% 10. Land Rover Discovery 13,065 12,494 +4.6% Segment total 271,014 222,270 +21.9%
PREMIUM LARGE SUV & CROSSOVER 2016 2015 change 1. BMW X1 97,218 42,159 -- 2. Audi Q3 93,037 82,761 +12.4% 3. Mercedes GLA 67,457 64,291 +4.9% 4. Range Rover Evoque 64,169 51,744 +24.0% 5. Infiniti Q30 8,049 19 -- 6. Audi Q2 7,511 0 -- 7. Infiniti QX30 785 0 -- 8. Alpina XD3 173 162 +6.8% 9. Land Rover Freelander 29 341 -91.5% 10. Infiniti EX -- 1 -- Segment total 338,428 241,478 +40.1%
PREMIUM COMPACT SUV & CROSSOVER
2016 2015 change 1. BMW 2 series 14,132 12,306 +14.8% 2. BMW 4 series 12,462 15,429 -19.2% 3. Audi A3 9,650 12,495 -22.8% 4. Audi A5 8,549 6,745 +26.7% 5. Mercedes SLC 6,771 3 -- 6. Mercedes E class 5,963 7,998 -25.4% 7. Porsche 911 5,133 4,782 +7.3% 8. Audi TT 5,092 4,842 +5.2% 9. Porsche 718 Boxster 3,142 147 -- 10. BMW Z4 3,005 4,099 -26.7% Segment total 84,687 90,255 -6.2%
PREMIUM CONVERTIBLE & ROADSTER 2016 2015 change 1. Mercedes C class 26,653 7,933 -- 2. BMW 2 series 18,083 14,867 +21.6% 3. BMW 4 series 17,699 21,805 -18.8% 4. Audi TT 15,929 17,598 -9.5% 5. Porsche 911 10,494 9,677 +8.4% 6. Audi A5 7,951 7,907 +0.6% 7. Mercedes E class 4,380 7,037 -37.8% 8. Porsche Cayman 3,059 3,331 -8.2% 9. Jaguar F-Type 2,872 3,011 -4.6% 10. Mercedes-AMG GT 2,366 2,519 -6.1% Segment total 120,425 105,879 +13.7%
PREMIUM COUPE
2016 2015 change 1. BMW 7 series 13,505 6,037 -- 2. Mercedes S class 12,952 13,642 -5.1% 3. Audi A7 9,107 10,290 -11.5% 4. Audi A8 5,445 6,744 -19.3% 5. Porsche Panamera 3,505 4,362 -19.6% 6. BMW 6 series GC 3,319 4,516 -26.5% 7. Jaguar XJ 1,893 1,656 +14.3% 8. Infiniti Q70 505 555 -9.0% 9. Volkswagen Phaeton 168 1,510 -88.9% 10. Lexus LS 83 134 -38.1% Segment total 50,530 49,502 +2.1%
UPPER PREMIUM 2016 2015 change 1. Audi A6 93,929 95,900 -2.1% 2. Mercedes E class 89,222 69,993 +27.5% 3. BMW 5 series 81,601 89,202 -8.5% 4. Volvo V70/XC70 30,318 49,312 -38.5% 5. Audi A5 27,202 30,792 -11.7% 6. Jaguar XF 15,941 16,452 -3.1% 7. Volvo S90/V90 10,981 0 8. Mercedes CLS 7,816 12,672 -38.3% 9. Maserati Ghibli 4,194 4,697 -10.7% 10. Lexus GS 2,065 1,403 +47.2% Segment total 364,390 373,028 -2.3%
LARGE PREMIUM

43
AUTOMOTIVE NEWS EUROPE DATA
www.autonewseurope.comMARCH 2017
Aston Martin ...... 240 248 –3% 5,187 3,414 52% BMW .................. 101,779 84,036 21% 1,176,911 1,162,362 1% BMW i ................ 3,825 2,616 46% 44,169 36,521 21% Mini .................... 26,561 28,901 –8% 367,109 358,643 2% Rolls-Royce ......... 378 116 226% 5,438 5,427 0% BMW Group ........ 132,543 115,669 15% 1,593,627 1,562,953 2% Bollore ................ 303 228 33% 4,062 3,614 12% CNH (Iveco) ......... 5,886 6,048 –3% 73,681 84,142 –12% Mercedes-Benz AMG 3,642 3,105 17% 41,973 43,545 –4% Mercedes-Benz .. 124,563 102,858 21% 1,514,782 1,546,913 –2% Mercedes-Maybach 50 50 0% 597 623 –4% Smart .................. 12,353 12,891 –4% 159,805 170,607 –6% Fuso .................... 189 271 –30% 2,322 2,498 –7% Daimler ............... 140,797 119,175 18% 1,719,479 1,764,186 –3% DHL Group (StreetScooter) 233 126 85% 2,759 1,587 74% Alfa Romeo ....... 11,033 5,080 117% 213,873 91,063 135% Ferrari ................ 638 745 –14% 7,780 8,705 –11% Fiat ..................... 66,546 62,610 6% 783,930 772,947 1% Jeep .................... 14,656 17,062 –14% 181,782 169,149 7% Lancia ................. 6,096 6,477 –6% 72,844 67,417 8% Maserati ............. 4,587 1,593 188% 56,781 42,962 32% Fiat Chrysler ....... 103,556 93,567 11% 1,316,990 1,152,243 14% Ford ..................... 91,173 105,600 –14% 1,182,652 1,130,857 5% LTI ....................... 86 70 23% 4,142 1,345 208% Volvo .................. 25,678 25,277 2% 435,496 452,556 –4% Geely ................... 25,764 25,347 2% 439,638 453,901 –3% Buick .................. 1,516 1,286 18% 30,404 8,291 267% Holden ............... 275 145 90% 2,830 2,087 36% Opel/Vauxhall .... 86,213 84,804 2% 1,113,259 1,032,442 8% GM ...................... 88,004 86,235 2% 1,146,493 1,042,820 10% Great Wall ......... 862 784 10% 9,617 9,266 4% Great Wall Motors 862 784 10% 9,617 9,266 4% Honda ................. 2,162 10,846 –80% 137,006 134,146 2% Hyundai ............. 31,559 28,224 12% 368,195 358,408 3% Kia ...................... 25,448 21,195 20% 297,786 310,706 –4% Hyundai-Kia ........ 57,007 49,419 15% 665,981 669,114 0%
EUROPEAN LIGHT-VEHICLE PRODUCTION BY BRAND, January
McLaren .............. 217 186 17% 3,165 2,910 9% Morgan ............... 39 40 –3% 558 554 1% Proton (Lotus) .... 136 101 35% 1,855 1,262 47% Citroen ............... 66,363 61,852 7% 797,990 831,667 –4% DS ....................... 4,453 5,530 –19% 90,817 71,307 27% Peugeot ............. 87,657 98,269 –11% 1,218,176 1,201,063 1% PSA Group .......... 158,473 165,651 –4% 2,106,983 2,104,037 0% Alpine ................ 293 0 – 8,114 332 – Dacia .................. 23,436 26,671 –12% 279,585 319,904 –13% Infiniti ................ 3,936 1,736 127% 50,684 37,241 36% Nissan ................. 40,108 47,140 –15% 625,732 603,912 4% Renault .............. 100,306 91,348 10% 1,356,934 1,353,565 0% Renault-Nissan ... 168,079 166,895 1% 2,321,049 2,314,954 0% SAIC (MG) ........... 0 200 – 0 850 – Suzuki ................. 17,176 17,567 –2% 193,021 203,974 –5% Jaguar ................ 12,461 10,255 22% 184,789 172,547 7% Land Rover ........ 25,415 36,639 –31% 375,899 374,089 0% Tata ..................... 37,876 46,894 –19% 560,688 546,636 3% Tesla .................... 1,334 1,129 18% 18,607 16,846 10% Toyota ................. 32,483 44,072 –26% 466,613 491,205 –5% Audi ................... 102,395 93,276 10% 1,311,833 1,326,963 –1% Bentley ............... 1,080 824 31% 16,047 14,258 13% Bugatti ............... 4 0 – 51 15 240% Lamborghini ...... 179 222 –19% 2,181 3,129 –30% MAN ................... 1,304 0 – 14,711 3,397 333% Porsche ............... 20,549 14,733 39% 250,371 236,880 6% Seat .................... 33,484 20,429 64% 451,870 440,829 3% Skoda ................. 64,320 65,729 –2% 721,475 786,823 –8% Volkswagen ....... 201,846 164,235 23% 2,375,290 2,352,310 1% VW Group ........... 425,161 359,448 18% 5,143,829 5,164,604 0%
EU Total ............... 1,489,504 1,415,475 5% 19,113,540 18,860,075 1%Note: Monthly production data is calculated based on working days per plant
Source: PwC Autofacts
Jan. Jan. % 2017 2016 % 2017 2016 chng. forecast actual chng.
Jan. Jan. % 2017 2016 % 2017 2016 chng. forecast actual chng.
The auto industry is going places.Highlight your region’s advantages to companies looking to relocate or expand. Participate in the Guide to Economic Development for the Automotive Industry.
The guide will be delivered to a worldwide audience of more than 160,000automotive executives, from the U.S. to Canada, from Europe to China.
Don’t be left behind.Learn more today atautonews.com/econdev

44
AUTOMOTIVE NEWS EUROPE DATA
www.autonewseurope.com MARCH 2017
Dacia ................................. 1,706 1,456 +17.2% 1,706 1,456 +17.2% Renault brand .................. 4,350 4,051 +7.4% 4,350 4,051 +7.4% Renault commercial vehicles 519 451 +15.1% 519 451 +15.1% Total Renault Group ......... 6,575 5,958 +10.4% 6,575 5,958 +10.4% Infiniti ............................... 6 0 – 6 0 – Nissan brand ..................... 1,320 971 +35.9% 1,320 971 +35.9% Total Nissan Motor ........... 1,326 971 +36.6% 1,326 971 +36.6% RENAULT-NISSAN .............. 7,901 6,929 +14.0% 7,901 6,929 +14.0% Audi .................................. 625 911 –31.4% 625 911 –31.4% Bentley .............................. 1 0 – 1 0 – Porsche .............................. 66 55 +20.0% 66 55 +20.0% Seat ................................... 536 502 +6.8% 536 502 +6.8% Skoda ................................ 925 715 +29.4% 925 715 +29.4% VW brand ......................... 3,059 2,791 +9.6% 3,059 2,791 +9.6% VW commercial vehicles .. 1,255 1,736 –27.7% 1,255 1,736 –27.7% VW GROUP ........................ 6,467 6,710 –3.6% 6,467 6,710 –3.6% Ford brand ........................ 1,509 1,320 +14.3% 1,509 1,320 +14.3% Ford commercial vehicles 2,978 2,449 +21.6% 2,978 2,449 +21.6% FORD MOTOR .................... 4,487 3,769 +19.1% 4,487 3,769 +19.1% Alfa Romeo ...................... 16 12 +33.3% 16 12 +33.3% Fiat brand ......................... 1,648 1,625 +1.4% 1,648 1,625 +1.4% Fiat commercial vehicles .. 2,218 2,216 +0.1% 2,218 2,216 +0.1% Maserati ............................ 2 1 +100.0% 2 1 +100.0% Jeep ................................... 111 92 +20.7% 111 92 +20.7% FIAT CHRYSLER .................. 3,995 3,946 +1.2% 3,995 3,946 +1.2% Citroen .............................. 515 394 +30.7% 515 394 +30.7% Citroen commercial vehicles 441 248 +77.8% 441 248 +77.8% DS ...................................... 9 8 +12.5% 9 8 +12.5% Peugeot ............................ 637 538 +18.4% 637 538 +18.4% Peugeot commercial vehicles 168 571 –70.6% 168 571 –70.6% PSA GROUP ........................ 1,770 1,759 +0.6% 1,770 1,759 +0.6% Hyundai ............................ 2,223 2,230 –0.3% 2,223 2,230 –0.3% Hyundai commercial vehicles 154 101 +52.5% 154 101 +52.5% Kia ..................................... 426 263 +62.0% 426 263 +62.0% Kia commercial vehicles ... 193 155 +24.5% 193 155 +24.5% HYUNDAI-KIA .................... 2,996 2,749 +9.0% 2,996 2,749 +9.0% Opel .................................. 1,575 1,262 +24.8% 1,575 1,262 +24.8% GM ..................................... 1,575 1,262 +24.8% 1,575 1,262 +24.8% Mercedes-Benz ................. 488 1,080 –54.8% 488 1,080 –54.8% M-B commercial vehicles . 343 360 –4.7% 343 360 –4.7% Smart ................................. 2 0 – 2 0 – DAIMLER ............................ 833 1,440 –42.2% 833 1,440 –42.2% Toyota brand .................... 2,283 1,481 +54.2% 2,283 1,481 +54.2% TOYOTA MOTOR ............... 2,283 1,481 +54.2% 2,283 1,481 +54.2% BMW brand ...................... 568 496 +14.5% 568 496 +14.5% Mini ................................... 55 101 –45.5% 55 101 –45.5% BMW GROUP ..................... 623 597 +4.4% 623 597 +4.4% Honda ............................... 1,317 737 +78.7% 1,317 737 +78.7% HONDA .............................. 1,317 737 +78.7% 1,317 737 +78.7% Mitsubishi ......................... 28 39 –28.2% 28 39 –28.2% Mitsubishi commercial vehicles 173 324 –46.6% 173 324 –46.6% MITSUBISHI ........................ 201 363 –44.6% 201 363 –44.6% Volvo ................................. 155 187 –17.1% 155 187 –17.1% GEELY GROUP ................... 155 187 –17.1% 155 187 –17.1% SsangYong ........................ 19 24 –20.8% 19 24 –20.8% MAHINDRA & MAHINDRA 19 24 –20.8% 19 24 –20.8% Jaguar ............................... 6 20 –70.0% 6 20 –70.0% Land Rover ....................... 34 46 –26.1% 34 46 –26.1% Tata brand ........................ 0 9 – 0 9 – TATA MOTORS .................. 40 75 –46.7% 40 75 –46.7% CNH .................................... 146 0 – 146 0 – SUZUKI ............................... 79 7 – 79 7 – SUBARU ............................. 67 73 –8.2% 67 73 –8.2% PROTON ............................. 0 10 – 0 10 – MAZDA .............................. 54 50 +8.0% 54 50 +8.0% ASTON MARTIN ................. 0 2 – 0 2 – FERRARI ............................. 0 3 – 0 3 – OTHER (China automakers) 0 30 – 0 30 – OTHER ................................ 100 190 –47.4% 100 190 –47.4%
TOTAL TURKEY .................. 35,108 32,393 +8.4% 35,108 32,393 +8.4%
Source: JATO Dynamics +44(0) 20 8423 7100 (www.jato.com)
Jan. Jan. Percent 1 month 1 month Percent 2017 2016 change 2017 2016 change
TURKEY VEHICLE SALES BY MANUFACTURER – January
Top 25 Selling Vehicles in TurkeyJanuary 2017 1 Renault Clio 1,846 2 Renault Megane 1,722 3 Ford Transit Courier/Tourneo Courier 1,712 4 Toyota Corolla 1,144 5 Ford Transit/Tourneo 1,130 6 Honda Civic 1,115 7 Fiat Doblo 1,108 8 Fiat Egea 1,098 9 Fiat Fiorino/Qubo 1,02310 Volkswagen Golf 87311 Opel Astra 85712 Volkswagen Passat 84313 Ford Focus 78414 Hyundai Accent 72415 Dacia Sandero 71615 Hyundai i20 71617 Nissan Qashqai 65918 Volkswagen Transporter 55619 Dacia Duster 53920 Renault Symbol 52421 Volkswagen Caddy 48522 Volkswagen Polo 46823 Skoda Octavia 43124 Volkswagen Jetta 42125 Volkswagen Tiguan 413
Source: JATO Dynamics +44 (0) 20 8423 7100 (www.jato.com)
Top 25 Selling Vehicles in TurkeyJanuary 2016 1 Renault Fluence 1,569 2 Ford Transit Courier/Tourneo Courier 1,303 3 Toyota Corolla 1,270 4 Renault Clio 1,191 5 Ford Transit/Tourneo 1,102 6 Fiat Egea 1,070 7 Fiat Doblo 980 8 Fiat Fiorino/Qubo 967 9 Hyundai i20 96610 Volkswagen Polo 80411 VW Transporter 76012 Renault Symbol 74713 Volkswagen Passat 66714 Volkswagen Golf 63115 Hyundai Accent 55416 Dacia Sandero 53816 Mercedes C class 53818 Volkswagen Caddy 53219 Ford Focus 52920 Opel Astra 49721 Hyundai Tucson 46722 Dacia Duster 44323 Opel Insignia 44024 Nissan Qashqai 41025 Peugeot Partner 409
Source: JATO Dynamics +44(0) 20 8423 7100 (www.jato.com)
brought to you courtesy of www.jato.com

45
AUTOMOTIVE NEWS EUROPE DATA
www.autonewseurope.comMARCH 2017
AvtoVAZ ................... 16,334 15,577 5% 16,334 15,577 5% Datsun ....................... 1,107 1,001 11% 1,107 1,001 11% Infiniti ....................... 379 298 27% 379 298 27% Nissan ........................ 4,230 4,494 –6% 4,230 4,494 –6% Renault ..................... 5,208 5,014 4% 5,208 5,014 4% RENAULT-NISSAN ...... 27,258 26,384 3% 27,258 26,384 3% KIA ............................. 10,306 9,049 14% 10,306 9,049 14% Audi .......................... 935 905 3% 935 905 3% Skoda ........................ 3,571 3,556 0% 3,571 3,556 0% Volkswagen .............. 4,581 4,455 3% 4,581 4,455 3% Volkswagen vans ..... 305 323 –6% 305 323 –6% VW GROUP ................ 9,392 9,239 2% 9,392 9,239 2% Genesis ...................... 6 0 – 6 0 – Hyundai .................... 6,694 8,010 –16% 6,694 8,010 –16% HYUNDAI GROUP ...... 6,700 8,010 –16% 6,700 8,010 –16% Lexus ......................... 1,000 1,085 –8% 1,000 1,085 –8% Toyota ....................... 3,831 6,064 –37% 3,831 6,064 –37% TOYOTA GROUP ........ 4,831 7,149 –32% 4,831 7,149 –32% Mercedes-Benz ......... 2,471 3,206 –23% 2,471 3,206 –23% Mercedes-Benz vans 246 260 –5% 246 260 –5% Smart ......................... 20 12 67% 20 12 67% DAIMLER .................... 2,737 3,478 –21% 2,737 3,478 –21% GAZ LCV ..................... 2,307 1,851 25% 2,307 1,851 25% FORD .......................... 2,253 2,242 1% 2,253 2,242 1% BMW ......................... 1,758 1,919 –8% 1,758 1,919 –8% Mini ........................... 70 76 –8% 70 76 –8% BMW GROUP ............. 1,828 1,995 –8% 1,828 1,995 –8% Cadillac ..................... 78 48 63% 78 48 63% Chevrolet .................. 1,734 1,201 44% 1,734 1,201 44% GM ............................. 1,812 1,249 45% 1,812 1,249 45% UAZ ............................ 1,735 1,930 –10% 1,735 1,930 –10% MAZDA ...................... 1,513 1,411 7% 1,513 1,411 7% MITSUBISHI ................ 1,076 1,323 –19% 1,076 1,323 –19% LIFAN .......................... 929 1,244 –25% 929 1,244 –25% Jaguar ....................... 134 34 294% 134 34 294% Land Rover ............... 401 500 –20% 401 500 –20% JAGUAR LAND ROVER 535 534 0% 535 534 0% Citroen ...................... 265 220 21% 265 220 21% Peugeot .................... 227 196 16% 227 196 16% PSA GROUP ................ 492 416 18% 492 416 18% RAVON ....................... 445 0 – 445 0 – SUBARU ..................... 303 422 –28% 303 422 –28% SUZUKI ....................... 265 571 –54% 265 571 –54% Alfa Romeo .............. 0 2 – 0 2 – Chrysler ..................... 0 3 – 0 3 – Fiat ............................ 122 164 –26% 122 164 –26% Jeep ........................... 92 76 21% 92 76 21% FIAT CHRYSLER .......... 214 245 –13% 214 245 –13% CHERY ........................ 205 280 –27% 205 280 –27% PORSCHE .................... 151 311 –51% 151 311 –51% Acura ......................... 0 47 – 0 47 – Honda ....................... 123 190 –35% 123 190 –35% HONDA GROUP ......... 123 237 –48% 123 237 –48% GEELY ......................... 120 555 –78% 120 555 –78% CHANGAN .................. 93 34 174% 93 34 174% VOLVO ....................... 72 16 350% 72 16 350% DFM ............................ 54 91 –41% 54 91 –41% ISUZU ......................... 41 57 –28% 41 57 –28% IVECO ......................... 35 47 –26% 35 47 –26% FAW ........................... 33 35 –6% 33 35 –6% ZOTYE ........................ 28 0 – 28 0 – BRILLIANCE ................ 13 114 –89% 13 114 –89% BAW ........................... 10 13 –23% 10 13 –23% HYUNDAI LCV ............ 4 0 – 4 0 – FOTON ....................... 3 0 – 3 0 – SSANGYONG ............. 0 153 – 0 153 – HAIMA ....................... 0 40 – 0 40 – DAEWOO ................... 0 1,269 – 0 1,269 –
Total ........................... 77,916 81,994 –5% 77,916 81,994 –5%
Russia vehicle sales by manufacturer – January Jan. Jan. Percent 1 mos. 1 mos. Percent 2017 2016 change 2017 2016 change
1 Kia Rio 5,693
2 Lada Granta 4,624
3 Lada Vesta 4,088
4 Hyundai Solaris 2,886
5 Hyundai Creta 2,565
6 VW Polo 2,550
7 Skoda Rapid 1,981
8 Renault Duster 1,848
9 Chevrolet Niva 1,670
10 Lada 4x4 1,627
11 Lada X-ray 1,578
12 Kia Sportage 1,565
13 Lada Largus 1,562
14 Renault Kaptur 1,519
15 Toyota Camry 1,327
16 VW Tiguan 1,288
17 Skoda Octavia 1,248
18 Nissan X-Trail 1,206
19 Toyota RAV4 1,150
20 Lada Priora 1,143
21 Mazda CX-5 1,115
22 Lada Kalina 1,025
23 Datsun On-Do 1,014
24 Nissan Qashqai 1,010
25 Mitsubishi Outlander 943
January 2017 Top 25 Sellers Ranking based on new car and LCV sales in Russia
Source: AEB Automobile Manufacturers Committee
1 Lada Granta 7,377
2 Hyundai Solaris 5,626
3 Kia Rio 3,553
4 Toyota RAV4 2,816
5 VW Polo 2,655
6 Kia Sportage 2,407
7 Renault Duster 2,379
8 Lada Largus 2,065
9 Lada Vesta 1,643
10 Lada 4x4 1,609
11 Skoda Rapid 1,560
12 Renault Logan 1,481
13 Lada Priora 1,386
14 Skoda Octavia 1,365
15 Kia Cee’d 1,196
16 Chevrolet Niva 1,182
17 Toyota Camry 1,146
18 Lada Kalina 1,140
19 Nissan Qashqai 1,073
20 Renault Sandero 1,043
21 Toyota Land Cruiser 1,014
22 Mazda CX-5 975
23 Daewoo Gentra 957
24 UAZ Patriot 856
25 Nissan Almera 854
January 2016 Top 25 Sellers Ranking based on new car and LCV sales in Russia

46
AUTOMOTIVE NEWS EUROPE FINAL WORD
www.autonewseurope.com MARCH 2017
FINAL WORD
Luca Ciferri is Associate Publisher and Editor at Automotive News
Europe. He can be reached [email protected]
Why city mayors could be key in industry’s futurePSA Group CEO Carlos Tavares is
scared that the mayors of the world’s biggest cities -- especially those in Europe -- will have a powerful say in which pow-ertrains will rule the road because they can dictate which types of vehicles will be allowed inside their metropolitan areas.
“Do you expect me to be happy at 85 riding a bicycle in Paris on a cold, snowy day?” Tavares asked reporters on the sidelines of a press event for the Peugeot 5008 in Lisbon last month. It’s easy to understand why he is nervous. The rising sentiment against diesels is gaining trac-tion in Europe because mayors in cities such as Paris -- where PSA is based -- want to eliminate the powertrain by 2025.
The mayors are gaining power in Europe because EU lawmakers have failed to set clear guidelines for future urban mobility at a pan-European level.
C40 targets dieselsEliminating diesels from cities is one of the key priorities of the C40 organization (www.c40.org). Started in October 2005 when former London Mayor Ken Living-stone convened representatives from 18 megacities to pursue action and coopera-tion on reducing greenhouse gas emis-sions, the C40 now includes 90 cities and is chaired by Paris Mayor Anne Hidalgo, who is a declared enemy of the diesel.The C40 claims that cities occupy just 2 percent of the world’s land but con-sume more than two-thirds of the world’s energy and account for more than 70 percent of global CO2 emissions.
“Cities are on the frontlines of global climate change and are also well posi-tioned to play a leadership role in driv-ing global action to address climate change,” the C40 states on its website.
Last year, the C40 drafted the Air Qual-ity Declaration to show its commitment to banning diesel vehicles by the middle of the next decade. The declaration in-
cludes data from the World Health Or-ganization that claims 3 million deaths worldwide each year are linked to expo-sure to outdoor air pollution. The vast majority of these deaths occur in cities.The C40 asked automakers to stop pro-ducing diesels by 2025 and to support a rapid transition to electric, hydrogen and hybrid vehicles.
Some of the C40’s founding members, such as the city of Paris, not only agreed to remove diesel vehicles from their streets by 2025, they also pledged to incentivize alternative powertrain ve-hicles and heavily promote walking and cycling. That is why Tavares said that he doesn’t look forward to a time when he is forced to get on his bike to enter Paris when he is an octogenarian.
Lack of freedomSome might consider Tavares’ views as a sign that he is against change. That’s
far from true. He is confident that PSA’s engineers can develop whichever so-lutions are needed to allow Peugeot, Citroen and DS drivers to enter any big city. What concerns him is that motor-ists could be forced to use a technology based on the whims of a person, or a limited number of people, rather than on the solution’s well-to-wheel benefits.
“My view remains that all regulation should be technology-neutral,” Tavares said. “Different automakers will offer different technical solutions, leaving the customer the final choice of what he considers more appropriate and conve-nient for his individual mobility needs.” He added that cities that pick technolo-gies for the people strip away their free-dom of mobility.
“To me freedom means I could contin-ue to get up on a Saturday and decide where I want to go,” he said. “With my own car.” ANE
The city of Paris wants diesel-powered vehicles removed from its streets by 2025 to help reduce air pollution, which is blamed for causing millions of deaths worldwide each year.
Phot
o: R
eute
rs

2
AUTOMOTIVE NEWS EUROPE COVER STORY
www.autonewseurope.com JULY 2016
Knowledge built for market leadership
© 2016 PwC. All rights reserved. PwC refers to the PwC network and/or one or more of its member firms, each of which is a separate legal entity. Please see www.pwc.com/structure for further details. This content is for general information purposes only, and should not be used as a substitute for consultation with professional advisors.
From knowledge comes informed decisions. That’s why business leaders are looking for insight on today’s complex issues. And why we provide perspective on issues such as corporate governance, operations, regulation, talent, operations, cyber security, strategy and new platforms for growth. To gain additional insight on these and other issues of importance to your automotive business, visit www.pwc.com/auto

48
AUTOMOTIVE NEWS EUROPE COVER STORY
www.autonewseurope.com MARCH 2017
ITALDESIGN PARTNERS WITH AUDI FOR Q2 ENGINEERING
& DEVELOPMENT.
Engineering. Styling. Packaging. Modelling. Prototyping. Testing. Validation. Showcars. Ultra-Low Series Production. Industrial Design.
www.italdesign.it


