28
Autonomous Vehicles Impacts on the General Vehicle Industry Evan Cooper and James Pearson
Autonomous Vehicles
Impacts on the General Vehicle Industry
Evan Cooper and James Pearson
Agenda
• An Introduction to Self Driving Vehicles
• The History
• The current and future players
• Modelling and Assumptions
• How will this impact the industry if there is no industry shift?
• Expectations and Alternatives
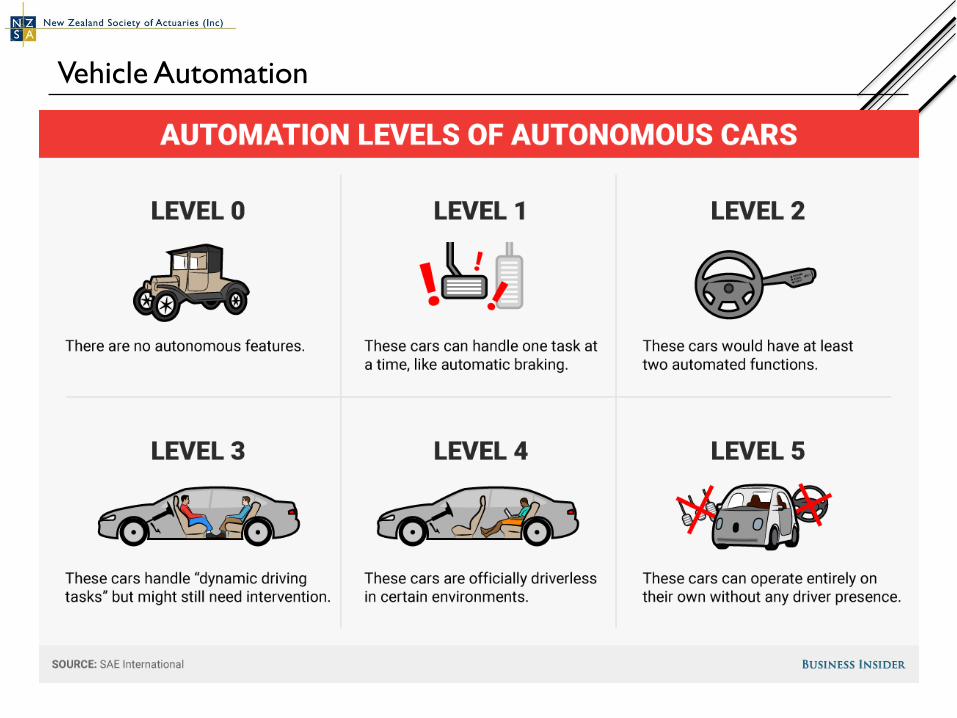
Vehicle Automation
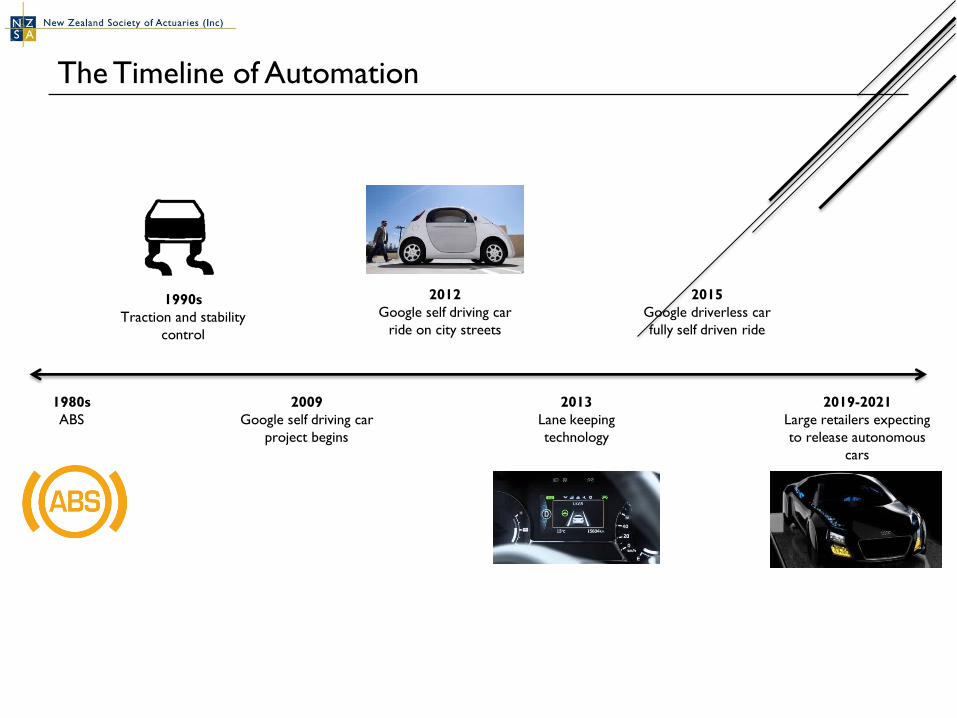
The Timeline of Automation
1980s
ABS
2019-2021
Large retailers expecting
to release autonomous
cars
2015
Google driverless car
fully self driven ride
1990s
Traction and stability
control
2009
Google self driving car
project begins
2012
Google self driving car
ride on city streets
2013
Lane keeping
technology
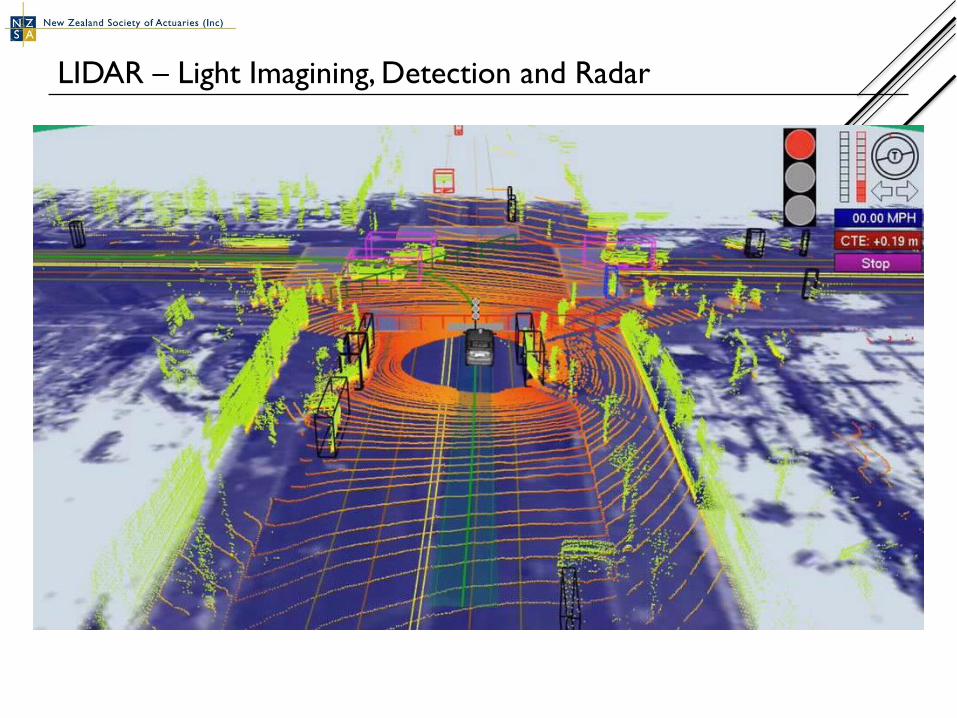
LIDAR – Light Imagining, Detection and Radar
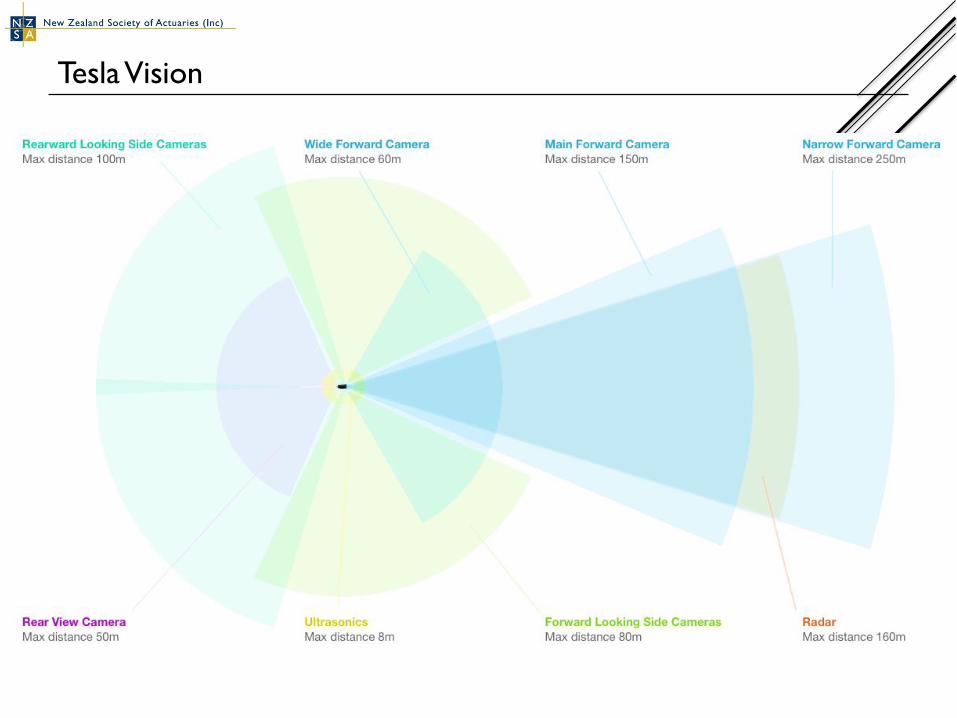
Tesla Vision
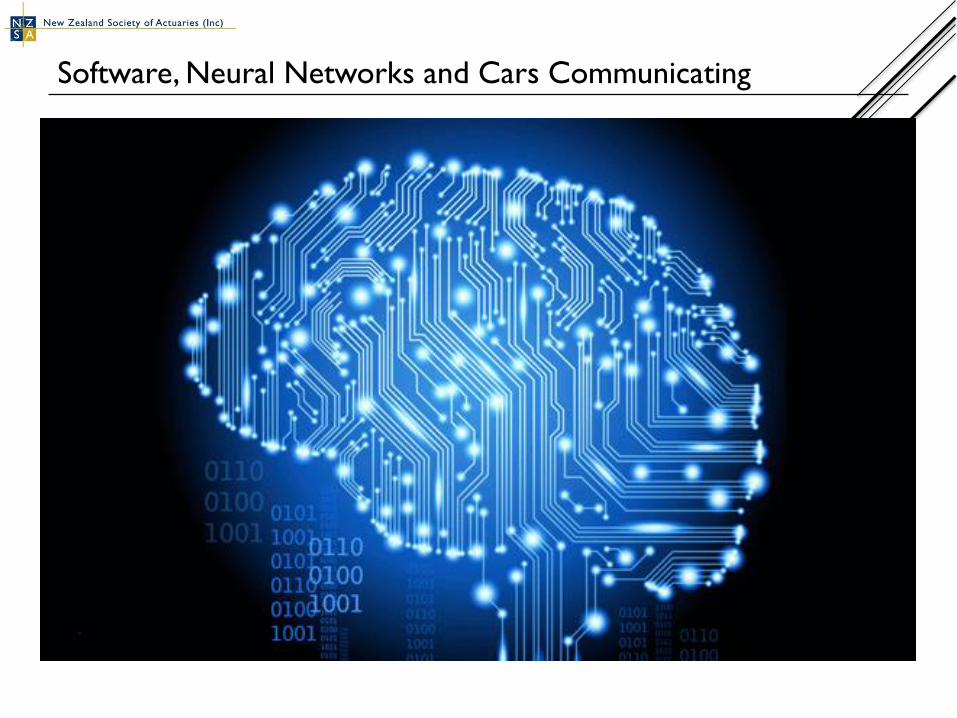
Software, Neural Networks and Cars Communicating

The Trolley Problem
Autonomous Car Impact Model
• Premiums
• Claims
• Relative Risk by Age Bracket
• Comprehensive and Third Party Cover
• Uptake of Autonomous Vehicles
• Number of Autonomous and Non-Autonomous Vehicles
• Autonomous vehicle crash rates
Premium and Claims Assumptions
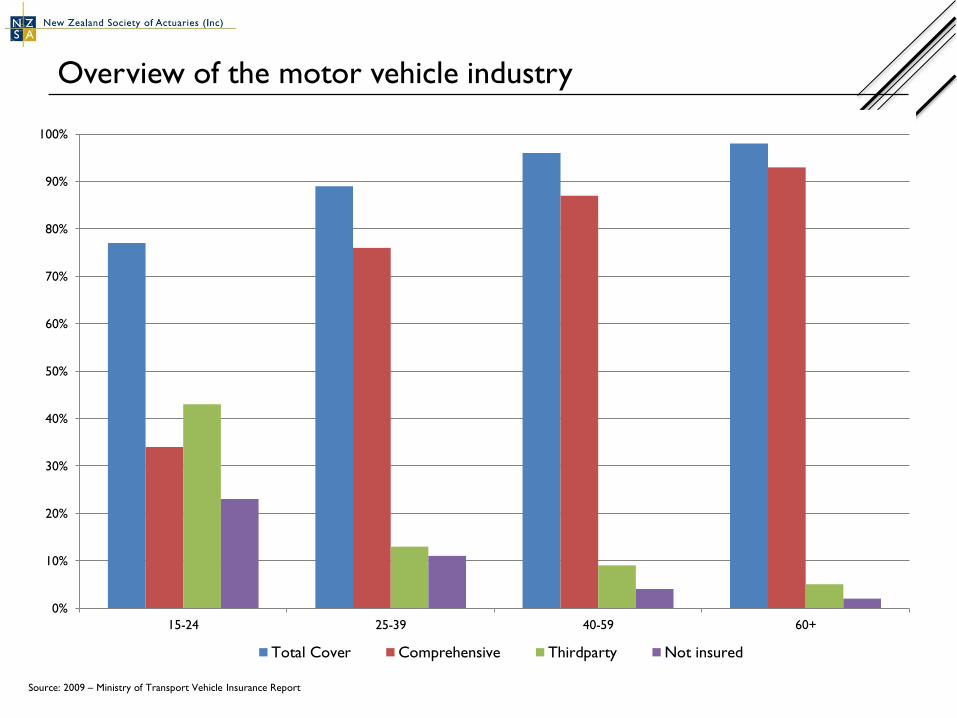
Overview of the motor vehicle industry
0%
10%
20%
30%
40%
50%
60%
70%
80%
90%
100%
15-24 25-39 40-59 60+
Total Cover Comprehensive Thirdparty Not insured
Source: 2009 – Ministry of Transport Vehicle Insurance Report
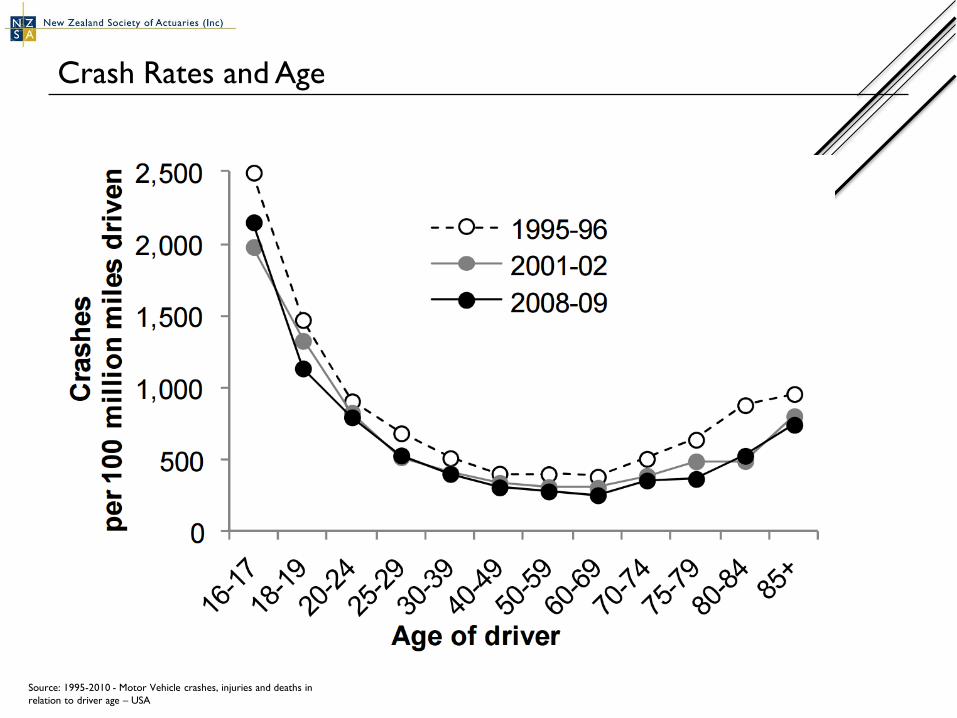
Crash Rates and Age
Source: 1995-2010 - Motor Vehicle crashes, injuries and deaths in
relation to driver age – USA
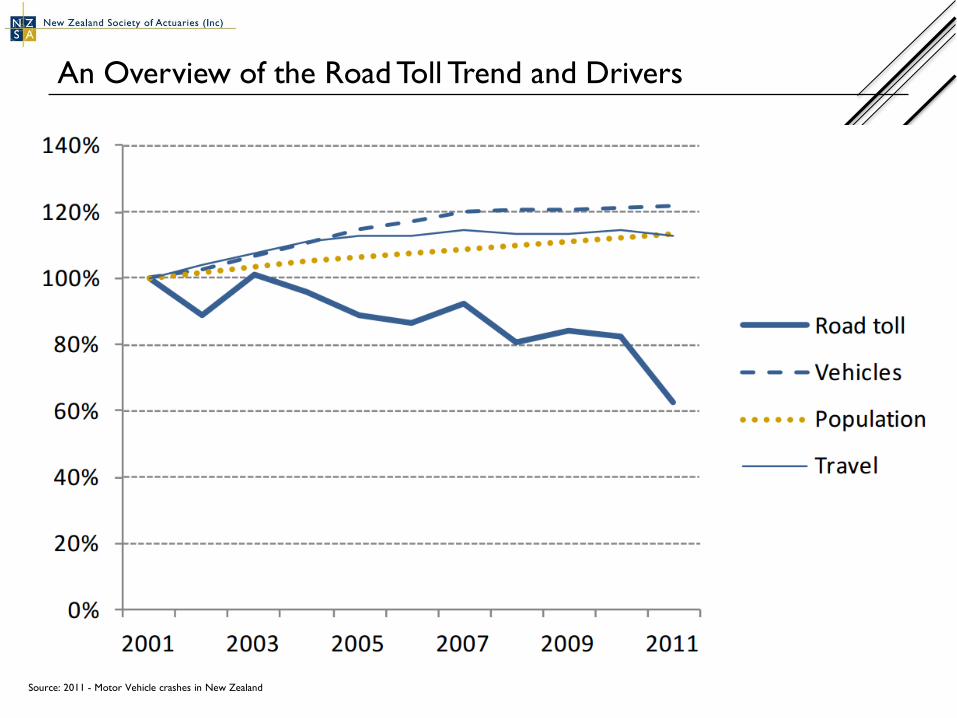
An Overview of the Road Toll Trend and Drivers
Source: 2011 - Motor Vehicle crashes in New Zealand

Crashes causing Injury and Death by Age
0
10
20
30
40
50
60
70
16-19 20-24 25-29 30-34 35-39 40-44 45-49 50-54 55-59 60-64 65-69 70-74 75+
Age Group
Source: Ministry of Transport Licence and Fleet Statistics – Crash and
Casualties report
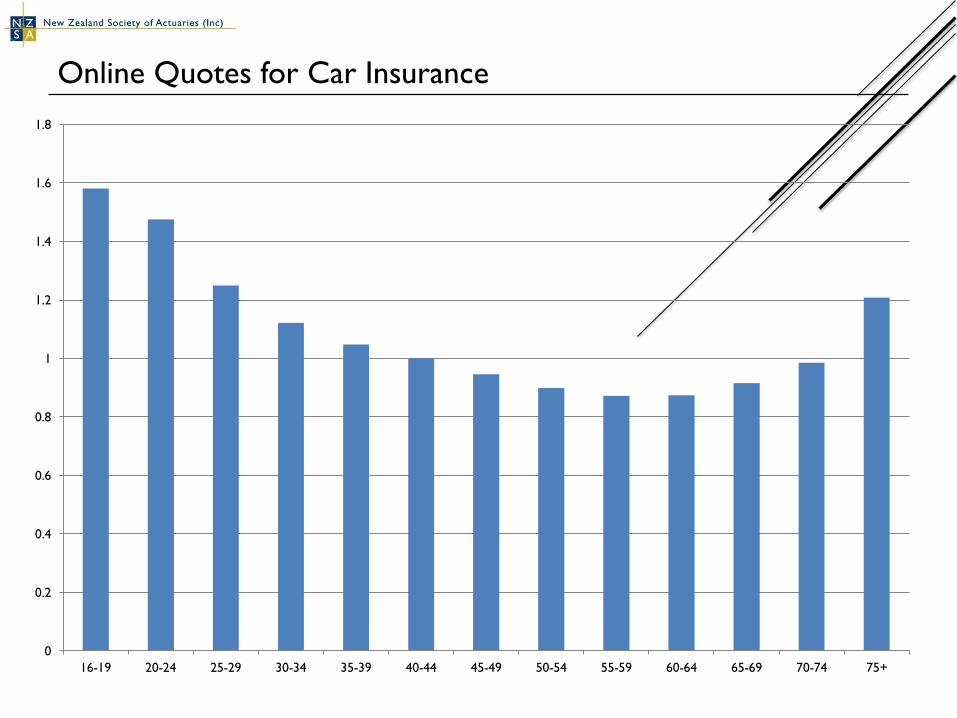
Online Quotes for Car Insurance
0
0.2
0.4
0.6
0.8
1
1.2
1.4
1.6
1.8
16-19 20-24 25-29 30-34 35-39 40-44 45-49 50-54 55-59 60-64 65-69 70-74 75+

Premium Assumptions – $702 per unit population
0
200
400
600
800
1,000
1,200
1,400
1,600
1996 1999 2002 2005 2008 2011 2014
Millio
ns
Predicted Premium Actual Premium
Source: 1996-2015 – Insurance Council of New Zealand
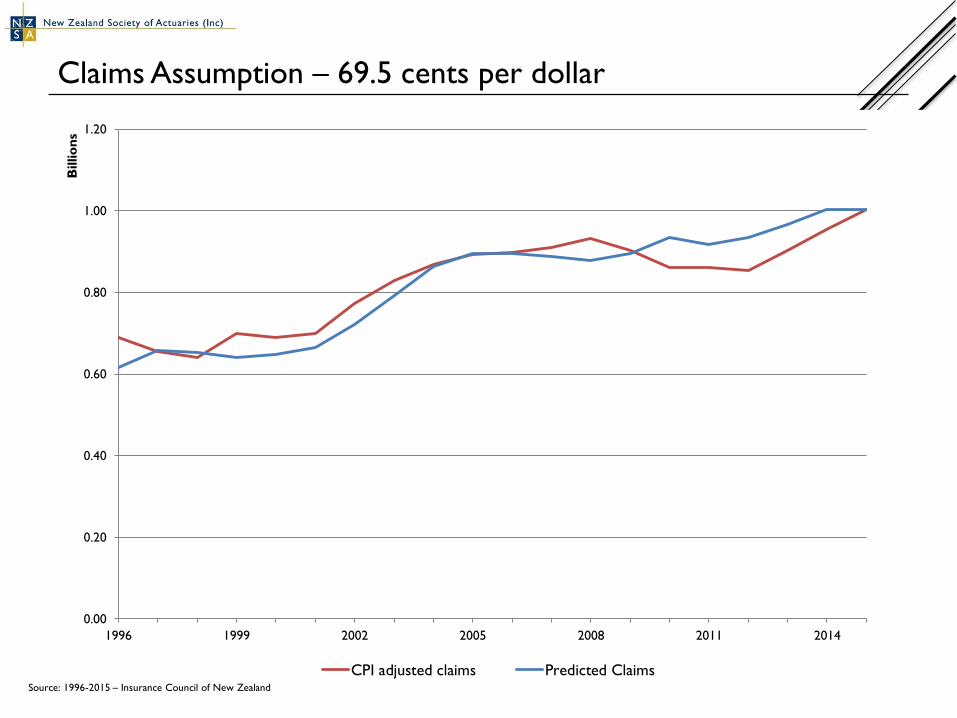
Claims Assumption – 69.5 cents per dollar
0.00
0.20
0.40
0.60
0.80
1.00
1.20
1996 1999 2002 2005 2008 2011 2014
Billio
ns
CPI adjusted claims Predicted ClaimsSource: 1996-2015 – Insurance Council of New Zealand
Car Uptake and Population Assumptions

Uptake
0%
10%
20%
30%
40%
50%
60%
18-29 30-44 45-54 55-64 65+
Safe Not SafeSource: Morning Consulting - 2016
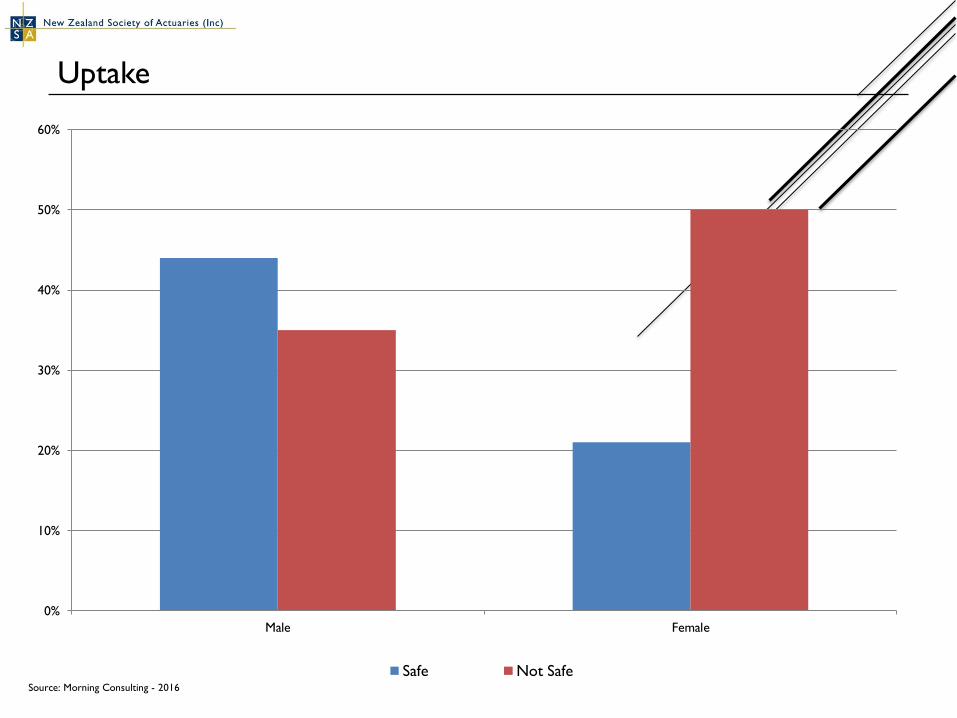
Uptake
0%
10%
20%
30%
40%
50%
60%
Male Female
Safe Not SafeSource: Morning Consulting - 2016
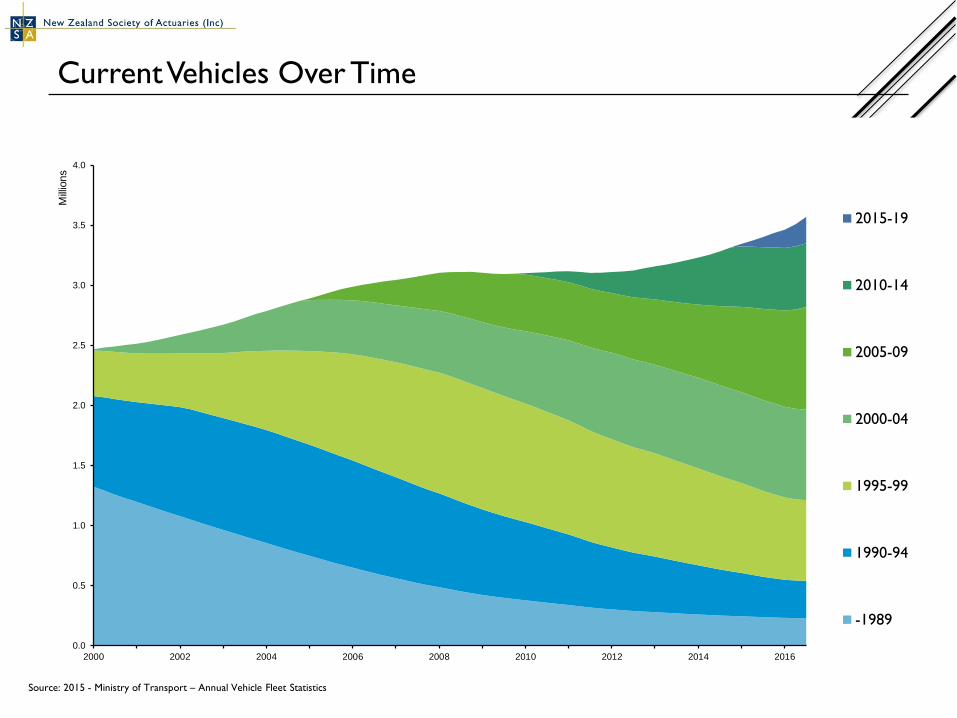
Current Vehicles Over Time
0.0
0.5
1.0
1.5
2.0
2.5
3.0
3.5
4.0
2000 2002 2004 2006 2008 2010 2012 2014 2016
Mill
ions
2015-19
2010-14
2005-09
2000-04
1995-99
1990-94
-1989
Source: 2015 - Ministry of Transport – Annual Vehicle Fleet Statistics
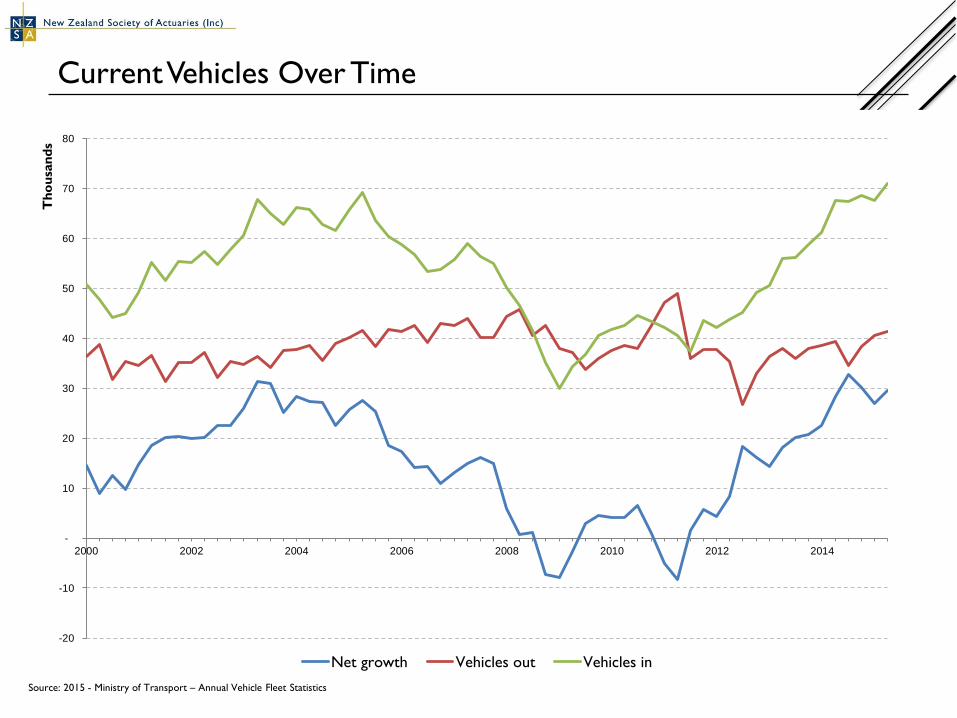
Current Vehicles Over Time
-20
-10
-
10
20
30
40
50
60
70
80
2000 2002 2004 2006 2008 2010 2012 2014
Th
ou
san
ds
Net growth Vehicles out Vehicles in
Source: 2015 - Ministry of Transport – Annual Vehicle Fleet Statistics
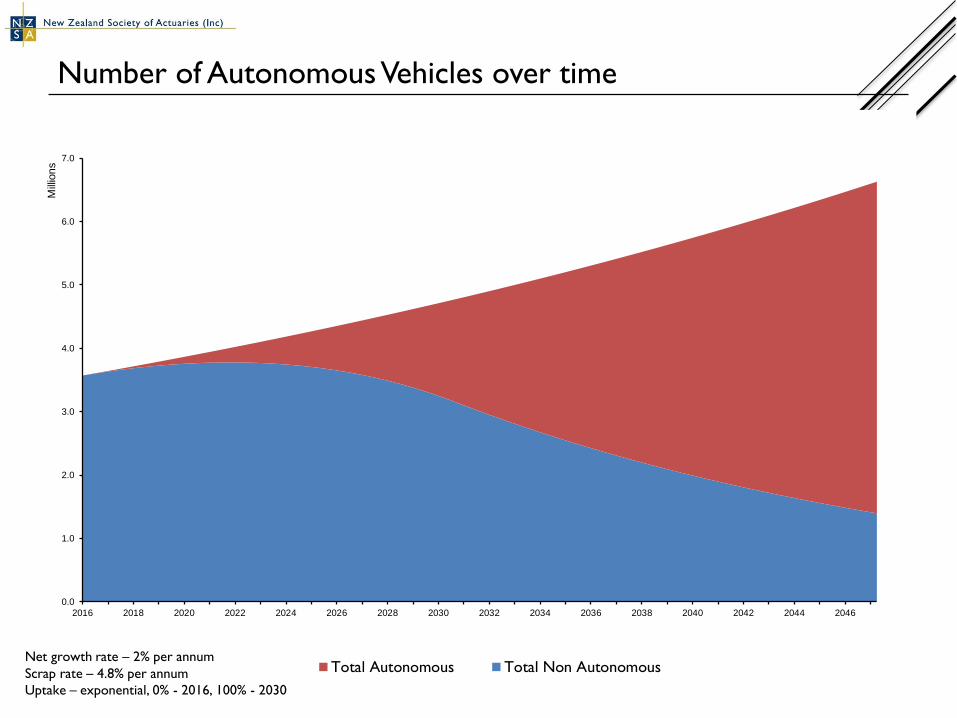
Number of Autonomous Vehicles over time
0.0
1.0
2.0
3.0
4.0
5.0
6.0
7.0
2016 2018 2020 2022 2024 2026 2028 2030 2032 2034 2036 2038 2040 2042 2044 2046
Mill
ion
s
Total Autonomous Total Non AutonomousNet growth rate – 2% per annum
Scrap rate – 4.8% per annum
Uptake – exponential, 0% - 2016, 100% - 2030
Expectations and Alternatives
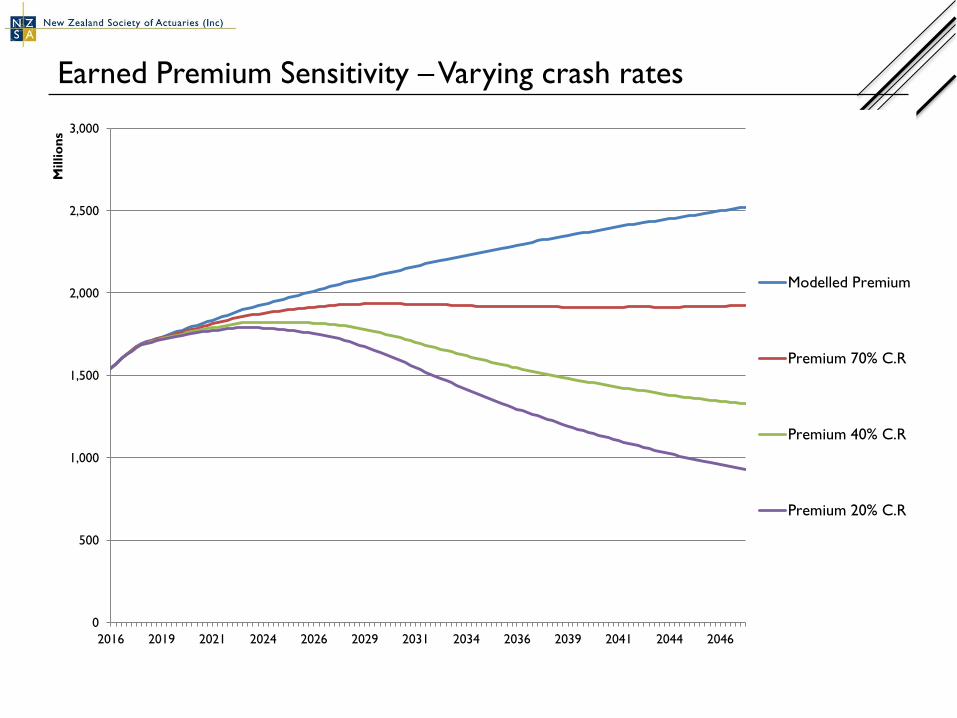
Earned Premium Sensitivity – Varying crash rates
0
500
1,000
1,500
2,000
2,500
3,000
2016 2019 2021 2024 2026 2029 2031 2034 2036 2039 2041 2044 2046
Millio
ns
Modelled Premium
Premium 70% C.R
Premium 40% C.R
Premium 20% C.R
Alternative Models of the Automotive Industry
• Private Ownership vs Ride Sharing
– Theft and Damage
– Crash Liability
• Regulatory Changes
• Will it be an insurable market
• Cyber insurance

Conclusion and Discussion