EQUITY RESEARCH RBC Capital Markets, LLC Joseph Spak, CFA (Analyst) (212) 428-2364 [email protected]Jacob Hughes (Associate) (212) 618-5594 [email protected]August 13, 2013 Autos and Auto Parts: RBC Automotive Consumer Survey Vol. 6: Survey Supports Positive Full-Year View We recently conducted our quarterly proprietary survey of 456 likely new vehicle purchasers. Our key insights are as follows: • Purchasing Intentions support our next 12-month SAAR view. Our Purchasing Intentions Index was fairly level in August versus May. We believe our survey results support our view for a 2H13 SAAR in the mid- to-high 15mm range. Recent retail strength (July 2013 at 13.7mm retail SAAR, +19% y/y) also supports this view. • Macro not having impact on vehicle purchase decision. Our diffusion index (macro has increased intentions minus decreased intentions) improved again in August 2013 vs. May 2013, implying that consumers are increasingly comfortable with a still subdued economic environment and willing to purchase a new vehicle if needed. • High level of uncertainty among buyers remains; share up for grabs. Consumers who are looking to purchase a new vehicle remain relatively undecided. Thirty-seven percent of respondents indicated that they haven’t made a decision yet, down from a high of 39% in May but still up 6pp from February. In our view, this could allow GM, which is refreshing a significant portion of its portfolio, to gain share. • Chevy and Dodge saw higher "consideration" scores. We view “consideration” as a good proxy for showroom activity. In our view, sustainably improved consideration/showroom traffic eventually yields higher conversion (purchasing intentions) and share gains. Chevy scored well, which is supportive of our bullish GM stance. • Potential near-term share gainers: Ford, Chevy, Nissan. All saw improvements in the “intention to buy metric” in August 2013 vs. May 2013. Nissan improvement coincided with MSRP cuts. VW and Hyundai are potential near-term share losers. • Old age of vehicle and improved fuel efficiency top considerations. Old age of current vehicle is still the predominant reason for new purchase and supports pent-up demand argument. Looking for improved fuel efficiency is the second most popular reason. • Price becoming a more important feature? Performance/driving qualities (27% of respondents) were listed as the most important feature. Price was a close second at 25%, but up from low 20's all year long. This could be a sign that more aggressive pricing will be needed going forward. Fuel efficiency was third. • Segments: Small car and midsize sedan segment interest stepped back modestly. We saw sequential improvement in pickups, CUVs, and SUVs in the month. Stocks: We continue to favor GM over Ford given the earnings acceleration and upside we see at GM over the next few years. We expect the current valuation gap (almost 1 turn on 2014 EBITDAP) to begin to dissipate over the next 2–3 quarters as improved GMs come through. Furthermore, a GM common dividend is possible (in 2014) once the UST exits its position. RBC Purchasing Intentions Index 0.16 0.17 0.18 0.19 0.20 0.21 0.22 0.23 0.24 May- 12 Aug- 12 Nov- 12 Feb- 13 May- 13 Aug- 13 Index Source: RBC Capital Markets Macro Impact on Vehicle Purchasing Intention Decreased 13% Neither increased nor decreased 83% Increased 4% Source: RBC Capital Markets Macro Impact Diffusion Index - 19% - 17% - 15% - 13% - 11% -9% -7% -5% Aug- 12 Nov- 12 Feb- 13 May- 13 Aug- 13 Diffusion (Increased-Decreased) Source: RBC Capital Markets Priced as of prior trading day's market close, EST (unless otherwise noted). All values in USD unless otherwise noted. For Required Conflicts Disclosures, see Page 14. [email protected] FIRST LAST 08/18/13 12:45:37 PM Hong Kong Highpower
Transcript
EQU
ITY
RESE
ARC
H RBC Capital Markets, LLCJoseph Spak, CFA (Analyst)(212) [email protected]
Autos and Auto Parts: RBCAutomotive Consumer SurveyVol. 6: Survey Supports Positive Full-Year ViewWe recently conducted our quarterly proprietary survey of 456 likely newvehicle purchasers. Our key insights are as follows:
• Purchasing Intentions support our next 12-month SAAR view. OurPurchasing Intentions Index was fairly level in August versus May. Webelieve our survey results support our view for a 2H13 SAAR in the mid-to-high 15mm range. Recent retail strength (July 2013 at 13.7mm retailSAAR, +19% y/y) also supports this view.
• Macro not having impact on vehicle purchase decision. Our diffusionindex (macro has increased intentions minus decreased intentions)improved again in August 2013 vs. May 2013, implying that consumersare increasingly comfortable with a still subdued economic environmentand willing to purchase a new vehicle if needed.
• High level of uncertainty among buyers remains; share up for grabs.Consumers who are looking to purchase a new vehicle remain relativelyundecided. Thirty-seven percent of respondents indicated that theyhaven’t made a decision yet, down from a high of 39% in May but still up6pp from February. In our view, this could allow GM, which is refreshinga significant portion of its portfolio, to gain share.
• Chevy and Dodge saw higher "consideration" scores. We view“consideration” as a good proxy for showroom activity. In our view,sustainably improved consideration/showroom traffic eventually yieldshigher conversion (purchasing intentions) and share gains. Chevy scoredwell, which is supportive of our bullish GM stance.
• Potential near-term share gainers: Ford, Chevy, Nissan. All sawimprovements in the “intention to buy metric” in August 2013 vs. May2013. Nissan improvement coincided with MSRP cuts. VW and Hyundaiare potential near-term share losers.
• Old age of vehicle and improved fuel efficiency top considerations. Oldage of current vehicle is still the predominant reason for new purchaseand supports pent-up demand argument. Looking for improved fuelefficiency is the second most popular reason.
• Price becoming a more important feature? Performance/drivingqualities (27% of respondents) were listed as the most importantfeature. Price was a close second at 25%, but up from low 20's all yearlong. This could be a sign that more aggressive pricing will be neededgoing forward. Fuel efficiency was third.
• Segments: Small car and midsize sedan segment interest stepped backmodestly. We saw sequential improvement in pickups, CUVs, and SUVsin the month.
Stocks: We continue to favor GM over Ford given the earnings accelerationand upside we see at GM over the next few years. We expect the currentvaluation gap (almost 1 turn on 2014 EBITDAP) to begin to dissipate overthe next 2–3 quarters as improved GMs come through. Furthermore, aGM common dividend is possible (in 2014) once the UST exits its position.
RBC Purchasing Intentions Index
0.16
0.17
0.18
0.19
0.20
0.21
0.22
0.23
0.24
May- 12 Aug- 12 Nov- 12 Feb- 13 May- 13 Aug- 13
Index
Source: RBC Capital Markets
Macro Impact on Vehicle Purchasing Intention
Decreased
13%
Neither
increased
nor
decreased
83%
Increased
4%
Source: RBC Capital Markets
Macro Impact Diffusion Index
- 19%
- 17%
- 15%
- 13%
- 11%
- 9%
- 7%
- 5%
Aug- 12 Nov- 12 Feb- 13 May- 13 Aug- 13
Dif
fusi
on (
Incr
ease
d-D
ecre
ased
)
Source: RBC Capital Markets
Priced as of prior trading day's market close, EST (unless otherwise noted).All values in USD unless otherwise noted.
For Required Conflicts Disclosures, see Page [email protected] FIRST LAST 08/18/13 12:45:37 PM Hong Kong Highpower
Industry & Macro Insights Purchasing Intentions Survey Supports Our 2013 View Our Purchasing Intentions Index was fairly level in August versus May. We believe our survey results support our view for a 2H13 SAAR in the mid-to-high 15mm range. Recent retail strength (13.7mm July retail SAAR, +19% y/y) also supports this outlook. After 14.5mm (+13% y/y) vehicles sold in the US in 2012, we expect 15.5mm (+7% y/y) vehicles to be sold in 2013. While we are clearly through the larger part of the recovery in the US, we still expect modest growth over the next couple of years on the back of pent-up demand, new models, and cheap/available credit back to a ~16–16.5mm trendline.
Exhibit 1: RBC Purchasing Intentions Index
0.16
0.17
0.18
0.19
0.20
0.21
0.22
0.23
0.24
May-12 Aug-12 Nov-12 Feb-13 May-13 Aug-13
Index
Source: RBC Capital Markets
Exhibit 2: US Sales, 1967–2015E
8
9
10
11
12
13
14
15
16
17
18
1967
1968
1969
1970
1971
1972
1973
1974
1975
1976
1977
1978
1979
1980
1981
1982
1983
1984
1985
1986
1987
1988
1989
1990
1991
1992
1993
1994
1995
1996
1997
1998
1999
2000
2001
2002
2003
2004
2005
2006
2007
2008
2009
2010
2011
2012
2013E
2014E
2015E
US
Sale
s (m
m)
-25%
-20%
-15%
-10%
-5%
0%
5%
10%
15%
20%
25%
y/y
US Sales y/y Source: BEA, Autodata, RBC Capital Markets
In total, 22.6% of respondents indicated that they were either extremely likely, very likely, or moderately likely to purchase a new vehicle in the next 12 months (down slightly from 22.9% in May). Weighting the probabilities (100% for extremely likely, 75% for very likely) and applying that percentage to the light vehicle universe (~240mm vehicles in the U.S. divided by ~1.9 vehicles per household) would yield annual sales of 11.6mm. It would take only approximately 25% of those respondents who stated they are moderately likely to purchase a vehicle to actually purchase a vehicle in order to achieve a sales rate of 15.5mm and 30% to get to the high 15’s, which is the rate we expect in 2H13 into 2014. As the question is defined, “moderately likely to purchase” implies a 50% chance of purchase.
August 13, 2013 2
Autos and Auto Parts: RBC Automotive Consumer Survey
[email protected] FIRST LAST 08/18/13 12:45:37 PM Hong Kong Highpower
Exhibit 3: How likely are you to purchase a new automobile (not used) in the next 12 months?
August 2013
Not at all
likely
60%
Slightly likely
17%
Moderately
likely
12%
Very likely
6%
Extremely
likely
5%
May 2013
Extremely
likely
5%Very likely
6%
Moderately
likely
12%
Slightly likely
19%
Not at all
likely
58%
Source: RBC Capital Markets
Macro Not Having Impact on Vehicle Purchase Decision Eighty-three percent of respondents stated that recent economic headlines in the U.S. have not changed their likelihood of purchasing a vehicle in the next 12 months. Four percent stated that the macro has increased their purchasing intentions while 13% stated that it decreased their purchasing intentions. Our diffusion index (increased intentions minus decreased intentions) was essentially flat in August 2013 vs. May 2013. A more benign macro environment supports increased consumer confidence and our full-year sales outlook (with bias to upside).
Exhibit 4: Have recent U.S. economic headlines increased or decreased your likelihood to purchase a vehicle in the next 12 months?
Decreased
13%
Neither
increased
nor
decreased
83%
Increased
4%
Source: RBC Capital Markets
Exhibit 5: Impact of Macro Headlines on Purchasing Decision Diffusion Index Improved Modestly in August
-19%
-17%
-15%
-13%
-11%
-9%
-7%
-5%
Aug-12 Nov-12 Feb-13 May-13 Aug-13
Dif
fusio
n (
Increased-D
ecreased)
Source: RBC Capital Markets
August 13, 2013 3
Autos and Auto Parts: RBC Automotive Consumer Survey
[email protected] FIRST LAST 08/18/13 12:45:37 PM Hong Kong Highpower
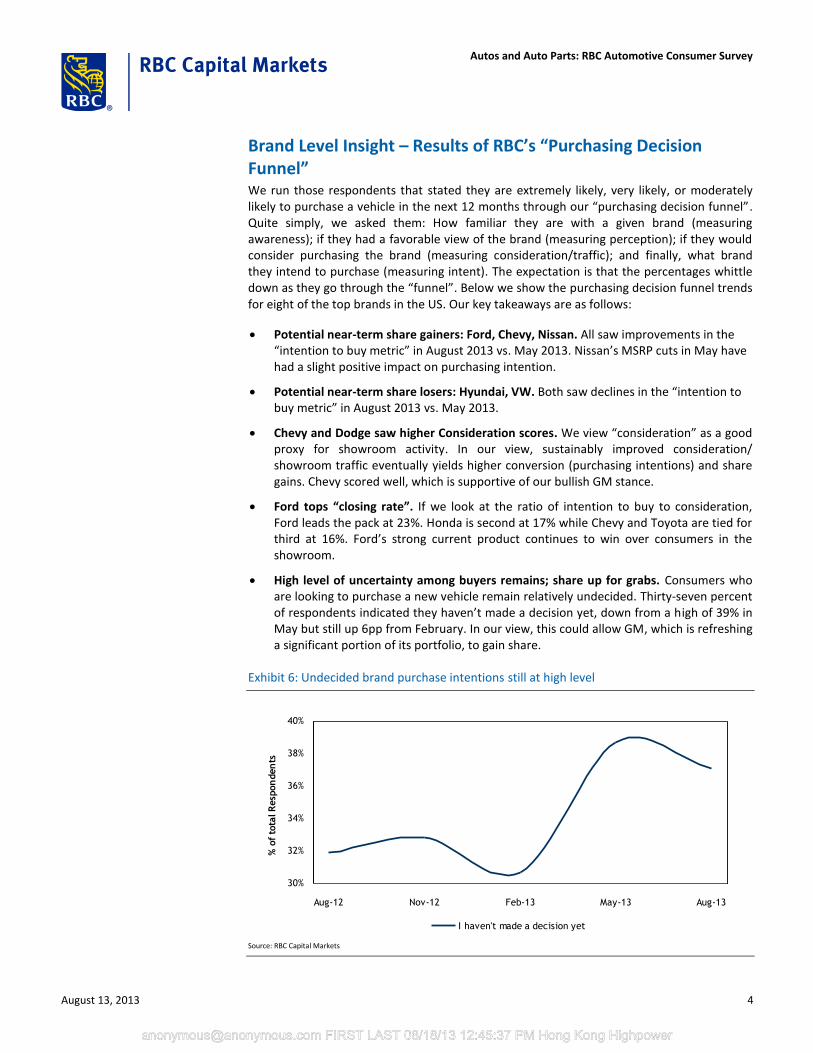
Brand Level Insight – Results of RBC’s “Purchasing Decision Funnel” We run those respondents that stated they are extremely likely, very likely, or moderately likely to purchase a vehicle in the next 12 months through our “purchasing decision funnel”. Quite simply, we asked them: How familiar they are with a given brand (measuring awareness); if they had a favorable view of the brand (measuring perception); if they would consider purchasing the brand (measuring consideration/traffic); and finally, what brand they intend to purchase (measuring intent). The expectation is that the percentages whittle down as they go through the “funnel”. Below we show the purchasing decision funnel trends for eight of the top brands in the US. Our key takeaways are as follows:
Potential near-term share gainers: Ford, Chevy, Nissan. All saw improvements in the “intention to buy metric” in August 2013 vs. May 2013. Nissan’s MSRP cuts in May have had a slight positive impact on purchasing intention.
Potential near-term share losers: Hyundai, VW. Both saw declines in the “intention to buy metric” in August 2013 vs. May 2013.
Chevy and Dodge saw higher Consideration scores. We view “consideration” as a good proxy for showroom activity. In our view, sustainably improved consideration/ showroom traffic eventually yields higher conversion (purchasing intentions) and share gains. Chevy scored well, which is supportive of our bullish GM stance.
Ford tops “closing rate”. If we look at the ratio of intention to buy to consideration, Ford leads the pack at 23%. Honda is second at 17% while Chevy and Toyota are tied for third at 16%. Ford’s strong current product continues to win over consumers in the showroom.
High level of uncertainty among buyers remains; share up for grabs. Consumers who are looking to purchase a new vehicle remain relatively undecided. Thirty-seven percent of respondents indicated they haven’t made a decision yet, down from a high of 39% in May but still up 6pp from February. In our view, this could allow GM, which is refreshing a significant portion of its portfolio, to gain share.
Exhibit 6: Undecided brand purchase intentions still at high level
30%
32%
34%
36%
38%
40%
Aug-12 Nov-12 Feb-13 May-13 Aug-13
% o
f to
tal R
esp
on
den
ts
I haven't made a decision yet
Source: RBC Capital Markets
August 13, 2013 4
Autos and Auto Parts: RBC Automotive Consumer Survey
[email protected] FIRST LAST 08/18/13 12:45:37 PM Hong Kong Highpower
Exhibit 7: RBC Purchasing Decision Funnel Trends – Mass Brands
Ford
0%
10%
20%
30%
40%
50%
60%
70%
80%
Familiarity Favorability Consideration Intention
Aug-12 Nov-12 Feb-13 May-13 Aug-13
Chevy
0%
10%
20%
30%
40%
50%
60%
70%
Familiarity Favorability Consideration Intention
Aug-12 Nov-12 Feb-13 May-13 Aug-13
Toyota
0%
10%
20%
30%
40%
50%
60%
70%
80%
Familiarity Favorability Consideration Intention
Aug-12 Nov-12 Feb-13 May-13 Aug-13
Honda
0%
10%
20%
30%
40%
50%
60%
70%
Familiarity Favorability Consideration Intention
Aug-12 Nov-12 Feb-13 May-13 Aug-13
Nissan
0%
10%
20%
30%
40%
50%
60%
Familiarity Favorability Consideration Intention
Aug-12 Nov-12 Feb-13 May-13 Aug-13
Dodge
0%
5%
10%
15%
20%
25%
30%
35%
40%
45%
50%
Familiarity Favorability Consideration Intention
Aug-12 Nov-12 Feb-13 May-13 Aug-13
Hyundai
0%
5%
10%
15%
20%
25%
30%
35%
40%
45%
Familiarity Favorability Consideration Intention
Aug-12 Nov-12 Feb-13 May-13 Aug-13
Volkswagen
0%
10%
20%
30%
40%
50%
60%
Familiarity Favorability Consideration Intention
Aug-12 Nov-12 Feb-13 May-13 Aug-13
Source: RBC Capital Markets
August 13, 2013 5
Autos and Auto Parts: RBC Automotive Consumer Survey
[email protected] FIRST LAST 08/18/13 12:45:37 PM Hong Kong Highpower
Exhibit 8: “Closing” Score – Ratio of Intention to Buy/Consideration
0%
5%
10%
15%
20%
25%
Ford Honda Chevy Toyota Nissan Dodge Hyundai VW
Inte
nti
on/C
onsi
dera
tion
Source: RBC Capital Markets
We also take a closer look at Ford’s and GM’s luxury brands, Lincoln and Cadillac, respectively. In our view, both brands face an uphill battle in the US luxury segment, as evidenced by their intention to buy scores (Lincoln more so than Cadillac). While it’s early stages, we did see continued higher consideration for GM’s Cadillac brand (third consecutive increase). Concerning Lincoln, it saw a tick-up in favorability this month, while consideration is unchanged. This hasn’t yet translated into stronger intentions for either brand—unchanged vs. prior survey.
August 13, 2013 6
Autos and Auto Parts: RBC Automotive Consumer Survey
[email protected] FIRST LAST 08/18/13 12:45:37 PM Hong Kong Highpower
Autos and Auto Parts: RBC Automotive Consumer Survey
[email protected] FIRST LAST 08/18/13 12:45:37 PM Hong Kong Highpower
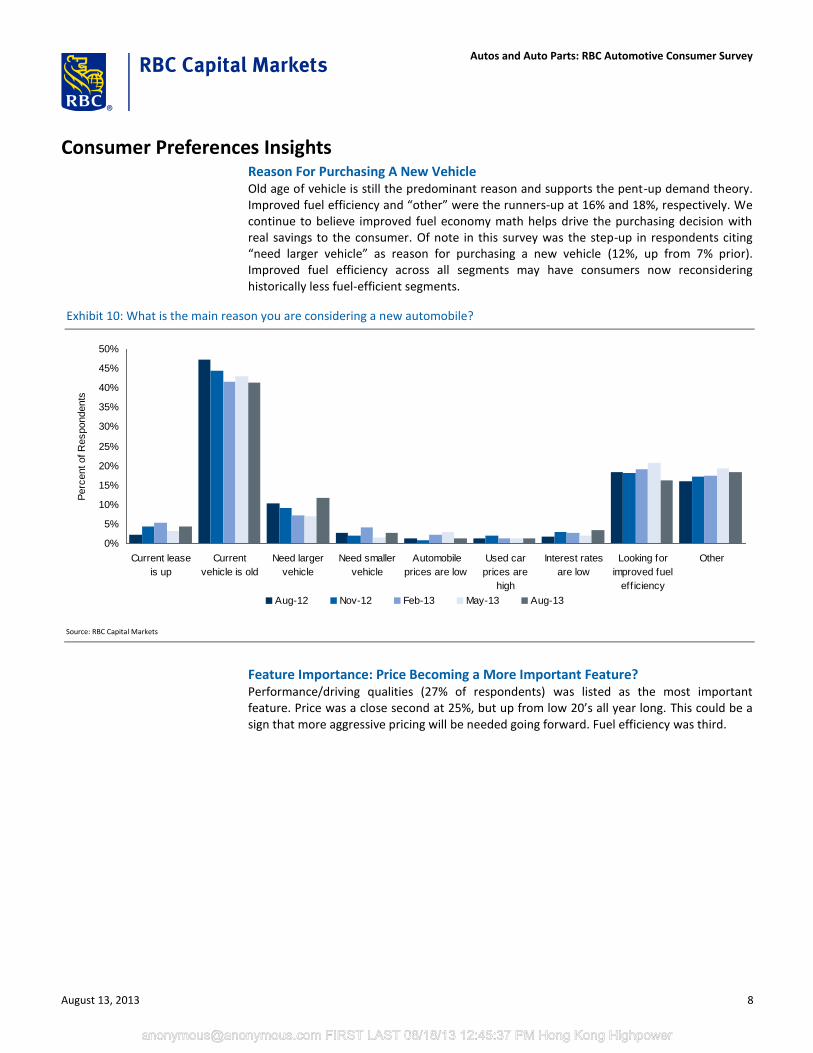
Consumer Preferences Insights Reason For Purchasing A New Vehicle Old age of vehicle is still the predominant reason and supports the pent-up demand theory. Improved fuel efficiency and “other” were the runners-up at 16% and 18%, respectively. We continue to believe improved fuel economy math helps drive the purchasing decision with real savings to the consumer. Of note in this survey was the step-up in respondents citing “need larger vehicle” as reason for purchasing a new vehicle (12%, up from 7% prior). Improved fuel efficiency across all segments may have consumers now reconsidering historically less fuel-efficient segments.
Exhibit 10: What is the main reason you are considering a new automobile?
0%
5%
10%
15%
20%
25%
30%
35%
40%
45%
50%
Current lease
is up
Current
vehicle is old
Need larger
vehicle
Need smaller
vehicle
Automobile
prices are low
Used car
prices are
high
Interest rates
are low
Looking for
improved fuel
eff iciency
Other
Perc
ent of R
espondents
Aug-12 Nov-12 Feb-13 May-13 Aug-13
Source: RBC Capital Markets
Feature Importance: Price Becoming a More Important Feature? Performance/driving qualities (27% of respondents) was listed as the most important feature. Price was a close second at 25%, but up from low 20’s all year long. This could be a sign that more aggressive pricing will be needed going forward. Fuel efficiency was third.
August 13, 2013 8
Autos and Auto Parts: RBC Automotive Consumer Survey
[email protected] FIRST LAST 08/18/13 12:45:37 PM Hong Kong Highpower
Exhibit 11: Which feature is most important when considering an automobile purchase?
0%
5%
10%
15%
20%
25%
30%
Price
Fuel e
ffic
iency
Bra
nd
Exte
rior
appeara
nce
Inte
rior
appeara
nce
Safe
ty
Perf
orm
ance/d
rivin
g
qualit
ies
Oth
er
Aug-12 Nov-12 Feb-13May-13 Aug-13
Source: RBC Capital Markets
….That said, consumers still highly value fuel efficiency and continue to pursue more fuel-efficient powertrains, including engine downsizing, but want a payback under three years.
Exhibit 12: Do you plan to choose a more fuel-efficient vehicle when you make your purchase?
0%
5%
10%
15%
20%
25%
30%
35%
No Yes, w ill go
from a 8-
cylinder to
6-cylinder
Yes, w ill go
from a 6-
cylinder to
a 4-cylinder
Yes, w ill
sw itch
from gas to
diesel
Yes, w ill
sw itch to a
hybrid or
electric
vehicle
I already
have a fuel
eff icient
vehicle
I don’t
know
Aug-12 Nov-12 Feb-13
May-13 Aug-13
Source: RBC Capital Markets
August 13, 2013 9
Autos and Auto Parts: RBC Automotive Consumer Survey
[email protected] FIRST LAST 08/18/13 12:45:37 PM Hong Kong Highpower
Exhibit 13: How long of a payback period (recouping price premium) would you require to consider purchasing a more fuel-efficient powertrain (e.g., hybrid, diesel, electric)?
0%
5%
10%
15%
20%
25%
30%
35%
40%
45%
Would not
consider
Under 3
years
4 years 5 years 6 years 7 years 8+ years
Perc
ent
of
Resp
ondents
Nov-12 Feb-13 May-13 Aug-13
Source: RBC Capital Markets
Segments: Uptick in Pickups, CUVS, SUVs Demand for smaller, more fuel-efficient vehicles will continue to be a mix headwind for automakers. Small car and midsize sedan segment interest stepped back modestly. We saw sequential improvement in pickups, CUVs, and SUVs in the month. This is consistent with the “need larger vehicle” response from above.
Exhibit 14: Which automobile category are you considering purchasing?
0%
5%
10%
15%
20%
25%
30%
35%
40%
45%
Sm
all
car
Mid
siz
e s
edan
Sm
all
pic
kup
Fulls
ize p
ickup
Sm
all
cro
ssover/
SU
V
Mid
-siz
e
cro
ssover/
SU
V
Full-
siz
e S
UV
Min
ivan
Oth
er
Whic
h a
uto
mobile
cate
gory
are
you c
onsid
ering
purc
hasin
g?
Aug-12 Nov-12 Feb-13 May-13 Aug-13
Source: RBC Capital Markets
August 13, 2013 10
Autos and Auto Parts: RBC Automotive Consumer Survey
[email protected] FIRST LAST 08/18/13 12:45:37 PM Hong Kong Highpower
Appendix Exhibit 15: How would you describe your credit quality?
0%
5%
10%
15%
20%
25%
30%
35%
40%
45%
Excellent Very Good Good Fair Poor
Perc
ent
of
Resp
ondents
Aug-12 Nov-12 Feb-13 May-13 Aug-13
Source: RBC Capital Markets
Exhibit 16: Compared to one year ago, do you believe it is easier to be approved for an auto loan?
47% 47% 48%54% 52%
54% 54% 52%46% 48%
0%
10%
20%
30%
40%
50%
60%
70%
80%
90%
100%
Aug-12 Nov-12 Feb-13 May-13 Aug-13
Yes No
Source: RBC Capital Markets
August 13, 2013 11
Autos and Auto Parts: RBC Automotive Consumer Survey
[email protected] FIRST LAST 08/18/13 12:45:37 PM Hong Kong Highpower
Exhibit 17: What model year is your current automobile?
0%
1%
2%
3%
4%
5%
6%
7%
8%
9%
10%
2013
2012
2011
2010
2009
2008
2007
2006
2005
2004
2003
2002
2001
2000
1999
1998
1997
1996
1995
pre
-1995
Perc
ent of R
espondents
Aug-12 Nov-12 Feb-13 May-13 Aug-13
Source: RBC Capital Markets
Note the “hole” in 2009 model year vehicles above.
Exhibit 18: Have recent gas prices impacted the type of vehicle you plan on purchasing?
0%
10%
20%
30%
40%
50%
60%
70%
80%
No Yes, plan on switching
from truck/SUV to
passenger car
Yes, plan on switching
from truck/SUV to
crossover
Yes, other
Perc
ent
of
Resp
ondents
Aug-12 Nov-12 Feb-13 May-13 Aug-13
Source: RBC Capital Markets
Methodology and Demographics of Our Survey Respondents We have conducted an extensive proprietary survey that aims to identify key purchasing intentions among those who may purchase an automobile within the next 12 months. The survey ran for a week of consecutive days in the last week of July. We collected 2,130 responses and this is the approximate sample size for any question about current ownership. Any question that delved into purchasing intentions (which we limited to extremely likely,
August 13, 2013 12
Autos and Auto Parts: RBC Automotive Consumer Survey
[email protected] FIRST LAST 08/18/13 12:45:37 PM Hong Kong Highpower
very likely, or moderately likely) was from a sample size of 456 individuals. We received responses from all 50 states and Washington, D.C.
Exhibit 19: Survey Demographics of Total Respondents and Respondents Who May Purchase a Vehicle in Next 12 Months
Gender Total
Likely To
Purchase Age Total
Likely To
Purchase Education Total
Likely To
Purchase Household Income Total
Likely To
Purchase
Male 50.6% 53.3% < 18 0.0% 0.0% Less than high school degree 0.9% 0.7% Less than $20,000 15.9% 4.6%
Female 49.4% 46.7% 18-29 20.6% 16.6% High school degree 8.0% 8.6% $20,000 to $49,999 16.5% 15.6%
30-44 28.7% 29.2% Some college 25.5% 25.9% $50,000 to $99,999 33.9% 34.0%
45-60 31.3% 34.7% Associate or bachelor degree 38.7% 35.8% $100,000 to $149,999 18.4% 25.2%
> 60 19.4% 19.5% Graduate degree 27.0% 29.0% $150,000 or More 15.4% 20.6% Source: RBC Capital Markets
August 13, 2013 13
Autos and Auto Parts: RBC Automotive Consumer Survey
[email protected] FIRST LAST 08/18/13 12:45:37 PM Hong Kong Highpower
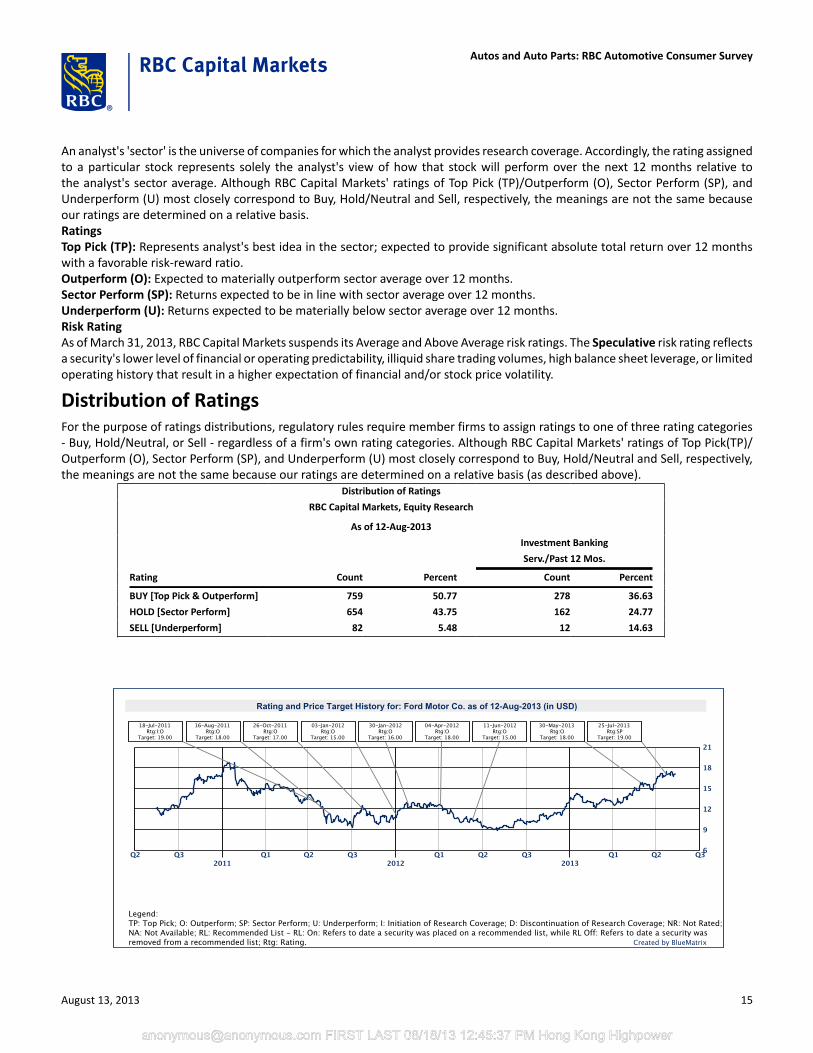
Companies MentionedFord Motor Co. (NYSE: F; $17.07; Sector Perform)General Motors Company (NYSE: GM; $35.98; Outperform)
Required DisclosuresConflicts DisclosuresThe analyst(s) responsible for preparing this research report received compensation that is based upon various factors, includingtotal revenues of the member companies of RBC Capital Markets and its affiliates, a portion of which are or have been generatedby investment banking activities of the member companies of RBC Capital Markets and its affiliates.
A member company of RBC Capital Markets or one of its affiliates managed or co-managed a public offering of securities for FordMotor Co. in the past 12 months.
A member company of RBC Capital Markets or one of its affiliates received compensation for investment banking services fromFord Motor Co. in the past 12 months.
RBC Capital Markets, LLC makes a market in the securities of Ford Motor Co..
A member company of RBC Capital Markets or one of its affiliates received compensation for products or services other thaninvestment banking services from Ford Motor Co. during the past 12 months. During this time, a member company of RBC CapitalMarkets or one of its affiliates provided non-investment banking securities-related services to Ford Motor Co..
A member company of RBC Capital Markets or one of its affiliates received compensation for products or services other thaninvestment banking services from Ford Motor Co. during the past 12 months. During this time, a member company of RBC CapitalMarkets or one of its affiliates provided non-securities services to Ford Motor Co..
RBC Capital Markets is currently providing Ford Motor Co. with non-securities services.
RBC Capital Markets has provided Ford Motor Co. with investment banking services in the past 12 months.
RBC Capital Markets has provided Ford Motor Co. with non-investment banking securities-related services in the past 12 months.
RBC Capital Markets has provided Ford Motor Co. with non-securities services in the past 12 months.
RBC Capital Markets, LLC makes a market in the securities of General Motors Company.
A member company of RBC Capital Markets or one of its affiliates received compensation for products or services other thaninvestment banking services from General Motors Company during the past 12 months. During this time, a member companyof RBC Capital Markets or one of its affiliates provided non-investment banking securities-related services to General MotorsCompany.
A member company of RBC Capital Markets or one of its affiliates received compensation for products or services other thaninvestment banking services from General Motors Company during the past 12 months. During this time, a member company ofRBC Capital Markets or one of its affiliates provided non-securities services to General Motors Company.
RBC Capital Markets is currently providing General Motors Company with non-investment banking securities-related services.
RBC Capital Markets is currently providing General Motors Company with non-securities services.
RBC Capital Markets has provided General Motors Company with non-investment banking securities-related services in the past12 months.
RBC Capital Markets has provided General Motors Company with non-securities services in the past 12 months.
The author is employed by RBC Capital Markets, LLC, a securities broker-dealer with principal offices located in New York, USA.
Explanation of RBC Capital Markets Equity Rating SystemAugust 13, 2013 14
Autos and Auto Parts: RBC Automotive Consumer Survey
[email protected] FIRST LAST 08/18/13 12:45:37 PM Hong Kong Highpower
An analyst's 'sector' is the universe of companies for which the analyst provides research coverage. Accordingly, the rating assignedto a particular stock represents solely the analyst's view of how that stock will perform over the next 12 months relative tothe analyst's sector average. Although RBC Capital Markets' ratings of Top Pick (TP)/Outperform (O), Sector Perform (SP), andUnderperform (U) most closely correspond to Buy, Hold/Neutral and Sell, respectively, the meanings are not the same becauseour ratings are determined on a relative basis.RatingsTop Pick (TP): Represents analyst's best idea in the sector; expected to provide significant absolute total return over 12 monthswith a favorable risk-reward ratio.Outperform (O): Expected to materially outperform sector average over 12 months.Sector Perform (SP): Returns expected to be in line with sector average over 12 months.Underperform (U): Returns expected to be materially below sector average over 12 months.Risk RatingAs of March 31, 2013, RBC Capital Markets suspends its Average and Above Average risk ratings. The Speculative risk rating reflectsa security's lower level of financial or operating predictability, illiquid share trading volumes, high balance sheet leverage, or limitedoperating history that result in a higher expectation of financial and/or stock price volatility.
Distribution of RatingsFor the purpose of ratings distributions, regulatory rules require member firms to assign ratings to one of three rating categories- Buy, Hold/Neutral, or Sell - regardless of a firm's own rating categories. Although RBC Capital Markets' ratings of Top Pick(TP)/Outperform (O), Sector Perform (SP), and Underperform (U) most closely correspond to Buy, Hold/Neutral and Sell, respectively,the meanings are not the same because our ratings are determined on a relative basis (as described above).
Distribution of Ratings
RBC Capital Markets, Equity Research
As of 12-Aug-2013
Investment Banking
Serv./Past 12 Mos.
Rating Count Percent Count Percent
BUY [Top Pick & Outperform] 759 50.77 278 36.63
HOLD [Sector Perform] 654 43.75 162 24.77
SELL [Underperform] 82 5.48 12 14.63
August 13, 2013 15
Autos and Auto Parts: RBC Automotive Consumer Survey
[email protected] FIRST LAST 08/18/13 12:45:37 PM Hong Kong Highpower
References to a Recommended List in the recommendation history chart may include one or more recommended lists or modelportfolios maintained by a business unit of the Wealth Management Division of RBC Capital Markets, LLC. These RecommendedLists include a former list called the Prime Opportunity List (RL 3), the Guided Portfolio: Prime Income (RL 6), the Guided Portfolio:Large Cap (RL 7), Guided Portfolio: Dividend Growth (RL 8), the Guided Portfolio: Midcap 111 (RL9), and the Guided Portfolio: ADR(RL 10). The abbreviation 'RL On' means the date a security was placed on a Recommended List. The abbreviation 'RL Off' meansthe date a security was removed from a Recommended List.
Conflicts PolicyRBC Capital Markets Policy for Managing Conflicts of Interest in Relation to Investment Research is available from us on request.To access our current policy, clients should refer tohttps://www.rbccm.com/global/file-414164.pdfor send a request to RBC Capital Markets Research Publishing, P.O. Box 50, 200 Bay Street, Royal Bank Plaza, 29th Floor, SouthTower, Toronto, Ontario M5J 2W7. We reserve the right to amend or supplement this policy at any time.
Dissemination of Research and Short-Term Trade IdeasRBC Capital Markets endeavors to make all reasonable efforts to provide research simultaneously to all eligible clients, havingregard to local time zones in overseas jurisdictions. RBC Capital Markets' research is posted to our proprietary websites to ensureeligible clients receive coverage initiations and changes in ratings, targets and opinions in a timely manner. Additional distributionmay be done by the sales personnel via email, fax or regular mail. Clients may also receive our research via third-party vendors.Please contact your investment advisor or institutional salesperson for more information regarding RBC Capital Markets' research.RBC Capital Markets also provides eligible clients with access to SPARC on its proprietary INSIGHT website. SPARC contains marketcolor and commentary, and may also contain Short-Term Trade Ideas regarding the securities of subject companies discussed in thisor other research reports. SPARC may be accessed via the following hyperlink: https://www.rbcinsight.com. A Short-Term TradeIdea reflects the research analyst's directional view regarding the price of the security of a subject company in the coming days orweeks, based on market and trading events. A Short-Term Trade Idea may differ from the price targets and/or recommendationsin our published research reports reflecting the research analyst's views of the longer-term (one year) prospects of the subjectcompany, as a result of the differing time horizons, methodologies and/or other factors. Thus, it is possible that the securityof a subject company that is considered a long-term 'Sector Perform' or even an 'Underperform' might be a short-term buyingopportunity as a result of temporary selling pressure in the market; conversely, the security of a subject company that is rateda long-term 'Outperform' could be considered susceptible to a short-term downward price correction. Short-Term Trade Ideasare not ratings, nor are they part of any ratings system, and RBC Capital Markets generally does not intend, nor undertakes anyobligation, to maintain or update Short-Term Trade Ideas. Short-Term Trade Ideas discussed in SPARC may not be suitable for all
August 13, 2013 16
Autos and Auto Parts: RBC Automotive Consumer Survey
[email protected] FIRST LAST 08/18/13 12:45:37 PM Hong Kong Highpower
investors and have not been tailored to individual investor circumstances and objectives, and investors should make their ownindependent decisions regarding any Short-Term Trade Ideas discussed therein.
Analyst CertificationAll of the views expressed in this report accurately reflect the personal views of the responsible analyst(s) about any and all ofthe subject securities or issuers. No part of the compensation of the responsible analyst(s) named herein is, or will be, directly orindirectly, related to the specific recommendations or views expressed by the responsible analyst(s) in this report.
The Global Industry Classification Standard (“GICS”) was developed by and is the exclusive property and a service mark of MSCI Inc. (“MSCI”) and Standard & Poor’s Financial ServicesLLC (“S&P”) and is licensed for use by RBC. Neither MSCI, S&P, nor any other party involved in making or compiling the GICS or any GICS classifications makes any express or impliedwarranties or representations with respect to such standard or classification (or the results to be obtained by the use thereof), and all such parties hereby expressly disclaim all warrantiesof originality, accuracy, completeness, merchantability and fitness for a particular purpose with respect to any of such standard or classification. Without limiting any of the foregoing,in no event shall MSCI, S&P, any of their affiliates or any third party involved in making or compiling the GICS or any GICS classifications have any liability for any direct, indirect, special,punitive, consequential or any other damages (including lost profits) even if notified of the possibility of such damages.
Disclaimer
RBC Capital Markets is the business name used by certain branches and subsidiaries of the Royal Bank of Canada, including RBC Dominion Securities Inc., RBCCapital Markets, LLC, RBC Europe Limited, RBC Capital Markets (Hong Kong) Limited, Royal Bank of Canada, Hong Kong Branch and Royal Bank of Canada, SydneyBranch. The information contained in this report has been compiled by RBC Capital Markets from sources believed to be reliable, but no representation or warranty,express or implied, is made by Royal Bank of Canada, RBC Capital Markets, its affiliates or any other person as to its accuracy, completeness or correctness. Allopinions and estimates contained in this report constitute RBC Capital Markets' judgement as of the date of this report, are subject to change without notice andare provided in good faith but without legal responsibility. Nothing in this report constitutes legal, accounting or tax advice or individually tailored investmentadvice. This material is prepared for general circulation to clients and has been prepared without regard to the individual financial circumstances and objectives ofpersons who receive it. The investments or services contained in this report may not be suitable for you and it is recommended that you consult an independentinvestment advisor if you are in doubt about the suitability of such investments or services. This report is not an offer to sell or a solicitation of an offer to buyany securities. Past performance is not a guide to future performance, future returns are not guaranteed, and a loss of original capital may occur. RBC CapitalMarkets research analyst compensation is based in part on the overall profitability of RBC Capital Markets, which includes profits attributable to investment bankingrevenues. Every province in Canada, state in the U.S., and most countries throughout the world have their own laws regulating the types of securities and otherinvestment products which may be offered to their residents, as well as the process for doing so. As a result, the securities discussed in this report may not beeligible for sale in some jurisdictions. RBC Capital Markets may be restricted from publishing research reports, from time to time, due to regulatory restrictions and/or internal compliance policies. If this is the case, the latest published research reports available to clients may not reflect recent material changes in the applicableindustry and/or applicable subject companies. RBC Capital Markets research reports are current only as of the date set forth on the research reports. This report isnot, and under no circumstances should be construed as, a solicitation to act as securities broker or dealer in any jurisdiction by any person or company that is notlegally permitted to carry on the business of a securities broker or dealer in that jurisdiction. To the full extent permitted by law neither RBC Capital Markets norany of its affiliates, nor any other person, accepts any liability whatsoever for any direct or consequential loss arising from any use of this report or the informationcontained herein. No matter contained in this document may be reproduced or copied by any means without the prior consent of RBC Capital Markets.
Additional information is available on request.
To U.S. Residents:This publication has been approved by RBC Capital Markets, LLC (member FINRA, NYSE, SIPC), which is a U.S. registered broker-dealer and which acceptsresponsibility for this report and its dissemination in the United States. Any U.S. recipient of this report that is not a registered broker-dealer or a bank acting ina broker or dealer capacity and that wishes further information regarding, or to effect any transaction in, any of the securities discussed in this report, shouldcontact and place orders with RBC Capital Markets, LLC.To Canadian Residents:This publication has been approved by RBC Dominion Securities Inc.(member IIROC). Any Canadian recipient of this report that is not a Designated Institution inOntario, an Accredited Investor in British Columbia or Alberta or a Sophisticated Purchaser in Quebec (or similar permitted purchaser in any other province) andthat wishes further information regarding, or to effect any transaction in, any of the securities discussed in this report should contact and place orders with RBCDominion Securities Inc., which, without in any way limiting the foregoing, accepts responsibility for this report and its dissemination in Canada.To U.K. Residents:This publication has been approved by RBC Europe Limited ('RBCEL') which is authorized by the Prudential Regulation Authority and regulated by the FinancialConduct Authority ('FCA') and the Prudential Regulation Authority, in connection with its distribution in the United Kingdom. This material is not for generaldistribution in the United Kingdom to retail clients, as defined under the rules of the FCA. However, targeted distribution may be made to selected retail clients ofRBC and its affiliates. RBCEL accepts responsibility for this report and its dissemination in the United Kingdom.To Persons Receiving This Advice in Australia:This material has been distributed in Australia by Royal Bank of Canada - Sydney Branch (ABN 86 076 940 880, AFSL No. 246521). This material has been preparedfor general circulation and does not take into account the objectives, financial situation or needs of any recipient. Accordingly, any recipient should, before acting onthis material, consider the appropriateness of this material having regard to their objectives, financial situation and needs. If this material relates to the acquisitionor possible acquisition of a particular financial product, a recipient in Australia should obtain any relevant disclosure document prepared in respect of that productand consider that document before making any decision about whether to acquire the product. This research report is not for retail investors as defined in section761G of the Corporations Act.To Hong Kong Residents:This publication is distributed in Hong Kong by RBC Investment Services (Asia) Limited, RBC Investment Management (Asia) Limited and RBC Capital Markets (HongKong) Limited, licensed corporations under the Securities and Futures Ordinance or, by the Royal Bank of Canada, Hong Kong Branch, a registered institution under
August 13, 2013 17
Autos and Auto Parts: RBC Automotive Consumer Survey
[email protected] FIRST LAST 08/18/13 12:45:37 PM Hong Kong Highpower
the Securities and Futures Ordinance. This material has been prepared for general circulation and does not take into account the objectives, financial situation,or needs of any recipient. Hong Kong persons wishing to obtain further information on any of the securities mentioned in this publication should contact RBCInvestment Services (Asia) Limited, RBC Investment Management (Asia) Limited, RBC Capital Markets (Hong Kong) Limited or Royal Bank of Canada, Hong KongBranch at 17/Floor, Cheung Kong Center, 2 Queen's Road Central, Hong Kong (telephone number is 2848-1388).To Singapore Residents:This publication is distributed in Singapore by the Royal Bank of Canada, Singapore Branch and Royal Bank of Canada (Asia) Limited, registered entities grantedoffshore bank and merchant bank status by the Monetary Authority of Singapore, respectively. This material has been prepared for general circulation and doesnot take into account the objectives, financial situation, or needs of any recipient. You are advised to seek independent advice from a financial adviser beforepurchasing any product. If you do not obtain independent advice, you should consider whether the product is suitable for you. Past performance is not indicativeof future performance. If you have any questions related to this publication, please contact the Royal Bank of Canada, Singapore Branch or Royal Bank of Canada(Asia) Limited.To Japanese Residents:Unless otherwise exempted by Japanese law, this publication is distributed in Japan by or through RBC Capital Markets (Japan) Ltd., a registered type one financialinstruments firm and/or Royal Bank of Canada, Tokyo Branch, a licensed foreign bank.