arXiv:cond-mat/0207731v1 [cond-mat.dis-nn] 31 Jul 2002 Avalanche Dynamics in Wet Granular Materials P. Tegzes, 1, 2 T. Vicsek, 2 and P. Schiffer 1 1 Department of Physics and Materials Research Institute, Pennsylvania State University, University Park PA 16802 2 Department of Biological Physics, E¨ otv¨osLor´ and University, 1A P´ azm´anys´ et´ any, Budapest, Hungary 1117 (Dated: November 15, 2018) A detailed characterization of avalanche dynamics of wet granular media in a rotating drum apparatus is presented. The results confirm the existence of the three wetness regimes observed previously: the granular, the correlated and the viscoplastic regime. These regimes show qualita- tively different dynamic behaviors which are reflected in all the investigated quantities. We discuss the effect of interstitial liquid on the characteristic angles of the material and on the avalanche size distribution. These data also reveal logarithmic aging and allow us to map out the phase diagram of the dynamical behavior as a function of liquid content and flow rate. Via quantitative measurements of the flow velocity and the granular flux during avalanches, we characterize novel avalanche types unique to wet media. We also explore the details of viscoplastic flow (observed at the highest liquid contents) in which there are lasting contacts during flow, leading to coherence across the entire sample. This coherence leads to a velocity independent flow depth at high rotation rates and novel robust pattern formation in the granular surface. PACS numbers: 45.70.-n, 45.70.Ht, 45.70.Mg INTRODUCTION While most research on the physics of granular media has focused on dry grains, the presence of even micro- scopic quantities of interstitial liquid can have profound effects on the physical behavior [1, 2, 3, 4, 5, 6, 7, 8, 9]. Capillary forces lead to cohesion which greatly enhances the stability of wet samples, and several recent stud- ies have investigated liquid induced effects on the static properties [2, 3, 4, 5, 6, 7]. In previous studies of the re- pose angle of wet granular media using a draining crater apparatus [10], we identified three fundamental regimes as a function of the liquid content. The granular regime at very low liquid contents is dominated by the motion of individual grains; in the correlated regime corresponding to intermediate liquid contents, a rough surface is formed by the flow of separated clumps; and the repose angle of very wet samples results from smooth, cohesive flow with viscoplastic properties. The addition of liquid also quali- tatively changes the dynamic behavior of granular media, as was observed qualitatively in our angle of repose mea- surements and also revealed in recent segregation studies [8, 9]. A quantitative characterization of the dynamics of wet granular flow, however, has thus far been miss- ing. In this paper we study the avalanche dynamics and flow properties of wet granular materials to investigate how the gradual addition of a small amount of liquid in- fluences the dynamic properties of granular surface flow, and we find that the three fundamental regimes observed earlier are also reflected in the present experiment. Some of the results presented here have been published else- where [11]. Granular surface flow occurs when the inclined surface of a granular medium loses its stability against gravita- tional force. There are several experimental methods to investigate such flow, e.g. by gradually tilting a granular sample, which leads to an avalanche when the surface an- gle exceeds a critical value θ max [12]. Alternatively, if the surface angle is close to θ max , avalanches can be triggered by point-like perturbations [13]. The inclination of the surface can also be increased by the addition of grains to the top of the pile [14, 15] or by slowly decreasing the size of the supporting base [16]. In our measurements we employ a rotating drum appa- ratus (a cylindrical chamber partly filled with a granular medium and rotated around a horizontal axis) [17, 18], which tilts the sample in a highly controlled and repro- ducible manner and offers several benefits. The most im- portant advantage of a rotating drum is that at low rota- tion rates it allows for the observation of many avalanches without the need to change the sample. After each avalanche the medium remains at rest relative to the drum while its surface angle is slowly increased by rota- tion, until it reaches θ max again. Then another avalanche occurs, and the process starts over. Thus it is possi- ble to record hundreds of avalanches, which is essential for performing a statistical analysis or for averaging out noise-like fluctuations in dynamical data. In addition to the avalanches observed at low rotations rates, the rotat- ing drum also allows the investigation of continuous flow down the slope at higher rotation rates. The sections of this paper cover different aspects of our rotating drum experiments. In Section we describe the experimental setup. Section addresses some issues ex- plored in previous studies of cohesive granular media in a rotating drum [6, 19, 20, 21], focussing on the surface angles of the medium before and after avalanches, and describing a statistical analysis of avalanche size based on these angles. In Section we investigate the transition
Transcript
arX
iv:c
ond-
mat
/020
7731
v1 [
cond
-mat
.dis
-nn]
31
Jul 2
002
Avalanche Dynamics in Wet Granular Materials
P. Tegzes,1, 2 T. Vicsek,2 and P. Schiffer1
1Department of Physics and Materials Research Institute,
Pennsylvania State University, University Park PA 168022Department of Biological Physics, Eotvos Lorand University, 1A Pazmany setany, Budapest, Hungary 1117
(Dated: November 15, 2018)
A detailed characterization of avalanche dynamics of wet granular media in a rotating drumapparatus is presented. The results confirm the existence of the three wetness regimes observedpreviously: the granular, the correlated and the viscoplastic regime. These regimes show qualita-tively different dynamic behaviors which are reflected in all the investigated quantities. We discussthe effect of interstitial liquid on the characteristic angles of the material and on the avalanche sizedistribution. These data also reveal logarithmic aging and allow us to map out the phase diagram ofthe dynamical behavior as a function of liquid content and flow rate. Via quantitative measurementsof the flow velocity and the granular flux during avalanches, we characterize novel avalanche typesunique to wet media. We also explore the details of viscoplastic flow (observed at the highest liquidcontents) in which there are lasting contacts during flow, leading to coherence across the entiresample. This coherence leads to a velocity independent flow depth at high rotation rates and novelrobust pattern formation in the granular surface.
PACS numbers: 45.70.-n, 45.70.Ht, 45.70.Mg
INTRODUCTION
While most research on the physics of granular mediahas focused on dry grains, the presence of even micro-scopic quantities of interstitial liquid can have profoundeffects on the physical behavior [1, 2, 3, 4, 5, 6, 7, 8, 9].Capillary forces lead to cohesion which greatly enhancesthe stability of wet samples, and several recent stud-ies have investigated liquid induced effects on the staticproperties [2, 3, 4, 5, 6, 7]. In previous studies of the re-pose angle of wet granular media using a draining craterapparatus [10], we identified three fundamental regimesas a function of the liquid content. The granular regime
at very low liquid contents is dominated by the motion ofindividual grains; in the correlated regime correspondingto intermediate liquid contents, a rough surface is formedby the flow of separated clumps; and the repose angle ofvery wet samples results from smooth, cohesive flow withviscoplastic properties. The addition of liquid also quali-tatively changes the dynamic behavior of granular media,as was observed qualitatively in our angle of repose mea-surements and also revealed in recent segregation studies[8, 9]. A quantitative characterization of the dynamics
of wet granular flow, however, has thus far been miss-ing. In this paper we study the avalanche dynamics andflow properties of wet granular materials to investigatehow the gradual addition of a small amount of liquid in-fluences the dynamic properties of granular surface flow,and we find that the three fundamental regimes observedearlier are also reflected in the present experiment. Someof the results presented here have been published else-where [11].
Granular surface flow occurs when the inclined surfaceof a granular medium loses its stability against gravita-
tional force. There are several experimental methods toinvestigate such flow, e.g. by gradually tilting a granularsample, which leads to an avalanche when the surface an-gle exceeds a critical value θmax [12]. Alternatively, if thesurface angle is close to θmax, avalanches can be triggeredby point-like perturbations [13]. The inclination of thesurface can also be increased by the addition of grains tothe top of the pile [14, 15] or by slowly decreasing thesize of the supporting base [16].
In our measurements we employ a rotating drum appa-ratus (a cylindrical chamber partly filled with a granularmedium and rotated around a horizontal axis) [17, 18],which tilts the sample in a highly controlled and repro-ducible manner and offers several benefits. The most im-portant advantage of a rotating drum is that at low rota-tion rates it allows for the observation of many avalancheswithout the need to change the sample. After eachavalanche the medium remains at rest relative to thedrum while its surface angle is slowly increased by rota-tion, until it reaches θmax again. Then another avalancheoccurs, and the process starts over. Thus it is possi-ble to record hundreds of avalanches, which is essentialfor performing a statistical analysis or for averaging outnoise-like fluctuations in dynamical data. In addition tothe avalanches observed at low rotations rates, the rotat-ing drum also allows the investigation of continuous flowdown the slope at higher rotation rates.
The sections of this paper cover different aspects of ourrotating drum experiments. In Section we describe theexperimental setup. Section addresses some issues ex-plored in previous studies of cohesive granular media ina rotating drum [6, 19, 20, 21], focussing on the surfaceangles of the medium before and after avalanches, anddescribing a statistical analysis of avalanche size basedon these angles. In Section we investigate the transition
between avalanches and continuous flow as a function ofthe liquid content, and map out the phase diagram ofthe system. Then a short section () is devoted to themorphology of the surface. In the rest of the paper wefocus on characterizing the dynamics of cohesive flow. InSection we quantitatively investigate the flow dynamicsduring avalanches at different liquid contents by analyz-ing the time evolution of the averaged surface profile ob-tained from hundreds of avalanche events. In Section weanalyze the dynamical properties of the continuous flowphase occurring at faster rotation. We pay special atten-tion to the nature of the viscoplastic flow, observed atthe highest liquid contents which displays unique charac-teristics associated with coherent motion over the entiregranular surface. In the final section we summarize anddiscuss our results.
DESCRIPTION OF THE APPARATUS
We studied glass spheres thoroughly mixed with smallquantities of hydrocarbon oil. The viscosity of the oilused was 0.27 poise, and its surface tension was 0.02N/m.The liquid content varied between τ = 0.001% and 5% ofthe void volume. In this regime the flow of oil due to grav-ity can be neglected. Measurements were performed onthree sizes of beads, with diameters d = 0.9mm± 11%,d = 0.5mm± 20% and d = 0.35mm± 15%. Note thethe beads differed not only in their size, but also pre-sumably in their microscopic surface structures, whichare difficult to characterize or control. Nonetheless, mostof the qualitative behavior is reproduced in the differentgrain samples, those differences which are significant arementioned below.
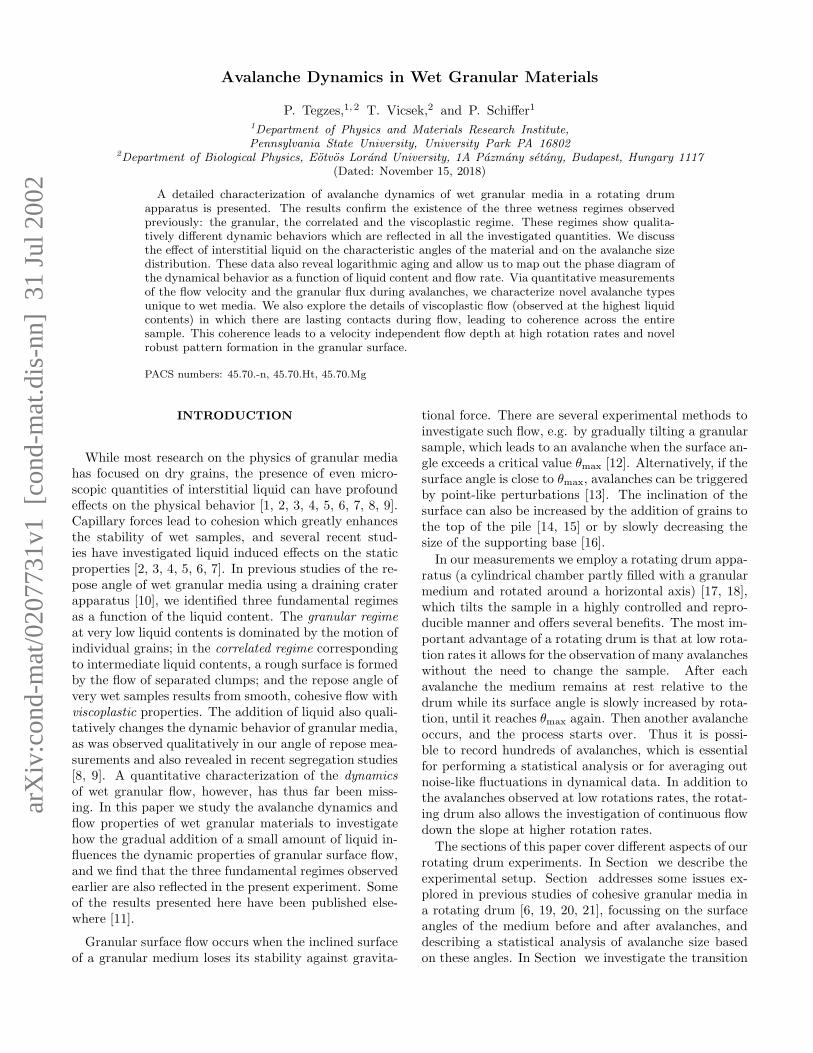
The rotating drum (Fig. 1) was made of thick plexiglas,but the vertical walls were lined with glass plates in orderto minimize electrostatic effects. To prevent slips alongthe circumference of our drum, we inserted a hollow, thinaluminum cylinder with a rough inner surface into thedrum. The inner diameter of the drum was 16.8 cm, itswidth was 3.2 cm, and the granular filling was 30%. Byperforming measurements in a thinner (2 cm) drum weverified that, while wall effects are not negligible, they donot appear to modify the qualitative behavior.
The drum was rotated by a computer-controlled pre-cision stepping motor which provided an extremely sta-
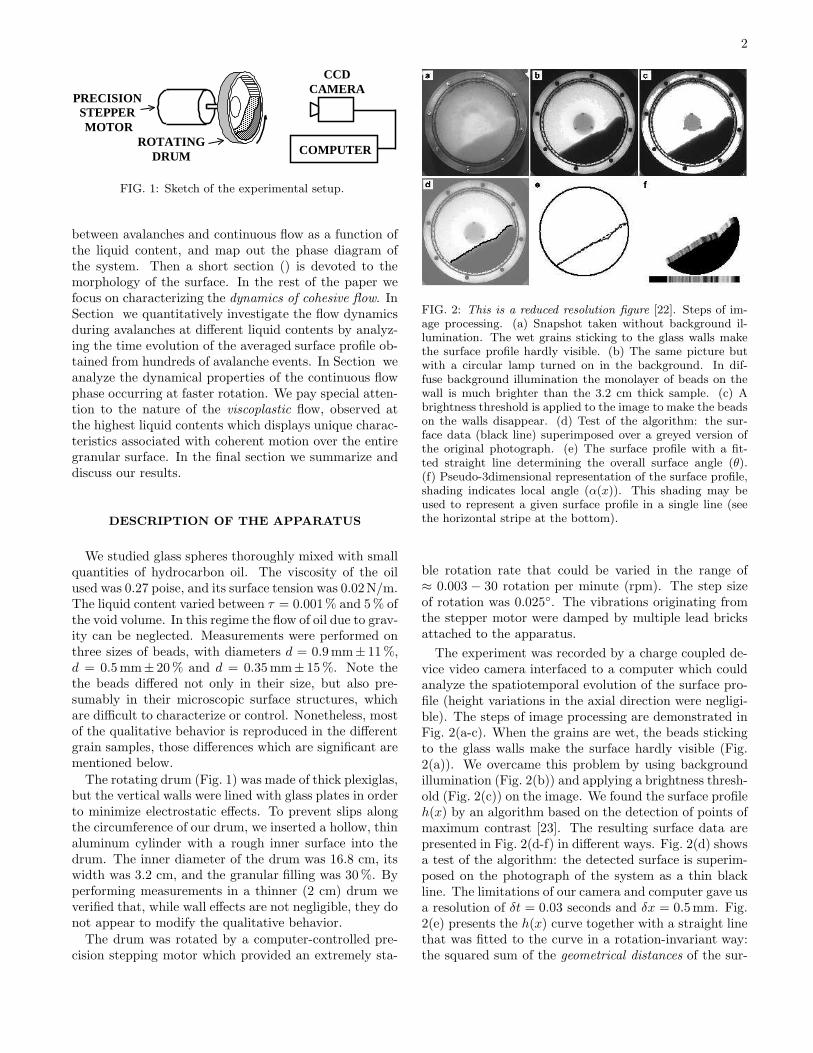
FIG. 2: This is a reduced resolution figure [22]. Steps of im-age processing. (a) Snapshot taken without background il-lumination. The wet grains sticking to the glass walls makethe surface profile hardly visible. (b) The same picture butwith a circular lamp turned on in the background. In dif-fuse background illumination the monolayer of beads on thewall is much brighter than the 3.2 cm thick sample. (c) Abrightness threshold is applied to the image to make the beadson the walls disappear. (d) Test of the algorithm: the sur-face data (black line) superimposed over a greyed version ofthe original photograph. (e) The surface profile with a fit-ted straight line determining the overall surface angle (θ).(f) Pseudo-3dimensional representation of the surface profile,shading indicates local angle (α(x)). This shading may beused to represent a given surface profile in a single line (seethe horizontal stripe at the bottom).
ble rotation rate that could be varied in the range of≈ 0.003 − 30 rotation per minute (rpm). The step sizeof rotation was 0.025. The vibrations originating fromthe stepper motor were damped by multiple lead bricksattached to the apparatus.
The experiment was recorded by a charge coupled de-vice video camera interfaced to a computer which couldanalyze the spatiotemporal evolution of the surface pro-file (height variations in the axial direction were negligi-ble). The steps of image processing are demonstrated inFig. 2(a-c). When the grains are wet, the beads stickingto the glass walls make the surface hardly visible (Fig.2(a)). We overcame this problem by using backgroundillumination (Fig. 2(b)) and applying a brightness thresh-old (Fig. 2(c)) on the image. We found the surface profileh(x) by an algorithm based on the detection of points ofmaximum contrast [23]. The resulting surface data arepresented in Fig. 2(d-f) in different ways. Fig. 2(d) showsa test of the algorithm: the detected surface is superim-posed on the photograph of the system as a thin blackline. The limitations of our camera and computer gave usa resolution of δt = 0.03 seconds and δx = 0.5mm. Fig.2(e) presents the h(x) curve together with a straight linethat was fitted to the curve in a rotation-invariant way:the squared sum of the geometrical distances of the sur-
3
face point from the line was minimized. The inclinationangle of this line gives the overall angle of the surface.This is the generalized version of the surface angle thathas typically been used to describe the flat surface ofdry samples. Finally, Fig. 2(f) shows the surface profilewith a brightness-coded representation of the local angle(α(x) = arctan
[
ddxh(x)
]
) in the third dimension. Thestripe at the bottom is a concise way of displaying thissurface profile using the same shading. In sections andwe use this representation of the surface topography tovisualize the time evolution of the surface by placing thestripes corresponding to successive surface profiles undereach other.
DYNAMIC PROPERTIES FROM SURFACE
ANGLE MEASUREMENTS
The phenomenology of wet granular materials is muchricher than that of dry samples. The attractive forcesbetween the particles lead to correlated motion of thegrains and qualitatively new avalanche dynamics. Thesenew types of avalanches form rough and highly variablesurfaces. In order to capture the most fundamental fea-tures of our system, however, we will initially neglectthese surface features and examine only the overall sur-
face angle (Fig. 2(e)) to describe the observed surfaceswith a single number. This approach allows us to com-pare our results directly to the behavior of dry materials,where the surface is virtually flat and is completely de-scribed by its inclination angle.
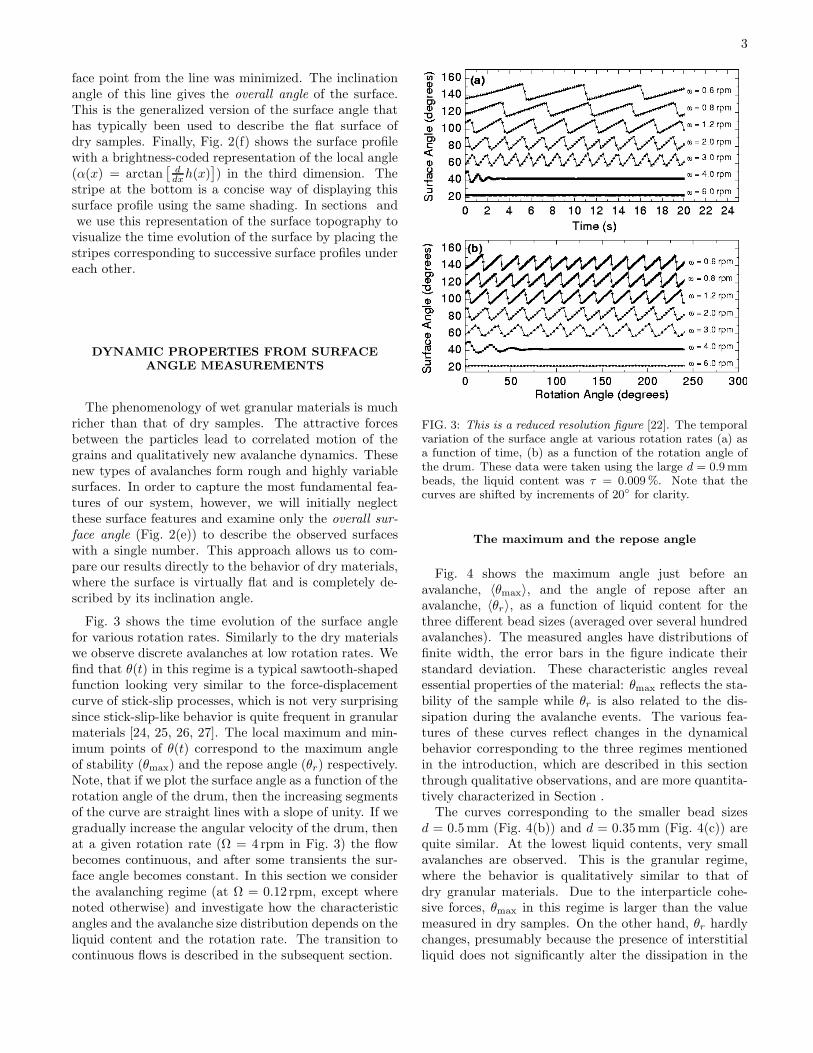
Fig. 3 shows the time evolution of the surface anglefor various rotation rates. Similarly to the dry materialswe observe discrete avalanches at low rotation rates. Wefind that θ(t) in this regime is a typical sawtooth-shapedfunction looking very similar to the force-displacementcurve of stick-slip processes, which is not very surprisingsince stick-slip-like behavior is quite frequent in granularmaterials [24, 25, 26, 27]. The local maximum and min-imum points of θ(t) correspond to the maximum angleof stability (θmax) and the repose angle (θr) respectively.Note, that if we plot the surface angle as a function of therotation angle of the drum, then the increasing segmentsof the curve are straight lines with a slope of unity. If wegradually increase the angular velocity of the drum, thenat a given rotation rate (Ω = 4 rpm in Fig. 3) the flowbecomes continuous, and after some transients the sur-face angle becomes constant. In this section we considerthe avalanching regime (at Ω = 0.12 rpm, except wherenoted otherwise) and investigate how the characteristicangles and the avalanche size distribution depends on theliquid content and the rotation rate. The transition tocontinuous flows is described in the subsequent section.
FIG. 3: This is a reduced resolution figure [22]. The temporalvariation of the surface angle at various rotation rates (a) asa function of time, (b) as a function of the rotation angle ofthe drum. These data were taken using the large d = 0.9mmbeads, the liquid content was τ = 0.009%. Note that thecurves are shifted by increments of 20 for clarity.
The maximum and the repose angle
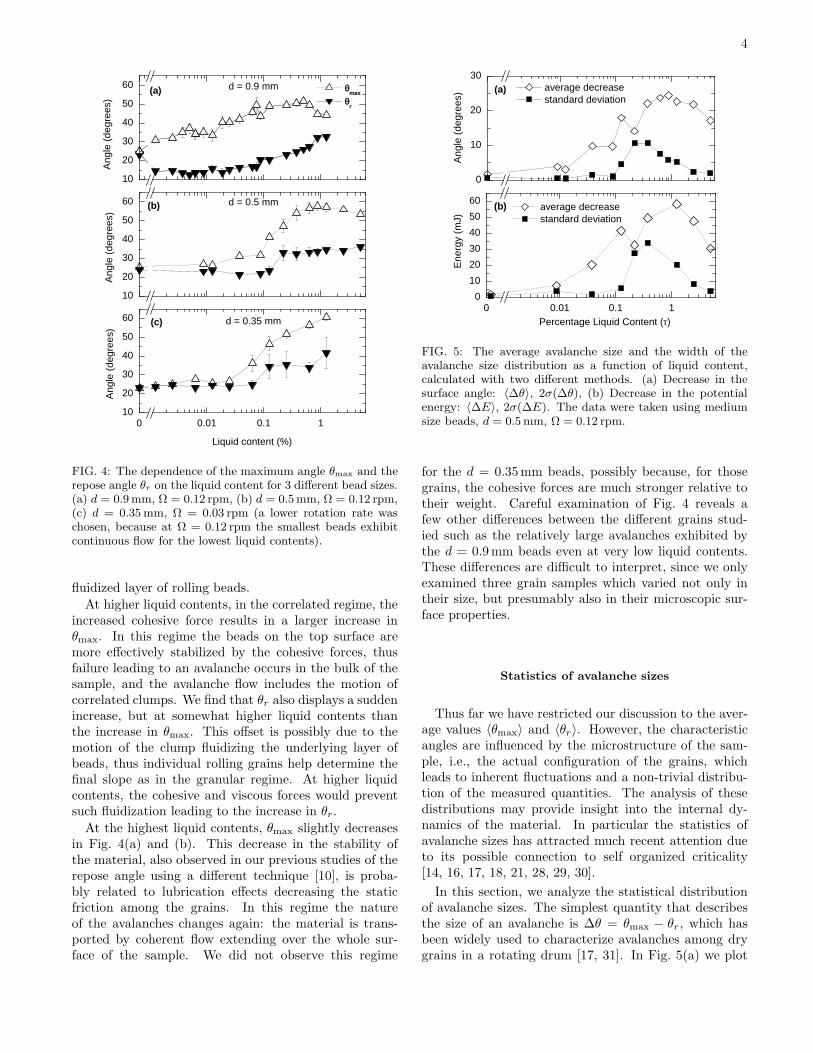
Fig. 4 shows the maximum angle just before anavalanche, 〈θmax〉, and the angle of repose after anavalanche, 〈θr〉, as a function of liquid content for thethree different bead sizes (averaged over several hundredavalanches). The measured angles have distributions offinite width, the error bars in the figure indicate theirstandard deviation. These characteristic angles revealessential properties of the material: θmax reflects the sta-bility of the sample while θr is also related to the dis-sipation during the avalanche events. The various fea-tures of these curves reflect changes in the dynamicalbehavior corresponding to the three regimes mentionedin the introduction, which are described in this sectionthrough qualitative observations, and are more quantita-tively characterized in Section .The curves corresponding to the smaller bead sizes
d = 0.5mm (Fig. 4(b)) and d = 0.35mm (Fig. 4(c)) arequite similar. At the lowest liquid contents, very smallavalanches are observed. This is the granular regime,where the behavior is qualitatively similar to that ofdry granular materials. Due to the interparticle cohe-sive forces, θmax in this regime is larger than the valuemeasured in dry samples. On the other hand, θr hardlychanges, presumably because the presence of interstitialliquid does not significantly alter the dissipation in the
4
10
20
30
40
50
60
(a) d = 0.9 mm
Ang
le (
degr
ees)
10
20
30
40
50
60 (b)
θmax
θr
d = 0.5 mm
Ang
le (
degr
ees)
0 0.01 0.1 110
20
30
40
50
60 (c) d = 0.35 mm
Liquid content (%)
Ang
le (
degr
ees)
FIG. 4: The dependence of the maximum angle θmax and therepose angle θr on the liquid content for 3 different bead sizes.(a) d = 0.9mm, Ω = 0.12 rpm, (b) d = 0.5mm, Ω = 0.12 rpm,(c) d = 0.35mm, Ω = 0.03 rpm (a lower rotation rate waschosen, because at Ω = 0.12 rpm the smallest beads exhibitcontinuous flow for the lowest liquid contents).
fluidized layer of rolling beads.
At higher liquid contents, in the correlated regime, theincreased cohesive force results in a larger increase inθmax. In this regime the beads on the top surface aremore effectively stabilized by the cohesive forces, thusfailure leading to an avalanche occurs in the bulk of thesample, and the avalanche flow includes the motion ofcorrelated clumps. We find that θr also displays a suddenincrease, but at somewhat higher liquid contents thanthe increase in θmax. This offset is possibly due to themotion of the clump fluidizing the underlying layer ofbeads, thus individual rolling grains help determine thefinal slope as in the granular regime. At higher liquidcontents, the cohesive and viscous forces would preventsuch fluidization leading to the increase in θr.
At the highest liquid contents, θmax slightly decreasesin Fig. 4(a) and (b). This decrease in the stability ofthe material, also observed in our previous studies of therepose angle using a different technique [10], is proba-bly related to lubrication effects decreasing the staticfriction among the grains. In this regime the natureof the avalanches changes again: the material is trans-ported by coherent flow extending over the whole sur-face of the sample. We did not observe this regime
0
10
20
30(a)
Ene
rgy
(mJ)
average decrease standard deviation
Ang
le (
degr
ees)
0 0.01 0.1 10
10
20
30
40
50
60 (b) average decrease standard deviation
Percentage Liquid Content (τ)
FIG. 5: The average avalanche size and the width of theavalanche size distribution as a function of liquid content,calculated with two different methods. (a) Decrease in thesurface angle: 〈∆θ〉, 2σ(∆θ), (b) Decrease in the potentialenergy: 〈∆E〉, 2σ(∆E). The data were taken using mediumsize beads, d = 0.5mm, Ω = 0.12 rpm.
for the d = 0.35mm beads, possibly because, for thosegrains, the cohesive forces are much stronger relative totheir weight. Careful examination of Fig. 4 reveals afew other differences between the different grains stud-ied such as the relatively large avalanches exhibited bythe d = 0.9mm beads even at very low liquid contents.These differences are difficult to interpret, since we onlyexamined three grain samples which varied not only intheir size, but presumably also in their microscopic sur-face properties.
Statistics of avalanche sizes
Thus far we have restricted our discussion to the aver-age values 〈θmax〉 and 〈θr〉. However, the characteristicangles are influenced by the microstructure of the sam-ple, i.e., the actual configuration of the grains, whichleads to inherent fluctuations and a non-trivial distribu-tion of the measured quantities. The analysis of thesedistributions may provide insight into the internal dy-namics of the material. In particular the statistics ofavalanche sizes has attracted much recent attention dueto its possible connection to self organized criticality[14, 16, 17, 18, 21, 28, 29, 30].
In this section, we analyze the statistical distributionof avalanche sizes. The simplest quantity that describesthe size of an avalanche is ∆θ = θmax − θr, which hasbeen widely used to characterize avalanches among drygrains in a rotating drum [17, 31]. In Fig. 5(a) we plot
5
0.0
0.5
1.0
d = 0.5 mm ττ (#data) 5.00% (347)2.50% (316)1.25% (469)0.37% (364)0.12% (499)0.04% (177)0.01% (1478)dry (178)
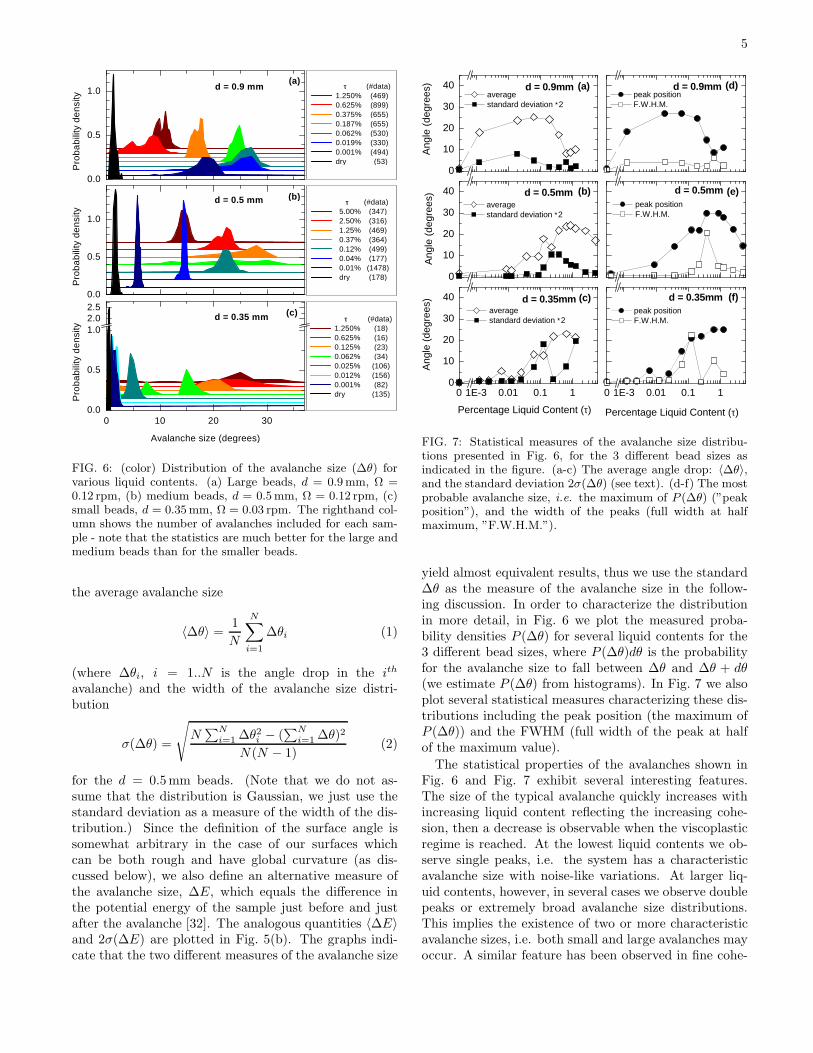
FIG. 6: (color) Distribution of the avalanche size (∆θ) forvarious liquid contents. (a) Large beads, d = 0.9mm, Ω =0.12 rpm, (b) medium beads, d = 0.5mm, Ω = 0.12 rpm, (c)small beads, d = 0.35mm, Ω = 0.03 rpm. The righthand col-umn shows the number of avalanches included for each sam-ple - note that the statistics are much better for the large andmedium beads than for the smaller beads.
the average avalanche size
〈∆θ〉 =1
N
N∑
i=1
∆θi (1)
(where ∆θi, i = 1..N is the angle drop in the ith
avalanche) and the width of the avalanche size distri-bution
σ(∆θ) =
√
N∑N
i=1 ∆θ2i − (∑N
i=1 ∆θ)2
N(N − 1)(2)
for the d = 0.5mm beads. (Note that we do not as-sume that the distribution is Gaussian, we just use thestandard deviation as a measure of the width of the dis-tribution.) Since the definition of the surface angle issomewhat arbitrary in the case of our surfaces whichcan be both rough and have global curvature (as dis-cussed below), we also define an alternative measure ofthe avalanche size, ∆E, which equals the difference inthe potential energy of the sample just before and justafter the avalanche [32]. The analogous quantities 〈∆E〉and 2σ(∆E) are plotted in Fig. 5(b). The graphs indi-cate that the two different measures of the avalanche size
0
10
20
30
40 (b)d = 0.5mm average standard deviation ∗2
Ang
le (
degr
ees)
(e) peak position F.W.H.M.
d = 0.5mm
0
10
20
30
40
(a)
Ang
le (
degr
ees) d = 0.9mm
average standard deviation ∗2
(d)d = 0.9mm peak position F.W.H.M.
0 1E-3 0.01 0.1 10
10
20
30
40 d = 0.35mm (c)
Percentage Liquid Content (τ)
Ang
le (
degr
ees)
average standard deviation ∗2
0 1E-3 0.01 0.1 1
d = 0.35mm (f) peak position F.W.H.M.
Percentage Liquid Content (τ)
FIG. 7: Statistical measures of the avalanche size distribu-tions presented in Fig. 6, for the 3 different bead sizes asindicated in the figure. (a-c) The average angle drop: 〈∆θ〉,and the standard deviation 2σ(∆θ) (see text). (d-f) The mostprobable avalanche size, i.e. the maximum of P (∆θ) (”peakposition”), and the width of the peaks (full width at halfmaximum, ”F.W.H.M.”).
yield almost equivalent results, thus we use the standard∆θ as the measure of the avalanche size in the follow-ing discussion. In order to characterize the distributionin more detail, in Fig. 6 we plot the measured proba-bility densities P (∆θ) for several liquid contents for the3 different bead sizes, where P (∆θ)dθ is the probabilityfor the avalanche size to fall between ∆θ and ∆θ + dθ(we estimate P (∆θ) from histograms). In Fig. 7 we alsoplot several statistical measures characterizing these dis-tributions including the peak position (the maximum ofP (∆θ)) and the FWHM (full width of the peak at halfof the maximum value).
The statistical properties of the avalanches shown inFig. 6 and Fig. 7 exhibit several interesting features.The size of the typical avalanche quickly increases withincreasing liquid content reflecting the increasing cohe-sion, then a decrease is observable when the viscoplasticregime is reached. At the lowest liquid contents we ob-serve single peaks, i.e. the system has a characteristicavalanche size with noise-like variations. At larger liq-uid contents, however, in several cases we observe doublepeaks or extremely broad avalanche size distributions.This implies the existence of two or more characteristicavalanche sizes, i.e. both small and large avalanches mayoccur. A similar feature has been observed in fine cohe-
6
0 50 100 150 200 250 300
20
30
40
50
0 50 100 150 200
20
30
40
50
(a)
Su
rfa
ce A
ng
le (
de
gre
es)
(d)(c)
(b)
Rotation Angle (degrees)
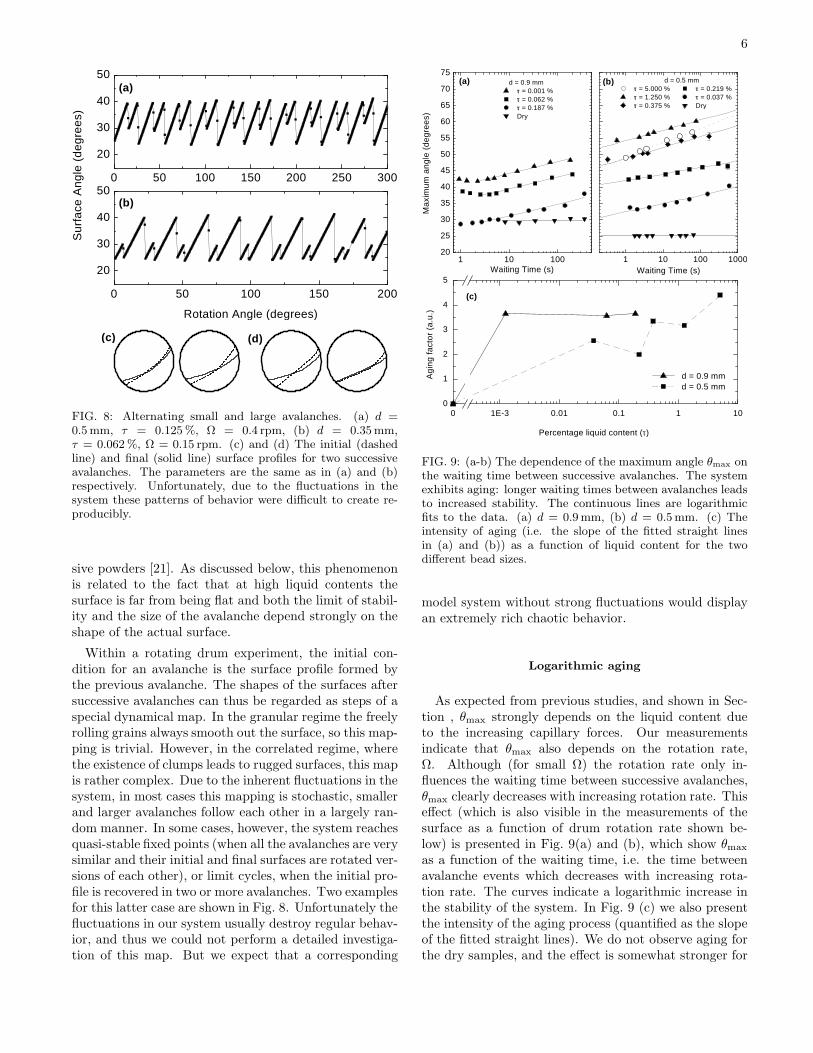
FIG. 8: Alternating small and large avalanches. (a) d =0.5mm, τ = 0.125%, Ω = 0.4 rpm, (b) d = 0.35mm,τ = 0.062%, Ω = 0.15 rpm. (c) and (d) The initial (dashedline) and final (solid line) surface profiles for two successiveavalanches. The parameters are the same as in (a) and (b)respectively. Unfortunately, due to the fluctuations in thesystem these patterns of behavior were difficult to create re-producibly.
sive powders [21]. As discussed below, this phenomenonis related to the fact that at high liquid contents thesurface is far from being flat and both the limit of stabil-ity and the size of the avalanche depend strongly on theshape of the actual surface.
Within a rotating drum experiment, the initial con-dition for an avalanche is the surface profile formed bythe previous avalanche. The shapes of the surfaces aftersuccessive avalanches can thus be regarded as steps of aspecial dynamical map. In the granular regime the freelyrolling grains always smooth out the surface, so this map-ping is trivial. However, in the correlated regime, wherethe existence of clumps leads to rugged surfaces, this mapis rather complex. Due to the inherent fluctuations in thesystem, in most cases this mapping is stochastic, smallerand larger avalanches follow each other in a largely ran-dom manner. In some cases, however, the system reachesquasi-stable fixed points (when all the avalanches are verysimilar and their initial and final surfaces are rotated ver-sions of each other), or limit cycles, when the initial pro-file is recovered in two or more avalanches. Two examplesfor this latter case are shown in Fig. 8. Unfortunately thefluctuations in our system usually destroy regular behav-ior, and thus we could not perform a detailed investiga-tion of this map. But we expect that a corresponding
FIG. 9: (a-b) The dependence of the maximum angle θmax onthe waiting time between successive avalanches. The systemexhibits aging: longer waiting times between avalanches leadsto increased stability. The continuous lines are logarithmicfits to the data. (a) d = 0.9mm, (b) d = 0.5mm. (c) Theintensity of aging (i.e. the slope of the fitted straight linesin (a) and (b)) as a function of liquid content for the twodifferent bead sizes.
model system without strong fluctuations would displayan extremely rich chaotic behavior.
Logarithmic aging
As expected from previous studies, and shown in Sec-tion , θmax strongly depends on the liquid content dueto the increasing capillary forces. Our measurementsindicate that θmax also depends on the rotation rate,Ω. Although (for small Ω) the rotation rate only in-fluences the waiting time between successive avalanches,θmax clearly decreases with increasing rotation rate. Thiseffect (which is also visible in the measurements of thesurface as a function of drum rotation rate shown be-low) is presented in Fig. 9(a) and (b), which show θmax
as a function of the waiting time, i.e. the time betweenavalanche events which decreases with increasing rota-tion rate. The curves indicate a logarithmic increase inthe stability of the system. In Fig. 9 (c) we also presentthe intensity of the aging process (quantified as the slopeof the fitted straight lines). We do not observe aging forthe dry samples, and the effect is somewhat stronger for
7
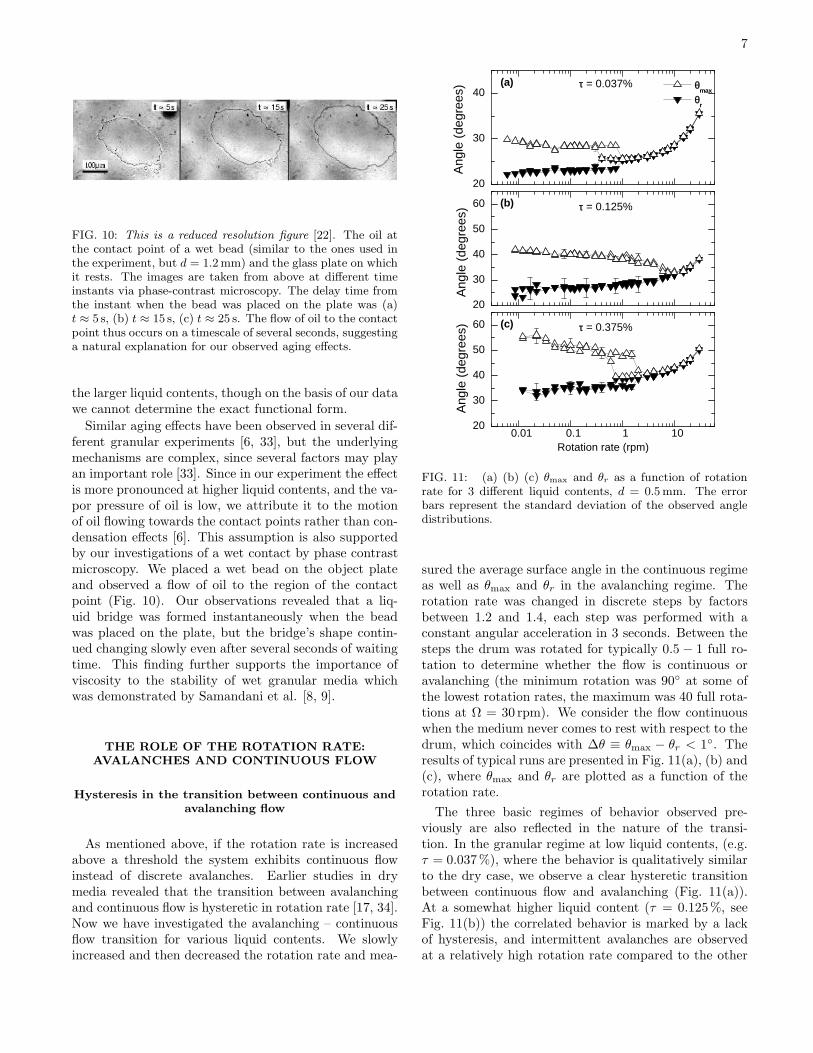
FIG. 10: This is a reduced resolution figure [22]. The oil atthe contact point of a wet bead (similar to the ones used inthe experiment, but d = 1.2mm) and the glass plate on whichit rests. The images are taken from above at different timeinstants via phase-contrast microscopy. The delay time fromthe instant when the bead was placed on the plate was (a)t ≈ 5 s, (b) t ≈ 15 s, (c) t ≈ 25 s. The flow of oil to the contactpoint thus occurs on a timescale of several seconds, suggestinga natural explanation for our observed aging effects.
the larger liquid contents, though on the basis of our datawe cannot determine the exact functional form.
Similar aging effects have been observed in several dif-ferent granular experiments [6, 33], but the underlyingmechanisms are complex, since several factors may playan important role [33]. Since in our experiment the effectis more pronounced at higher liquid contents, and the va-por pressure of oil is low, we attribute it to the motionof oil flowing towards the contact points rather than con-densation effects [6]. This assumption is also supportedby our investigations of a wet contact by phase contrastmicroscopy. We placed a wet bead on the object plateand observed a flow of oil to the region of the contactpoint (Fig. 10). Our observations revealed that a liq-uid bridge was formed instantaneously when the beadwas placed on the plate, but the bridge’s shape contin-ued changing slowly even after several seconds of waitingtime. This finding further supports the importance ofviscosity to the stability of wet granular media whichwas demonstrated by Samandani et al. [8, 9].
THE ROLE OF THE ROTATION RATE:
AVALANCHES AND CONTINUOUS FLOW
Hysteresis in the transition between continuous and
avalanching flow
As mentioned above, if the rotation rate is increasedabove a threshold the system exhibits continuous flowinstead of discrete avalanches. Earlier studies in drymedia revealed that the transition between avalanchingand continuous flow is hysteretic in rotation rate [17, 34].Now we have investigated the avalanching – continuousflow transition for various liquid contents. We slowlyincreased and then decreased the rotation rate and mea-
20
30
40 θ
max
θr
Ang
le (
degr
ees)
τ = 0.037%(a)
20
30
40
50
60
Ang
le (
degr
ees)
(b) τ = 0.125%
0.01 0.1 1 1020
30
40
50
60
Ang
le (
degr
ees) τ = 0.375%(c)
Rotation rate (rpm)
FIG. 11: (a) (b) (c) θmax and θr as a function of rotationrate for 3 different liquid contents, d = 0.5mm. The errorbars represent the standard deviation of the observed angledistributions.
sured the average surface angle in the continuous regimeas well as θmax and θr in the avalanching regime. Therotation rate was changed in discrete steps by factorsbetween 1.2 and 1.4, each step was performed with aconstant angular acceleration in 3 seconds. Between thesteps the drum was rotated for typically 0.5 − 1 full ro-tation to determine whether the flow is continuous oravalanching (the minimum rotation was 90 at some ofthe lowest rotation rates, the maximum was 40 full rota-tions at Ω = 30 rpm). We consider the flow continuouswhen the medium never comes to rest with respect to thedrum, which coincides with ∆θ ≡ θmax − θr < 1. Theresults of typical runs are presented in Fig. 11(a), (b) and(c), where θmax and θr are plotted as a function of therotation rate.
The three basic regimes of behavior observed pre-viously are also reflected in the nature of the transi-tion. In the granular regime at low liquid contents, (e.g.τ = 0.037%), where the behavior is qualitatively similarto the dry case, we observe a clear hysteretic transitionbetween continuous flow and avalanching (Fig. 11(a)).At a somewhat higher liquid content (τ = 0.125%, seeFig. 11(b)) the correlated behavior is marked by a lackof hysteresis, and intermittent avalanches are observedat a relatively high rotation rate compared to the other
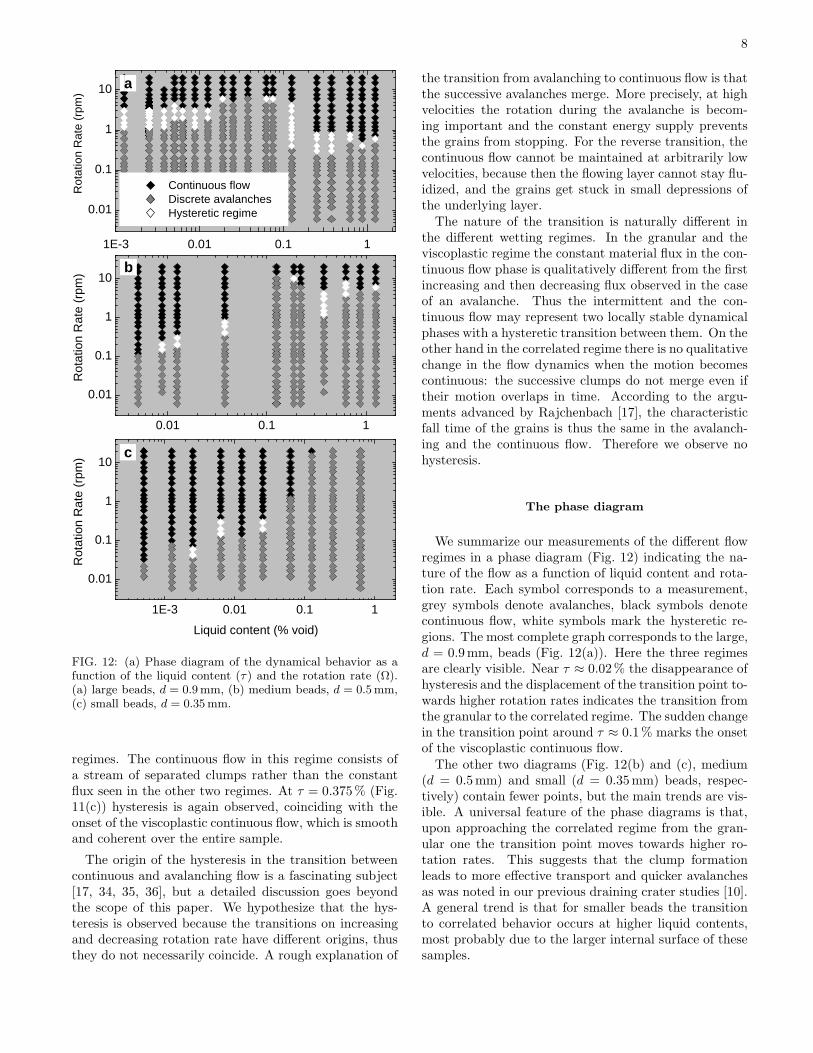
FIG. 12: (a) Phase diagram of the dynamical behavior as afunction of the liquid content (τ ) and the rotation rate (Ω).(a) large beads, d = 0.9mm, (b) medium beads, d = 0.5mm,(c) small beads, d = 0.35mm.
regimes. The continuous flow in this regime consists ofa stream of separated clumps rather than the constantflux seen in the other two regimes. At τ = 0.375% (Fig.11(c)) hysteresis is again observed, coinciding with theonset of the viscoplastic continuous flow, which is smoothand coherent over the entire sample.
The origin of the hysteresis in the transition betweencontinuous and avalanching flow is a fascinating subject[17, 34, 35, 36], but a detailed discussion goes beyondthe scope of this paper. We hypothesize that the hys-teresis is observed because the transitions on increasingand decreasing rotation rate have different origins, thusthey do not necessarily coincide. A rough explanation of
the transition from avalanching to continuous flow is thatthe successive avalanches merge. More precisely, at highvelocities the rotation during the avalanche is becom-ing important and the constant energy supply preventsthe grains from stopping. For the reverse transition, thecontinuous flow cannot be maintained at arbitrarily lowvelocities, because then the flowing layer cannot stay flu-idized, and the grains get stuck in small depressions ofthe underlying layer.The nature of the transition is naturally different in
the different wetting regimes. In the granular and theviscoplastic regime the constant material flux in the con-tinuous flow phase is qualitatively different from the firstincreasing and then decreasing flux observed in the caseof an avalanche. Thus the intermittent and the con-tinuous flow may represent two locally stable dynamicalphases with a hysteretic transition between them. On theother hand in the correlated regime there is no qualitativechange in the flow dynamics when the motion becomescontinuous: the successive clumps do not merge even iftheir motion overlaps in time. According to the argu-ments advanced by Rajchenbach [17], the characteristicfall time of the grains is thus the same in the avalanch-ing and the continuous flow. Therefore we observe nohysteresis.
The phase diagram
We summarize our measurements of the different flowregimes in a phase diagram (Fig. 12) indicating the na-ture of the flow as a function of liquid content and rota-tion rate. Each symbol corresponds to a measurement,grey symbols denote avalanches, black symbols denotecontinuous flow, white symbols mark the hysteretic re-gions. The most complete graph corresponds to the large,d = 0.9mm, beads (Fig. 12(a)). Here the three regimesare clearly visible. Near τ ≈ 0.02% the disappearance ofhysteresis and the displacement of the transition point to-wards higher rotation rates indicates the transition fromthe granular to the correlated regime. The sudden changein the transition point around τ ≈ 0.1% marks the onsetof the viscoplastic continuous flow.The other two diagrams (Fig. 12(b) and (c), medium
(d = 0.5mm) and small (d = 0.35mm) beads, respec-tively) contain fewer points, but the main trends are vis-ible. A universal feature of the phase diagrams is that,upon approaching the correlated regime from the gran-ular one the transition point moves towards higher ro-tation rates. This suggests that the clump formationleads to more effective transport and quicker avalanchesas was noted in our previous draining crater studies [10].A general trend is that for smaller beads the transitionto correlated behavior occurs at higher liquid contents,most probably due to the larger internal surface of thesesamples.
9
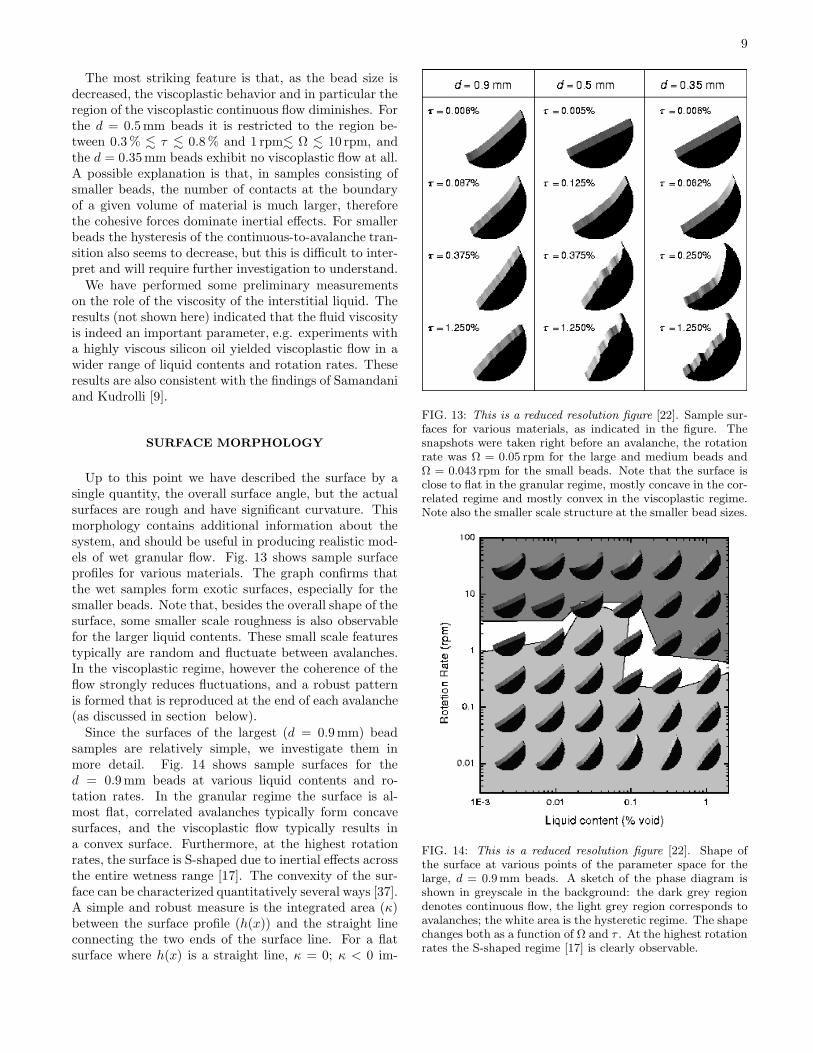
The most striking feature is that, as the bead size isdecreased, the viscoplastic behavior and in particular theregion of the viscoplastic continuous flow diminishes. Forthe d = 0.5mm beads it is restricted to the region be-tween 0.3% . τ . 0.8% and 1 rpm. Ω . 10 rpm, andthe d = 0.35mm beads exhibit no viscoplastic flow at all.A possible explanation is that, in samples consisting ofsmaller beads, the number of contacts at the boundaryof a given volume of material is much larger, thereforethe cohesive forces dominate inertial effects. For smallerbeads the hysteresis of the continuous-to-avalanche tran-sition also seems to decrease, but this is difficult to inter-pret and will require further investigation to understand.We have performed some preliminary measurements
on the role of the viscosity of the interstitial liquid. Theresults (not shown here) indicated that the fluid viscosityis indeed an important parameter, e.g. experiments witha highly viscous silicon oil yielded viscoplastic flow in awider range of liquid contents and rotation rates. Theseresults are also consistent with the findings of Samandaniand Kudrolli [9].
SURFACE MORPHOLOGY
Up to this point we have described the surface by asingle quantity, the overall surface angle, but the actualsurfaces are rough and have significant curvature. Thismorphology contains additional information about thesystem, and should be useful in producing realistic mod-els of wet granular flow. Fig. 13 shows sample surfaceprofiles for various materials. The graph confirms thatthe wet samples form exotic surfaces, especially for thesmaller beads. Note that, besides the overall shape of thesurface, some smaller scale roughness is also observablefor the larger liquid contents. These small scale featurestypically are random and fluctuate between avalanches.In the viscoplastic regime, however the coherence of theflow strongly reduces fluctuations, and a robust patternis formed that is reproduced at the end of each avalanche(as discussed in section below).Since the surfaces of the largest (d = 0.9mm) bead
samples are relatively simple, we investigate them inmore detail. Fig. 14 shows sample surfaces for thed = 0.9mm beads at various liquid contents and ro-tation rates. In the granular regime the surface is al-most flat, correlated avalanches typically form concavesurfaces, and the viscoplastic flow typically results ina convex surface. Furthermore, at the highest rotationrates, the surface is S-shaped due to inertial effects acrossthe entire wetness range [17]. The convexity of the sur-face can be characterized quantitatively several ways [37].A simple and robust measure is the integrated area (κ)between the surface profile (h(x)) and the straight lineconnecting the two ends of the surface line. For a flatsurface where h(x) is a straight line, κ = 0; κ < 0 im-
FIG. 13: This is a reduced resolution figure [22]. Sample sur-faces for various materials, as indicated in the figure. Thesnapshots were taken right before an avalanche, the rotationrate was Ω = 0.05 rpm for the large and medium beads andΩ = 0.043 rpm for the small beads. Note that the surface isclose to flat in the granular regime, mostly concave in the cor-related regime and mostly convex in the viscoplastic regime.Note also the smaller scale structure at the smaller bead sizes.
FIG. 14: This is a reduced resolution figure [22]. Shape ofthe surface at various points of the parameter space for thelarge, d = 0.9mm beads. A sketch of the phase diagram isshown in greyscale in the background: the dark grey regiondenotes continuous flow, the light grey region corresponds toavalanches; the white area is the hysteretic regime. The shapechanges both as a function of Ω and τ . At the highest rotationrates the S-shaped regime [17] is clearly observable.
10
(
5RWDWLRQ5DWHUSP
/LTXLG&RQWHQW
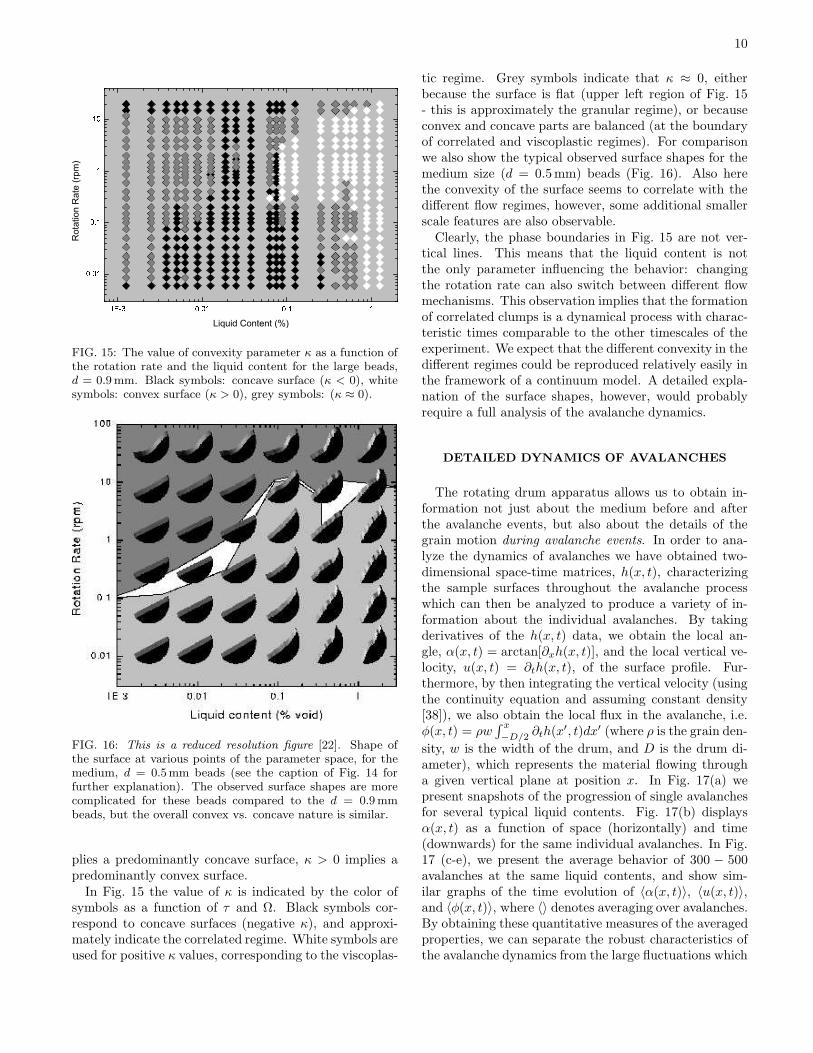
FIG. 15: The value of convexity parameter κ as a function ofthe rotation rate and the liquid content for the large beads,d = 0.9mm. Black symbols: concave surface (κ < 0), whitesymbols: convex surface (κ > 0), grey symbols: (κ ≈ 0).
FIG. 16: This is a reduced resolution figure [22]. Shape ofthe surface at various points of the parameter space, for themedium, d = 0.5mm beads (see the caption of Fig. 14 forfurther explanation). The observed surface shapes are morecomplicated for these beads compared to the d = 0.9mmbeads, but the overall convex vs. concave nature is similar.
plies a predominantly concave surface, κ > 0 implies apredominantly convex surface.In Fig. 15 the value of κ is indicated by the color of
symbols as a function of τ and Ω. Black symbols cor-respond to concave surfaces (negative κ), and approxi-mately indicate the correlated regime. White symbols areused for positive κ values, corresponding to the viscoplas-
tic regime. Grey symbols indicate that κ ≈ 0, eitherbecause the surface is flat (upper left region of Fig. 15- this is approximately the granular regime), or becauseconvex and concave parts are balanced (at the boundaryof correlated and viscoplastic regimes). For comparisonwe also show the typical observed surface shapes for themedium size (d = 0.5mm) beads (Fig. 16). Also herethe convexity of the surface seems to correlate with thedifferent flow regimes, however, some additional smallerscale features are also observable.Clearly, the phase boundaries in Fig. 15 are not ver-
tical lines. This means that the liquid content is notthe only parameter influencing the behavior: changingthe rotation rate can also switch between different flowmechanisms. This observation implies that the formationof correlated clumps is a dynamical process with charac-teristic times comparable to the other timescales of theexperiment. We expect that the different convexity in thedifferent regimes could be reproduced relatively easily inthe framework of a continuum model. A detailed expla-nation of the surface shapes, however, would probablyrequire a full analysis of the avalanche dynamics.
DETAILED DYNAMICS OF AVALANCHES
The rotating drum apparatus allows us to obtain in-formation not just about the medium before and afterthe avalanche events, but also about the details of thegrain motion during avalanche events. In order to ana-lyze the dynamics of avalanches we have obtained two-dimensional space-time matrices, h(x, t), characterizingthe sample surfaces throughout the avalanche processwhich can then be analyzed to produce a variety of in-formation about the individual avalanches. By takingderivatives of the h(x, t) data, we obtain the local an-gle, α(x, t) = arctan[∂xh(x, t)], and the local vertical ve-locity, u(x, t) = ∂th(x, t), of the surface profile. Fur-thermore, by then integrating the vertical velocity (usingthe continuity equation and assuming constant density[38]), we also obtain the local flux in the avalanche, i.e.φ(x, t) = ρw
∫ x
−D/2 ∂th(x′, t)dx′ (where ρ is the grain den-
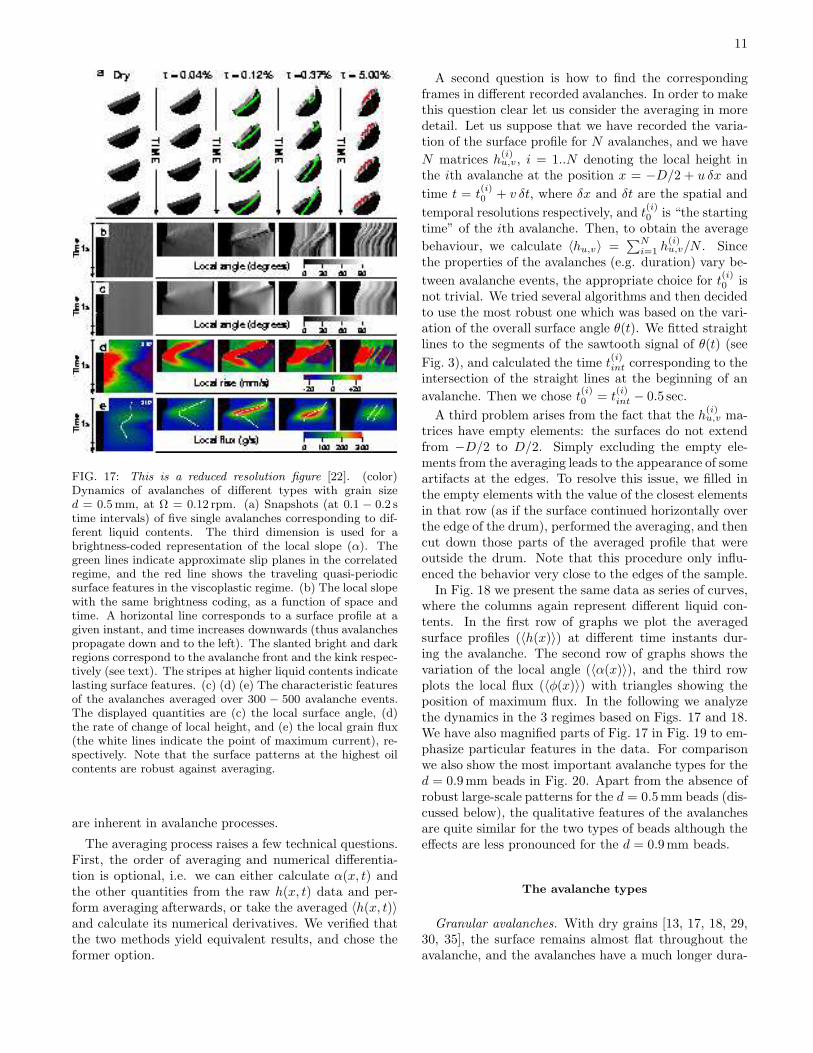
sity, w is the width of the drum, and D is the drum di-ameter), which represents the material flowing througha given vertical plane at position x. In Fig. 17(a) wepresent snapshots of the progression of single avalanchesfor several typical liquid contents. Fig. 17(b) displaysα(x, t) as a function of space (horizontally) and time(downwards) for the same individual avalanches. In Fig.17 (c-e), we present the average behavior of 300 − 500avalanches at the same liquid contents, and show sim-ilar graphs of the time evolution of 〈α(x, t)〉, 〈u(x, t)〉,and 〈φ(x, t)〉, where 〈〉 denotes averaging over avalanches.By obtaining these quantitative measures of the averagedproperties, we can separate the robust characteristics ofthe avalanche dynamics from the large fluctuations which
11
FIG. 17: This is a reduced resolution figure [22]. (color)Dynamics of avalanches of different types with grain sized = 0.5mm, at Ω = 0.12 rpm. (a) Snapshots (at 0.1 − 0.2 stime intervals) of five single avalanches corresponding to dif-ferent liquid contents. The third dimension is used for abrightness-coded representation of the local slope (α). Thegreen lines indicate approximate slip planes in the correlatedregime, and the red line shows the traveling quasi-periodicsurface features in the viscoplastic regime. (b) The local slopewith the same brightness coding, as a function of space andtime. A horizontal line corresponds to a surface profile at agiven instant, and time increases downwards (thus avalanchespropagate down and to the left). The slanted bright and darkregions correspond to the avalanche front and the kink respec-tively (see text). The stripes at higher liquid contents indicatelasting surface features. (c) (d) (e) The characteristic featuresof the avalanches averaged over 300 − 500 avalanche events.The displayed quantities are (c) the local surface angle, (d)the rate of change of local height, and (e) the local grain flux(the white lines indicate the point of maximum current), re-spectively. Note that the surface patterns at the highest oilcontents are robust against averaging.
are inherent in avalanche processes.
The averaging process raises a few technical questions.First, the order of averaging and numerical differentia-tion is optional, i.e. we can either calculate α(x, t) andthe other quantities from the raw h(x, t) data and per-form averaging afterwards, or take the averaged 〈h(x, t)〉and calculate its numerical derivatives. We verified thatthe two methods yield equivalent results, and chose theformer option.
A second question is how to find the correspondingframes in different recorded avalanches. In order to makethis question clear let us consider the averaging in moredetail. Let us suppose that we have recorded the varia-tion of the surface profile for N avalanches, and we have
N matrices h(i)u,v, i = 1..N denoting the local height in
the ith avalanche at the position x = −D/2 + u δx and
time t = t(i)0 + v δt, where δx and δt are the spatial and
temporal resolutions respectively, and t(i)0 is “the starting
time” of the ith avalanche. Then, to obtain the average
behaviour, we calculate 〈hu,v〉 =∑N
i=1 h(i)u,v/N . Since
the properties of the avalanches (e.g. duration) vary be-
tween avalanche events, the appropriate choice for t(i)0 is
not trivial. We tried several algorithms and then decidedto use the most robust one which was based on the vari-ation of the overall surface angle θ(t). We fitted straightlines to the segments of the sawtooth signal of θ(t) (see
Fig. 3), and calculated the time t(i)int corresponding to the
intersection of the straight lines at the beginning of an
avalanche. Then we chose t(i)0 = t
(i)int − 0.5 sec.
A third problem arises from the fact that the h(i)u,v ma-
trices have empty elements: the surfaces do not extendfrom −D/2 to D/2. Simply excluding the empty ele-ments from the averaging leads to the appearance of someartifacts at the edges. To resolve this issue, we filled inthe empty elements with the value of the closest elementsin that row (as if the surface continued horizontally overthe edge of the drum), performed the averaging, and thencut down those parts of the averaged profile that wereoutside the drum. Note that this procedure only influ-enced the behavior very close to the edges of the sample.In Fig. 18 we present the same data as series of curves,
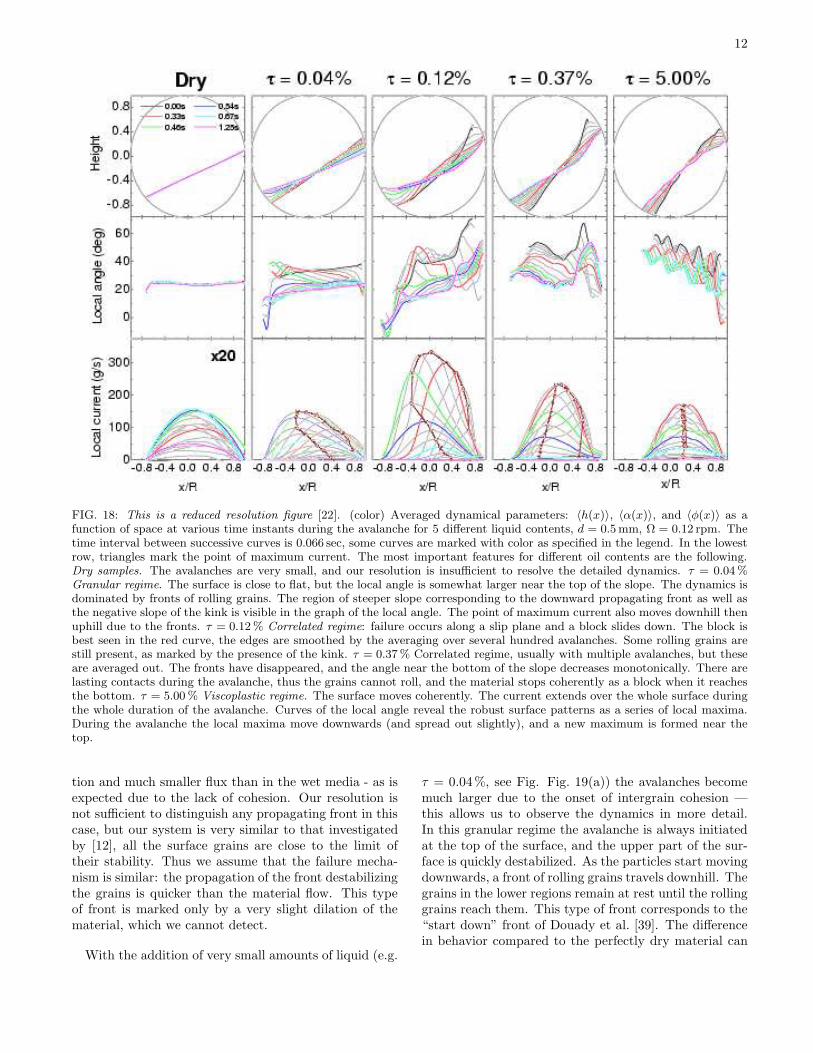
where the columns again represent different liquid con-tents. In the first row of graphs we plot the averagedsurface profiles (〈h(x)〉) at different time instants dur-ing the avalanche. The second row of graphs shows thevariation of the local angle (〈α(x)〉), and the third rowplots the local flux (〈φ(x)〉) with triangles showing theposition of maximum flux. In the following we analyzethe dynamics in the 3 regimes based on Figs. 17 and 18.We have also magnified parts of Fig. 17 in Fig. 19 to em-phasize particular features in the data. For comparisonwe also show the most important avalanche types for thed = 0.9mm beads in Fig. 20. Apart from the absence ofrobust large-scale patterns for the d = 0.5mm beads (dis-cussed below), the qualitative features of the avalanchesare quite similar for the two types of beads although theeffects are less pronounced for the d = 0.9mm beads.
The avalanche types
Granular avalanches. With dry grains [13, 17, 18, 29,30, 35], the surface remains almost flat throughout theavalanche, and the avalanches have a much longer dura-
12
FIG. 18: This is a reduced resolution figure [22]. (color) Averaged dynamical parameters: 〈h(x)〉, 〈α(x)〉, and 〈φ(x)〉 as afunction of space at various time instants during the avalanche for 5 different liquid contents, d = 0.5mm, Ω = 0.12 rpm. Thetime interval between successive curves is 0.066 sec, some curves are marked with color as specified in the legend. In the lowestrow, triangles mark the point of maximum current. The most important features for different oil contents are the following.Dry samples. The avalanches are very small, and our resolution is insufficient to resolve the detailed dynamics. τ = 0.04%Granular regime. The surface is close to flat, but the local angle is somewhat larger near the top of the slope. The dynamics isdominated by fronts of rolling grains. The region of steeper slope corresponding to the downward propagating front as well asthe negative slope of the kink is visible in the graph of the local angle. The point of maximum current also moves downhill thenuphill due to the fronts. τ = 0.12% Correlated regime: failure occurs along a slip plane and a block slides down. The block isbest seen in the red curve, the edges are smoothed by the averaging over several hundred avalanches. Some rolling grains arestill present, as marked by the presence of the kink. τ = 0.37% Correlated regime, usually with multiple avalanches, but theseare averaged out. The fronts have disappeared, and the angle near the bottom of the slope decreases monotonically. There arelasting contacts during the avalanche, thus the grains cannot roll, and the material stops coherently as a block when it reachesthe bottom. τ = 5.00% Viscoplastic regime. The surface moves coherently. The current extends over the whole surface duringthe whole duration of the avalanche. Curves of the local angle reveal the robust surface patterns as a series of local maxima.During the avalanche the local maxima move downwards (and spread out slightly), and a new maximum is formed near thetop.
tion and much smaller flux than in the wet media - as isexpected due to the lack of cohesion. Our resolution isnot sufficient to distinguish any propagating front in thiscase, but our system is very similar to that investigatedby [12], all the surface grains are close to the limit oftheir stability. Thus we assume that the failure mecha-nism is similar: the propagation of the front destabilizingthe grains is quicker than the material flow. This typeof front is marked only by a very slight dilation of thematerial, which we cannot detect.
With the addition of very small amounts of liquid (e.g.
τ = 0.04%, see Fig. Fig. 19(a)) the avalanches becomemuch larger due to the onset of intergrain cohesion —this allows us to observe the dynamics in more detail.In this granular regime the avalanche is always initiatedat the top of the surface, and the upper part of the sur-face is quickly destabilized. As the particles start movingdownwards, a front of rolling grains travels downhill. Thegrains in the lower regions remain at rest until the rollinggrains reach them. This type of front corresponds to the“start down” front of Douady et al. [39]. The differencein behavior compared to the perfectly dry material can
13
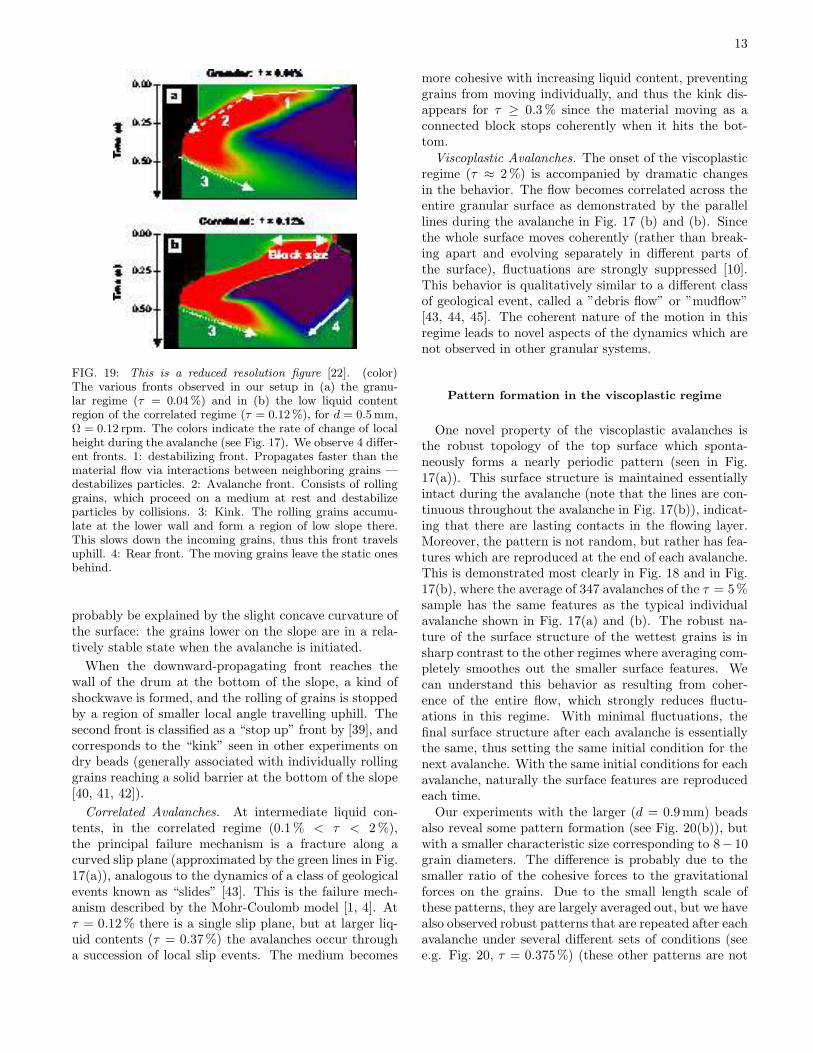
FIG. 19: This is a reduced resolution figure [22]. (color)The various fronts observed in our setup in (a) the granu-lar regime (τ = 0.04%) and in (b) the low liquid contentregion of the correlated regime (τ = 0.12%), for d = 0.5mm,Ω = 0.12 rpm. The colors indicate the rate of change of localheight during the avalanche (see Fig. 17). We observe 4 differ-ent fronts. 1: destabilizing front. Propagates faster than thematerial flow via interactions between neighboring grains —destabilizes particles. 2: Avalanche front. Consists of rollinggrains, which proceed on a medium at rest and destabilizeparticles by collisions. 3: Kink. The rolling grains accumu-late at the lower wall and form a region of low slope there.This slows down the incoming grains, thus this front travelsuphill. 4: Rear front. The moving grains leave the static onesbehind.
probably be explained by the slight concave curvature ofthe surface: the grains lower on the slope are in a rela-tively stable state when the avalanche is initiated.
When the downward-propagating front reaches thewall of the drum at the bottom of the slope, a kind ofshockwave is formed, and the rolling of grains is stoppedby a region of smaller local angle travelling uphill. Thesecond front is classified as a “stop up” front by [39], andcorresponds to the “kink” seen in other experiments ondry beads (generally associated with individually rollinggrains reaching a solid barrier at the bottom of the slope[40, 41, 42]).
Correlated Avalanches. At intermediate liquid con-tents, in the correlated regime (0.1% < τ < 2%),the principal failure mechanism is a fracture along acurved slip plane (approximated by the green lines in Fig.17(a)), analogous to the dynamics of a class of geologicalevents known as “slides” [43]. This is the failure mech-anism described by the Mohr-Coulomb model [1, 4]. Atτ = 0.12% there is a single slip plane, but at larger liq-uid contents (τ = 0.37%) the avalanches occur througha succession of local slip events. The medium becomes
more cohesive with increasing liquid content, preventinggrains from moving individually, and thus the kink dis-appears for τ ≥ 0.3% since the material moving as aconnected block stops coherently when it hits the bot-tom.Viscoplastic Avalanches. The onset of the viscoplastic
regime (τ ≈ 2%) is accompanied by dramatic changesin the behavior. The flow becomes correlated across theentire granular surface as demonstrated by the parallellines during the avalanche in Fig. 17 (b) and (b). Sincethe whole surface moves coherently (rather than break-ing apart and evolving separately in different parts ofthe surface), fluctuations are strongly suppressed [10].This behavior is qualitatively similar to a different classof geological event, called a ”debris flow” or ”mudflow”[43, 44, 45]. The coherent nature of the motion in thisregime leads to novel aspects of the dynamics which arenot observed in other granular systems.
Pattern formation in the viscoplastic regime
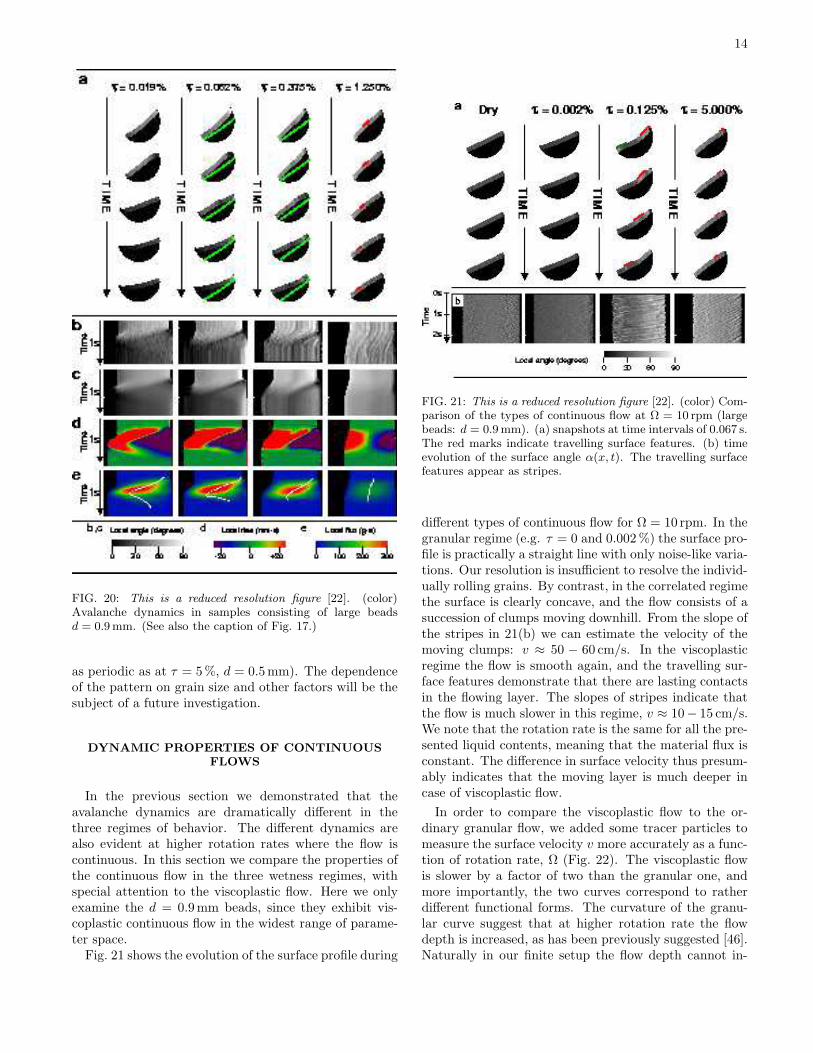
One novel property of the viscoplastic avalanches isthe robust topology of the top surface which sponta-neously forms a nearly periodic pattern (seen in Fig.17(a)). This surface structure is maintained essentiallyintact during the avalanche (note that the lines are con-tinuous throughout the avalanche in Fig. 17(b)), indicat-ing that there are lasting contacts in the flowing layer.Moreover, the pattern is not random, but rather has fea-tures which are reproduced at the end of each avalanche.This is demonstrated most clearly in Fig. 18 and in Fig.17(b), where the average of 347 avalanches of the τ = 5%sample has the same features as the typical individualavalanche shown in Fig. 17(a) and (b). The robust na-ture of the surface structure of the wettest grains is insharp contrast to the other regimes where averaging com-pletely smoothes out the smaller surface features. Wecan understand this behavior as resulting from coher-ence of the entire flow, which strongly reduces fluctu-ations in this regime. With minimal fluctuations, thefinal surface structure after each avalanche is essentiallythe same, thus setting the same initial condition for thenext avalanche. With the same initial conditions for eachavalanche, naturally the surface features are reproducedeach time.Our experiments with the larger (d = 0.9mm) beads
also reveal some pattern formation (see Fig. 20(b)), butwith a smaller characteristic size corresponding to 8− 10grain diameters. The difference is probably due to thesmaller ratio of the cohesive forces to the gravitationalforces on the grains. Due to the small length scale ofthese patterns, they are largely averaged out, but we havealso observed robust patterns that are repeated after eachavalanche under several different sets of conditions (seee.g. Fig. 20, τ = 0.375%) (these other patterns are not
14
FIG. 20: This is a reduced resolution figure [22]. (color)Avalanche dynamics in samples consisting of large beadsd = 0.9mm. (See also the caption of Fig. 17.)
as periodic as at τ = 5%, d = 0.5mm). The dependenceof the pattern on grain size and other factors will be thesubject of a future investigation.
DYNAMIC PROPERTIES OF CONTINUOUS
FLOWS
In the previous section we demonstrated that theavalanche dynamics are dramatically different in thethree regimes of behavior. The different dynamics arealso evident at higher rotation rates where the flow iscontinuous. In this section we compare the properties ofthe continuous flow in the three wetness regimes, withspecial attention to the viscoplastic flow. Here we onlyexamine the d = 0.9mm beads, since they exhibit vis-coplastic continuous flow in the widest range of parame-ter space.Fig. 21 shows the evolution of the surface profile during
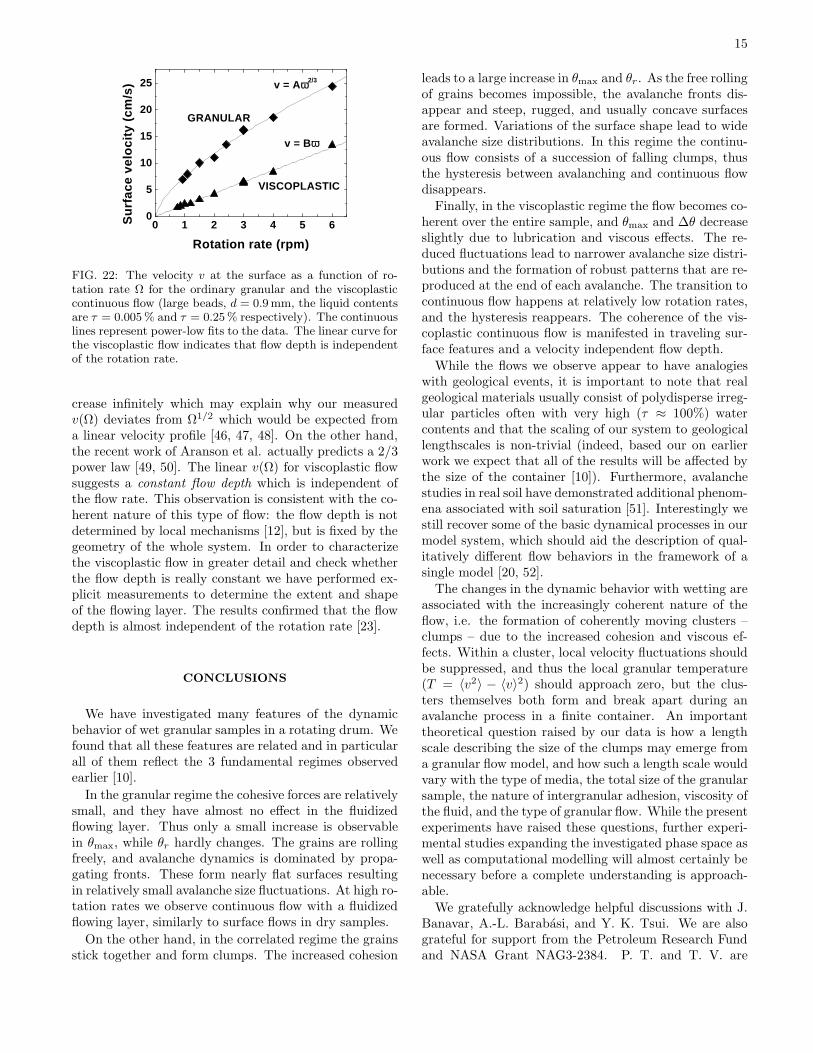
FIG. 21: This is a reduced resolution figure [22]. (color) Com-parison of the types of continuous flow at Ω = 10 rpm (largebeads: d = 0.9mm). (a) snapshots at time intervals of 0.067 s.The red marks indicate travelling surface features. (b) timeevolution of the surface angle α(x, t). The travelling surfacefeatures appear as stripes.
different types of continuous flow for Ω = 10 rpm. In thegranular regime (e.g. τ = 0 and 0.002%) the surface pro-file is practically a straight line with only noise-like varia-tions. Our resolution is insufficient to resolve the individ-ually rolling grains. By contrast, in the correlated regimethe surface is clearly concave, and the flow consists of asuccession of clumps moving downhill. From the slope ofthe stripes in 21(b) we can estimate the velocity of themoving clumps: v ≈ 50 − 60 cm/s. In the viscoplasticregime the flow is smooth again, and the travelling sur-face features demonstrate that there are lasting contactsin the flowing layer. The slopes of stripes indicate thatthe flow is much slower in this regime, v ≈ 10− 15 cm/s.We note that the rotation rate is the same for all the pre-sented liquid contents, meaning that the material flux isconstant. The difference in surface velocity thus presum-ably indicates that the moving layer is much deeper incase of viscoplastic flow.
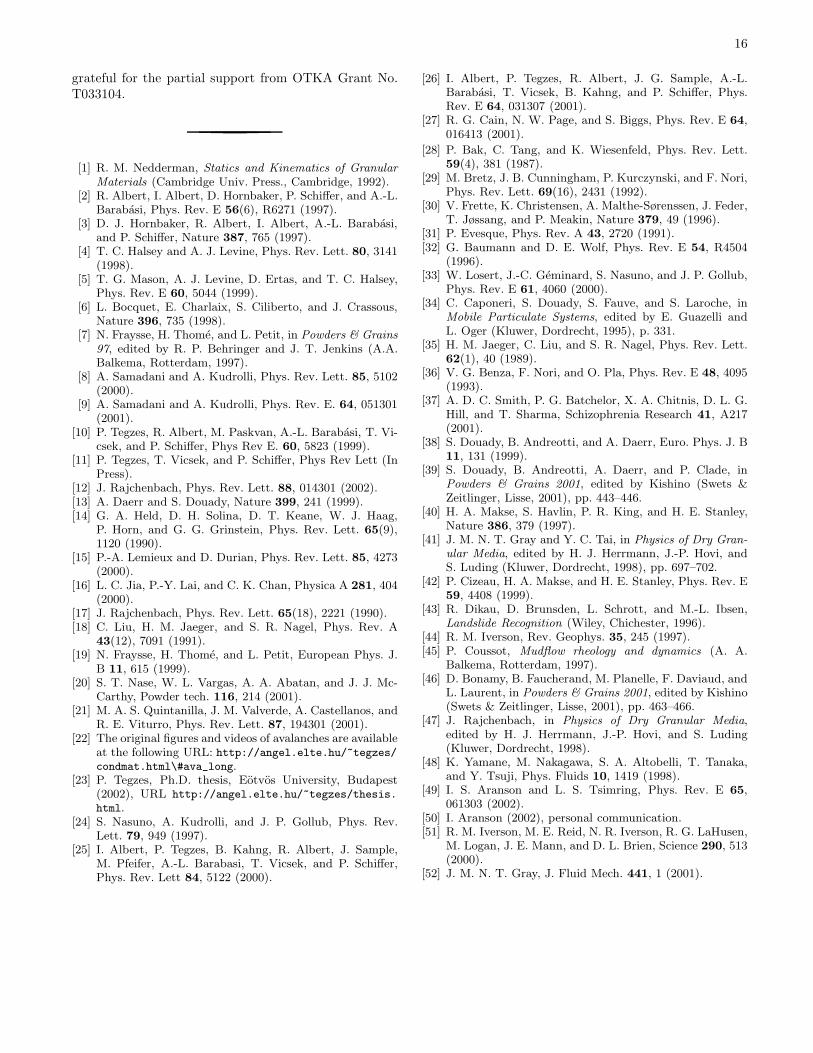
In order to compare the viscoplastic flow to the or-dinary granular flow, we added some tracer particles tomeasure the surface velocity v more accurately as a func-tion of rotation rate, Ω (Fig. 22). The viscoplastic flowis slower by a factor of two than the granular one, andmore importantly, the two curves correspond to ratherdifferent functional forms. The curvature of the granu-lar curve suggest that at higher rotation rate the flowdepth is increased, as has been previously suggested [46].Naturally in our finite setup the flow depth cannot in-
15
0 1 2 3 4 5 60
5
10
15
20
25
VISCOPLASTIC
GRANULAR
v = Bωω
v = Aωω2/3
Su
rfac
e ve
loci
ty (
cm/s
)
Rotation rate (rpm)
FIG. 22: The velocity v at the surface as a function of ro-tation rate Ω for the ordinary granular and the viscoplasticcontinuous flow (large beads, d = 0.9mm, the liquid contentsare τ = 0.005% and τ = 0.25% respectively). The continuouslines represent power-low fits to the data. The linear curve forthe viscoplastic flow indicates that flow depth is independentof the rotation rate.
crease infinitely which may explain why our measuredv(Ω) deviates from Ω1/2 which would be expected froma linear velocity profile [46, 47, 48]. On the other hand,the recent work of Aranson et al. actually predicts a 2/3power law [49, 50]. The linear v(Ω) for viscoplastic flowsuggests a constant flow depth which is independent ofthe flow rate. This observation is consistent with the co-herent nature of this type of flow: the flow depth is notdetermined by local mechanisms [12], but is fixed by thegeometry of the whole system. In order to characterizethe viscoplastic flow in greater detail and check whetherthe flow depth is really constant we have performed ex-plicit measurements to determine the extent and shapeof the flowing layer. The results confirmed that the flowdepth is almost independent of the rotation rate [23].
CONCLUSIONS
We have investigated many features of the dynamicbehavior of wet granular samples in a rotating drum. Wefound that all these features are related and in particularall of them reflect the 3 fundamental regimes observedearlier [10].
In the granular regime the cohesive forces are relativelysmall, and they have almost no effect in the fluidizedflowing layer. Thus only a small increase is observablein θmax, while θr hardly changes. The grains are rollingfreely, and avalanche dynamics is dominated by propa-gating fronts. These form nearly flat surfaces resultingin relatively small avalanche size fluctuations. At high ro-tation rates we observe continuous flow with a fluidizedflowing layer, similarly to surface flows in dry samples.
On the other hand, in the correlated regime the grainsstick together and form clumps. The increased cohesion
leads to a large increase in θmax and θr. As the free rollingof grains becomes impossible, the avalanche fronts dis-appear and steep, rugged, and usually concave surfacesare formed. Variations of the surface shape lead to wideavalanche size distributions. In this regime the continu-ous flow consists of a succession of falling clumps, thusthe hysteresis between avalanching and continuous flowdisappears.
Finally, in the viscoplastic regime the flow becomes co-herent over the entire sample, and θmax and ∆θ decreaseslightly due to lubrication and viscous effects. The re-duced fluctuations lead to narrower avalanche size distri-butions and the formation of robust patterns that are re-produced at the end of each avalanche. The transition tocontinuous flow happens at relatively low rotation rates,and the hysteresis reappears. The coherence of the vis-coplastic continuous flow is manifested in traveling sur-face features and a velocity independent flow depth.
While the flows we observe appear to have analogieswith geological events, it is important to note that realgeological materials usually consist of polydisperse irreg-ular particles often with very high (τ ≈ 100%) watercontents and that the scaling of our system to geologicallengthscales is non-trivial (indeed, based our on earlierwork we expect that all of the results will be affected bythe size of the container [10]). Furthermore, avalanchestudies in real soil have demonstrated additional phenom-ena associated with soil saturation [51]. Interestingly westill recover some of the basic dynamical processes in ourmodel system, which should aid the description of qual-itatively different flow behaviors in the framework of asingle model [20, 52].The changes in the dynamic behavior with wetting are
associated with the increasingly coherent nature of theflow, i.e. the formation of coherently moving clusters –clumps – due to the increased cohesion and viscous ef-fects. Within a cluster, local velocity fluctuations shouldbe suppressed, and thus the local granular temperature(T = 〈v2〉 − 〈v〉2) should approach zero, but the clus-ters themselves both form and break apart during anavalanche process in a finite container. An importanttheoretical question raised by our data is how a lengthscale describing the size of the clumps may emerge froma granular flow model, and how such a length scale wouldvary with the type of media, the total size of the granularsample, the nature of intergranular adhesion, viscosity ofthe fluid, and the type of granular flow. While the presentexperiments have raised these questions, further experi-mental studies expanding the investigated phase space aswell as computational modelling will almost certainly benecessary before a complete understanding is approach-able.
We gratefully acknowledge helpful discussions with J.Banavar, A.-L. Barabasi, and Y. K. Tsui. We are alsograteful for support from the Petroleum Research Fundand NASA Grant NAG3-2384. P. T. and T. V. are
16
grateful for the partial support from OTKA Grant No.T033104.
[1] R. M. Nedderman, Statics and Kinematics of Granular
Materials (Cambridge Univ. Press., Cambridge, 1992).[2] R. Albert, I. Albert, D. Hornbaker, P. Schiffer, and A.-L.
Barabasi, Phys. Rev. E 56(6), R6271 (1997).[3] D. J. Hornbaker, R. Albert, I. Albert, A.-L. Barabasi,
and P. Schiffer, Nature 387, 765 (1997).[4] T. C. Halsey and A. J. Levine, Phys. Rev. Lett. 80, 3141
(1998).[5] T. G. Mason, A. J. Levine, D. Ertas, and T. C. Halsey,
Phys. Rev. E 60, 5044 (1999).[6] L. Bocquet, E. Charlaix, S. Ciliberto, and J. Crassous,
Nature 396, 735 (1998).[7] N. Fraysse, H. Thome, and L. Petit, in Powders & Grains
97, edited by R. P. Behringer and J. T. Jenkins (A.A.Balkema, Rotterdam, 1997).
[8] A. Samadani and A. Kudrolli, Phys. Rev. Lett. 85, 5102(2000).
[9] A. Samadani and A. Kudrolli, Phys. Rev. E. 64, 051301(2001).
[10] P. Tegzes, R. Albert, M. Paskvan, A.-L. Barabasi, T. Vi-csek, and P. Schiffer, Phys Rev E. 60, 5823 (1999).
[11] P. Tegzes, T. Vicsek, and P. Schiffer, Phys Rev Lett (InPress).
[12] J. Rajchenbach, Phys. Rev. Lett. 88, 014301 (2002).[13] A. Daerr and S. Douady, Nature 399, 241 (1999).[14] G. A. Held, D. H. Solina, D. T. Keane, W. J. Haag,
P. Horn, and G. G. Grinstein, Phys. Rev. Lett. 65(9),1120 (1990).
[15] P.-A. Lemieux and D. Durian, Phys. Rev. Lett. 85, 4273(2000).
[16] L. C. Jia, P.-Y. Lai, and C. K. Chan, Physica A 281, 404(2000).
[17] J. Rajchenbach, Phys. Rev. Lett. 65(18), 2221 (1990).[18] C. Liu, H. M. Jaeger, and S. R. Nagel, Phys. Rev. A
43(12), 7091 (1991).[19] N. Fraysse, H. Thome, and L. Petit, European Phys. J.
B 11, 615 (1999).[20] S. T. Nase, W. L. Vargas, A. A. Abatan, and J. J. Mc-
Carthy, Powder tech. 116, 214 (2001).[21] M. A. S. Quintanilla, J. M. Valverde, A. Castellanos, and
R. E. Viturro, Phys. Rev. Lett. 87, 194301 (2001).[22] The original figures and videos of avalanches are available
at the following URL: http://angel.elte.hu/~tegzes/condmat.html\#ava_long.
[23] P. Tegzes, Ph.D. thesis, Eotvos University, Budapest(2002), URL http://angel.elte.hu/~tegzes/thesis.
html.[24] S. Nasuno, A. Kudrolli, and J. P. Gollub, Phys. Rev.
Lett. 79, 949 (1997).[25] I. Albert, P. Tegzes, B. Kahng, R. Albert, J. Sample,
M. Pfeifer, A.-L. Barabasi, T. Vicsek, and P. Schiffer,Phys. Rev. Lett 84, 5122 (2000).
[26] I. Albert, P. Tegzes, R. Albert, J. G. Sample, A.-L.Barabasi, T. Vicsek, B. Kahng, and P. Schiffer, Phys.Rev. E 64, 031307 (2001).
[27] R. G. Cain, N. W. Page, and S. Biggs, Phys. Rev. E 64,016413 (2001).
[28] P. Bak, C. Tang, and K. Wiesenfeld, Phys. Rev. Lett.59(4), 381 (1987).
[29] M. Bretz, J. B. Cunningham, P. Kurczynski, and F. Nori,Phys. Rev. Lett. 69(16), 2431 (1992).
[30] V. Frette, K. Christensen, A. Malthe-Sørenssen, J. Feder,T. Jøssang, and P. Meakin, Nature 379, 49 (1996).
[31] P. Evesque, Phys. Rev. A 43, 2720 (1991).[32] G. Baumann and D. E. Wolf, Phys. Rev. E 54, R4504
(1996).[33] W. Losert, J.-C. Geminard, S. Nasuno, and J. P. Gollub,
Phys. Rev. E 61, 4060 (2000).[34] C. Caponeri, S. Douady, S. Fauve, and S. Laroche, in
Mobile Particulate Systems, edited by E. Guazelli andL. Oger (Kluwer, Dordrecht, 1995), p. 331.
[35] H. M. Jaeger, C. Liu, and S. R. Nagel, Phys. Rev. Lett.62(1), 40 (1989).
[36] V. G. Benza, F. Nori, and O. Pla, Phys. Rev. E 48, 4095(1993).
[37] A. D. C. Smith, P. G. Batchelor, X. A. Chitnis, D. L. G.Hill, and T. Sharma, Schizophrenia Research 41, A217(2001).
[38] S. Douady, B. Andreotti, and A. Daerr, Euro. Phys. J. B11, 131 (1999).
[39] S. Douady, B. Andreotti, A. Daerr, and P. Clade, inPowders & Grains 2001, edited by Kishino (Swets &Zeitlinger, Lisse, 2001), pp. 443–446.
[40] H. A. Makse, S. Havlin, P. R. King, and H. E. Stanley,Nature 386, 379 (1997).
[41] J. M. N. T. Gray and Y. C. Tai, in Physics of Dry Gran-
ular Media, edited by H. J. Herrmann, J.-P. Hovi, andS. Luding (Kluwer, Dordrecht, 1998), pp. 697–702.
[42] P. Cizeau, H. A. Makse, and H. E. Stanley, Phys. Rev. E59, 4408 (1999).
[43] R. Dikau, D. Brunsden, L. Schrott, and M.-L. Ibsen,Landslide Recognition (Wiley, Chichester, 1996).
[44] R. M. Iverson, Rev. Geophys. 35, 245 (1997).[45] P. Coussot, Mudflow rheology and dynamics (A. A.
Balkema, Rotterdam, 1997).[46] D. Bonamy, B. Faucherand, M. Planelle, F. Daviaud, and
L. Laurent, in Powders & Grains 2001, edited by Kishino(Swets & Zeitlinger, Lisse, 2001), pp. 463–466.
[47] J. Rajchenbach, in Physics of Dry Granular Media,edited by H. J. Herrmann, J.-P. Hovi, and S. Luding(Kluwer, Dordrecht, 1998).
[48] K. Yamane, M. Nakagawa, S. A. Altobelli, T. Tanaka,and Y. Tsuji, Phys. Fluids 10, 1419 (1998).
[49] I. S. Aranson and L. S. Tsimring, Phys. Rev. E 65,061303 (2002).
[50] I. Aranson (2002), personal communication.[51] R. M. Iverson, M. E. Reid, N. R. Iverson, R. G. LaHusen,
M. Logan, J. E. Mann, and D. L. Brien, Science 290, 513(2000).
[52] J. M. N. T. Gray, J. Fluid Mech. 441, 1 (2001).