1 Stock Data Sector Pharmaceuticals Face Value (Rs.) 10.00 52 wk. High/Low (Rs.) 2059.00/1474.00 Volume (2 wk. Avg.) 1265 BSE Code 500674 Market Cap (Rs.mn.) 41538.00 Financials (Rs. in mn.) CY09 CY10E CY11E Net Sales 10525.00 11518.72 12670.59 EBIDTA 2589.00 2769.57 3029.39 PAT 1574.00 1740.65 1900.79 EPS 68.43 75.68 82.64 P/E 26.39 23.86 21.85 AVENTIS PHARMA LTD BUY F I R S T C A L L R E S E A R C H SYNOPSIS Sanofi-aventis, one of the world's leading pharmaceutical companies, and its 100% subsidiary, Hoechst GmbH, are the major shareholders of Aventis Pharma Limited and together hold 50.12% of its paid-up share capital. The company exports to countries like Russia, Sri Lanka, U.K and Egypt amongst others. Hoechst GmbH, a 100% subsidiary of Sanofi-aventis SA, has decided to acquire additional 10.27% stake in Aventis Pharma. Apollo Hospitals in partnership with Aventis Pharma Limited (Group sanofi- aventis) have launched the second ‘Fun Center’ for all children admitted at the Apollo Children’s Hospital in Chennai. The Board of Directors had declared an Interim Dividend of Rs. 4 per Equity share of Rs 10 for the year ending December 31, 2010. Net Sales of the company is expected to grow at a CAGR of 7% over 2008 to 2011. 1 Year Comparative Graph Aventis Pharma BSE SENSEX V.S.R. Sastry Equity Research Desk [email protected]Dr. V.V.L.N. Sastry Ph.D. Chief Research Officer [email protected]C.M.P: Target Price: Rs.1806.00 Rs.2023.00 Share Holding Pattern October 30 th , 2010
Transcript
1
Stock Data
Sector Pharmaceuticals
Face Value (Rs.) 10.00
52 wk. High/Low (Rs.) 2059.00/1474.00
Volume (2 wk. Avg.) 1265
BSE Code 500674
Market Cap (Rs.mn.) 41538.00
Financials (Rs. in mn.) CY09
CY10E CY11E
Net Sales 10525.00 11518.72 12670.59
EBIDTA 2589.00 2769.57 3029.39
PAT 1574.00 1740.65 1900.79
EPS 68.43 75.68 82.64
P/E 26.39 23.86 21.85
AVENTIS PHARMA LTD BUY F
I
R
S
T
C
A
L
L
R
E
S
E
A
R
C
H
SYNOPSIS Sanofi-aventis, one of the world's leading
pharmaceutical companies, and its 100% subsidiary, Hoechst GmbH, are the major shareholders of Aventis Pharma Limited and together hold 50.12% of its paid-up share capital.
The company exports to countries like Russia, Sri Lanka, U.K and Egypt amongst others.
Hoechst GmbH, a 100% subsidiary of
Sanofi-aventis SA, has decided to acquire additional 10.27% stake in Aventis Pharma.
Apollo Hospitals in partnership with
Aventis Pharma Limited (Group sanofi-aventis) have launched the second ‘Fun Center’ for all children admitted at the Apollo Children’s Hospital in Chennai.
The Board of Directors had declared an
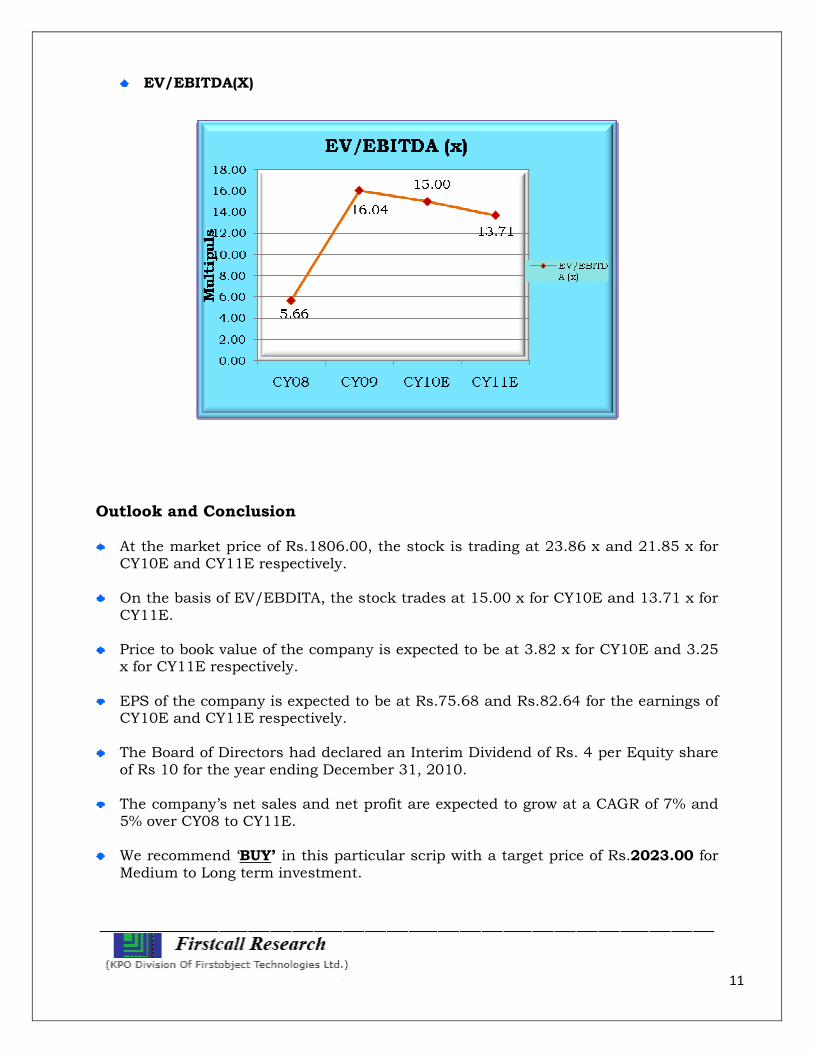
Interim Dividend of Rs. 4 per Equity share of Rs 10 for the year ending December 31, 2010.
For the third quarter, the top line of the company increased 6%YoY and stood at Rs.2936.00mn against Rs.2775.00mn of the same period of the last year. The bottom line of the company for the quarter stood at Rs.473.00mn from Rs.438.00mn of the corresponding period of the previous year i.e. an increase of 8%YoY.
4
EPS of the company for the quarter stood at Rs.20.57 for equity share of Rs.10.00 each.
Expenditure for the quarter stood at Rs.2331.00mn, which is around 6% higher than the corresponding period of the previous year. Raw material cost of the company for the quarter accounts for 32% of the sales of the company and stood at Rs.943.00mn from Rs.848.00mn of the corresponding period of the previous year i.e., an increase of 11%YoY. Other expenditure increased 13%YoY to Rs.614.00mn from Rs.544.00mn. and accounts for 21% of the revenue of the company for the quarter.
5
OPM and NPM for the quarter stood at 25% and 16% respectively from 25% and 16% respectively of the same period of the last year.
Dividend Declared The Board of Directors had declared an Interim Dividend of Rs. 4 per Equity share of Rs 10 for the year ending December 31, 2010. The dividend (including Dividend Distribution Tax) amounted to Rs.107 million.
Investments in two critical Projects Throughout 2010, the company will incur plan to expenditure in two critical projects as follows: a) “Prayas” – a Project to deliver high quality low cost healthcare to the rural
population, and b) Entering the Over The Counter (OTC) market.
6
Company Profile Sanofi‐aventis, a leading global pharmaceutical company, discovers, develops and
distributes therapeutic solutions to improve the lives of everyone. Sanofi‐aventis in
India operates through three entities ‐ Aventis Pharma Limited, Sanofi‐Synthelabo
(India) Limited and Sanofi Pasteur India Private Limited – the vaccines division of
Group sanofi‐aventis. The Global affiliate recently acquired a controlling stake in
Shantha Biotechnics in India. Sanofi‐aventis is listed in Paris (EURONEXT: SAN) and
in New York (NYSE: SNY).
Aventis Pharma (APL) was incorporated on May 1956 as Hoechst Fedco Pharma. Later
the name was changed to Hoechst Pharmaceuticals, Hoechst India and Hoechst
Marion Roussel. Sanofi-aventis is one of the world's leading pharmaceutical
companies, and its 100% subsidiary, Hoechst GmbH together hold 50.12 percent of its
paid-up share capital.
The manufacturing facilities are located at Ankleshwar (Gujarat) and Goa. Company’s
Ankleshwar has received ISO 14001 for Environment Management System. The
company exports to countries like Russia, Sri Lanka, U.K and Egypt amongst others.
7
Financials Results 12 Months Ended Profit & Loss Account (Standalone)
Value(Rs.in.mn) CY08 CY09 CY10E CY11E
Description 12m 12m 12m 12m
Net Sales 10365.00 10525.00 11518.72 12670.59
Other Income 394.00 330.00 392.65 431.92
Total Income 10759.00 10855.00 11911.37 13102.51
Expenditure -7978.00 -8266.00 -9141.80 -10073.12
Operating Profit 2781.00 2589.00 2769.57 3029.39
Interest -3.00 -1.00 0.00 0.00
Gross profit 2778.00 2588.00 2769.57 3029.39
Depreciation -182.00 -173.00 -197.59 -213.40
Profit Before Tax 2596.00 2415.00 2571.98 2815.99
Tax -934.00 -841.00 -831.33 -915.20
Net Profit 1662.00 1574.00 1740.65 1900.79
Equity capital 230.00 230.00 230.00 230.00
Reserves 7881.00 8916.00 10656.65 12557.44
Face Value 10.00 10.00 10.00 10.00
Total No. of Shares 23.00 23.00 23.00 23.00
EPS 72.26 68.43 75.68 82.64
8
Quarterly Ended Profit & Loss Account (Standalone)