AbstractThree different experimental steps were carried out. The first set ofexperiments was to select bacterial strains able to grow and degrade thepollutant (acetone or dichloromethane) as the sole organic carbon source.The second set of experiments used a batch reactor to estimate the efficiencyof the bacterial strains selected. The final set of experiments were conductedusing a suspended-growth bioscrubber which was designed, constructedand tested to determine if biomass could be supported in the system withgaseous pollutants as the only organic carbon source. The removalefficiency varied from 63 to 79 % at acetone laods between 0.6 and 3 g/hand from 67 to 72 % at dichloromethane load between 33 and 220 mg/h.The efficiency of the system appeared to depend on the mass transfer ofpollutants, the liquid recycle rate and the system flow rate. The presence of astable biomass population indicated successful absorption and thedegradation of the pollutants.
1 IntroductionInto the atmosphere as a consequence of industrial activity, the release ofvolatile organic compounds (VOC) is one of the most significantenvironmental public concerns. It has been estimated that 2874 tonnes ofVOC (natural sources are not taken into account) are emitted in France in1985 and 1924 tonnes in 1991 (ADEME, 1994). Tchobanoglous andBurton (1991) defined VOC as organic compounds that have a boilling pointwhich is less than or equal to 100°C and /or a vapour pressure which isgreater than 1 mm Hg at 25°C. This make them become volatile whenexposed to air. These pollutants are often toxic, cause odour problems, andproduce smog (Le Cloirec et al. 1991; Chang, 1992).
Several methods are available to control VOC emissions from fixedsources including thermal incineration, condensation, and scrubbing.Physical absorption or wet scrubbing is the mechanism whereby volatilecompounds are removed from the gas phase by absorbing them in a liquidwhich can be typically water or other organic solvents like silicon oil
(Penaud, 1989) or polyethylene glycols (Azou, 1991). After the masstransfer, the liquid phase must be regenerated or treated to remove thecontaminant Chemical reagents can be added to neutralize acidic or alkaline,oxidize the absorbed compounds to carbon dioxide, water, and othermineral by-products, allowing the recirculation of the liquid phase.Biological treatment is particularly attractive since biochemical oxidationusually results in mineralisation, destroying the toxic nature of the pollutant.Biological oxidation may complete the other standard methods of control toachieve more reduction of emissions of organic air pollutants.
There are three common biological processes for treating wastegases: biofilters, trickling filters, and suspended-growth bioscrubbers(Ottengraf, 1986; Overcamp et al. 1992, Le Cloirec et al. 1991). Biofilterspass waste gases through soil, compost, or peat beds, (recently Le Cloirecet al. (1993) used dry sludge coming from wastewater treatment plant as afilter bed). Micro-organisms growing on the bed medium degrade thepollutants contained in the gas stream. A trickling filter pass waste gasesthrough a packed tower. Water is recycled through a packing to absorb thepollutant and to keep the biofilm wet and supplied with essential nutrients.The pollutant diffusing into the biofilm is degraded. A suspended-growthbioscrubber circulates a biomass slurry between an absorber and anoxidation reactor. The pollutant is absorbed and may be partially degraded inthe absorber unit. The remaining pollutant is degraded in the oxidationreactor. Biological treatment of waste gases is accomplished by bringing thepolluted gas stream into contact with appropriate micro-organisms, whichdegrade the organic compounds (Ottengraf, 1987). Most biogenic ornaturally occurring compounds can easily be degraded by microorganismsby aerobic metabolic processes. Biological oxidation of pollutants leads tonew cell material, carbon dioxide, water and other by-products dependingon the absorbed pollutants (e.g. chloride, sulphur, sulphate,...). Not allxenobiotics compounds can be degraded by biochemical processes underaerobic conditions. For "recalcitrant" xenobiotics, special micro-organismsable to eliminate products which are strange to life must be selected. Othercompounds, such as trichloroethylene, can only be degraded aerobically bycometabolic processes where the bacteria degrade a primary substratethrough metabolic processes. There are also xenobiotics called "persistent"for which biological treatment is not effective.
The primary goals of this research were to design, construct, and testa biological scrubber to remove VOC from a gaseous waste stream. Asuspended-growth bioscrubber was tested using acetone anddichloromethane as pollutants. Experiments demonstrated that an activeviable biomass population could be developed in scrubber with the onlyorganic carbon source coming from the gas phase. In order to determinetheir effect on the system, operational parameters were varied. This researchreports the finding of these experiments.
2 Materials and methods :
2 / BiomassThe microorganisms used in these experiments were derived from anactivated sludge obtained from a local domestic wastewater treatment plant.To select spontaneous dichloromethane or acetone utilizing mutants, cultureswere grown under non sterile conditions. The temperature of the cultureswas maintained at 22-23°C. Approximately 1.5 litre of activated sludge
containing 3.5 g of mixed liquor suspended solids (MLSS) per litre weresuspended in nutrient solution and exposed to pollutant in 2 liters lab-scale,semi-continuous batch system at 200 mg/1 for acetone and 50 mg/1 fordichloromethane. Enriched cultures were acclimatized to metabolize thepollutants. The pH of the cultures was kept at 7.5 using 30 % NaOHsolution as a neutralizing agent. The composition of the nutrient solutionused was identical for the enrichissment of biomass in the scrubberexperiment (see below). To ensure satisfactory acclimatization of micro-organisms, biomass was fed only with the pollutant as the sole carbon andenergy source for two weeks. At the end of this period, the acclimatizedculture was used to inoculate the biological scrubber. The batch system wasaerated (100 ml/min) with a sparger placed at the bottom of the bioreactor.Because of their low boilling point and high vapour pressure (Table 1)acetone and dichloromethane are difficult to handle. For the acetoneexperiments, an absorber containing sodium bisulphite (4%c in water) wasplaced at the output of the vessel. In this way, the evaporated acetone (about20 % per 24 h) was trapped and analyzed by GC. A mass balance equationwas used to quantify the amount of the biodegraded acetone. Concerning thedichloromethane tests, the chloride concentration resulting fromdichloromethane degradation was measured in the liquid phase in order todetermine the biodegradation yield.
2 2 Nutrients and growth conditions
The nutritive solution (solution A) which supplied inorganic compoundsnecessary for biomass growth contains (g per litre) : (NH4)2SO4 25,,KH2PO4 40, K2HPO4 40, pH = 7.5. The solution A was added to theacclimatized biomass according to the general ratio formula : C / N / P = 1501511. Moreless, 10ml of the solution B (Trace elements g/1 : CuSO4 0.04,MnSO4 0.02, NaMoO4 0.004, ZnSO4 0.003, CaSO4 0.05, MgSO4 0.5,FeSO4 0.01, pH adjusted to 7.5) were added per litre of the culture mediumto minimize the possibility of nutrient limitations.
2 3 Model pollutants
For these experiments acetone and dichloromethane were chosen as theorganic pollutants because they show different characteristics as shown inTable 1 which summarizes some of their physical and chemical properties.In addition, acetone and dichloromethane are common solvents emitted bymany industries. Acetone and dichloromethane from Carlo Erba was used.For all the experiments acetone or dichloromethane introduced into the airstream were the sole carbon source for the biomass.
PropertiesSolubility in waterBiodegradabilityMelting pointBoiling pointSpecific gravityHenry's law constant (25°C)Vapour pressure
Acetonevery solublebiodegradable-94.6°C56.5°C0.792 g/ml0.0015200 mm Hg at 22.7°C
The inlet or outlet gazeous pollutants were analyzed by gas chromatography(Hewlett-Packard 5890 serie II model) equiped with a flame ionisationdetector. The analytical column was the HP1 capillary column crosslinkedwith methylsilicone gum. Compounds were eluted from the columnisothermally at an oven temperature of 60°C The carrier gas was helium at aflow rate of 25 ml/min. Calibration was carried out by injecting 5 ml of aprepared gas at different concentrations. The detector response was linearover the studied concentration range (25 mg/nP to 100 g/nv*). Theconcentration of pollutants in the liquid phase was measured with a totalcarbon analyser (Shimadzu TOC 5000 model). Each sample (5 ml) was
filtered through a 0,45 |im membrane and analyzed immediately aftersampling. The MLSS concentration was determined according toNFT 90-105. The amount of chloride generated by dichloromethane degradation wasdetermined according to NF T 91-014.2 5 Experimental procedure
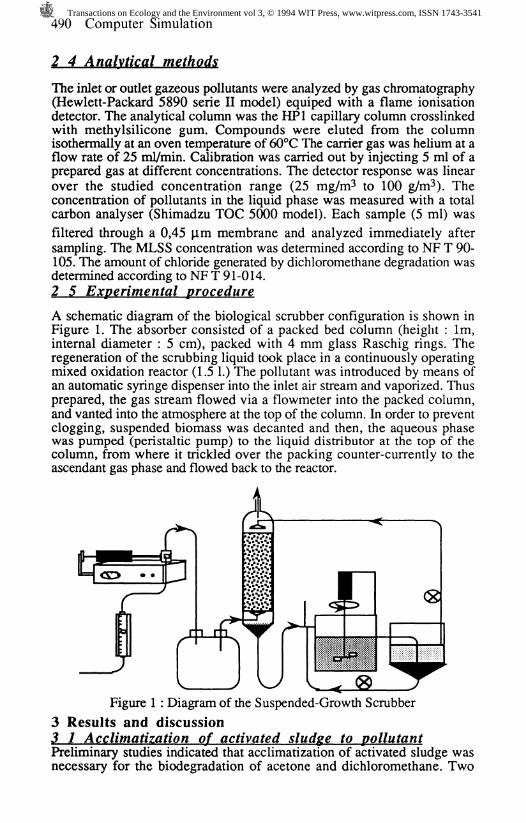
A schematic diagram of the biological scrubber configuration is shown inFigure 1. The absorber consisted of a packed bed column (height : 1m,internal diameter : 5 cm), packed with 4 mm glass Raschig rings. Theregeneration of the scrubbing liquid took place in a continuously operatingmixed oxidation reactor (1.5 1.) The pollutant was introduced by means ofan automatic syringe dispenser into the inlet air stream and vaporized. Thusprepared, the gas stream flowed via a flowmeter into the packed column,and vanted into the atmosphere at the top of the column. In order to preventclogging, suspended biomass was decanted and then, the aqueous phasewas pumped (peristaltic pump) to the liquid distributor at the top of thecolumn, from where it trickled over the packing counter-currently to theascendant gas phase and flowed back to the reactor.
Figure 1 : Diagram of the Suspended-Growth Scrubber
3 Results and discussion3 1 Acclimatization of activated sludge to pollutantPreliminary studies indicated that acclimatization of activated sludge wasnecessary for the biodegradation of acetone and dichloromethane. Two
activated sludge reactors were operated for 2 weeks with concentrations of3.5 mM for acetone culture and 1 mM for dichloromethane culture addeddaily. Acclimatisation of the two cultures was inferred by measuring TOCand MLSS concentration in the reactors as a function of time. For thedichloromethane exposed culture the scum was usually renewed in order toeliminate high chloride concentration in the batch reactor coming fromdichloromethane degradation. Chloride concentration was also monitored.
100-
80 -
60-
40 -
20-
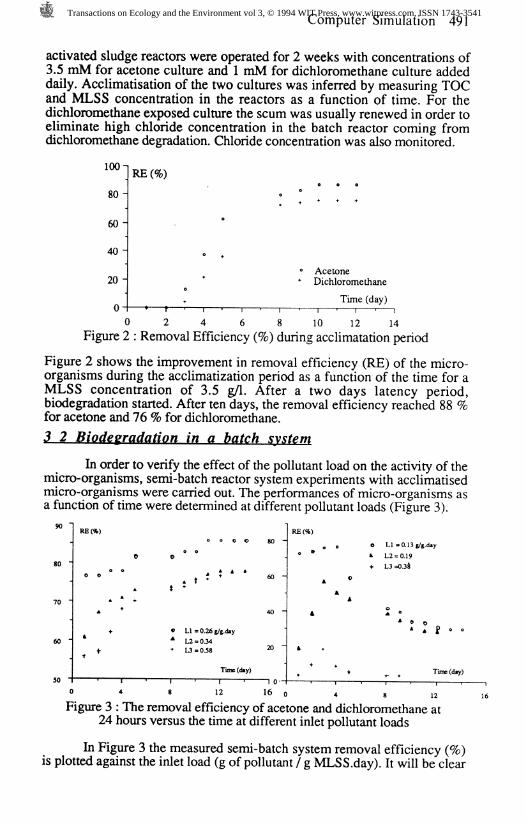
RE(%)
AcetoneDichloromethane
Time (day)
0 2 4 6 8 10 12 14Figure 2 : Removal Efficiency (%) during acclimatation period
Figure 2 shows the improvement in removal efficiency (RE) of the micro-organisms during the acclimatization period as a function of the time for aMLSS concentration of 3.5 g/1. After a two days latency period,biodegradation started. After ten days, the removal efficiency reached 88 %for acetone and 76 % for dichloromethane.
3 2 Biodegradation in a batch system
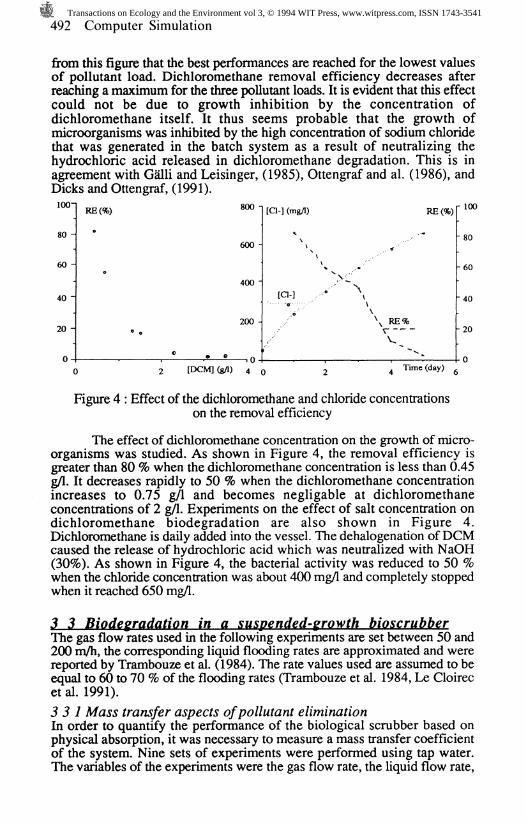
In order to verify the effect of the pollutant load on the activity of themicro-organisms, semi-batch reactor system experiments with acclimatisedmicro-organisms were carried out. The performances of micro-organisms asa function of time were determined at different pollutant loads (Figure 3).
RE(%)
LI = 0.26 g/g.dayL2 = 034
Tire (day)
RE(%)0 LI =0.1 3 g/g.day& L2=0.19+ L3 =0.38
Time (day)
12—I o16 o
Figure 3 : The removal efficiency of acetone and dichloromethane at24 hours versus the time at different inlet pollutant loads
In Figure 3 the measured semi-batch system removal efficiency (%)is plotted against the inlet load (g of pollutant / g MLSS.day). It will be clear
from this figure that the best performances are reached for the lowest valuesof pollutant load. Dichloromethane removal efficiency decreases afterreaching a maximum for the three pollutant loads. It is evident that this effectcould not be due to growth inhibition by the concentration ofdichloromethane itself. It thus seems probable that the growth ofmicroorganisms was inhibited by the high concentration of sodium chloridethat was generated in the batch system as a result of neutralizing thehydrochloric acid released in dichloromethane degradation. This is inagreement with Galli and Leisinger, (1985), Ottengraf and al. (1986), andDicks and Ottengraf, (1991).100-1
80 -
40 -
20 -
RE(%)
600 -
60 - o400 -
200 -
-.0
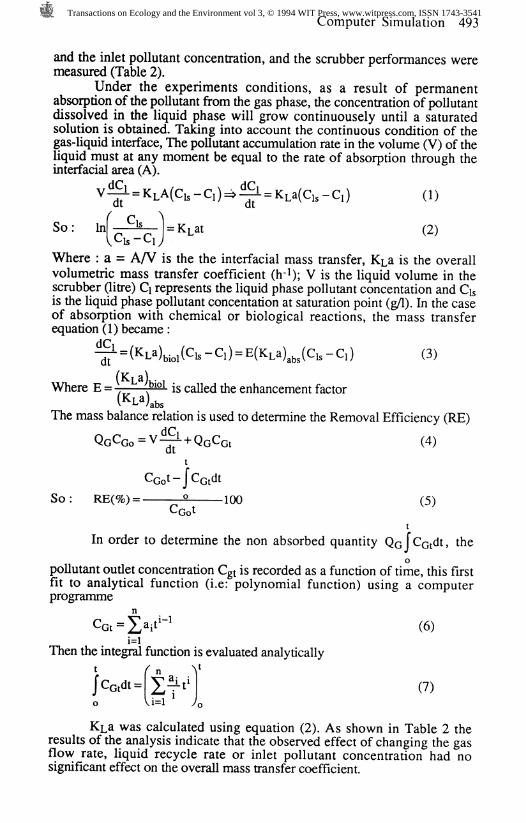
[C1-] (mg/1) RE (%)
\
RE%\ — —
100
- 80
-40
-20
0 2 [DCM] (g/1) 40 2 4 Time (day) ^
Figure 4 : Effect of the dichloromethane and chloride concentrationson the removal efficiency
The effect of dichloromethane concentration on the growth of micro-organisms was studied. As shown in Figure 4, the removal efficiency isgreater than 80 % when the dichloromethane concentration is less than 0.45g/1. It decreases rapidly to 50 % when the dichloromethane concentrationincreases to 0.75 g/1 and becomes negligable at dichloromethaneconcentrations of 2 g/1. Experiments on the effect of salt concentration ondichloromethane biodegradation are also shown in Figure 4.Dichloromethane is daily added into the vessel. The dehalogenation of DCMcaused the release of hydrochloric acid which was neutralized with NaOH(30%). As shown in Figure 4, the bacterial activity was reduced to 50 %when the chloride concentration was about 400 mg/1 and completely stoppedwhen it reached 650 mg/1.
3 3 Biodegradation in a suspended-growth bioscrubberThe gas flow rates used in the following experiments are set between 50 and200 m/h, the corresponding liquid flooding rates are approximated and werereported by Trambouze et al. (1984). The rate values used are assumed to beequal to 60 to 70 % of the flooding rates (Trambouze et al. 1984, Le Cloirecet al. 1991).
331 Mass transfer aspects of pollutant eliminationIn order to quantify the performance of the biological scrubber based onphysical absorption, it was necessary to measure a mass transfer coefficientof the system. Nine sets of experiments were performed using tap water.The variables of the experiments were the gas flow rate, the liquid flow rate,
and the inlet pollutant concentration, and the scrubber performances weremeasured (Table 2).
Under the experiments conditions, as a result of permanentabsorption of the pollutant from the gas phase, the concentration of pollutantdissolved in the liquid phase will grow continuousely until a saturatedsolution is obtained. Taking into account the continuous condition of thegas-liquid interface, The pollutant accumulation rate in the volume (V) of theliquid must at any moment be equal to the rate of absorption through theinterfacial area (A).
(2)
Where : a = A/V is the the interfacial mass transfer, K^a is the overallvolumetric mass transfer coefficient (h-i); V is the liquid volume in thescrubber (litre) Q represents the liquid phase pollutant concentation and QSis the liquid phase pollutant concentation at saturation point (g/1). In the caseof absorption with chemical or biological reactions, the mass transferequation (1) became :
The mass balance relation is used to determine the Removal Efficiency (RE)
(4)
So: RE(%) = - * - 100 (5)
In order to determine the non absorbed quantity QcCctdt, the
pollutant outlet concentration Cgt is recorded as a function of time, this firstfit to analytical function (i.e: polynomial function) using a computerprogramme
n
C"Gt "]L* (6)
Then the integral function is evaluated analytically
t ( n V
jcctdt= XTM (7)I • 1 * I1=1
KLa was calculated using equation (2). As shown in Table 2 theresults of the analysis indicate that the observed effect of changing the gasflow rate, liquid recycle rate or inlet pollutant concentration had nosignificant effect on the overall mass transfer coefficient.
Table 2 : Summary of experiment results of Acetone and DCM gazabsorption.
For the system using tap water as the scrubbing liquid. Removalefficiency ranged from 55 % to 70 % for acetone absorption and from 48 %to 56 % for dichloromethane absorption. Table 2 summarizes the efficiencyof the system for physical absorption. It is useful to compare the UL/UG ratioto the removal efficiency for the system. Figure 5 shows that as UL/UGincreases, removal efficiency improves, indicating the existence of a masstransfer resistance. This agrees with Hartman and Tramper's research(1991). The highest removal efficiency was achieved at the highest UL/UGratio. This is consistent with the theory of physical absorbers.
• Cgo = 0.25g/m3 -^10^* Cgo = 0.50* n ^+ Cgo = 1 G
Figure 5 : UI/UG ratio vs scrubber efficiency332 Pollutant biodegradation with a suspended-growthbioscrubberThe three variables in the experiments were the liquid and the gas flow ratesthrough the absorber, and the inlet pollutant concentration. The first studiescarried out with 5 g/1 of biomass concentration and values of liquid and gasflow rates similar to those used in physical absorption showed the recyclingof liquid was hindred due to the density of the slurry in the packingincreasing drop pressure in the column causing it to fill up after working forthree days. It was therefore necessary to reduce the biomass concentration
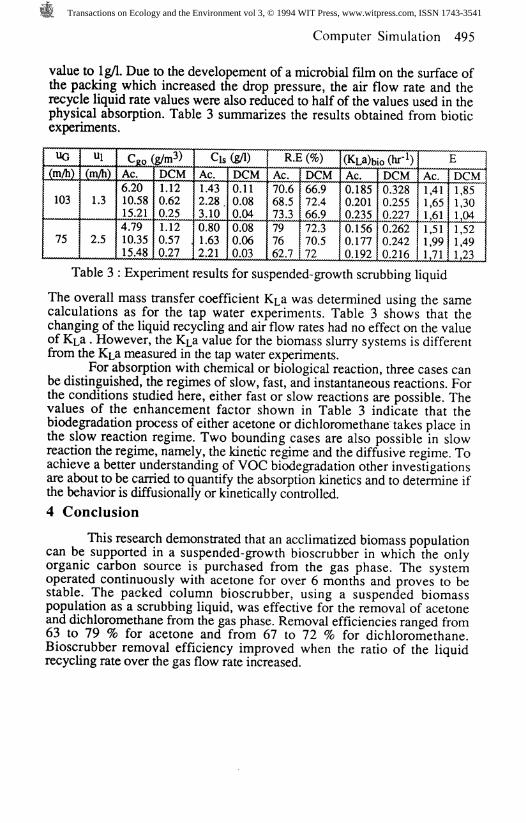
value to lg/1. Due to the developement of a microbial film on the surface ofthe packing which increased the drop pressure, the air flow rate and therecycle liquid rate values were also reduced to half of the values used in thephysical absorption. Table 3 summarizes the results obtained from bioticexperiments.
UG(m/h)
103
75 \
Ul(m/h)
1.3
2.5
...CjjQ.(Ac.6.2010.5815.214.7910.3515.48
g/m3)DCM1.120.620.251.120.57 :0.27 !
Qs(g/l)Ac.1.432.283.100.801.632.21
DCM0.110.080.040.080.060.03
R.E (%)
Ac.70.668.573.3797662.7
DCM66.972.466.972.370.572
(KLa)bio(hr-l)Ac.0.1850.2010.2350.1560.1770.192
DCM0.3280.2550.2270.2620.2420.216 I
EAc1,411,651,611,511,991,71 i
DCM1,851,301,041,521,491,23
Table 3 : Experiment results for suspended-growth scrubbing liquid
The overall mass transfer coefficient K^a was determined using the samecalculations as for the tap water experiments. Table 3 shows that thechanging of the liquid recycling and air flow rates had no effect on the valueof K^a . However, the K^a value for the biomass slurry systems is differentfrom the K^a measured in the tap water experiments.
For absorption with chemical or biological reaction, three cases canbe distinguished, the regimes of slow, fast, and instantaneous reactions. Forthe conditions studied here, either fast or slow reactions are possible. Thevalues of the enhancement factor shown in Table 3 indicate that thebiodegradation process of either acetone or dichloromethane takes place inthe slow reaction regime. Two bounding cases are also possible in slowreaction the regime, namely, the kinetic regime and the diffusive regime. Toachieve a better understanding of VOC biodegradation other investigationsare about to be carried to quantify the absorption kinetics and to determine ifthe behavior is diffusionally or kinetically controlled.
4 Conclusion
This research demonstrated that an acclimatized biomass populationcan be supported in a suspended-growth bioscrubber in which the onlyorganic carbon source is purchased from the gas phase. The systemoperated continuously with acetone for over 6 months and proves to bestable. The packed column bioscrubber, using a suspended biomasspopulation as a scrubbing liquid, was effective for the removal of acetoneand dichloromethane from the gas phase. Removal efficiencies ranged from63 to 79 % for acetone and from 67 to 72 % for dichloromethane.Bioscrubber removal efficiency improved when the ratio of the liquidrecycling rate over the gas flow rate increased.
1. ADEME (1994), Rapport interne2. Azou. A, (1991), Reduction des Emissions atmospheriques de composesorganiques volatils. Adsorption - absorption - regeneration in situ. These,University de Rennes I. Rennes, France.3. Chang H, (1992), An antegrated theory for suspended-growthbioscrubbers, M.S Thesis, Clemson University, Clemson, S. C. USA.4. Dick R.M.M., Ottengraf S.P.P. (1991), Verification studies of asimplified model for removal of Dichloromethane from waste gases using abiological trickling filter, Bioprocess Eng., Part I, 6, 93-99.5. Galli R. And Leisinger Th., (1985), Specialided bacterial strains for theremoval of dichloromethane from industrial waste, Conservation &Recyclings, 1/2,91-100.6. Gardy C. P. L., Jr., Lim H. C., (1980), Biological wastewatertreatment, Marcel Dekker inc., New York.7. Gary M. Klecka, (1982), Fate and effects of methylene chloride inactivated sludge, App Env Microbiol, 44, 3, 701-707.8. Hartman S. Tramper J., (1991), Dichloromethane removal from wastegases with a trickle-bed bioreactor, Bioprocess Eng., 6 (3), 83-92.8. Kirchner K., Kramer P., Rehm H. J., (1985), absorption and oxydationof pollutants using bacterial cultures (monocultures), Intern. Chem. Eng,25, 3, 428-435.9. Le Cloirec P., Fanlo J. L., Degorce-Dumas J. R. (1991), Traitement desodeurs et desodorisation Industrielle. Techtendances, Innovation 128, 24rue du quatre septembre, 75002 Paris. France.10. Leson G., Winer A. M., (1991), biofiltration : an inovative air pollutioncontrol technology for VOC emission, J. Air. Waste Management Ass, 41,8, 1045-1054.11. Morchadi J, Motha G, Rouger J, (1993), "AOX transformation andchloride formation in batch activated sludge treatment of kraft bleachingeffluents", Pulp and Paper Technologies for a Cleaner World, Intern. Env.Symp. (Paris). France12. Morchadi J (1994), Transfert gaz-liquide en systeme biotique etabiotique. Application a 1'elimination des COV. These, I. N. P. Grenoble,Ecole des Mines d'Al&s. France (soutenance prevue en 1994).13. Ottengraf S. P. P, Meesters J. J. P, Van Den Oever A. H. C, RozemaH. R, (1986), Biological Elimination of volatile xenobiotic compounds inbiofilters, Bioprocess Eng., 1, 61-69.14. Ottengraf S. P. P, (1986), Exhaust gas purification, in Biotechnology,Rehm H. J. Reed G. Eds., 12, 8, Verlagsgesellschaft, Weinheim,Germany, 426-452.15. Ottengraf S. P. P, (1987), Biological systems for waste gas elimination,Trends in Biotechn., 5, 132-136.16. Penaud F, (1989), Etude en reacteur de la biodegradation de certainscomposes xenobiotiques apportes en phase liquide ou gazeuse. These,Universite de Technologic de Compiegne, France.17. Tchobanoglous G., Burton F. L. (1991), Waste Water Engineering : :Treatment, disposal and reuse, 3rd Ed., Metcalf & Eddy Inc., McGraw-HillInc , N Y.18. Trambouze T., Van Landeghem H., Wauquier J. P. (1984), Lesreacteurs chimiques, Edition Technip, Paris.