50
AVEREM Process Engineering 20.04.2016 AVEREM Process Engineering - Services and Specialties - Equipment – Methods – Balances – Models
AVEREM Process Engineering
20.04.2016
AVEREM Process Engineering
- Services and Specialties -
Equipment – Methods – Balances – Models
AVEREM Process Engineering
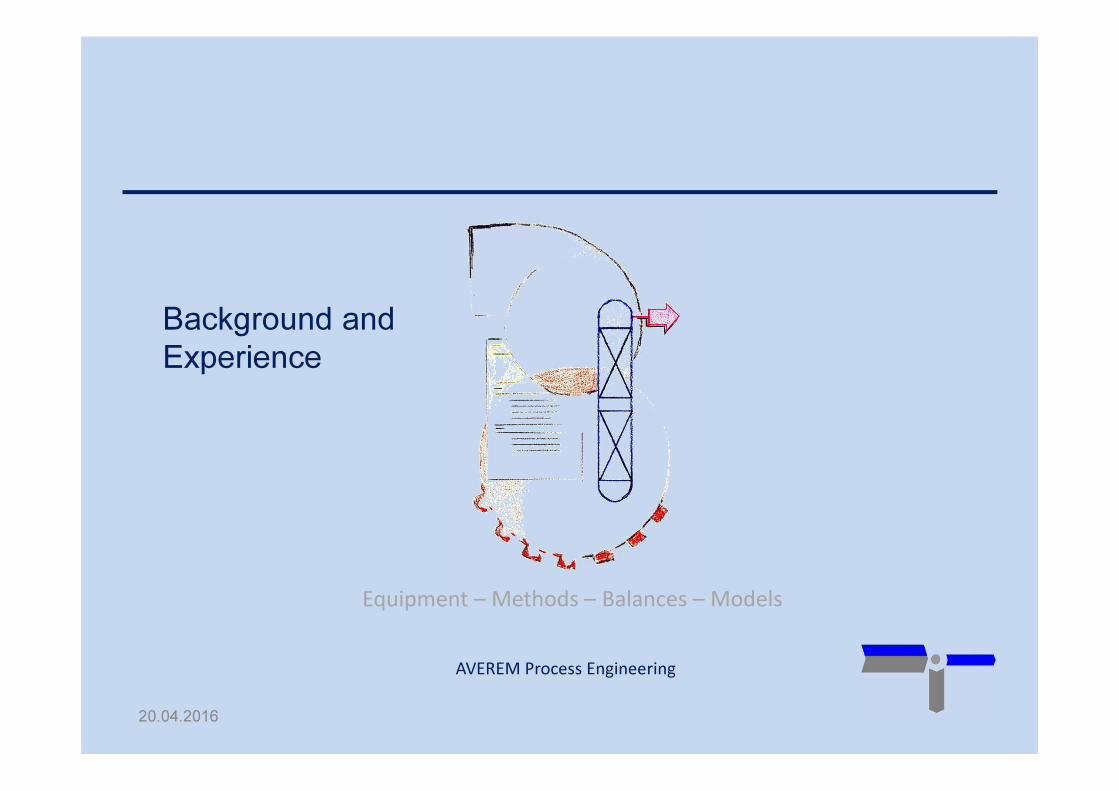
Background and
Experience
Equipment – Methods – Balances – Models
20.04.2016
AVEREM Process Engineering
Martin Schottler - Educational Background
� Study of Chemistry at the universities of Saarbrücken and Darmstadt (Germany)
� Master- and PhD thesis in the sector of gas phase reaction kinetics and chemistry/physics of
flames.
� 1982 Master thesis, 1986 PhD thesis completed.
� 1987 - 1989 Siemens Mikroelektronik Technologiezentrum, Munich (Germany) -
Semiconductor processing and engineering, mainly wet processes.
� 1989 - 1996 Hoechst AG, Dept. of Process Engineering (Group: reaction engineering),
Frankfurt (Germany)
� 1996 - 2010 MEISSNER+WURST / M+W Zander / M+W Group, Stuttgart (Germany)
Design support for high tech facility installations like in semiconductor or
solar fabs.
� 2010 - 2013 Consulting as a freelancer
� 2014 – today Foundation of AVEREM, Managing Director
07.11.1320.04.2016
Equipment – Methods – Balances – Models

AVEREM Process Engineering
Branches and Industries - Experience
07.11.1320.04.2016
Equipment – Methods – Balances – Models
AVEREM Process Engineering
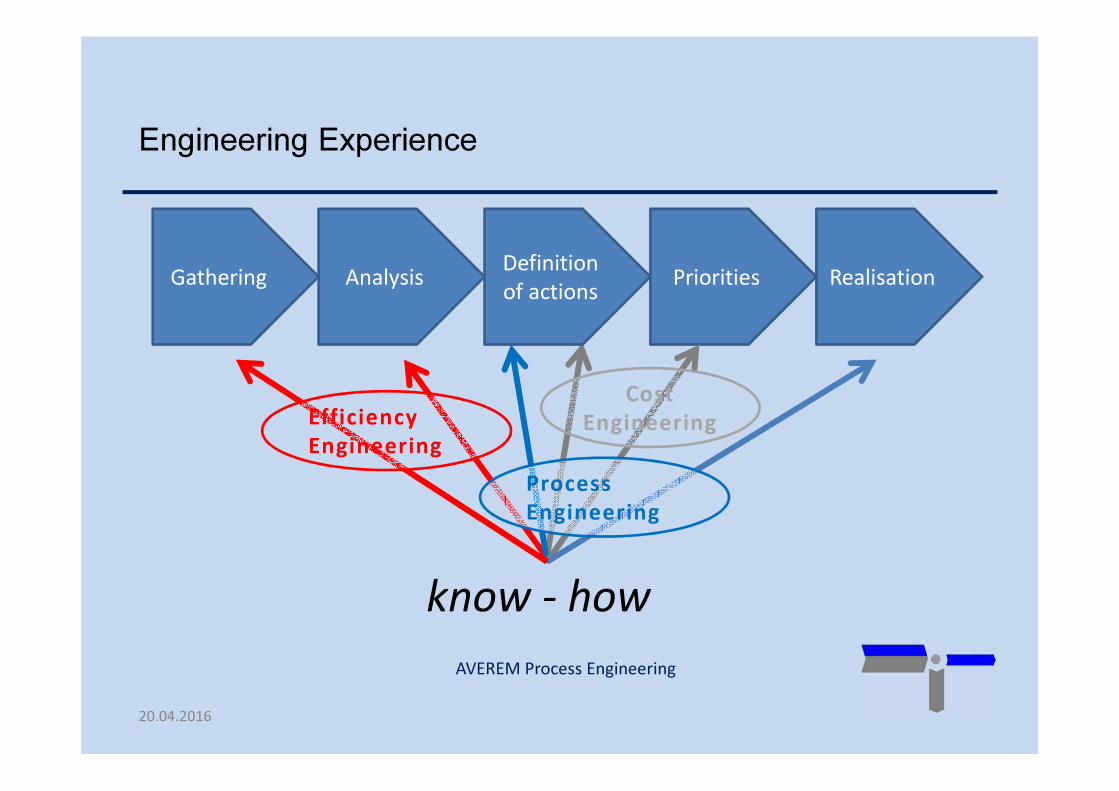
Engineering Experience
Gathering AnalysisDefinition
of actionsPriorities Realisation
know - how
Efficiency
Engineering
Process
Engineering
Cost
Engineering
20.04.2016
AVEREM Process Engineering
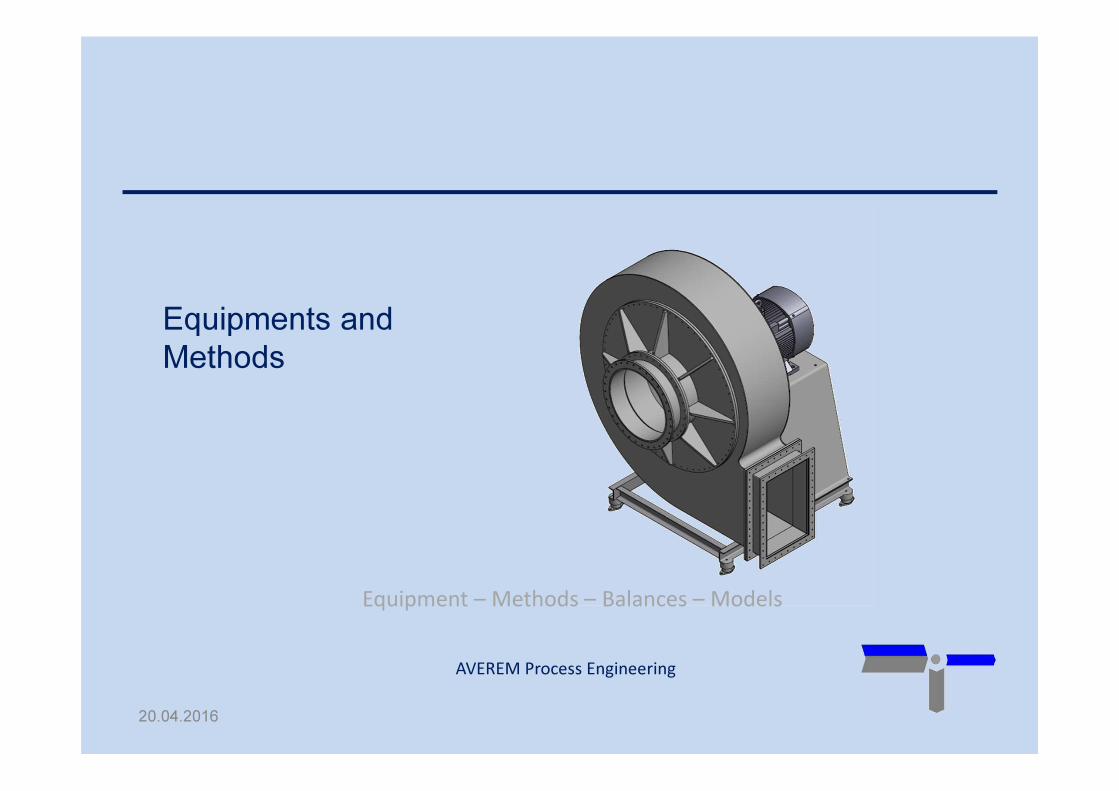
Equipments and
Methods
Equipment – Methods – Balances – Models
20.04.2016

AVEREM Process Engineering
Equipments and Methods - Specialties
� VOC Exhaust Treatment
� Oxidation, Adsorption, Biology
� Condensation Plants for Solvent Recovery
� Ecobalance of VOC treatment
� Aqueous/Solvent wet absorbers („Wet Scrubbers“)
� Corrosives, Solvents
� Nitrous Gases (Process Choice vs. DENOX)
� Dry Absorber Configuration and Geometry
� Chemical Absorption, Effiency and Lifetime
� Flow Pattern
� Recommendation of Process – Dimensioning – Process Total Cost
Comparison
07.11.1320.04.2016
AVEREM Process Engineering
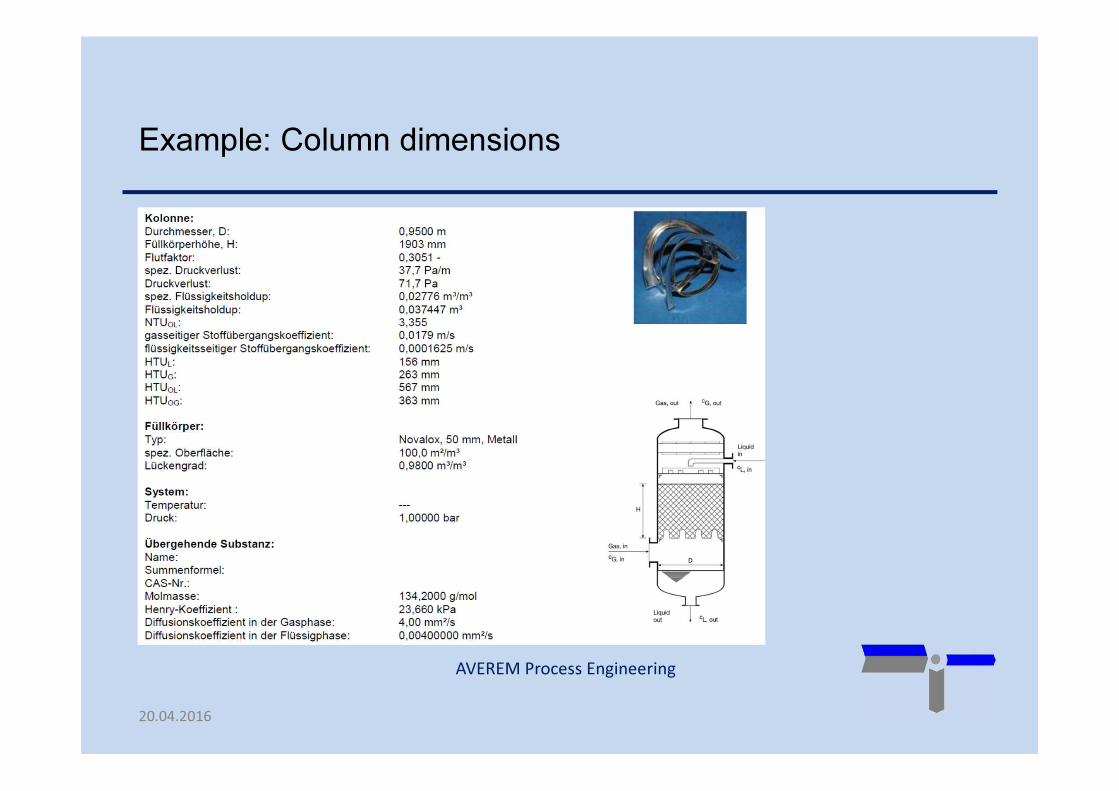
Example: Column dimensions
20.04.2016
AVEREM Process Engineering
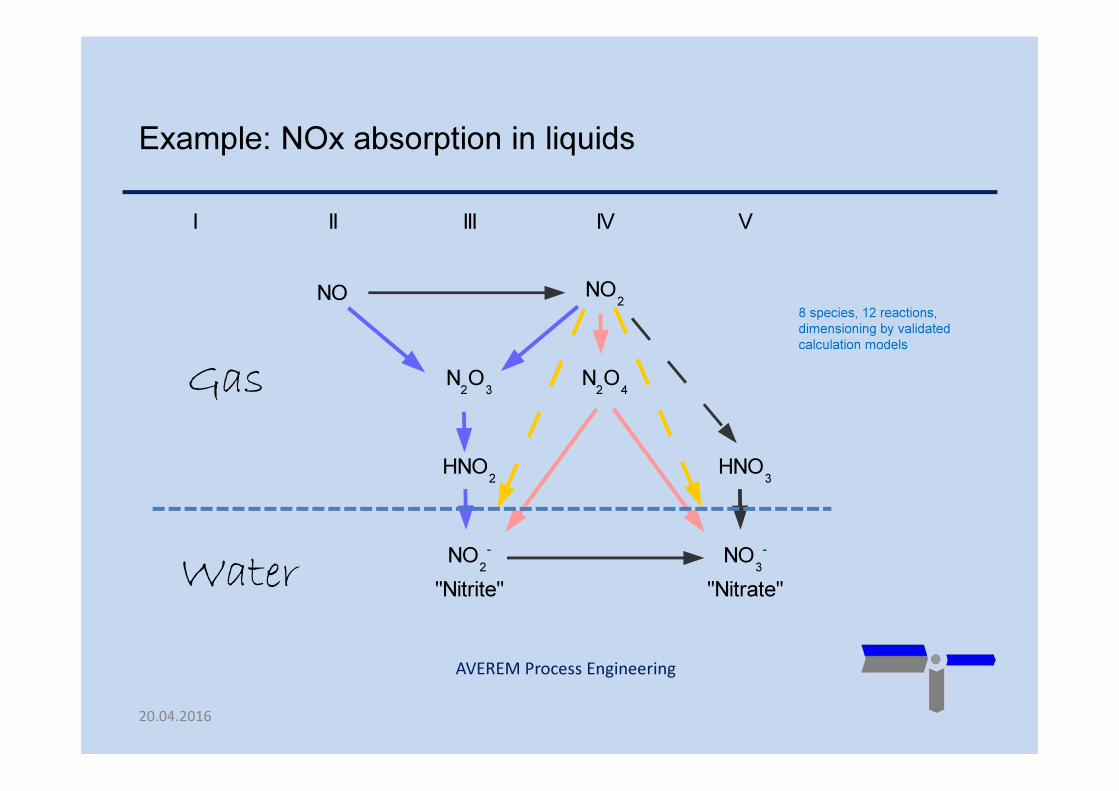
Example: NOx absorption in liquids
07.11.13
I II III IV V
NO
"Nitrite" "Nitrate"
NO2
N2O
3N
2O
4
HNO2
HNO3
NO2
-NO
3
-
Water
Gas
8 species, 12 reactions,
dimensioning by validated
calculation models
20.04.2016
AVEREM Process Engineering
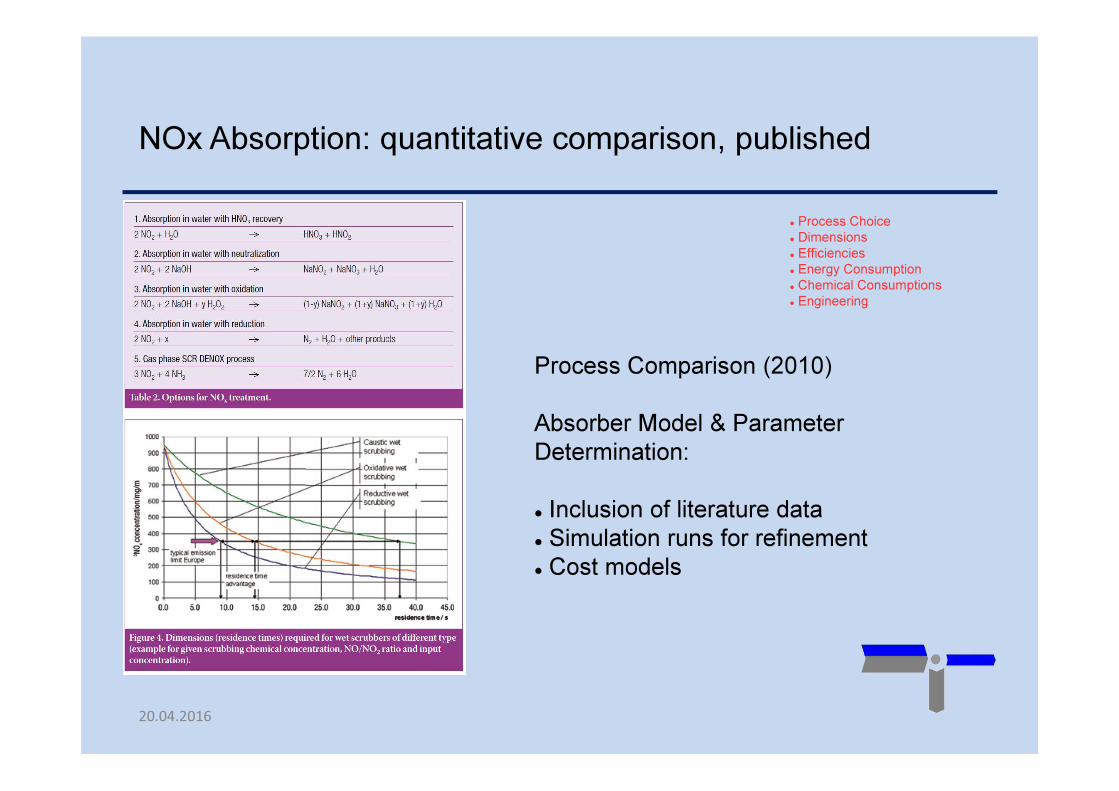
NOx Absorption: quantitative comparison, published
07.11.13
Process Comparison (2010)
Absorber Model & Parameter
Determination:
� Inclusion of literature data
� Simulation runs for refinement
� Cost models
� Process Choice
� Dimensions
� Efficiencies
� Energy Consumption
� Chemical Consumptions
� Engineering
20.04.2016
AVEREM Process Engineering
Balances and
Models
07.11.1320.04.2016
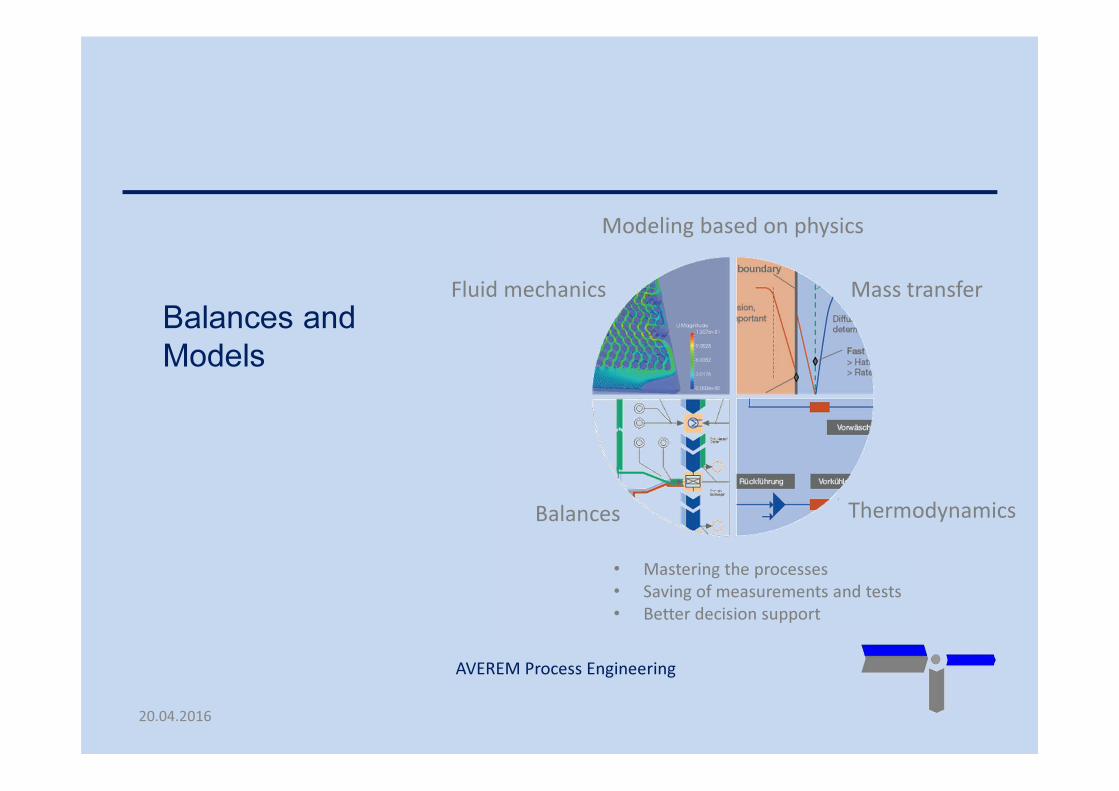
Modeling based on physics
Mass transferFluid mechanics
Balances Thermodynamics
• Mastering the processes
• Saving of measurements and tests
• Better decision support

AVEREM Process Engineering
Balances and Models
� Thermodynamic process models („Flowsheets“)
� Reaction Kinetics, homogeneous and heterogeneous reactions
� Mass Transfer gas-liquid� Rates of evaporation
� Rates of absorption
� Coupled absorption/reaction processes
� CFD (Computational fluid dynamics) calculations� Pipe flow pattern, vessel flow pattern
� Room air flow, stack flow, air flow around buildings
� „Bird's Eye“ Balances using Sankey Diagrams� Material and energy flow
� Cost flow
� Audit for capacities and reserves
� Ecobalance and CO2Footprint
07.11.1320.04.2016
AVEREM Process Engineering
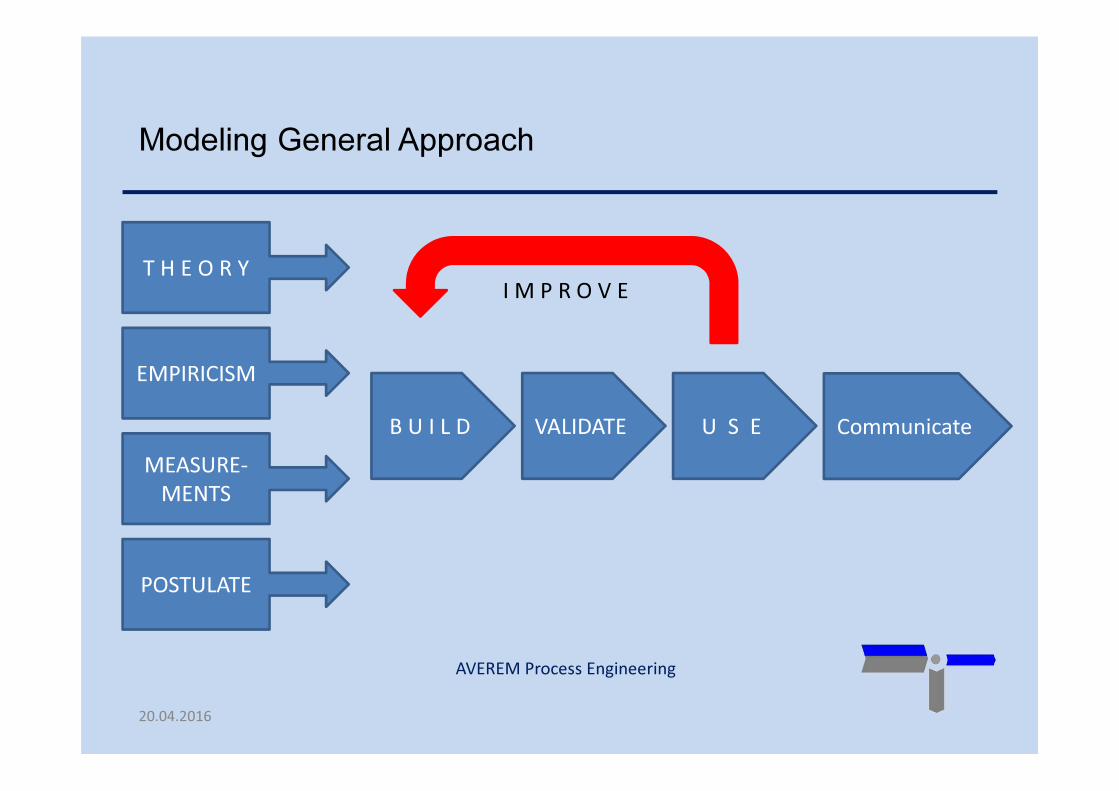
Modeling General Approach
T H E O R Y
EMPIRICISM
MEASURE-
MENTS
POSTULATE
B U I L D VALIDATE U S E
I M P R O V E
Communicate
20.04.2016

AVEREM Process Engineering
The Underestimation Award for Process Modelling
U1 = Underestimation of Communication Difficulties
U2 = Underestimation of Validation Time and Effort
U3 = Underestimation of Model Maintenance
20.04.2016
Our experience will help to
overcome underestimation
AVEREM Process Engineering
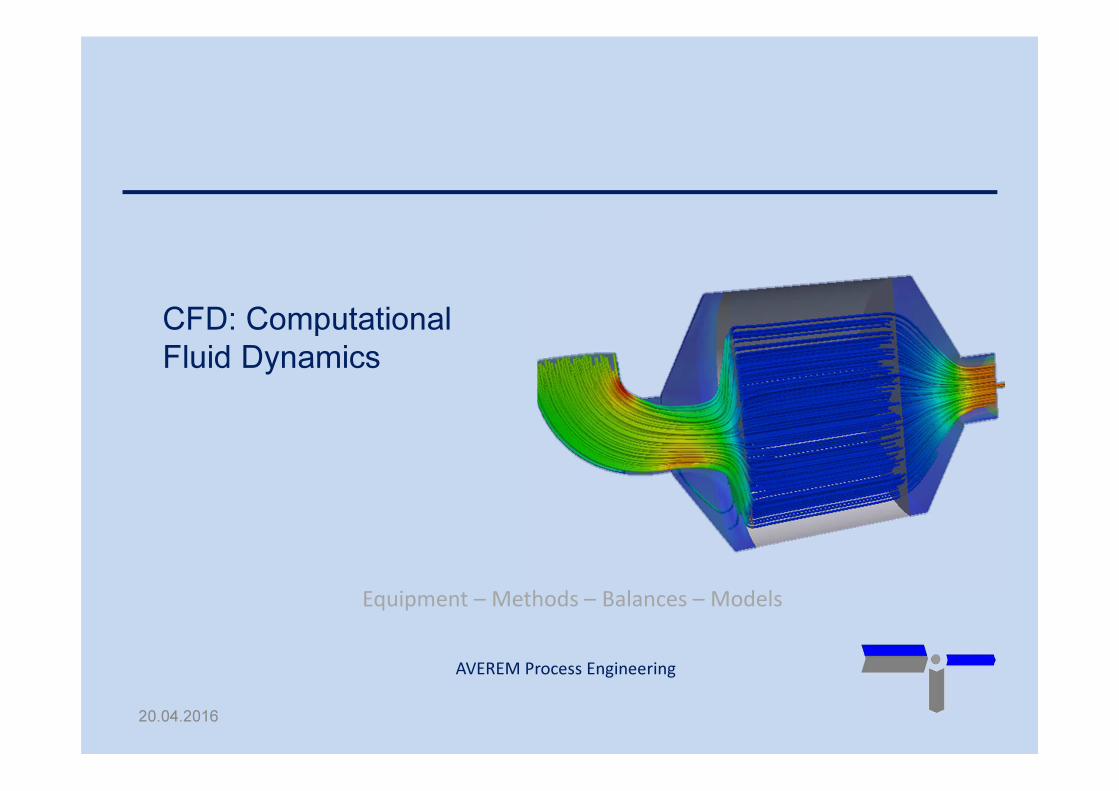
CFD: Computational
Fluid Dynamics
20.04.2016
Equipment – Methods – Balances – Models
AVEREM Process Engineering
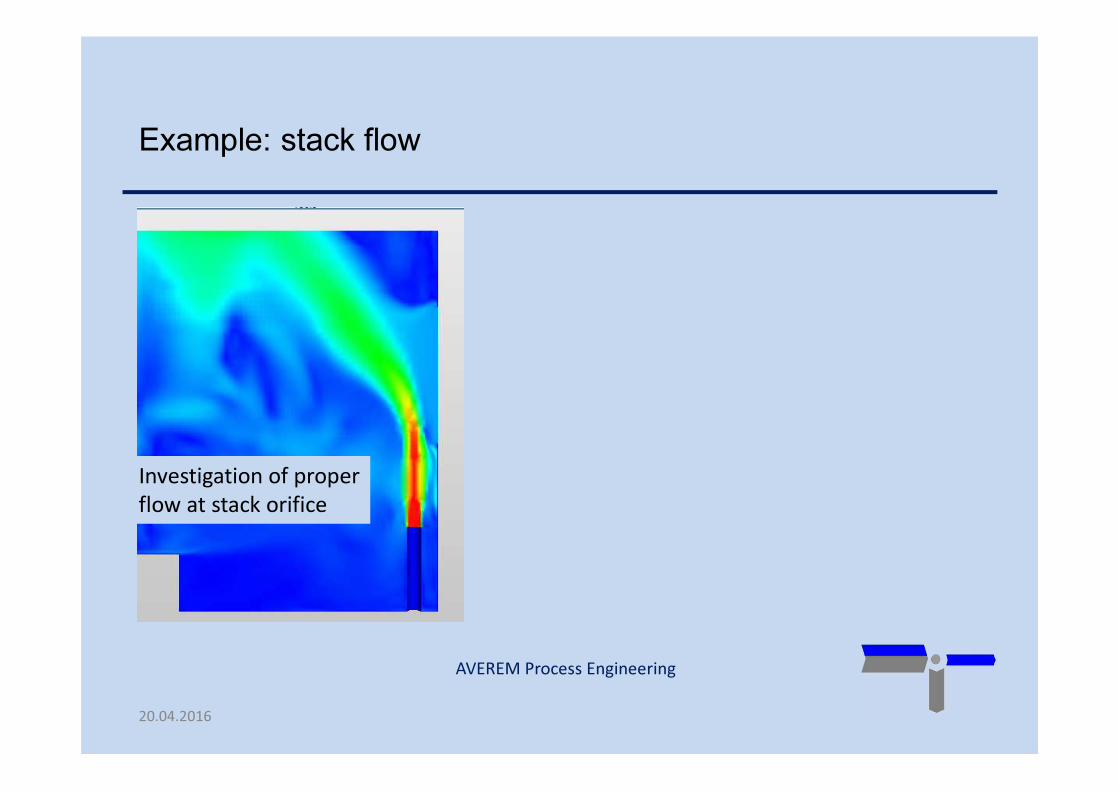
Example: stack flow
Investigation of proper
flow at stack orifice
20.04.2016
AVEREM Process Engineering
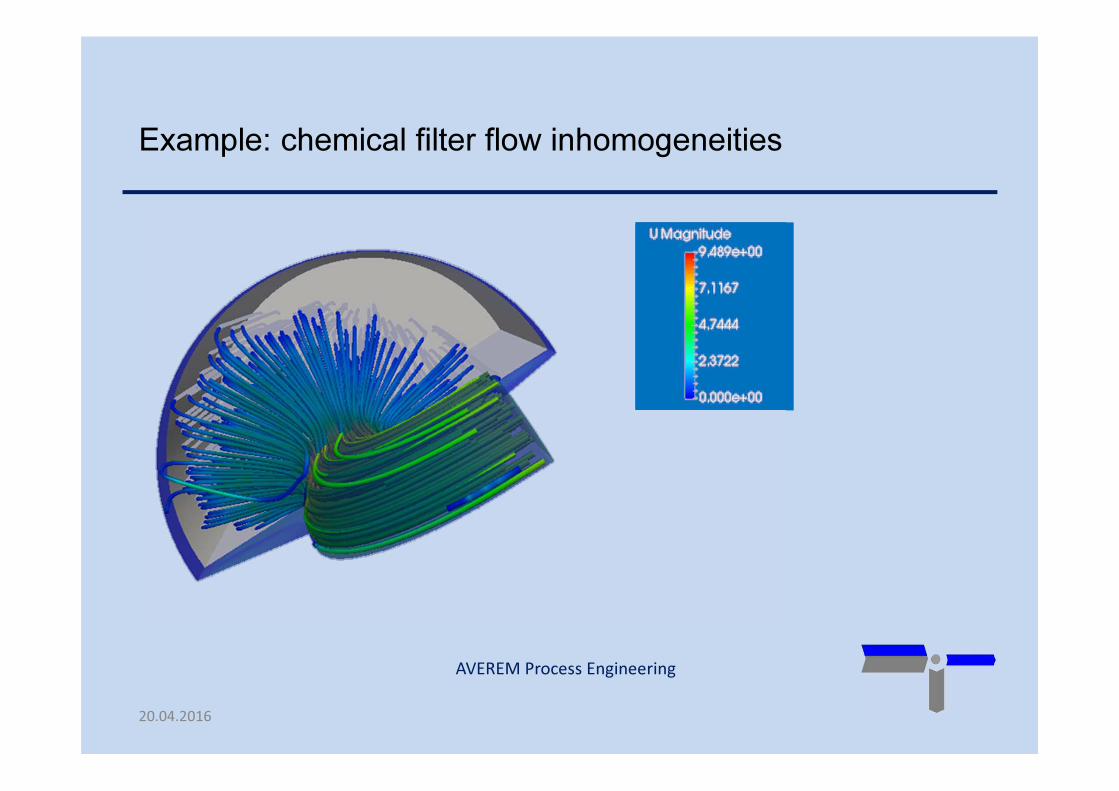
Example: chemical filter flow inhomogeneities
20.04.2016
AVEREM Process Engineering
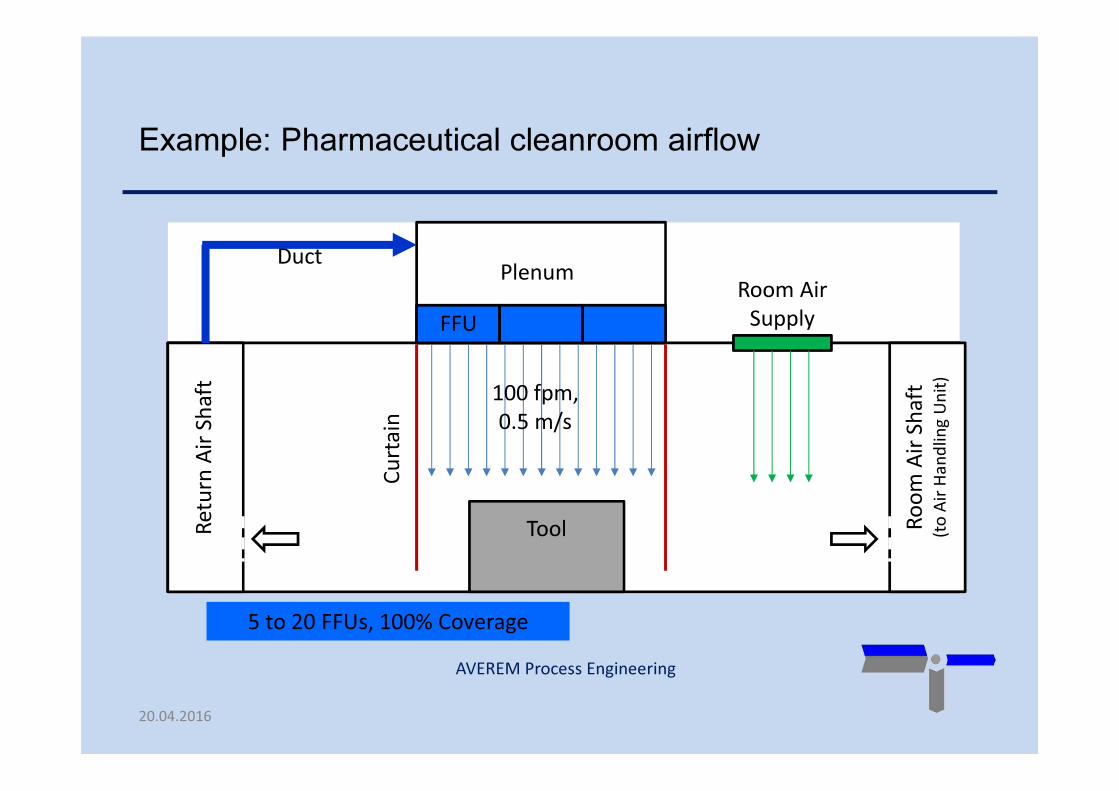
Example: Pharmaceutical cleanroom airflow
FFU
Re
turn
Air
Sh
aft
PlenumDuct
Ro
om
Air
Sh
aft
(to
Air
Ha
nd
lin
g U
nit
)
Room Air
Supply
Tool
100 fpm,
0.5 m/s
5 to 20 FFUs, 100% Coverage
Cu
rta
in
20.04.2016
AVEREM Process Engineering
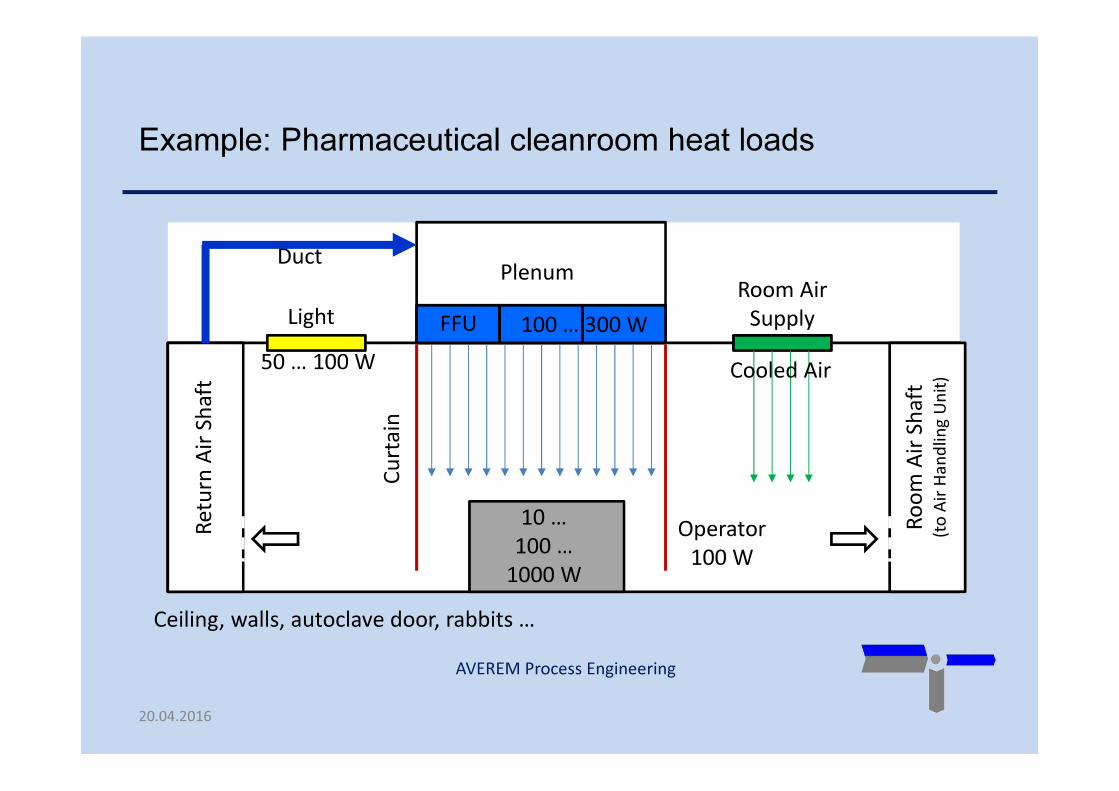
Example: Pharmaceutical cleanroom heat loads
FFU
Re
turn
Air
Sh
aft
PlenumDuct
Ro
om
Air
Sh
aft
(to
Air
Ha
nd
lin
g U
nit
)
Room Air
Supply
10 …
100 …
1000 W
100 … 300 W
Operator
100 W
Light
50 … 100 W
Ceiling, walls, autoclave door, rabbits …
Cooled AirC
urta
in
20.04.2016
AVEREM Process Engineering
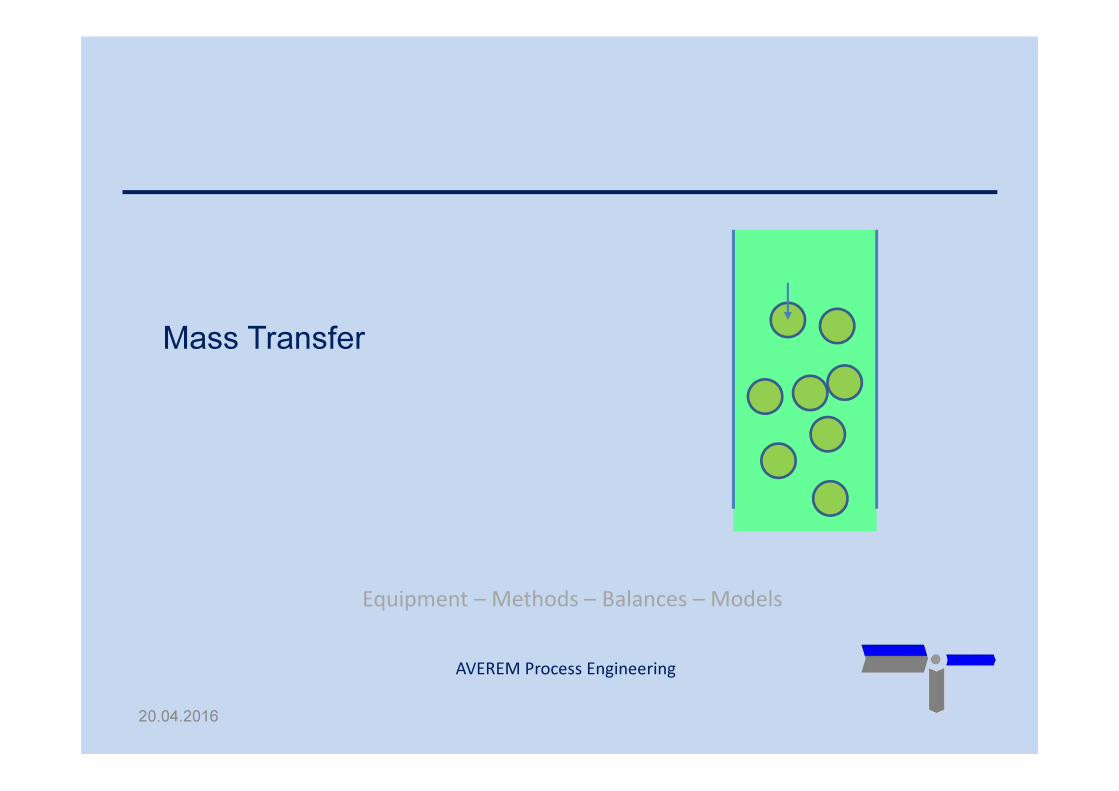
Mass Transfer
Equipment – Methods – Balances – Models
20.04.2016
AVEREM Process Engineering
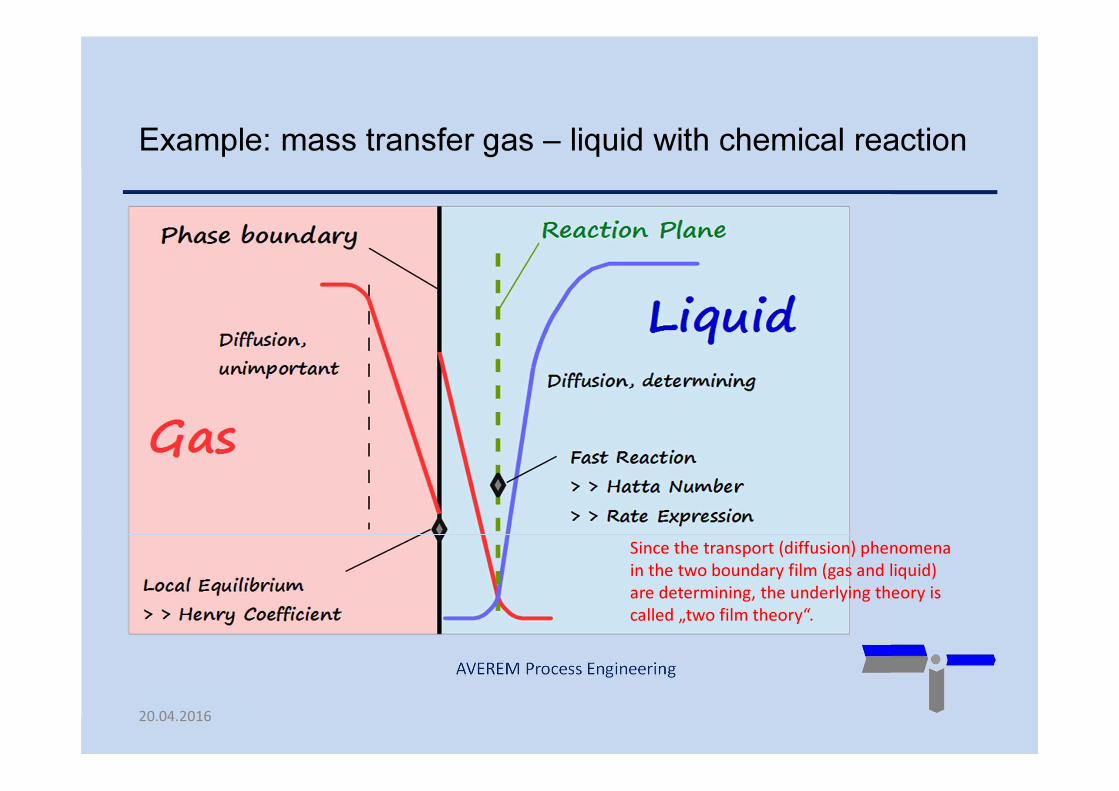
Example: mass transfer gas – liquid with chemical reaction
20.04.2016
Since the transport (diffusion) phenomena
in the two boundary film (gas and liquid)
are determining, the underlying theory is
called „two film theory“.
AVEREM Process Engineering
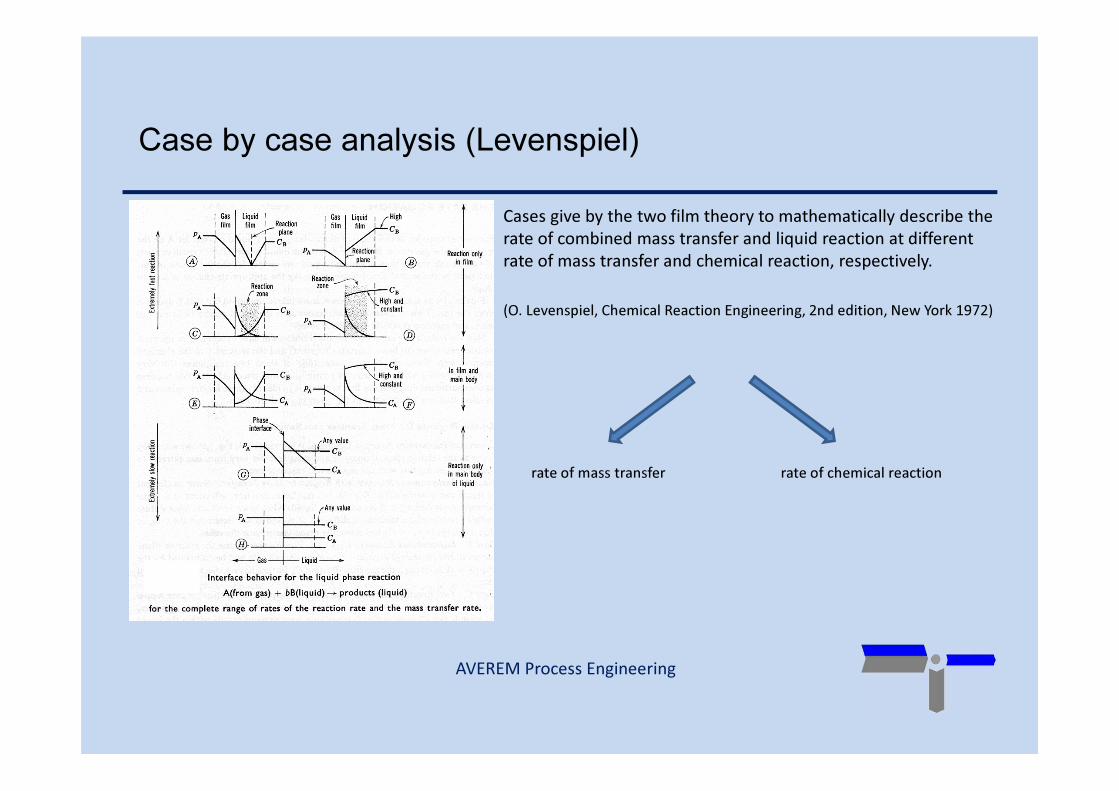
Case by case analysis (Levenspiel)
Cases give by the two film theory to mathematically describe the
rate of combined mass transfer and liquid reaction at different
rate of mass transfer and chemical reaction, respectively.
(O. Levenspiel, Chemical Reaction Engineering, 2nd edition, New York 1972)
rate of mass transfer rate of chemical reaction
AVEREM Process Engineering
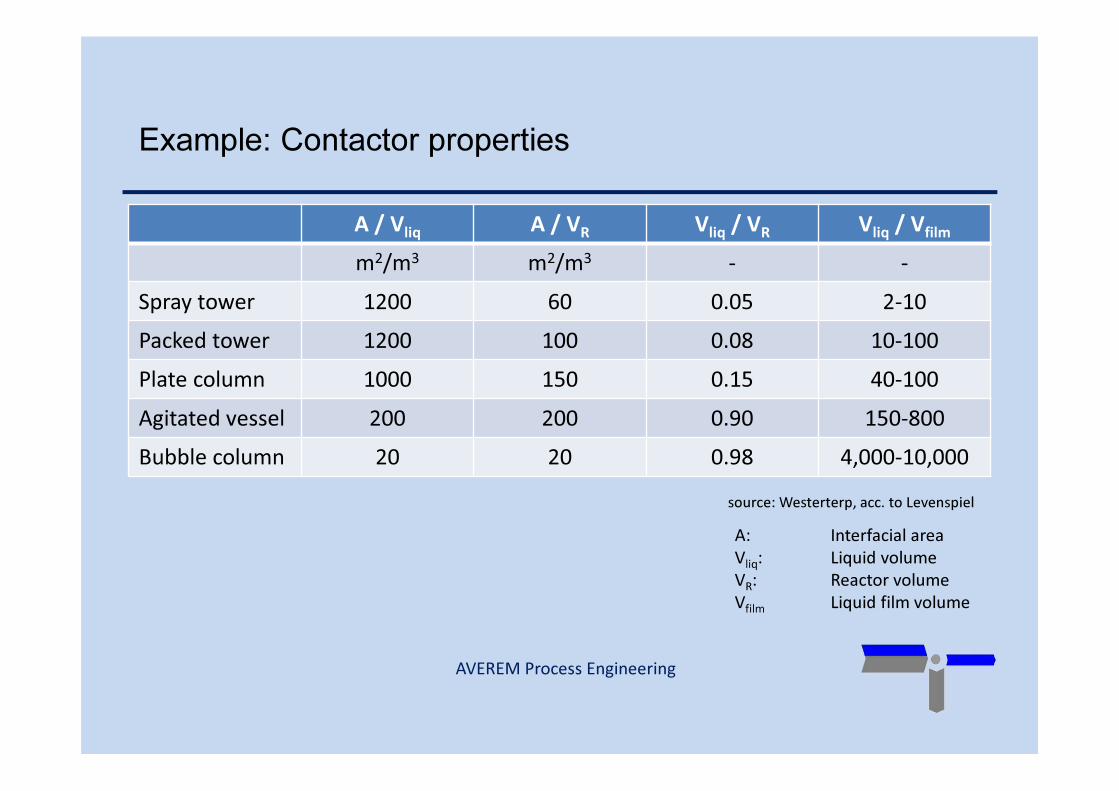
Example: Contactor properties
A / Vliq A / VR Vliq / VR Vliq / Vfilm
m2/m3 m2/m3 - -
Spray tower 1200 60 0.05 2-10
Packed tower 1200 100 0.08 10-100
Plate column 1000 150 0.15 40-100
Agitated vessel 200 200 0.90 150-800
Bubble column 20 20 0.98 4,000-10,000
source: Westerterp, acc. to Levenspiel
A: Interfacial area
Vliq: Liquid volume
VR: Reactor volume
Vfilm Liquid film volume
AVEREM Process Engineering
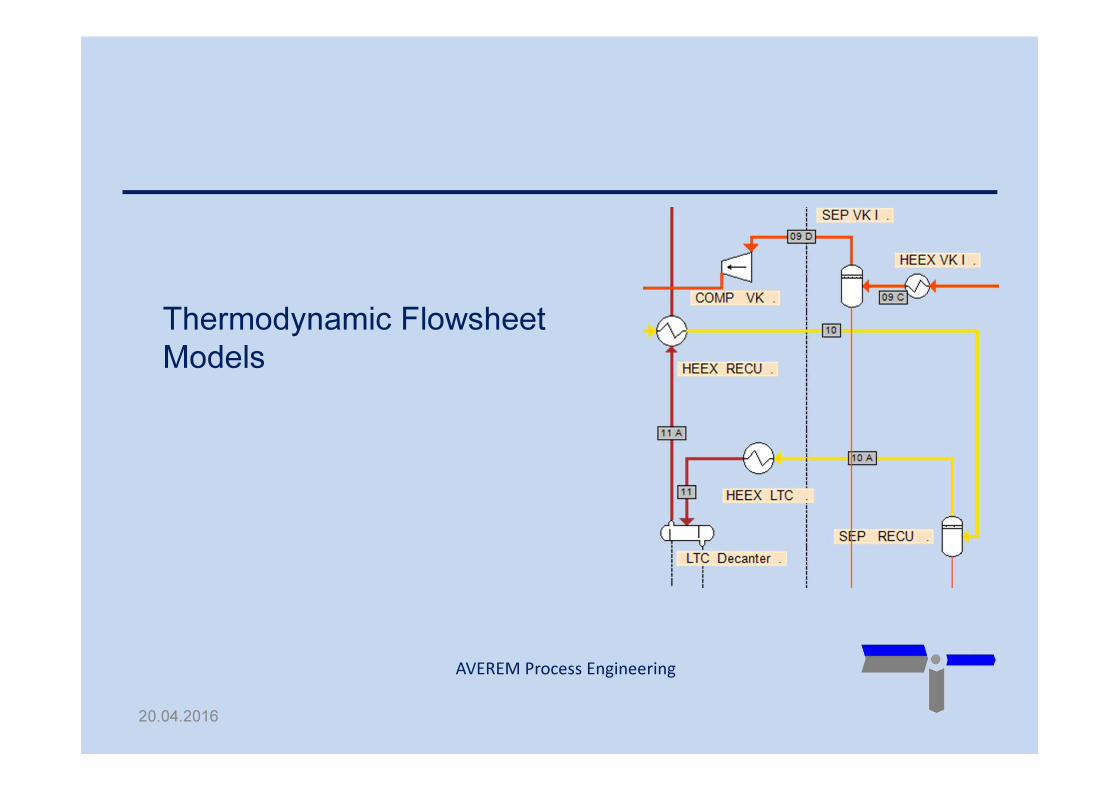
Thermodynamic Flowsheet
Models
20.04.2016
AVEREM Process Engineering
07.11.13
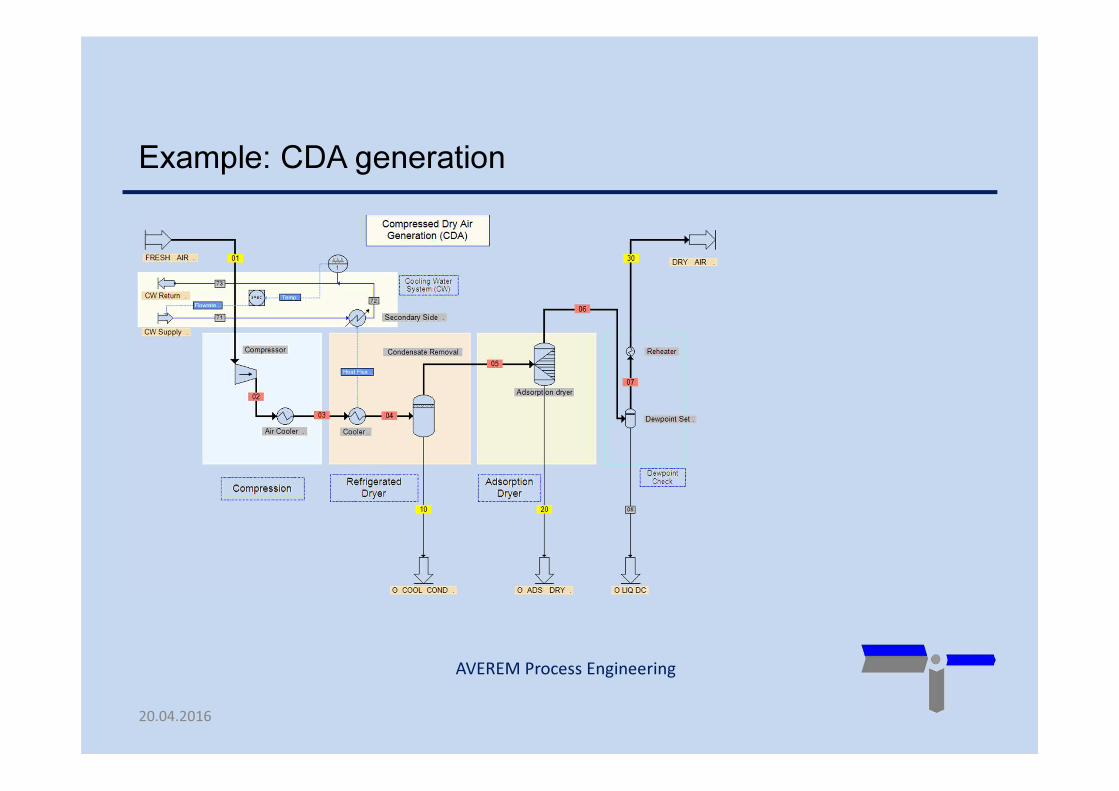
Example: CDA generation
20.04.2016
AVEREM Process Engineering
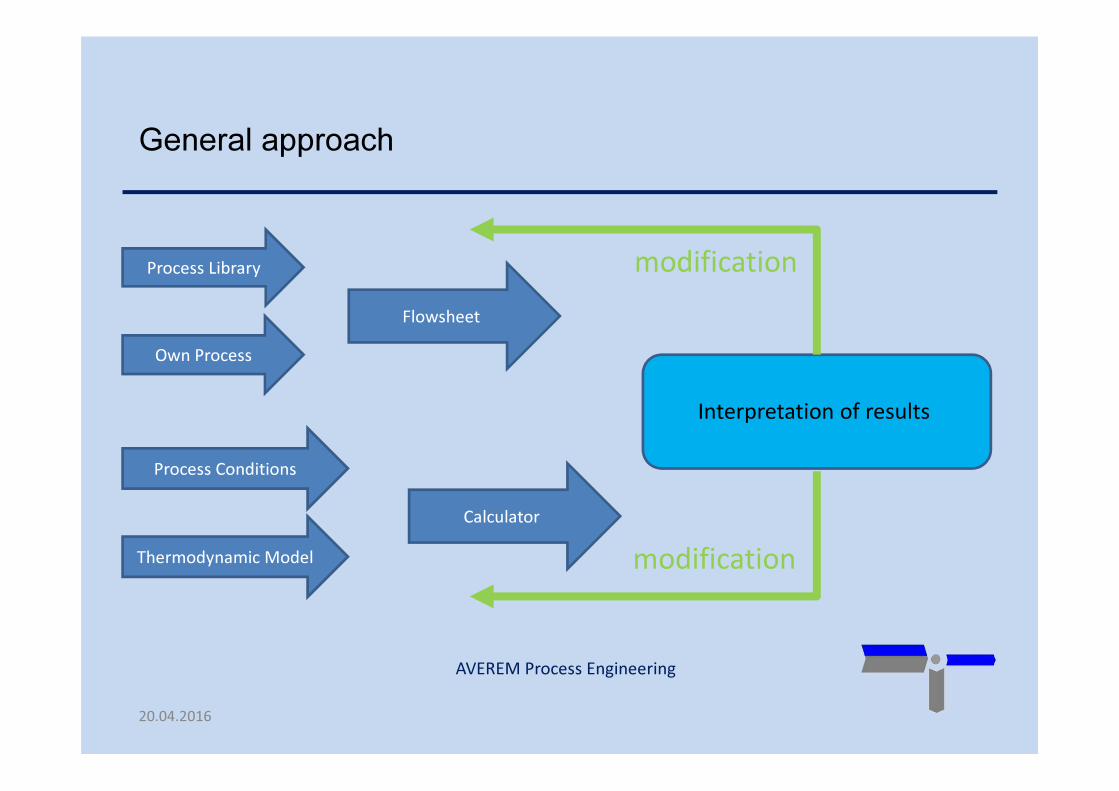
General approach
Flowsheet
Process Library
Process Conditions
Own Process
Calculator
Interpretation of results
Thermodynamic Model
modification
modification
20.04.2016
AVEREM Process Engineering
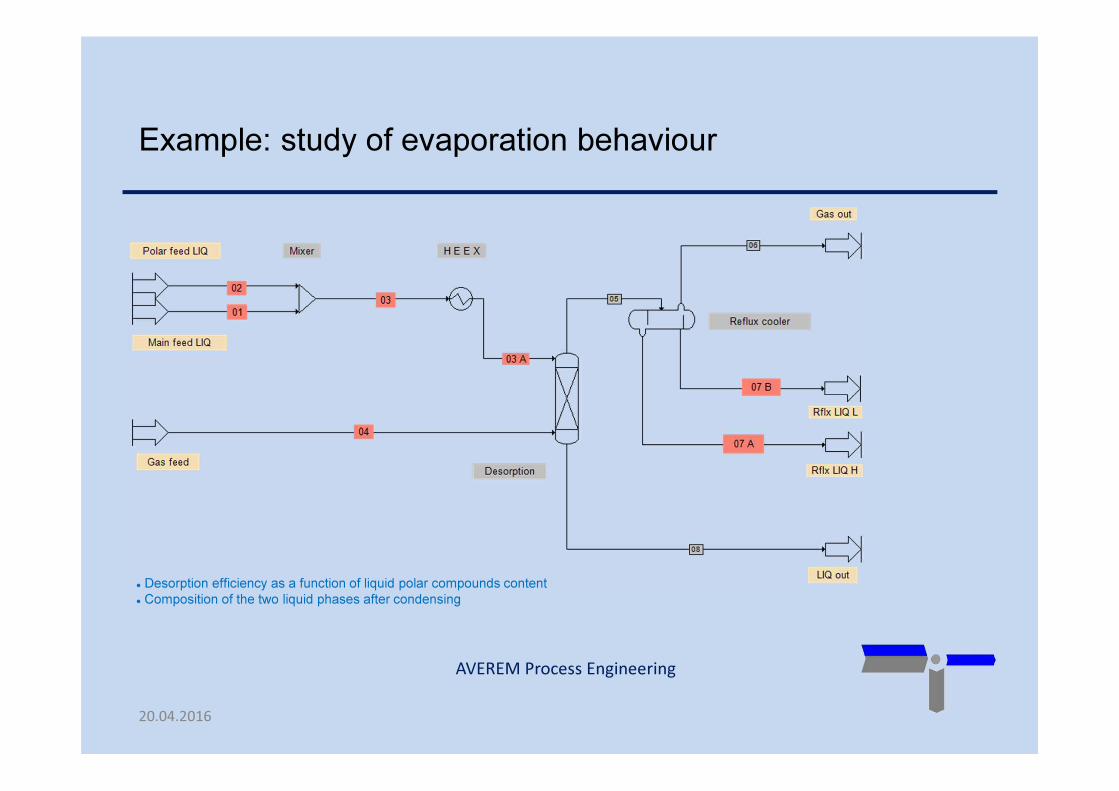
Example: study of evaporation behaviour
� Desorption efficiency as a function of liquid polar compounds content
� Composition of the two liquid phases after condensing
20.04.2016

AVEREM Process Engineering
Example: Exhaust air purification
07.11.1320.04.2016
� Purification efficiency
� Absorption liquid flow and regeneration
� Impurities and their behaviour
� Exhaust composition
� Heat balance
20.04.2016

AVEREM Process Engineering
Sankey Diagram
Analysis
20.04.2016
AVEREM Process Engineering
Example I: Site Flow Analysis
Thermodynamics: None
20.04.2016

AVEREM Process Engineering
Semiconductor site / 45% water recycling, energy flow
07.11.13
T1: Process Equipment
T2: UPW Production
T3: CDA Production
T4: MAHU
T5: Waste Water Treatment
T6: Exhaust Treatment
T7: Solid / Liquid waste
T8: Chillersand CWD
T9: Cooling Towers
P2: Electrical Energy
P3: Water discharged
P4: Air exhausted
P5: Waste
P4: Air exhaustedP2: Electrical Energy
P2: Electrical Energy
P2: Electrical Energy
P6: WWT
P6: WWT
P6: WWT
P7: Production
P4: Air exhausted
P8: EX
P7: Production
P9: Return Air
P10: Wafers P11: PV Wafer finished
P12:CT Heat
P1: Raw Water
P3: Water discharged
P13: CoolingP13: Cooling
P13: CoolingP14:WST
P14:WST
P13: Cooling
P8: EX
P1: Raw Water
P15: Outside Air
P15: Outside AirP2: Electrical Energy
P7: Production
P16:MAHU
P16:MAHU
P15: Outside Air
P3: Water discharged
40,110 kWh
T10: Return AirManagement
T11: CT WaterDispatch
P18: CT Water
P18: CT Water
P3: Water discharged
P19: Return Air2
P19: Return Air2
20,000 kWh
8,352 kWh
P13: Cooling
P2: Electrical Energy
P2: Electrical Energy
P20: UPW Recycling T12: UPW Recycling
P6: WWT
P20: UPW Recycling
P21: From Recycling
P21: From Recycling
20.04.2016
� „Bird's Eye“ View to Production
� Engineering Case Studies
� Optimisation

AVEREM Process Engineering
Semiconductor site / 45% water recycling, water flow
07.11.13
T1: Process Equipment
T2: UPW Production
T3: CDA Production
T4: MAHU
T5: Waste Water Treatment
T6: Exhaust Treatment
T7: Solid / Liquid waste
T8: Chillersand CWD
T9: Cooling Towers
P2: Electrical Energy
P3: Water discharged
P4: Air exhausted
P5: Waste
P4: Air exhaustedP2: Electrical Energy
P2: Electrical Energy
P2: Electrical Energy
P6: WWT
P6: WWT
P6: WWT
P7: Production
P4: Air exhausted
P8: EX
P7: Production
P9: Return Air
P10: Wafers P11: PV Wafer finished
P12:CT Heat
P1: Raw Water
P3: Water discharged
P13: Cooling
P13: Cooling
P13: CoolingP14:WST
P14:WST
P13: Cooling
P8: EX
P1: Raw Water
P15: Outside Air
P15: Outside AirP2: Electrical Energy
P7: Production
P16:MAHU
P16:MAHU
P15: Outside Air
P3: Water discharged
80,220 kg
158.7 m3/h
132.3 m3/h
T10: Return AirManagement
T11: CT WaterDispatch
P18: CT Water
P18: CT Water
P3: Water discharged
P19: Return Air2
P19: Return Air2
P13: Cooling
P2: Electrical Energy
P2: Electrical Energy
P20: UPW RecyclingT12: UPW Recycling
P6: WWT
P20: UPW Recycling
P21: From Recycling
P21: From Recycling
220 m3/h
98.11 m3/h
99 m3/h
121 m3/h
� „Bird's Eye“ View to Production
� Engineering Case Studies
� Optimisation
20.04.2016
AVEREM Process Engineering
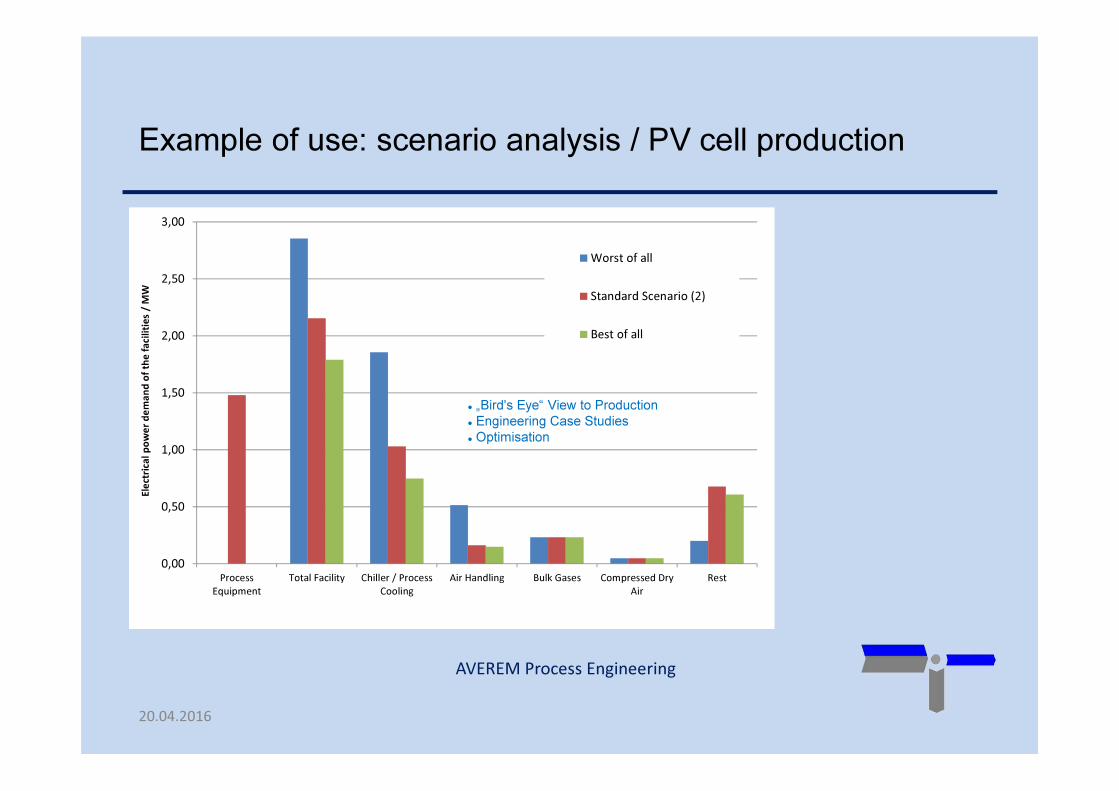
Example of use: scenario analysis / PV cell production
20.04.2016
0,00
0,50
1,00
1,50
2,00
2,50
3,00
Process
Equipment
Total Facility Chiller / Process
Cooling
Air Handling Bulk Gases Compressed Dry
Air
Rest
Ele
ctri
cal
po
we
r d
em
an
d o
f th
e f
aci
liti
es
/ M
W
Worst of all
Standard Scenario (2)
Best of all
� „Bird's Eye“ View to Production
� Engineering Case Studies
� Optimisation
AVEREM Process Engineering
Example II: Sensitivity Analysis / Business Cases
Thermodynamics: None
20.04.2016
AVEREM Process Engineering
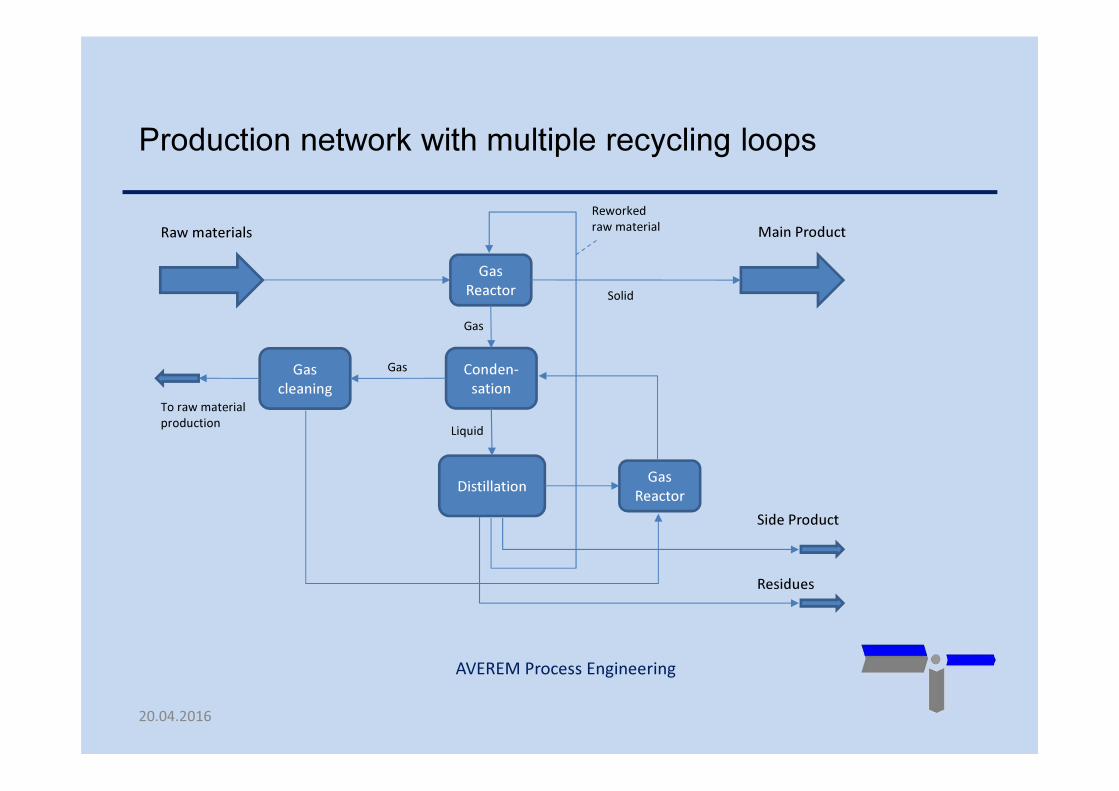
Production network with multiple recycling loops
Gas
Reactor
Conden-
sation
DistillationGas
Reactor
Raw materials Main Product
Gas
cleaning
Gas
Liquid
Solid
Gas
Reworked
raw material
Side Product
Residues
To raw material
production
20.04.2016
AVEREM Process Engineering
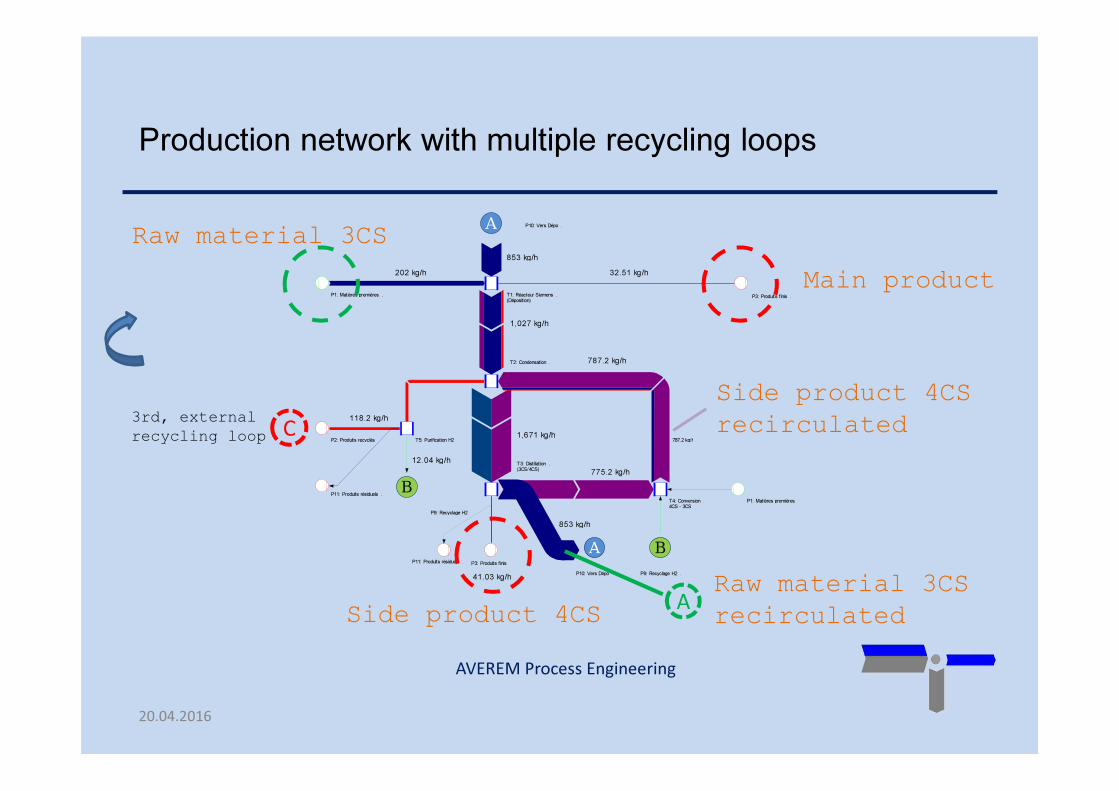
Production network with multiple recycling loops
Gas
Reactor
Conden-
sation
DistillationGas
Reactor
Raw materials Main Product
Gas
cleaning
Gas
Liquid
Solid
Gas
Reworked
raw material
Side Product
Residues
To raw material
production
P1: Matières premières .
P2: Produits recyclés .
P3: Produits finis .T1: Réacteur Siemens .(Déposition)
T2: Condensation .
T3: Distillation .(3CS/4CS)
T4: Conversion .4CS - 3CS
T5: Purification H2 .
P3: Produits finis .
B
P9: Recyclage H2 .
B
P9: Recyclage H2 .
P1: Matières premières .
A
P10: Vers Dépo .
A P10: Vers Dépo .
P11: Produits résiduels .
P11: Produits résiduels .
787.2 kg/h
787.2 kg/h
202 kg/h
853 kg/h
32.51 kg/h
853 kg/h
1,027 kg/h
1,671 kg/h
12.04 kg/h
118.2 kg/h
775.2 kg/h
41.03 kg/h
Main product
Side product 4CS
Side product 4CS
recirculated3rd, external
recycling loop C
Raw material 3CS
Raw material 3CS
recirculatedA
20.04.2016
AVEREM Process Engineering
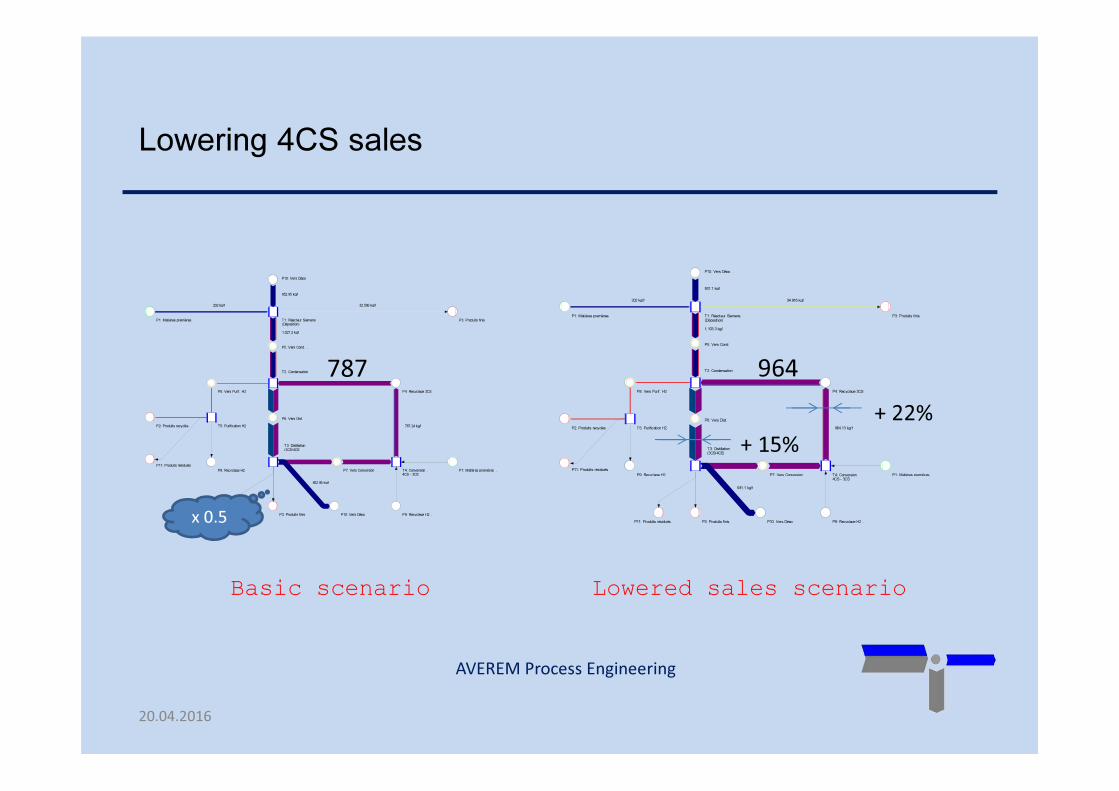
Lowering 4CS sales
P1: Matières premières .
P2: Produits recyclés .
P3: Produits finis .
P4: Recyclage 3CS .
T1: Réacteur Siemens .(Déposition)
T2: Condensation .
T3: Distillation .(3CS/4CS)
T4: Conversion .4CS - 3CS
P5: Vers Cond. .
P6: Vers Dist. .
P7: Vers Conversion .
P8: Vers Purif. H2 .
T5: Purification H2 .
P3: Produits finis . P9: Recyclage H2 .
P9: Recyclage H2 . P1: Matières premières .
P10: Vers Dépo .
P10: Vers Dépo .
P11: Produits résiduels .
P11: Produits résiduels .
787.24 kg/h
787.24 kg/h
202 kg/h
852.95 kg/h
32.506 kg/h
852.95 kg/h
1,027.2 kg/h
x 0.5
787
P1: Matières premières .
P2: Produits recyclés .
P3: Produits finis .
P4: Recyclage 3CS .
T1: Réacteur Siemens .(Déposition)
T2: Condensation .
T3: Distillation .(3CS/4CS)
T4: Conversion .4CS - 3CS
P5: Vers Cond. .
P6: Vers Dist. .
P7: Vers Conversion .
P8: Vers Purif. H2 .
T5: Purification H2 .
P3: Produits finis . P9: Recyclage H2 .
P9: Recyclage H2 . P1: Matières premières .
P10: Vers Dépo .
P10: Vers Dépo .
P11: Produits résiduels .
P11: Produits résiduels .
964.13 kg/h
964.13 kg/h
202 kg/h
931.1 kg/h
34.916 kg/h
931.1 kg/h
1,103.3 kg/h
964
+ 22%
+ 15%
Basic scenario Lowered sales scenario
20.04.2016

AVEREM Process Engineering
No 4CS sales – basic scenario
P1: Matières premières .
P2: Produits recyclés .
P3: Produits finis .
P4: Recyclage 3CS .
T1: Réacteur Siemens .(Déposition)
T2: Condensation .
T3: Distillation .(3CS/4CS)
T4: Conversion .4CS - 3CS
P5: Vers Cond. .
P6: Vers Dist. .
P7: Vers Conversion .
P8: Vers Purif. H2 .
T5: Purification H2 .
P3: Produits finis . P9: Recyclage H2 .
P9: Recyclage H2 . P1: Matières premières .
P10: Vers Dépo .
P10: Vers Dépo .
P11: Produits résiduels .
P11: Produits résiduels .
787.24 kg/h
787.24 kg/h
202 kg/h
852.95 kg/h
32.506 kg/h
852.95 kg/h
1,027.2 kg/h
= 0
787
P1: Matières premières .
P2: Produits recyclés .
P3: Produits finis .
P4: Recyclage 3CS .
T1: Réacteur Siemens .(Déposition)
T2: Condensation .
T3: Distillation .(3CS/4CS)
T4: Conversion .4CS - 3CS
P5: Vers Cond. .
P6: Vers Dist. .
P7: Vers Conversion .
P8: Vers Purif . H2 .
T5: Purification H2 .
P3: Produits finis . P9: Recyclage H2 .
P9: Recyclage H2 . P1: Matières premières .
P10: Vers Dépo .
P10: Vers Dépo .
P11: Produits résiduels .
P11: Produits résiduels .
1,237 kg/h
1,237 kg/h
202 kg/h
1,049.2 kg/h
38.559 kg/h
1,049.2 kg/h
1,218.4 kg/h
1,237
+ 57%
+ 37%
Basic scenario No sales scenario
20.04.2016
AVEREM Process Engineering
Example III: Carbon Footprint of VOC removal from
exhaust gas
Thermodynamics: Undergraduate Level
20.04.2016
AVEREM Process Engineering
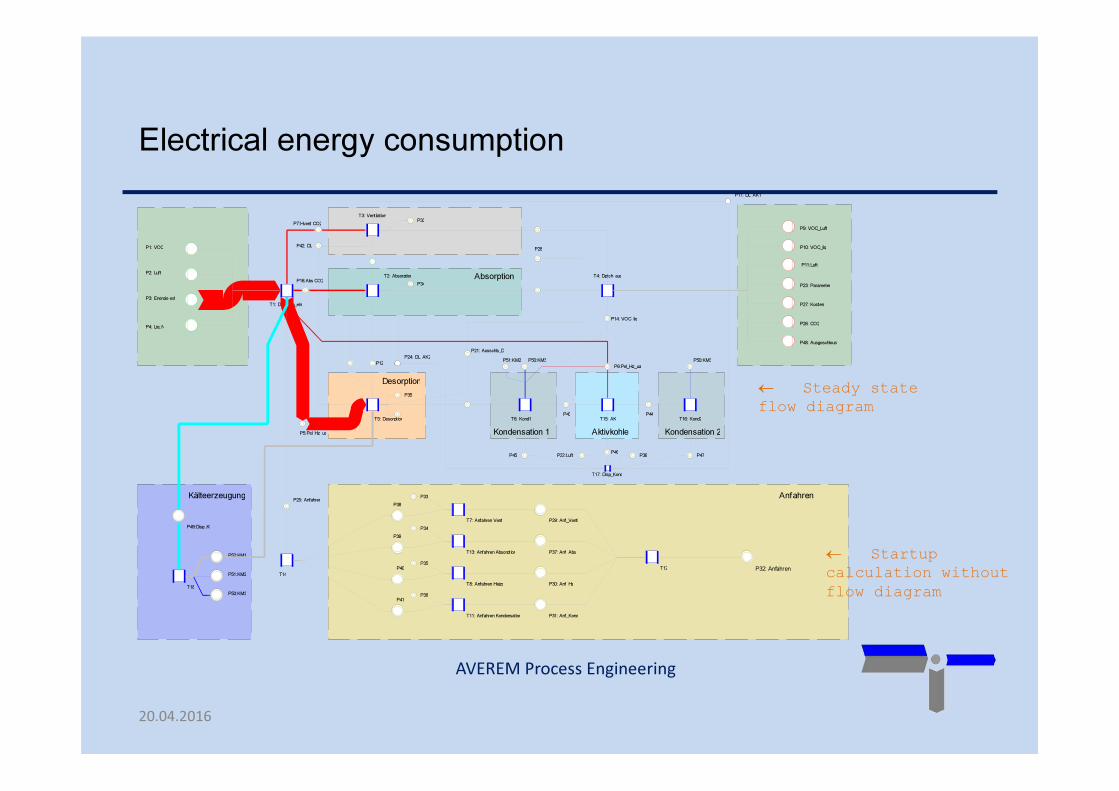
Electrical energy consumption
T1: Dispatch_ein
T2: Absorption
T3: Ventilation
P1: VOC
P9: VOC_Luft
P10: VOC_liq
P11:Luft
T4: Dptch_aus
T5: Desorption T6: Kond1
P14: VOC_liq
P16:Abs CO2
P17: DL_AK1
P21: Ausschls_D
P23: Parameter
P24: DL_AK2
P6:Pel_Hz_uaP12
P7:Hvent CO2
P5:Pel_Hz_ua
P3: Energie ext
P4: Liq_N
P2: Luft
P25: Anfahren
T7: Anfahren Venti
T8: Anfahren Heizg
P26: CO2
P27: Kosten
Desorption
Kondensation 1
Absorption
P28
T11: Anfahren Kondensation
P29: Anf_Venti
P30: Anf_Hz
P31: Anf_Kond
T12 P32: Anfahren
Anfahren
P33
P34
P35
P36
P33
T13: Anfahren Absorption P37: Anf_Abs
P35
P34
P36
T14
P38
P39
P40
P41
P42: DL
T15: AK T16: Kond2
T17: Disp_Kond
P43 P44
P45P46
P47P22:Luft
P48: Ausgeschleust
Aktivkohle Kondensation 2
T18
P49:Disp_Kl
P50:KM3
P51:KM2
P52:KM1
Kälteerzeugung
P51:KM2 P50:KM3 P50:KM3
← Steady state
flow diagram
← Startup
calculation without
flow diagram
20.04.2016
AVEREM Process Engineering
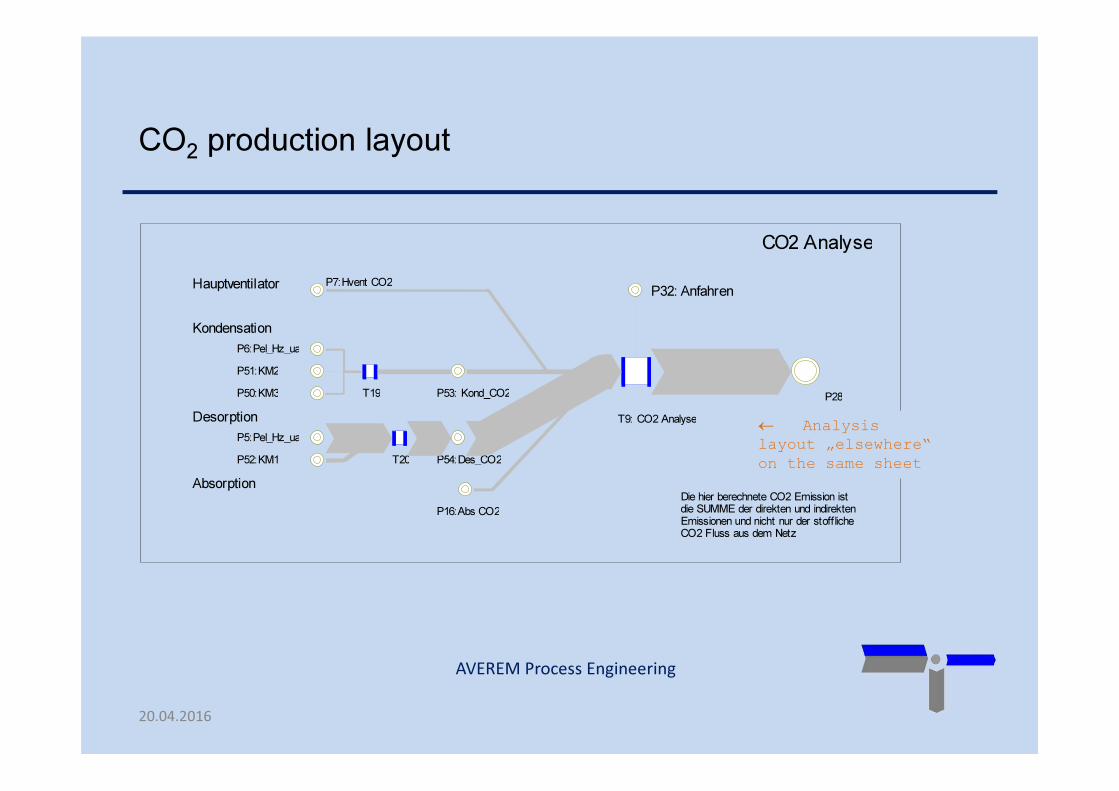
CO2production layout
CO2 Analyse
T9: CO2 Analyse
P7:Hvent CO2
P6:Pel_Hz_ua
P5:Pel_Hz_ua
P16:Abs CO2
Die hier berechnete CO2 Emission ist die SUMME der direkten und indirekten Emissionen und nicht nur der stoffliche CO2 Fluss aus dem Netz
P28
Kondensation
Hauptventilator
Desorption
Absorption
P32: Anfahren
P51:KM2
P50:KM3 T19 P53: Kond_CO2
P52:KM1 T20 P54:Des_CO2
← Analysis
layout „elsewhere“
on the same sheet
20.04.2016
AVEREM Process Engineering
Example IV: Ultrapure Water Plant - Debottlenecking
Thermodynamics: Undergraduate level
20.04.2016

AVEREM Process Engineering
Handling of peak flow
T15: Stufe 2Pumpen
T16: Wärme-tauscher
T17: Haupt-Ionentauscher
T15: Stufe 2Pumpen
T16: Wärme-tauscher
m3/h
kWkW
ave
Peak
20.04.2016
AVEREM Process Engineering
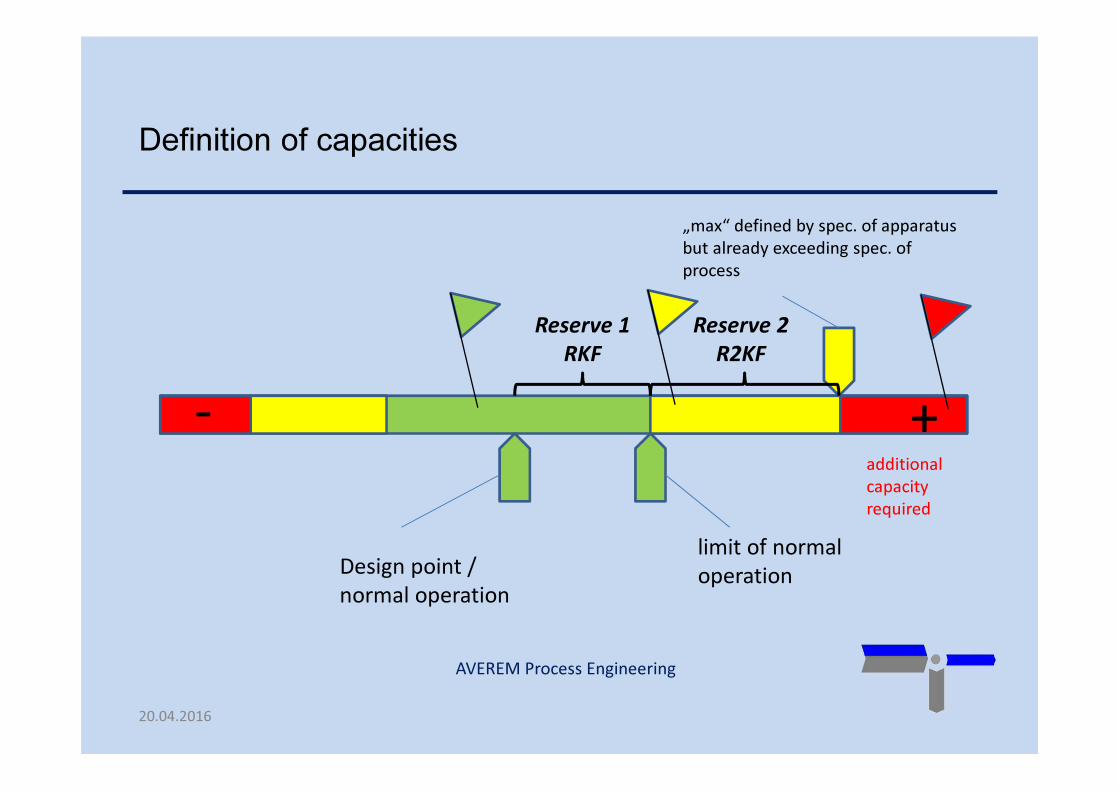
Definition of capacities
Design point /
normal operation
limit of normal
operation
„max“ defined by spec. of apparatus
but already exceeding spec. of
process
Reserve 1
RKF
Reserve 2
R2KF
+-
additional
capacity
required
20.04.2016
AVEREM Process Engineering
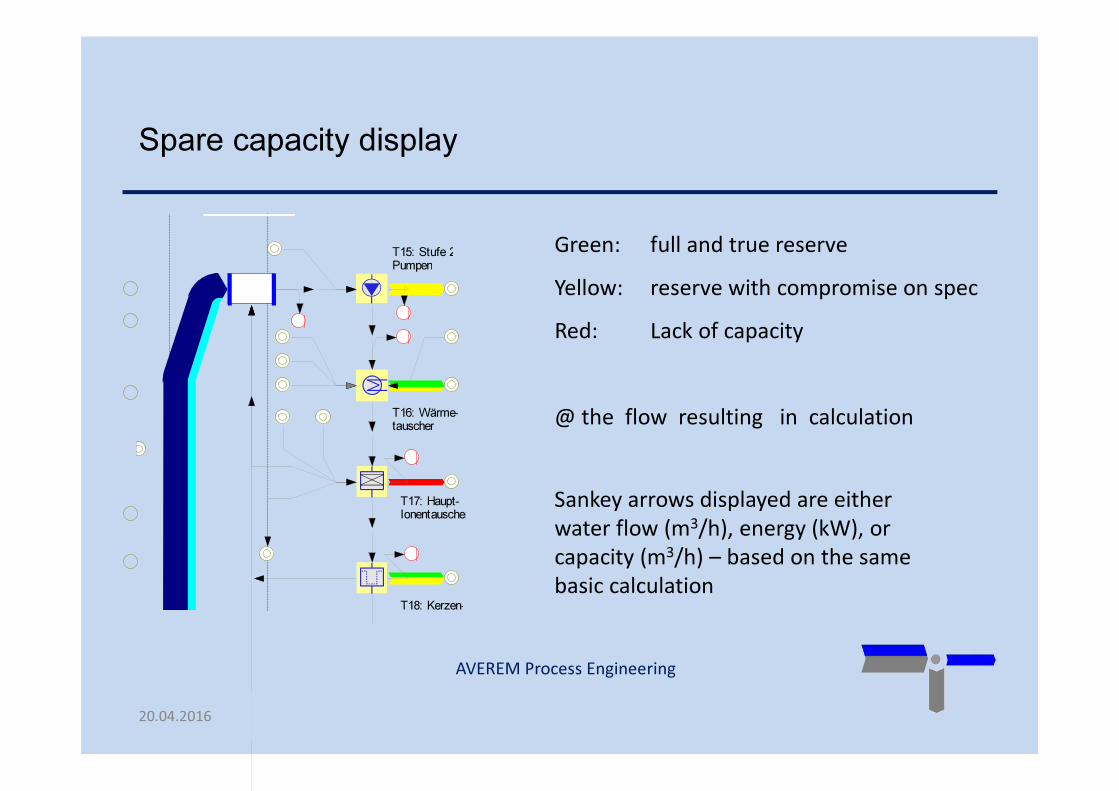
Spare capacity display
T15: Stufe 2Pumpen
T16: Wärme-tauscher
T17: Haupt-Ionentauscher
T18: Kerzen-
Green: full and true reserve
Yellow: reserve with compromise on spec
Red: Lack of capacity
@ the flow resulting in calculation
Sankey arrows displayed are either
water flow (m3/h), energy (kW), or
capacity (m3/h) – based on the same
basic calculation
20.04.2016
AVEREM Process Engineering
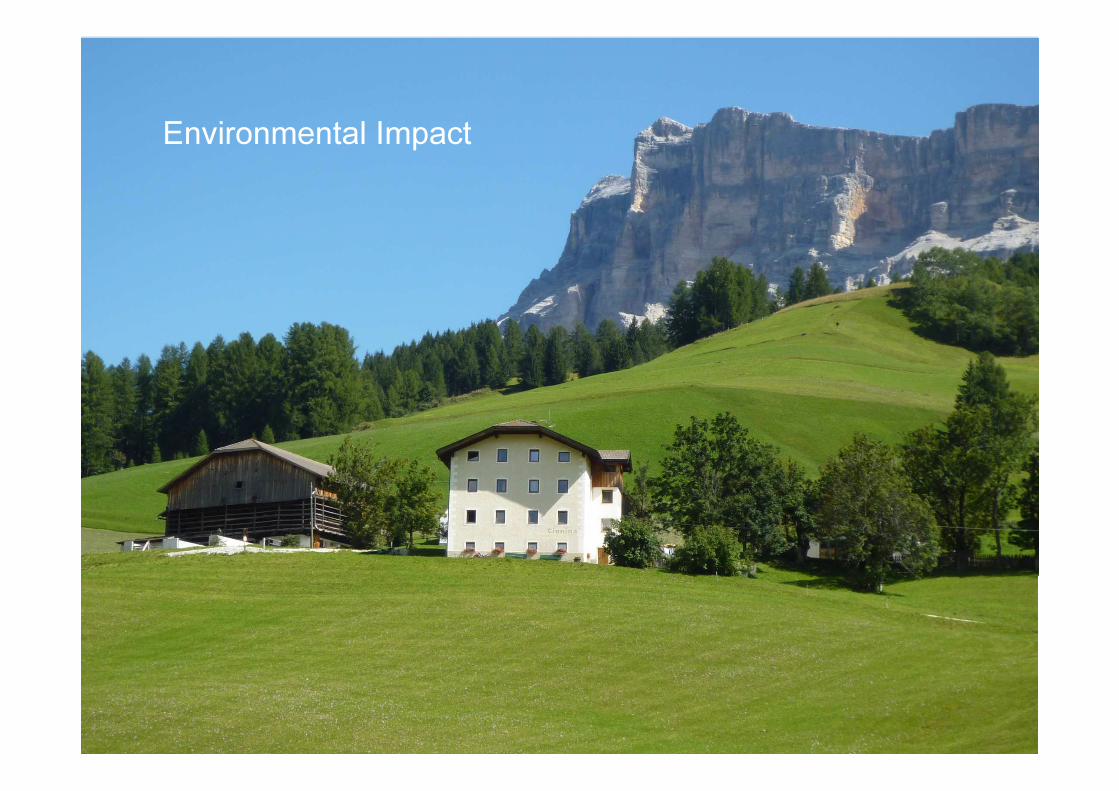
Environmental Impact
AVEREM Process Engineering
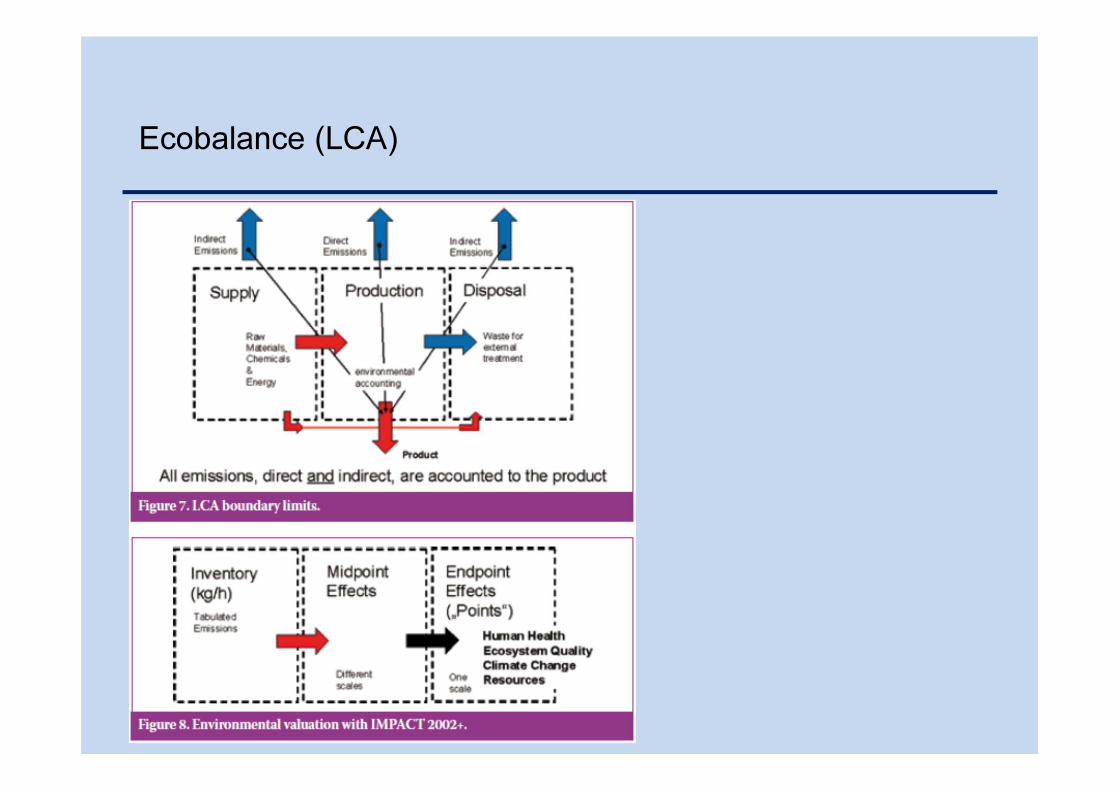
Ecobalance (LCA)
07.11.13
AVEREM Process Engineering
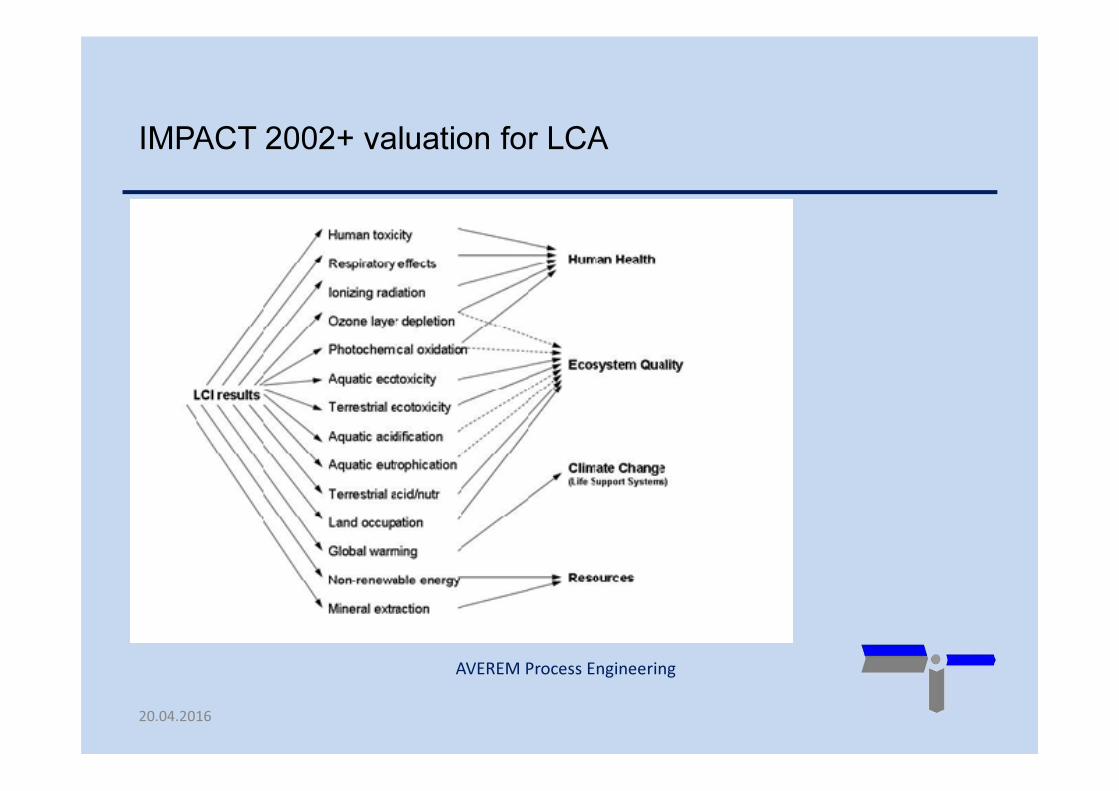
IMPACT 2002+ valuation for LCA
07.11.1320.04.2016
AVEREM Process Engineering
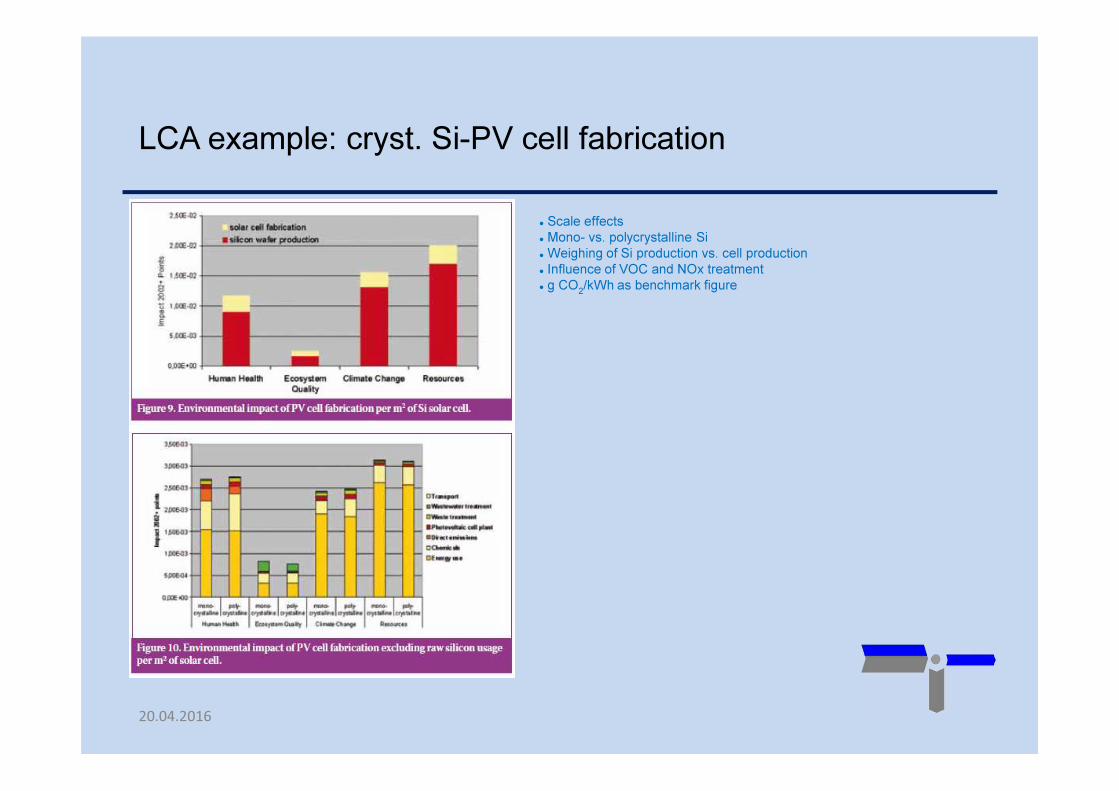
LCA example: cryst. Si-PV cell fabrication
07.11.13
� Scale effects
� Mono- vs. polycrystalline Si
� Weighing of Si production vs. cell production
� Influence of VOC and NOx treatment
� g CO2/kWh as benchmark figure
20.04.2016
AVEREM Process Engineering
07.11.13
AVEREM Process Enginering
AVEREM Verfahrenstechnik GmbH
Bismarckstr. 75
70197 Stuttgart (Germany)
www.averem.com - [email protected]
+49 - 711 - 914 968 70
+49 - 151 - 235 607 45 (mobile)
20.04.2016


